in situ measurement of the infrared spectral extinction ... situ measurement of the infrared...
TRANSCRIPT

In situ Measurement of the Infrared Spectral Extinction for
Various Chemical, Biological, and Background Aerosols
by Kristan P. Gurton, David Ligon, and Rachid Dahmani
ARL-TR-3071 September 2003 Approved for public release; distribution unlimited.

Report Documentation Page Form ApprovedOMB No. 0704-0188
Public reporting burden for the collection of information is estimated to average 1 hour per response, including the time for reviewing instructions, searching existing data sources, gathering andmaintaining the data needed, and completing and reviewing the collection of information. Send comments regarding this burden estimate or any other aspect of this collection of information,including suggestions for reducing this burden, to Washington Headquarters Services, Directorate for Information Operations and Reports, 1215 Jefferson Davis Highway, Suite 1204, ArlingtonVA 22202-4302. Respondents should be aware that notwithstanding any other provision of law, no person shall be subject to a penalty for failing to comply with a collection of information if itdoes not display a currently valid OMB control number.
1. REPORT DATE 00 SEP 2003
2. REPORT TYPE N/A
3. DATES COVERED -
4. TITLE AND SUBTITLE In situ Measurement of the Infrared Spectral Extinction for VariousChemical, Biological, and Background Aerosols
5a. CONTRACT NUMBER
5b. GRANT NUMBER
5c. PROGRAM ELEMENT NUMBER
6. AUTHOR(S) 5d. PROJECT NUMBER
5e. TASK NUMBER
5f. WORK UNIT NUMBER
7. PERFORMING ORGANIZATION NAME(S) AND ADDRESS(ES) U.S. Army Research Lab., ATTN: AMSRL-CI-EE, 2800 Powder MillRd., Adelphi, MD 20783-1197
8. PERFORMING ORGANIZATIONREPORT NUMBER
9. SPONSORING/MONITORING AGENCY NAME(S) AND ADDRESS(ES) 10. SPONSOR/MONITOR’S ACRONYM(S)
11. SPONSOR/MONITOR’S REPORT NUMBER(S)
12. DISTRIBUTION/AVAILABILITY STATEMENT Approved for public release, distribution unlimited
13. SUPPLEMENTARY NOTES The original document contains color images.
14. ABSTRACT
15. SUBJECT TERMS
16. SECURITY CLASSIFICATION OF: 17. LIMITATION OF ABSTRACT
UU
18. NUMBEROF PAGES
24
19a. NAME OFRESPONSIBLE PERSON
a. REPORT unclassified
b. ABSTRACT unclassified
c. THIS PAGE unclassified
Standard Form 298 (Rev. 8-98) Prescribed by ANSI Std Z39-18

NOTICES
Disclaimers The findings in this report are not to be construed as an official Department of the Army position unless so designated by other authorized documents. Citation of manufacturer’s or trade names does not constitute an official endorsement or approval of the use thereof. Destroy this report when it is no longer needed. Do not return it to the originator.

Army Research Laboratory Adelphi, MD 20783-1197
ARL-TR-3071 September 2003 In situ Measurement of the Infrared Spectral Extinction for
Various Chemical, Biological, and Background Aerosols
Kristan P. Gurton, David Ligon, and Rachid Dahmani Computational and Information Sciences Directorate, ARL
Approved for public release; distribution unlimited.
ii
REPORT DOCUMENTATION PAGE Form Approved
OMB No. 0704-0188 Public reporting burden for this collection of information is estimated to average 1 hour per response, including the time for reviewing instructions, searching existing data sources, gathering and maintaining the data needed, and completing and reviewing the collection information. Send comments regarding this burden estimate or any other aspect of this collection of information, including suggestions for reducing the burden, to Department of Defense, Washington Headquarters Services, Directorate for Information Operations and Reports (0704-0188), 1215 Jefferson Davis Highway, Suite 1204, Arlington, VA 22202-4302. Respondents should be aware that notwithstanding any other provision of law, no person shall be subject to any penalty for failing to comply with a collection of information if it does not display a currently valid OMB control number. PLEASE DO NOT RETURN YOUR FORM TO THE ABOVE ADDRESS.
1. REPORT DATE (DD-MM-YYYY)
September 2003 2. REPORT TYPE
Final 3. DATES COVERED (From - To)
September 2002–May 2003 5a. CONTRACT NUMBER
5b. GRANT NUMBER
4. TITLE AND SUBTITLE
In situ Measurement of the Infrared Spectral Extinction for Various Chemical, Biological, and Background Aerosols
5c. PROGRAM ELEMENT NUMBER
5d. PROJECT NUMBER
3FEJ16 5e. TASK NUMBER
6. AUTHOR(S)
Kristan P. Gurton, David Ligon, and Rachid Dahmani
5f. WORK UNIT NUMBER
7. PERFORMING ORGANIZATION NAME(S) AND ADDRESS(ES)
U.S. Army Research Laboratory ATTN: AMSRL-CI-EE 2800 Powder Mill Road Adelphi, MD 20783-1197
8. PERFORMING ORGANIZATION REPORT NUMBER ARL-TR-3071
10. SPONSOR/MONITOR'S ACRONYM(S)
9. SPONSORING/MONITORING AGENCY NAME(S) AND ADDRESS(ES)
Edgewood Research Development and Engineering Center Aberdeen Proving Ground, MD 11. SPONSOR/MONITOR'S REPORT
NUMBER(S)
12. DISTRIBUTION/AVAILABILITY STATEMENT
Approved for public release; distribution unlimited.
13. SUPPLEMENTARY NOTES
14. ABSTRACT
We conducted a series spectral extinction measurements on a variety of aerosolized chemical and biological simulants over the spectral range 3–13 µm using conventional Fourier transform infrared (FTIR) aerosol spectroscopy. Samples consist of both aerosolized particulates and atomized liquids. Materials considered include Bacillus subtilis endospores (BG), lyophilized ovalbumin, polyethylene glycol (PEG), dimethicone (SF-96 grade 50), and three common background materials (Kaolin clay [hydrated aluminum silicate], Arizona road dust [primarily SiO2], and diesel soot). Aerosol size distributions and mass density were measured simultaneously with the FTIR spectra. As a result all optical parameters presented here are mass-normalized, i.e., (m2/g). In an effort to establish the utility of using Mie theory to predict such parameters, a series of calculations were conducted. For materials in which the complex indices of refraction are known, e.g., silicone oil (SF-96 grade 50) and Kaolin, measured size distributions were convolved with Mie theory and the resultant spectral extinction calculated. Where there was good agreement between measured and calculated extinction spectra, absorption, total scattering, and backscatter were also calculated. 15. SUBJECT TERMS
Aerosol, infrared, extinction, absorption, backscatter FTIR, Bactillus subtilis
16. SECURITY CLASSIFICATION OF: 19a. NAME OF RESPONSIBLE PERSON Kristan P. Gurton
a. REPORT
Unclassified b. ABSTRACT
Unclassified c. THIS PAGE
Unclassified
17. LIMITATIONOF ABSTRACT
UL
18. NUMBER OF PAGES
20 19b. TELEPHONE NUMBER (Include area code) 301-394-2093
Standard Form 298 (Rev. 8/98) Prescribed by ANSI Std. Z39.18

iii
Contents
List of Figures iv
Acknowledgments v
1. Introduction 1
2. Experiment 2
3. Results 4
4. Comments 4
5. References 12
Distribution 15

iv
List of Figures
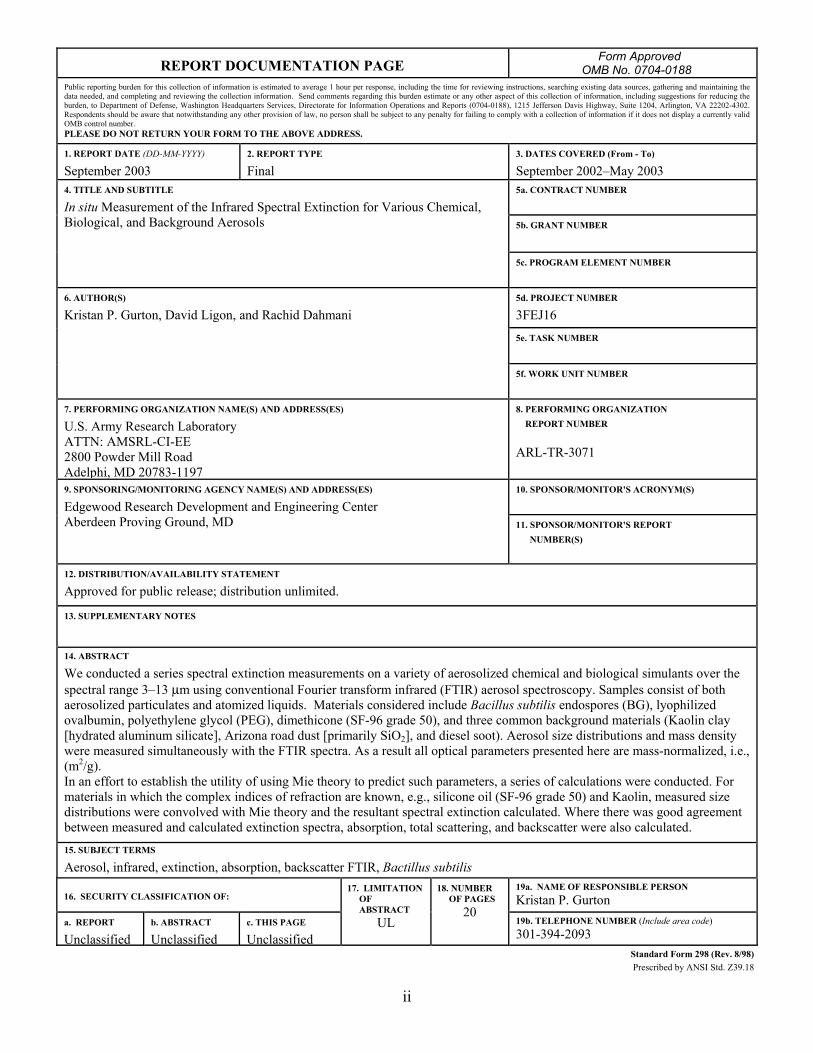
Figure 1. Measured size distribution for particulates and liquid droplets.......................................3 Figure 2. Complex indices of refraction for Bacillus subtilis endospores......................................5 Figure 3. Complex indices for liquid silicone SF-96 grade 50. ......................................................6 Figure 4. Complex indices of refraction for Kaolin clay. ...............................................................7 Figure 5. Measured (thick red) and calculated (thick blue) spectral extinction for aerosolized
Bacillus subtilis endospores. Also shown are the Mie theory predicted total scatter (thin blue), absorption (orange), and backscatter (green)...................................................................8
Figure 6. Measured (thick red) and calculated (thick blue) spectral extinction for nebulized liquid silicone SF-96 grade 50. Also shown are the Mie theory predicted total scatter (thin blue), absorption (orange), and backscatter (green). .........................................................8
Figure 7. Measured (thick red) and calculated (thick blue) spectral extinction for aerosolized Kaolin clay. Also shown are the Mie theory predicted total scatter (thin blue), absorption (orange), and backscatter (green)...............................................................................................9
Figure 8. Measured spectral extinction for PEG-200, diesel soot, Arizona road dust, and Ovalbumin..................................................................................................................................9
Figure 9. Comparison of the measured extinction spectra for Ovalbumin (lyophilized egg white) with a Mie calculation using the indices of refraction for Bacillus subtilis endospores (BG). .....................................................................................................................11
Figure 10. Measured extinction for agglomerated Cab-O-sil aerogel at various concentrations. The flat spectral extinction is synonymous with very large particles (compared with the wavelength)..............................................................................................12

v
Acknowledgments
We would like to thank the Edgewood Chemical and Biological Center for their continued support and sponsorship in the area of aerosol research. In particular, we are extremely appreciative to Dr. Richard Vanderbeek and Dr. Alan Samuels for their technical expertise and the insightful conversations that aided us in the work.

vi
INTENTIONALLY LEFT BLANK

1
1. Introduction
Currently, there is a great effort underway within both the defense and academic research community to develop an optical-based technique that is capable of detecting the presence of harmful airborne biological or chemical agents. In order to accomplish this, researchers require a set of fundamental parameters that describe the electromagnetic (EM) interaction with micron-sized particles (i.e., extinction, absorption, total-scatter, and backscatter coefficients). This report is an extension of prior work conducted as a “basic parameters” study designed to provide optical cross-sections for a variety of aerosol materials used to simulate the presence of more harmful agents (1). For many common naturally occurring aerosols, such parameters are readily available (2,3). However, for materials that are derived from biological and/or chemical matter, measured in situ optical parameters in the infrared (IR) are woefully lacking.
In addition, for those who wish to calculate optical cross-sections, a similar knowledge of the bulk complex indices of refraction and particle size distributions is required. Often Mie theory (only truly appropriate for perfect spheres) are applied to media in which particle geometry is quite complex. Validity of these calculations are sometimes questionable particularly when the aerosol particle dimensions are comparable to the wavelength in question. Similarly, issues arise with experimental techniques used to measure the complex indices of refraction for particulate material (4). The preferred method for deriving indices in the IR involve compressing the materials into small quasi-transparent pellets. Transmission and near-normal reflectance measurements are conducted on these pellets over a given spectral range. A Kramers-Kronig relation is then applied to the reflection spectra and resultant complex indices are calculated. However, large uncertainties arise in spectral regions where anomalous dispersion for the material is great (i.e., regions where the absorption is strong). It is often these regions of strong absorption that are of greatest interest to the researcher. As a result, we attempt to address some of these issues of accuracy for certain calculated parameters in the IR, when the aerosols are not necessarily spherical, and whose indices of refraction are in question. In practice, accurate knowledge of both size distribution and complex indices of refraction are usually very difficult to acquire. In a report soon to follow we examine to what degree such unknown quantities can be “inverted,” using only spectral extinction and/or backscatter (5).
The materials considered here may be broken into three distinctly different groups. The first group is characterized as typical biological simulants, which include Bacillus subtilis var. niger (BG) endospores (a common soil-based bacteria) and dry powdered ovalbumin (lyophilized egg white).

2
The second group we considered consisted of two common chemical species, polydimethyl-siloxane (SF-96 grade 50) and polyethylene glycol (PEG 200), and represented our chemical simulants. These two chemicals were chosen due to their relatively low vapor pressure, which allowed good droplet formation with little or no evaporation.
The final group consisted of several “background” aerosols often present in the atmosphere (i.e., Kaolin clay [hydrated aluminum silicate], Arizona road dust [primarily SiO2 and Al2O3] and diesel soot).
2. Experiment
All samples presented here were provided by the Edgewood Research Development and Engineering Center (ERDEC), Aberdeen Proving Ground, MD. However, much of these materials are quite common and can be acquired through conventional chemical suppliers.
Aerosol samples derived from solid material (e.g., BG, Kaolin, and ovalbumin), were milled to produce particle distribution within an approximate size range of 0.7 µm < diameter < 10 µm. These powdered materials were effectively aerosolized by injecting pressurized dry air through a cylindrical nozzle that contained a spiraling array of fine stainless-steel wires. A vortex created within the nozzle effectively separated and dispersed the dry particles with minimal agglomeration. Care was taken to properly adjust the air pressure to levels that resulted in good particle separation while remaining low enough to avoid fragmentation of the particles below their milled diameters.
Liquid samples were dispersed using a pharmaceutical nebulizer. These nebulizers are specifically designed to produce particle distributions within the respiratory range of 0.8 µm < diameter < 4.0 µm when pressurized to 10 psi.
We have found that depending on the viscosity of the liquid, generated size distributions can be shifted to smaller diameters by slightly increasing the pump pressure. As a result both PEG 200 and SF-96 grade 50 were atomized using a pressure of 20 psi, which produced a distribution with a modal diameter 0.82 µm. Particle-size distributions were measured in situ using a commercial particle-size spectrometer, TSI Aerodynamic Particle Sizer Model 3321. Resultant size distributions for aerosolized particulates and liquid droplets are shown in Figure 1. Because TSI instrument use a “time-of-flight” method to predict an aerodynamic diameter, accurate values for the “bulk” density of the aerosol particle is required. Unfortunately, for aerosols that were highly amorphous or that contain many different constituents, accurate bulk densities were unattainable (e.g., soot and Arizona road dust). As a result, size distributions for those materials are not presented. However, antidotal evidence-based aerosol settling rates and video-microscopy images of particles captured on slides suggest distributions similar to what is seen for Kaolin (i.e., a large submicron component with a model diameter between 1 and 5 µm).
3
Figure 1. Measured size distribution for particulates and liquid droplets.
The primary transmission measurements were conducted in a 0.8-m3 aerosol chamber which provided an optical path length of 0.61 m. Dispersed aerosols were gently drawn into the chamber using a small-area recirculating fan. Continuous monitoring of humidity levels was conducted using a filtered dew-point hygrometer that was inserted through the walls of the chamber. Because dry air was used to flush the various optical windows, water vapor levels were kept to a minimum. Relative humidity levels for most runs were typically < 8%, which is representative of a fairly dry environment.
We obtained IR transmission spectra using a high-resolution (0.02 wave number) Bomem DA2.02 Fourier transform IR (FTIR) spectrometer. For this study, the spectrometer was operated in a transmission mode (i.e., spectral attenuation was measured by placing the aerosol chamber between the source and the interferometer). A broadband IR Nernst glower was collimated with a ZnSe condensing lens assembly and projected through the aerosol chamber with two BaF2 transmission windows that were fitted with dry-air flushes. Transmitted light was coupled to the interferometer with a gold-surfaced f/4 off-axis parabola. Because spectra derived from aerosols are devoid of any fine structure often seen in vapor spectra, the FTIR was operated at a spectral resolution of 4.0 cm–1.
Aerosol mass densities (g/m3) were periodically measured during the run using conventional dosimetric techniques (6). Aerosol mass samples were collected by drawing known volumes of the air-particle mixture onto polycarbonate filters, nominal pore-size 0.20 µm, for predetermined periods of time. Results from the dosimetric sampling were then used to mass normalize the measured spectral extinction, (m2/g).
1.E+00
1.E+01
1.E+02
1.E+03
1.E+04
1.E+05
0.1 1 10 100Aerodynamic Diameter (um)
Particle Count
(au) SF-96 & PEG-200Bacillus subtilis (new)KaolinOvalbumin

4
3. Results
Interferograms were recorded before, during, and after each aerosol dispersion. A Bartlett apodization was applied to each interferogram before the background spectra were removed. Transmission was converted to extinction using a Beer’s law relation. Results were mass normalized by dividing the path-integrated extinction, (1/m), by the corresponding aerosol density, (g/m3).
For materials in which complex indices of refraction were available from prior studies (Figures 2–4), Mie theory calculations were conducted using the appropriate size distribution shown in Figure 1 (7). Where agreement between the measured and calculated extinction was reasonable, the calculated spectral absorption, total scatter, and backscatter are also presented (Figures 5–7). For ovalbumin, PEG 200, diesel soot, and Arizona road dust in which no such indices were available, only the measured spectral extinction is presented (Figure 8).
4. Comments
When comparing measured extinction with Mie calculated values (Figures 5–7) one should keep in mind that all the complex indices used in the calculations were gathered from prior studies and may not accurately represent the materials used here. Nevertheless, we thought it informative to show such comparisons because it is often the case that one must rely on previously published constants to compute various optical parameters.
For the three materials presented with refractive indices (i.e., BG, Kaolin, and SF-96 grade 50), the refractive index for SF-96 grade 50 is least likely to vary from one measurement to the next because it is a highly standardized chemical where production is tightly monitored. In addition, because it is a liquid, we know with certainty that the nebulized particles must be spherical and thus most appropriate for applying Mie theory. As one can see in Figure 6, agreement between measured and calculated spectral extinction is quite reasonable. Agreement for the location of the peaks and valleys for the spectral extinction is quite good. However, agreement between the relative magnitude between the two is not as good and is attributed to uncertainties in the size distribution (Figure 1). In general, the underpredicted values for the Mie extinction is synonymous with a slightly broader size distribution than seen in Figure 1. Nevertheless, where agreement is exceptable (e.g., 3–8.5 µm and 10–12 µm), Mie computed absorption, scatter, and backscatter should be fairly representative of the true values.

5
Index of refraction for Bacillus subtilis
1.2
1.25
1.3
1.35
1.4
1.45
1.5
1.55
1.6
3 4 5 6 7 8 9 10 11 12 13 14Wavelength (um)
Real Index
1.E-03
1.E-02
1.E-01
1.E+00
3 4 5 6 7 8 9 10 11 12 13 14
Wavelength (um)
Imaginary Index
Figure 2. Complex indices of refraction for Bacillus subtilis endospores.

6
Refractive index for silicone SF-96 grade 50
0.50.70.91.11.31.51.71.92.12.3
3 4 5 6 7 8 9 10 11 12 13Wavelength (um)
RealIndex
0
0.2
0.4
0.6
0.8
1
3 4 5 6 7 8 9 10 11 12 13Wavelength (um)
Imaginary Index
Figure 3. Complex indices for liquid silicone SF-96 grade 50.

7
Refractive index for Kaolin
0
0.5
1
1.5
2
2.5
3
3 4 5 6 7 8 9 10 11 12 13Wavelength (um)
Real Index
0
0.5
1
1.5
2
2.5
3 4 5 6 7 8 9 10 11 12 13
Wavelength (um)
Imaginary Index
Figure 4. Complex indices of refraction for Kaolin clay.

8
1.E-03
1.E-02
1.E-01
1.E+00
3 4 5 6 7 8 9 10 11 12 13
Wavelength (um)
Mass Normalized Coefficient(m^2/gram)
Extinction (measured)Extinction (M ie theory) Total Scatter (M ie theory) Absorption (M ie theory)Backscatter (M ie theory)
Figure 5. Measured (thick red) and calculated (thick blue) spectral extinction for aerosolized Bacillus
subtilis endospores. Also shown are the Mie theory predicted total scatter (thin blue), absorption (orange), and backscatter (green).
1.E-03
1.E-02
1.E-01
1.E+00
3 4 5 6 7 8 9 10 11 12 13
Wavelength (um)
MassNormalizedCoefficient(m 2̂/gram)
Extinction (measured) Extinction (Mie theory)Total scatter (Mie theory)Absorption (Mie theory)Backscatter (Mie theory)
Figure 6. Measured (thick red) and calculated (thick blue) spectral extinction for nebulized liquid
silicone SF-96 grade 50. Also shown are the Mie theory predicted total scatter (thin blue), absorption (orange), and backscatter (green).

9
1.E-04
1.E-03
1.E-02
1.E-01
1.E+00
3 4 5 6 7 8 9 10 11 12 13
Wavelength (um)
Mass normaized Coefficient
(m̂ 2/gram)Extinction (measured)
Extinction (Mie theory)Total Scatter (Mie theory)
Absorption (Mie theory)
Backscatter (Mie theory)
Figure 7. Measured (thick red) and calculated (thick blue) spectral extinction for aerosolized Kaolin clay. Also shown are the Mie theory predicted total scatter (thin blue), absorption (orange), and backscatter (green).
1.E-03
1.E-02
1.E-01
1.E+00
1.E+01
3 4 5 6 7 8 9 10 11 12 13
Wavelength (um)
ExtinctionCoefficient (m 2̂/gram)
PEG-200Diesel sootArizona road dust (SiO2)Ovalbumin
Figure 8. Measured spectral extinction for PEG 200, diesel soot, Arizona road dust, and ovalbumin.

10
As for the Bacillus subtilis (BG) samples, little is known about the exact form and conditions in which the indices were measured by Querry (7). What is certain is that the BG sample(s) provided by ERDEC was grown, cleaned, and milled from a completely different batch than used by Querry nearly a decade prior. In lieu of this and given the fact that growth media used for producing bacterial endospores can be quite variable, agreement seen in Figure 5 is good. One notable region of divergence occurs in the long wave IR between 9 and 10 µm. Although difficult to see in Figure 5, the measured spectral extinction shows a modest peak at 9.1 µm, but the calculated spectra using Querry’s indices show this peak quite suppressed and shifted toward 10 µm. Although researchers have attributed this peak to absorption by phosphates and/or polysaccharides, we believe a portion of the increased extinction seen in the measured spectra between 9 and 10 µm may be due to a residual silicate used during the milling process.
Perhaps the least certain complex index used was that of Kaolin. It is well known that the optical properties for Kaolin are quite variable, depending upon the geographic location where it was mined (i.e., Kaolin is routinely sourced from North America, China, and Europe). As a result, good agreement between measured and calculated extinction was not expected. As seen in Figure 7, the spectral features of the Mie calculated extinction appears suppressed when compared to the measured values.
Figure 8 shows the measured mass-normalized spectral extinction for PEG 200, Arizona road dust, ovalbumin, and diesel soot. As mentioned before, complex indices of refraction were not available for these materials and as a result no Mie calculations are presented. However, we will note several key aspects for the various spectra seen in Figure 8.
First, the two noticeable features seen in the extinction spectra for diesel soot seen at 4.25 µm and the fine structure seen between 5 and 8 µm are due to gaseous absorption of CO2 and water, respectively, that were generated during the burning of diesel fuel and proved extremely difficult to remove using conventional FTIR background subtraction methods. Prior studies have shown this spectra to be devoid of any real structure and decreases monotonically with increasing wavelength (8).
Although the preparation/dissemination of the PEG 200 liquid was relatively straightforward, we did notice during several runs the emergence of strong water vapor absorption lines when the liquid samples were left in the open for periods of several hours due to the fact that PEG 200 is extremely hydroscopic. For this reason, care should be taken when using PEG 200 chemical simulant for aerosol research because water uptake for atomized samples is very likely except in the most arid of environments.
The extinction spectrum for ovalbumin turned out to be somewhat surprising. As one can see by comparing ovalbumin spectra with the Mie calculated extinction spectra for BG seen in Figure 5, the two spectra are nearly identical (Figure 9).

11
1.E-02
1.E-01
1.E+00
3 4 5 6 7 8 9 10 11 12 13Wavelength (um)
Mass NormalizedExtinction
Coefficient(m^2/gram) Bacillus subtilis (Mie theory)
Ovalbumin (measured)
Figure 9. Comparison of the measured extinction spectra for ovalbumin (lyophilized egg white) with a Mie calculation using the indices of refraction for Bacillus subtilis endospores (BG).
Although not definitive, based on this comparison, it seems that one might be able to use with this comparison the expected complex indices of refraction for ovalbumin should be similar to that of BG seen in Figure 2. Where cost and the availability of a good biological simulant are an issue, using ovalbumin powder may suffice. This would be particularly useful for field tests in which large quantities of a simulant are required.
The last material shown in Figure 8 is that of a somewhat standardized background aerosol called Arizona road dust obtained from Powder Technology Inc., Burnsville, MN. Because Arizona road dust is well characterized it has become a popular natural obscurant used in many radiative transfer measurements. The particular type used for this study was sized to have a nominal diameter of 1.13 µm with a standard deviation 0.385 µm. Chemical analysis shows the following compounds as a percentage of mass: 76% SiO2, 15% Al2O3, 4% Fe2O3, 4% Na2O, as well as traces of CaO, MgO, and TiO2.
Finally, as part of this study we were provided with an unusual material called Cab-O-sil. Cab-O-sil is a synthetic, amorphous, untreated fumed silicon dioxide that is composed of fine sub-micron SiO2 particles. Used commercially as a thickening agent for food and cosmetics, this silica “aerogel” is extremely amorphous (94% of its volume is air) and is sometimes used as a fluidizer to improve aerosol dissemination efficiencies. As a result, we were asked to produce spectra for this possible residual compound. However, difficulties with extreme agglomeration arose during the FTIR measurement. Various attempts to disperse dry well-separated Cab-O-sil particles failed. Resultant measured spectra showed little wavelength dependence regardless of the concentration (Figure 10). These “flat” spectra are synonymous with the presences of very
Bacillus subtilis (Mie theory)
Ovalbumin (measured)

12
1.E-02
1.E-01
1.E+00
3 4 5 6 7 8 9 10 11 12 13Wavelength (um)
Extinction (1/m)
Cab0001Cab0002Cab0003Cab0004
Figure 10. Measured extinction for agglomerated Cab-O-sil aerogel at various concentrations. The flat
spectral extinction is synonymous with very large particles (compared with the wavelength).
large particles when compared to the wavelength (i.e., the extinction mechanism is primarily due to the particle’s geometric cross-section rather than any diffraction effects). Efforts to measure the in situ aerosols density also failed because we were unable to collect enough measurable mass on the dosimetric filter substrates during the spectral runs. Nevertheless, one can see the obvious absorption between 8 and 10 µm due to SiO2, which is also seen in the Arizona road dust spectra.
5. References
1. Gurton, K. P.; Ligon, D.; Kvavilashvili, R. Measured Infrared Spectral Extinction For Aerosolized Bacillus subtilis var. niger Endospores From 3 to 13 um. Applied Optics 2001, 40 (25), 4443–4448.
2. Deepak, A. Atmospheric Aerosols: Their Formation, Optical Properties, and Effects; Spectrum Press: Hampton VA, 1982.
3. Gerber, H.; Hindman, E. Light Absorption by Aerosol Particles; Spectrum Press: Hampton VA, 1982.
4. Wieliczka, D. W.; Querry, M. R. Four Techniques to Measure Complex Refractive Indices of Liquids and Solids at Carbon Dioxide Laser Wavelengths in the Infrared Spectral Region; CRDEC-CR-062; Chemical Research, Development and Engineering Center: Aberdeen Proving Ground, MD, 1990.

13
5. Ligon, D.; Gillespie, J.; Pellegrino, P. Aerosol Properties From Spectral Extinction and Backscatter Estimated by an Inverse Monte Carlo Method. Applied Optics 2000, 39 (24), 4402–4410.
6. Bruce, C. Measuring Aerosol Density Using Nephelometry and Dosimetry; Center for Atmospheric Sciences Press: Las Cruces, NM, 1987.
7. Querry, Marvin R. Optical Constants of Minerals and Other Materials from the Millimeter to the Ultraviolet; CRDEC-CR88009; Chemical Research, Development and Engineering Center; Aberdeen Proving Ground, MD, 1987.
8. Bruce, C. W.; Gurton, K. P.; Stromberg, T. F. Trans-Spectral Absorption and Scattering of Electromagnetic Radiation by Diesel Soot. Applied Optics 1991, 30 (12), 1537–1546.

14
INTENTIONALLY LEFT BLANK

15
Distribution
DARPAATTN S Welby3701 N Fairfax DrArlington VA 22203-1714
Ofc of the Secy of DefnsATTN ODDRE (R&AT)The PentagonWashington DC 20301-3080
US Army TRADOCBattle Lab Integration & Techl DirctrtATTN ATCD-B10 Whistler LaneFT Monroe VA 23651-5850
Dir for MANPRINTOfc of the Deputy Chief of Staff for PrsnnlATTN J HillerThe Pentagon Rm 2C733Washington DC 20301-0300
Edgewood Chemical Biological CtrATTN AMSSB-RRT-DP A C SamuelsATTN AMSSB-RRT-DP R Vanderbeek (20
copies)5183 Blackhawk Rd Bldg E-5554Aberdeen Proving Ground MD 21010-5424
US Military AcdmyMathematical Sci Ctr of ExcellenceATTN LTC T RugensteinThayer Hall Rm 226CWest Point NY 10996-1786
SMC/CZA2435 Vela Way Ste 1613El Segundo CA 90245-5500
TECOMATTN AMSTE-CLAberdeen Proving Ground MD 21005-5057
US Army ARDECATTN AMSTA-AR-TDBldg 1Picatinny Arsenal NJ 07806-5000
US Army Aviation & Mis LabATTN AMSAM-RD-MG-IP H F AndersonRedstone Arsenal AL 35809
US Army Avn & Mis CmndATTN AMSMI-RD W C McCorkleRedstone Arsenal AL 35898-5240
US Army CECOM RDEC NVESDATTN J Howe10221 Burbech Rd Ste 430FT Belvoir VA 22060-5806
US Army ECBCATTN AMSSB-RRT BottigerATTN AMSSB-RRT E Stuebing5183 Blackhawk Rd Bldg E-5951Aberdeen Proving Ground MD 21010-5424
US Army Info Sys Engrg CmndATTN AMSEL-IE-TD F JeniaFT Huachuca AZ 85613-5300
US Army Natick RDECActing Techl DirATTN SBCN-T P BrandlerKansas Street Bldg78Natick MA 01760-5002
US Army Simulation Train & Instrmntn CmndATTN AMSTI-CG M MacedoniaATTN J Stahl12350 Research ParkwayOrlando FL 32826-3726
US Army Tank-Automtv Cmnd RDECATTN AMSTA-TR J ChapinWarren MI 48397-5000
Nav Rsrch LabATTN J D Eversole4555 Overlook AveWashington DC 20375
Hicks & Assoc IncATTN G Singley III1710 Goodrich Dr Ste 1300McLean VA 22102

Distribution (cont’d)
16
Palisades Inst for Rsrch Svc IncATTN E Carr1745 Jefferson Davis Hwy Ste 500Arlington VA 22202-3402
DirectorUS Army Rsrch LabATTN AMSRL-RO-D JCI ChangATTN AMSRL-RO-EN W D BachPO Box 12211Research Triangle Park NC 27709
US Army Rsrch LabATTN AMSRL-D D R SmithATTN AMSRL-D J M MillerATTN AMSRL-CI-IS-R Mail & Records MgmtATTN AMSRL-CI-IS-T Techl Pub (2 copies)ATTN AMSRL-CI-OK-TL Techl LibATTN AMSRL-CI-EP K GurtonATTN AMSRL-SE-EE A GoldbergATTN AMSRL-SE-EM D BeekmanAdelphi MD 20783-1197