in silico methods for drug repurposing and...
TRANSCRIPT

Overview
In silico methods for drugrepurposing and pharmacologyRachel A. Hodos,1,2 Brian A. Kidd,1 Khader Shameer,1
Ben P. Readhead1 and Joel T. Dudley1*
Data in the biological, chemical, and clinical domains are accumulating at ever-increasing rates and have the potential to accelerate and inform drug develop-ment in new ways. Challenges and opportunities now lie in developing analytictools to transform these often complex and heterogeneous data into testablehypotheses and actionable insights. This is the aim of computational pharmacol-ogy, which uses in silico techniques to better understand and predict how drugsaffect biological systems, which can in turn improve clinical use, avoid unwantedside effects, and guide selection and development of better treatments. Oneexciting application of computational pharmacology is drug repurposing—finding new uses for existing drugs. Already yielding many promising candi-dates, this strategy has the potential to improve the efficiency of the drug devel-opment process and reach patient populations with previously unmet needssuch as those with rare diseases. While current techniques in computationalpharmacology and drug repurposing often focus on just a single data modalitysuch as gene expression or drug–target interactions, we argue that methods suchas matrix factorization that can integrate data within and across diverse datatypes have the potential to improve predictive performance and provide a fullerpicture of a drug’s pharmacological action. © 2016 Wiley Periodicals, Inc.
How to cite this article:WIREs Syst Biol Med 2016. doi: 10.1002/wsbm.1337
INTRODUCTION
Modern pharmaceutical research faces seriouschallenges1–4 with decreasing productivity in
drug development and a persistent gap between ther-apeutic needs and available treatments. The numberof drugs approved per dollar spent on research anddevelopment is declining,2,4 with recent studies esti-mating 15 years and over $1 billion to bring a newdrug to market.5 This is partially due to high attri-tion rates; only 10% of compounds that make it toPhase II clinical trials are eventually approved,6 withthe majority of failures either resulting from safety
concerns or poor efficacy.7,8 Amidst the decliningproductivity, there is also a pressing need to providetreatments for rare diseases. According to theNational Organization for Rare Disorders,9 there areroughly 7000 rare diseases that, taken together,affect about 10% of the first-world population, andyet only a few percent of these diseases have anypharmacological treatments available.10 With currentresearch and development costs, developing de novotherapies for each of these rare diseases is infeasible.All these taken together point to a need for innova-tive approaches, both for identifying new therapeuticopportunities, as well as improving our knowledgesurrounding drug action and side effects of investiga-tional compounds.
Against this backdrop, advances in genomicsand computational methods present new opportu-nities in research and drug development. Data suchas gene expression, drug–target interactions (DTI),protein networks, electronic health records, clinicaltrial reports, and drug adverse event reports are
*Correspondence to: [email protected] of Genetics and Genomic Sciences, Icahn Institute forGenomics and Multiscale Biology, New York, NY, USA2Courant Institute of Mathematical Sciences, New York Univer-sity, New York, NY, USA
Conflict of interest: Corresponding author Joel T. Dudley ownsequity in NuMedii Inc., Ayasdi Inc., and LAM Therapeutics.
© 2016 Wiley Per iodicals , Inc.

rapidly accumulating and becoming increasinglyaccessible and standardized.11,12 However, these dataare often complex, high-dimensional, and noisy, pre-senting new challenges and opportunities to developcomputational methods that can assimilate these datain order to accelerate drug discovery and generatenovel insights surrounding drug mechanisms, sideeffects, and interactions.
Computational pharmacology is the growingset of techniques aiming to address precisely the chal-lenges above. In this review, we will cover three spe-cific aims within the realm of computationalpharmacology (see Figure 1). The first is the predic-tion of DTI, which are fundamental to the way thatdrugs work and often provide an important founda-tion for other aims in computational pharmacology.Next, we will discuss methods to predict or explainpotential side effects or adverse drug reactions. Thisis important, as an improved understanding of off-target effects would result in fewer therapeutic fail-ures due to unintended physiological responses.Third, we will discuss methods for drug repurposing,that is, finding new uses for existing drugs.
In this review, we discuss methods in computa-tional pharmacology that integrate across multipledata resources or across data for many compounds(see Figure 2). Such data integration can help toreduce noise and improve the predictive ability of
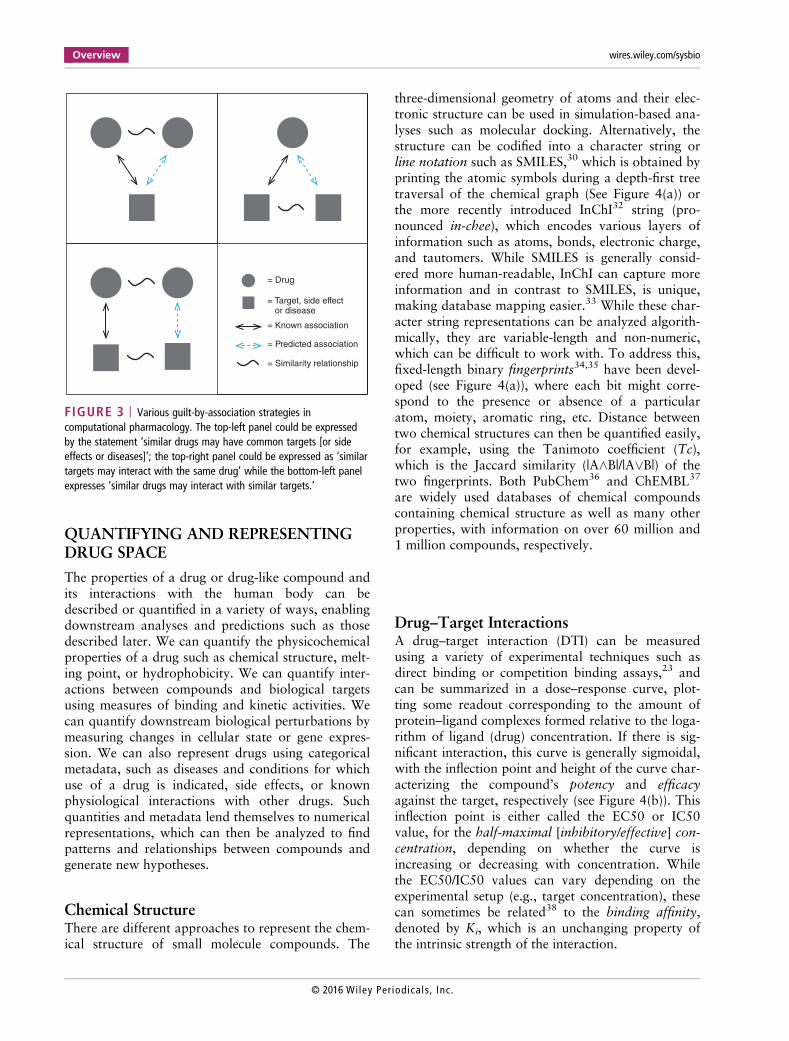
high-dimensional data sets.14–19 Data integrationacross compounds can also enable new types ofinquiry; for example, ‘What can information aboutone drug teach us about another drug?’ Examplesinclude similarity-based approaches (also sometimescalled guilt-by-association) that evaluate if ‘similar’drugs could share common targets,20–24 or have simi-lar side effects,25 or treat the same disease26–29 (seeFigure 3). There are different ways to define similar-ity and to make use of this idea, and herein we illus-trate several examples.
We start by discussing how different aspects ofpharmacological space can be measured and quanti-fied, including a description of some important data-bases and resources. We then give an overview ofthree applications of computational pharmacology:predicting DTI, predicting and explaining side effects,and drug repurposing. We close with a discussion ofdata integration in computational pharmacology andsome comments on future directions in the field.
Pharmocophoremodeling
Moleculardocking
Guilt-by-association
Deep neuralnetworks
Target
predictionDrug
repurposing
Side effect
prediction
Drug–target interactions
Guilt-by-association
EHR mining
Connectivity mapping
Drug–target interactions
Molecular networks
Guilt-by-association
Causality analysis
FIGURE 1 | A visual map of this article. We can discover newassociations between drugs and molecular targets, side effects, ordiseases, using a variety of techniques. Some of the strategiesreviewed in this article are listed in the three segments.
Inte
gra
tion
acro
ss d
ata
typ
es
Integration across compounds
Structure
Targets
Expression
Side effects
Indications
FIGURE 2 | Data can be integrated across compounds and/oracross data types. Note that this is a simplified illustration in thesense that both targets and gene expression responses to a compoundcan vary depending on the biological conditions in which they areassayed, for example, different cell lines, concentrations, etc.13
WIREs System Biology and Medicine Computational approaches to drug repurposing and pharmacology
© 2016 Wiley Per iodica ls , Inc.
QUANTIFYING AND REPRESENTINGDRUG SPACE
The properties of a drug or drug-like compound andits interactions with the human body can bedescribed or quantified in a variety of ways, enablingdownstream analyses and predictions such as thosedescribed later. We can quantify the physicochemicalproperties of a drug such as chemical structure, melt-ing point, or hydrophobicity. We can quantify inter-actions between compounds and biological targetsusing measures of binding and kinetic activities. Wecan quantify downstream biological perturbations bymeasuring changes in cellular state or gene expres-sion. We can also represent drugs using categoricalmetadata, such as diseases and conditions for whichuse of a drug is indicated, side effects, or knownphysiological interactions with other drugs. Suchquantities and metadata lend themselves to numericalrepresentations, which can then be analyzed to findpatterns and relationships between compounds andgenerate new hypotheses.
Chemical StructureThere are different approaches to represent the chem-ical structure of small molecule compounds. The
three-dimensional geometry of atoms and their elec-tronic structure can be used in simulation-based ana-lyses such as molecular docking. Alternatively, thestructure can be codified into a character string orline notation such as SMILES,30 which is obtained byprinting the atomic symbols during a depth-first treetraversal of the chemical graph (See Figure 4(a)) orthe more recently introduced InChI32 string (pro-nounced in-chee), which encodes various layers ofinformation such as atoms, bonds, electronic charge,and tautomers. While SMILES is generally consid-ered more human-readable, InChI can capture moreinformation and in contrast to SMILES, is unique,making database mapping easier.33 While these char-acter string representations can be analyzed algorith-mically, they are variable-length and non-numeric,which can be difficult to work with. To address this,fixed-length binary fingerprints34,35 have been devel-oped (see Figure 4(a)), where each bit might corre-spond to the presence or absence of a particularatom, moiety, aromatic ring, etc. Distance betweentwo chemical structures can then be quantified easily,for example, using the Tanimoto coefficient (Tc),which is the Jaccard similarity (|A^B|/|A_B|) of thetwo fingerprints. Both PubChem36 and ChEMBL37
are widely used databases of chemical compoundscontaining chemical structure as well as many otherproperties, with information on over 60 million and1 million compounds, respectively.
Drug–Target InteractionsA drug–target interaction (DTI) can be measuredusing a variety of experimental techniques such asdirect binding or competition binding assays,23 andcan be summarized in a dose–response curve, plot-ting some readout corresponding to the amount ofprotein–ligand complexes formed relative to the loga-rithm of ligand (drug) concentration. If there is sig-nificant interaction, this curve is generally sigmoidal,with the inflection point and height of the curve char-acterizing the compound’s potency and efficacyagainst the target, respectively (see Figure 4(b)). Thisinflection point is either called the EC50 or IC50value, for the half-maximal [inhibitory/effective] con-centration, depending on whether the curve isincreasing or decreasing with concentration. Whilethe EC50/IC50 values can vary depending on theexperimental setup (e.g., target concentration), thesecan sometimes be related38 to the binding affinity,denoted by Ki, which is an unchanging property ofthe intrinsic strength of the interaction.
= Target, side effect or disease
= Known association
= Predicted association
= Similarity relationship
= Drug
FIGURE 3 | Various guilt-by-association strategies incomputational pharmacology. The top-left panel could be expressedby the statement ‘similar drugs may have common targets [or sideeffects or diseases]’; the top-right panel could be expressed as ‘similartargets may interact with the same drug’ while the bottom-left panelexpresses ‘similar drugs may interact with similar targets.’
Overview wires.wiley.com/sysbio
© 2016 Wiley Per iodicals , Inc.

TABLE
1|ASelectionof
DatabasesandResourcesUsefulforC
omputationalPharm
acologyandDrug
Repurposing
Resource
type
Resource
Description
URL
Generalresource
forcom
poundinform
ation
PubC
hem
Database
ofover
60millioncompoundstructures,
chem
icalfeatures,b
ioactivity,etc.
https://pubchem
.ncbi.nlm.nih.gov/
Generalresource
forcom
poundinform
ation
ChEM
BLDa
tabase
ofover
1millioncompoundstructures,
chem
icalfeatures,b
ioactivity,etc.
https://w
ww.ebi.ac.uk/chembl/ws
DTIs(binary)
DrugBank
Drug
anddrug
target
inform
ationforo
ver7
000
drugs
http://www.drugbank.ca/
DTIs(detailed)
BindingD
BInform
ationon
bindingaffinitiesandother
quantitiesrelatedto
DTIs
https://w
ww.bindingdb.org
PredictedDT
IsSEA
DTIspredictedusingtheSEAmethod
http://sea.bksla
b.org/
PredictedDT
IsDR
.PRO
DIS
DTIspredictedusingtheFindsitecom
bmethod,
can
also
access
killing
index(see
text)
http://cssb.biology.gatech.edu/repurpose
Drug-inducedtra
nscriptionalperturbations
Cmap
v21309
compounds
exposedto
five
different
cancer
celllines
https://w
ww.broadinstitute.org/cmap/
Drug-inducedtra
nscriptionalperturbations,etc.
LINCS
L1000data:o
ver1
millionprofilesgeneratedby
chem
icalandgenetic
pertu
rbationof
dozens
ofcancer
andprimarycelllines;o
ther
drug-re
lated
datasetsalso
available
http://www.lincscloud.org/a
ndhttp://www.lincsproject.org/
Disease-relatedgenetic/genom
icpertu
rbations
TCGA
RNAseq,m
icroarray,and/or
sequence
inform
ation
oncanceroustissues,coveringover
30typesof
cancer
http://cancergenome.nih.gov/
Disease-relatedtra
nscriptionalperturbations,
etc.
GEO
Anarchiveof
microarray,next-generation
sequencing,and
otherformsof
high-th
roughput
functionalgenom
icdata
subm
itted
bythe
scientificcommunity,coveringawidevarietyof
experim
entalconditions
includingdisease
characterizations
http://www.ncbi.nlm.nih.gov/geo/
Phenotypicdrug
screen
NPC
(NCG
C)Results
ofroughly2500
approved
compounds
screened
in~200phenotypicandtarget-based
assays,focusingon
various
cancers,malaria,
nuclearreceptors,and
signalingpathways
http://tripod.nih.gov/npc/
Phenotypicdrug
screen
PD2
Results
ofnearly2500
approved
compounds
screened
in35
phenotypicassays
coveringfive
phenotypicmodules
(angiogenesis,W
ntpotentiation,
insulin
secretion,
GLP-1
secretion,
andKR
AS)
https://ncats.nih.gov/expertise/preclinical/pd2
Drug–diseaseassociations
Pharos
Resource
connectingdrugs,targets,anddiseases
https://pharos.nih.gov/idg/index
WIREs System Biology and Medicine Computational approaches to drug repurposing and pharmacology
© 2016 Wiley Per iodica ls , Inc.

Various levels of DTI information are availablein public databases. Binary-level information, that is,simply indicating the presence or absence of an inter-action, is available in DrugBank39 for several thou-sand drugs, representing over 4000 unique targets.This could naturally be constructed into a binary tar-get interaction profile vector for each drug, withlength equal to the number of targets. Alternatively,more detailed, experimentally determined binding datafor hundreds of thousands of drugs and drug-likecompounds are captured in databases such asChEMBL,37 PubChem Bioassay,36 and BindingDB.40
Drug Perturbations of Gene ExpressionGenome-wide mRNA expression levels can be usedas a proxy to measure chemical perturbations of cel-lular state by comparing expression in cellular sam-ples with and without exposure to a chemicalcompound. Each perturbation can be represented asan expression profile, where each gene is assigned anumber corresponding to the degree of up- or down-regulation relative to control (e.g., the difference ofmean expression values); or this can be further pro-cessed by discretizing the values into a signature,defined here to mean the sets of significantly up- anddown-regulated genes. Though less commonly used,one could alternatively consider differentialvariance,41 or drug-induced changes in the gene–genecovariance, also called differential coexpression42
(see Figure 4(c)). Several publicly available resourcesare worth mentioning here. The Connectivity Map43
(Cmap) and its recent update utilizing the L1000technology as part of the LINCS44 project have gen-erated publicly available expression measurementsfrom thousands of in vitro drug perturbations tomultiple human cell lines; while GEO45 serves as apublic gene expression repository with over one mil-lion samples to date, covering a wide varietyof experiments including both drug and disease per-turbations. Also, as part of a crowdsourcing proj-ect46 organized by the LINCS data integrationand coordination center, over 900 drug-perturbationexperiments have been extracted from GEO and pro-cessed into signatures that are freely availablefor download. Different metrics can be used to evalu-ate the similarity between two expression profilesand/or signatures,47,48 including correlation, cosinedistance, and Gene Set Enrichment Analysis.43
Cell and Animal PhenotypesMoving beyond the molecular level, one can alsomeasure or observe a compound’s phenotypic effectsTA
BLE
1|Co
ntinued
Resource
type
Resource
Description
URL
Drug–diseaseassociations
ClinicalTrials
Aregistryandresults
database
ofpubliclyand
privatelysupportedclinicalstudiesof
human
participantsconductedaround
theworld
https://clinicaltrials.gov/
Drug–sid
eeffectassociations
SIDE
RInform
ationfro
mpublicdocumentsandpackage
inserts
onmarketedcompounds
andtheir
recorded
ADEs,including
sideeffectfrequency
http://sid
eeffects.em
bl.de/
Drug–sid
eeffectassociations
Offsides
Side
effectsandAD
Esnotlisted
onFDA’sofficial
drug
label
http://tatonettilab.org/resources/tatonetti-stm
.htm
l
Drug–sid
eeffectassociations
FAERS
Adverseeventa
ndmedicationerrorreports
subm
itted
toFDA
http://www.fda.gov/Drugs/
GuidanceCom
plianceRegulatoryInformation/
Surveillance/Ad
verseD
rugEffects/
Signature-matchingrepositioning
pipeline
DvD(Drug
vs.D
isease)
AnR/Cytoscapepipelineprovidingdynamicaccess
topublicgene
expressio
nrepositoriesand
enablingdrug/dise
asecomparisons
www.ebi.ac.uk/saezrodriguez/DV
D/
Overview wires.wiley.com/sysbio
© 2016 Wiley Per iodicals , Inc.

N1CCN(CC1)C(C(F)=C2)=CC(=C2C4=O)N(C3CC3)C=C4C(=O)O
OH
ONH2
O OH
CL≥ 4 Br
1 0 0 1 1 0
SMILES string
Binary fingerprint
HN N
N OH
O
O
F
N N
N O
O
O
F
1
1 2
24
4
3
3
Breakcycles
N N
NO
O
O
F
1
1 2
2
4
4
3
3
Traversegraph
Removehydrogens
(a)
(c)
(d)
(b)
1 0 1 1 0 0
1 0 0 1 0 1
Side effect, disease, or drug classification
Flatten
ontology
Legend
(none)
Ontologyterm
Associateddrugs
Log(concentration)
EC50/
potency
Increasing
potencyEfficacy
% lig
an
d b
ou
nd
TreatedUntreated Profile
SignatureDiffe
rentia
l
varia
nceDiffe
rentia
l
coexp
ress
ion
Ge
ne
s
TreatedUntreated
Exp
ressio
n leve
l
Low High
Samples
FIGURE 4 | Quantifying and representing drug space. (a) Representing chemical structure. A two-dimensional representation of chemicalstructure can be processed into line notation such as the SMILES string, or into a binary fingerprint. To construct the SMILES string, first hydrogensare removed and any cycles are broken by removing one edge from each cycle. The SMILES string is then generated by printing the node symbolsduring a depth-first tree traversal of the chemical graph, and using parentheses to denote branches of the tree. In the example, the gold-coloredpath represents the main backbone for traversal. A binary fingerprint can be generated by pre-defining chemical features such as the ones shown,and then using a ‘1’ or ‘0’ to indicate the presence or absence of each feature in the chemical structure. (b) Quantifying drug–target interactions.A dose–response curve is shown, plotting the percentage of ligand (drug) bound with a candidate target, as a function of the logarithm of ligandconcentration. Since the slope is positive, the inflection point is called the EC50 value (see text). This is a measure of potency, with a lower EC50corresponding to a more potent effect of the drug on the target. The height of the curve at the inflection point is a measure of the strength of theeffect, that is, efficacy. (c) Quantifying drug-perturbed gene expression. Gene expression can be used to characterize the effect of a drug on agroup of cells by comparing expression between treated and untreated samples. The data can be processed into a differential expression profile, orprocessed further into a signature of up- and down-regulated genes. One could also summarize the perturbation using differential variance ordifferential coexpression. (d) Representing categorical associations such as side effects, diseases, or therapeutic classes. Categorical metadata canoften be mapped to a structured ontology (see text for examples), where the highest level of the tree corresponds to the broadest categorization,and deeper levels divide these into more and more detailed distinctions. A numerical representation can be generated by selecting a level of detailin the ontology tree and indicating presence or absence of a drug’s association with each category using a ‘1’ or ‘0.’ The construction of theSMILES string in (a) is modified based on a figure created by the Wikimedia user ‘Fdardel’ and reused according to the Creative CommonsAttribution-Share Alike 2.5 Generic license. (c) is modified from Gaiteri and Ding31 used with permission.
WIREs System Biology and Medicine Computational approaches to drug repurposing and pharmacology
© 2016 Wiley Per iodica ls , Inc.

on a cellular sample or in an animal model, forexample, cytotoxicity in cancer cells49–51 or sleepingpatterns in zebrafish.52 In fact, until roughly 30 yearsago this was the primary approach to drug discoveryuntil it was largely replaced by rational (i.e., target-centric) drug discovery, and yet has remained animportant source of new therapies, for example, con-tributing the majority of first-in-class FDA approvalsbetween 1998 and 2008.53 Phenotypic screens areadvantageous in that they evaluate a drug’s effectswithin the complexities of biological systems,enabling identification of hits whose mechanism maydepend on novel and/or multiple targets, and whichmay translate more easily into the clinic.54 Withinthe phenotypic screening paradigm, Zheng et al.54
discusses trade-offs between the use of cellular versusanimal models, for example, cell-based screens usu-ally have higher throughput while animal modelsenable probing of more complex phenotypes.
While phenotypic screens are usually performedone assay at a time with a particular disease or out-come in mind, data from multiple screens couldpotentially be aggregated to provide a phenotypicprofile for each compound. For example, the Bioas-say feature of PubChem55,56 contains over 740 mil-lion data points from both biochemical andphenotypic screens covering over 1 million smallmolecules, with many compounds having resultsfrom hundreds or even thousands of assays.ChEMBL also contains bioassay data, with over12 million data points.37 There are also some pub-licly available data resources containing (relatively)full drug-by-phenotype matrices. For example, NPC-PD257 contains results of nearly 2500 clinicallyapproved compounds screened in 35 phenotypicassays designed to focus on cardiovascular disease,diabetes, and cancer. Additionally, the NIH ChemicalGenomics Center has also compiled a dataset58 ofroughly 2500 approved compounds screened inabout 200 phenotypic and target-based assays, focus-ing on various cancers, malaria, nuclear receptors,and signaling pathways.
Finally, a noteworthy set of cell-based pheno-typic screens are cancer cell line sensitivitystudies,49–51 where cellular growth rates (also calledcell viability) are measured before and after drugexposure, for a panel of cancer cell lines. For exam-ple, the Cancer Therapeutic Response Portal49 meas-ured sensitivity of 242 genetically characterizedcancer cell lines to 354 small molecule probes anddrugs. Another example is the Genomics of DrugSensitivity in Cancer51 database, which measured138 anticancer drugs across 700 cell lines. The Can-cer Cell Line Encyclopedia59 provides complementary
information to these data, providing detailed geneticcharacterization of 1000 cancer cell lines, which, forexample, might be used to assess cell line similarityand predict drug-perturbed growth rates in addi-tional cell lines.60
Drug ClassificationsVarious drug classifications, for example, based ontherapeutic usage or pharmacological action, providean additional layer of information to the drug space.These classification systems are generally organizedinto some sort of hierarchical, structured ontology,where higher levels refer to more general categoriza-tions and lower levels to more specific terms andassociations, and oftentimes multiple, synonymousterms are stored together in the hierarchy, to supporta wide variety of queries and mappings. Such infor-mation can be translated into binary feature vectorsfor each drug by simply flattening the ontology treeat a particular depth and only respecting distinctionsup to that level (See Figure 4(d)). Similarity betweenthese vectors could then be computed using Jaccardsimilarity.
There are many examples of drug ontologies.The anatomical therapeutic class61 (ATC) coding sys-tem classifies the active ingredients of drugs into fivelevels, starting with the organ system(s) on which thecompound acts (e.g., the nervous or respiratory sys-tem), and subsequently drilling down into moredetail such as chemical or pharmacological cate-gories. Drug ATC codes are available on DrugBank’swebsite.62 The National Drug File Reference Termi-nology63 provides an alternative classification ofdrugs based on properties such as mechanism ofaction, physiologic effect, and therapeutic category,and is cross-referenced to other vocabularies includ-ing MESH64 and RxNorm.65 A third example is theChEBI66 ontology, which contains multiple sub-ontologies: one based on molecular structure, forexample, dividing organic and inorganic compounds;another based on chemical role, for example, as aninhibitor, ligand, or surfactant; another based on bio-logical role, for example, antibiotic, antiviral agent,coenzyme, or hormone; and finally another for appli-cations, for example, pesticide or anti-rheumaticdrug. Additional drug classifications or controlledvocabularies are provided by KEGG,67 MeSH,64 andMedDRAa.
A practical issue that can arise when workingwith multiple drug databases is that a single drugoften carries many different names and identifiers.RxNorm65 addresses this problem by providing stan-dardized compound names that are mapped to many
Overview wires.wiley.com/sysbio
© 2016 Wiley Per iodicals , Inc.

other names and identifiers, enabling easier dataintegration.
Disease IndicationsKnown therapeutic indications of a drug can be trea-ted as additional metadata providing clues, for exam-ple, for predicting side effects or new indications.Drug–disease associations are available from a vari-ety of sources, including DrugBank, Pharos,68 andPharmGKB.69 Pharos is a relatively new resourcethat connects drugs, targets, and diseases, wheredrug–disease associations include both those in clini-cal trials as well as approved indications, and diseaseterms are mapped to Disease Ontology ids (seebelow). PharmGKB is a database focusing on phar-macogenetics and pharmacogenomics (i.e., identify-ing drug/gene associations) but contains drug–diseaserelationships from FDA labels, such as those used inthe work of Yang and Agarwal.16 Information canalso be directly mined from the FDA, for example,using ‘the Orange Book’70 or FDALabel,71 the latterenabling full-text searching of drug labels includingprescription drugs, biologics, and over-the-countermedicines. Finally, clinical trials information can beconsidered a ‘noisy’ indication of drug–disease rela-tionships, with later-stage clinical trials representingincreased confidence in the association, relative toearly-stage trials.72 At the time of writing, Clinical-Trials.gov73 contained information on nearly200,000 trials.
Similar to the above-described drug classifica-tions, disease terms and indications are also organ-ized into various classifications and ontologies. Boththe Disease Ontology74 and MedDRA® providestructured ontologies over disease terms, henceenabling numerical representations for each drugbased on its known disease indications, in a similarway as just described in the previous section. Map-pings of unstructured disease terms between datasetsare made easier by controlled vocabularies such asMedical Subject Headings64 (MeSH) and otherswithin the Unified Medical Language Sys-tem75 (UMLS).
Side Effects and Adverse Drug EventsA final example of potentially useful drug-relatedinformation is given by side effects and adverse drugevents (ADEs). Similar to disease indications, sideeffects terms and adverse events are represented instructured ontologies such as MedDRA®. Severalimportant resources organize complementary aspectsof side effect information. First, SIDER76 (Side Effect
Resource) is a public side-effect database with com-piled information from FDA package inserts connect-ing 888 drugs to 1450 side-effect terms. Anotherresource is the OFFSIDES77 database, generated byanalyzing over 400,000 adverse effects not listed onthe FDA’s official drug label, and identifying an aver-age of 329 off-label ADEs per drug. Finally, the FDAAdverse Event Reporting System (FAERS) is a data-base of information on adverse event and medicationerror reports submitted to the FDA by manufac-turers, healthcare professionals, and the generalpublic.
Now that we have considered various ways toquantify and represent drug-related information, wewill see how such information can be used in severaldifferent applications of computational pharmacol-ogy, starting with target prediction.
PREDICTING DRUG-TARGETINTERACTIONS
At the most basic level, drugs exert their effects onbiological systems by binding with protein targetsand affecting their downstream activity, and henceknowledge of these interactions provides a keytoward understanding and predicting higher-levelinformation such as side effects, therapeutic mechan-isms, and novel indications. However, there are stillmany gaps in our knowledge of which drugs bind towhich targets. At the time of writing, DrugBank39
lists on average less than two targets per drug,whereas a recent article78 predicted that the trueaverage number of targets per drug is a staggering329. Even if this is a gross overestimation, it providessome indication that there are many more interac-tions than are currently known. Filling these gaps byexperimentally testing all drugs against all possibleprotein targets is currently infeasible, and hence avariety of computational methods have been devel-oped to predict likely interactions. De novo predic-tion, that is, based only on structure, is useful forvirtual screening of large compound libraries, whileother methods make use of related interactions togenerate new predictions for compounds that havealready been shown to have pharmacologicalactivity.
De Novo Structure-Based PredictionMolecular docking is a popular approach that usesthree-dimensional modeling and computer simulationto dock a candidate drug into a protein-bindingpocket and then score the energetic favorability orlikelihood of the pair’s interaction.79,80 This
WIREs System Biology and Medicine Computational approaches to drug repurposing and pharmacology
© 2016 Wiley Per iodica ls , Inc.

approach is advantageous in that it can providestructural insights into the nature of the interaction(see Figure 5(a)), which might enable further optimi-zation of the compound’s structure to increase bind-ing affinity for its target. However, moleculardocking depends on the existence of a reliable three-dimensional model of the protein, and for certain tar-get classes such as membrane-bound proteins, thisoften does not exist due to experimental limitations.Further, the approach is very computationallydemanding, limiting its feasibility for large-scale,many-to-many DTI prediction tasks.
While molecular docking is considered a target-based approach as each compound is evaluatedagainst the selected target’s structure, one can alter-natively take a ligand-based approach, constructing asort of abstract ‘pseudo-drug’ representation called apharmacophore model (see Figure 5(b)), containingthe chemical features deemed to be important forinteraction with the chosen target.81 Compounds canthen be aligned and scored against the model througha process that is much less computationally demand-ing than molecular docking. Pharmacophore modelscan be constructed from analysis of the target’s bind-ing pocket, or (moving beyond the de novo predic-tion setting) could alternatively be derived using a setof positive and negative examples of compoundsinteracting with the target. Compared with moleculardocking, this approach is more computationally effi-cient, and some studies indicate that it generally hasbetter accuracy.82,83 Pharmacophore models areoften used to screen large compound libraries (e.g.,
millions of compounds) in order to prioritize poten-tial lead compounds for experimental follow-up,84
sometimes improving hit rates by an order of magni-tude. However, the hit rate will naturally depend onthe quality of the pharmacophore model, which canbe sensitive to the specific compounds or algorithmused and hence prone to high false-positive and false-negative rates.81
Learning from Related InteractionsIf there are already established examples of com-pounds that interact with the same or a similar tar-get, this information can be included as an additionallayer useful for predicting new interactions. This isaccomplished by employing (either implicitly orexplicitly) a guilt-by-association (GBA) principle, thatis, that similar drugs may share common targets, orlikewise, similar proteins may be targeted by thesame drug. This line of thinking is supported byrecent work which found that among the roughly20,000 human proteins, there are only about 1000unique shapes of binding pockets,85 implying thatproteins have many shared binding pockets and inturn, shared binding partners. Providing additionalsupport for the GBA approach, Paolini et al.86 inte-grated drug–target interaction data from multiplesources to construct a bipartite DTI network andfound that proteins from the same class tend to sharecommon drug interaction partners.
Various approaches exist that incorporateknowledge of related interactions. One was already
(a) (b)
FIGURE 5 | Computational chemistry approaches for target prediction. (a) Result of a molecular docking simulation. The globular surface ofthe protein is shown in grey, and its docked ligand is in blue. (b) Example of a pharmacophore model. A pharmacophore model is used torepresent the chemical features deemed to be important for interaction with a chosen target. The features are arranged in three dimensions alongwith some tolerance radius in an attempt to account for dynamic conformational changes of both protein and ligand. A pharmacophore model canbe constructed from structural analysis of the target’s binding pocket, or can be based on previously known interactions with the target.Compounds can then be aligned and scored against a pharmacophore model in order to prioritize likely interactions. Colors indicate differentchemical descriptors such as hydrogen bond donor, or hydrogen bond acceptor, or hydrophobic region. (a) is reproduced from ‘Evolution ofConformational Disorder & Diversity of the P53 Interactome’ by Anne-Sophie Huart and Ted R. Hupp, under the terms of the Creative CommonsAttribution License. (b) is recreated based on a figure by Wikimedia user ‘Dcirovic.’ Licensed under CC0 via Commons:https://commons.wikimedia.org/wiki/File:PharmacophoreModel_example.svg#/media/File:PharmacophoreModel_example.svg.
Overview wires.wiley.com/sysbio
© 2016 Wiley Per iodicals , Inc.

mentioned in the previous section: DTI-based phar-macophore modeling. Another commonapproach87,88 is to frame the problem as binary clas-sification and employ supervised machine learningmodels where the inputs are physicochemical featuresof the drug and/or protein in question, and the out-put (either known or predicted), is the presence orabsence of an interaction. For example, Nidhi et al.87
used a Naïve Bayes framework to predict targetsbased only on chemical structure, achieving 77%recall of known interactions among the top three pre-dicted targets for each drug. As an alternative tobinary classification, one can also formulate DTI pre-diction as a regression problem where the aim is toestimate binding affinities. Examples of this includethe work of Bock and Gough,89 in which supportvector regression was used to identify high-affinityligands for orphan GPCRs; and the more recentwork of Cao et al.90 in which random forest regres-sion on both drug and target features achievedAUC’s of up to 0.96.
Deep neural networks have also recently beenexplored to predict drug–target interactions fromchemical structure along with known interac-tions.92,93 For example, Ramsundar et al.92 inte-grated millions of data points representing bothpositive and negative examples of DTIs for over200 unique targets. They used a ‘multi-task’ frame-work, in which prediction for each target was consid-ered a separate task requiring its own (linear)classifier, but where all classifiers used the same fea-ture representation, which was optimized using theneural network. The deep-learning based approachachieved a maximum cross-validated AUC (areaunder the receiver operating curve) of 0.87 anddemonstrated that the multitask aspect of theirapproach consistently provided slight improvements(roughly 0.01 increase in AUC) over an equivalentsingle-task analysis with the same amount of data.Note that the task-specific linear classifiers as well asthe previously mentioned machine learning modelsare in some sense analogous to a pharmacophoremodel, in that all of these models ‘decide’ whichstructural features are most important for theinteraction.
All of the above-described methods only implic-itly invoke the similarity principle, for example, byfitting coefficients to drug and/or protein features, sothat drugs with similar features would have similarpredictions. However a number of machine learningmethods have been developed which explicitlyemploy a similarity-based framework by workingdirectly with similarity matrices between drugsand/or targets. A very simple example is a nearest-
neighbor method,21 where, for example, one couldpredict whether an interaction would occur betweendrug D and target T based on whether the drug‘nearest’ to D interacts with T, or alternatively,whether the target nearest to T interacts with D. Inthis same vein, Bleakley et al.20 propose a slightlymore sophisticated approach they call bipartite localmodels, training a different support vector machine(SVM) classifier for each drug and each target, whereuser-specified drug- and target-similarity matrices areinput to the SVM algorithm, and known interactionsserve as labels. Ding et al.21 provide a cogent andinsightful review of similarity-based machine learningapproaches, along with some experiments bench-marking the ability of eight different algorithms torecover known DTIs. While their results did notreveal a clear winner, AUCs reached as high as 0.98for ion channels, but varied significantly per targetclass (likely due at least in part to varying amountsof available data per class), and are hence difficult tocompare against the AUCs from the deep-learningapproach described above.
While compound structural similarity is per-haps the most natural and well-supported metricused for DTI prediction, other notions of similarityhave also found success. For example, Campilloset al.22 developed a metric for side effect similarityover a set of 746 marketed compounds, findingapproximately 1000 side-effect-driven drug–drugrelationships and confirming 9 out of 20 subsequentDTI predictions in cell-based assays. Interestingly,about one quarter of their identified drug pairs wereboth chemically dissimilar and also had differenttherapeutic indications, demonstrating that sideeffect information provides a somewhat orthogonalview of compound relationships that is still informa-tive of target activity. Keiser et al.94 present analternative framework based on their similarityensemble approach (SEA),23 where each targetis represented by its known binding ligands (includ-ing endogenous ligands), and then similarity betweenthe candidate drug and the ligand set is evaluatingusing a statistical framework developed by theauthors.23 Of 30 tested predictions, 23 of themwere experimentally confirmed, including theactivity of the drug DMT on serotonergic receptors,indicating a different mechanism of action for DMTthan was currently understood. A final example usingan alternative notion of similarity is the network-based inference (NBI) method,24 which simply usesknown DTIs to predict new ones; that is, the drugsimilarity metric in this case (though not explicit inthe NBI framework) is based on target interactionprofiles.
WIREs System Biology and Medicine Computational approaches to drug repurposing and pharmacology
© 2016 Wiley Per iodica ls , Inc.

One important consideration when employingany such technique based on related interactions isthe paucity of high-confidence negative examples;that is, it is difficult to know whether a particulardrug–target interaction is, in fact, not possible, or ifan interaction may occur in a different biologicalcontext. Recent work91 aimed to address this prob-lem by developing an in silico method to identifyhigh-confidence negative examples and furtherdemonstrating that such examples boost predictiveperformance.
DTI prediction is a fairly well-studied problem,with many different techniques that together use avariety of data including chemical structure, proteinstructure, side-effect associations, ligand sets, andother drug–target interactions. While computationalchemistry can be used to generate de novo predic-tions and hence explore new areas of pharmacologi-cal space, similarity-based techniques offer theadvantage that they can improve in accuracy as moredata become available. Many of these methods havedemonstrated a high degree of accuracy and haveproven to be useful both in virtual screening settingsto prioritize compounds for High ThroughputScreening, as well as for identifying new targets forknown drugs. We will see in the next sections howthese techniques can also provide a foundation topredict side effects and discover new therapeuticindications.
PREDICTING AND EXPLAINING SIDEEFFECTS AND ADVERSE EVENTS
Drug safety is a critical factor in the success of com-mercial drug development. Improved ability to modeland predict drug side effects and adverse events iscrucial for improving the efficiency of drug discovery,as early identification of undesirable toxicity can pre-vent further investment of resources in a nonviabledrug entity. The current standard approach to safetyscreening is pre-clinical testing in animal diseasemodels. However, such experiments are costly,95 andleave a large degree of uncertainty as to whether theresults will translate into humans96,97 due to geneticand environmental differences.
Computational approaches can help addresssome of these challenges. In silico techniques havethe potential to predict unwanted side effects at ear-lier stages in the drug development pipeline, forexample, based on predicted drug–target interac-tions78,98 or in vitro drug-induced gene expressionperturbations.99 Further, Lum et al.100 suggest thattranslational uncertainty between animal models and
humans could be lessened by taking a computationalsystems biology approach, modeling the conservedresponses of molecular networks across species.
Identification of new side effect associationswith approved compounds is also an important aimand falls under the heading of pharmacovigilance.Such associations might be missed in clinical trials,for example, due to the rarity of occurrence, or adelay between start of medication and onset of symp-toms.101 Computational techniques are particularlyrelevant in this case, given the added ability to minedata surrounding the compound’s post-market useand effects.25,101,102
Target-Mediated ConnectionsSome protein targets have been identified as causallyimplicated for undesirable effects,103,104 and thisinformation can be used to link drugs with sucheffects. For example, Lounkine et al.98 used the SEAmethod23 described in the previous section to evalu-ate the activity of 656 marketed drugs on 73 sideeffect-associated proteins. They developed a methodto identify predicted off-targets that explained sideeffects better than any of a drug’s established targets.From this came a prediction that abdominal painfrom the synthetic oestrogen chlorotrianisene ismediated by its newly discovered and validated inter-action with the enzyme cyclooxygenase-1. Zhouet al.78 took a similar approach, using their FINDSI-TEcomb method105 to predict DTIs for all drugs inDrugBank compared against a majority of proteinsin the human proteome. Combining these predictedDTIs with known drug-side effect associationsenabled association of targets with side effects, evenif the targets had no experimentally verified druginteractions. Finally, the authors introduced a killingindex, which estimates the likelihood that a com-pound has serious side effects such as death, strokeor heart failure. They found that 44% of small mole-cules from DrugBank were predicted to have a killingindex >0, whereas this was true for only 16% ofFDA-approved drugs, providing some validation totheir analysis and suggesting that this killing indexmight be useful, for example, to filter out investiga-tional compounds in early stages of drugdevelopment.
Molecular Network ModelingWhile the approaches just described are based onestablished connections between targets and sideeffects, molecular network modeling can be used tohypothesize new connections between targets and
Overview wires.wiley.com/sysbio
© 2016 Wiley Per iodicals , Inc.

side effects and help to elucidate physiologicalmechanisms. This is exemplified by the work of twodifferent groups aiming to explain a fatal hyperten-sive response among some people taking the CETPinhibitor torcetrapib which lead to the drug (intendedfor atherosclerosis) failing Phase III clinical trials.106
An understanding of the molecular mechanisms indu-cing the fatal response would help to avoid repeti-tions of this scenario in the future and clarifywhether other CETP inhibitors should continue to bepursued. Chang et al.107 developed a frameworkusing structure-based target prediction and a tech-nique called metabolic modeling108 to implicate tar-gets for the hypertensive response, hypothesizing thatthe side effect was due to renal regulation of bloodpressure via metabolite reabsorption and secretion.Using structure-based target prediction, they identi-fied a list of 41 metabolic proteins predicted to beoff-targets of the drug. Then they used a renal meta-bolic network model constructed over 338 genes tosimulate phenotypic consequences of inhibition ofeach of the targets, yielding 6 out of 41 ‘hits’ pre-dicted to alter renal function. Two of these hits hadliterature support connecting the targets to hyperten-sion in humans, mice and/or rats, while the remain-ing four were novel hypotheses. Fan et al.109 alsoused network analysis to explore potential explana-tions for the torcetrapib-induced hypertension. Theyconstructed a context-specific human signaling net-work filtered by a set of genes that were differentiallyexpressed in adrenal carcinoma cells treated with tor-cetrapib, identifying several enriched signaling path-ways with previous associations to hypertension.
Other ApproachesA variety of other approaches have been used to ana-lyze or predict connections between drugs andadverse effects. Scheiber et al.110 used known drug–ADE associations to connect specific chemical fea-tures of drugs to 4210 ADE terms using an extensionof Naïve Bayes modeling. An example of a resultingmodel is shown in Figure 6, depicting a well-knownexample of structural associations with QT intervalprolongation, which causes cardiac arrhythmia.Along similar lines, Liu et al.111 used causality analy-sis based on Bayesian network structure learning toconnect both chemical and biological features ofdrugs to ADEs, in a way that could be causally inter-preted. As a final example, Vilar et al.25 used a GBAapproach on a large insurance claims database toestimate drug associations with four diverse ADEs:acute renal failure, acute liver failure, acute myocar-dial infarction, and upper gastrointestinal ulcer. The
authors evaluated various compound similarity met-rics such as chemical structure, targets, ATC code,and other ADEs, finding that the latter two metrics,both informed by phenotypic associations, achievedthe top AUPRs (Area Under the Precision-RecallCurve) in three of the four ADEs tested.
Side effect prediction and analysis is an impor-tant yet challenging aim in computational pharma-cology. Part of the challenge stems from the difficultyin defining side effects unambiguously. Additionally,relative to drug–target interactions, side effects aregenerally quite downstream in a cascade of biologicalevents initiated by drug exposure, and hence drug–side effect relationships are more indirect and henceelusive.
DISCOVERING NEW CONNECTIONSBETWEEN DRUG AND DISEASE
One area of computational pharmacology that hasgained increasing amounts of attention in recentyears is drug repurposing (also called ‘repositioning’),which seeks to find new uses for known drugs as wellas for early-stage assets or shelved compounds. Twokey insights help explain why drugs could be usedfor more than one purpose: first, many drugs havemultiple protein targets,86,112 and second, differentdiseases can share genetic factors, molecular path-ways, and/or clinical manifestations,113,114 and hencea drug which acts on such overlapping factors maybe beneficial to both conditions. Drug repurposing isnot a new idea. Examples of successfully repurposed
Terfenadine
Q T p r o l o n g a t i o n
Astemizole
HO
N
OH
F
N
NN
H
N
O
FIGURE 6 | Connecting chemical features to side effects. Scheiberet al.110 used known drug–ADE associations to connect specificchemical features of drugs to various ADE terms using an extension ofNaïve Bayes modeling. An example of a resulting model is shownhere, associating specific chemical features with QT intervalprolongation, which causes cardiac arrhythmia. (Adapted withpermission from Ref110)
WIREs System Biology and Medicine Computational approaches to drug repurposing and pharmacology
© 2016 Wiley Per iodica ls , Inc.

drugs include Minoxidil, developed for hypertensionand now indicated for hair loss, Viagra, repurposedfrom angina to erectile dysfunction, and Thalido-mide, originally for morning sickness and now usedto treat symptoms of leprosy.115,116 However, whilethese examples were due to serendipitous observa-tions, we will discuss computational methods thatexplore the drug repurposing space systematically.
Drug repurposing offers many benefits over denovo drug development. The time and cost towardapproval of a new indication can be greatly reducedfor a drug with an established safety record, withestimates of 3–10 years for a repurposed compoundas compared with 10–17 years for a new molecularentity (NME).117 Approval rates are also muchhigher, for example, 25% of repurposed candidatessucceed from Phase II to approval, compared with10% for a NME.6 Furthermore, drug repurposing isa promising avenue to address unmet therapeuticneeds for rare and neglected diseases,118–124 and canalso identify drugs that are more efficacious or cost-effective than existing ones. Finally, some of the insilico techniques described here provide the addi-tional benefit of generating hypotheses about biologi-cal mechanisms of a drug or disease in the process ofpredicting new repositioning candidates, comparedwith traditional drug development strategies whichsometimes treat biological systems as ‘black boxes.’
Note that, in the following paragraphs, we willdescribe how various sources of information, includ-ing DTIs and side effects, can provide clues for drugrepurposing. This can be effective even when theseclues are predicted from other information sourcessuch as chemical structure,16 and hence in this waywe can view drug repurposing as a natural extensionof methods described in the previous sections.
Target-Centric ApproachesOne approach for identifying a new indication is torepurpose a drug based on the biological role that atarget plays in disease. A rather straightforwardexample in this regard is the work of Chavaliet al.,122 who used metabolic modeling to generate alist of 15 genes and 8 double-gene combinations pre-dicted to be relevant targets for the neglected tropicaldisease, leishmaniasis major. The authors were ableto associate these genes with 254 FDA-approvedcompounds based on drug–target interactions, andfound validation for 14% (10 out of 71) of thesecompounds which overlapped with an independentHTS screen against leishmaniasis. Another examplethat employs this approach in a more complex man-ner is the work of Chen et al.,72 who integrated a
large number of information sources including drug–target interactions, disease–gene associations, andprotein–protein interactions networks into a hetero-geneous network they call DrugNet, connectingdrugs, targets, and diseases. The authors use a net-work propagation algorithm called ProphNet125 that,given an input query node, either a drug or disease,ranks the remaining nodes of the other type, that is,drugs for a disease query, and vice versa. Theyachieved a leave-one-out cross-validation AUC of0.96 in recapitulating known drug-diseaseassociations.
From Side Effects to DiscoveriesWhile side effects usually carry negative connota-tions, sometimes these unintended consequences offerclues toward new therapeutic directions. For exam-ple, the testosterone reductase inibitor Finasteridewas initially tried and ultimately approved to treatbenign prostatic hyperplasia.126 During the trials,however, an unintended treatment outcome was hairgrowth. Rather than dismissing this side effect as anegative, this observation ignited the idea to repur-pose Finasteride for the hereditary condition Andro-genetic Alopecia (colloquially called male patternbaldness). In another example, the antidepressantdrug bupriopion was noted to have an antismokingeffect during the clinical trials for treating depres-sion.127 This finding lead to the development of anew smoking cessation drug marketed as Zyban.128
These serendipitous observations raise the ques-tion of whether the discovery of new indications canbe accelerated by automated, systematic mining ofside effect information. Indeed, Zhang et al.17 foundthat side effect information was even more predictiveof disease indications than chemical structure or pro-tein target information. Yang and Agarwal16 mergeddrug–side-effect data from SIDER76 with drug–disease information from PharmGKB69 to identify aset of side-effect–disease relationships, which werethen used to build Naïve Bayes models for 145 dis-ease indications using the side effects as features (seeFigure 7), achieving AUCs above 0.8 for 92% of themodels. Ye et al.26 similarly hypothesized that drugswith similar side effects might share common indica-tions. They constructed a network over drugs basedon Jaccard similarity of their associations with 6495side effects. Disease indications were then predictedbased on enrichments of FDA-approved indicationsamong neighboring compounds, and while theauthors did not compute ROC curves, they foundthat over 70% of the predictions were FDAapproved, and another 10% supported by
Overview wires.wiley.com/sysbio
© 2016 Wiley Per iodicals , Inc.

preclinical/clinical trials or scientific literature. Inter-estingly, the results varied widely for different classesof drugs, with the best performance for treatments ofdiabetes and obesity as well as laxatives andantimycobacterials.
Of course, side effect information are onlyavailable for drugs that have at least reached clinicaltrials if not approval, and hence approaches usingside effect information alone would generally onlyapply in these cases. However, there are ways aroundthis; for example, predicting side effects from chemi-cal structure and then connecting these side effects topotential indications.16
Gene Expression as a Common Languagebetween Drug and DiseaseGene expression data provide a high dimensionalreadout of cellular state and biological perturbationresulting from drug treatment or the presence of dis-ease. Gene expression profiling enables quantitativemolecular comparisons between drug- and disease-perturbed states. One advantage of transcriptomicapproaches is that this type of data can be generatedfor nearly any chemical compound or disease,regardless of the compound’s approval status, andagnostic to drug or disease mechanisms. Further,while information on side effects and targets hasmany false negatives, expression profiling provides
an unbiased, genome-scale view for each drug anddisease perturbation.
One key approach used in many expression-based drug repurposing studies115,129–132 is alterna-tively called signature reversion, signature matching,or connectivity mapping,43 which matches drugs anddiseases with opposing or anti-correlated expressionprofiles, reasoning that if gene expression is per-turbed in one direction in a diseased state, and in thereverse direction upon exposure of a drug, then per-haps that drug could ‘push’ the disease-perturbedexpression back toward a more normal state, andhence provide therapeutic benefit for the disease133
(see Figure 8). For example, Sirota et al.129 systemati-cally compared gene expression signatures derivedfrom Cmap for 164 small molecule compoundsagainst a set of expression signatures derived fromGEO for 100 different diseases, generating over 1000drug repurposing predictions, connecting at least oneof the 164 compounds to each of 53 diseases. Twopredictions from this work were selected for experi-mental validation in animal models, both yieldingpositive results. Specifically, topiramate, an anti-convulsant predicted to be therapeutic for both ulcer-ative colitis and Crohn’s disease, was shown to ame-liorate symptoms in a rat model of irritable boweldisorder,134 and also cimetidine, an antihistamineapproved for inhibition of gastric acid secretion waspredicted to treat lung adenocarcinoma (LA), and
TracheobronchitisPemphigus0.320.15
MCC
Sialadenitis
Lerisetron
MitiglinideMelagatran
Muraglitazar
Glenvastatin
Ximelagatran
Pranlukast
ABT-770
Claudivation Arm pain VasculitisSexual
dysfunctionHyperkalemia
Postural
hypotension
Sinus
arrest
Positive
ANA
Cold
extremities
Hypertension
FIGURE 7 | Connecting side effects to diseases. Yang and Agarwal16 constructed 145 disease-specific models using drug side effects aspredictive features to evaluate each drug’s therapeutic potential for the disease. Shown is their predictive model for hypertension, where theassociation between hypertension and each side effect (quantified by the Matthews correlation coefficient, MCC) is depicted by both color andedge-thickness. Binary associations between drugs and side effects are shown in grey. Notice that many of the features such as posturalhypotension and cold extremities seem reasonable in that they are commonly associated with low blood pressure. Reprinted with permission underthe CreativeCommons license: https://creativecommons.org/licenses/by/2.0/.
WIREs System Biology and Medicine Computational approaches to drug repurposing and pharmacology
© 2016 Wiley Per iodica ls , Inc.

showed dose-dependent reduction of LA tumorgrowth in mice.129
Signature matching can also be used to connectbetween drugs. Iorio et al.99 used pairwise similaritybeen drug-perturbed gene expression profiles to con-struct a network over 1302 drugs. Highly connectedcommunities in this graph were significantly enrichedfor compounds with similar MoA (Mechanisms ofAction) and also revealed new mechanisms and indi-cations, for example predicting and subsequently ver-ifying that the drug Fasudil enhances cellularautophagy, indicating potential for certain neurode-generative disorders. Note that this is anothersimilarity-based approach, since mechanisms arehypothesized to be shared between similar com-pounds, where similarity is now based on geneexpression perturbations.
One drawback of these expression-basedapproaches is that some drugs and diseases do notinduce strong expression perturbations, and hencethe signal for such perturbations would be noisy andhence lead to higher false-positive or false-negativerates. Another consideration is that the signaturereversion principle may fail, for example, if the dis-ease expression profile is a result instead of a causeof the diseased state, in which case reverting the pro-file with a drug may not be therapeutic.
Finally, there are some interesting opportunitiesfor future work here. First, there is an opportunity tobetter explore and leverage the tissue- or cell type-specificity of drug transcriptional perturbations, asmost existing approaches ignore this dimension ofinformation, and in some cases such context has beenshown to be very important.13 Also, instead of
simple, pairwise-comparisons of expression profiles,it might be fruitful to better understand or map outthese drug- or disease-perturbed transcriptional land-scapes, providing more meaningful context or metricsfor subsequent comparisons. This is one example ofdata integration within a single modality. Some workhas already ventured in this direction, for example,analyzing bi-clusters135 of genes co-regulated by asubset of compounds, or applying a generalization ofBayesian principal component analysis to projectdrug-perturbed expression profiles into a lower-dimensional linear subspace.136 One simple, yet rela-tively unexplored direction within this vein would beto incorporate covariance between genes (often calledcoexpression) into a similarity metric.
Drug- and Disease-SimilarityThe GBA principle can also be applied to make newconnections between drug and disease.27–29 Forexample, Chiang and Butte27 hypothesized that iftwo diseases have medications in common, thenother medications currently used for only one of thetwo diseases may also be therapeutic for the other.They compiled FDA approved as well as off-labeluses connecting 2022 drugs to 726 diseases, andapplying this simple GBA rule, generated about57,000 novel drug-use suggestions. As validation, theauthors found that their predicted drug–disease pairswere 12 times as likely to be found in recent clinicaltrials than those that were not suggested by theirmethod. Another example is the work of Zhanget al.,28 who developed a matrix factorization frame-work to implement a more general version of a drug
TreatedUntreated
Genes
HealthyDiseased
Drug opposite to disease
Drug similar to disease
...Drug 1
Drug 2
...Disease
1
Disease
2
FIGURE 8 | ‘Connectivity mapping’ for drug repurposing. The connectivity mapping approach hypothesizes that a drug and disease withopposing or anti-correlated expression profiles might be a therapeutic match, reasoning that if gene expression is perturbed in one direction in adiseased state, and in the reverse direction upon exposure of a drug, then perhaps that drug could ‘push’ the disease-perturbed expression backtoward a more normal state, and hence provide therapeutic benefit for the disease.
Overview wires.wiley.com/sysbio
© 2016 Wiley Per iodicals , Inc.

and disease GBA rule, where instead of connectingdisease pairs based on sharing the exact same medi-cation, they incorporate a variety of both disease sim-ilarity and drug similarity information. They achieve10-fold cross-validation AUC of 0.87. This methodoffers the added benefit of a quantitative estimate ofthe relative contribution of each source of similarityinformation, here finding that side effect informationhad the largest contribution, followed by chemicalstructure and then known targets.
Mining and Validating Drug RepurposingSignals in Electronic Health RecordsElectronic health records (EHRs) offer a promisingnew resource to be explored for generating and vali-dating drug repurposing hypotheses. EHR providemassive, longitudinal data on thousands or even mil-lions of patients, including lab results, diagnosiscodes, prescriptions, and physician notes. As EHRdatabases are becoming more standardized and inte-grated across multiple hospital systems, they aregaining increasing attention from the informaticscommunity as a resource to be mined, for example,to assess quality of patient care, build early predic-tion models for disease, re-evaluate medication usage,and identify off-label usage.137 By identifyingmatched cohorts within an EHR database that eitherhave or have not been prescribed a particular medi-cation, one could conceivably perform observationalstudies as proxy for randomized controlled clinicaltrials, mining for unexpected effects associated withthe prescribed medication. In contrast to many obser-vational study contexts, the vast scale of EHR data-bases would enable this to be done in parallel to testa large number of drug repurposing hypotheses andanalyze effects over larger patient populations andlonger time durations. While we are not yet aware ofany such published analyses generating novel drugrepurposing hypotheses from EHR analysis, Xuet al.138 demonstrated the utility of EHR data for asimilar use- to provide external validation to an exist-ing drug repurposing hypothesis. They used the casestudy of metformin, a drug traditionally used to treattype 2 diabetes (T2D) but recently hypothesized tobe associated with reduced cancer mortality. To testthe hypothesis, the authors identified patients in twoseparate EHR databases diagnosed with both cancerand T2D, and applied Kaplan–Meier survival analy-sis to find that patients taking metformin indeed hadimproved survival. While we foresee that more drugrepurposing studies will be published using EHRdata, current work with EHR databases is oftenimpeded by privacy concerns as well as data cleaning
and modeling issues, including incomplete and irreg-ularly sampled information, inaccurate diagnosiscodes, and unstructured clinical notes.137
While computational drug repurposing is stillwaiting to see its first compound reach the market,experimental and quantitative evidence is accumulat-ing in support of the feasibility of this approach. Thefield will likely continue to draw new attention, bothfrom researchers; as new data such as internet searchqueries102 and EHRs are incorporated into analyticpipelines; as well as from the general public, as evi-dence for this strategy continues to grow. One wayto make this evidence more convincing and advancethe field more systematically would be to adopt stan-dardized validation datasets so that different meth-odologies could be compared on the same footing(e.g., Cheng et al.48). Potential datasets that couldserve this purpose might come from clinical trials dataas used by Martinez et al.,72 drug therapeutic classifi-cation as used by Napolitano et al.,18 or drug–diseaseassociations, such as those used by Cheng et al.48
Finally, enough examples of repurposed com-pounds have been generated that we can begin toask questions like, ‘Are there certain features of a com-pound that make it more or less repurposeable?’ Orsimilarly, ‘Are there certain classes of diseases or con-ditions for which repurposing hits are more likely?’
DATA INTEGRATION INCOMPUTATIONAL PHARMACOLOGY
While we have already described many integrativeapproaches as they apply to different pharmacologi-cal aims, in this section we bring data integrationinto the spotlight, first highlighting the benefits ofsuch approaches, and then critically discussing sev-eral computational methodologies that lend them-selves well to data integration.
The Case for Data IntegrationAs pharmacological space comprises a variety of datatypes, each one having its own peculiarities and chal-lenges, it is natural that the first attempts to minethese data often focus on just one or two of theseinformation sources. However, in the same way thatmultiple camera angles can help clarify a sports play,it is intuitive that multiple data angles would gener-ally improve predictive performance and help clarifythe story surrounding a particular drug and its poten-tial effects on the human body. A statistical rationalefor the benefit of integrative approaches is that somecomponent of the noise contained in each datamodality will be independent, and hence, combining
WIREs System Biology and Medicine Computational approaches to drug repurposing and pharmacology
© 2016 Wiley Per iodica ls , Inc.

these modalities would lessen the obfuscating effectsof such noise.
Quantitative evidence in support of integrationacross data types has been demonstrated for a varietyof tasks in areas related to computationalpharmacology.14–19 For example, Napolitano et al.18
demonstrated the benefits of data integration for pre-dicting drug therapeutic class; incorporating geneexpression, chemical structure, and target interactionprofiles into a single drug-similarity matrix that wasinput to a multiclass SVM classifier. The authorscompared ROC curves generated using the multi-source similarity matrix against curves generatedusing three different single-data source similaritymatrices, achieving higher accuracy with the integra-tive approach, as shown in Figure 9. Vilar et al.14
used principal component analysis to integrate fivedifferent types of features including chemical struc-ture and target interaction profiles to predict drug–drug interactions, and showed that the integratedfeatures were as good or better than any individualfeature, and the advantage, as measured by AUC,was magnified in an independent test dataset.Another example is the work of Zitnic et al.15 whoincorporated a variety of drug, gene and diseaseinformation sources using a simultaneous matrix fac-torization approach to build a data-driven diseaseclassification system that, impressively, found litera-ture support for all 14 predicted disease–disease asso-ciations not already present in the Disease Ontology.Furthermore, by systematically removing each datasource one at a time and measuring the change inrecall of disease–gene associations, the authorsdemonstrated that each individual data source con-tributed positively to model performance. All theseexamples demonstrate the power of combining multi-ple data dimensions in the chemical, biological, andphenotypic spaces to build predictive models relatedto drug and disease.
Comparison of Integrative MethodsHere, we highlight three algorithmic frameworks thatstand out among recent work in computational phar-macology as relatively well-suited for multiscale dataintegration, namely similarity-based methods, net-work modeling, and matrix factorization. Eachmakes certain modeling assumptions and has variouspractical benefits and drawbacks.
Similarity-Based MethodsSimilarity-based methods14,21,22,25–29 comprise awide variety of approaches applicable to all threeaims reviewed in this article. Similarity-based
approaches lend themselves naturally to data integra-tion in that a variety of information sources and met-adata can be used to define similarity betweencompounds, targets, side effects, and diseases. Fur-ther, multiple similarity measures for the same typeof entity can often be combined into a single similar-ity matrix, for example, combining multipledrug-similarity matrices into an SVM classifier.14,18
However, one should use caution when combiningsimilarity information, as different modalities can besomewhat orthogonal, as found in the work of Cam-pillos et al.22 where drugs were connected based onside effects but did not share targets or known indi-cations (as described earlier). In this case, averagingdifferent similarity measures might hide a signal thatcomes from only one dimension, and therefore, onemight consider alternative ways to combine similarityinformation, such as taking the maximum similarityamong all measures.
The premise that similar compounds have simi-lar properties, though not always true,139 is an intui-tive notion and has substantial empirical support,particularly in the case of structural similarity reveal-ing shared target interactions.22,85,86 Further, based
0
0
0.2
0.2
0.4
0.4
False positives rate
Kernels predictive power
Tru
e p
ositiv
es r
ate
0.6
0.6
0.8
GEXCHEMTARGEX + CHEM + TAR
0.8
1.0
1.0
FIGURE 9 | Improved performance of data integration.Napolitano et al.18 demonstrated the benefits of data integration forpredicting drug therapeutic class; incorporating gene expression (GEX),chemical structure (CHEM), and target interaction profiles (TAR) into asingle drug–similarity matrix that was input to a multiclass SVMclassifier. They compared the ROC curve generated using themultisource similarity matrix against curves generated using threedifferent single-data source similarity matrices, with the formerachieving higher accuracy, as shown. (Reprinted with permissionaccording to the Chemistry Central copyright and license agreement.)
Overview wires.wiley.com/sysbio
© 2016 Wiley Per iodicals , Inc.

on the premise that DTIs are the fundamental effec-tors of downstream biological and physiological per-turbations, it is reasonable to extend the similarityprinciple to such downstream effects, for example,side effects and disease indications.
One drawback of similarity-based approachesis the reliance on data existing ‘nearby’ in pharmaco-logical space, hence limiting applicability for discov-ery of truly novel classes of compounds, targets, etc.One potential way to address this limitation wouldbe to employ an active learning framework140, whichoptimally selects biochemical experiments to performin order to efficiently map out, and hence enable pre-dictions across, diverse regions of the space.
Network MethodsNetworks provide an intuitive framework to inte-grate a wide variety of information sources, captur-ing both quantitative and qualitative relationshipsbetween entities, such as gene expression correlation,or the presence or absence of an interaction.72 Net-work topology can be utilized in graph-based algo-rithms such as label propagation methods141 thatiteratively propagate information to neighboringnodes; NBI24 methods that make new connectionsbased only on local topology; and shortest-path algo-rithms to identify parsimonious explanations of net-work perturbations.142
Molecular networks such as gene regulatorynetworks and metabolic models have many applica-tions in computational pharmacology.143 Gene regu-latory networks constructed from genome-widetranscriptional profiles and intrinsic genomic varia-tion are able to estimate causal relationships betweenmolecules and identify key drivers of disease.144–146
This new field of network pharmacology is still in theearly days147 but is already illuminating fruitful drugtargets for treating diseased states100,148,149 and pro-ducing accurate estimates of off-target effects.107,109
Alternatively, metabolic models constructed from setsof metabolic reactions can be used to simulateenzyme kinetic activities and perform in silico geneknockouts, which can, for example, help to identifyand prioritize new drug targets.122,150
One practical drawback of some networkapproaches is a tendency to be somewhat ad hoc innature, having many tuning parameters,151 for exam-ple, thresholds to determine presence or absence ofedges, or how exactly to extract subnetworks, or towhat degree nodes should share information withtheir neighbors. Systematic exploration of the robust-ness of the analysis to various parameter settingsshould ideally be performed; however, this can betime-consuming and may lead to ambiguous
conclusions, and hence a researcher may simplyresort to using default parameters. However, in somecases, selection152 of parameters can be guided by(relatively crude) heuristics such as a constraint thatthe network structure satisfies the scale-freeproperty.153
Bayesian network modeling, for example, usedto model gene regulatory networks,154,155 presentssome specific practical challenges. Bayesian networkinference is computationally intensive and requires alarge number of samples (at least hundreds or thou-sands) in order to derive accurate results.156 In addi-tion, there are sometimes multiple Bayesian networkgraph structures that can equally represent the samedataset. To illustrate, the two graphs, X!Y andY X are semantically equivalent in the language ofBayesian networks, essentially representing the ideathat correlation does not imply causation. In suchcases, however, additional data can sometimes beused to resolve directional ambiguities, for example,using intrinsic genomic variation144 or time seriesdata.157
While it is natural to model biological systemsand, more abstractly, pharmacological space, as a setof entities with local interactions, an implicit model-ing assumption that is often made in network-basedapproaches is that information travels along pathsconsisting of local relationships,24,72,141 that is, long-range interactions and pathway cross-talks leading tononlinearities might be ignored. While these assump-tions simplify modeling and analysis considerablyand may provide reasonable results, this should beconsidered carefully before proceeding downthis path.
Despite these drawbacks, network modeling willlikely become more prevalent in the coming years aslarger and/or more precise (e.g. single-cell) datasetsare generated, and the scientific community continuesto embrace the systems biology perspective.
Matrix FactorizationRecent applications of matrix factorization-basedmethods15,28,158–160 demonstrate some importantadvantages of this type of approach, in particular,ease of multi-scale integration as well as data imputa-tion within a mathematically rigorous formulation.Matrix factorization approximates a (usually large)matrix as a product of lower-rank matrices. Thisapproximation can be interpreted as making themodeling assumption that there are a small numberof ‘factors’ (i.e., less than the number of data points)that are responsible for the main variations in thedata. Another interpretation is that the data can beprojected from a higher-dimensional space to a
WIREs System Biology and Medicine Computational approaches to drug repurposing and pharmacology
© 2016 Wiley Per iodica ls , Inc.

lower-dimensional linear space, by applying some lin-ear transformation. When the factorized matrixrepresents self-similarity (e.g., a drug–drug matrix)the lower-dimensional space corresponds to a moresuccinct, and hopefully more natural, feature repre-sentation of the data. Alternatively, if the factorizedmatrix represents relationships between two entities,for example, a drug–disease matrix, then this lower-dimensional space corresponds to one into whichboth drugs and diseases can be projected,28,158 andhence compared quantitatively.
The method developed by Zhang et al.28
(described earlier) presents a unified framework forincorporating multiple drug– and disease–similaritymeasures along with known drug–disease associa-tions in order to predict new therapeutic associations.All three relationships (drug–drug, disease–disease,and drug–disease) are represented by matrices, whichare factorized. The key idea here that makes this atruly integrative approach, is that a single, commonlow-dimensional drug projection is sought to be max-imally consistent with all of the drug-similarity matri-ces, and likewise, a common disease-projectionmatrix is sought to be consistent with all of thedisease–similarity matrices. Then, these two projec-tions are used in combination to factorize the drug–disease matrix. The entire process is optimized tomaximally recapitulate known drug–disease associa-tions. A similar approach was presented by Zitnicet al.15 (also described earlier) for disease classifica-tion, where, for example, five different gene–genesimilarity matrices were all factorized using a com-mon projection matrix. In addition to disease classifi-cation and drug repurposing, matrix factorizationhas also been used for DTI prediction159 and drug–ADR associations.160
Another advantage of matrix factorization is itsutility for data imputation via ‘matrix completion,’where missing entries in a matrix are filled in basedon the observed entries. Many techniques161–163 tosolve this problem were developed as a result of theNetflix competition,164 which posed movie recom-mendation as a matrix completion problem. As anexample of a biological application, Chi et al.165 usedmatrix completion to impute genotype information.
CONCLUSION
Computational pharmacology and drug repurposingare burgeoning areas of research that are enablingnew ways to systematically explore the drug space
and generate novel hypotheses surrounding drugaction and indications. These techniques are helpingto accelerate the drug discovery process and generatenovel hypotheses from diverse data, helping to aug-ment research beyond what might be possible basedsolely on human intuition or observation.
As new sources of drug-related informationbecome available and molecular measurements (e.g.,−omics) become more routine, we foresee severalnew and exciting directions that could be exploredwithin the space of computational pharmacology.First, under-utilized data sources such as quantitativebinding data40 and phenotypic screens,166 as well asnewer data sources such as EHR and internet searchengine queries102 will likely provide further avenuesof development in the near future. Second, we believethat matrix factorization is a very promisingapproach that should be explored in terms of its abil-ity to integrate across diverse data and impute miss-ing information. Tensor decomposition, the naturalextension of matrix factorization to data structuresthat extend across more than two dimensions (e.g.,gene expression across many drugs and cell types)might also be explored, for example, to analyzeLINCS L1000 gene expression data or to constructlow-dimensional representations of patient state fromEHR data.167 Third, recent big-data approaches aregenerating improved disease classifications15 andsubtype stratifications,168 and this will likely lead toan improved ability to identify therapies targeted tomore specific patient populations. Finally, some drugrepurposing methodologies translate naturally into apersonalized medicine setting; most notably, signa-ture matching techniques, where the disease signaturecould easily be replaced by an individual’s expressionsignature. Perhaps there are other techniques devel-oped for drug repurposing that could be easily trans-lated into this new setting. For example, it is likelythat more types of -omics data will soon be availableon a large scale, providing alternative, high-dimensional disease quantifications that could readilytranslate into personalized medicine applications inthe coming years.
NOTEa MedDRA®, the Medical Dictionary for Regulatory Activ-ities terminology, is the international medical terminologydeveloped under the auspices of the International Confer-ence on Harmonisation of Technical Requirements for Reg-istration of Pharmaceuticals for Human Use (ICH).
Overview wires.wiley.com/sysbio
© 2016 Wiley Per iodicals , Inc.
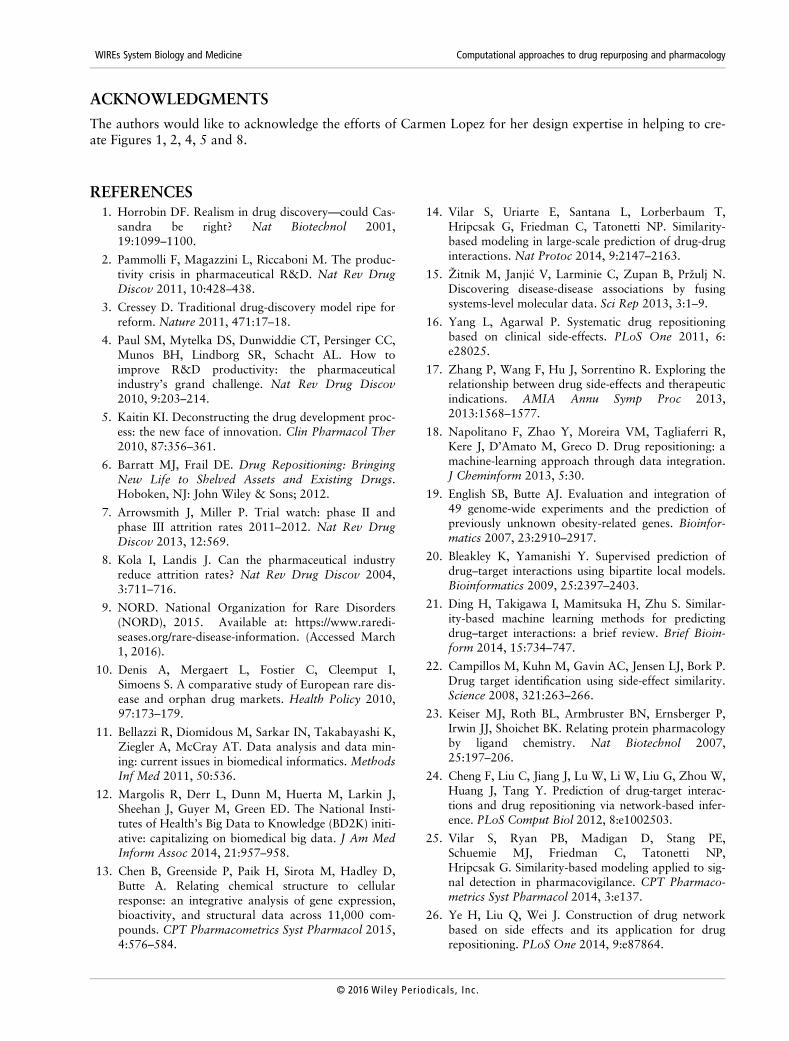
ACKNOWLEDGMENTS
The authors would like to acknowledge the efforts of Carmen Lopez for her design expertise in helping to cre-ate Figures 1, 2, 4, 5 and 8.
REFERENCES1. Horrobin DF. Realism in drug discovery—could Cas-
sandra be right? Nat Biotechnol 2001,19:1099–1100.
2. Pammolli F, Magazzini L, Riccaboni M. The produc-tivity crisis in pharmaceutical R&D. Nat Rev DrugDiscov 2011, 10:428–438.
3. Cressey D. Traditional drug-discovery model ripe forreform. Nature 2011, 471:17–18.
4. Paul SM, Mytelka DS, Dunwiddie CT, Persinger CC,Munos BH, Lindborg SR, Schacht AL. How toimprove R&D productivity: the pharmaceuticalindustry’s grand challenge. Nat Rev Drug Discov2010, 9:203–214.
5. Kaitin KI. Deconstructing the drug development proc-ess: the new face of innovation. Clin Pharmacol Ther2010, 87:356–361.
6. Barratt MJ, Frail DE. Drug Repositioning: BringingNew Life to Shelved Assets and Existing Drugs.Hoboken, NJ: John Wiley & Sons; 2012.
7. Arrowsmith J, Miller P. Trial watch: phase II andphase III attrition rates 2011–2012. Nat Rev DrugDiscov 2013, 12:569.
8. Kola I, Landis J. Can the pharmaceutical industryreduce attrition rates? Nat Rev Drug Discov 2004,3:711–716.
9. NORD. National Organization for Rare Disorders(NORD), 2015. Available at: https://www.raredi-seases.org/rare-disease-information. (Accessed March1, 2016).
10. Denis A, Mergaert L, Fostier C, Cleemput I,Simoens S. A comparative study of European rare dis-ease and orphan drug markets. Health Policy 2010,97:173–179.
11. Bellazzi R, Diomidous M, Sarkar IN, Takabayashi K,Ziegler A, McCray AT. Data analysis and data min-ing: current issues in biomedical informatics. MethodsInf Med 2011, 50:536.
12. Margolis R, Derr L, Dunn M, Huerta M, Larkin J,Sheehan J, Guyer M, Green ED. The National Insti-tutes of Health’s Big Data to Knowledge (BD2K) initi-ative: capitalizing on biomedical big data. J Am MedInform Assoc 2014, 21:957–958.
13. Chen B, Greenside P, Paik H, Sirota M, Hadley D,Butte A. Relating chemical structure to cellularresponse: an integrative analysis of gene expression,bioactivity, and structural data across 11,000 com-pounds. CPT Pharmacometrics Syst Pharmacol 2015,4:576–584.
14. Vilar S, Uriarte E, Santana L, Lorberbaum T,Hripcsak G, Friedman C, Tatonetti NP. Similarity-based modeling in large-scale prediction of drug-druginteractions. Nat Protoc 2014, 9:2147–2163.
15. Žitnik M, Janji�c V, Larminie C, Zupan B, Pržulj N.Discovering disease-disease associations by fusingsystems-level molecular data. Sci Rep 2013, 3:1–9.
16. Yang L, Agarwal P. Systematic drug repositioningbased on clinical side-effects. PLoS One 2011, 6:e28025.
17. Zhang P, Wang F, Hu J, Sorrentino R. Exploring therelationship between drug side-effects and therapeuticindications. AMIA Annu Symp Proc 2013,2013:1568–1577.
18. Napolitano F, Zhao Y, Moreira VM, Tagliaferri R,Kere J, D’Amato M, Greco D. Drug repositioning: amachine-learning approach through data integration.J Cheminform 2013, 5:30.
19. English SB, Butte AJ. Evaluation and integration of49 genome-wide experiments and the prediction ofpreviously unknown obesity-related genes. Bioinfor-matics 2007, 23:2910–2917.
20. Bleakley K, Yamanishi Y. Supervised prediction ofdrug–target interactions using bipartite local models.Bioinformatics 2009, 25:2397–2403.
21. Ding H, Takigawa I, Mamitsuka H, Zhu S. Similar-ity-based machine learning methods for predictingdrug–target interactions: a brief review. Brief Bioin-form 2014, 15:734–747.
22. Campillos M, Kuhn M, Gavin AC, Jensen LJ, Bork P.Drug target identification using side-effect similarity.Science 2008, 321:263–266.
23. Keiser MJ, Roth BL, Armbruster BN, Ernsberger P,Irwin JJ, Shoichet BK. Relating protein pharmacologyby ligand chemistry. Nat Biotechnol 2007,25:197–206.
24. Cheng F, Liu C, Jiang J, Lu W, Li W, Liu G, Zhou W,Huang J, Tang Y. Prediction of drug-target interac-tions and drug repositioning via network-based infer-ence. PLoS Comput Biol 2012, 8:e1002503.
25. Vilar S, Ryan PB, Madigan D, Stang PE,Schuemie MJ, Friedman C, Tatonetti NP,Hripcsak G. Similarity-based modeling applied to sig-nal detection in pharmacovigilance. CPT Pharmaco-metrics Syst Pharmacol 2014, 3:e137.
26. Ye H, Liu Q, Wei J. Construction of drug networkbased on side effects and its application for drugrepositioning. PLoS One 2014, 9:e87864.
WIREs System Biology and Medicine Computational approaches to drug repurposing and pharmacology
© 2016 Wiley Per iodica ls , Inc.

27. Chiang AP, Butte AJ. Systematic evaluation of drug-disease relationships to identify leads for novel druguses. Clin Pharmacol Ther 2009, 86:507–510.
28. Zhang P, Wang F, Hu J. Towards drug repositioning:a unified computational framework for integratingmultiple aspects of drug similarity and disease similar-ity. AMIA Annu Symp Proc 2014, 2014:1258–1267.
29. Gottlieb A, Stein GY, Ruppin E, Sharan R. PRE-DICT: a method for inferring novel drug indicationswith application to personalized medicine. Mol SystBiol 2011, 7:496.
30. Weininger D. SMILES, a chemical language andinformation system. 1. Introduction to methodologyand encoding rules. J Chem Inf Comput Sci 1988,28:31–36.
31. Gaiteri C, Ding Y, French B, Tseng GC, Sibille E.Beyond modules and hubs: the potential of gene coex-pression networks for investigating molecularmechanisms of complex brain disorders. Genes BrainBehav 2014, 13:13–24.
32. McNaught A. The iupac international chemical iden-tifier. Chem Int 2006, 28:12–14.
33. O’Boyle NM. Towards a Universal SMILESrepresentation-a standard method to generate canoni-cal SMILES based on the InChI. J Cheminform2012, 4:22.
34. Xue L, Godden JW, Stahura FL, Bajorath J. Designand evaluation of a molecular fingerprint involvingthe transformation of property descriptor values intoa binary classification scheme. J Chem Inf ComputSci 2003, 43:1151–1157.
35. Durant JL, Leland BA, Henry DR, Nourse JG. Reop-timization of MDL keys for use in drug discovery.J Chem Inf Comput Sci 2002, 42:1273–1280.
36. Bolton EE, Wang Y, Thiessen PA, Bryant SH. Pub-Chem: integrated platform of small molecules andbiological activities. Annu Rep Comput Chem 2008,4:217–241.
37. Bento AP, Gaulton A, Hersey A, Bellis LJ,Chambers J, Davies M, Krüger FA, Light Y, Mak L,McGlinchey S. The ChEMBL bioactivity database: anupdate. Nucleic Acids Res 2014, 42:D1083–D1090.
38. Yung-Chi C, Prusoff WH. Relationship between theinhibition constant (K i) and the concentration ofinhibitor which causes 50 per cent inhibition (I 50) ofan enzymatic reaction. Biochem Pharmacol 1973,22:3099–3108.
39. Wishart DS, Knox C, Guo AC, Shrivastava S,Hassanali M, Stothard P, Chang Z, Woolsey J. Drug-Bank: a comprehensive resource for in silico drug dis-covery and exploration. Nucleic Acids Res 2006, 34:D668–D672.
40. Liu T, Lin Y, Wen X, Jorissen RN, Gilson MK. Bin-dingDB: a web-accessible database of experimentally
determined protein–ligand binding affinities. NucleicAcids Res 2007, 35:D198–D201.
41. Ben-Dayan MM, MacCarthy T, Schlecht NF,Belbin TJ, Childs G, Smith RV, Prystowsky MB,Bergman A. Cancer as the disintegration of robust-ness: population-level variance in gene expressionidentifies key differences between tobacco-and HPV-associated oropharyngeal carcinogenesis. Arch PatholLab Med 2015, 139:1362–1372.
42. Hsu C-L, Juan H-F, Huang H-C. Functional analysisand characterization of differential coexpression net-works. Sci Rep 2015, 5:13295.
43. Lamb J, Crawford ED, Peck D, Modell JW, Blat IC,Wrobel MJ, Lerner J, Brunet JP, Subramanian A,Ross KN, et al. The connectivity map: using gene-expression signatures to connect small molecules,genes, and disease. Science 2006, 313:1929–1935.
44. Duan Q, Flynn C, Niepel M, Hafner M, Muhlich JL,Fernandez NF, Rouillard AD, Tan CM, Chen EY,Golub TR. LINCS Canvas Browser: interactive webapp to query, browse and interrogate LINCS L1000gene expression signatures. Nucleic Acids Res 2014,42:W449–W460.
45. Edgar R, Domrachev M, Lash AE. Gene expressionomnibus: NCBI gene expression and hybridizationarray data repository. Nucleic Acids Res 2002,30:207–210.
46. Lab Ma. BD2K-LINCS-DCIC crowdsourcing portal.Available at: http://www.maayanlab.net/crowdsour-cing. (Accessed November 25, 2015).
47. Cheng J, Xie Q, Kumar V, Hurle M,Freudenberg JM, Yang L, AGARWAL P. Evaluationof analytical methods for connectivity map data. PacSymp Biocomput 2013, 5–16.
48. Cheng J, Yang L, Kumar V, Agarwal P. Systematicevaluation of connectivity map for disease indica-tions. Genome Med 2014, 6:540.
49. Basu A, Bodycombe NE, Cheah JH, Price EV, Liu K,Schaefer GI, Ebright RY, Stewart ML, Ito D, Wang S.An interactive resource to identify cancer genetic andlineage dependencies targeted by small molecules. Cell2013, 154:1151–1161.
50. Shoemaker RH. The NCI60 human tumour cell lineanticancer drug screen. Nat Rev Cancer 2006,6:813–823.
51. Yang W, Soares J, Greninger P, Edelman EJ,Lightfoot H, Forbes S, Bindal N, Beare D, Smith JA,Thompson IR. Genomics of drug sensitivity in cancer(GDSC): a resource for therapeutic biomarker discov-ery in cancer cells. Nucleic Acids Res 2013, 41:D955–D961.
52. Rihel J, Prober DA, Arvanites A, Lam K,Zimmerman S, Jang S, Haggarty SJ, Kokel D,Rubin LL, Peterson RT. Zebrafish behavioral profil-ing links drugs to biological targets and rest/wakeregulation. Science 2010, 327:348–351.
Overview wires.wiley.com/sysbio
© 2016 Wiley Per iodicals , Inc.

53. Swinney D. Phenotypic vs. target-based drug discov-ery for first-in-class medicines. Clin Pharmacol Ther2013, 93:299–301.
54. Zheng W, Thorne N, McKew JC. Phenotypic screensas a renewed approach for drug discovery. Drug Dis-cov Today 2013, 18:1067–1073.
55. Wang Y, Xiao J, Suzek TO, Zhang J, Wang J,Zhou Z, Han L, Karapetyan K, Dracheva S,Shoemaker BA. PubChem’s BioAssay database.Nucleic Acids Res 2012, 40:D400–D412.
56. Wang Y, Bolton E, Dracheva S, Karapetyan K,Shoemaker BA, Suzek TO, Wang J, Xiao J, Zhang J,Bryant SH. An overview of the PubChem BioAssayresource. Nucleic Acids Res 2010, 38:D255–D266.
57. Lee JA, Shinn P, Jaken S, Oliver S, Willard FS,Heidler S, Peery RB, Oler J, Chu S, Southall N. Novelphenotypic outcomes identified for a public collectionof approved drugs from a publicly accessible panel ofassays. PLoS One 2015, 10:e0130796.
58. Huang R, Southall N, Wang Y, Yasgar A, Shinn P,Jadhav A, Nguyen D-T, Austin CP. The NCGC phar-maceutical collection: a comprehensive resource ofclinically approved drugs enabling repurposing andchemical genomics. Sci Transl Med 2011, 3:80ps16.
59. Barretina J, Caponigro G, Stransky N, Venkatesan K,Margolin AA, Kim S, Wilson CJ, Lehár J,Kryukov GV, Sonkin D. The cancer cell line encyclo-pedia enables predictive modelling of anticancer drugsensitivity. Nature 2012, 483:603–607.
60. Costello JC, Heiser LM, Georgii E, Gönen M,Menden MP, Wang NJ, Bansal M, Hintsanen P,Khan SA, Mpindi J-P. A community effort to assessand improve drug sensitivity prediction algorithms.Nat Biotechnol 2014, 32:1202–1212.
61. Organization WH. Guidelines for ATC Classificationand DDD Assignment. Geneva: World Health Organ-ization; 1996.
62. DrugBank. ATC classification browser. Available at:http://www.drugbank.ca/atc. (Accessed September28, 2015).
63. 2015AA UMLS National drug file—reference termi-nology source information. Available at: https://www.nlm.nih.gov/research/umls/sourcereleasedocs/current/NDFRT/index.html. (Accessed November 8, 2015).
64. Lipscomb CE. Medical subject headings (MeSH). BullMed Libr Assoc 2000, 88:265.
65. Liu S, Ma W, Moore R, Ganesan V, Nelson S.RxNorm: prescription for electronic drug informationexchange. IT Prof 2005, 7:17–23.
66. Degtyarenko K, de Matos P, Ennis M, Hastings J,Zbinden M, McNaught A, Alcántara R, Darsow M,Guedj M, Ashburner M. ChEBI: a database andontology for chemical entities of biological interest.Nucleic Acids Res 2008, 36:D344–D350.
67. Kanehisa M, Goto S, Hattori M, Aoki-Kinoshita KF,Itoh M, Kawashima S, Katayama T, Araki M,Hirakawa M. From genomics to chemical genomics:new developments in KEGG. Nucleic Acids Res2006, 34:D354–D357.
68. Pharos. Available at: https://pharos.nih.gov/idg/index.(Accessed September 28, 2015).
69. Whirl-Carrillo M, McDonagh EM, Hebert JM,Gong L, Sangkuhl K, Thorn CF, Altman RB, Klein TE.Pharmacogenomics knowledge for personalized medi-cine. Clin Pharmacol Ther 2012, 92:414–417.
70. Food U, Administration D. Orange book: ApprovedDrug Products with Therapeutic Equivalence Evalua-tions. US FDA: Silver Spring, MD; 2010.
71. Administration FaD. FDALabel: full-text searchof drug labeling. Available at: http://www.fda.gov/ScienceResearch/BioinformaticsTools/ucm289739.htm - Issues. (Accessed November 8, 2015).
72. Martínez V, Navarro C, Cano C, Fajardo W,Blanco A. DrugNet: network-based drug-disease pri-oritization by integrating heterogeneous data. ArtifIntell Med 2015, 63:41–49.
73. Health NIo. ClinicalTrials.gov. Available at: http://www.clinicalTrials.gov. (Accessed October 6, 2015).
74. Schriml LM, Arze C, Nadendla S, Chang Y-WW,Mazaitis M, Felix V, Feng G, Kibbe WA. DiseaseOntology: a backbone for disease semantic integra-tion. Nucleic Acids Res 2012, 40:D940–D946.
75. Bodenreider O. The unified medical language system(UMLS): integrating biomedical terminology. NucleicAcids Res 2004, 32:D267–D270.
76. Kuhn M, Campillos M, Letunic I, Jensen LJ, Bork P.A side effect resource to capture phenotypic effects ofdrugs. Mol Syst Biol 2010, 6:343.
77. Tatonetti NP, Patrick PY, Daneshjou R, Altman RB.Data-driven prediction of drug effects and interac-tions. Sci Transl Med 2012, 4:125ra131.
78. Zhou H, Gao M, Skolnick J. Comprehensive predic-tion of drug-protein interactions and side effects forthe human proteome. Sci Rep 2015, 5:11090.
79. Meng X-Y, Zhang H-X, Mezei M, Cui M. Moleculardocking: a powerful approach for structure-baseddrug discovery. Curr Comput Aided Drug Des2011, 7:146.
80. Cheng T, Li Q, Zhou Z, Wang Y, Bryant SH. Struc-ture-based virtual screening for drug discovery: aproblem-centric review. AAPS J 2012, 14:133–141.
81. Yang S-Y. Pharmacophore modeling and applicationsin drug discovery: challenges and recent advances.Drug Discov Today 2010, 15:444–450.
82. Krüger DM, Evers A. Comparison of structure-andligand-based virtual screening protocols consideringhit list complementarity and enrichment factors.ChemMedChem 2010, 5:148–158.
WIREs System Biology and Medicine Computational approaches to drug repurposing and pharmacology
© 2016 Wiley Per iodica ls , Inc.

83. Chen Z, H-l L, Q-j Z, Bao X-g, Yu K-q, Luo X-m,Zhu W-l, H-l J. Pharmacophore-based virtual screen-ing versus docking-based virtual screening: a bench-mark comparison against eight targets. ActaPharmacol Sin 2009, 30:1694–1708.
84. Alvarez J, Shoichet B. Virtual Screening in Drug Dis-covery. Boca Raton, FL: CRC press; 2005.
85. Gao M, Skolnick J. A comprehensive survey of small-molecule binding pockets in proteins. PLoS ComputBiol 2013, 9:e1003302.
86. Paolini GV, Shapland RH, van Hoorn WP,Mason JS, Hopkins AL. Global mapping of pharma-cological space. Nat Biotechnol 2006, 24:805–815.
87. Nidhi GM, Davies JW, Jenkins JL. Prediction of bio-logical targets for compounds using multiple-categoryBayesian models trained on chemogenomics data-bases. J Chem Inf Model 2006, 46:1124–1133.
88. Jacob L, Vert J-P. Protein-ligand interaction predic-tion: an improved chemogenomics approach. Bioin-formatics 2008, 24:2149–2156.
89. Bock JR, Gough DA. Virtual screen for ligands oforphan G protein-coupled receptors. J Chem InfModel 2005, 45:1402–1414.
90. Cao D-S, Liang Y-Z, Deng Z, Hu Q-N, He M, Xu Q-S, Zhou G-H, Zhang L-X, Deng Z, Liu S. Genome-scale screening of drug-target associations relevant toKi using a chemogenomics approach. PLoS One2013, 8:e57680.
91. Liu H, Sun J, Guan J, Zheng J, Zhou S. Improvingcompound–protein interaction prediction by buildingup highly credible negative samples. Bioinformatics2015, 31:i221–i229.
92. Ramsundar B, Kearnes S, Riley P, Webster D,Konerding D, Pande V. Massively multitasknetworks for drug discovery. arXiv preprintarXiv:1502.02072 2015.
93. Dahl GE, Jaitly N, Salakhutdinov R. Multi-task neu-ral networks for QSAR predictions. arXiv preprintarXiv:1406.1231 2014.
94. Keiser MJ, Setola V, Irwin JJ, Laggner C, Abbas AI,Hufeisen SJ, Jensen NH, Kuijer MB, Matos RC,Tran TB, et al. Predicting new molecular targets forknown drugs. Nature 2009, 462:175–181.
95. Bottini AA, Hartung T. Food for thought on the eco-nomics of animal testing. ALTEX 2009, 26:3–16.
96. Jucker M. The benefits and limitations of animalmodels for translational research in neurodegenera-tive diseases. Nat Med 2010, 16:1210–1214.
97. Mak IW, Evaniew N, Ghert M. Lost in translation:animal models and clinical trials in cancer treatment.Am J Transl Res 2014, 6:114.
98. Lounkine E, Keiser M, Whitebread S, Mikhailov D,Hamon J, Jenkins J, Lavan P, Weber E, Doak A,Côté S, et al. Large-scale prediction and testing of
drug activity on side-effect targets. Nature 2012,486:361–367.
99. Iorio F, Bosotti R, Scacheri E, Belcastro V,Mithbaokar P, Ferriero R, Murino L, Tagliaferri R,Brunetti-Pierri N, Isacchi A, et al. Discovery of drugmode of action and drug repositioning from tran-scriptional responses. Proc Natl Acad Sci 2010,107:14621–14626.
100. Lum PY, Derry JM, Schadt EE. Integrative genomicsand drug development. Pharmacogenomics 2009,10:203–12.
101. Yom-Tov E, Gabrilovich E. Postmarket drug surveil-lance without trial costs: discovery of adverse drugreactions through large-scale analysis of web searchqueries. J Med Internet Res 2013, 15:e124.
102. White RW, Tatonetti NP, Shah NH, Altman RB,Horvitz E. Web-scale pharmacovigilance: listening tosignals from the crowd. J Am Med Inform Assoc2013, 20:404–408.
103. Bender A, Scheiber J, Glick M, Davies JW,Azzaoui K, Hamon J, Urban L, Whitebread S,Jenkins JL. Analysis of pharmacology data and theprediction of adverse drug reactions and off-targeteffects from chemical structure. ChemMedChem2007, 2:861–873.
104. Azzaoui K, Hamon J, Faller B, Whitebread S,Jacoby E, Bender A, Jenkins JL, Urban L. Modelingpromiscuity based on in vitro safety pharmacologyprofiling data. ChemMedChem 2007, 2:874–880.
105. Zhou H, Skolnick J. FINDSITEcomb: a threading/structure-based, proteomic-scale virtual ligand screen-ing approach. J Chem Inf Model 2012, 53:230–240.
106. Barter PJ, Caulfield M, Eriksson M, Grundy SM,Kastelein JJ, Komajda M, Lopez-Sendon J, Mosca L,Tardif J-C, Waters DD. Effects of torcetrapib inpatients at high risk for coronary events. N Engl JMed 2007, 357:2109–2122.
107. Chang RL, Xie L, Xie L, Bourne PE, Palsson B�.Drug off-target effects predicted using structural anal-ysis in the context of a metabolic network model.PLoS Comput Biol. 2010, 6:e1000938.
108. Kim HU, Sohn SB, Lee SY. Metabolic network mod-eling and simulation for drug targeting and discovery.Biotechnol J 2012, 7:330–342.
109. Fan S, Geng Q, Pan Z, Li X, Tie L, Pan Y, Li X. Clar-ifying off-target effects for torcetrapib using networkpharmacology and reverse docking approach. BMCSyst Biol 2012, 6:152.
110. Scheiber J, Jenkins JL, Sukuru SCK, Bender A,Mikhailov D, Milik M, Azzaoui K, Whitebread S,Hamon J, Urban L. Mapping adverse drug reactionsin chemical space. J Med Chem 2009, 52:3103–3107.
111. Liu M, Cai R, Hu Y, Matheny ME, Sun J, Hu J,Xu H. Determining molecular predictors of adversedrug reactions with causality analysis based on
Overview wires.wiley.com/sysbio
© 2016 Wiley Per iodicals , Inc.

structure learning. J Am Med Inform Assoc 2014,21:245–251.
112. Koch U, Hamacher M, Nussbaumer P. Cheminfor-matics at the interface of medicinal chemistry andproteomics. Biochim Biophys Acta 2014,1844:156–161.
113. Glicksberg BS, Li L, Cheng WY, Shameer K,Hakenberg J, Castellanos R, Ma M, Shi L, Shah H,Dudley JT, et al. An integrative pipeline for multi-modal discovery of disease relationships. Pac SympBiocomput 2015, 20:407–418.
114. Piro RM. Network medicine: linking disorders. HumGenet 2012, 131:1811–1820.
115. Dudley JT, Deshpande T, Butte AJ. Exploiting drug–disease relationships for computational drug reposi-tioning. Brief Bioinform 2011, 12:303–311.
116. Ashburn TT, Thor KB. Drug repositioning: identify-ing and developing new uses for existing drugs. NatRev Drug Discov 2004, 3:673–683.
117. Elvidge S. Getting the drug repositioning genie out ofthe bottle. Life Sci Leader 2016, 14–18.
118. Ekins S, Williams AJ, Krasowski MD, Freundlich JS.In silico repositioning of approved drugs for rare andneglected diseases. Drug Discov Today 2011,16:298–310.
119. Muthyala R. Orphan/rare drug discovery through drugrepositioning. Drug Discov Today 2011, 8:71–76.
120. Sardana D, Zhu C, Zhang M, Gudivada RC, Yang L,Jegga AG. Drug repositioning for orphan diseases.Brief Bioinform 2011, 12:346–356.
121. Molineris I, Ala U, Provero P, Di Cunto F. Drugrepositioning for orphan genetic diseases throughconserved anticoexpressed gene clusters (CAGCs).BMC Bioinform 2013, 14:288.
122. Chavali AK, Blazier AS, Tlaxca JL, Jensen PA,Pearson RD, Papin JA. Metabolic network analysispredicts efficacy of FDA-approved drugs targeting thecausative agent of a neglected tropical disease. BMCSyst Biol 2012, 6:27.
123. Liu Z, Borlak J, Tong W. Deciphering miRNA tran-scription factor feed-forward loops to identify drugrepurposing candidates for cystic fibrosis. GenomeMed 2014, 6:94.
124. Andrews KT, Fisher G, Skinner-Adams TS. Drugrepurposing and human parasitic protozoan diseases.Int J Parasitol Drugs Drug Resist 2014, 4:95–111.
125. Martínez V, Cano C, Blanco A. ProphNet: a genericprioritization method through propagation of infor-mation. BMC Bioinform 2014, 15:S5.
126. Gormley GJ, Stoner E, Bruskewitz RC, Imperato-McGinley J, Walsh PC, McConnell JD, Andriole GL,Geller J, Bracken BR, Tenover JS, et al. The effect offinasteride in men with benign prostatic hyperplasia.The Finasteride Study Group. N Engl J Med 1992,327:1185–1191.
127. Ferry L, Johnston JA. Efficacy and safety of bupro-pion SR for smoking cessation: data from clinicaltrials and five years of postmarketing experience. IntJ Clin Pract 2003, 57:224–230.
128. Wu P, Wilson K, Dimoulas P, Mills EJ. Effectivenessof smoking cessation therapies: a systematic reviewand meta-analysis. BMC Public Health 2006, 6:300.
129. Sirota M, Dudley JT, Kim J, Chiang AP, Morgan AA,Sweet-Cordero A, Sage J, Butte AJ. Discovery andpreclinical validation of drug indications using com-pendia of public gene expression data. Sci TranslMed 2011, 3:96ra77.
130. McArt DG, Zhang S-D. Identification of candidatesmall-molecule therapeutics to cancer by gene-signature perturbation in connectivity mapping. PLoSOne 2011, 6:e16382.
131. Ramachandran S, Osterhaus SR, Karp PH,Welsh MJ, McCray PB Jr. A genomic signatureapproach to rescue ΔF508-cystic fibrosis transmem-brane conductance regulator biosynthesis and func-tion. Am J Respir Cell Mol Biol 2014, 51:354–362.
132. Hu G, Agarwal P. Human disease-drug networkbased on genomic expression profiles. PLoS One2009, 4:e6536.
133. Iorio F, Rittman T, Ge H, Menden M, Saez-Rodriguez J. Transcriptional data: a new gateway todrug repositioning? Drug Discov Today 2013,18:350–357.
134. Dudley JT, Sirota M, Shenoy M, Pai RK, Roedder S,Chiang AP, Morgan AA, Sarwal MM, Pasricha PJ,Butte AJ. Computational repositioning of the anticon-vulsant topiramate for inflammatory bowel disease.Sci Transl Med 2011, 3:96ra76.
135. Iskar M, Zeller G, Blattmann P, Campillos M,Kuhn M, Kaminska KH, Runz H, Gavin AC,Pepperkok R, van Noort V. Characterization of drug-induced transcriptional modules: towards drug repo-sitioning and functional understanding. Mol Syst Biol2013, 9:662.
136. Parkkinen JA, Kaski S. Probabilistic drug connectivitymapping. BMC Bioinform 2014, 15:113.
137. Yao L, Zhang Y, Li Y, Sanseau P, Agarwal P. Elec-tronic health records: Implications for drug discovery.Drug Discov Today 2011, 16:594–599.
138. Xu H, Aldrich MC, Chen Q, Liu H, Peterson NB,Dai Q, Levy M, Shah A, Han X, Ruan X. Validatingdrug repurposing signals using electronic healthrecords: a case study of metformin associated withreduced cancer mortality. J Am Med Inform Assoc2014, 22:179–191.
139. Maggiora GM. On outliers and activity cliffs whyQSAR often disappoints. J Chem Inf Model 2006,46:1535.
WIREs System Biology and Medicine Computational approaches to drug repurposing and pharmacology
© 2016 Wiley Per iodica ls , Inc.

140. Kangas JD, Naik AW, Murphy RF. Efficient discov-ery of responses of proteins to compounds usingactive learning. BMC bioinformatics 2014, 15:1.
141. Huang Y-F, Yeh H-Y, Soo V-W. Inferring drug-disease associations from integration of chemical,genomic and phenotype data using network propaga-tion. BMC Med Genomics 2013, 6:S4.
142. Chindelevitch L, Ziemek D, Enayetallah A,Randhawa R, Sidders B, Brockel C, Huang ES.Causal reasoning on biological networks: interpretingtranscriptional changes. Bioinformatics 2012,28:1114–1121.
143. Schmidt BJ, Papin JA, Musante CJ. Mechanistic sys-tems modeling to guide drug discovery and develop-ment. Drug Discov Today 2013, 18:116–127.
144. Schadt EE, Lamb J, Yang X, Zhu J, Edwards S,Guhathakurta D, Sieberts SK, Monks S, Reitman M,Zhang C, et al. An integrative genomics approach toinfer causal associations between gene expression anddisease. Nat Genet 2005, 37:710–717.
145. Emilsson V, Thorleifsson G, Zhang B,Leonardson AS, Zink F, Zhu J, Carlson S,Helgason A, Walters GB, Gunnarsdottir S,et al. Genetics of gene expression and its effect on dis-ease. Nature 2008, 452:423–428.
146. Argmann C, Dobrin R, Heikkinen S, Auburtin A,Pouilly L, Cock TA, Koutnikova H, Zhu J, Schadt EE,Auwerx J. Ppargamma2 is a key driver of longevity inthe mouse. PLoS Genet 2009, 5:e1000752.
147. Hopkins AL. Network pharmacology: the next para-digm in drug discovery. Nat Chem Biol 2008,4:682–690.
148. Schadt EE, Friend SH, Shaywitz DA. A network viewof disease and compound screening. Nat Rev DrugDiscov 2009, 8:286–295.
149. Pinto JP, Machado RS, Xavier JM, Futschik ME.Targeting molecular networks for drug research.Front Genet 2014, 5:160.
150. Li Z, Wang RS, Zhang XS. Two-stage flux balanceanalysis of metabolic networks for drug target identi-fication. BMC Syst Biol 2011, 5(Suppl 1):S11.
151. Langfelder P, Horvath S. WGCNA: an R package forweighted correlation network analysis. BMC Bioin-form 2008, 9:559.
152. Zhang B, Horvath S. A general framework forweighted gene co-expression network analysis. StatAppl Genet Mol Biol 2005, 4:17.
153. Barabási A-L. Scale-free networks: a decade andbeyond. Science 2009, 325:412.
154. Zhang B, Gaiteri C, Bodea L-G, Wang Z, McElwee J,Podtelezhnikov AA, Zhang C, Xie T, Tran L,Dobrin R. Integrated systems approach identifiesgenetic nodes and networks in late-onset Alzheimer’sdisease. Cell 2013, 153:707–720.
155. Jostins L, Ripke S, Weersma RK, Duerr RH,McGovern DP, Hui KY, Lee JC, Schumm LP,Sharma Y, Anderson CA, et al. Host-microbe interac-tions have shaped the genetic architecture of inflam-matory bowel disease. Nature 2012, 491:119–124.
156. Daly R, Shen Q, Aitken S. Learning Bayesian net-works: approaches and issues. Knowl Eng Rev 2011,26:99–157.
157. Sima C, Hua J, Jung S. Inference of gene regulatorynetworks using time-series data: a survey. Curr Geno-mics 2009, 10:416–429.
158. Dai W, Liu X, Gao Y, Chen L, Song J, Chen D,Gao K, Jiang Y, Yang Y, Chen J. Matrixfactorization-based prediction of novel drug indica-tions by integrating genomic space. Comput MathMethods Med 2015, 2015:275045.
159. Cobanoglu MC, Liu C, Hu F, Oltvai ZN, Bahar I.Predicting drug–target interactions using probabilisticmatrix factorization. J Chem Inf Model 2013,53:3399–3409.
160. Li R, Dong Y, Kuang Q, Wu Y, Li Y, Zhu M, Li M.Inductive matrix completion for predicting adversedrug reactions (ADRs) integrating drug–target interac-tions. Chemometr Intell Lab Syst 2015, 144:71–79.
161. Bell RM, Koren Y, Volinsky C. The BellKor solutionto the Netflix prize. Technical Report, AT&T LabsResearch, 2007.
162. Töscher A, Jahrer M. The bigchaos solution to thenetflix prize 2008. Netflix Prize Report, 2008.
163. Piotte M, Chabbert M. The pragmatic theory solu-tion to the netflix grand prize. Netflix Prize Docu-mentation, 2009.
164. Bennett J, Lanning S. The netflix prize. Proceedingsof KDD cup and workshop: In; 2007.
165. Chi EC, Zhou H, Chen GK, Del Vecchyo DO,Lange K. Genotype imputation via matrix comple-tion. Genome Res 2013, 23:509–518.
166. Saporito MS, Lipinski CA, Reaume AG. Phenotypicin vivo screening to identify new, unpredicted indica-tions for existing drugs and drug candidates. In:Barratt MJ, Frail DE, eds. Drug Repositioning: Bring-ing New Life to Shelved Assets and Existing Drugs.Hoboken, NJ: John Wiley & Sons, Inc; 2012,253–290.
167. Ho JC, Ghosh J, Steinhubl SR, Stewart WF,Denny JC, Malin BA, Sun J. Limestone: high-throughput candidate phenotype generation via tensorfactorization. J Biomed Inform 2014, 52:199–211.
168. Li L, Cheng W-Y, Glicksberg BS, Gottesman O,Tamler R, Chen R, Bottinger EP, Dudley JT. Identifi-cation of type 2 diabetes subgroups through topologi-cal analysis of patient similarity. Sci Transl Med2015, 7:311ra174.
Overview wires.wiley.com/sysbio
© 2016 Wiley Per iodicals , Inc.