in higher education - sightlines state of sustainability in higher education 2015: ... other factors...
TRANSCRIPT
THE STATE OF SUSTAINABILITY IN HIGHER EDUCATIONEmissions Metrics, Consumption Trends & Strategies for Success
2015
TM
TABLE OF CONTENTS
The State of Sustainability in Higher Education 2015: Emissions Metrics, Consumption Trends & Strategies for Success
Introduction ......................................................................................................................... 3-5
Campus Carbon Footprints in Context: How We Got Here ......................... 3
Campus Carbon Reporting Frameworks: A Primer ........................................ 4
The Power of Aggregated, Standardized Data ................................................ 5
Study Methodology ........................................................................................................... 6-7
Summary of Findings ........................................................................................................ 8-10
Factors Affecting Energy Consumption ....................................................................... 11-12
Size Matters ............................................................................................................ 11
Growth in Campus Space ................................................................................... 11
Capital Investment Shifts ..................................................................................... 12
Which campuses are Making Progress and Why ....................................................... 13-16
Case Study .............................................................................................................. 14
The Importance of Institutional Commitment .............................................. 15
Case Study .............................................................................................................. 16
Other Factors Affecting Emissions and Energy Consumption ................................ 17-19
Energy Cost ............................................................................................................ 17
Energy Policy ......................................................................................................... 18
Case Study .............................................................................................................. 19
Conclusions and Recommendations ........................................................................... 20-26
Summary of Findings ........................................................................................... 20
Institutional Commitment and Leadership Matters ..................................... 20
Turning Facilities Challenges Into Sustainability Opportunities .................. 22
Implementing Renewable Energy Strategies .................................................. 23
Case Study .............................................................................................................. 24
Public Sector-Based Incentives and Regulation Matter ................................ 25
Metrics Matter ........................................................................................................ 26
Conclusion .......................................................................................................................... 27
Acknowledgements .......................................................................................................... 28
3
The State of Sustainability in Higher Education 2015: Emissions Metrics, Consumption Trends & Strategies for Success
INTRODUCTION
In 2008, as a significant number of campuses across
the country mobilized to offer leadership around climate
change solutions, Second Nature published a guidance
document for signatories to the American College
& University Presidents’ Climate Commitment, now called
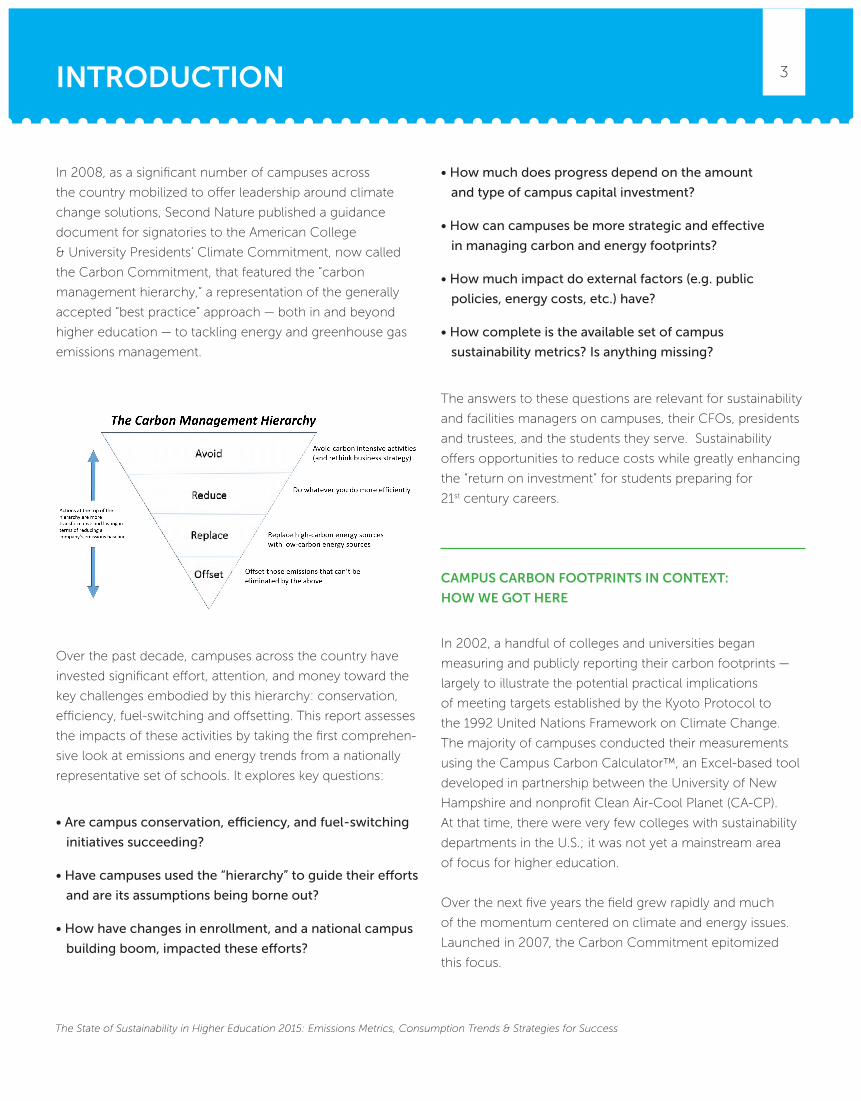
the Carbon Commitment, that featured the “carbon
management hierarchy,” a representation of the generally
accepted “best practice” approach — both in and beyond
higher education — to tackling energy and greenhouse gas
emissions management.
Over the past decade, campuses across the country have
invested significant effort, attention, and money toward the
key challenges embodied by this hierarchy: conservation,
efficiency, fuel-switching and offsetting. This report assesses
the impacts of these activities by taking the first comprehen-
sive look at emissions and energy trends from a nationally
representative set of schools. It explores key questions:
• Are campus conservation, efficiency, and fuel-switching
initiatives succeeding?
• Have campuses used the “hierarchy” to guide their efforts
and are its assumptions being borne out?
• How have changes in enrollment, and a national campus
building boom, impacted these efforts?
• How much does progress depend on the amount
and type of campus capital investment?
• How can campuses be more strategic and effective
in managing carbon and energy footprints?
• How much impact do external factors (e.g. public
policies, energy costs, etc.) have?
• How complete is the available set of campus
sustainability metrics? Is anything missing?
The answers to these questions are relevant for sustainability
and facilities managers on campuses, their CFOs, presidents
and trustees, and the students they serve. Sustainability
offers opportunities to reduce costs while greatly enhancing
the “return on investment” for students preparing for
21st century careers.
CAMPUS CARBON FOOTPRINTS IN CONTEXT:
HOW WE GOT HERE
In 2002, a handful of colleges and universities began
measuring and publicly reporting their carbon footprints —
largely to illustrate the potential practical implications
of meeting targets established by the Kyoto Protocol to
the 1992 United Nations Framework on Climate Change.
The majority of campuses conducted their measurements
using the Campus Carbon Calculator™, an Excel-based tool
developed in partnership between the University of New
Hampshire and nonprofit Clean Air-Cool Planet (CA-CP).
At that time, there were very few colleges with sustainability
departments in the U.S.; it was not yet a mainstream area
of focus for higher education.
Over the next five years the field grew rapidly and much
of the momentum centered on climate and energy issues.
Launched in 2007, the Carbon Commitment epitomized
this focus.
4
The State of Sustainability in Higher Education 2015: Emissions Metrics, Consumption Trends & Strategies for Success
INTRODUCTION
The Carbon Commitment was significant in several ways:
1. It made public reporting mandatory for its signatories,
and provided a new, central repository for this
reported data.
2. It asked schools to establish reduction baselines and
climate action plans.
3. It spurred greater codification of campus reporting
and target-setting frameworks.
CAMPUS CARBON REPORTING FRAMEWORKS: A PRIMER
By the launch of the Carbon Commitment, there were
already hundreds of schools voluntarily measuring and
publicly reporting their carbon footprints, but schools
were sharing data sporadically through hundreds of diverse
campus publications and websites. The majority of these
institutions continued using the Campus Carbon
Calculator™ (CCC) which had been continually developed
in alignment with global carbon accounting standards called
the Greenhouse Gas (GHG) Protocol.
KEY SUSTAINABILITY ACHIEVEMENTS IN HIGHER EDUCATION
1990 Talloires Declaration
1997 Kyoto Protocol adopted
2000 LEED standards launched by USGBC
2001 GHG Protocol-First "corporate standard" for carbon accounting published by GHG Protocol
2004 CCC v4.0 made widely available on CA-CP website
2006 California Global Warming Solutions Act mandates statewide reporting and reduction targets
2006 AASHE launches
2007 Energy Action Coalition organizes first Powershift conference in D.C.
2007 College of the Atlantic becomes first institution of higher education to meet carbon neutrality target
2007 Massachusetts Executive Order 484 requires state campuses and agencies to reduce emissions and energy use
2007 American College & University Presidents’ Climate Commitment, now known as the Carbon Commitment, was launched
2010 First annual Princeton Review Guide to Green Colleges published
2010 AASHE STARS 1.0 launched
2011 Carbon Management and Analysis Platform (CMAP) pilot launched
2014 Capital Partners Solar Project announced
2014 University of California announces largest campus solar purchases in U.S. to date
2015 Green Gigawatt Partnership launched
INTRODUCTION
5
The State of Sustainability in Higher Education 2015: Emissions Metrics, Consumption Trends & Strategies for Success
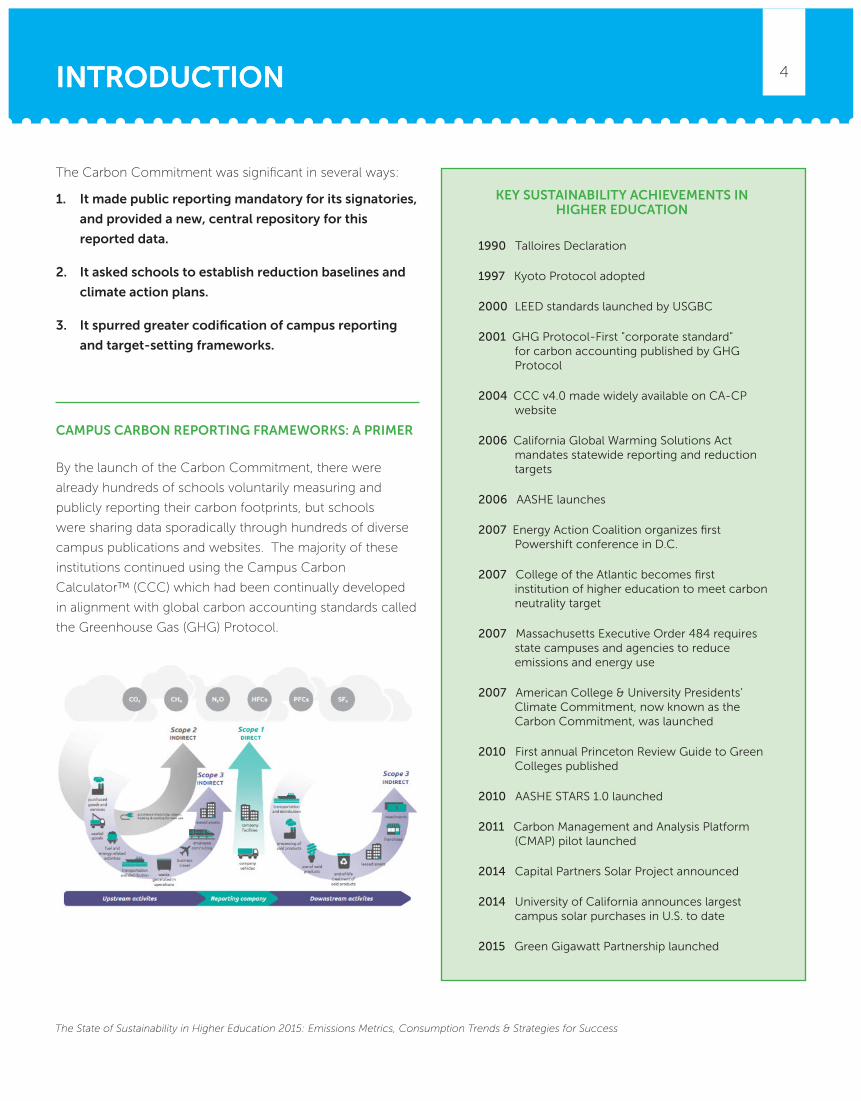
One of the most important functions of the GHG Protocol
was to create a framework for setting boundaries:
Temporal: Established a baseline year against which
to measure progress;
Organizational: Defined what organizational units
would be included whether based on ownership,
or control. In practical terms, this allowed institutions
to be strategic, while also remaining clear and
transparent, about what locations or facilities they
include in their reports (and thus in their goals) —
for example, by deciding to include or not to include
emissions from satellite campuses, research hospitals.
Operational: Defined what sources of emissions-
production would be included. The concept of “scopes”
helped users distinguish between different kinds of
emissions sources both in their measurement and
reporting. This 3-Scope framework has facilitated
useful clarity in GHG tracking.
The GHG Protocol included guidance about what
constituted a “complete” GHG inventory: Scope 1 and 2
sources being mandatory, and Scope 3 being optional.
The Carbon Commitment likewise required reporting
of Scope 1 and Scope 2, as well as a subset of Scope 3
(commuting, study abroad, and business travel).
THE POWER OF AGGREGATED, STANDARDIZED DATA
Since 2007, over 600 campuses that signed the Carbon
Commitment have been reporting their Scope 1, 2, and
selected Scope 3 sources every other year. In addition,
other campuses have opted to set their own emissions
reduction goals and to hold themselves publically
accountable through regular reports. More than 90% of
these campuses have done so via the Campus Carbon
Calculator.™
Based on this demand, Sightlines and CA-CP
collaborated to create a user-friendly, web-based version
of the Calculator, called the Carbon Management and
Analysis Platform (CMAP), which would aggregate the
campus input as well as emissions output data into one
central database to be used for research purposes by
sustainability professionals, faculty, or students. In 2014,
CA-CP transferred the CCC, CMAP, and all related
intellectual property to the University of New Hampshire,
which continues to support the CCC and CMAP. Now,
UNH and Sightlines are taking the first comprehensive look
at energy and emissions trends from a diverse national set
of schools, based on the following data sources:
• Sightlines Return on Physical Assets (ROPA) database,
with the CCC calculation methodology overlaid. This
database has only a subset of the inputs that go into
a full campus GHG inventory, but those inputs are
generally the primary Scope 1 and 2 emissions sources.
This database has extensive Quality Assurance/Quality
Control (QA/QC) for its inputs.
• CMAP database, with data from both inputs and
outputs of campus GHG inventories. Currently, this
data is self-reported and has no significant quality
assurance mechanisms; also, the number of schools
using CMAP is small compared to the number of
schools using the Excel version of the tool. For those
reasons, the ROPA data set was used to perform the
primary analyses, and the CMAP database was used
mainly for comparison and “reality-checking”
the results.
Ultimately, the goal is to shift all users of the Excel-based
version of the Campus Carbon Calculator to CMAP, while
we build in more quality control mechanisms. In so doing,
we can provide data with which to do a much more
granular analysis.
In the meantime, however, this report represents an
important first step towards what we hope will be annual
updating of a long-term and comprehensive analyses, from
which the entire higher education sector can learn, plan
and benefit.
INTRODUCTION
6
The State of Sustainability in Higher Education 2015: Emissions Metrics, Consumption Trends & Strategies for Success
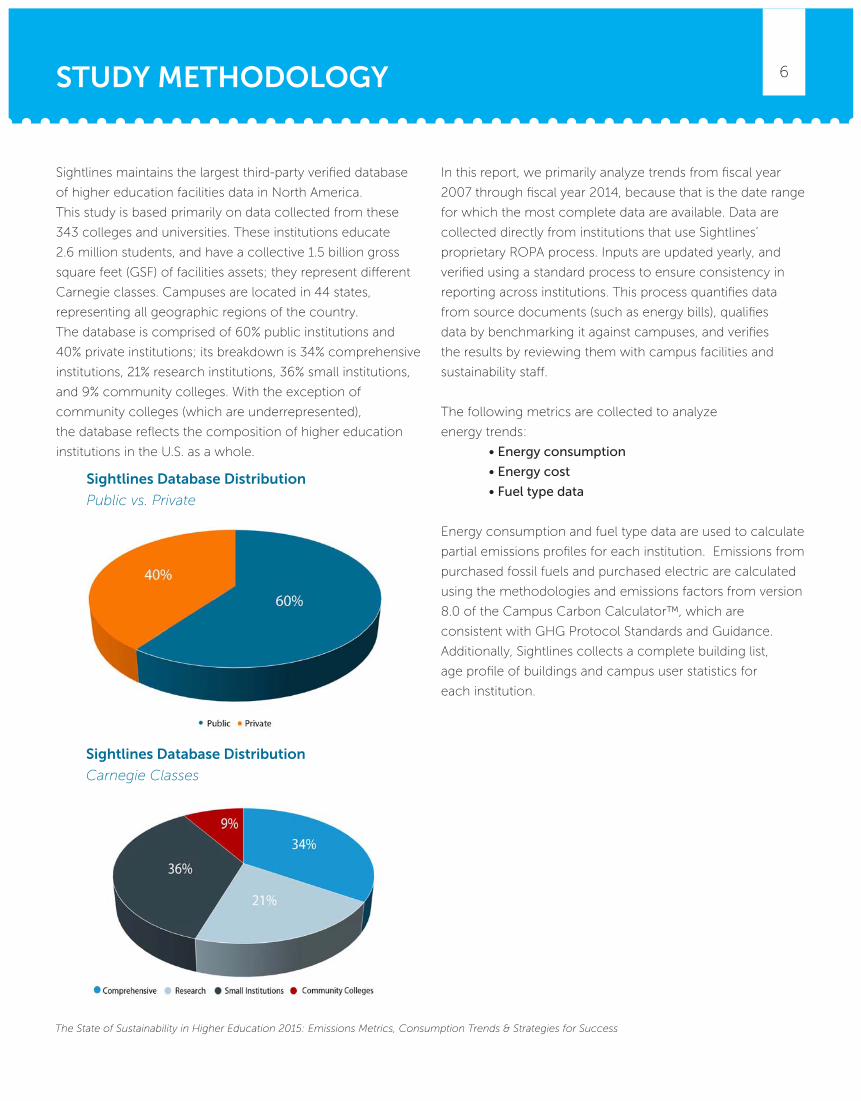
Sightlines maintains the largest third-party verified database
of higher education facilities data in North America.
This study is based primarily on data collected from these
343 colleges and universities. These institutions educate
2.6 million students, and have a collective 1.5 billion gross
square feet (GSF) of facilities assets; they represent different
Carnegie classes. Campuses are located in 44 states,
representing all geographic regions of the country.
The database is comprised of 60% public institutions and
40% private institutions; its breakdown is 34% comprehensive
institutions, 21% research institutions, 36% small institutions,
and 9% community colleges. With the exception of
community colleges (which are underrepresented),
the database reflects the composition of higher education
institutions in the U.S. as a whole.
In this report, we primarily analyze trends from fiscal year
2007 through fiscal year 2014, because that is the date range
for which the most complete data are available. Data are
collected directly from institutions that use Sightlines’
proprietary ROPA process. Inputs are updated yearly, and
verified using a standard process to ensure consistency in
reporting across institutions. This process quantifies data
from source documents (such as energy bills), qualifies
data by benchmarking it against campuses, and verifies
the results by reviewing them with campus facilities and
sustainability staff.
The following metrics are collected to analyze
energy trends:
• Energy consumption
• Energy cost
• Fuel type data
Energy consumption and fuel type data are used to calculate
partial emissions profiles for each institution. Emissions from
purchased fossil fuels and purchased electric are calculated
using the methodologies and emissions factors from version
8.0 of the Campus Carbon Calculator™, which are
consistent with GHG Protocol Standards and Guidance.
Additionally, Sightlines collects a complete building list,
age profile of buildings and campus user statistics for
each institution.
STUDY METHODOLOGY
Sightlines Database Distribution
Public vs. Private
Sightlines Database Distribution
Carnegie Classes
7
The State of Sustainability in Higher Education 2015: Emissions Metrics, Consumption Trends & Strategies for Success
This data is used to normalize energy and campus age
metrics. Finally, capital expenditure data is collected and
categorized according to type of work completed.
Sightlines uses five packages to classify dollars spent:
• Space renewal: renovation and replacement of
internal building space, such as classrooms
• Building systems: renewal of HVAC, electrical,
plumbing, and mechanical systems
• Envelope: replacement of roof, windows, doors,
foundations and exteriors
• Infrastructure: heating/cooling and electrical
distribution systems
• Safety/code: fire protection, ADA compliance,
security systems
Collecting information on these packages enables us
to better understand capital investment into energy
efficiency projects.
STUDY METHODOLOGY
8
The State of Sustainability in Higher Education 2015: Emissions Metrics, Consumption Trends & Strategies for Success
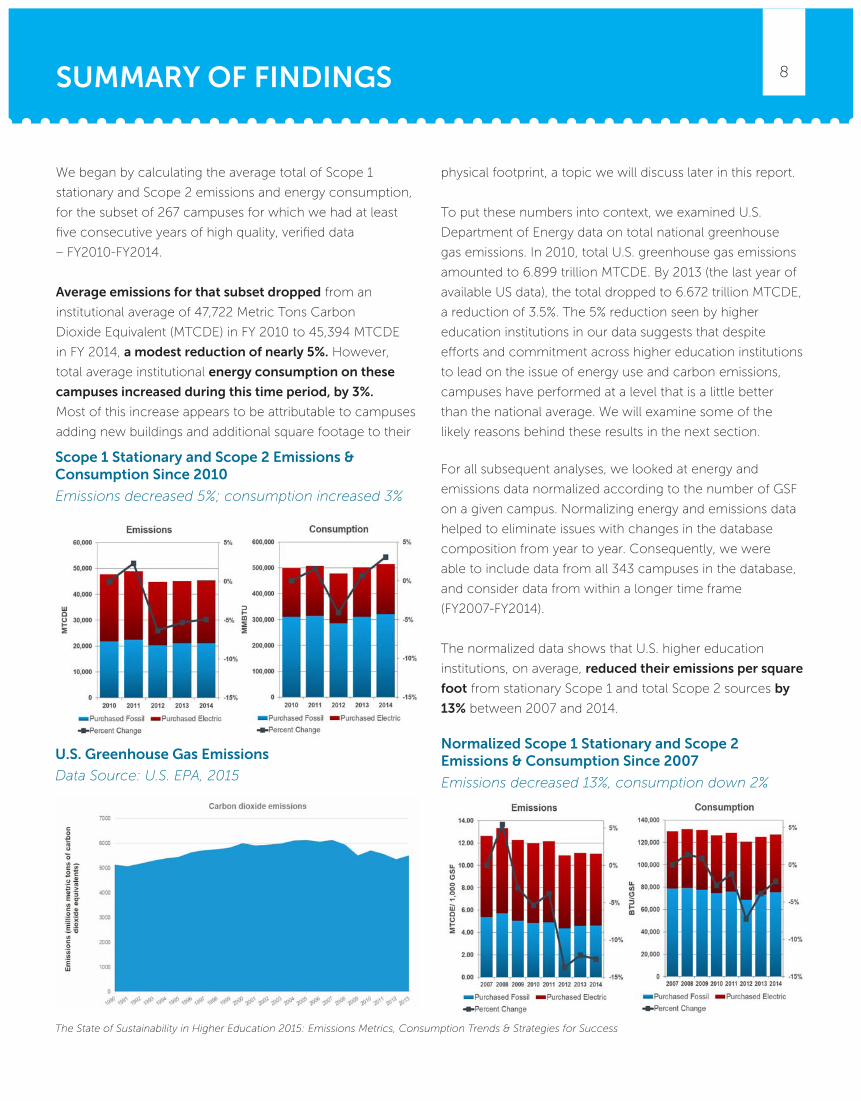
We began by calculating the average total of Scope 1
stationary and Scope 2 emissions and energy consumption,
for the subset of 267 campuses for which we had at least
five consecutive years of high quality, verified data
– FY2010-FY2014.
Average emissions for that subset dropped from an
institutional average of 47,722 Metric Tons Carbon
Dioxide Equivalent (MTCDE) in FY 2010 to 45,394 MTCDE
in FY 2014, a modest reduction of nearly 5%. However,
total average institutional energy consumption on these
campuses increased during this time period, by 3%.
Most of this increase appears to be attributable to campuses
adding new buildings and additional square footage to their
physical footprint, a topic we will discuss later in this report.
To put these numbers into context, we examined U.S.
Department of Energy data on total national greenhouse
gas emissions. In 2010, total U.S. greenhouse gas emissions
amounted to 6.899 trillion MTCDE. By 2013 (the last year of
available US data), the total dropped to 6.672 trillion MTCDE,
a reduction of 3.5%. The 5% reduction seen by higher
education institutions in our data suggests that despite
efforts and commitment across higher education institutions
to lead on the issue of energy use and carbon emissions,
campuses have performed at a level that is a little better
than the national average. We will examine some of the
likely reasons behind these results in the next section.
For all subsequent analyses, we looked at energy and
emissions data normalized according to the number of GSF
on a given campus. Normalizing energy and emissions data
helped to eliminate issues with changes in the database
composition from year to year. Consequently, we were
able to include data from all 343 campuses in the database,
and consider data from within a longer time frame
(FY2007-FY2014).
The normalized data shows that U.S. higher education
institutions, on average, reduced their emissions per square
foot from stationary Scope 1 and total Scope 2 sources by
13% between 2007 and 2014.
SUMMARY OF FINDINGS
U.S. Greenhouse Gas Emissions
Data Source: U.S. EPA, 2015
Scope 1 Stationary and Scope 2 Emissions & Consumption Since 2010
Emissions decreased 5%; consumption increased 3%
Normalized Scope 1 Stationary and Scope 2 Emissions & Consumption Since 2007
Emissions decreased 13%, consumption down 2%
9
The State of Sustainability in Higher Education 2015: Emissions Metrics, Consumption Trends & Strategies for Success
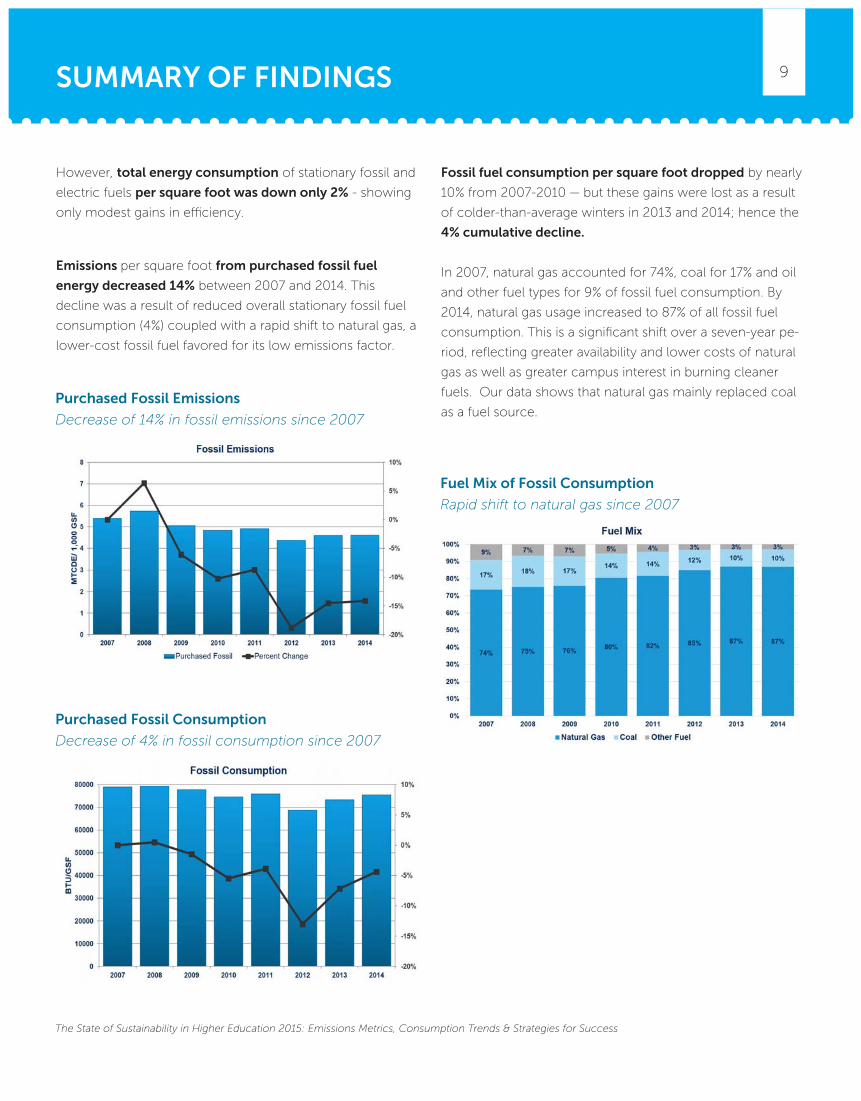
However, total energy consumption of stationary fossil and
electric fuels per square foot was down only 2% - showing
only modest gains in efficiency.
Emissions per square foot from purchased fossil fuel
energy decreased 14% between 2007 and 2014. This
decline was a result of reduced overall stationary fossil fuel
consumption (4%) coupled with a rapid shift to natural gas, a
lower-cost fossil fuel favored for its low emissions factor.
Fossil fuel consumption per square foot dropped by nearly
10% from 2007-2010 — but these gains were lost as a result
of colder-than-average winters in 2013 and 2014; hence the
4% cumulative decline.
In 2007, natural gas accounted for 74%, coal for 17% and oil
and other fuel types for 9% of fossil fuel consumption. By
2014, natural gas usage increased to 87% of all fossil fuel
consumption. This is a significant shift over a seven-year pe-
riod, reflecting greater availability and lower costs of natural
gas as well as greater campus interest in burning cleaner
fuels. Our data shows that natural gas mainly replaced coal
as a fuel source.
SUMMARY OF FINDINGS
Purchased Fossil Emissions
Decrease of 14% in fossil emissions since 2007
Purchased Fossil Consumption
Decrease of 4% in fossil consumption since 2007
Fuel Mix of Fossil Consumption
Rapid shift to natural gas since 2007
10
The State of Sustainability in Higher Education 2015: Emissions Metrics, Consumption Trends & Strategies for Success
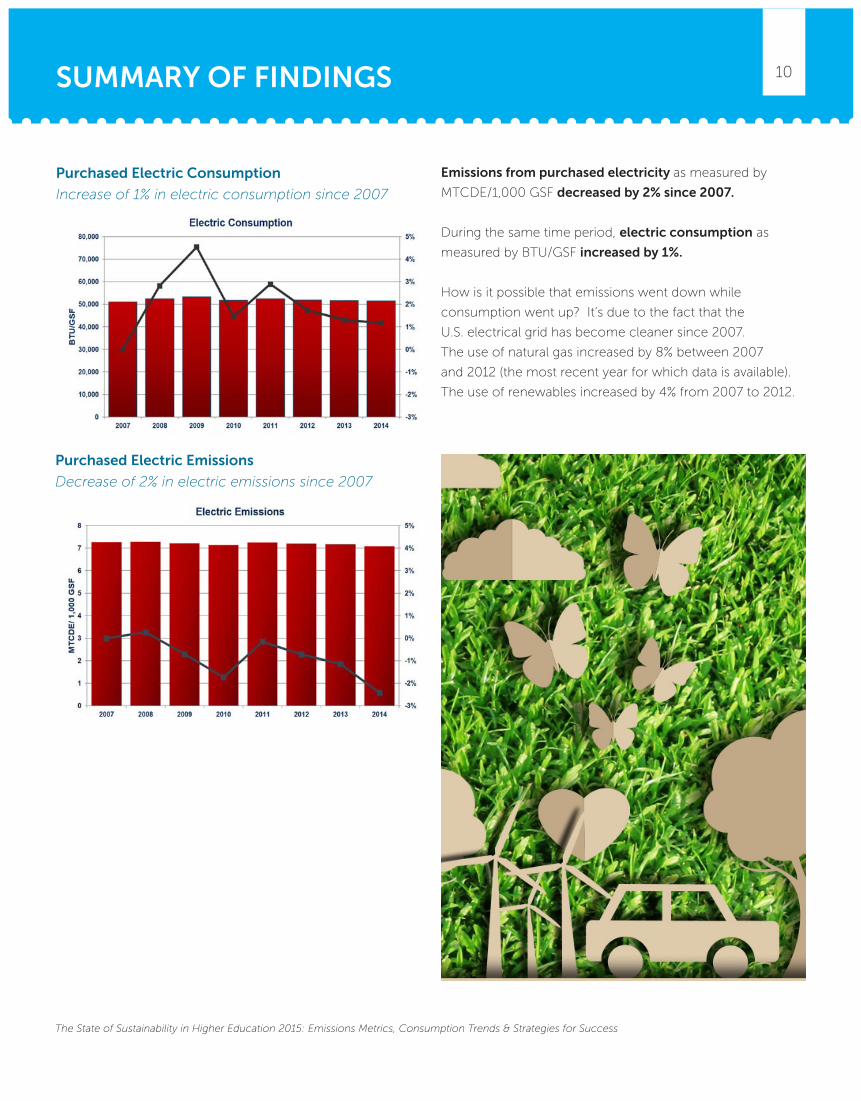
Emissions from purchased electricity as measured by
MTCDE/1,000 GSF decreased by 2% since 2007.
During the same time period, electric consumption as
measured by BTU/GSF increased by 1%.
How is it possible that emissions went down while
consumption went up? It’s due to the fact that the
U.S. electrical grid has become cleaner since 2007.
The use of natural gas increased by 8% between 2007
and 2012 (the most recent year for which data is available).
The use of renewables increased by 4% from 2007 to 2012.
SUMMARY OF FINDINGS
Purchased Electric Emissions
Decrease of 2% in electric emissions since 2007
Purchased Electric Consumption
Increase of 1% in electric consumption since 2007
11
The State of Sustainability in Higher Education 2015: Emissions Metrics, Consumption Trends & Strategies for Success
In order to understand the relatively small amount of
progress made in reducing carbon emissions at higher
education institutions over the past eight years, we drilled
down into the main source of emissions: energy consump-
tion. This section of the report looks at how factors such
as campus size, growth in space and capital investment
influence energy consumption and ultimately
carbon emissions.
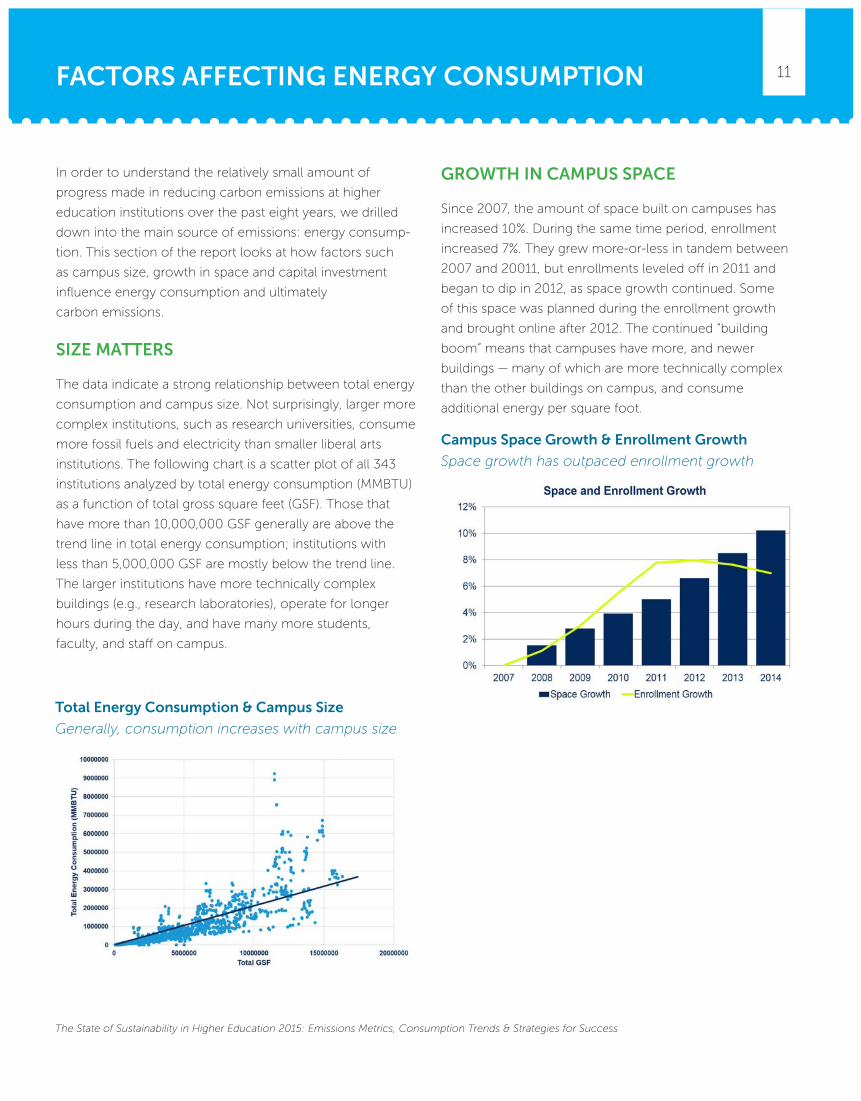
SIZE MATTERS
The data indicate a strong relationship between total energy
consumption and campus size. Not surprisingly, larger more
complex institutions, such as research universities, consume
more fossil fuels and electricity than smaller liberal arts
institutions. The following chart is a scatter plot of all 343
institutions analyzed by total energy consumption (MMBTU)
as a function of total gross square feet (GSF). Those that
have more than 10,000,000 GSF generally are above the
trend line in total energy consumption; institutions with
less than 5,000,000 GSF are mostly below the trend line.
The larger institutions have more technically complex
buildings (e.g., research laboratories), operate for longer
hours during the day, and have many more students,
faculty, and staff on campus.
GROWTH IN CAMPUS SPACE
Since 2007, the amount of space built on campuses has
increased 10%. During the same time period, enrollment
increased 7%. They grew more-or-less in tandem between
2007 and 20011, but enrollments leveled off in 2011 and
began to dip in 2012, as space growth continued. Some
of this space was planned during the enrollment growth
and brought online after 2012. The continued “building
boom” means that campuses have more, and newer
buildings — many of which are more technically complex
than the other buildings on campus, and consume
additional energy per square foot.
FACTORS AFFECTING ENERGY CONSUMPTION
Total Energy Consumption & Campus Size
Generally, consumption increases with campus size
Campus Space Growth & Enrollment Growth
Space growth has outpaced enrollment growth
12
The State of Sustainability in Higher Education 2015: Emissions Metrics, Consumption Trends & Strategies for Success
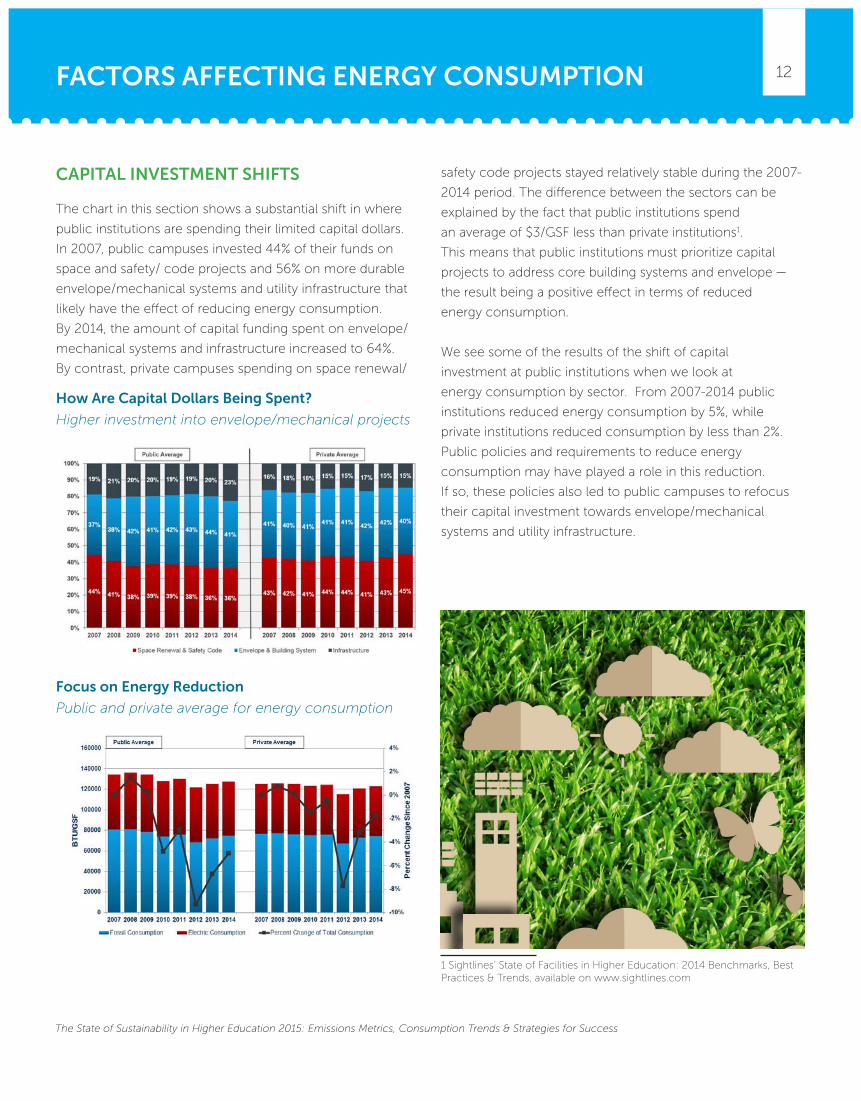
CAPITAL INVESTMENT SHIFTS
The chart in this section shows a substantial shift in where
public institutions are spending their limited capital dollars.
In 2007, public campuses invested 44% of their funds on
space and safety/ code projects and 56% on more durable
envelope/mechanical systems and utility infrastructure that
likely have the effect of reducing energy consumption.
By 2014, the amount of capital funding spent on envelope/
mechanical systems and infrastructure increased to 64%.
By contrast, private campuses spending on space renewal/
safety code projects stayed relatively stable during the 2007-
2014 period. The difference between the sectors can be
explained by the fact that public institutions spend
an average of $3/GSF less than private institutions1.
This means that public institutions must prioritize capital
projects to address core building systems and envelope —
the result being a positive effect in terms of reduced
energy consumption.
We see some of the results of the shift of capital
investment at public institutions when we look at
energy consumption by sector. From 2007-2014 public
institutions reduced energy consumption by 5%, while
private institutions reduced consumption by less than 2%.
Public policies and requirements to reduce energy
consumption may have played a role in this reduction.
If so, these policies also led to public campuses to refocus
their capital investment towards envelope/mechanical
systems and utility infrastructure.
1 Sightlines’ State of Facilities in Higher Education: 2014 Benchmarks, Best Practices & Trends, available on www.sightlines.com
FACTORS AFFECTING ENERGY CONSUMPTION
How Are Capital Dollars Being Spent?
Higher investment into envelope/mechanical projects
Focus on Energy Reduction
Public and private average for energy consumption
13
The State of Sustainability in Higher Education 2015: Emissions Metrics, Consumption Trends & Strategies for Success
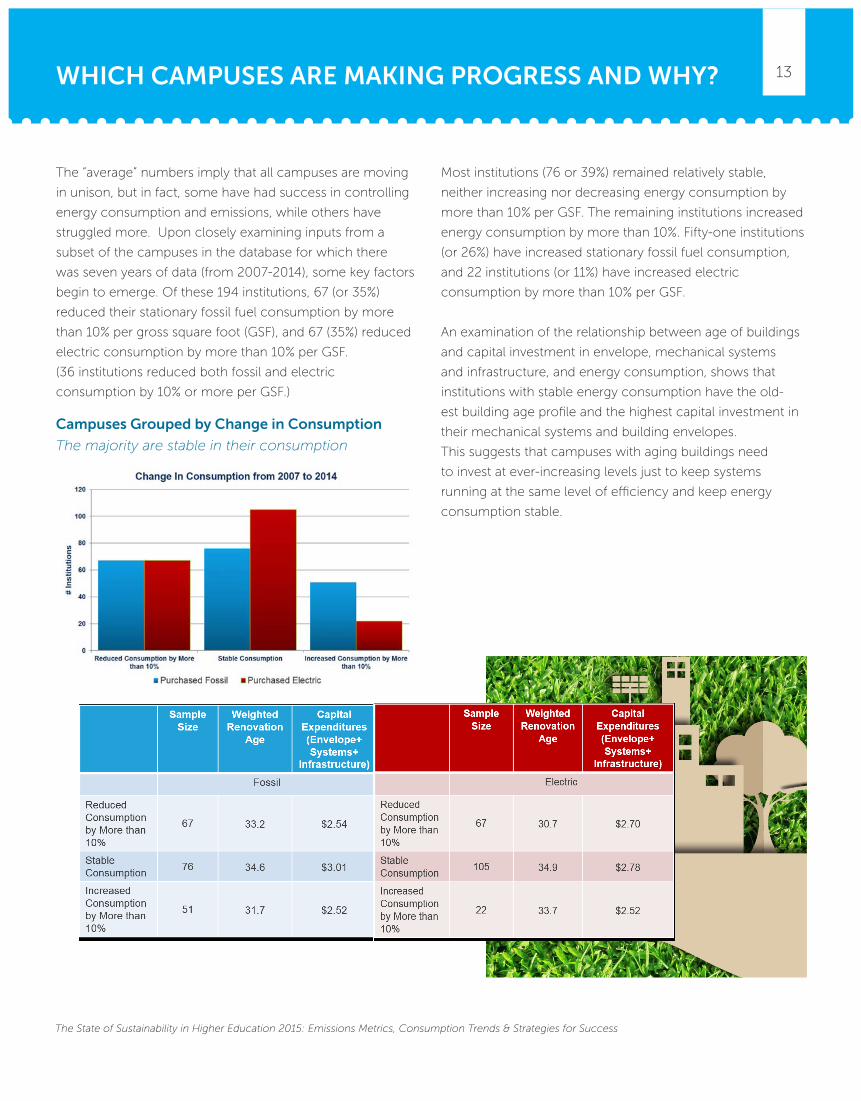
The “average” numbers imply that all campuses are moving
in unison, but in fact, some have had success in controlling
energy consumption and emissions, while others have
struggled more. Upon closely examining inputs from a
subset of the campuses in the database for which there
was seven years of data (from 2007-2014), some key factors
begin to emerge. Of these 194 institutions, 67 (or 35%)
reduced their stationary fossil fuel consumption by more
than 10% per gross square foot (GSF), and 67 (35%) reduced
electric consumption by more than 10% per GSF.
(36 institutions reduced both fossil and electric
consumption by 10% or more per GSF.)
Most institutions (76 or 39%) remained relatively stable,
neither increasing nor decreasing energy consumption by
more than 10% per GSF. The remaining institutions increased
energy consumption by more than 10%. Fifty-one institutions
(or 26%) have increased stationary fossil fuel consumption,
and 22 institutions (or 11%) have increased electric
consumption by more than 10% per GSF.
An examination of the relationship between age of buildings
and capital investment in envelope, mechanical systems
and infrastructure, and energy consumption, shows that
institutions with stable energy consumption have the old-
est building age profile and the highest capital investment in
their mechanical systems and building envelopes.
This suggests that campuses with aging buildings need
to invest at ever-increasing levels just to keep systems
running at the same level of efficiency and keep energy
consumption stable.
WHICH CAMPUSES ARE MAKING PROGRESS AND WHY?
Campuses Grouped by Change in Consumption
The majority are stable in their consumption
14
The State of Sustainability in Higher Education 2015: Emissions Metrics, Consumption Trends & Strategies for Success
The campuses that either increased or decreased energy
consumption by 10% or greater had a slightly younger age
profile than campuses with stable consumption. However,
the campuses that decreased electric consumption spent
almost $0.20 more per square foot capital on envelope,
mechanical systems and infrastructure. There was not a
similar relationship with respect to capital expenditures
and fossil consumption.
WHICH CAMPUSES ARE MAKING PROGRESS AND WHY?
INFRASTRUCTURE IMPROVEMENTS INCREASE ENERGY EFFICIENCY AT WASHBURN
Washburn University in Kansas is one institution that shows how infrastructure improvements can create gains in
energy efficiency. In 2013-2014, Washburn entered an energy performance contract with the TRANE Company
through USBank. Trane installed new equipment and building automation controls in seven campus buildings
and made scheduling and set-point adjustments in most of the remaining buildings on campus. Annual energy
efficiency savings are projected at $617,880 and will be used to pay the debt over a 15 year time frame. 1
1 http://www.washburn.edu/faculty-staff/campus-services/facilities-services/energy-efficiency-policy.html
15
The State of Sustainability in Higher Education 2015: Emissions Metrics, Consumption Trends & Strategies for Success
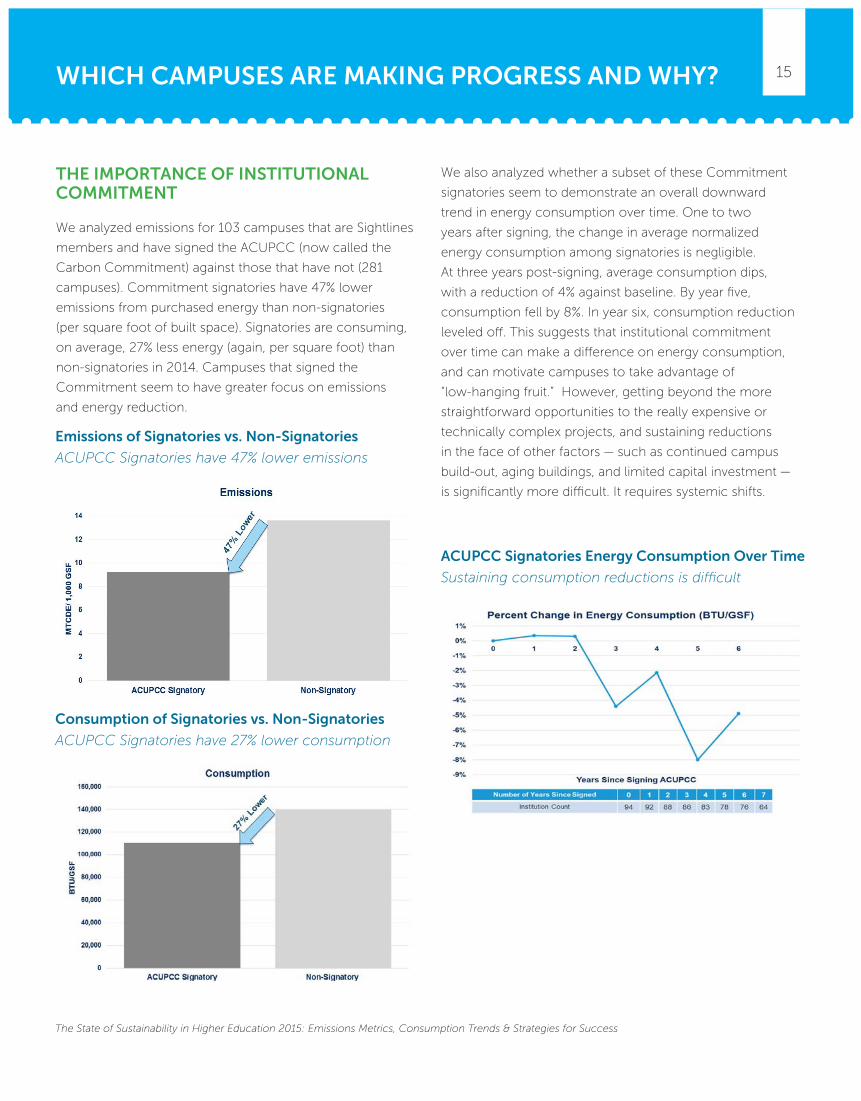
THE IMPORTANCE OF INSTITUTIONAL COMMITMENT
We analyzed emissions for 103 campuses that are Sightlines
members and have signed the ACUPCC (now called the
Carbon Commitment) against those that have not (281
campuses). Commitment signatories have 47% lower
emissions from purchased energy than non-signatories
(per square foot of built space). Signatories are consuming,
on average, 27% less energy (again, per square foot) than
non-signatories in 2014. Campuses that signed the
Commitment seem to have greater focus on emissions
and energy reduction.
We also analyzed whether a subset of these Commitment
signatories seem to demonstrate an overall downward
trend in energy consumption over time. One to two
years after signing, the change in average normalized
energy consumption among signatories is negligible.
At three years post-signing, average consumption dips,
with a reduction of 4% against baseline. By year five,
consumption fell by 8%. In year six, consumption reduction
leveled off. This suggests that institutional commitment
over time can make a difference on energy consumption,
and can motivate campuses to take advantage of
“low-hanging fruit.” However, getting beyond the more
straightforward opportunities to the really expensive or
technically complex projects, and sustaining reductions
in the face of other factors — such as continued campus
build-out, aging buildings, and limited capital investment —
is significantly more difficult. It requires systemic shifts.
WHICH CAMPUSES ARE MAKING PROGRESS AND WHY?
Consumption of Signatories vs. Non-Signatories
ACUPCC Signatories have 27% lower consumption
Emissions of Signatories vs. Non-Signatories
ACUPCC Signatories have 47% lower emissions
ACUPCC Signatories Energy Consumption Over Time
Sustaining consumption reductions is difficult
16
The State of Sustainability in Higher Education 2015: Emissions Metrics, Consumption Trends & Strategies for Success
WHICH CAMPUSES ARE MAKING PROGRESS AND WHY?
BIG CHANGES REQUIRE BIG PLANNING AT NYU
A plan set in motion in 2006 is helping New York University, one of the largest campuses in the nation, reaching
its sustainability goals ahead of schedule. As a Charter signatory of the American College and University Presidents’
Climate Commitment, now known as the Carbon Commitment, in 2007, NYU has agreed to achieve climate
neutrality by 2040.¹ NYU was further motivated by the PlaNYC Climate Challenge, the mayor’s plan calling for
all city institutions of higher education voluntarily reducing greenhouse gas (GHG) emissions by 30% by 2017.2
The 2006 institution-wide initiative created a Sustainability Task Force, established a Sustainability Fund and
announced the $125 million new co-generation (CoGen) plant project.³ In 2010, NYU’s Climate Action Plan
further solidified the institution’s commitment to sustainability, and “fuses the short-term climate change mitigation
strategies of the Mayoral Challenge commitment with the broader goals of the ACUPCC; each complements the
other and anchors NYU’s overarching commitment to sustainability.”⁴ In 2011, NYU’s natural gas-fired CoGen plant
went online, a formidable replacement for their 30-year-old, oil-fired plant. This CoGen upgrade alone forecasted
a reduction in GHG emissions of over 20% while attaining nearly 90% energy efficiency. When combined with
consistent decreases in GHG emissions since 2006, NYU has already achieved a GHG reduction goal of
approximately 40%.
1 http://www.nyu.edu/about/news-publications/news/2010/03/12/nyu_releases_climate.html
2 http://www.nyu.edu/about/news-publications/news/2011/01/21/nyu-switches-on-green-cogen-plant-and-powers-up-for-the-sustainable-
future.html
3 New York University Climate Action plan, p 10 (http://www.nyu.edu/sustainability/pdf/capreport10.pdf)
4 Ibid., p. 11
17
The State of Sustainability in Higher Education 2015: Emissions Metrics, Consumption Trends & Strategies for Success
Many factors affect emissions and energy consumption at
campuses. Some are under the control of the institutional
decision-makers, such as fossil fuel sources, where electricity
is purchased, how capital is invested, and the commitment
and policies to reduce carbon emissions and energy
consumption. These factors help explain some of the
trends we have identified. However, there are additional
factors outside the control of the institution that have an
impact on carbon emissions and energy consumption.
Some of these factors are examined in this section.
ENERGY COST
Earlier in this report, we documented factors that have
an impact on energy emissions and consumption. In this
section, we analyze the relationship between the cost
of energy and emissions from consumption.
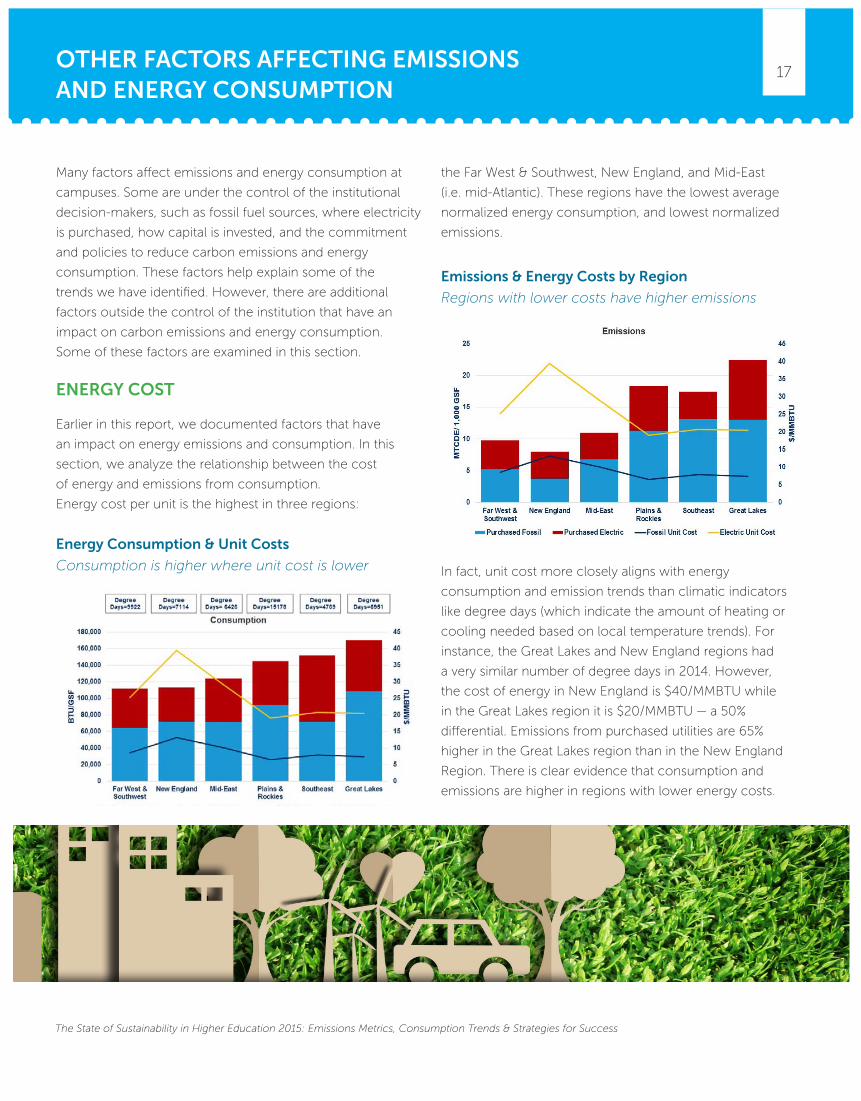
Energy cost per unit is the highest in three regions:
the Far West & Southwest, New England, and Mid-East
(i.e. mid-Atlantic). These regions have the lowest average
normalized energy consumption, and lowest normalized
emissions.
In fact, unit cost more closely aligns with energy
consumption and emission trends than climatic indicators
like degree days (which indicate the amount of heating or
cooling needed based on local temperature trends). For
instance, the Great Lakes and New England regions had
a very similar number of degree days in 2014. However,
the cost of energy in New England is $40/MMBTU while
in the Great Lakes region it is $20/MMBTU — a 50%
differential. Emissions from purchased utilities are 65%
higher in the Great Lakes region than in the New England
Region. There is clear evidence that consumption and
emissions are higher in regions with lower energy costs.
OTHER FACTORS AFFECTING EMISSIONS AND ENERGY CONSUMPTION
Energy Consumption & Unit Costs
Consumption is higher where unit cost is lower
Emissions & Energy Costs by Region
Regions with lower costs have higher emissions
18
The State of Sustainability in Higher Education 2015: Emissions Metrics, Consumption Trends & Strategies for Success
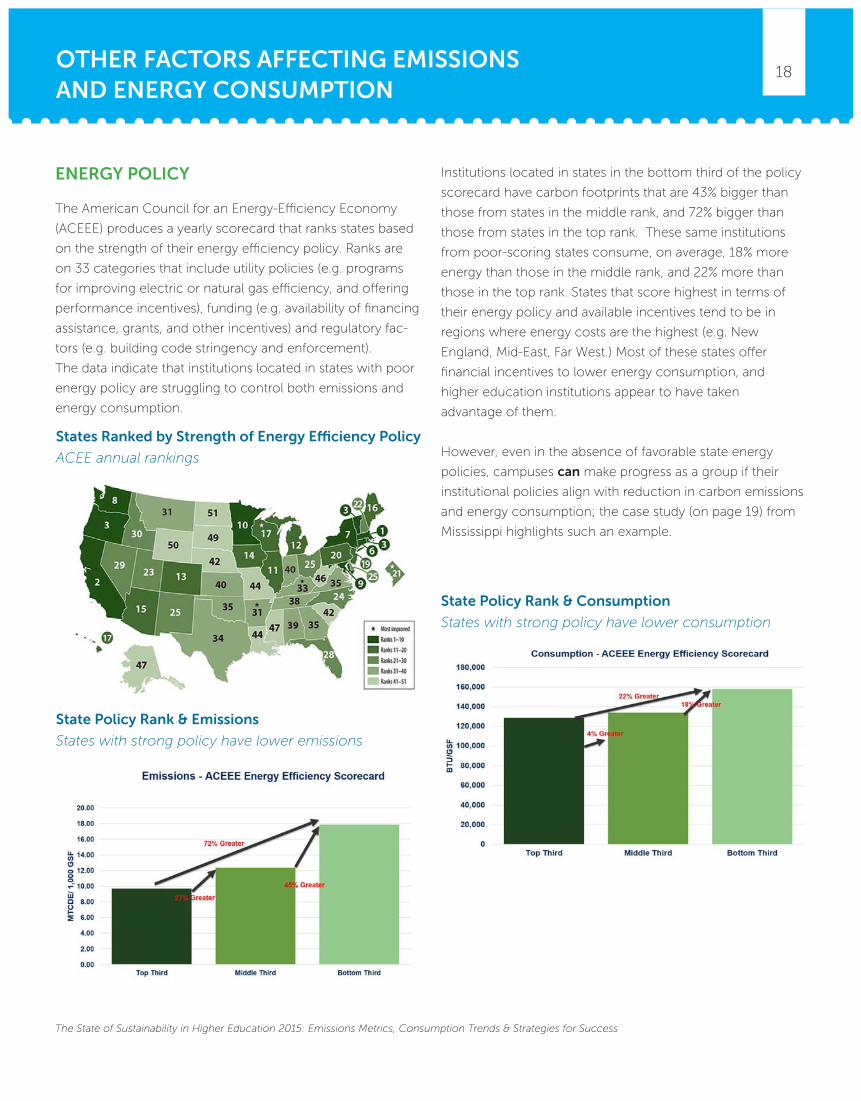
ENERGY POLICY
The American Council for an Energy-Efficiency Economy
(ACEEE) produces a yearly scorecard that ranks states based
on the strength of their energy efficiency policy. Ranks are
on 33 categories that include utility policies (e.g. programs
for improving electric or natural gas efficiency, and offering
performance incentives), funding (e.g. availability of financing
assistance, grants, and other incentives) and regulatory fac-
tors (e.g. building code stringency and enforcement).
The data indicate that institutions located in states with poor
energy policy are struggling to control both emissions and
energy consumption.
Institutions located in states in the bottom third of the policy
scorecard have carbon footprints that are 43% bigger than
those from states in the middle rank, and 72% bigger than
those from states in the top rank. These same institutions
from poor-scoring states consume, on average, 18% more
energy than those in the middle rank, and 22% more than
those in the top rank. States that score highest in terms of
their energy policy and available incentives tend to be in
regions where energy costs are the highest (e.g. New
England, Mid-East, Far West.) Most of these states offer
financial incentives to lower energy consumption, and
higher education institutions appear to have taken
advantage of them.
However, even in the absence of favorable state energy
policies, campuses can make progress as a group if their
institutional policies align with reduction in carbon emissions
and energy consumption; the case study (on page 19) from
Mississippi highlights such an example.
OTHER FACTORS AFFECTING EMISSIONS AND ENERGY CONSUMPTION
State Policy Rank & Consumption
States with strong policy have lower consumption
States Ranked by Strength of Energy Efficiency Policy
ACEE annual rankings
State Policy Rank & Emissions
States with strong policy have lower emissions
19
The State of Sustainability in Higher Education 2015: Emissions Metrics, Consumption Trends & Strategies for Success
LEADING BY EXAMPLE IN MASSACHUSETTSIn 2007, the legislature of Massachusetts announced Executive Order 484 – Leading By Example: Clean Energy
and Efficient Buildings, an order that addressed the environmental impact of all buildings managed by the Division
of Capital Asset Management and Maintenance (DCAMM). DCAMM manages all state buildings, including the
UMass system and all other state and community colleges.1 Order 484 promoted energy conservation, clean
energy practices and waste reduction, established reduction goals, and outlined new construction criteria.
To help campuses meet their goals, the Energy Team (E-Team), a business unit of the Facilities Management and
Maintenance group at DCAMM, “worked to ensure that facilities attain practicable goals in sustainable design and
construction and achieve optimal levels of energy and water efficiency for existing, renovated, and new buildings.”2
Many of these 29 schools, including the UMass System, have signed the Carbon Commitment, formerly known
as the American College and University Presidents’ Climate Commitment, and, with assistance from the E-Team,
many are currently undertaking or have completed energy efficiency projects.3 There is also a 21-page guide
entitled “Campus Sustainability Best Practices: A Resource for Colleges and Universities” designed to offer tools
on issues ranging from renewal energy initiatives to financing and education.4
MISSISSIPPI STATE SYSTEM POLICYMississippi Public Universities are reducing energy consumption and increasing efficiency, helped largely by
policies set in place by the Board of Trustees and the system-wide Energy Council, which is comprised of
university representatives, system personnel and a Board representative.
In 2010, a goal of reducing energy consumption by 30% by 2020 was set. In FY14, “despite a 20% increase in
square footage and an exceptionally cold winter, the system achieved a 21% reduction in consumption.”5
The Mississippi Institutions of Higher Learning (IHL) has a 15-item sustainability policy that outlines procedures
designed to help guide improvements across operations, grounds, materials, and transportation. The policy
instructs each institution to develop their own campus policy and states that “no less than 25 percent of the
expected annual recurring savings from completed energy efficiency projects to be set aside to finance future
energy efficiency efforts,”6 which creates a built-in funding source.
1 http://www.mass.gov/anf/property-mgmt-and-construction/facilities-mgmt-and-maintenance/energy-and-sustainability/leading-by-exmple-clean-engy-and-effic-bldgs-eo484.html2 http://www.mass.gov/anf/property-mgmt-and-construction/facilities-mgmt-and-maintenance/energy-and-sustainability/3 http://www.mass.gov/anf/property-mgmt-and-construction/design-and-construction-of-public-bldgs/current-and-completed-projects/energy-projects/4 http://www.mass.gov/eea/docs/eea/lbe/lbe-campus-sustain-practices.pdf5 http://www.mississippi.edu/ihl/newsstory.asp?ID=11106 http://www.mississippi.edu/facilities/downloads/sustainability_policy.pdf
OTHER FACTORS AFFECTING EMISSIONS AND ENERGY CONSUMPTION
20
The State of Sustainability in Higher Education 2015: Emissions Metrics, Consumption Trends & Strategies for Success
SUMMARY OF FINDINGS
In summary, an analysis of campus energy and emissions
data from a nationally-representative set of U.S. institutions
of higher education for the period 2007-2014 concludes
the following:
• Gross average emissions from Stationary Scope 1 and
Scope 2 sources are down a modest 5% from 2010-2014,
and gross energy consumption actually increased over
the same time period.
• Emissions per square foot were down 13% between
2007 and 2014; however energy usage per square foot
was down only 2%.
• These findings do not reflect a lack of effort on the part
of campuses; what they do reflect is new construction
and renovations that added square footage also resulted
in additional energy consumption. Adding to the physical
footprint trumps efforts to reduce energy consumption.
• Most of the progress in reducing campus carbon foot-
prints came as a result of switching from high-carbon
energy sources (e.g. coal and oil) to lower-carbon natural
gas and zero-emissions on- and off-site renewal energy.
• Campuses that shifted capital investment to envelope,
mechanical systems like HVAC and utility infrastructure
made more progress in reducing GHG emissions and
reducing energy use. Public campuses improved more
than private campuses, possibly reflecting stronger
public policy goals.
• Schools with buildings of an older age profile had to
spend more just to keep consumption stable.
• Campus size, density, age profile, and capital
investment portfolios are key drivers of GHG
emissions and energy consumption
• Institutional commitment and leadership matters.
For example, campuses that have signed on to Second
Nature’s Carbon Commitment (formerly the ACUPCC)
had lower emissions than non-signatories.
• Energy cost has a big impact on energy consumption.
Campuses in regions where energy is cheap consumed
more than campuses in high cost regions, even when
degree days were similar.
• Public policy and incentives are critical. Campuses in
regions with strong energy and GHG reduction incentives
consumed less; those in states with weaker policies
consumed more.
So what do these findings tells us? The next sections look at
four strategies that offer higher education institutions a path
to lower emissions and energy consumption:
1. Institutional commitment and leadership
2. Strategic investment based on life-cycle costing
3. Increased engagement in matters of public policy
(i.e., incentives and regulation)
4. More sophisticated metrics, tracking and analysis to
guide decision-making
INSTITUTIONAL COMMITMENT AND LEADERSHIP MATTERS
Institutional commitment is expected to be a driver
in sustainability outcomes and, the data did highlight
preferable emissions numbers for schools that were
signatories of the most high-profile example of a U.S.
campus greenhouse gas commitment. This internal
commitment has helped them keep their average energy
consumption, emissions, and costs lower than their
counterparts’ and it led them to commit resources to sustain
energy and emissions reductions.
CONCLUSIONS AND RECOMMENDATIONS
21
The State of Sustainability in Higher Education 2015: Emissions Metrics, Consumption Trends & Strategies for Success
Commitment is about more than espousing conceptual
support; it’s about consistent, long-term action.
As Cummings notes in his (2010) research of sustainability
efforts at four schools, “to be a national leader requires
direct and consistent attention from campus leadership.”2
A recent study by the Association of Climate Change
Officers reports, “Despite many universities having signed
declarations, we found that strong administrative leadership
is necessary to make those signatures meaningful.”3
Successful long-term sustainability efforts also require at
least one campus-based “champion.” These can be faculty
or staff members (students are too transitory to be effective
champions in this sense, though they can be very effective
proponents for starting new efforts or making significant
one-time shifts). These champions need to be able to
marshal resources and provide incentives for participation
by others. Without having at least one such champion,
climate and energy efforts are likely to be intermittent,
opportunistic or even haphazard, rather than strategic.
Finding or creating, and empowering such champions
is a critical component of institutional commitment
and leadership.
2 Cummings, G. 2009. “Turning Higher Education Green From The Inside Out: A Qualitative Study of Four Colleges and Universities That Made Green Happen.” Ph.D. Dissertation, University of Pennsylvania.3 Association of Climate Change Officers. 2013 “Business Drivers Impacting Establishment and Implementation of Greenhouse Gas Emissions Reduction Goals.”
Obviously, internal commitments are conditioned by
several factors, particularly financial ones. A NACUBO/
Second Nature policy brief that examined data from the
Institute for Building Efficiency’s “Energy Efficiency Indicator”
2011 report found lack of funding was “by far the primary
barrier to pursuing energy efficiency among higher
education respondents” and determined that for bigger
projects with longer paybacks, the resulting “cost feasibil-
ity gap” is simply too big for many institutions to handle.4 It
is important for sustainability advocates to engage campus
business officers, academic leaders and facilities leaders
to build support for how strategic investments can have
a significant impact on reducing carbon emissions and
energy consumption; with that understanding firmly in
place, it is more likely that creative ways to fill that gap
can be developed.
4 Second Nature/NACUBO (2013) Higher Education: Leading the Nation to a Safe and Secure Energy Future. Available at: www.nacubo.org/Documents/BusinessPolicyAreas/Leading%20the%20Nation%20White%20Paper.pdf
CONCLUSIONS AND RECOMMENDATIONS
22
The State of Sustainability in Higher Education 2015: Emissions Metrics, Consumption Trends & Strategies for Success
STRATEGIC INVESTMENT MATTERS
We started this report outlining strategies in the Carbon
Management Hierarchy. Avoidance strategies are deemed
the highest priority, as well as the most transformative and
lasting in this hierarchy; however, the seven-year trends
highlighted in this report suggest that the majority of the
progress in cutting campus carbon emissions to date has
been made by replacing high-carbon fuels with natural gas
or renewables. Many of these fuel-switching projects have
achieved significant cost savings. Shifts to renewables
have helped campuses reduce energy cost volatility,
and facilitate long-term planning.
Have we moved away, then, from the strategy of avoidance
as the preferred method to reduce carbon emissions? Not
necessarily. Fuel-switching strategies have made positive —
even transformative — contributions to the shift toward low-
carbon institutions, especially when coupled with
sustained conservation and efficiency programs; however,
this approach cannot single-handedly solve the problem.
More fundamental changes also need to be made.
TURNING FACILITIES CHALLENGES INTO
SUSTAINABILITY OPPORTUNITIES
In the Sightlines database, 40% of campus space was
constructed between 1960 and 1975, to accommodate the
baby boomer generation’s pursuit of higher education.
The construction was fast, and during a period in which
energy management was not a primary concern. The
buildings of that era have not stood the test of time and are
known for their high levels of deferred maintenance and for
being “energy hogs.” The growing deferred maintenance
in these 1960-70s buildings is one of the most vexing
challenges campuses face today. While these older buildings
are deteriorating, campuses across the country have added
a significant amount of new space. There is simply not
enough money to fix the older buildings and keep-up the
newer buildings at the same time. The growth in campus
building and the increasingly crushing burdens of deferred
maintenance have been a factor contributing to spiraling
operational (and thus tuition) costs, creating a crisis of
campus sustainability in the most literal sense.
But these facilities challenges may be turned into
sustainability opportunities, by implementing the
following strategies:
• Set capital priorities to proactively address the backlog
needs in the aging buildings that are critical to mission
and programs. There is strong evidence that many of these
buildings are already at high risk of failure for key building
components; waiting for failures to occur will not only result
in program disruption, but will also be much more costly
than fixing the buildings now. Campuses should plan based
on life-cycle costs: significant renovations of the 1960-70s
buildings will immediately improve the energy consumption
and long-term operating costs on campus.
• Eliminate or replace aging space with new modern
facilities, especially those buildings of vintages where poor
quality construction and lack of attention to energy use
was prevalent. Sometimes less is more when it comes to
addressing aging buildings with high backlogs. A “renovation
through replacement” approach is a powerful — and
ultimately, much less costly — way to eliminate aging space
with high levels of deferred maintenance and excessive
energy costs. In some cases, campuses can actually
eliminate underutilized space in poor condition. Leadership
needs to identify and implement such opportunities,
however difficult. These might be the most valuable financial
or operational contribution administrators or trustees could
make the campus more sustainable.
• Adopt policies that result in minimal net new square
footage and establish criteria for the construction of new
CONCLUSIONS AND RECOMMENDATIONS
23
The State of Sustainability in Higher Education 2015: Emissions Metrics, Consumption Trends & Strategies for Success
space. New construction must support the mission of the
institution and support future program needs. A number of
campuses have already implemented “no net new space”
policies, meaning that they will balance any new
construction with elimination of other buildings. These
policies represent the high-impact “avoidance” aspect of the
carbon management hierarchy, and will pay off in reduced
energy consumption and carbon pollution, while improving
institutional sustainability.
IMPLEMENTING RENEWABLE ENERGY STRATEGIES
The massive move away from coal and oil to natural gas
was the biggest single driver in campus carbon emissions
reductions between 2007 and 2014. The question now is
whether natural gas will become the “new normal” and the
rate of reductions will plateau, or whether natural gas will be
the “bridge fuel” in the way some clean energy advocates
have envisioned.
Campuses can lead the way. There are significant
opportunities for campuses to implement further fuel
switching and use renewables like solar and wind as part of
their energy portfolio, and in so doing increase the security
of their power and energy supplies, reduce cost volatility,
and appeal to sustainability-minded prospective students as
well as alumni and potential donors.
Large-scale adoption of renewable energy will require
institutions to create or leverage new financial strategies.
For example, some universities are finding ways to structure
Power Purchase Agreements (PPAs) for both on- and offsite
renewable energy projects that require no up-front costs
and lock in rates that compete with conventional energy.
New federal programs and national initiatives (e.g. the Green
Gigawatt Partnership) are tools for reducing the transaction
costs of putting such deals in place. As energy production
and delivery systems continue to evolve, with new options
like cost-effective on-site power storage, micro-grids,
and other innovations, campuses that stay educated and
engaged about new options can benefit financially
and operationally.
The 2012 joint report by NACUBO and Second Nature,
“Leading the Nation to a Safe and Secure Energy Future,”5
noted that campuses are particularly challenged to find ways
of financing renewable-energy projects because of sharp
declines in state support coupled with the diminished ability
of endowments to support operations and lack of access to
several forms of grants and tax incentives. However, falling
costs for technologies like solar, coupled with innovation in
financing mechanisms (from the aforementioned PPAs to
Green Bonds — which have been successfully employed by a
handful of campuses over the past couple of years and offer
a great deal of untapped potential) are making it increasingly
evident that shifting to renewables represents a real strategic
opportunity for return on investment.
5 Second Nature/NACUBO (2013) Higher Education: Leading the Nation to a Safe and Secure Energy Future. Available at: http://www.nacubo.org/Documents/BusinessPolicyAreas/Leading%20the%20Nation%20White%20Paper.pdf
CONCLUSIONS AND RECOMMENDATIONS
24
The State of Sustainability in Higher Education 2015: Emissions Metrics, Consumption Trends & Strategies for Success
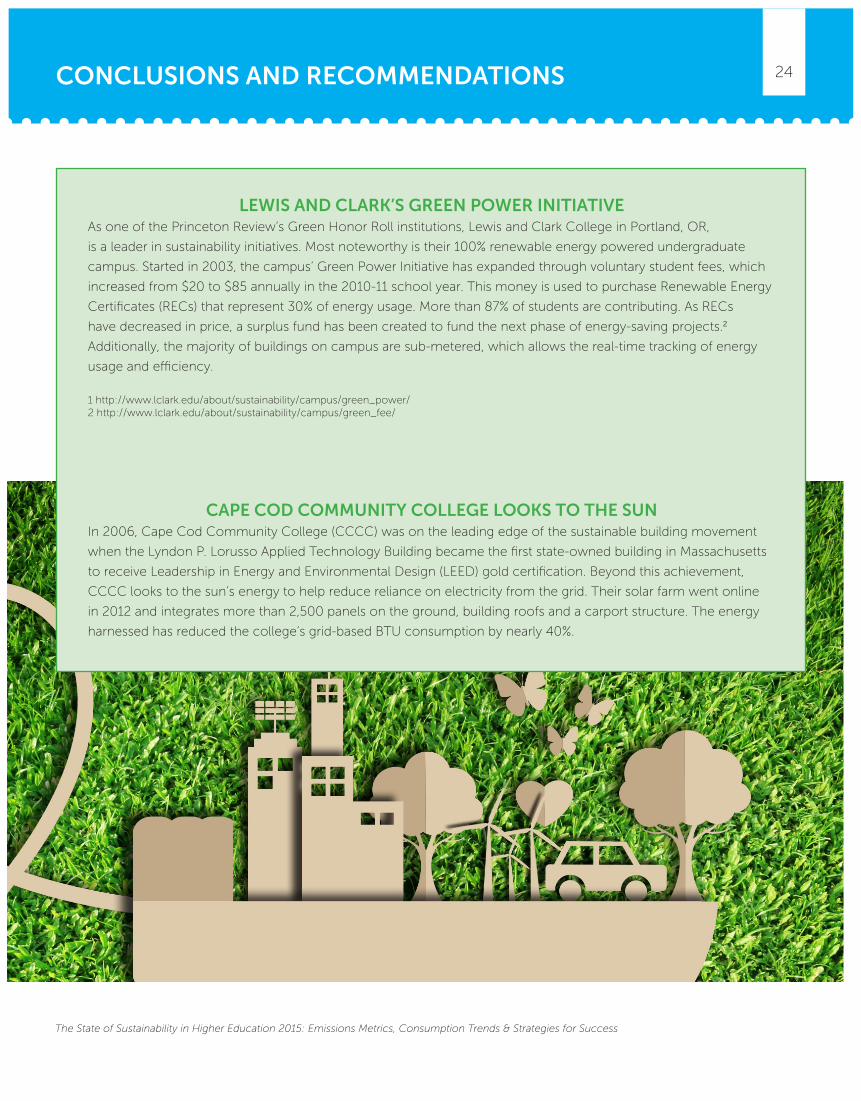
LEWIS AND CLARK’S GREEN POWER INITIATIVEAs one of the Princeton Review’s Green Honor Roll institutions, Lewis and Clark College in Portland, OR,
is a leader in sustainability initiatives. Most noteworthy is their 100% renewable energy powered undergraduate
campus. Started in 2003, the campus’ Green Power Initiative has expanded through voluntary student fees, which
increased from $20 to $85 annually in the 2010-11 school year. This money is used to purchase Renewable Energy
Certificates (RECs) that represent 30% of energy usage. More than 87% of students are contributing. As RECs
have decreased in price, a surplus fund has been created to fund the next phase of energy-saving projects.2
Additionally, the majority of buildings on campus are sub-metered, which allows the real-time tracking of energy
usage and efficiency.
1 http://www.lclark.edu/about/sustainability/campus/green_power/2 http://www.lclark.edu/about/sustainability/campus/green_fee/
CAPE COD COMMUNITY COLLEGE LOOKS TO THE SUNIn 2006, Cape Cod Community College (CCCC) was on the leading edge of the sustainable building movement
when the Lyndon P. Lorusso Applied Technology Building became the first state-owned building in Massachusetts
to receive Leadership in Energy and Environmental Design (LEED) gold certification. Beyond this achievement,
CCCC looks to the sun’s energy to help reduce reliance on electricity from the grid. Their solar farm went online
in 2012 and integrates more than 2,500 panels on the ground, building roofs and a carport structure. The energy
harnessed has reduced the college’s grid-based BTU consumption by nearly 40%.
CONCLUSIONS AND RECOMMENDATIONS
25
The State of Sustainability in Higher Education 2015: Emissions Metrics, Consumption Trends & Strategies for Success
PUBLIC SECTOR-BASED INCENTIVES
AND REGULATION MATTER
As the data clearly illustrates, campus’s energy use, costs
and emissions are strongly influenced by their respective
public sector and regulatory environments. Public sector
funding and regulatory factors also impact renewable
energy use and emissions performance. State-based
regulatory factors likely explain, for example, a predomi-
nance of Massachusetts institutions among the colleges
in the database that reduced their consumption by 10%
or greater (see page 20).6
In spite of the ways in which state and federal energy
policies and regulations clearly impact their bottom lines,
it is not clear that campus administrators are engaging as
actively as they might in energy policy dialogues with
elected officials, regulators and/or their utilities. This is a
missed opportunity not only to influence their operating
environments, but also to lead on a key economic
development issue: the future of our national energy
system. There are many options for shaping and
responding to the regulatory environment issues
discussed here. First, campuses could further support
calls for clear federal and state-level policies aimed at
incentivizing conservation, efficiency, and renewable
energy efforts — for example, to allow tax-exempt revenue
bond financing for power purchase agreements, or to
develop new loan options.7 Likewise, they can advocate for
rules and rates that make it easier and more cost effective
for institutions to produce energy on-site and feed it into
the grid. These policies will have major implications on
utility prices across the board.
6 Levine, Dovev (2015). Beyond Camus Borders: how External Environments Shape College and University Based Renewable Energy Achievements. (Unpublished Doctoral Dissertation) University of New Hampshire, Durham NH.
7 Second Nature/NACUBO (2013)
A handful of campuses that have recently signaled interest in
instituting their own internal “carbon tax” could look into the
potential for leveraging such commitments via collaboration
with like-minded civil servants within their state houses and
other political offices.
CONCLUSIONS AND RECOMMENDATIONS
26
The State of Sustainability in Higher Education 2015: Emissions Metrics, Consumption Trends & Strategies for Success
METRICS MATTER
The higher education sustainability movement has
made great strides on a number of fronts. To support
that progress, organizations like AASHE, Second Nature,
the U.S. Green Building Council, the Sustainable
Endowments Institute, APPA, and NACUBO have invested
significant resources into developing valuable, user-driven
tools and platforms for collecting and reporting out
metrics — from institutional carbon footprints and
(qualitative) climate action plans, to leadership
commitments like LEED, to investments in energy
efficiency and renewables through revolving funds,
and more.
While a significant and growing number of campuses are us-
ing these and other tools — including, of course, the
Campus Carbon Calculator™, Carbon MAP, and Sightlines
ROPA process and Sustainability Solutions — to measure
their carbon emissions and energy management efforts,
we still don’t have solid, qualified/verified data in a number
of key areas. Moreover, none of the available data is
organized or structured in a way that makes it easy to
access, analyze or interpret across platforms. Conducting
analysis within these constraints illuminated significant
measurement gaps:
• We know that fuel switching is a core part of this story,
but we were unable to trace a comprehensive,
contextualized picture of investment in, or deployment
of, renewables on or off campus. The data necessary to
do such an analysis do, arguably, exist — but they are
presently in too many fragmented places, and have too
little regimented QA/QC.
• Likewise, the necessary data was not readily available
to do a rigorous analysis of renewable energy certificate
(REC) or carbon offset purchases, and the degree to which
these have figured or are expected to figure into campus’s
near-term carbon management strategies.
• Due to a lack of consistent temporal and organizational
boundaries, and data collection methods, we could not
observe anything clearly meaningful or make actionable
conclusions around Scope 3 emissions (which is why no
Scope 3 data is included). Given that some analyses
suggest campus Scope 3 emissions can be larger than
Scope 1 and 2 combined — this is a significant data gap.
Looking at the life-cycle emissions impact of all fuels, for
example, might lead to very different energy infrastructure
investment choices than what we’ve seen over the past
several years. Campuses need better tools, and
encouragement to adopt more consistent practices,
for accurate, relevant modeling of their entire
Scope 3 emissions profiles (not just a subset).
The limits of what is possible with the current data
“ecosystem” suggest that everyone could benefit from
improved, streamlined systems for capturing key data
accurately and comprehensively; for aggregating it; and
for making it openly accessible. Moving toward such
systems will require sustained, systemic collaboration on
the part of the varied organizations that currently facilitate
this kind of data collection and reporting.
CONCLUSIONS AND RECOMMENDATIONS
27
The State of Sustainability in Higher Education 2015: Emissions Metrics, Consumption Trends & Strategies for Success
The bottom line suggested by the data is this: We in higher
education need to do a better job moving beyond talking
about reductions in carbon emissions and walking the walk
when it comes to addressing climate and energy issues.
This need presents a critical opportunity to ensure that our
higher education institutions are as socially relevant and
sustainable — in every sense of the word — as possible,
for decades to come.
The trends and findings presented here offer some insight
into possible strategic priorities and even adjustments
campuses can make in their carbon leadership efforts
moving forward. The reality is that we need to invest more
“up-front:” more attention, more sustained focus, more
creativity, and — yes — more financial capital, if we are
going to make the progress we need to make on energy
and climate change. Shifting to renewables by contracting
power purchase agreements does not require any up-front
capital, but can reduce energy cost volatility, facilitate long-
term budget planning, reduce energy costs, and dramatically
curb greenhouse gas emissions. Combining these strategies
with conservation and greater efficiency can result in large
and lasting energy and GHG savings.
Unfortunately, if we don’t make these investments now,
colleges and universities will continue to see our physical
campuses deteriorate, our energy consumption and costs
rise, and our ability to offer value questioned.
It is urgent that we focus on these four opportunities:
1. Make, and invest in, significant institutional
commitments to cutting energy use and emissions.
2. Prioritize avoiding new emissions sources by
“right-sizing” campus; contain life-cycle costs and
maintain efficiency through “re-setting” age profiles.
3. Leverage opportunities, such as large-scale power
purchase agreements, to replace fossil fuels with
renewable energy technologies. Take every advantage
of innovative funding mechanisms and emerging energy
storage technologies.
4. Engage actively, at a leadership level, in local, regional
and national dialogues on energy rules and regulations,
incentives, and systemic infrastructure investments.
5. Ramp up efforts to improve the availability of key
sustainability tools, metrics, datasets and modeling
capabilities. Focus, for example, on better data around
renewable energy, RECs and offsets, Scope 3 emissions,
energy spending and investment, and returns on said
investments. This recommendation applies to the
non-profits, agencies and businesses that serve
higher education (e.g. professional associations like
AASHE, APPA and NACUBO; nonprofits like USGBC,
Second Nature and SEI; and businesses like Sightlines).
It also applies to campuses themselves — like UNH —
whose participation and investment in these resources is
essential to success.
Seizing these opportunities will require even more innova-
tive thinking, breaking down of traditional silos, willingness
to experiment and to do things differently, and to act boldly.
The good news is that all of these investments will have a
high return, both in terms of financial resources and in terms
of making it easier for every institution to effectively manage
its physical campus. It’s a difficult but obvious choice; the
only one that will allow higher education to fulfill its ultimate
social mission — preparing future generations to lead, grow
and thrive.
CONCLUSION
28
The State of Sustainability in Higher Education 2015: Emissions Metrics, Consumption Trends & Strategies for Success
ACKNOWLEDGEMENTS
This report was a collaborative venture. From conception to
first draft, through revisions and final production, it benefitted
from a great deal of perceptive input by leaders throughout
the higher education community. Hearty thanks to all who
offered their valuable time, energy, and thoughtful
engagement to this process.
It is our hope that the report will help inform, prompt
dialogue, and inspire leaders on campuses everywhere
who are seeking to “raise the bar” further when it comes to
campus leadership on energy and climate change solutions.
Research, Analysis and Writing
Jennifer Andrews, University of New Hampshire
Dovev Levine, University of New Hampshire
James Kadamus, Sightlines
Heather Finnegan, Sightlines
Blair Li, Sightlines
Rudy Sturk, Sightlines
Reviewers
Internal: Tom Kelly, University of New Hampshire;
Elizabeth Farrell, University of New Hampshire;
Colleen Flaherty, University of New Hampshire;
Jay Pearlman, Sightlines.
External: Julian-Dautremont Smith, Association for
Advancement of Sustainability in Higher Education;
Jaime van Mourik, U.S. Green Building Council;
Tim Carter, Second Nature;
Janna Cohen-Rosenthal, Second Nature;
Steve Muzzy, Second Nature;
Chris O’Brien, Altenex
CONCLUSION
About UNH Sustainability InstituteThe UNH Sustainability Institute facilitates integration of diverse perspectives, disciplines and knowledge to address
sustainability’s grand challenges. As a university-wide institute, it supports innovation across curriculum, operations,
research and engagement. The Institute acts as a cultivator and champion of sustainability on campus, in the state
and region, and around the world, and is recognized for its unique, creative approach and thought leadership.
Learn more at www.sustainableunh.unh.edu.
About SightlinesFounded in 2000, Sightlines is a subsidiary of The Gordian Group. Sightlines gives colleges and universities the
independent data and perspective they need to make critical decisions about their most valuable assets – their
facilities. Sightlines stewards the industry’s most extensive verified database, allowing more than 450 institutions
across the U.S. and Canada to benchmark an institution’s facilities against universities and colleges across the
nation. Sightlines’ flagship offering for members is ROPA+, a fully integrated solution for facilities intelligence that
leads members through a comprehensive process of discovery, prediction and performance measurement. Other
Sightlines solutions provide higher ed executives with insights to assist with capital planning, space management
and campus sustainability initiatives. Learn more at www.sightlines.com.

The State of Sustainability in Higher Education 2015: Emissions Metrics, Consumption Trends & Strategies for Success.

The State of Sustainability in Higher Education 2015: Emissions Metrics, Consumption Trends & Strategies for Success.