improving your app with instruments - apple...
TRANSCRIPT
© 2014 Apple Inc. All rights reserved. Redistribution or public display not permitted without written permission from Apple.
#WWDC14
Improving Your App with Instruments
Session 418 Daniel Delwood Software Radiologist
Tools
Agenda
What's new in Instruments
Memory management
Time profiling
Performance counters
DTrace improvements
What's in Instruments
What's in Instruments
Memory Management

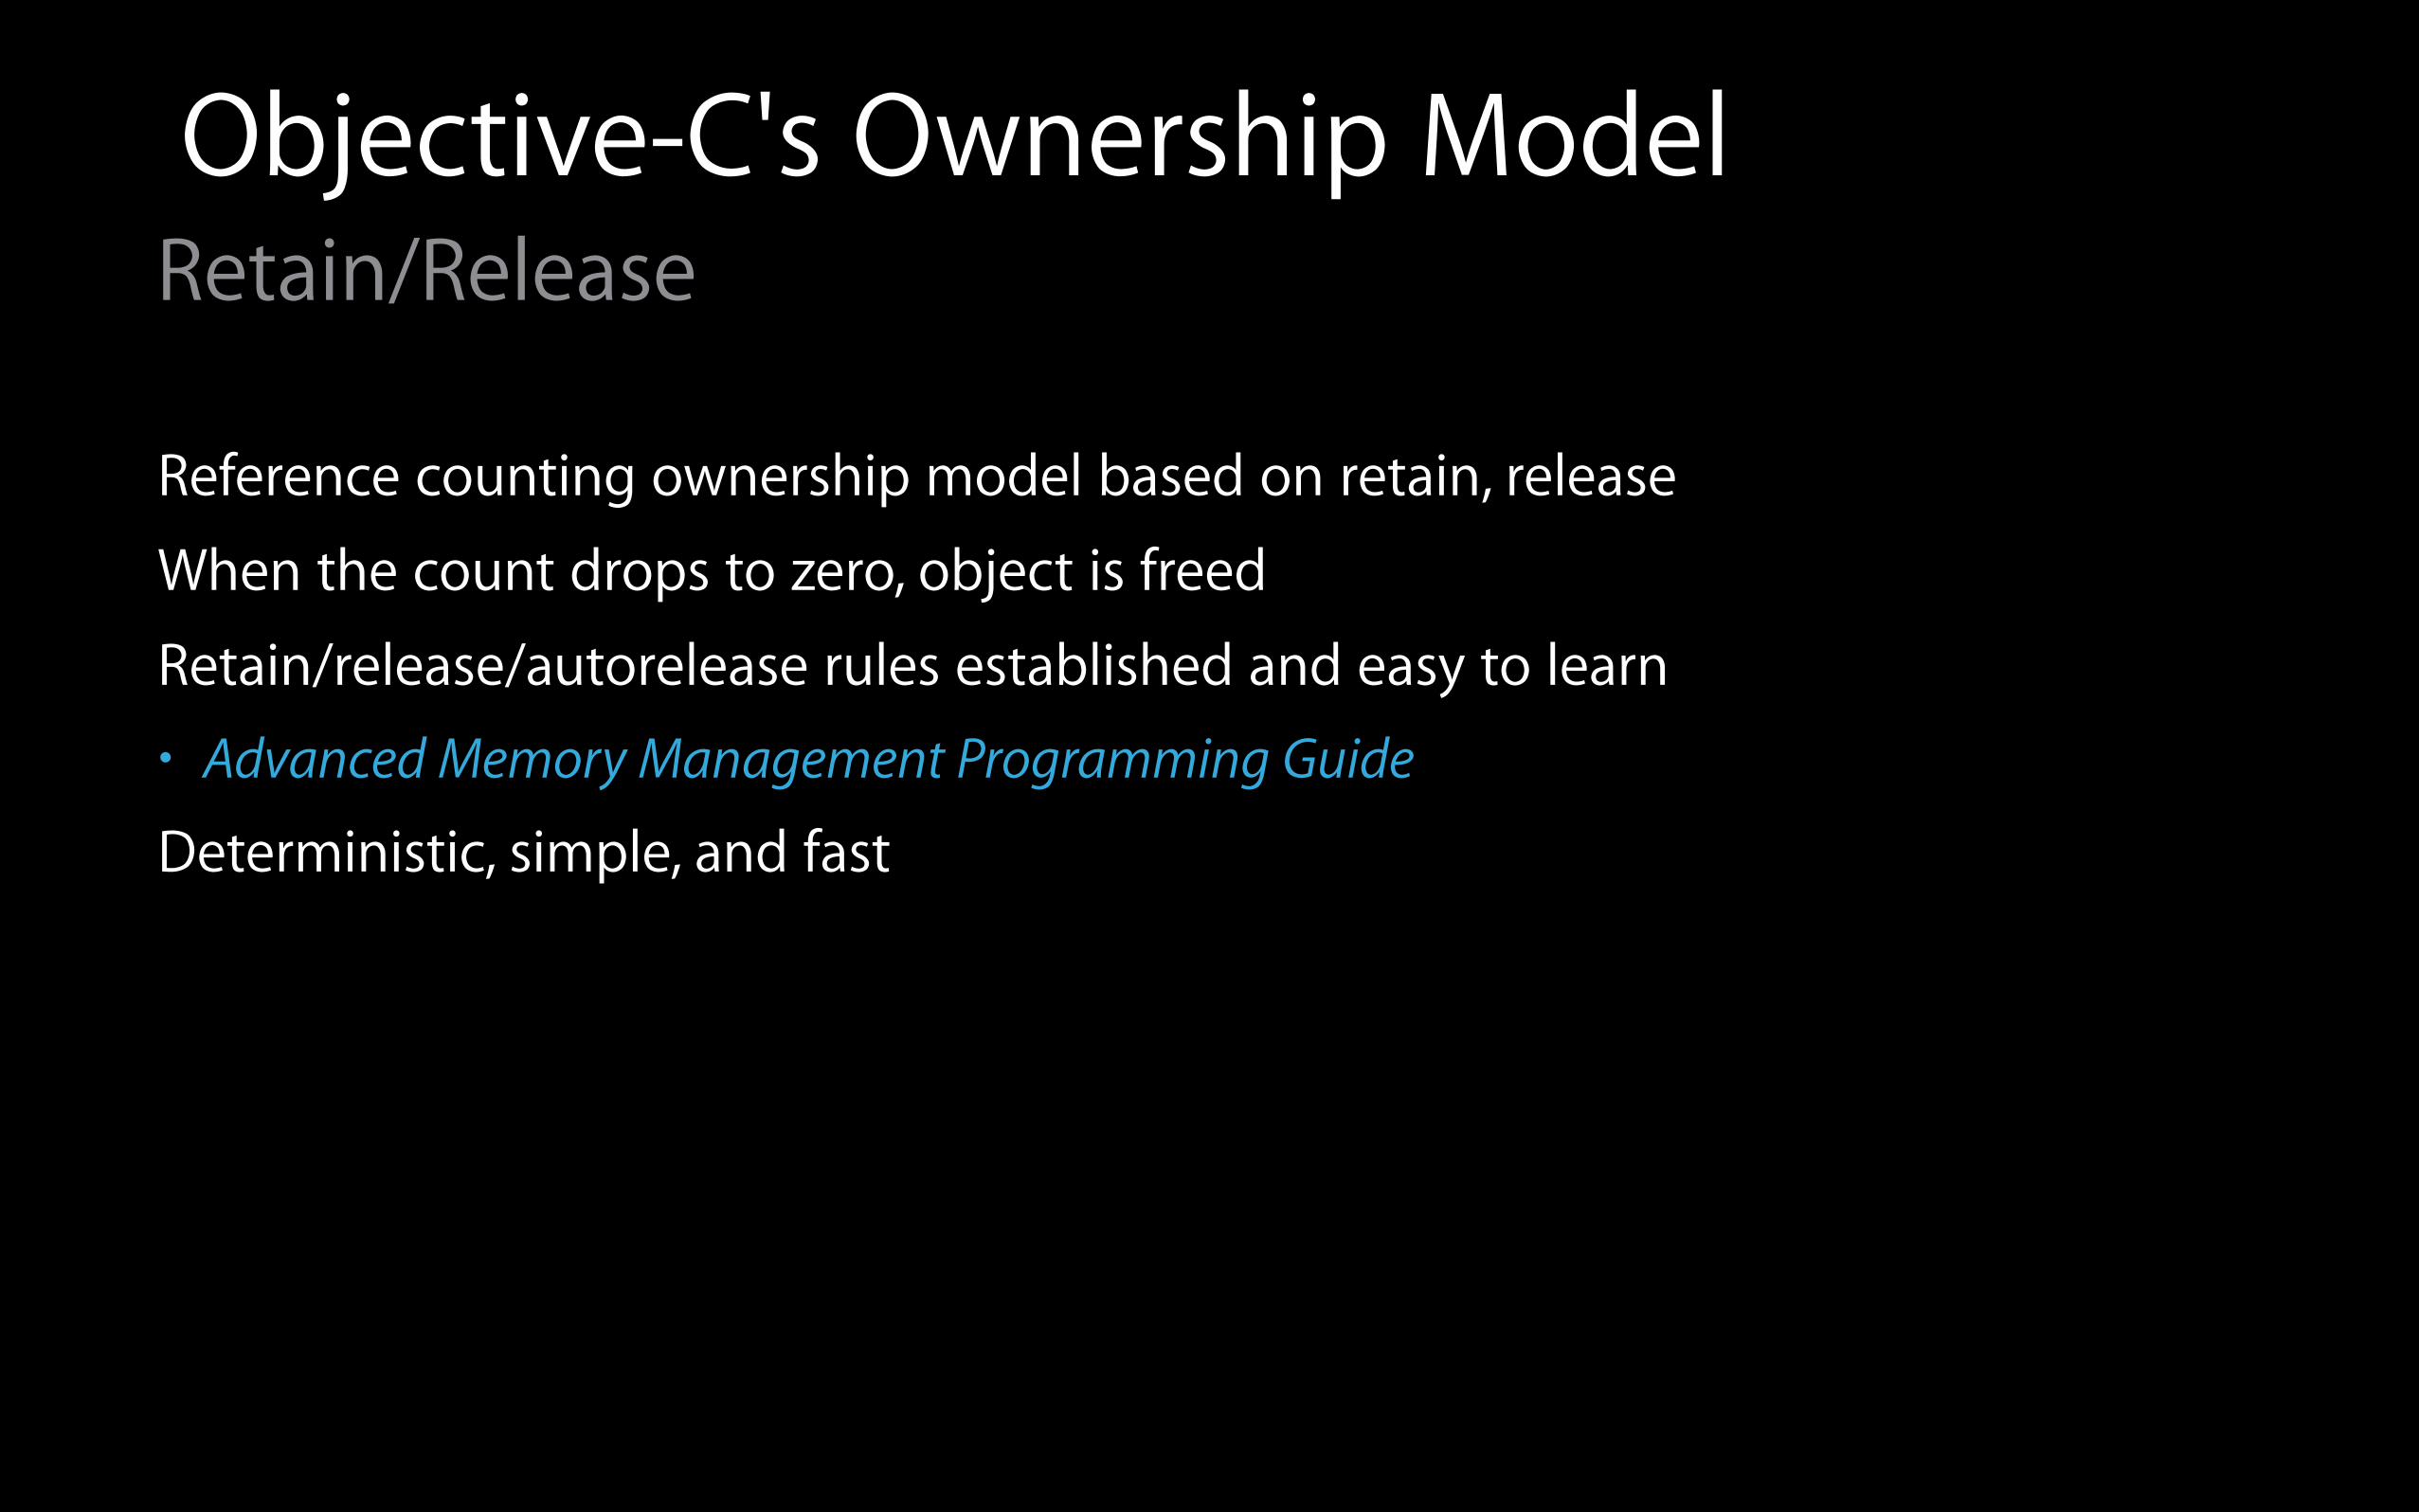
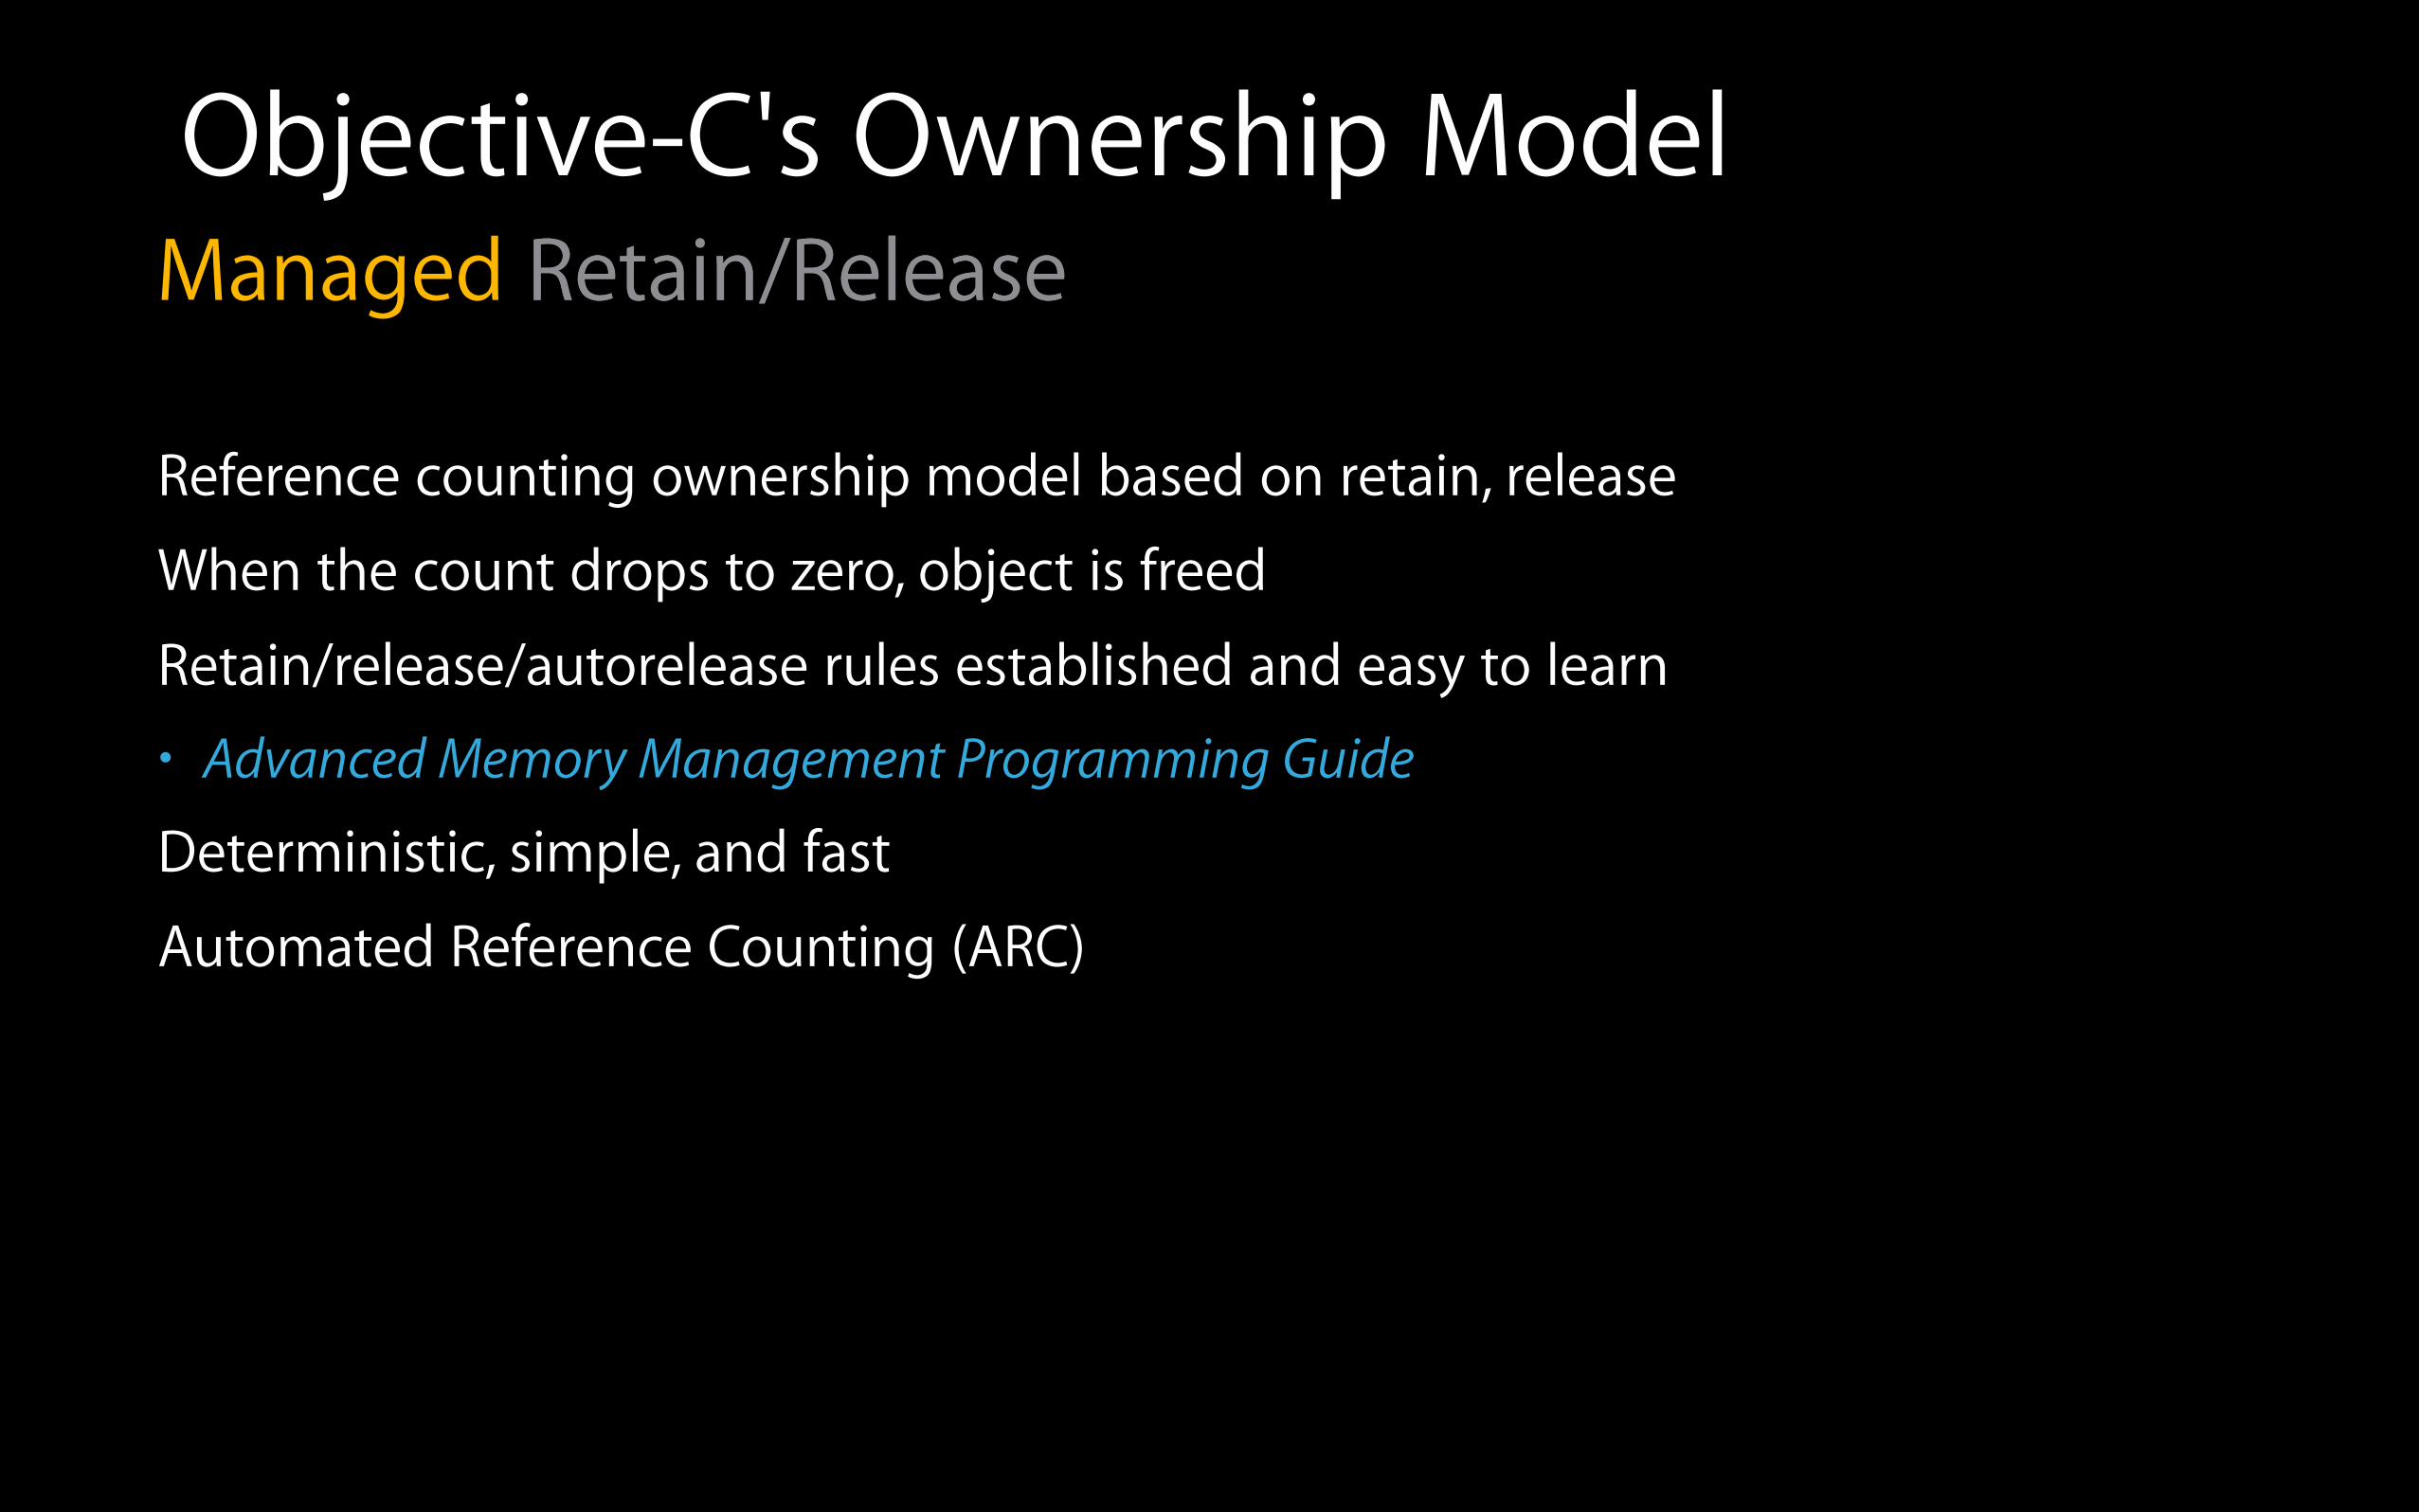
Objective-C's Ownership ModelRetain/Release
Reference counting ownership model based on retain, release
When the count drops to zero, object is freed
Retain/release/autorelease rules established and easy to learn• Advanced Memory Management Programming Guide
Deterministic, simple, and fast
Managed Retain/Release Objective-C's Ownership Model
Retain/Release
Reference counting ownership model based on retain, release
When the count drops to zero, object is freed
Retain/release/autorelease rules established and easy to learn• Advanced Memory Management Programming Guide
Deterministic, simple, and fast
Automated Reference Counting (ARC)
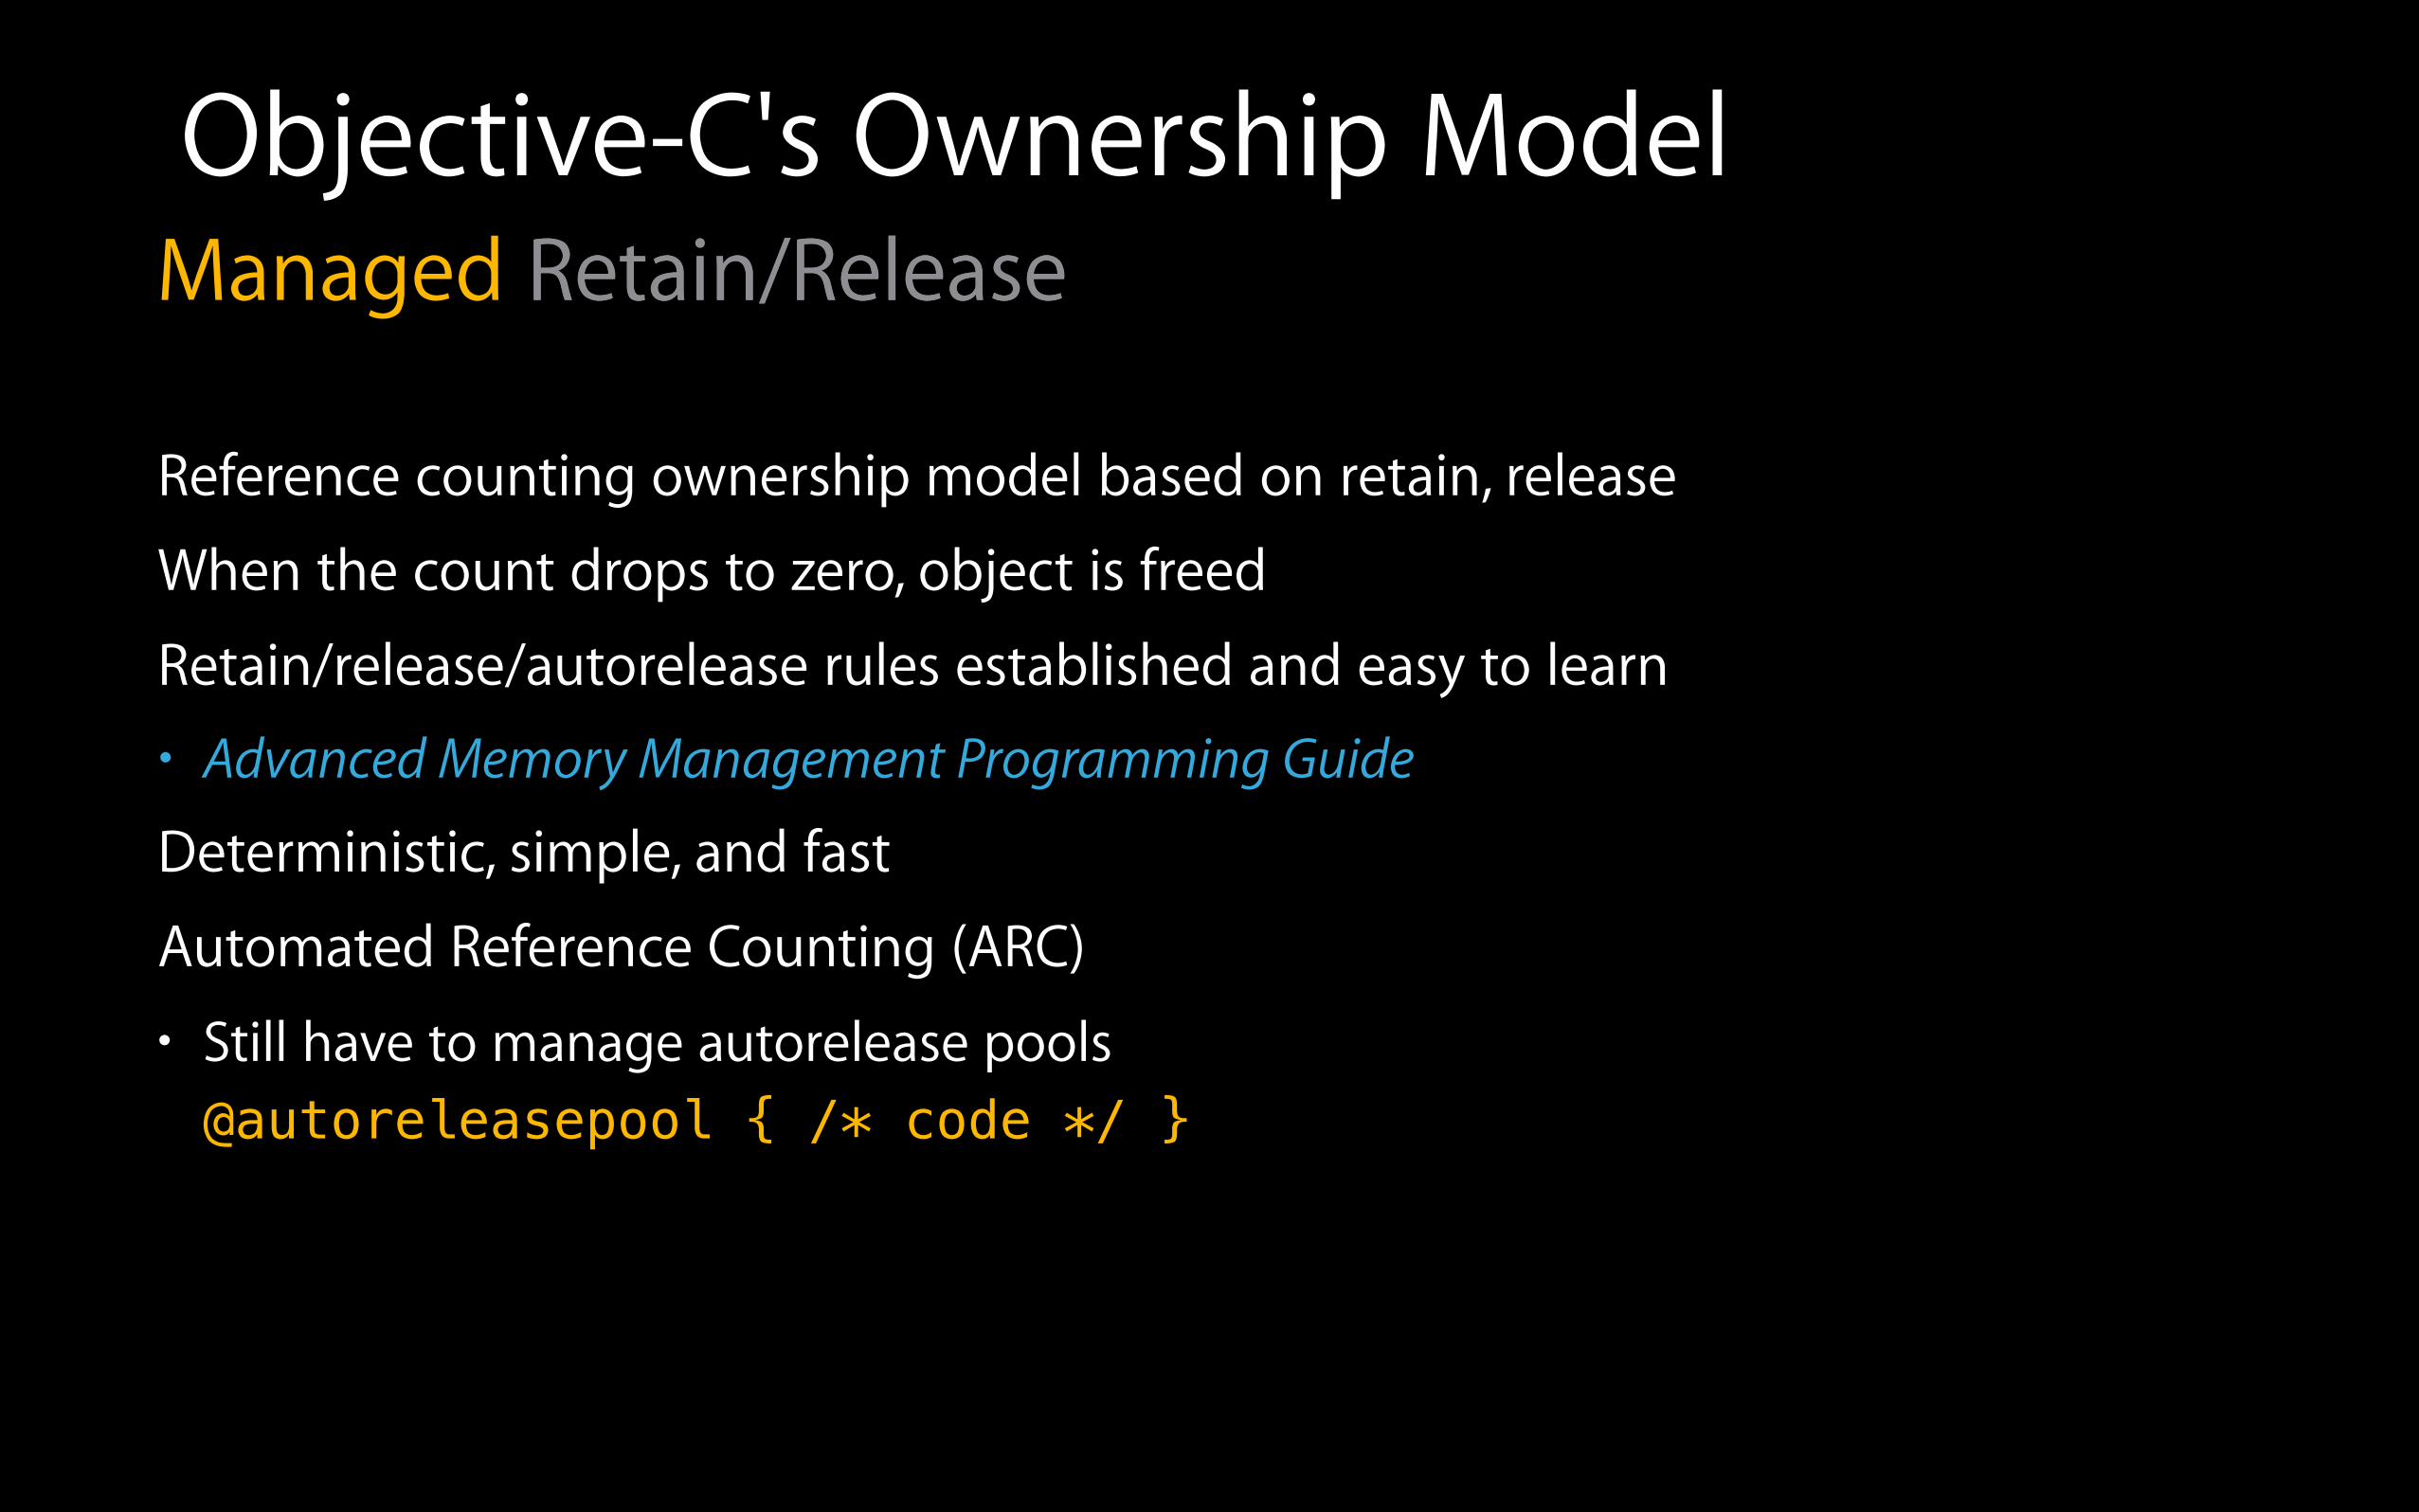
• Still have to manage autorelease pools @autoreleasepool { /* code */ }
Reference counting ownership model based on retain, release
When the count drops to zero, object is freed
Deterministic, simple, and fast
Automated Reference Counting (ARC)
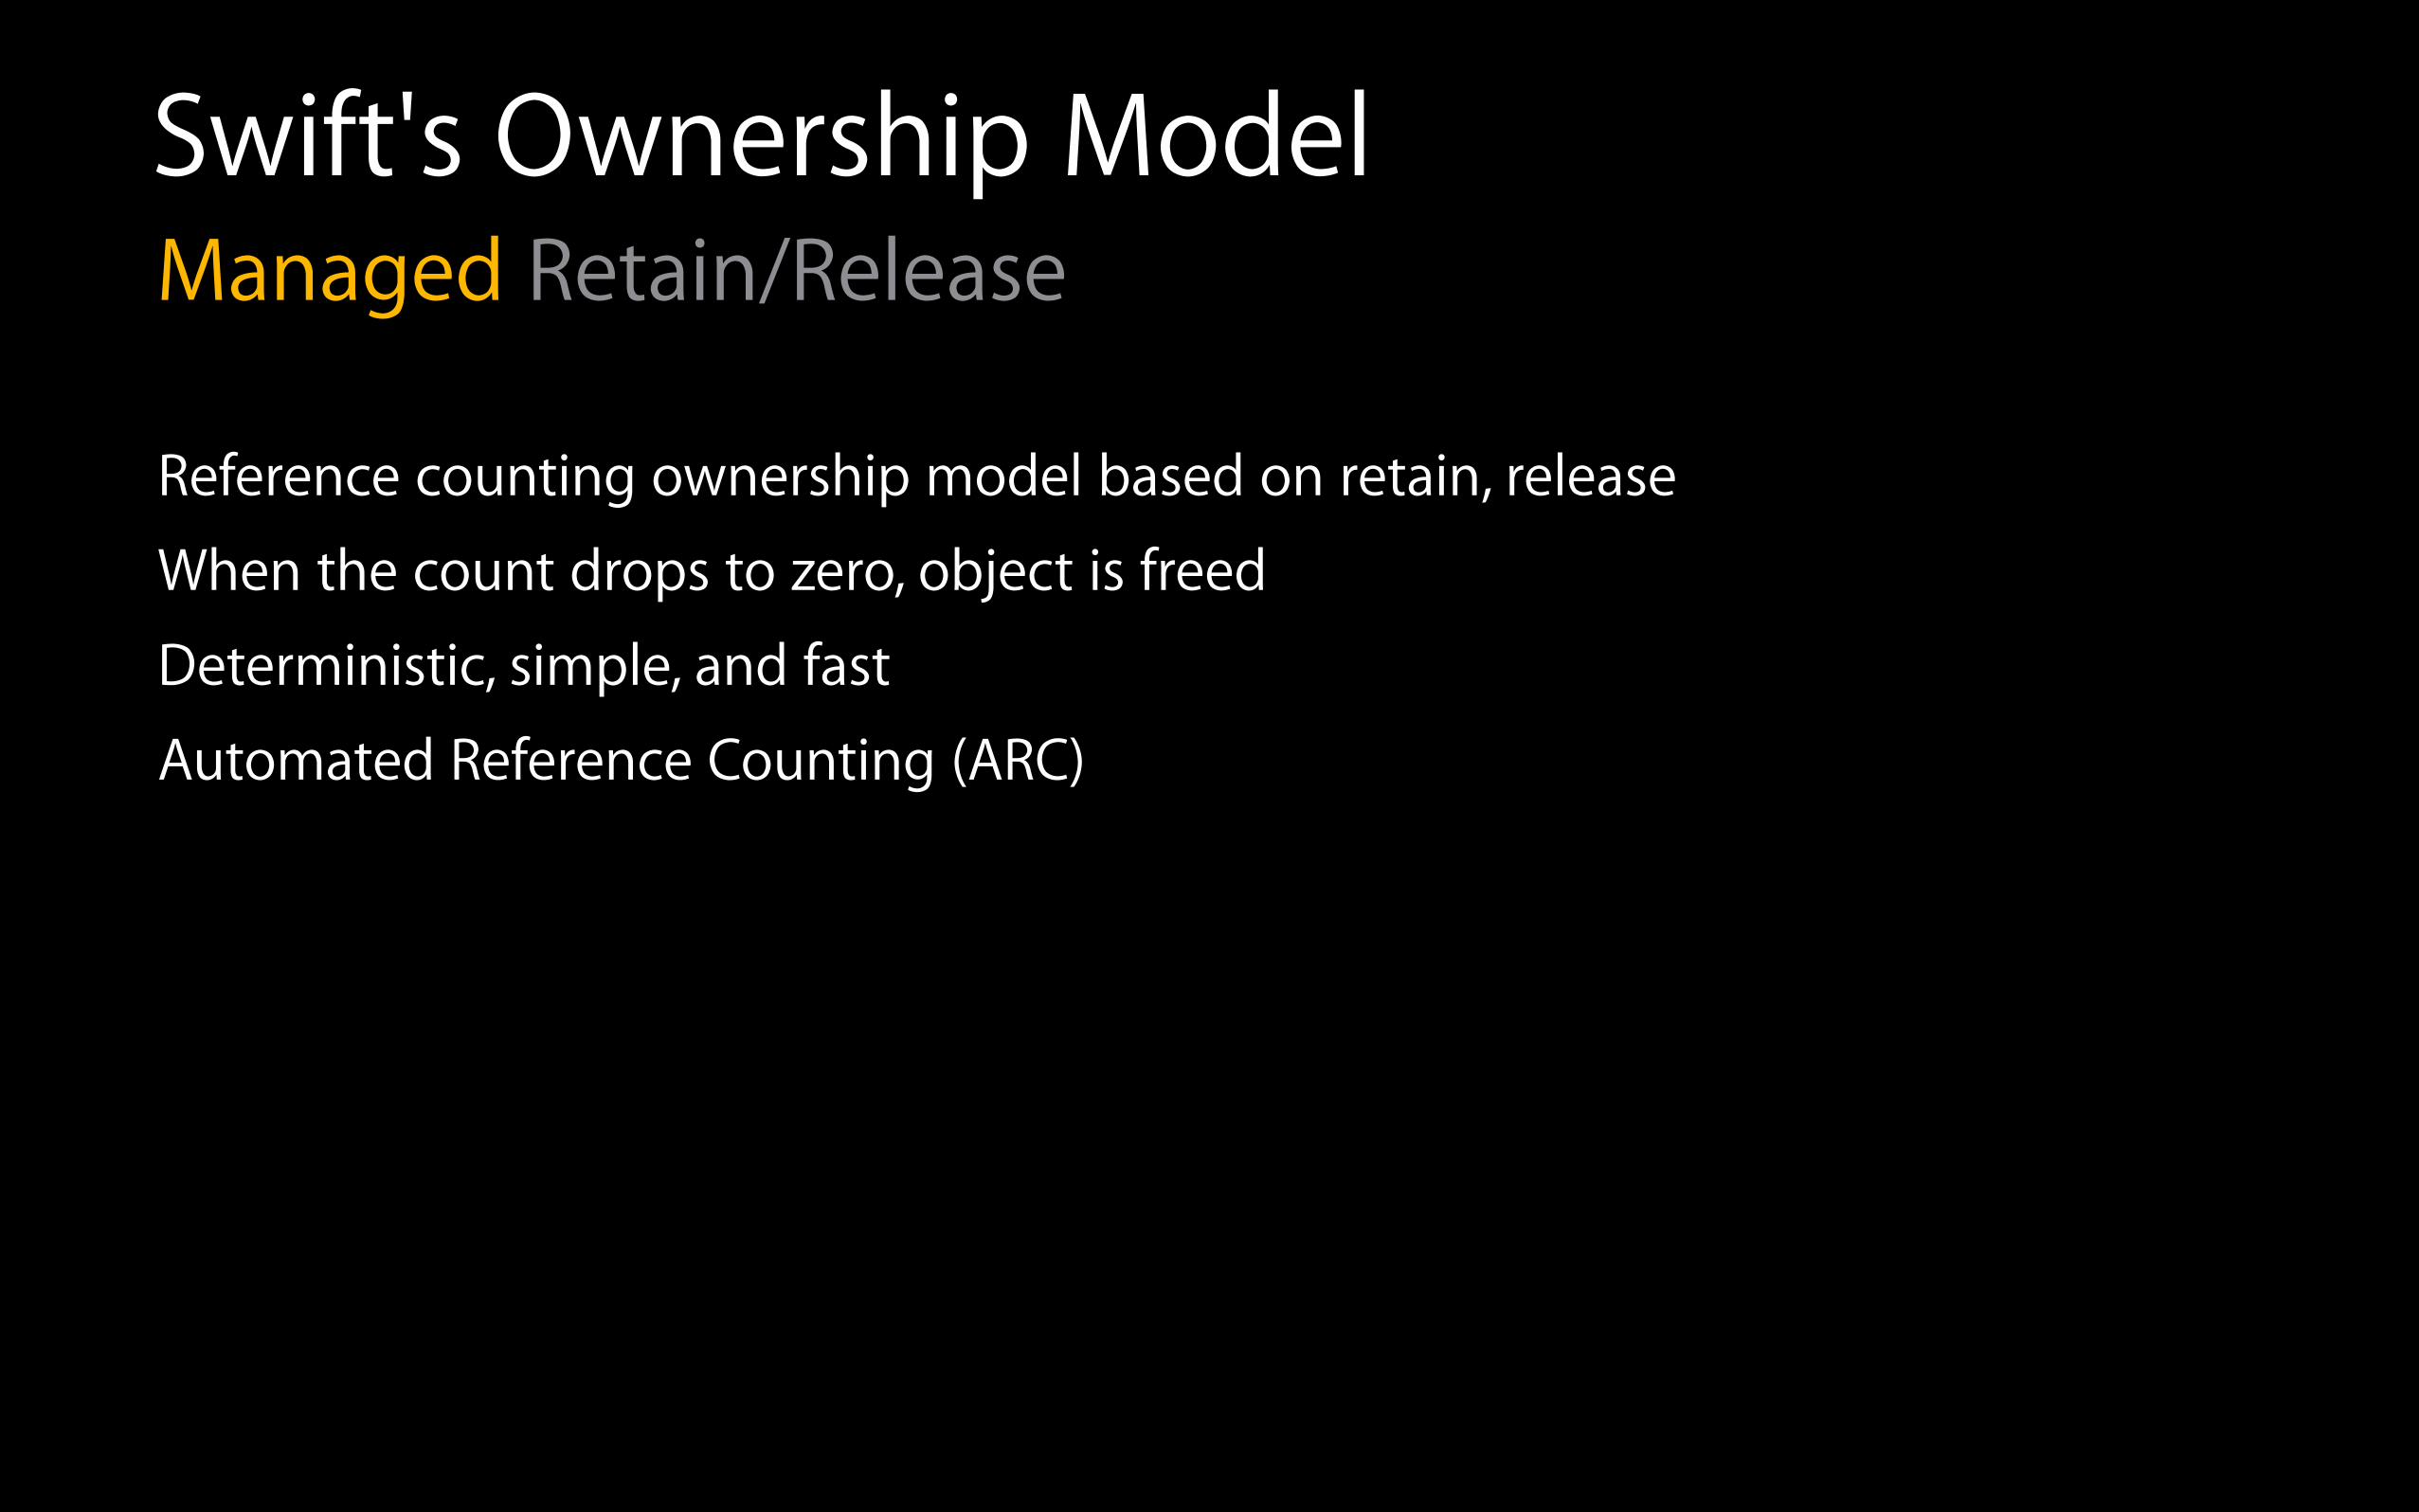
Swift's Ownership ModelManaged Retain/Release
Reference counting ownership model based on retain, release
When the count drops to zero, object is freed
Deterministic, simple, and fast
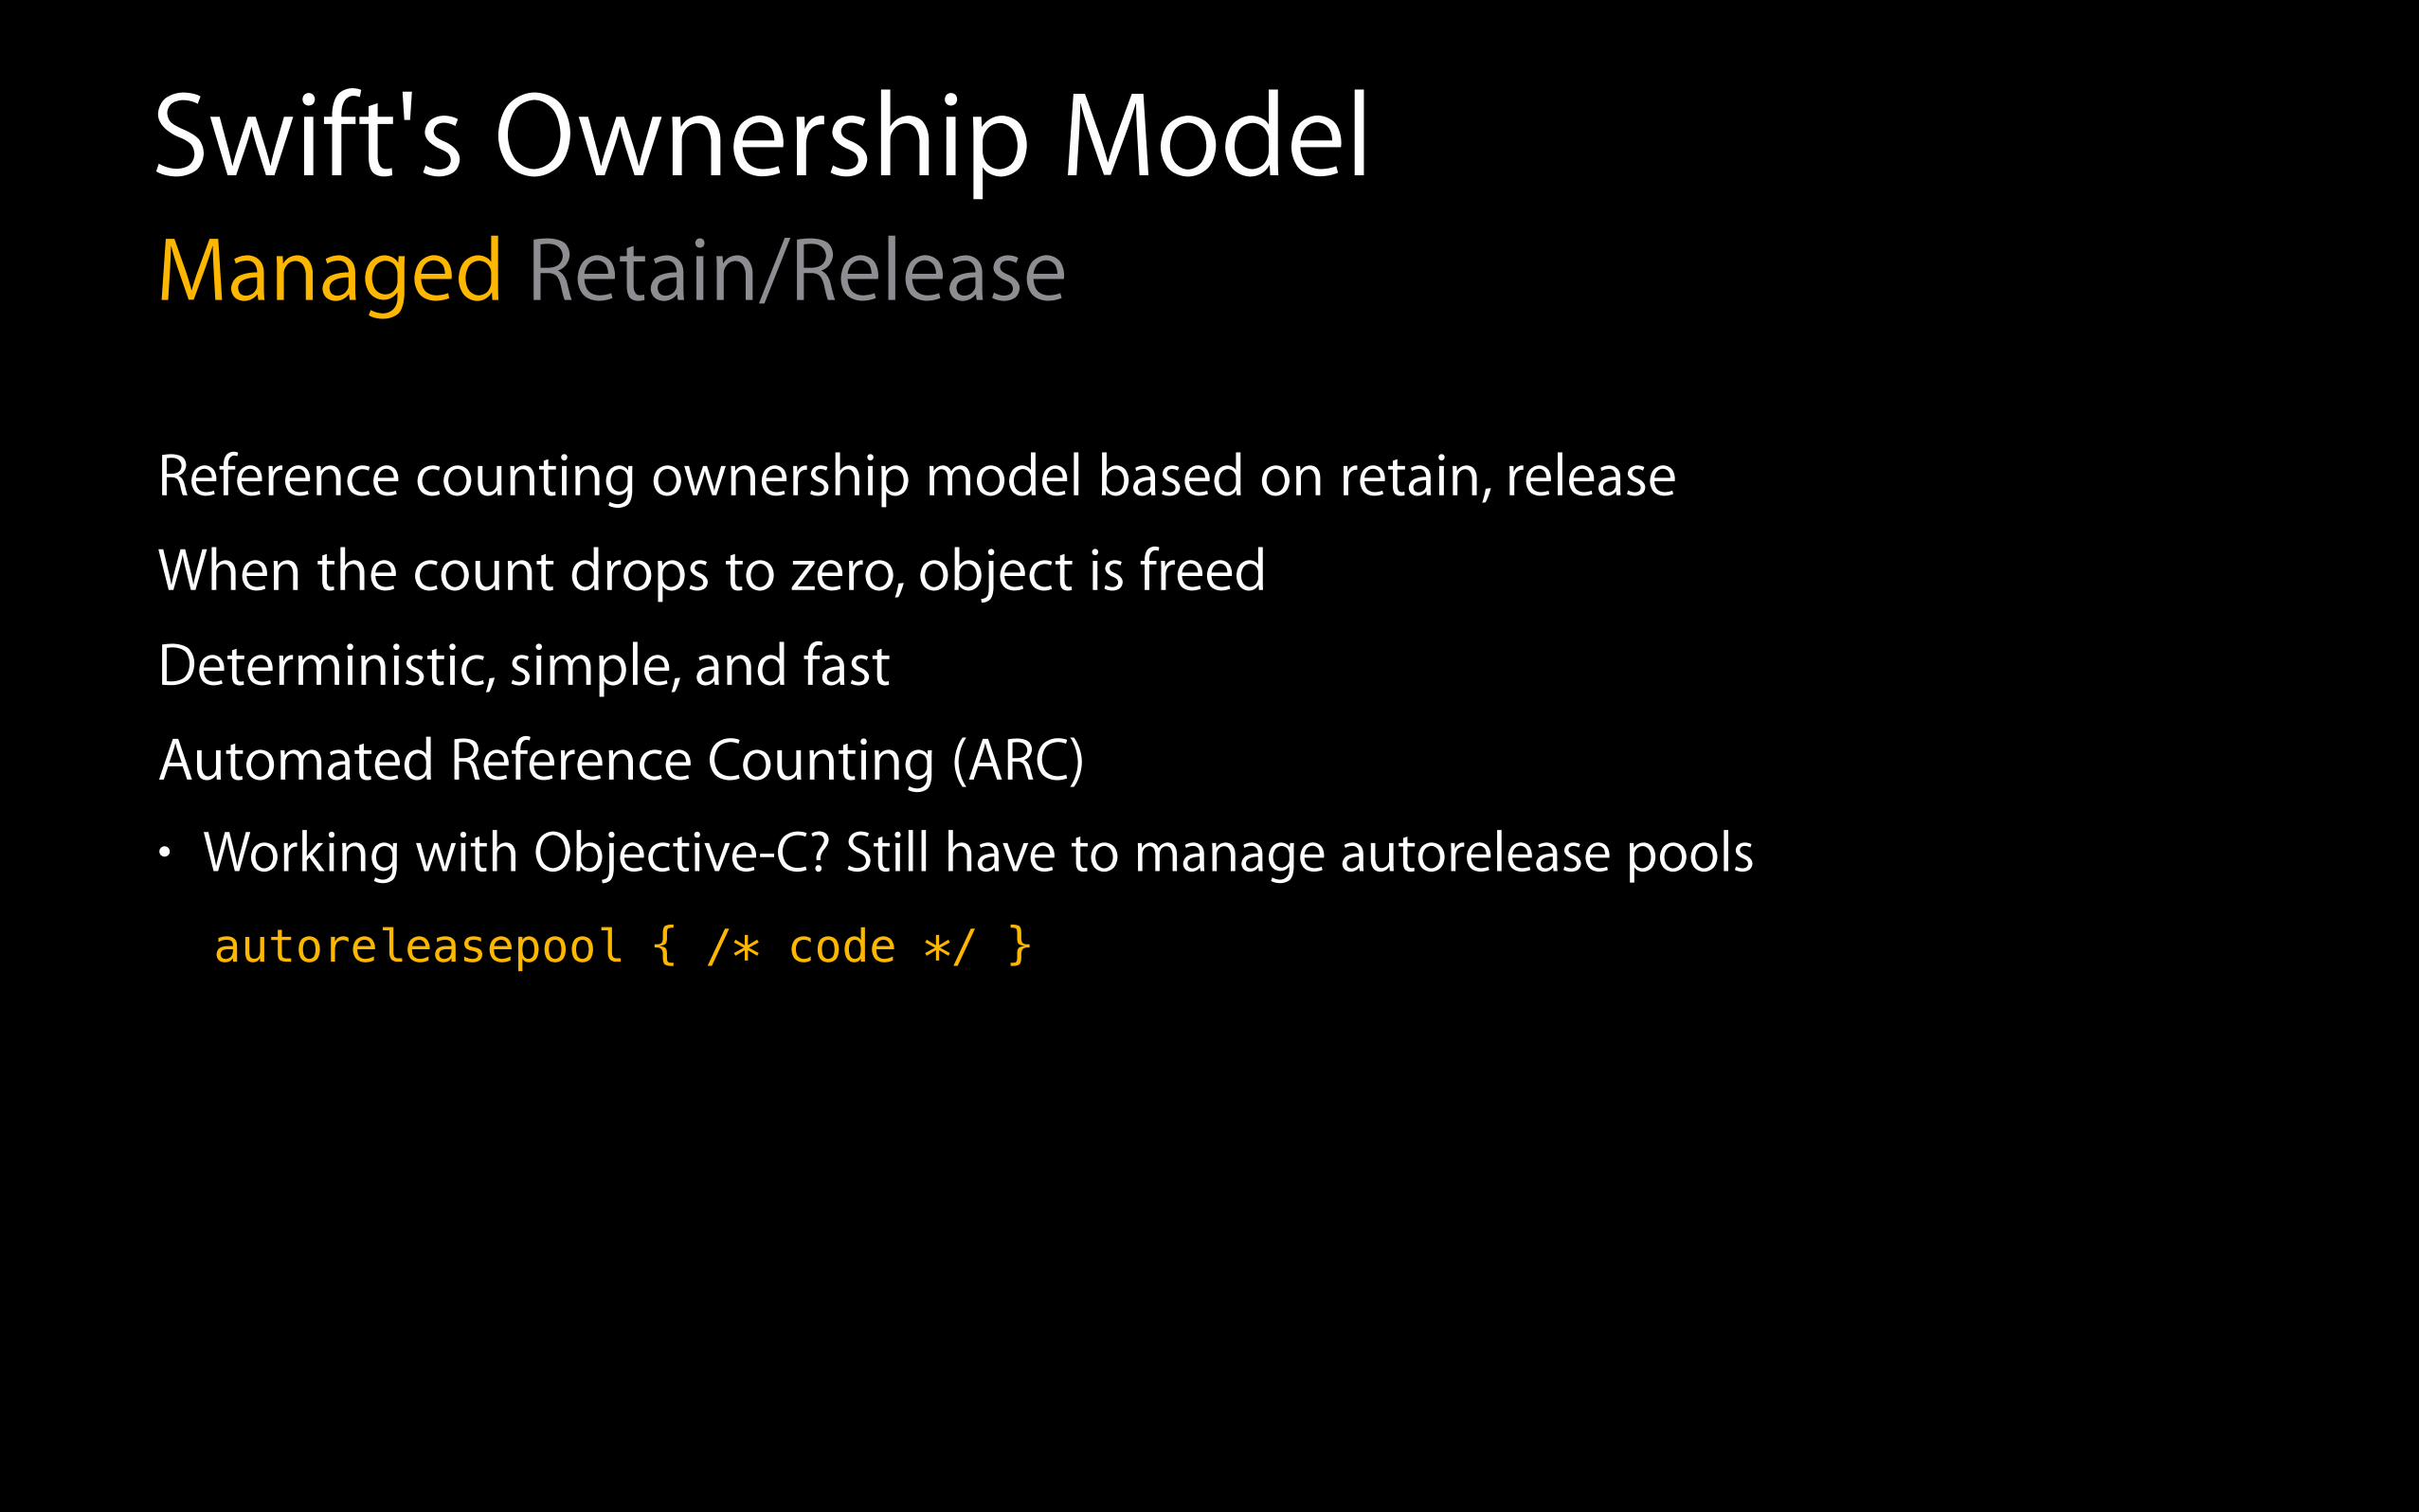
Automated Reference Counting (ARC)• Working with Objective-C? Still have to manage autorelease pools
autoreleasepool { /* code */ }
Swift's Ownership ModelManaged Retain/Release
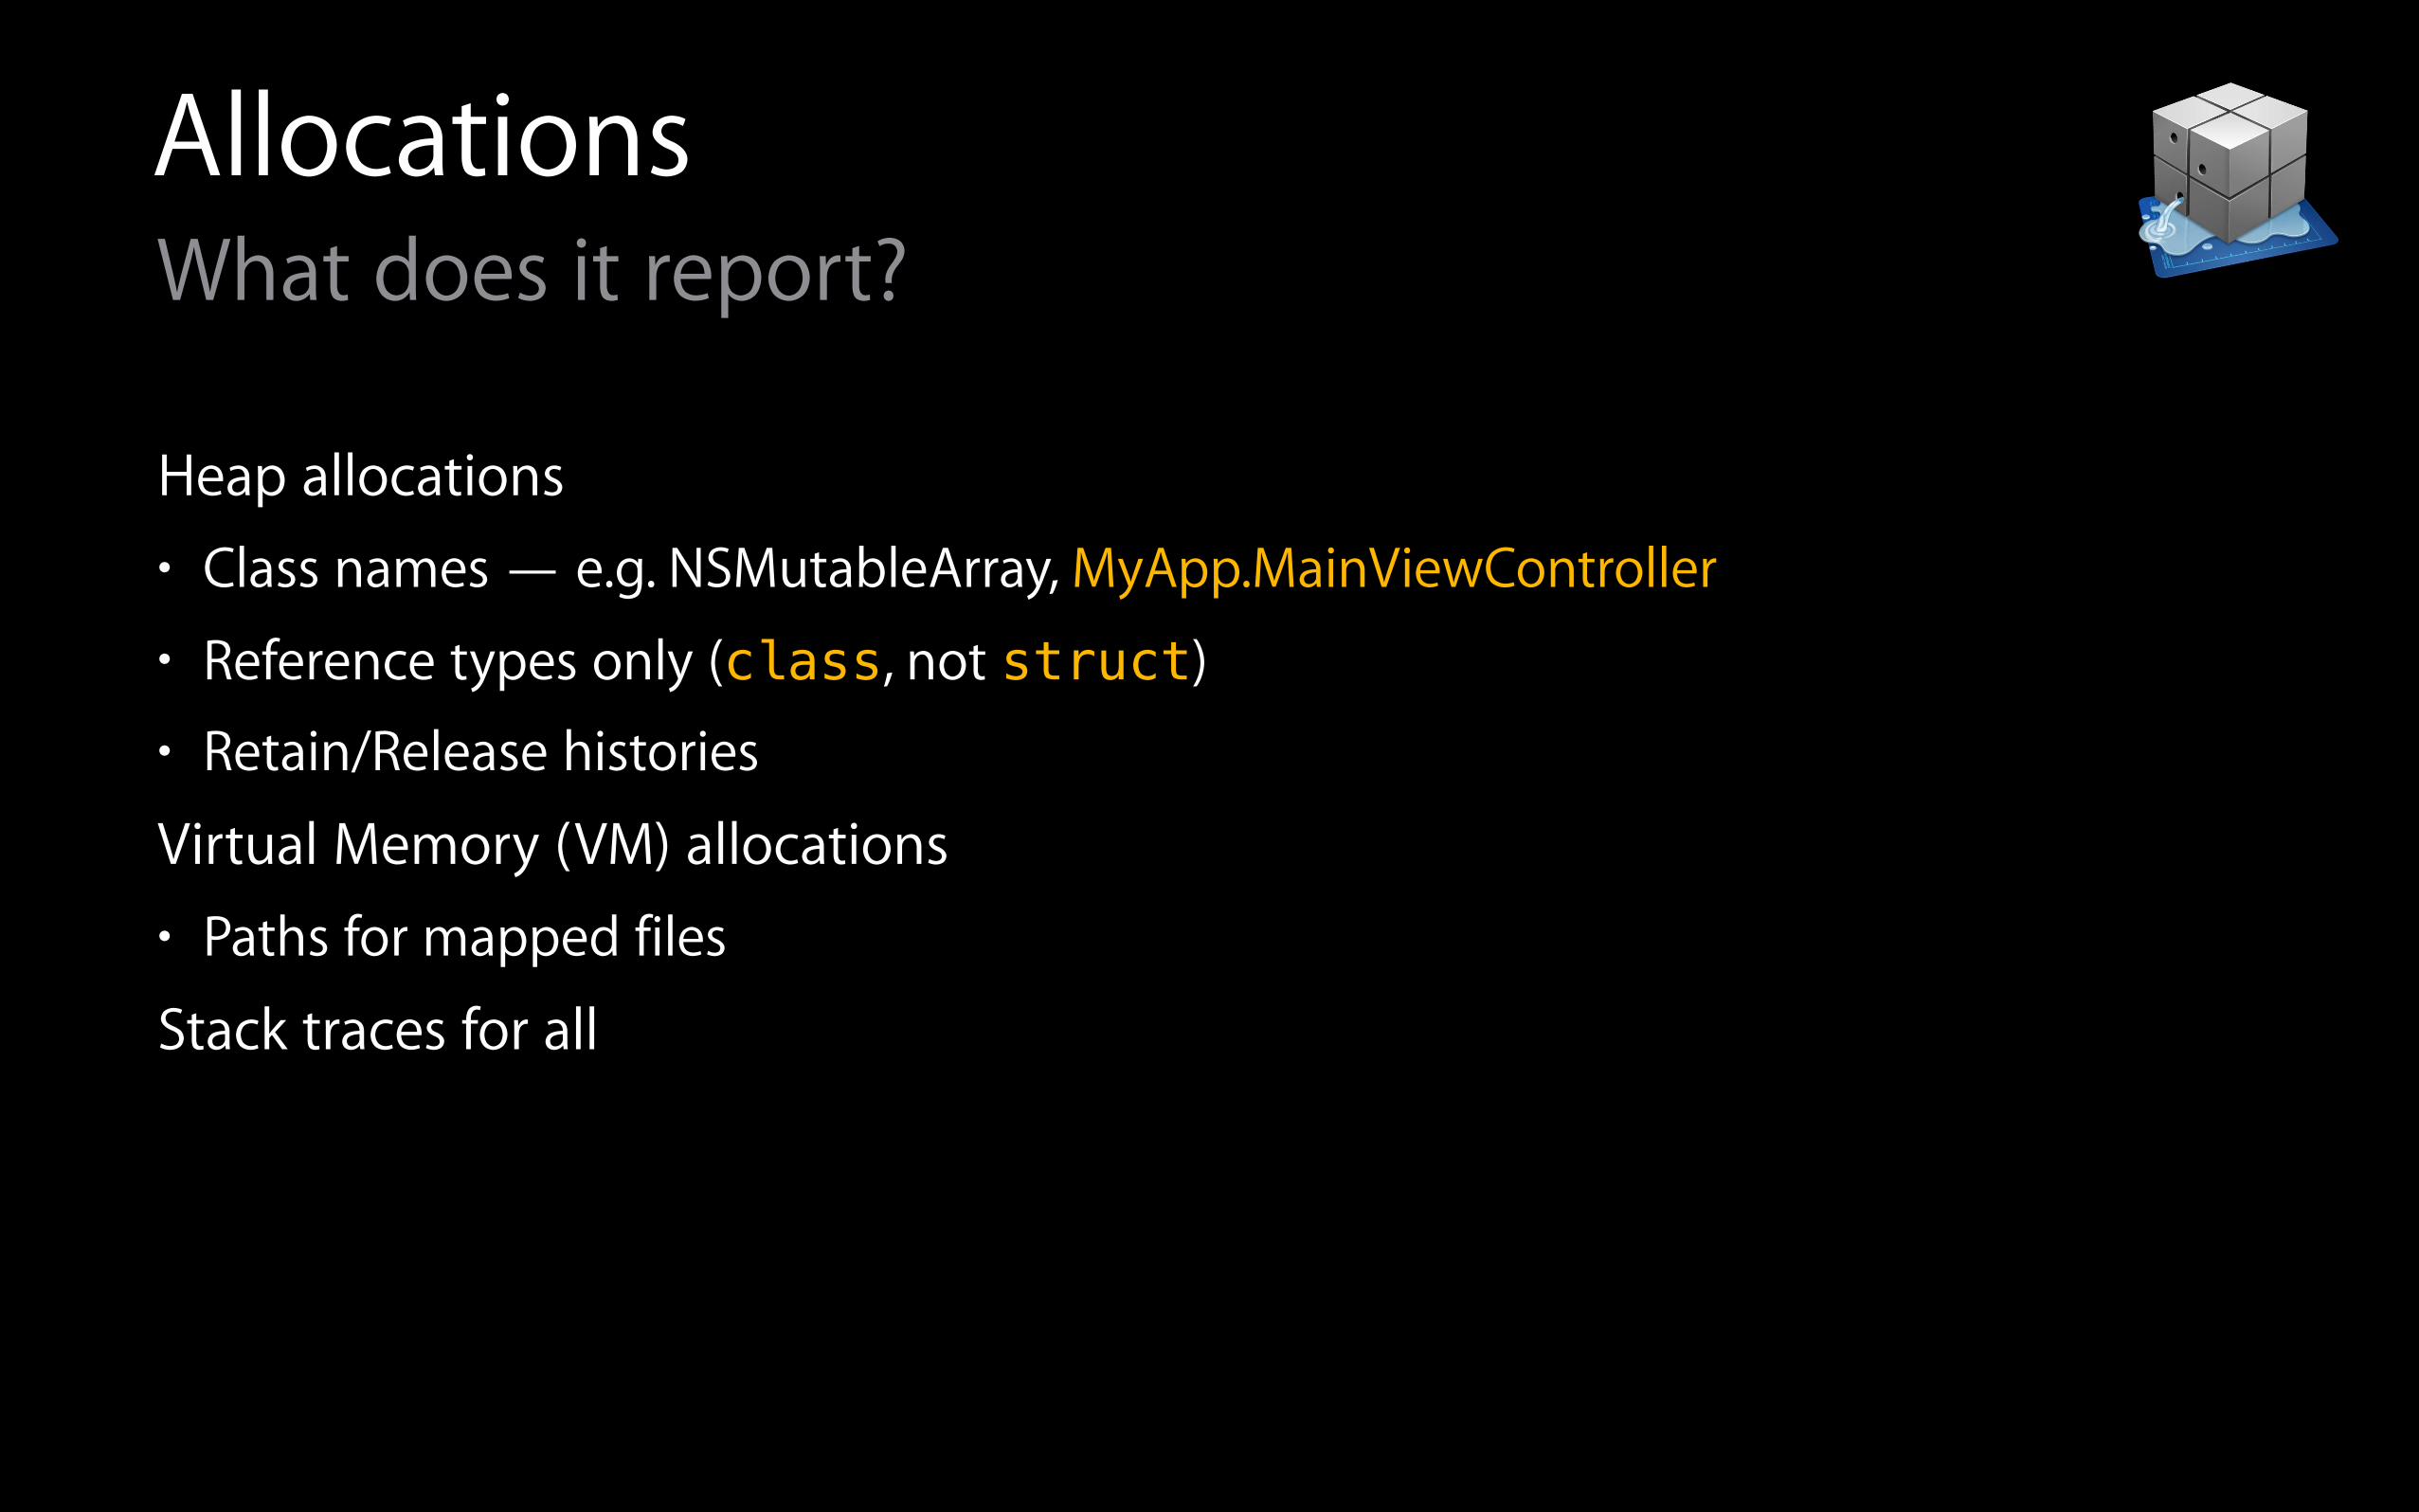
AllocationsWhat does it report?
Heap allocations • Class names — e.g. NSMutableArray, MyApp.MainViewController
• Reference types only (class, not struct)
• Retain/Release histories
Virtual Memory (VM) allocations • Paths for mapped files
Stack traces for all
DemoAllocations + App Extension E
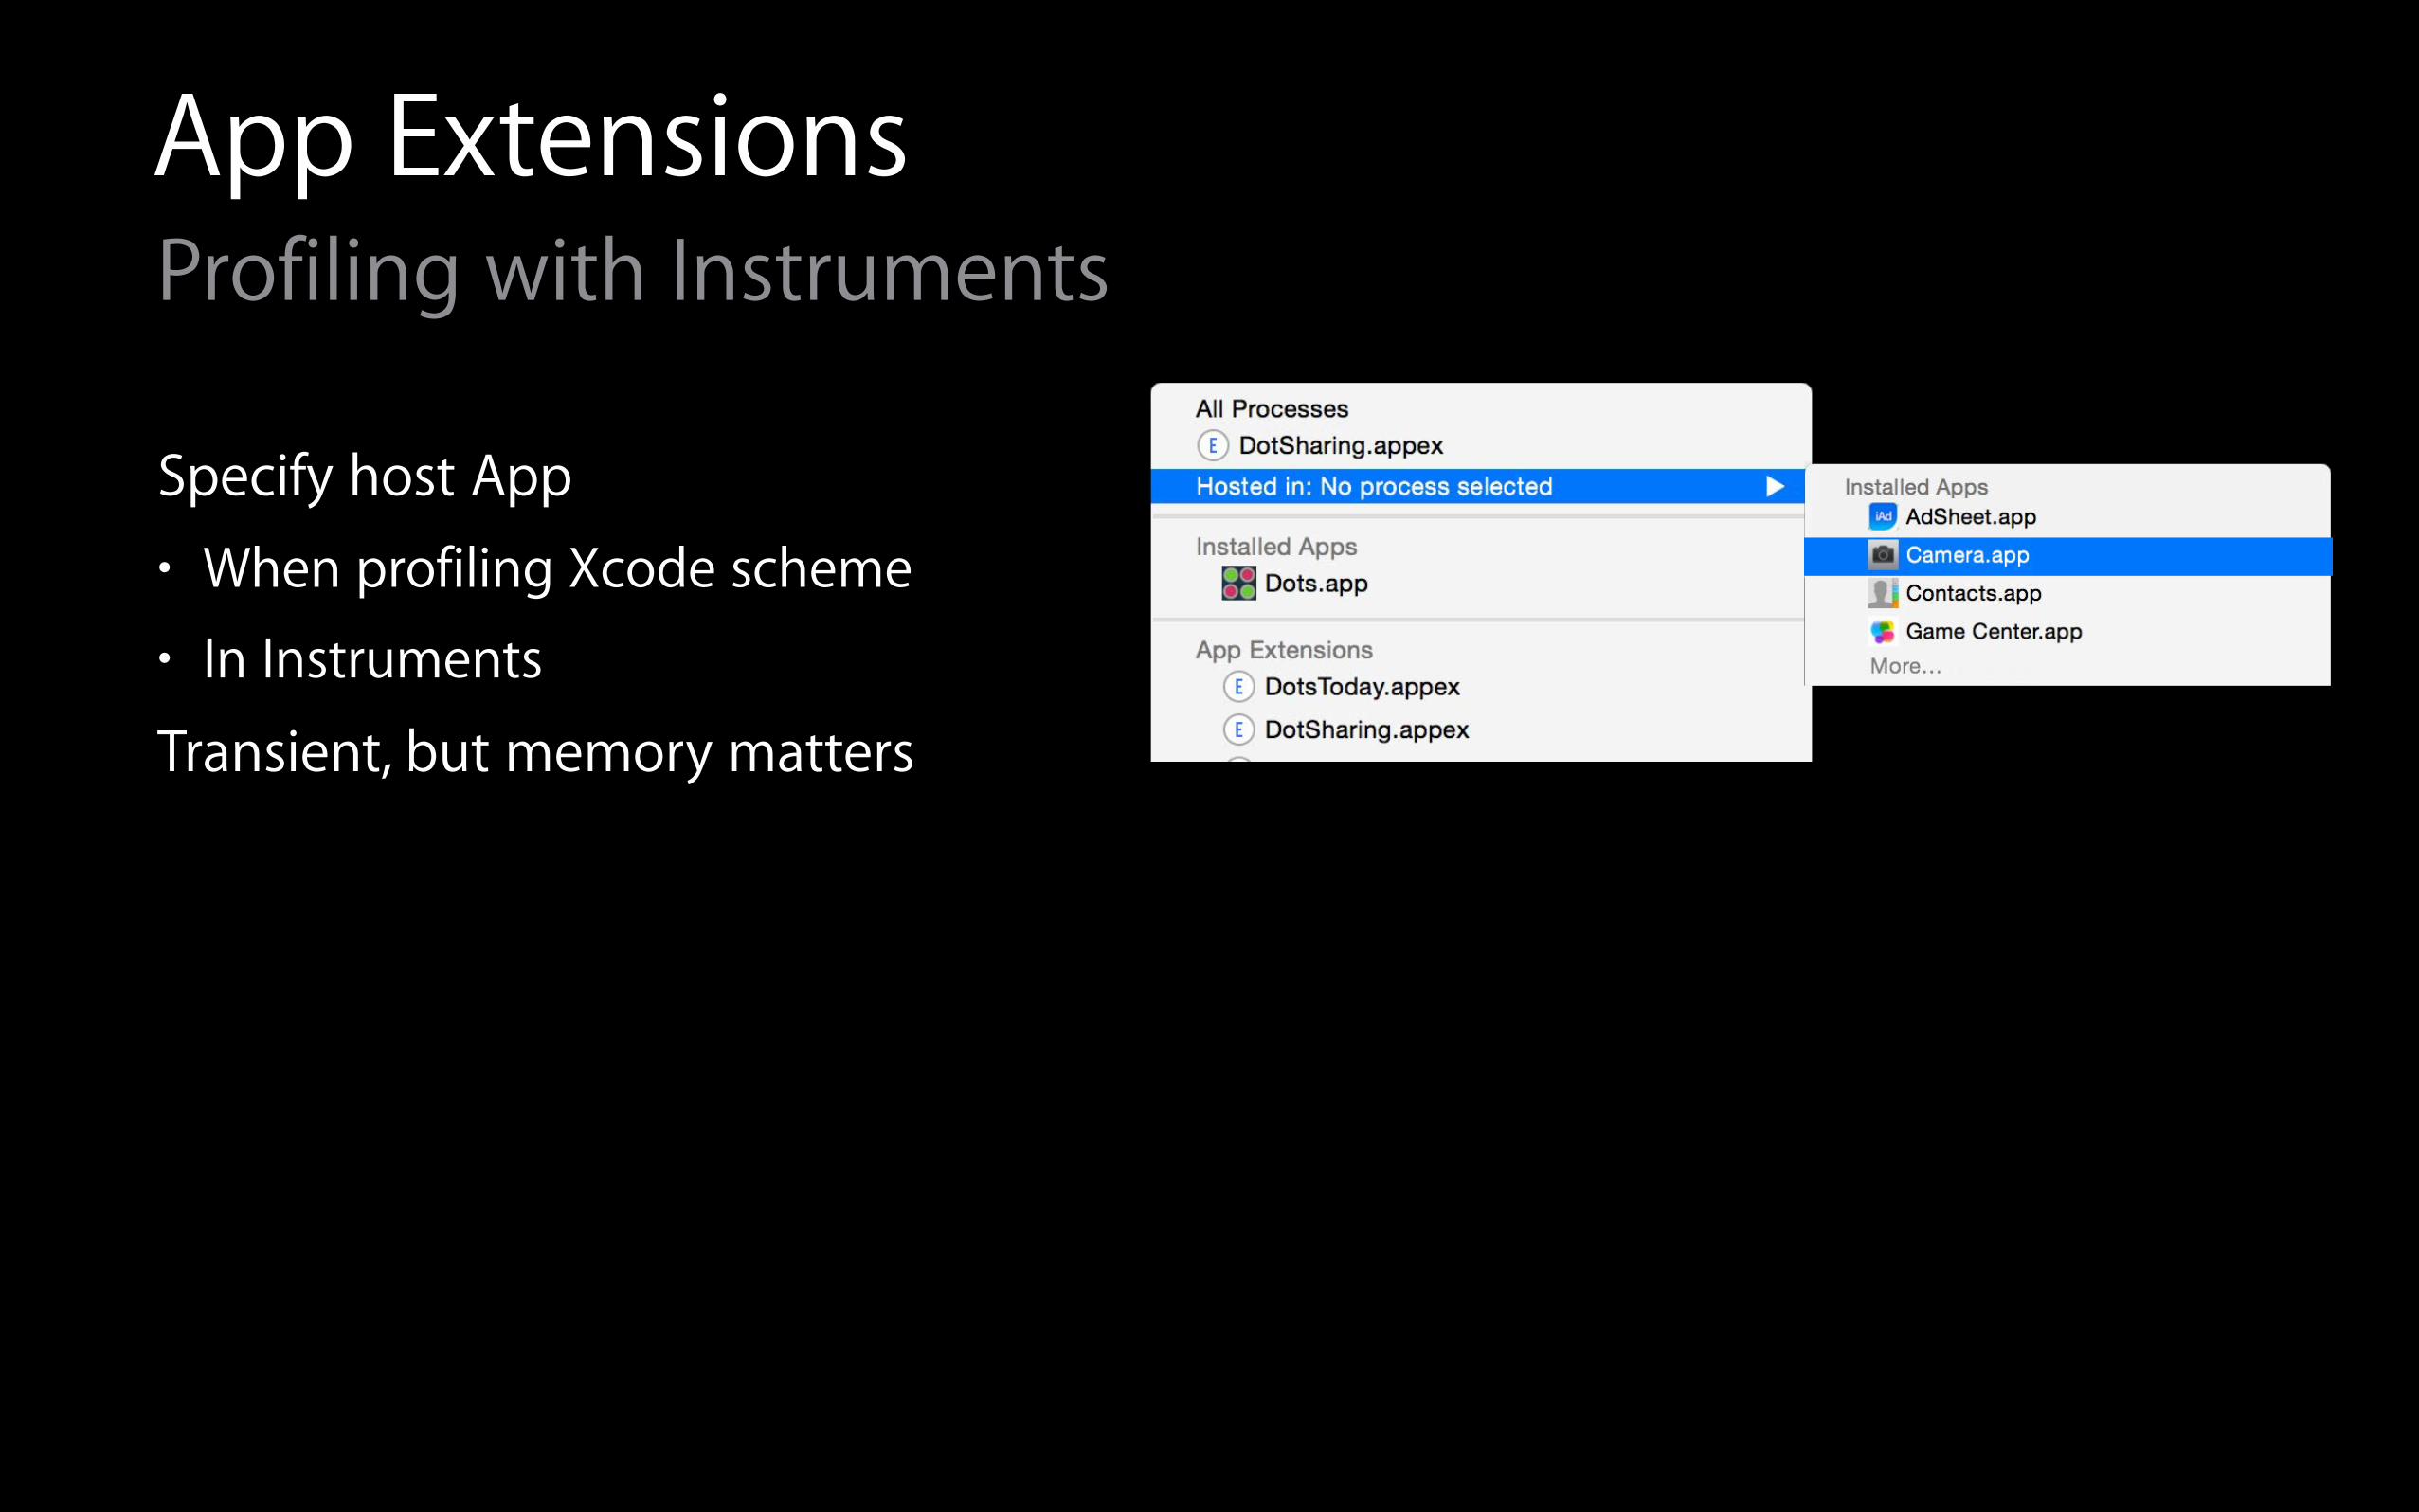
App ExtensionsProfiling with Instruments
Specify host App • When profiling Xcode scheme
• In Instruments
Transient, but memory matters
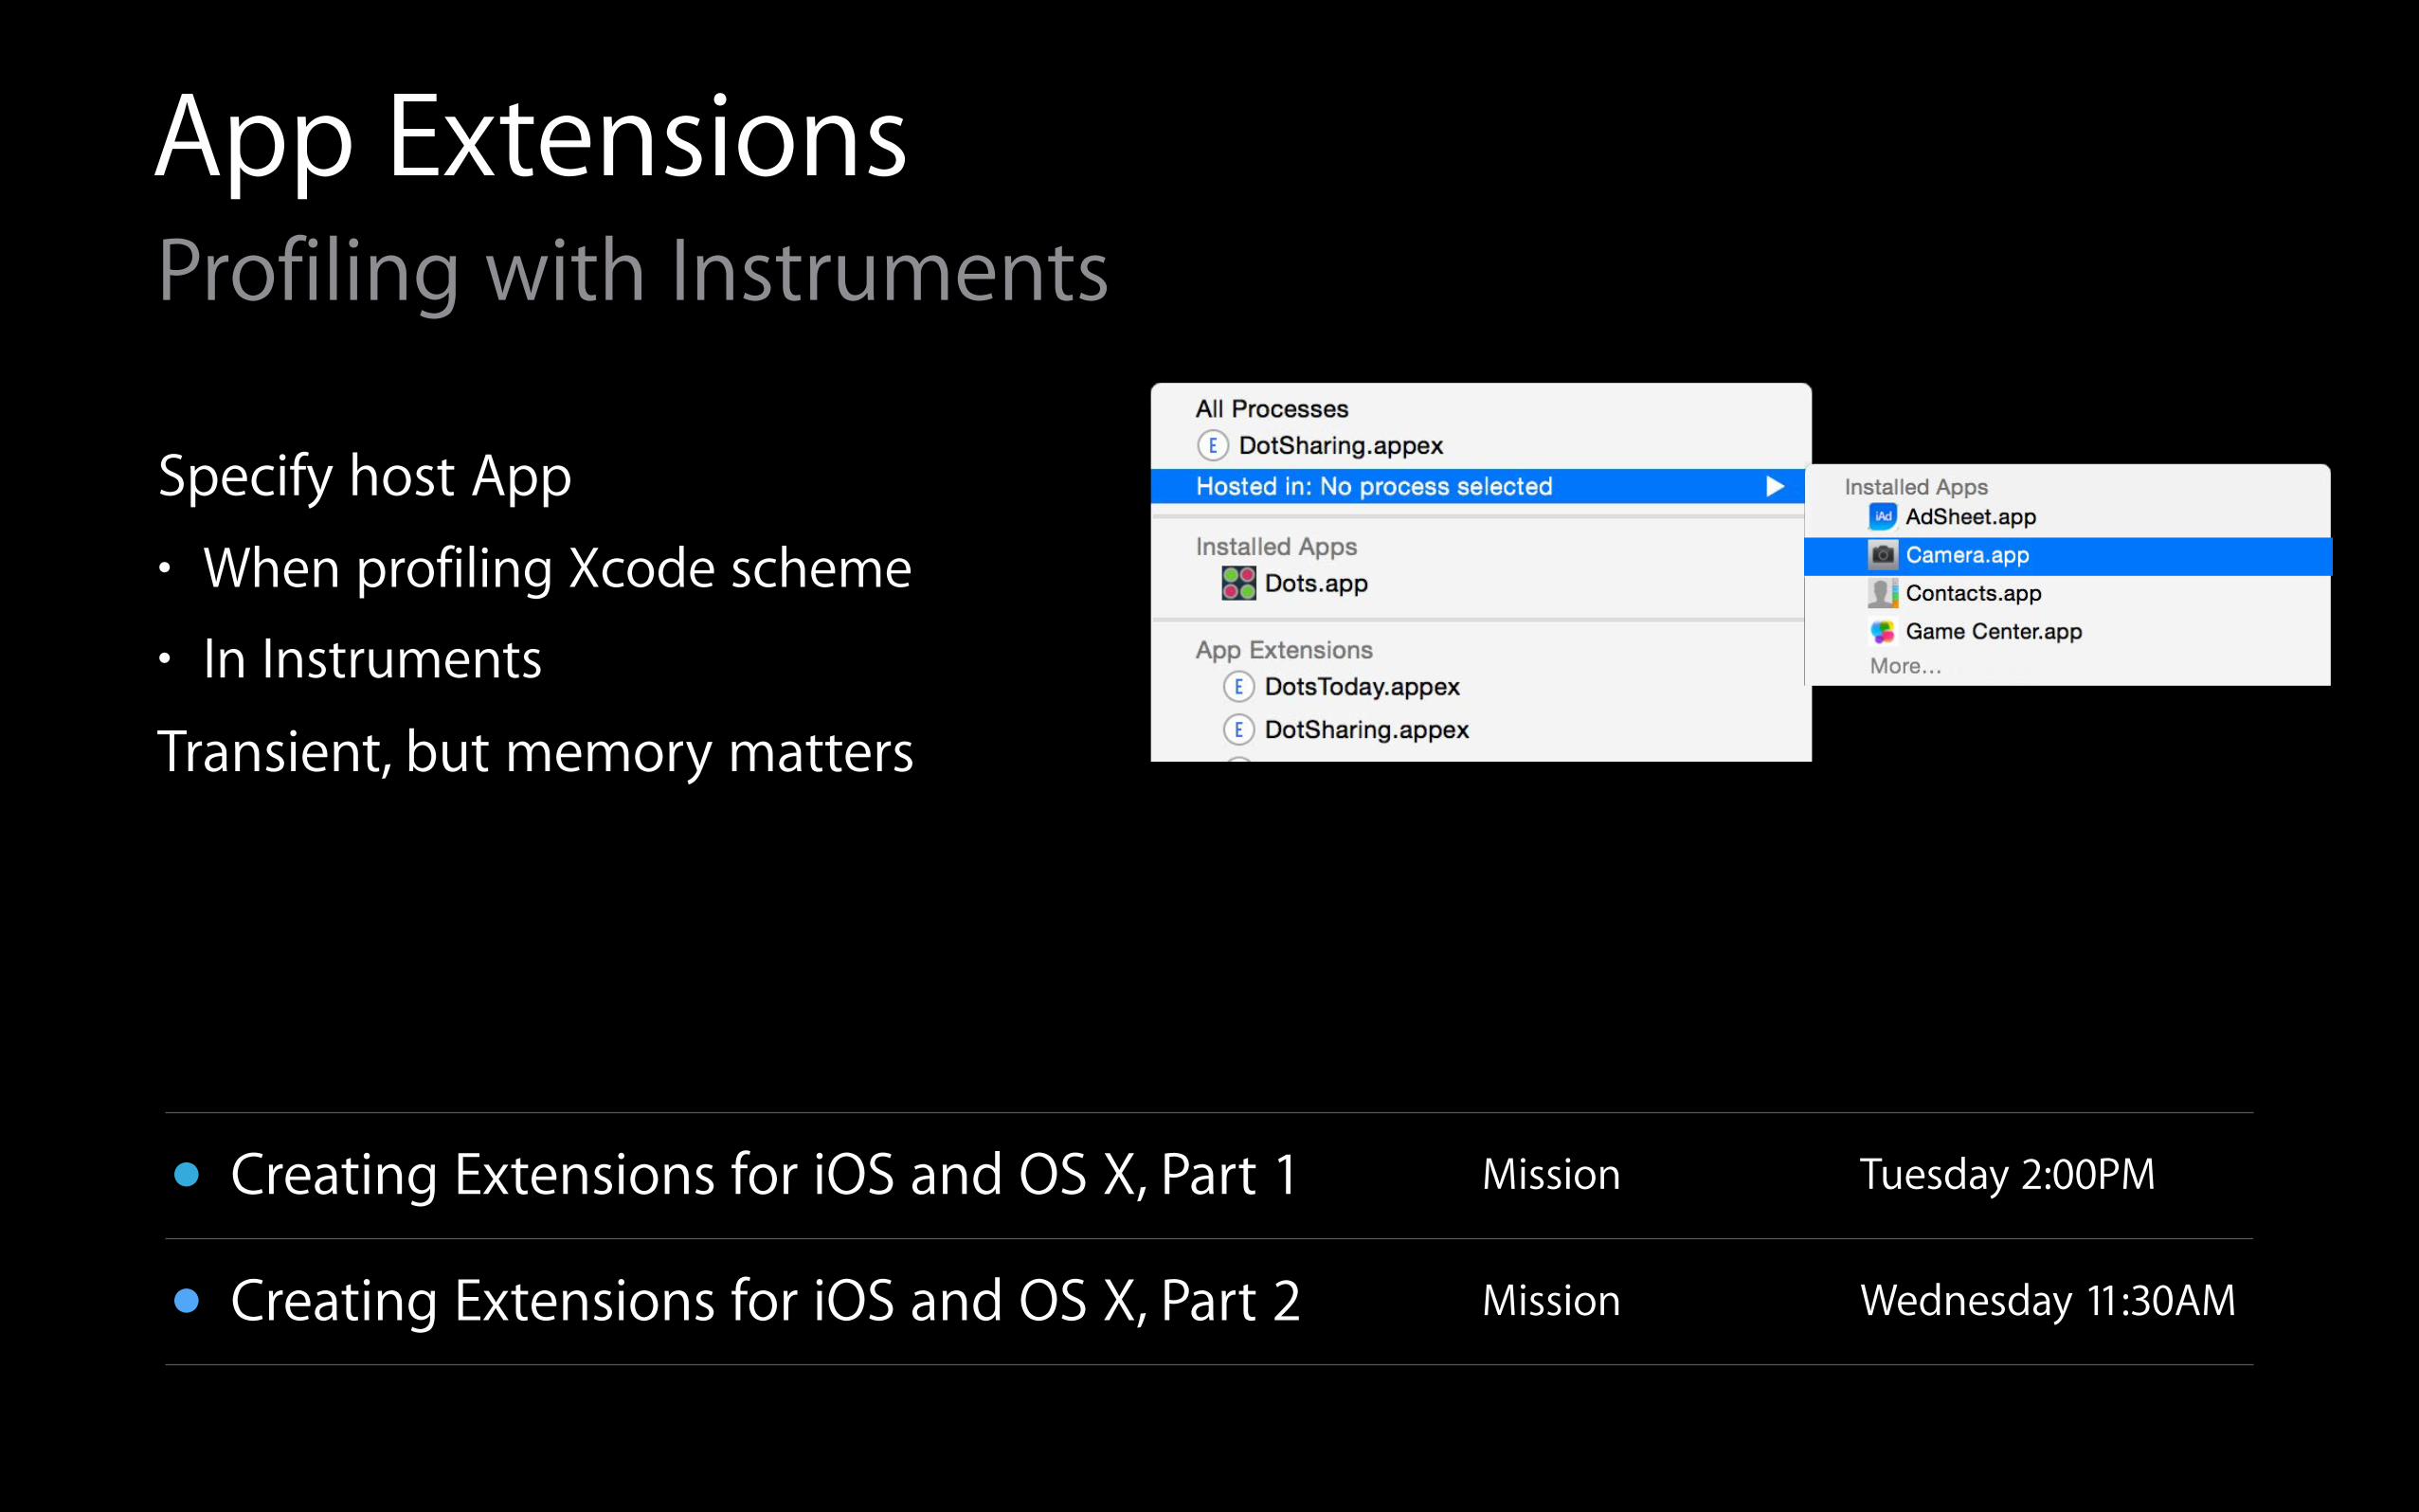
App ExtensionsProfiling with Instruments
Specify host App • When profiling Xcode scheme
• In Instruments
Transient, but memory matters
• Creating Extensions for iOS and OS X, Part 1 Mission Tuesday 2:00PM
• Creating Extensions for iOS and OS X, Part 2 Mission Wednesday 11:30AM
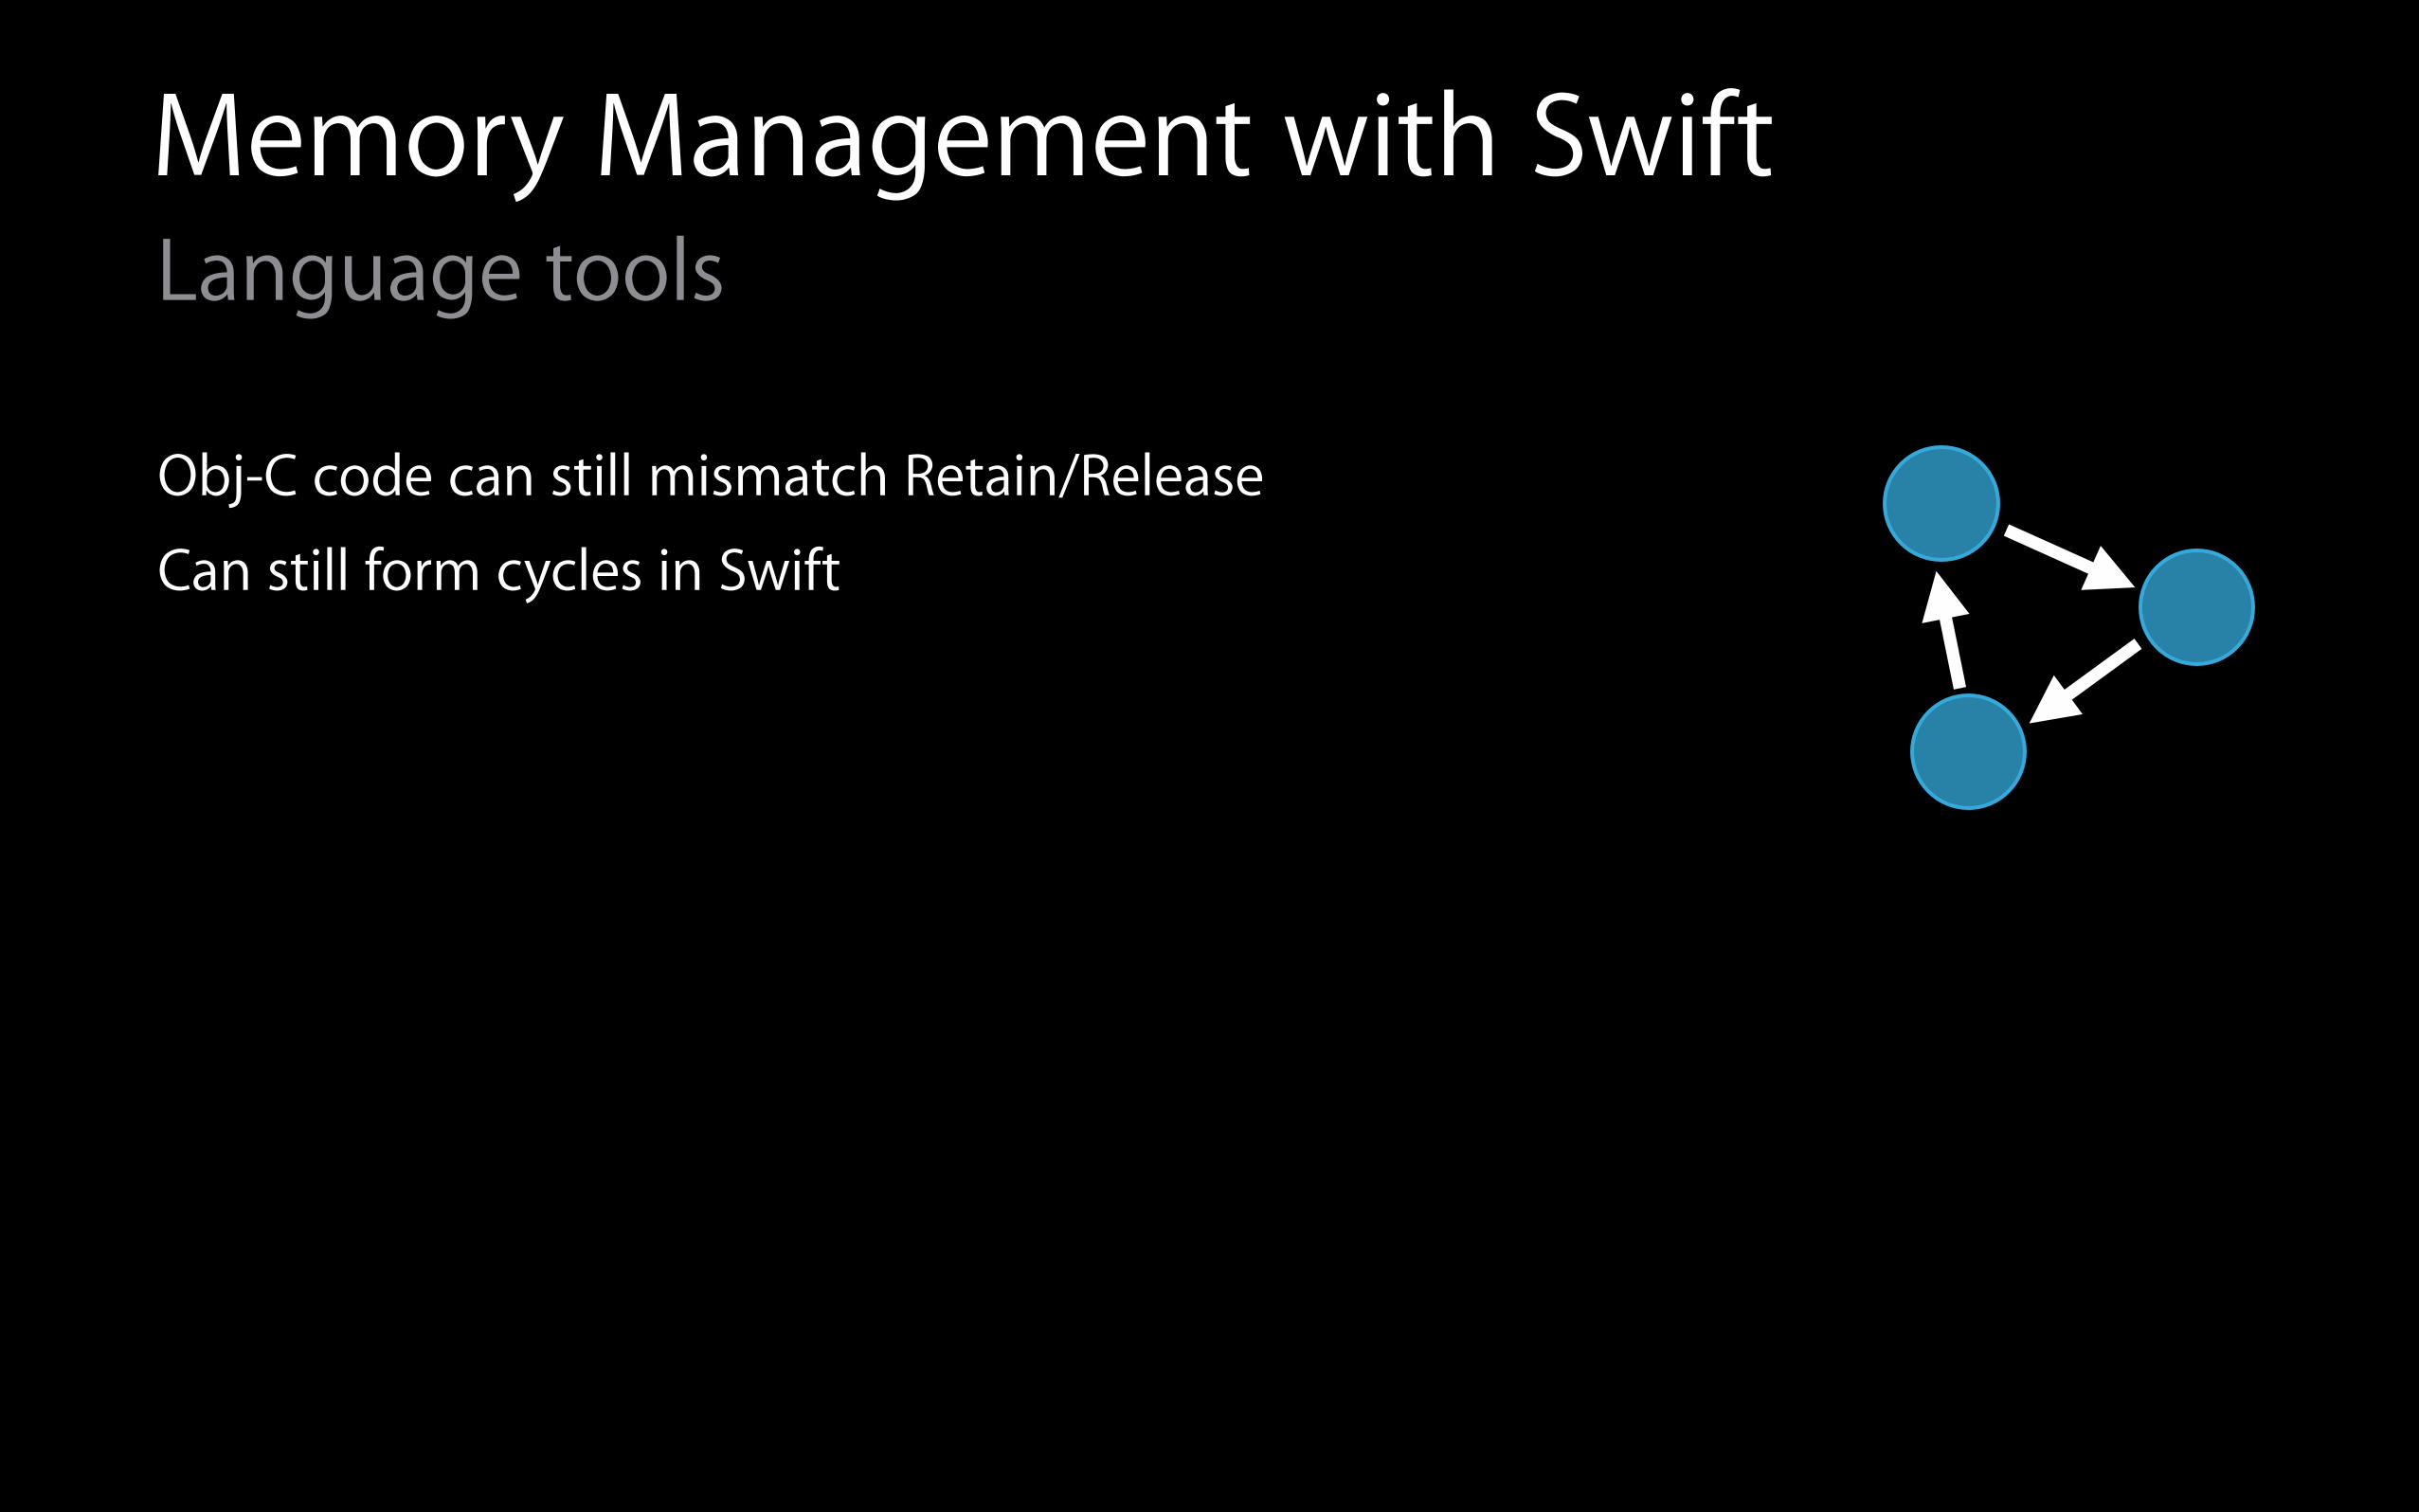
Memory Management with SwiftLanguage tools
Obj-C code can still mismatch Retain/Release
Can still form cycles in Swift
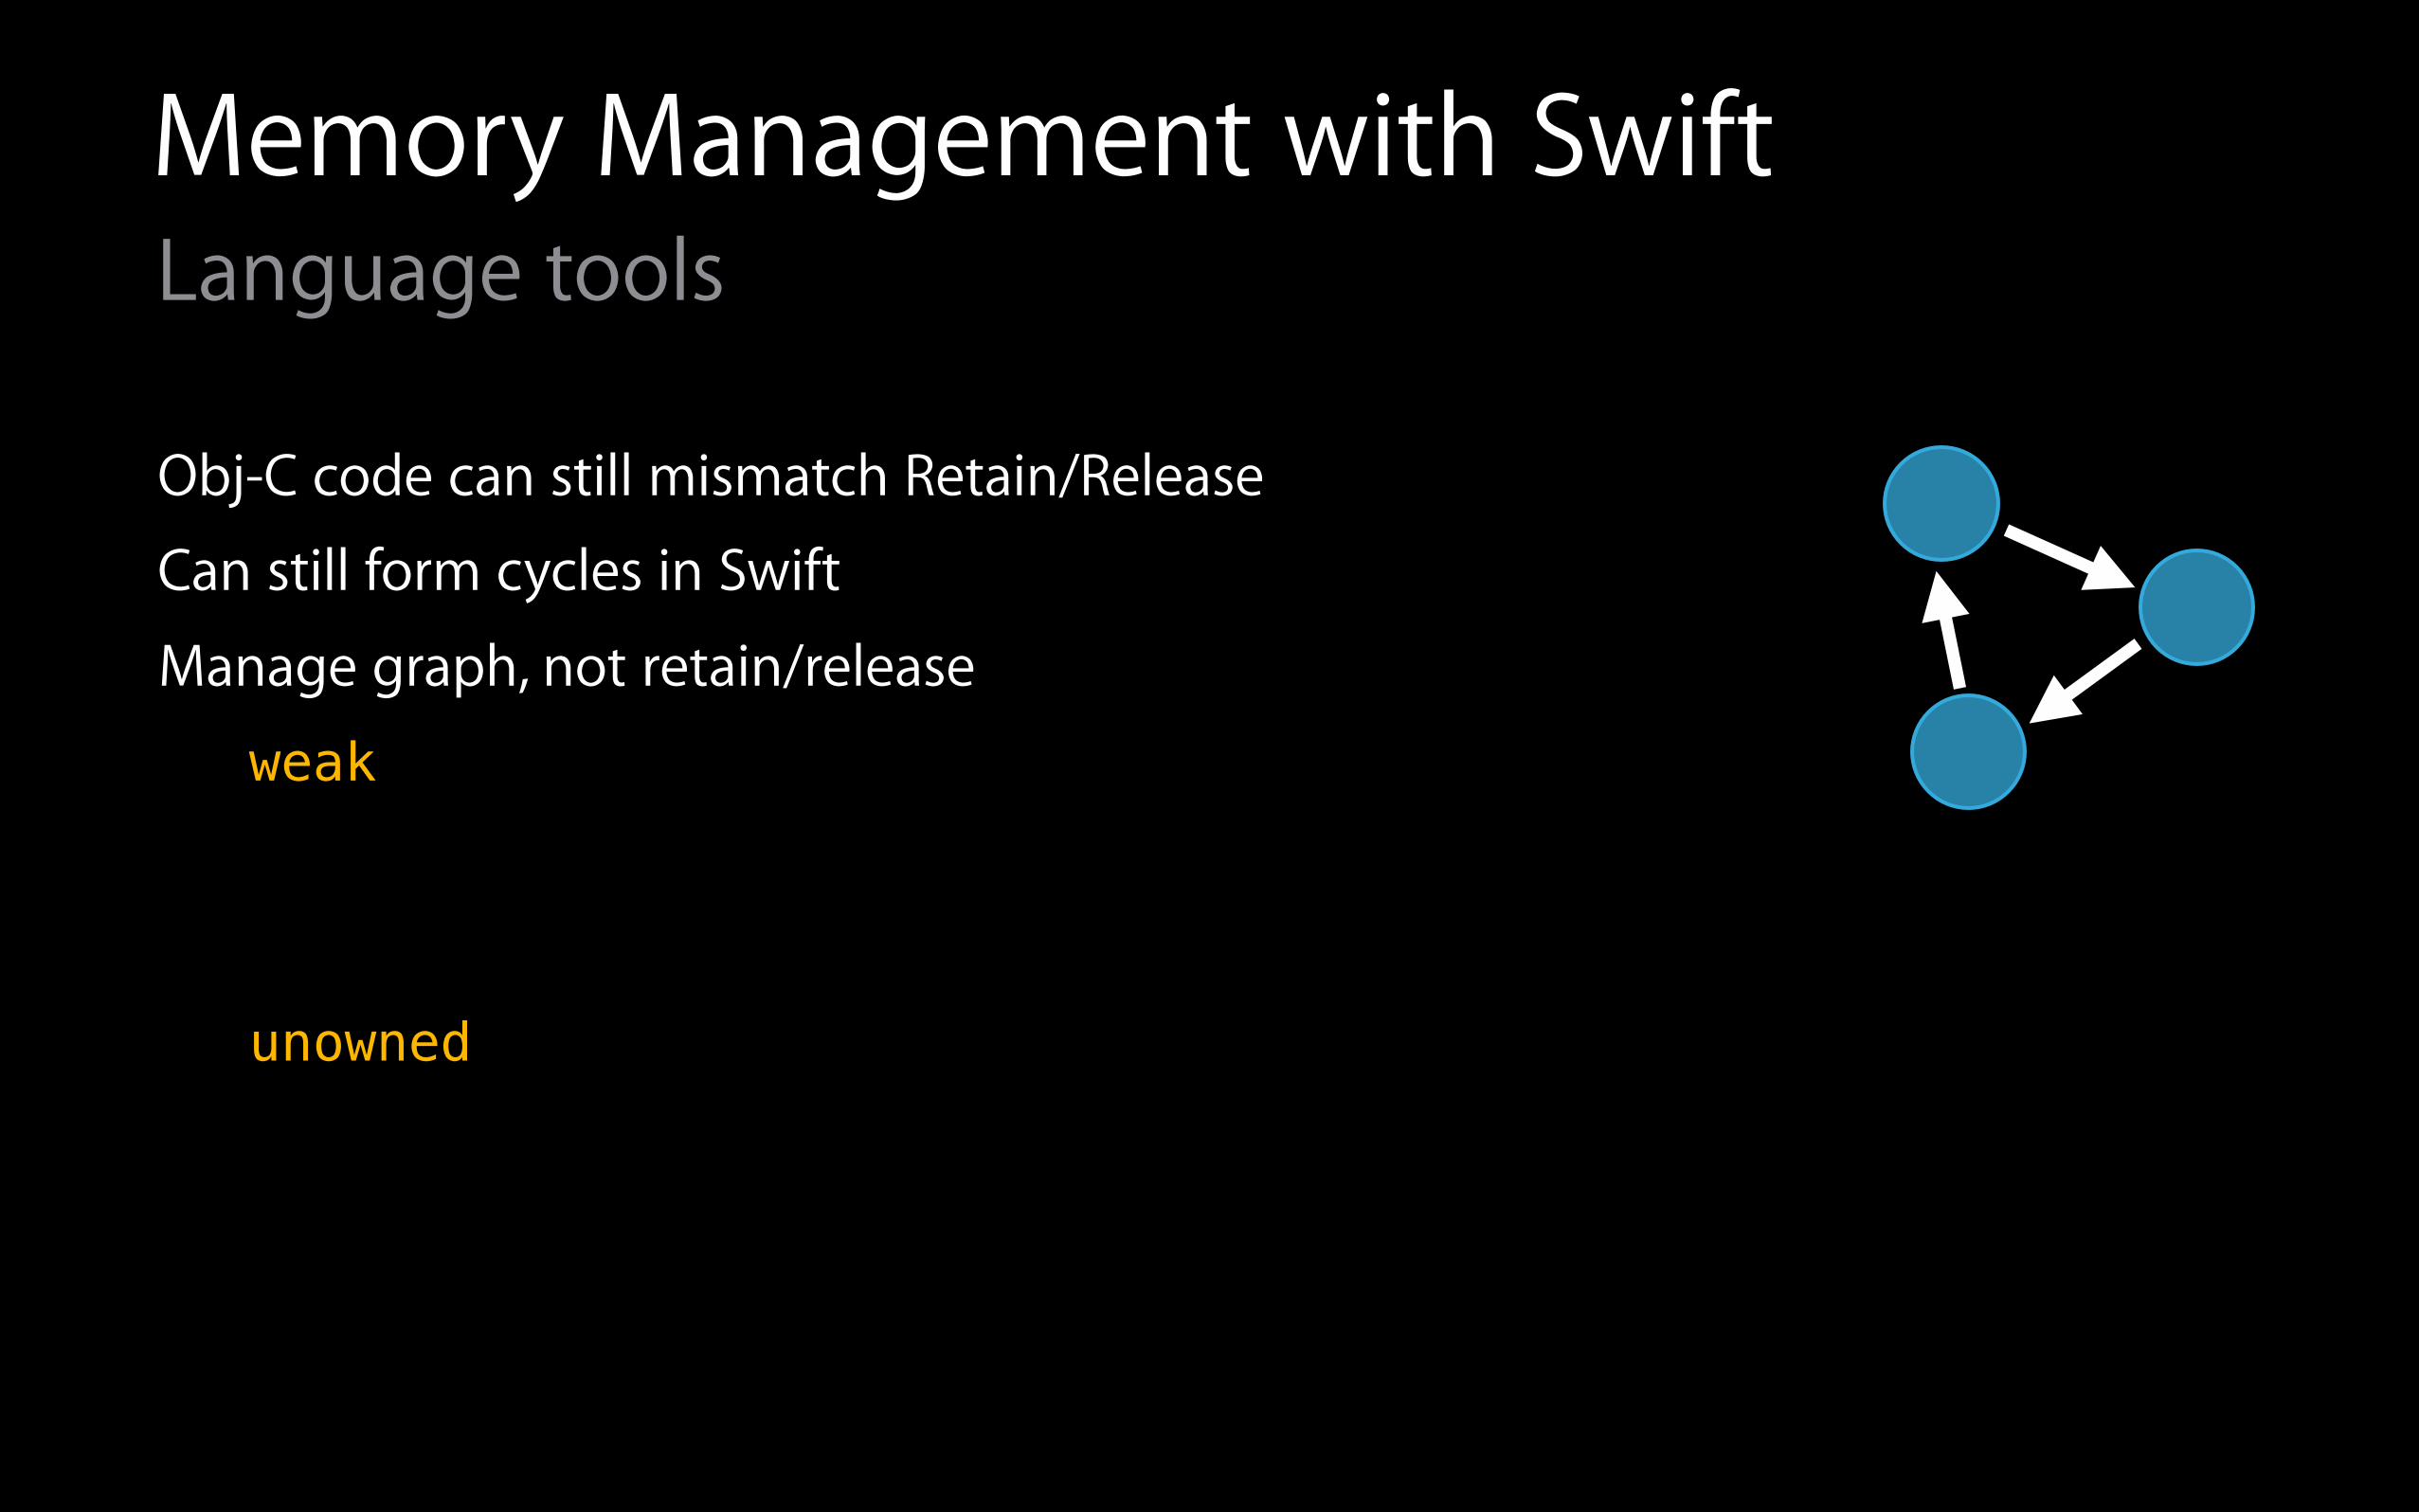
Memory Management with SwiftLanguage tools
Obj-C code can still mismatch Retain/Release
Can still form cycles in Swift
Manage graph, not retain/release
weak !
!
unowned
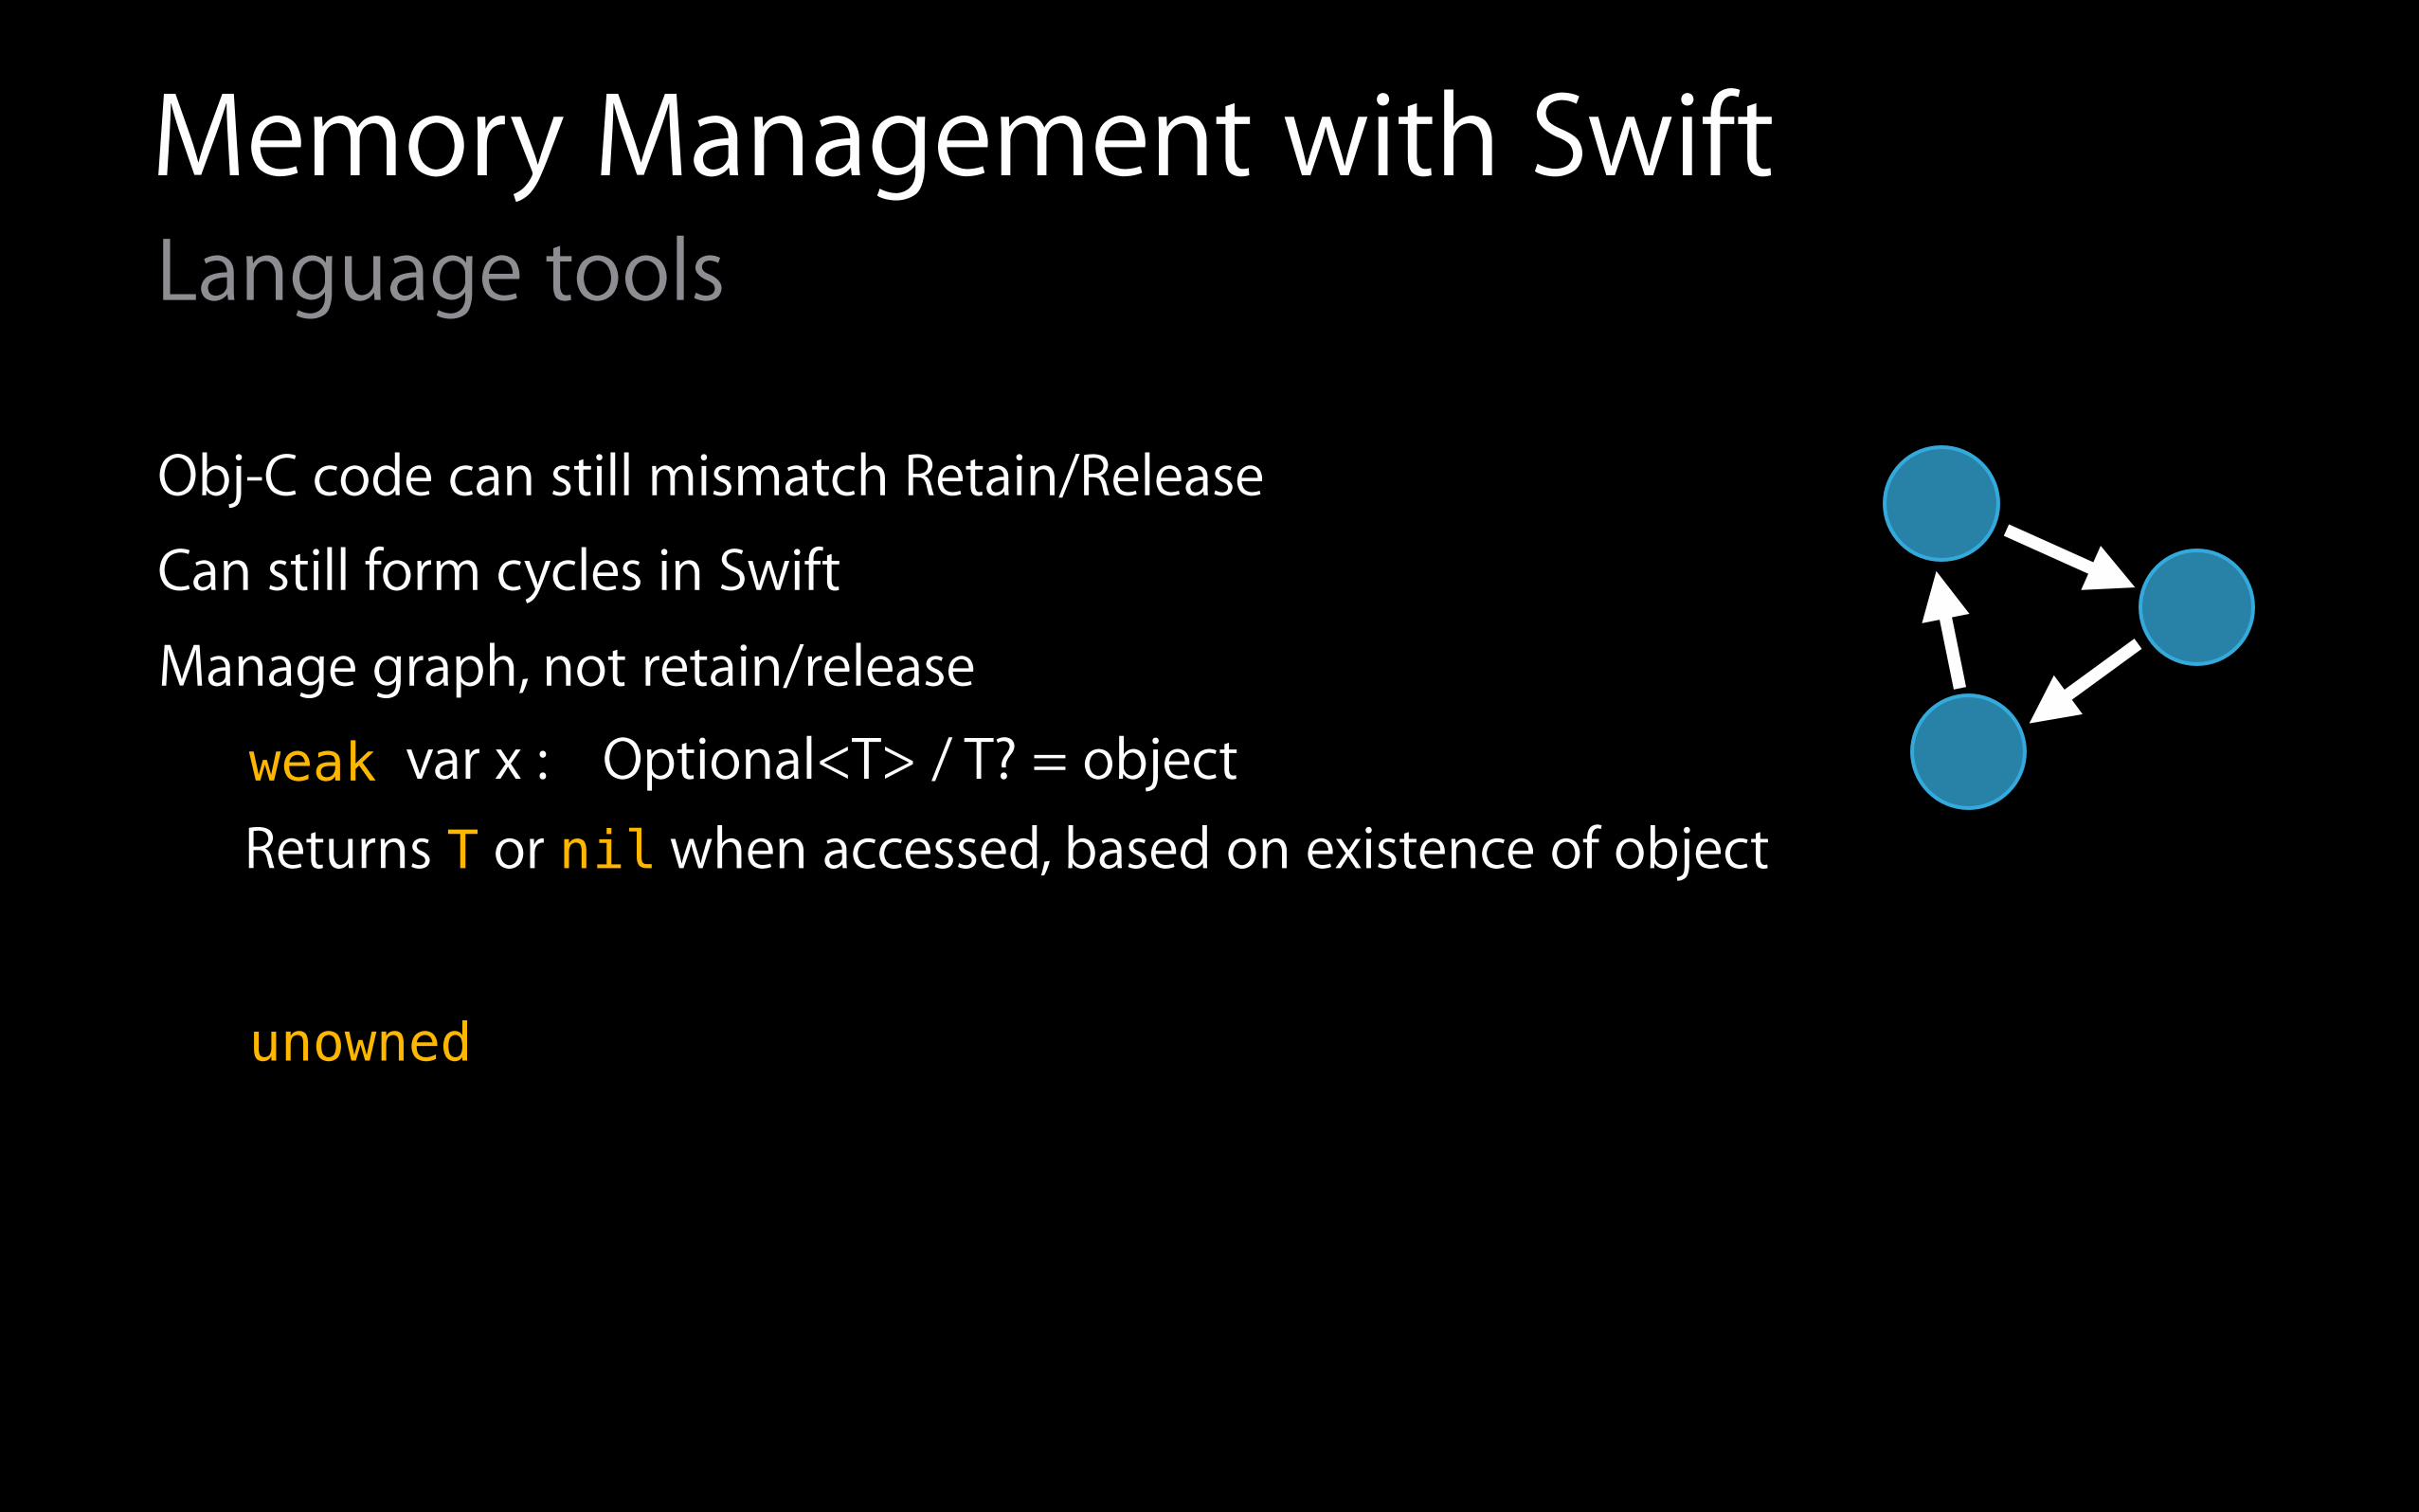
Memory Management with SwiftLanguage tools
Obj-C code can still mismatch Retain/Release
Can still form cycles in Swift
var x : Optional<T> / T? = objectReturns T or nil when accessed, based on existence of object
Manage graph, not retain/release
weak !
!
unowned
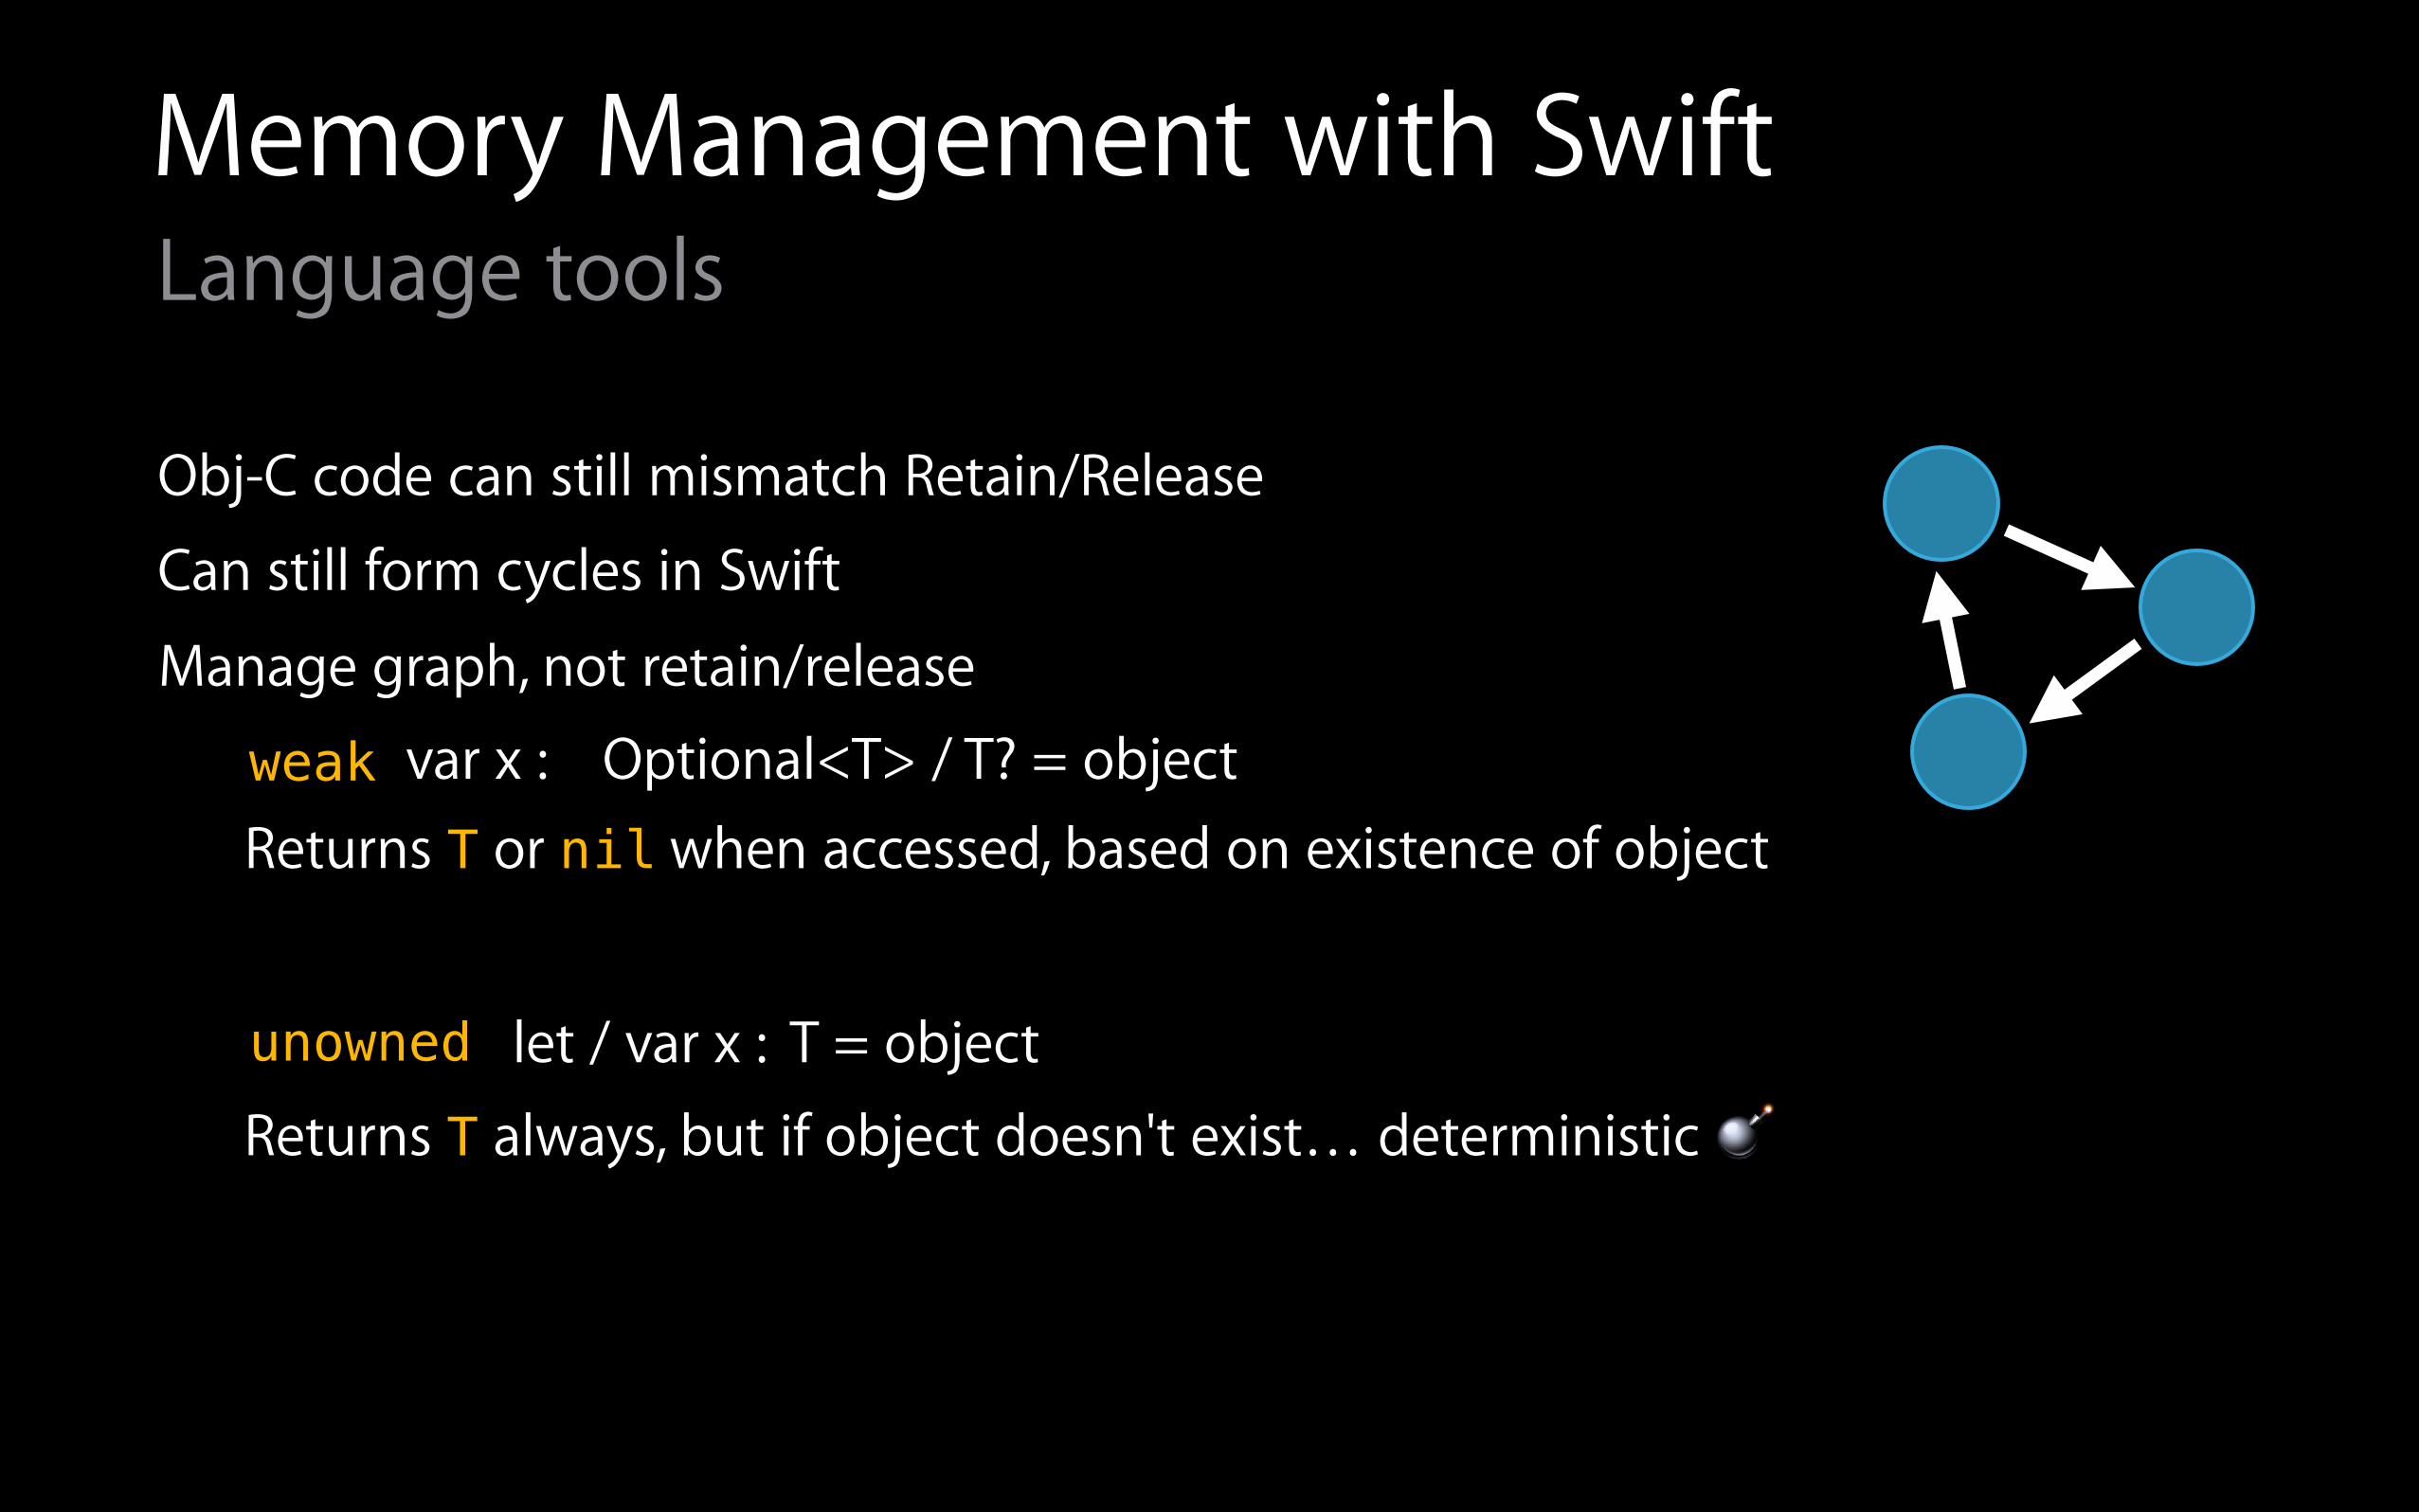
Memory Management with SwiftLanguage tools
Obj-C code can still mismatch Retain/Release
Can still form cycles in Swift
var x : Optional<T> / T? = object
let / var x : T = object
Returns T or nil when accessed, based on existence of object
Returns T always, but if object doesn't exist… deterministic 💣
Manage graph, not retain/release
weak !
!
unowned
!
!
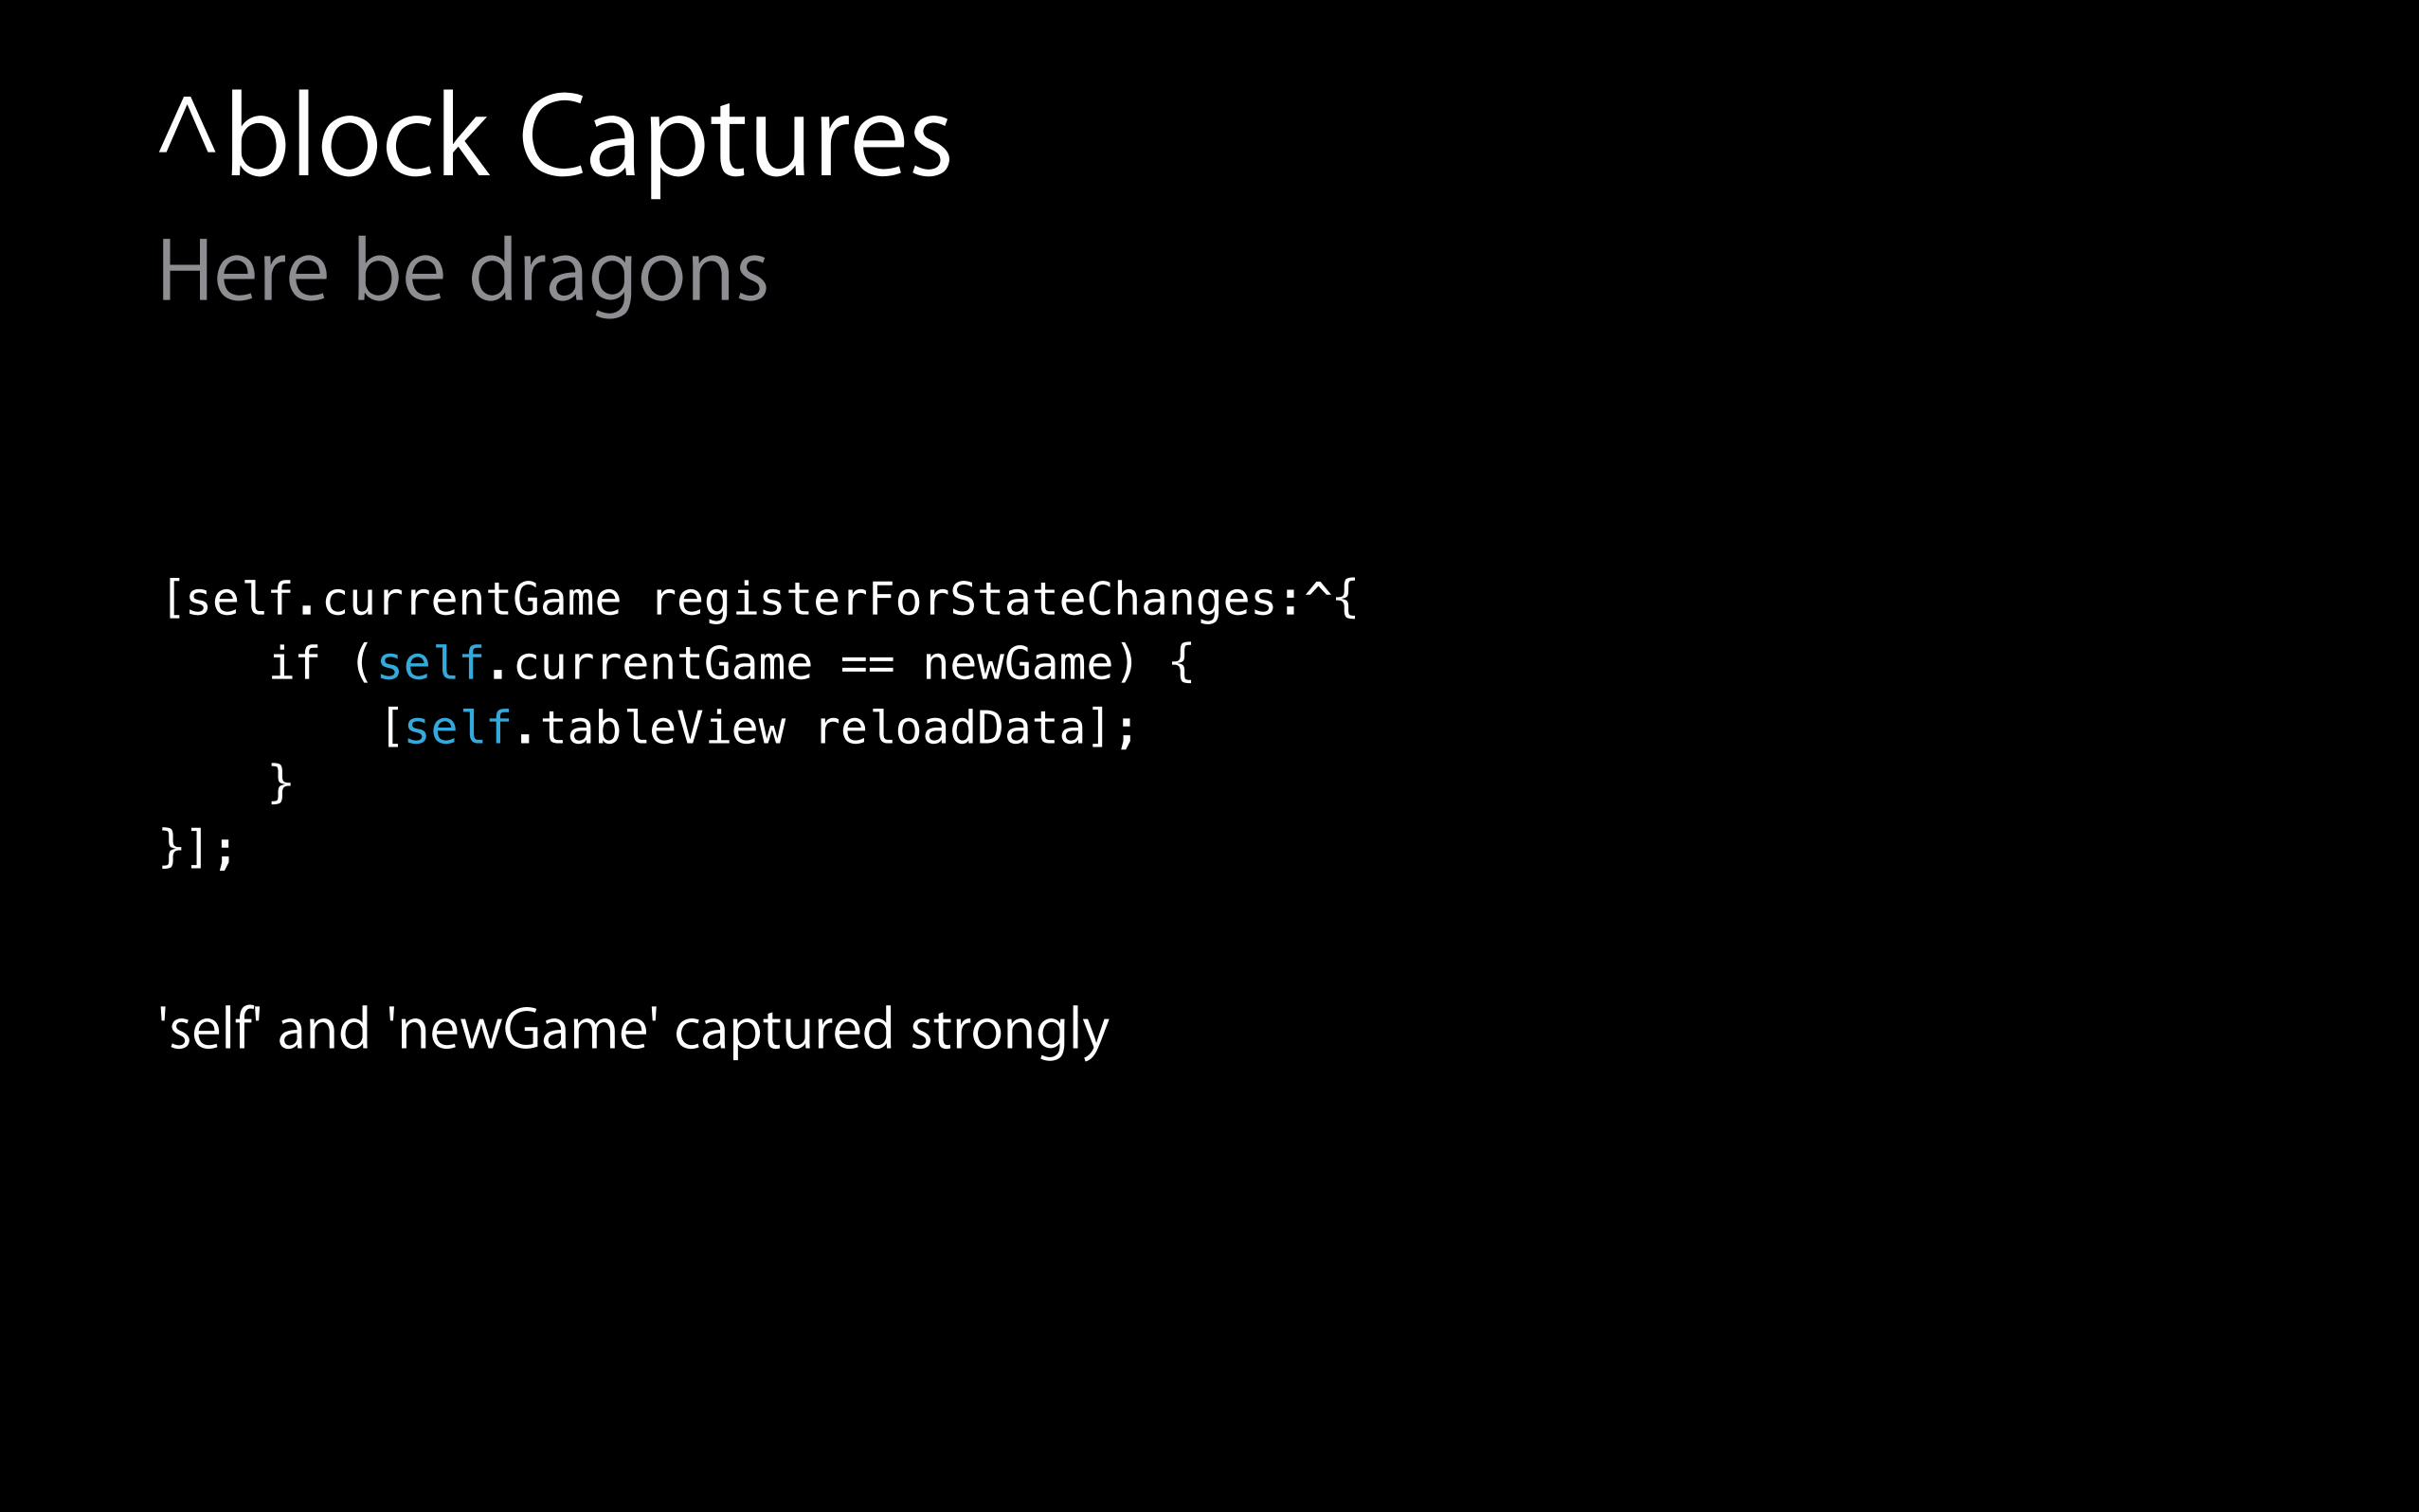
[self.currentGame registerForStateChanges:^{ if (self.currentGame == newGame) { [self.tableView reloadData]; } }];
!
'self' and 'newGame' captured strongly
^block CapturesHere be dragons
!
!
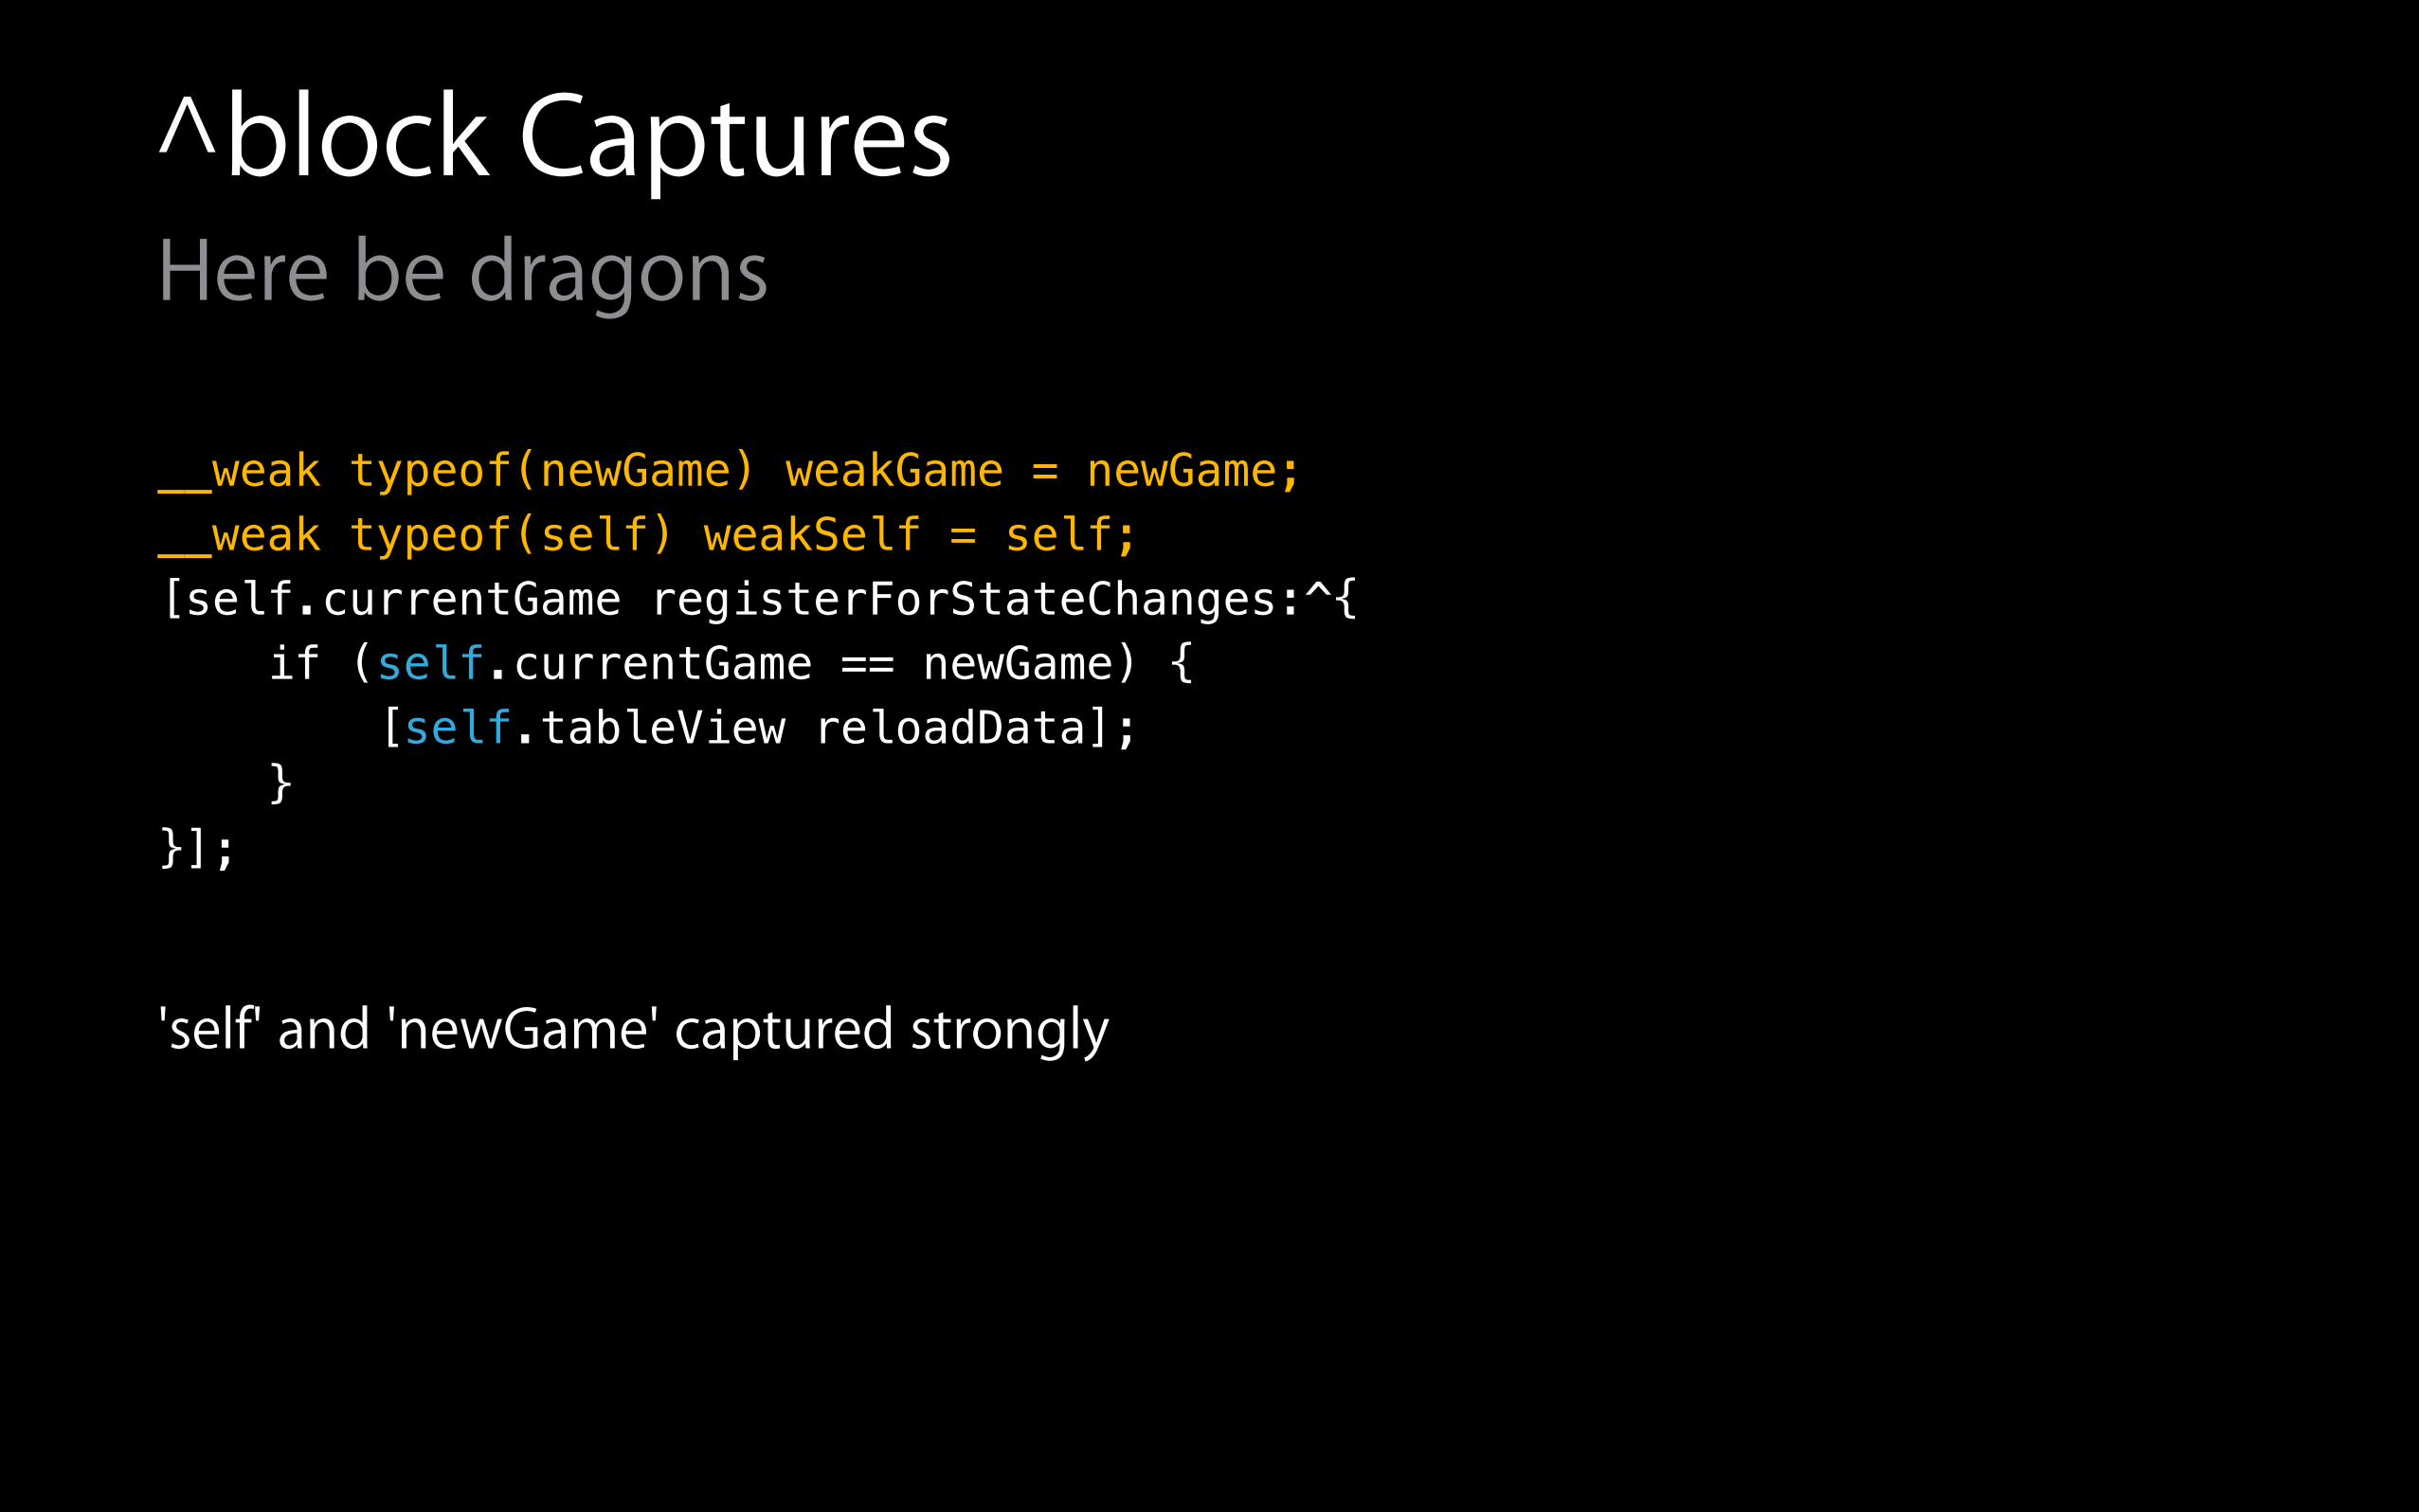
[self.currentGame registerForStateChanges:^{ if (self.currentGame == newGame) { [self.tableView reloadData]; } }];
!
'self' and 'newGame' captured strongly
__weak typeof(newGame) weakGame = newGame;__weak typeof(self) weakSelf = self;
^block CapturesHere be dragons
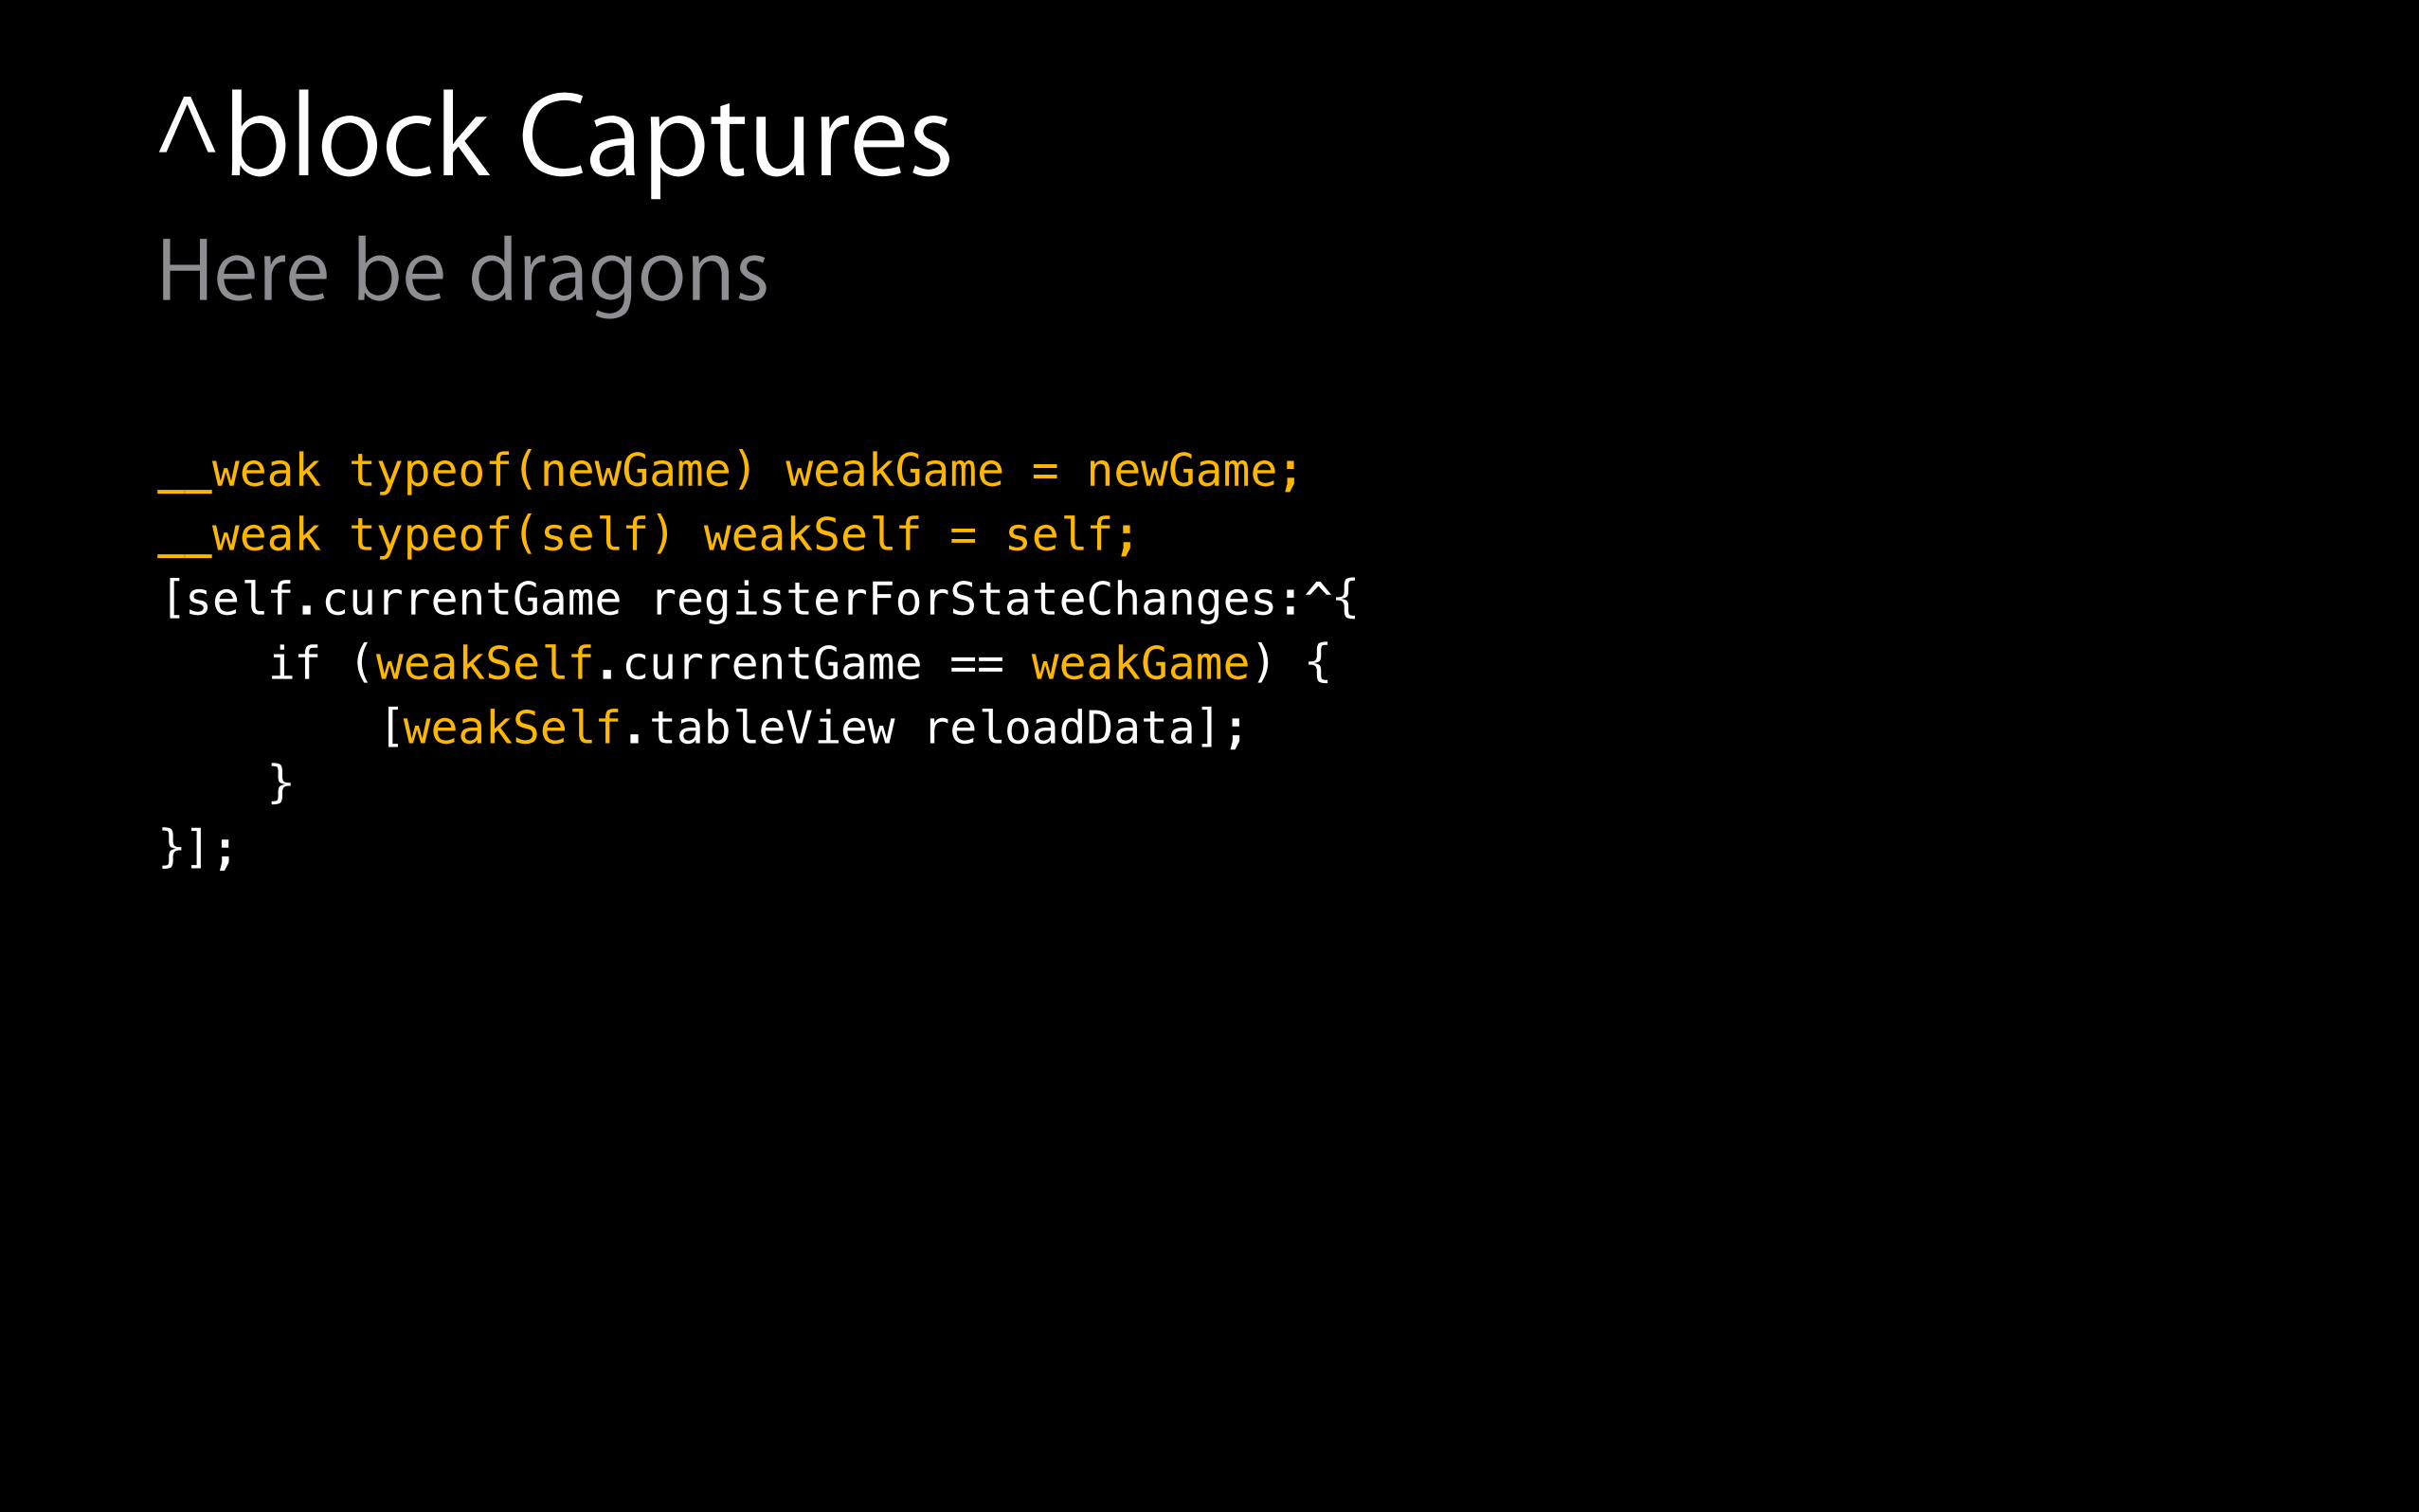
^block CapturesHere be dragons
__weak typeof(newGame) weakGame = newGame; __weak typeof(self) weakSelf = self; !
!
[self.currentGame registerForStateChanges:^{ if (weakSelf.currentGame == weakGame) { [weakSelf.tableView reloadData]; } }];
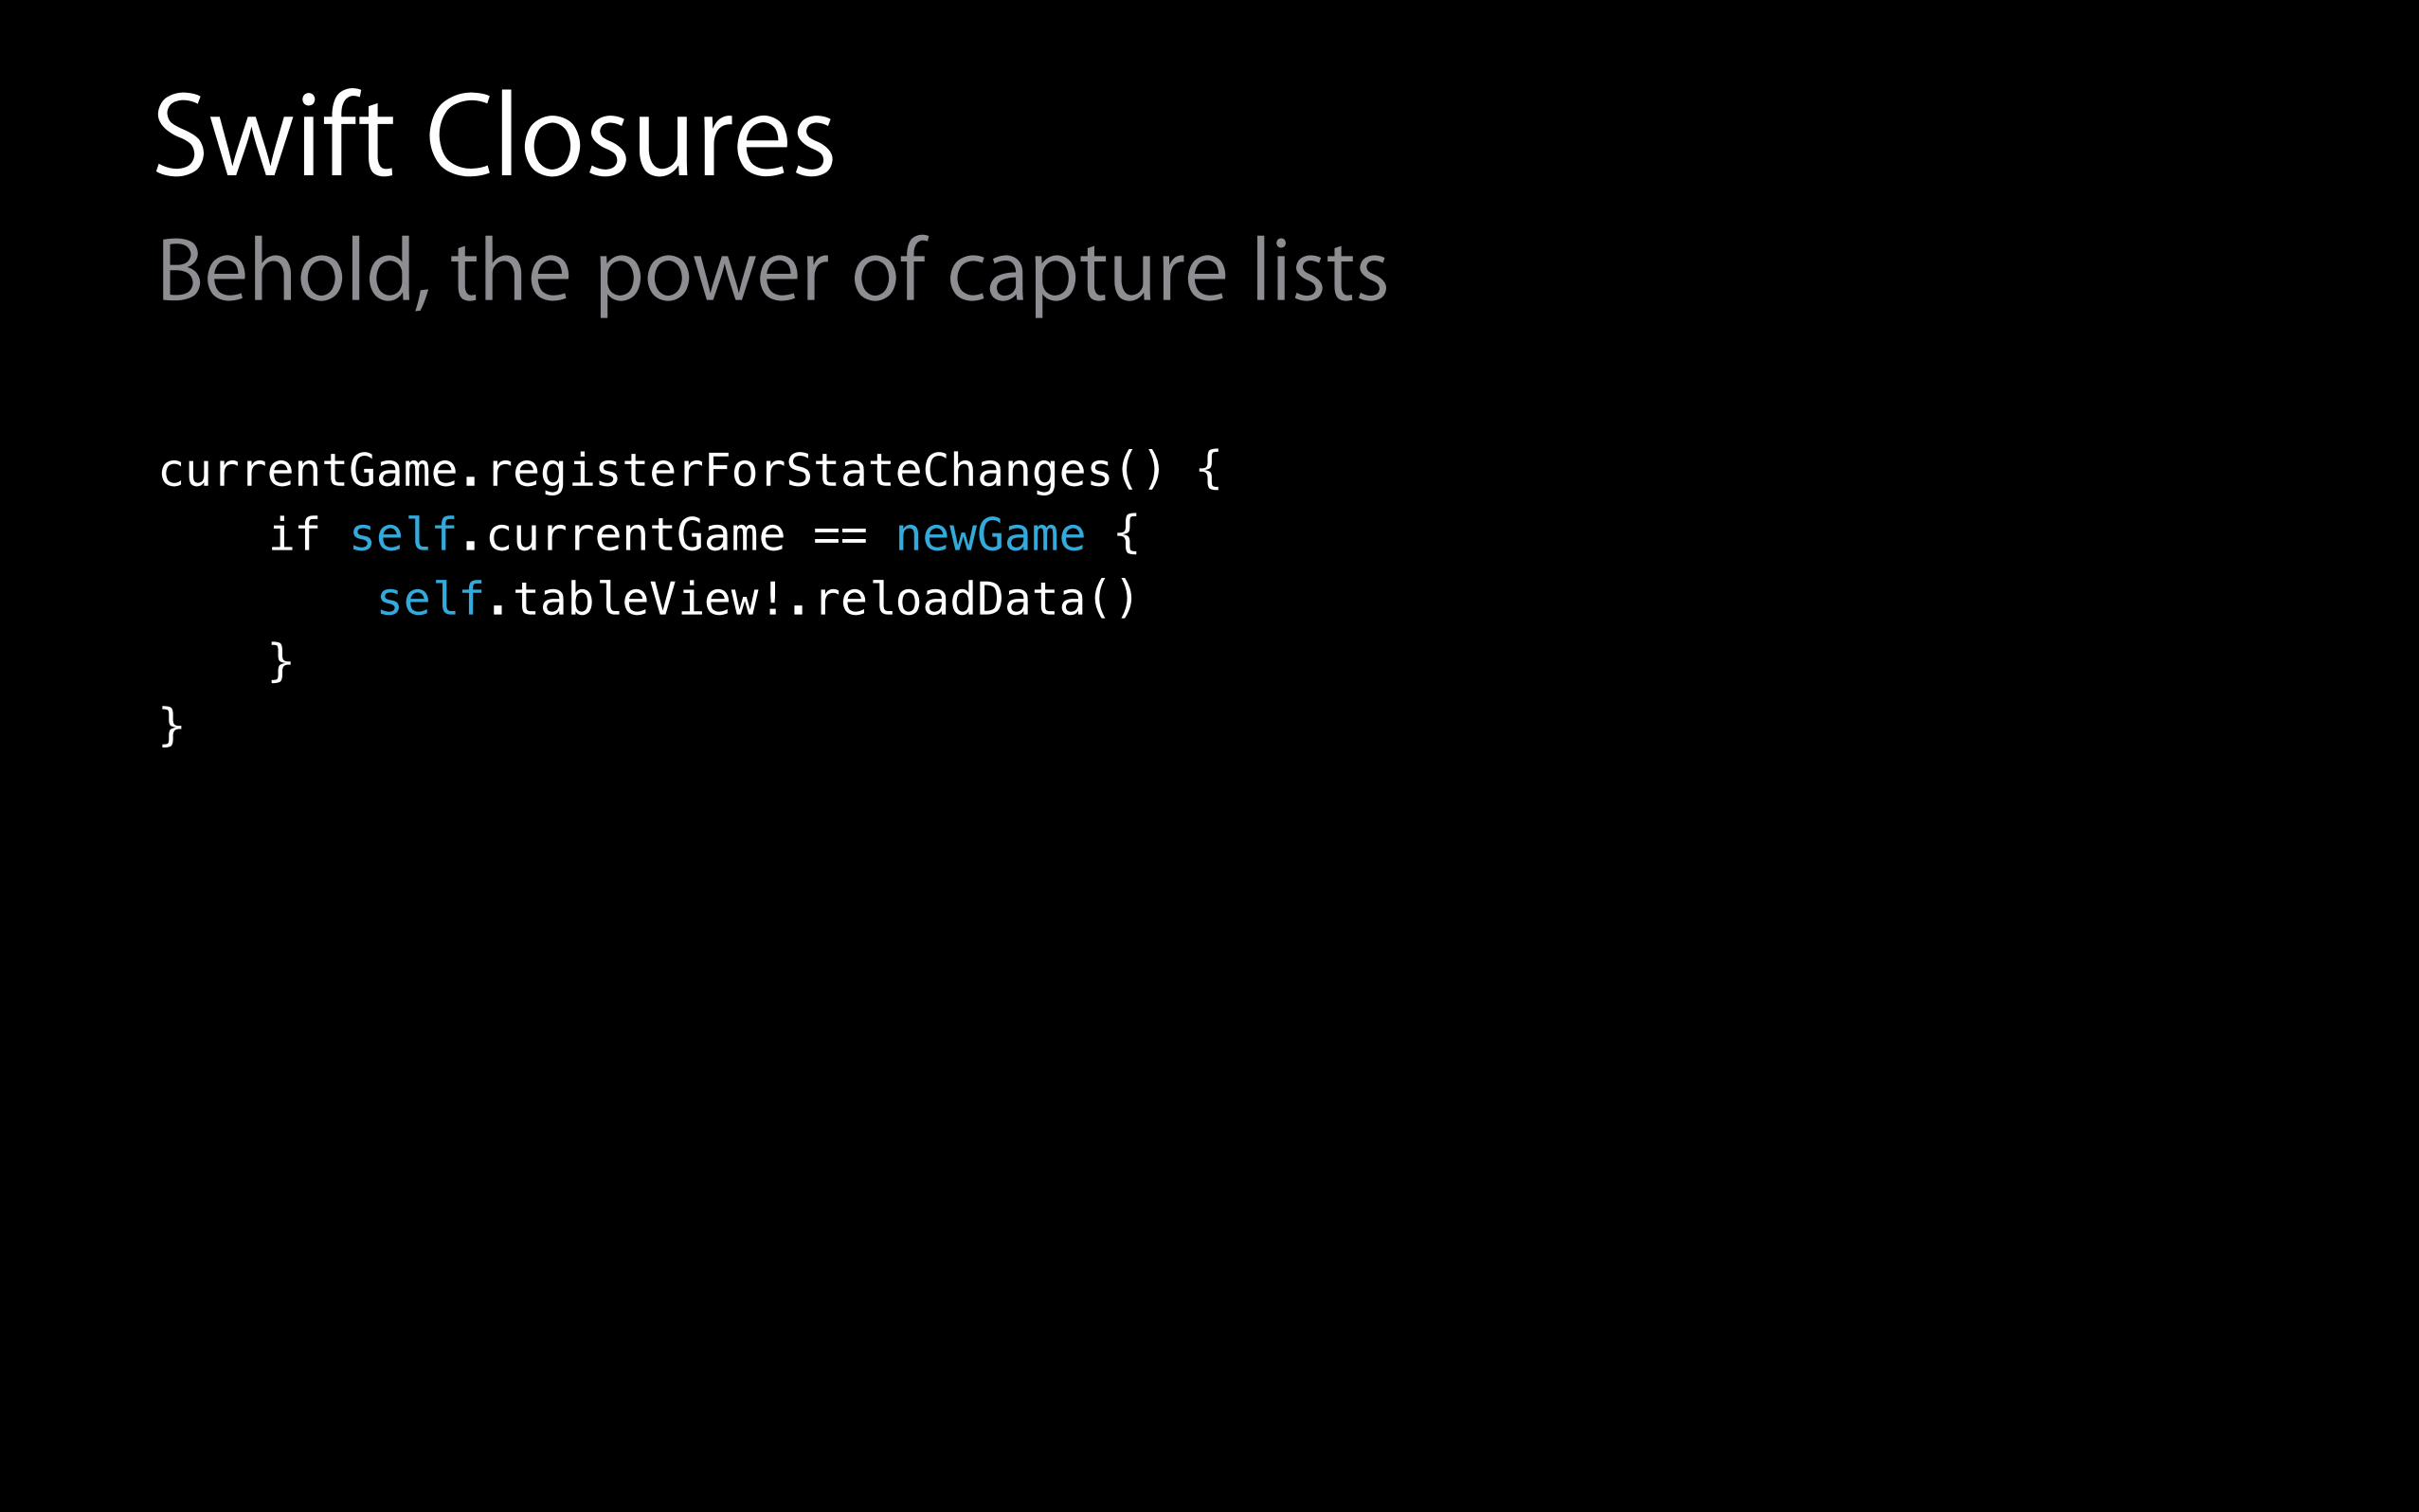
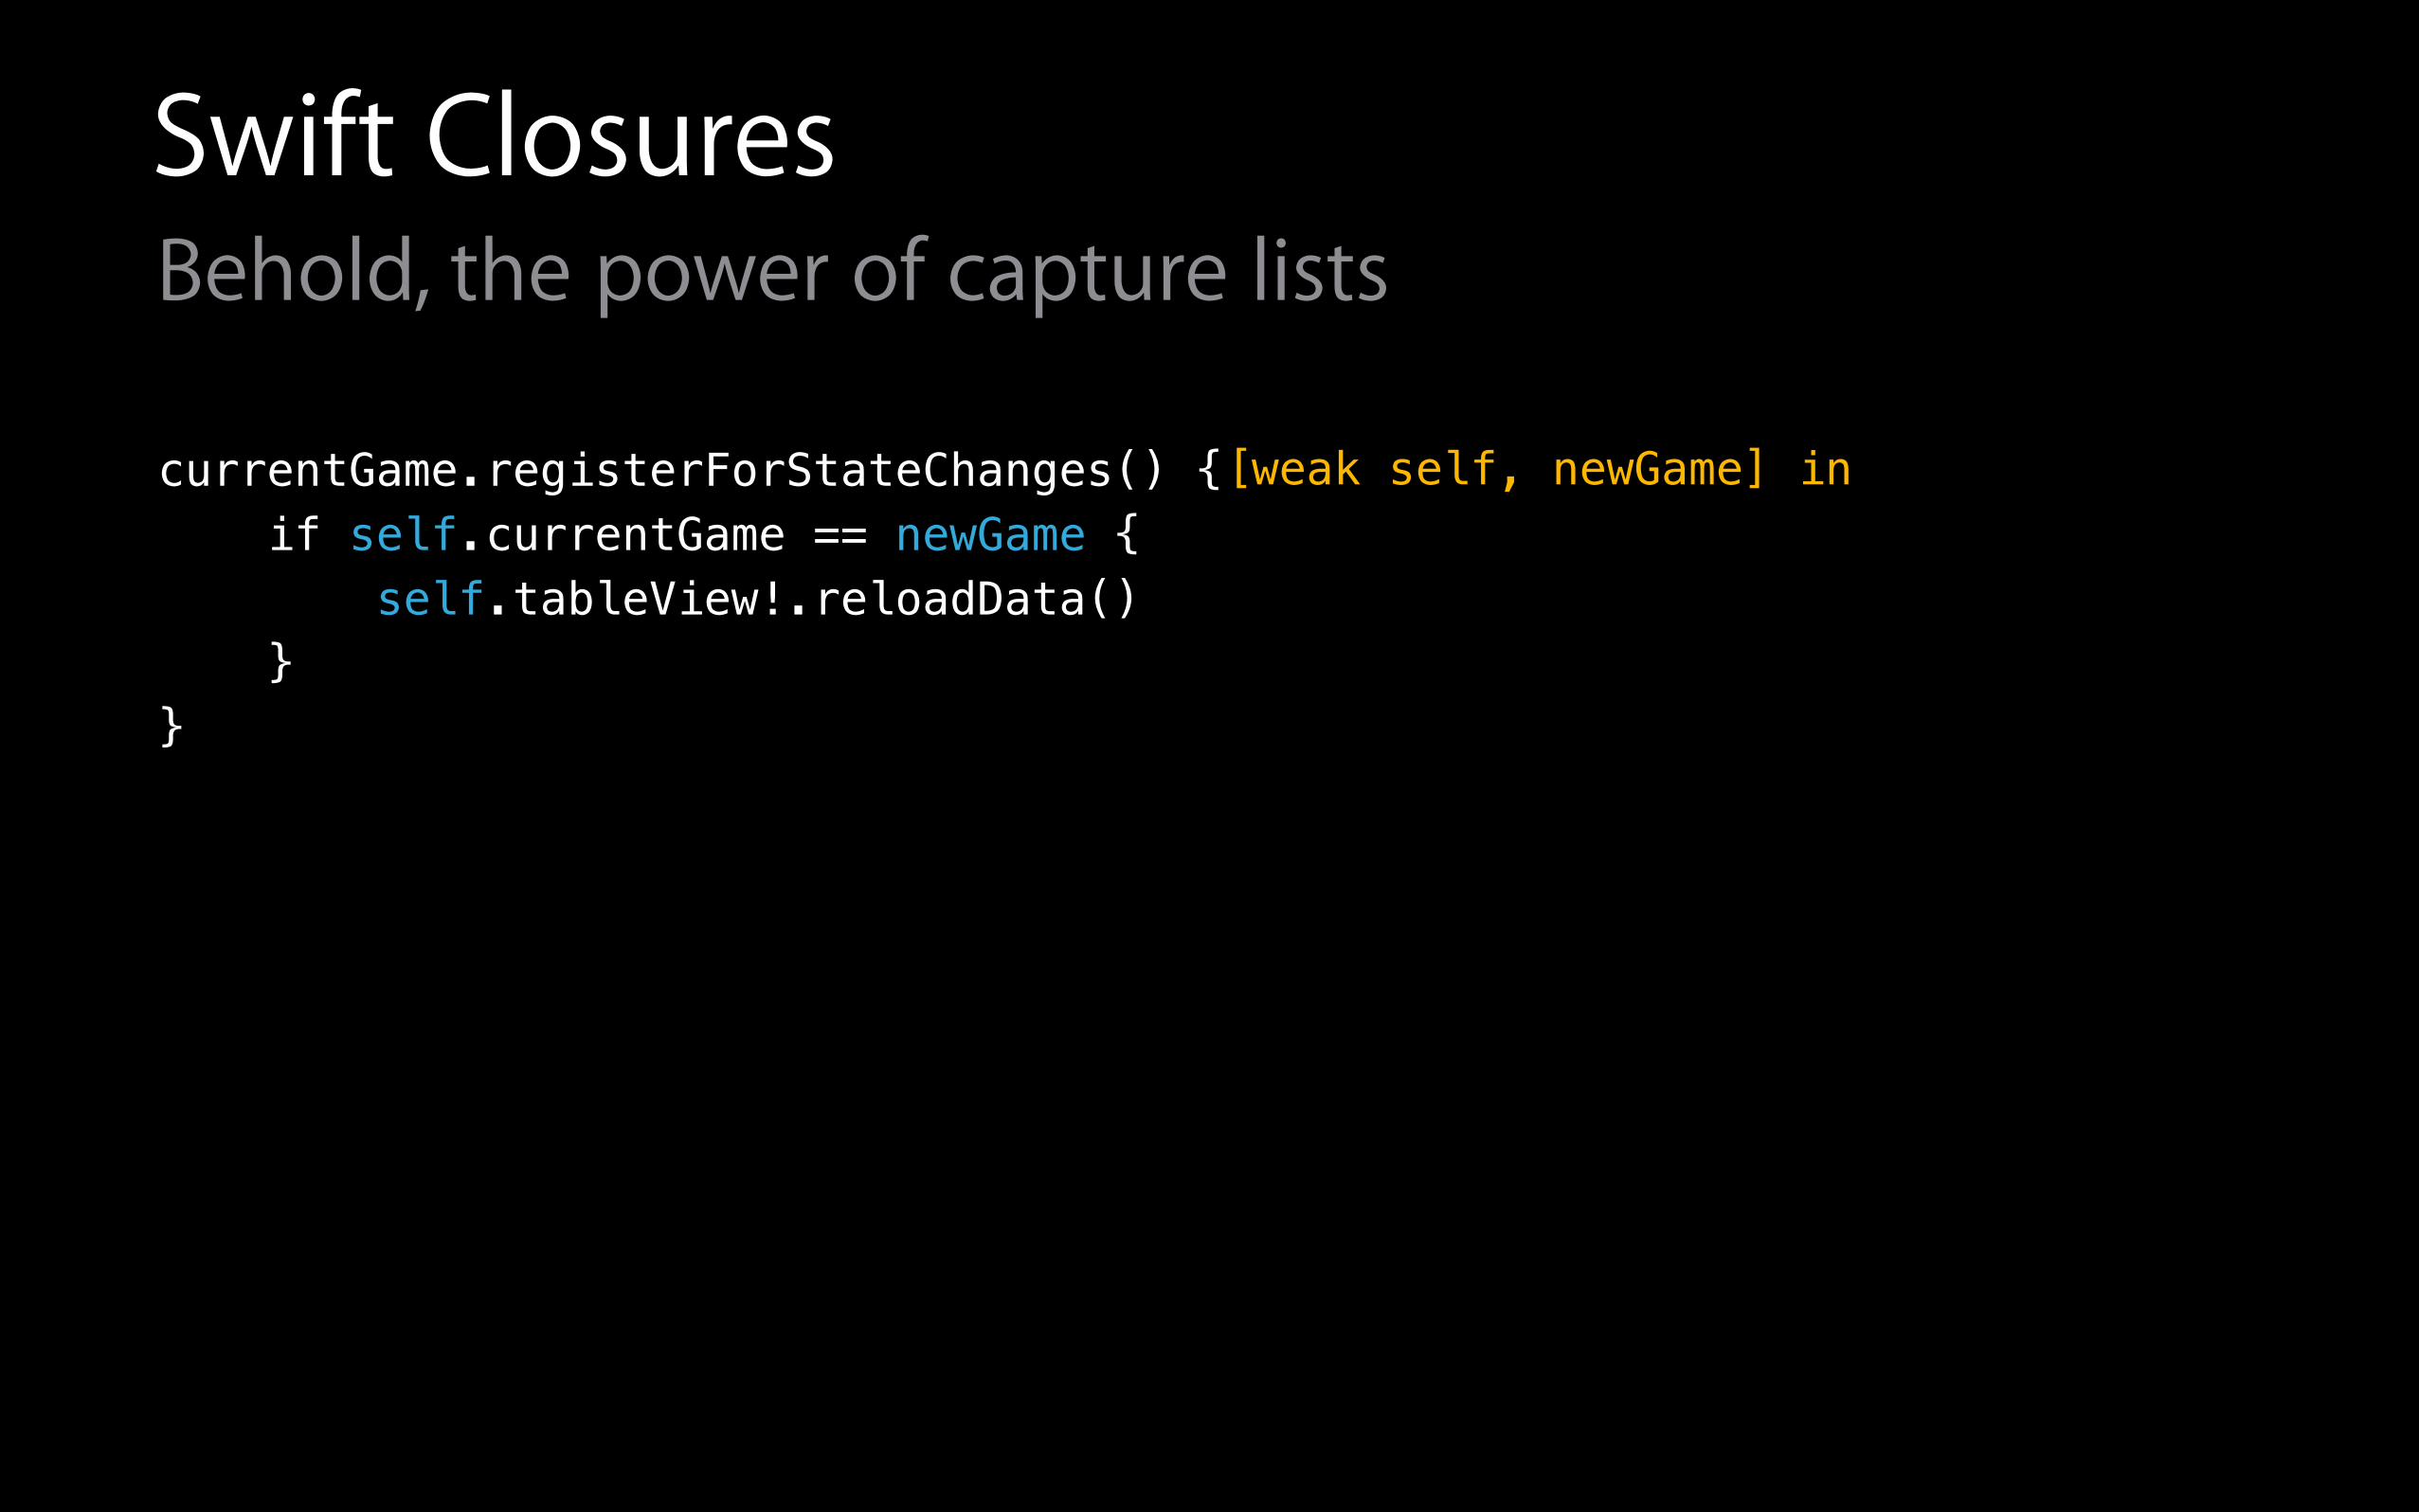
Swift ClosuresBehold, the power of capture lists
currentGame.registerForStateChanges() { if self.currentGame == newGame { self.tableView!.reloadData() } }
Swift ClosuresBehold, the power of capture lists
currentGame.registerForStateChanges() { if self.currentGame == newGame { self.tableView!.reloadData() } }
[weak self, newGame] in
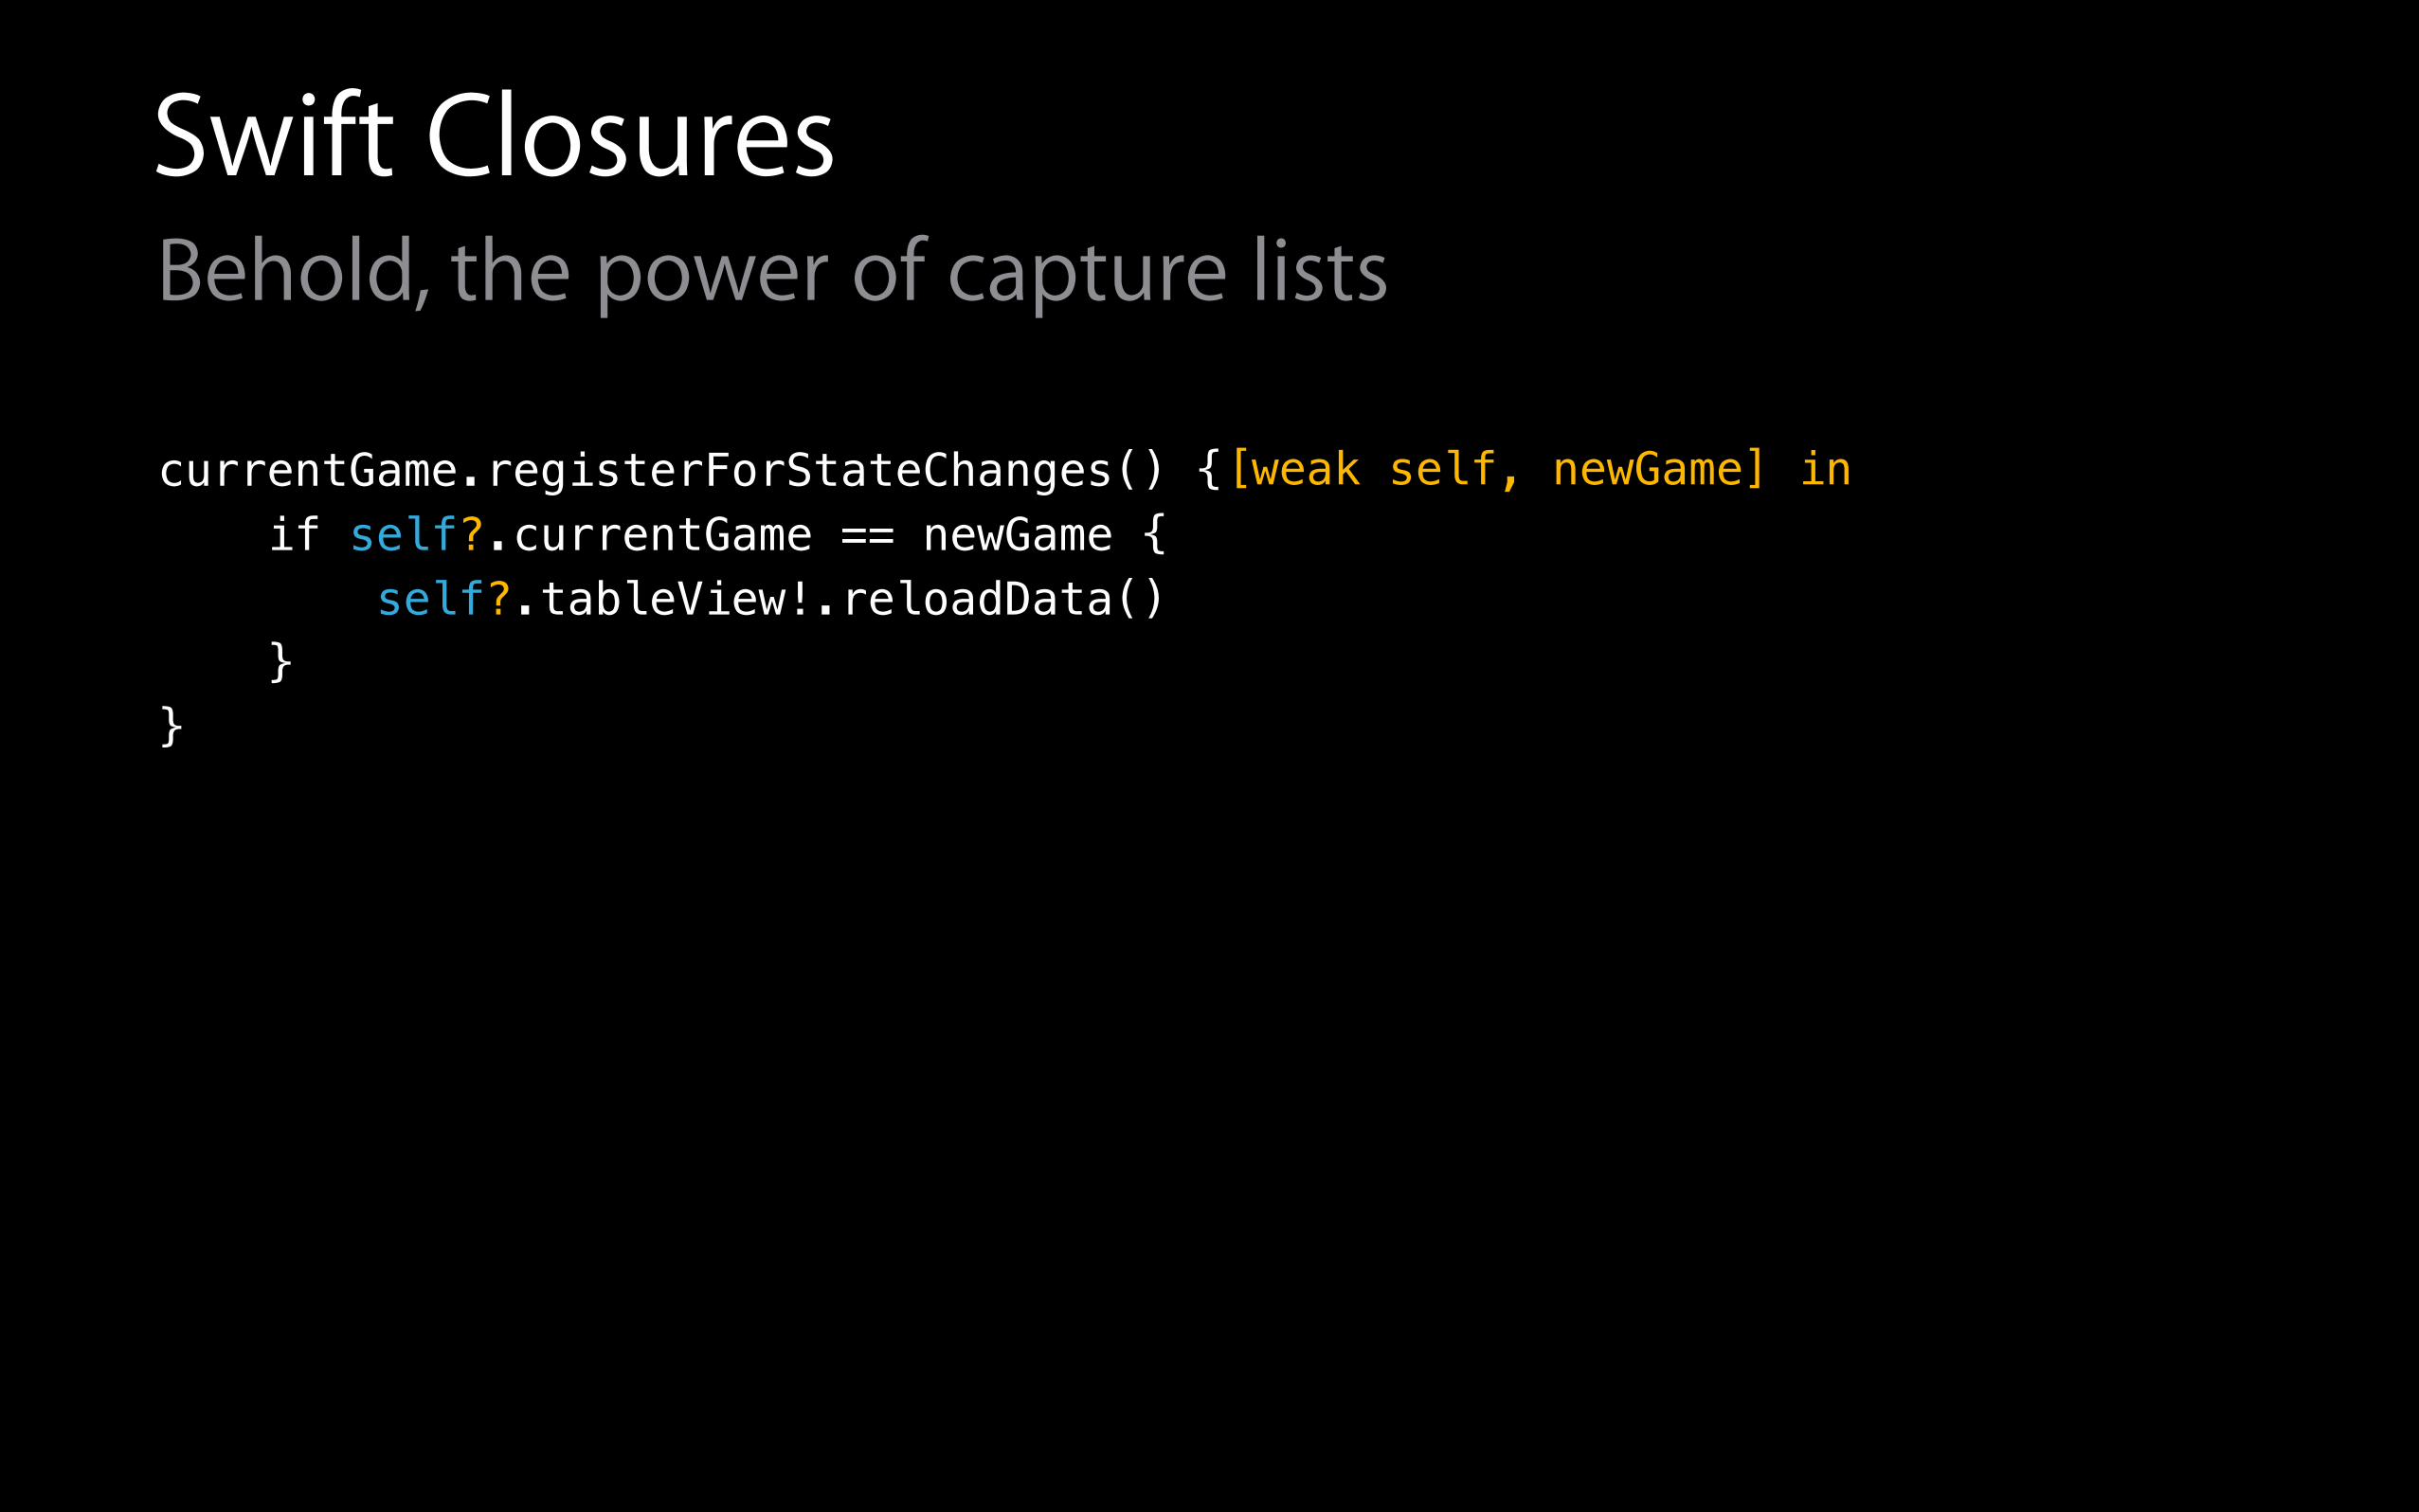
Swift ClosuresBehold, the power of capture lists
currentGame.registerForStateChanges() { if self?.currentGame == newGame { self?.tableView!.reloadData() } }
[weak self, newGame] in
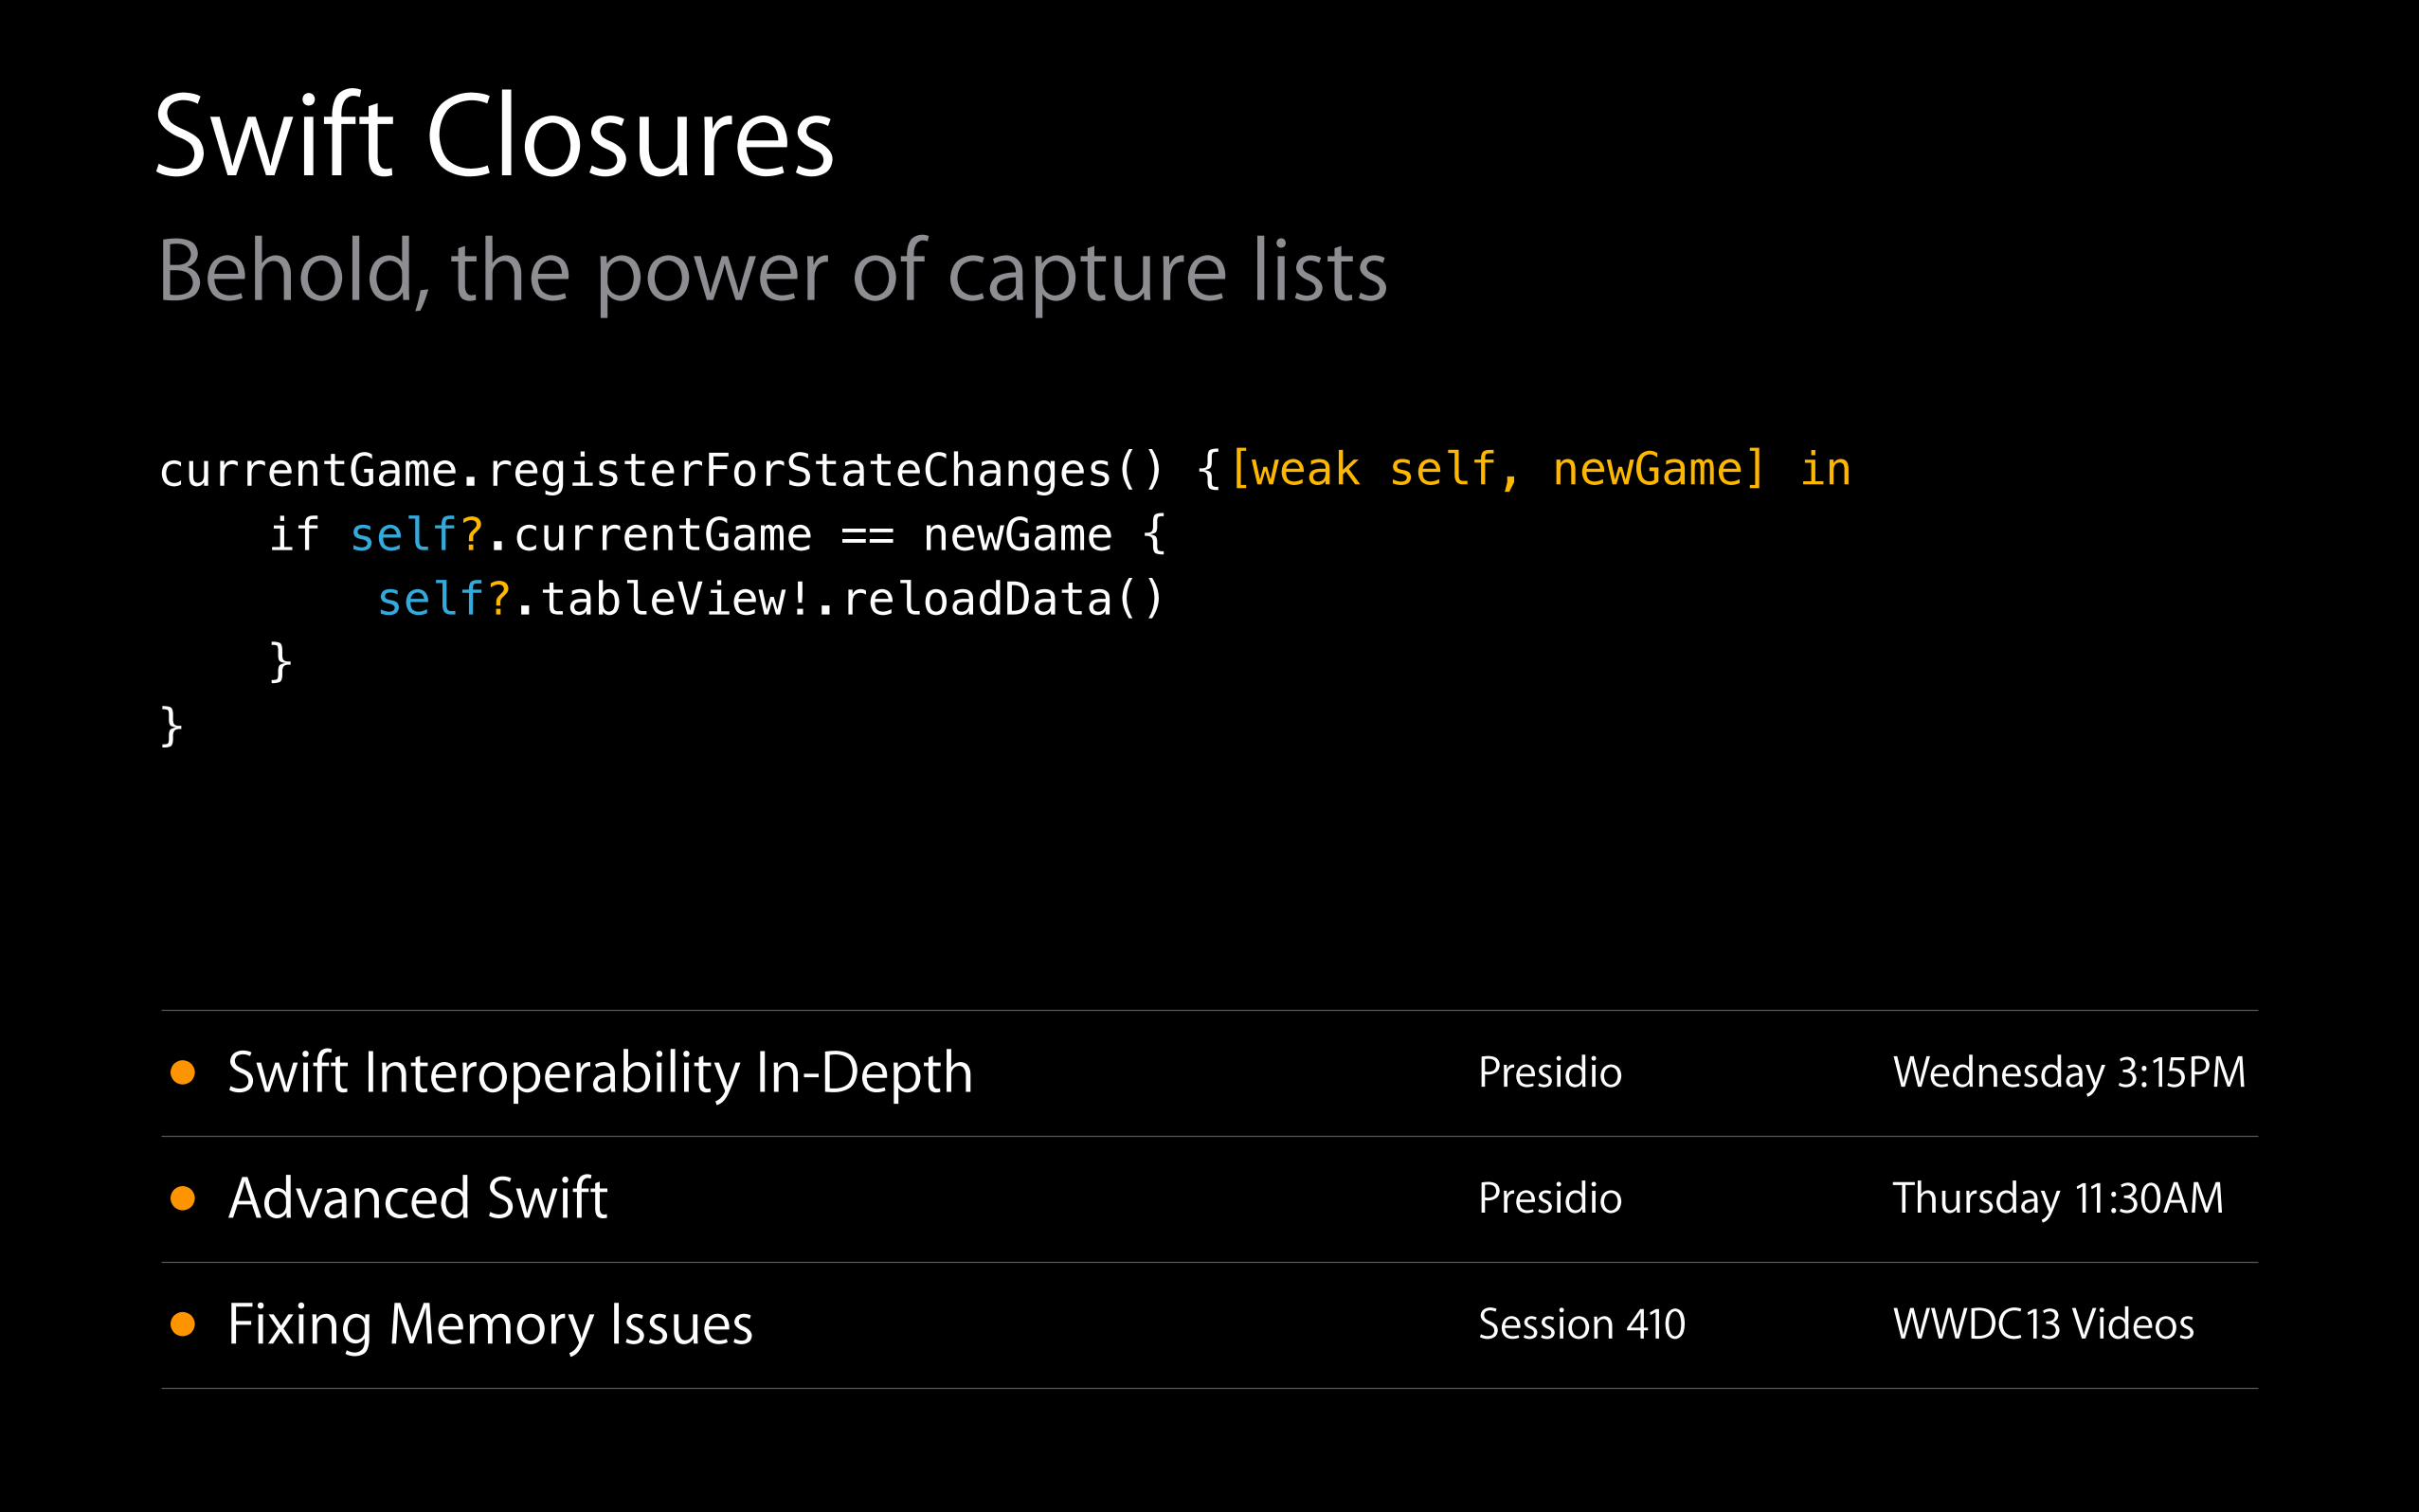
Swift ClosuresBehold, the power of capture lists
currentGame.registerForStateChanges() { if self?.currentGame == newGame { self?.tableView!.reloadData() } }
[weak self, newGame] in
• Swift Interoperability In-Depth Presidio Wednesday 3:15PM
• Advanced Swift Presidio Thursday 11:30AM
• Fixing Memory Issues Session 410 WWDC13 Videos
Time Profiling
Kris Markel Performance Tools Engineer

Why?
Why?
To provide a great user experience
Why?
To provide a great user experience• Faster app launch times
Why?
To provide a great user experience• Faster app launch times
• Keep the frame rate at 60fps
Why?
To provide a great user experience• Faster app launch times
• Keep the frame rate at 60fps
• Buttery-smooth scrolling
Why?
To provide a great user experience• Faster app launch times
• Keep the frame rate at 60fps
• Buttery-smooth scrolling
• Responsive UI
What?
An instrument that samples stack trace information at prescribed intervals
Provides an idea of how much time is spent in each method

When?
When?
Investigate specific problems
When?
Investigate specific problems• If you see stuttering or frame rate slowdowns
When?
Investigate specific problems• If you see stuttering or frame rate slowdowns
• Some part of your app is taking too long
When?
Investigate specific problems• If you see stuttering or frame rate slowdowns
• Some part of your app is taking too long
Identify and fix hotspots before they become problems
When?
Investigate specific problems• If you see stuttering or frame rate slowdowns
• Some part of your app is taking too long
Identify and fix hotspots before they become problems• Keep an eye on the CPU gauge in Xcode
DemoTime Profiler in action
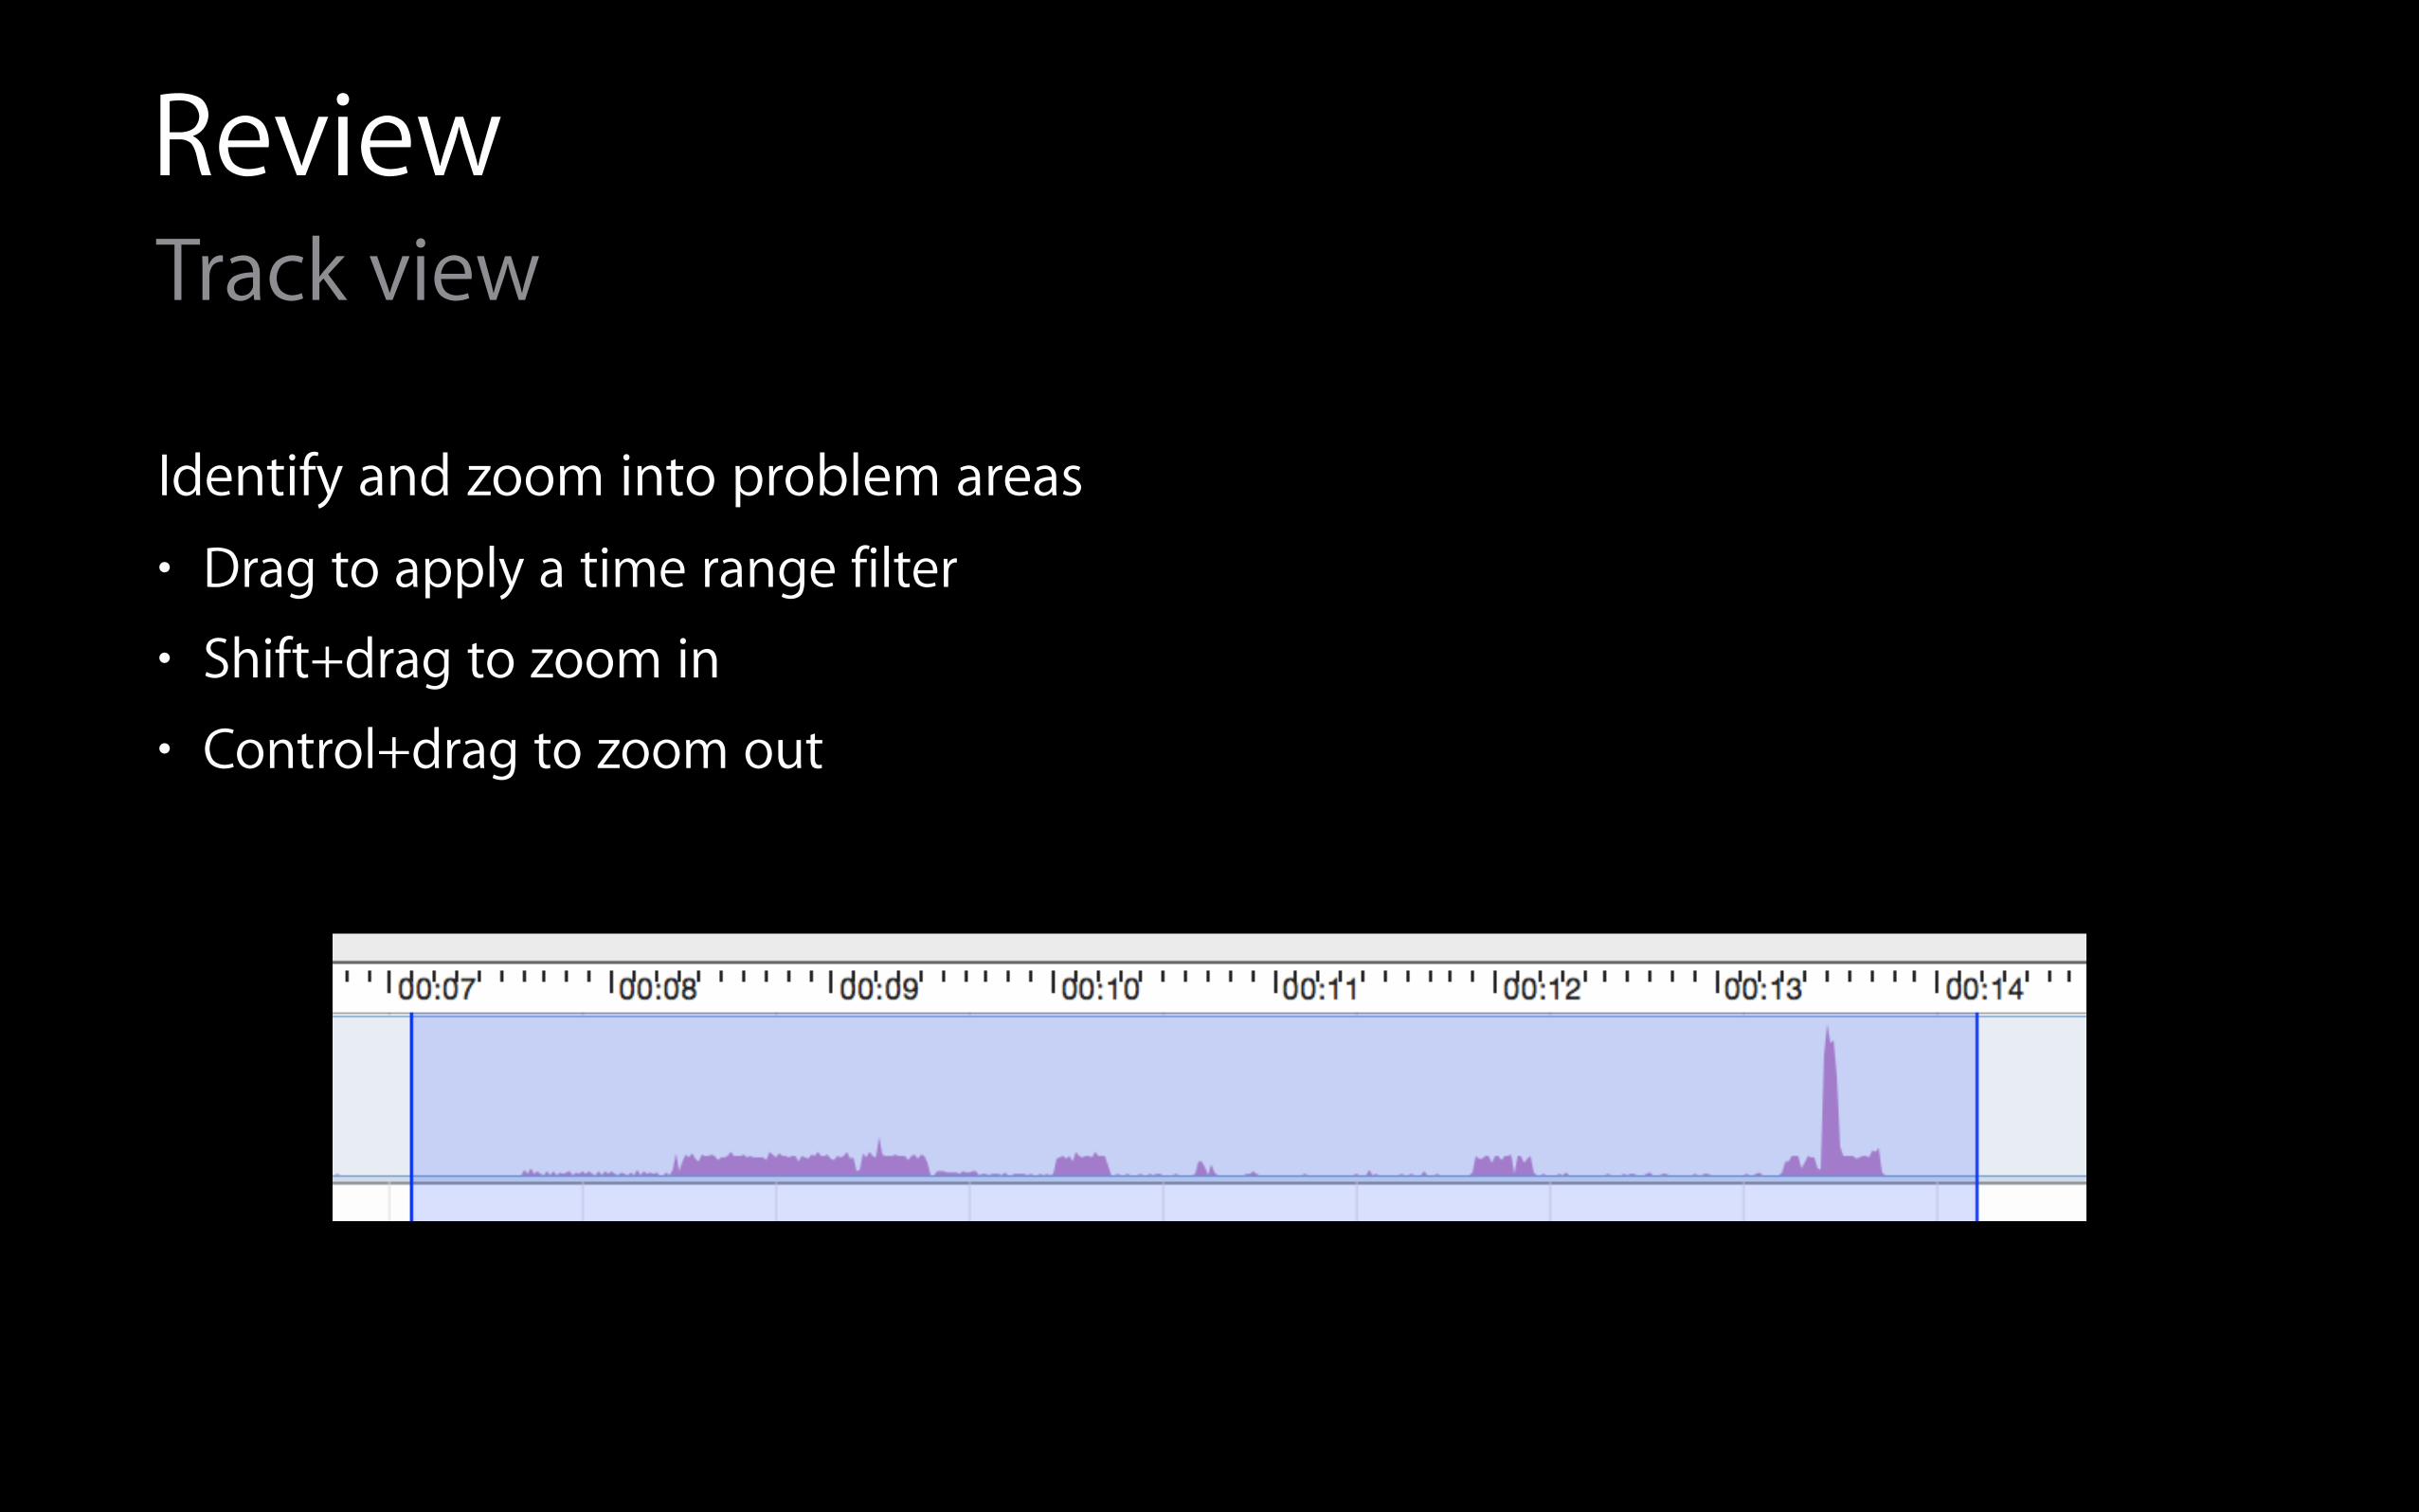
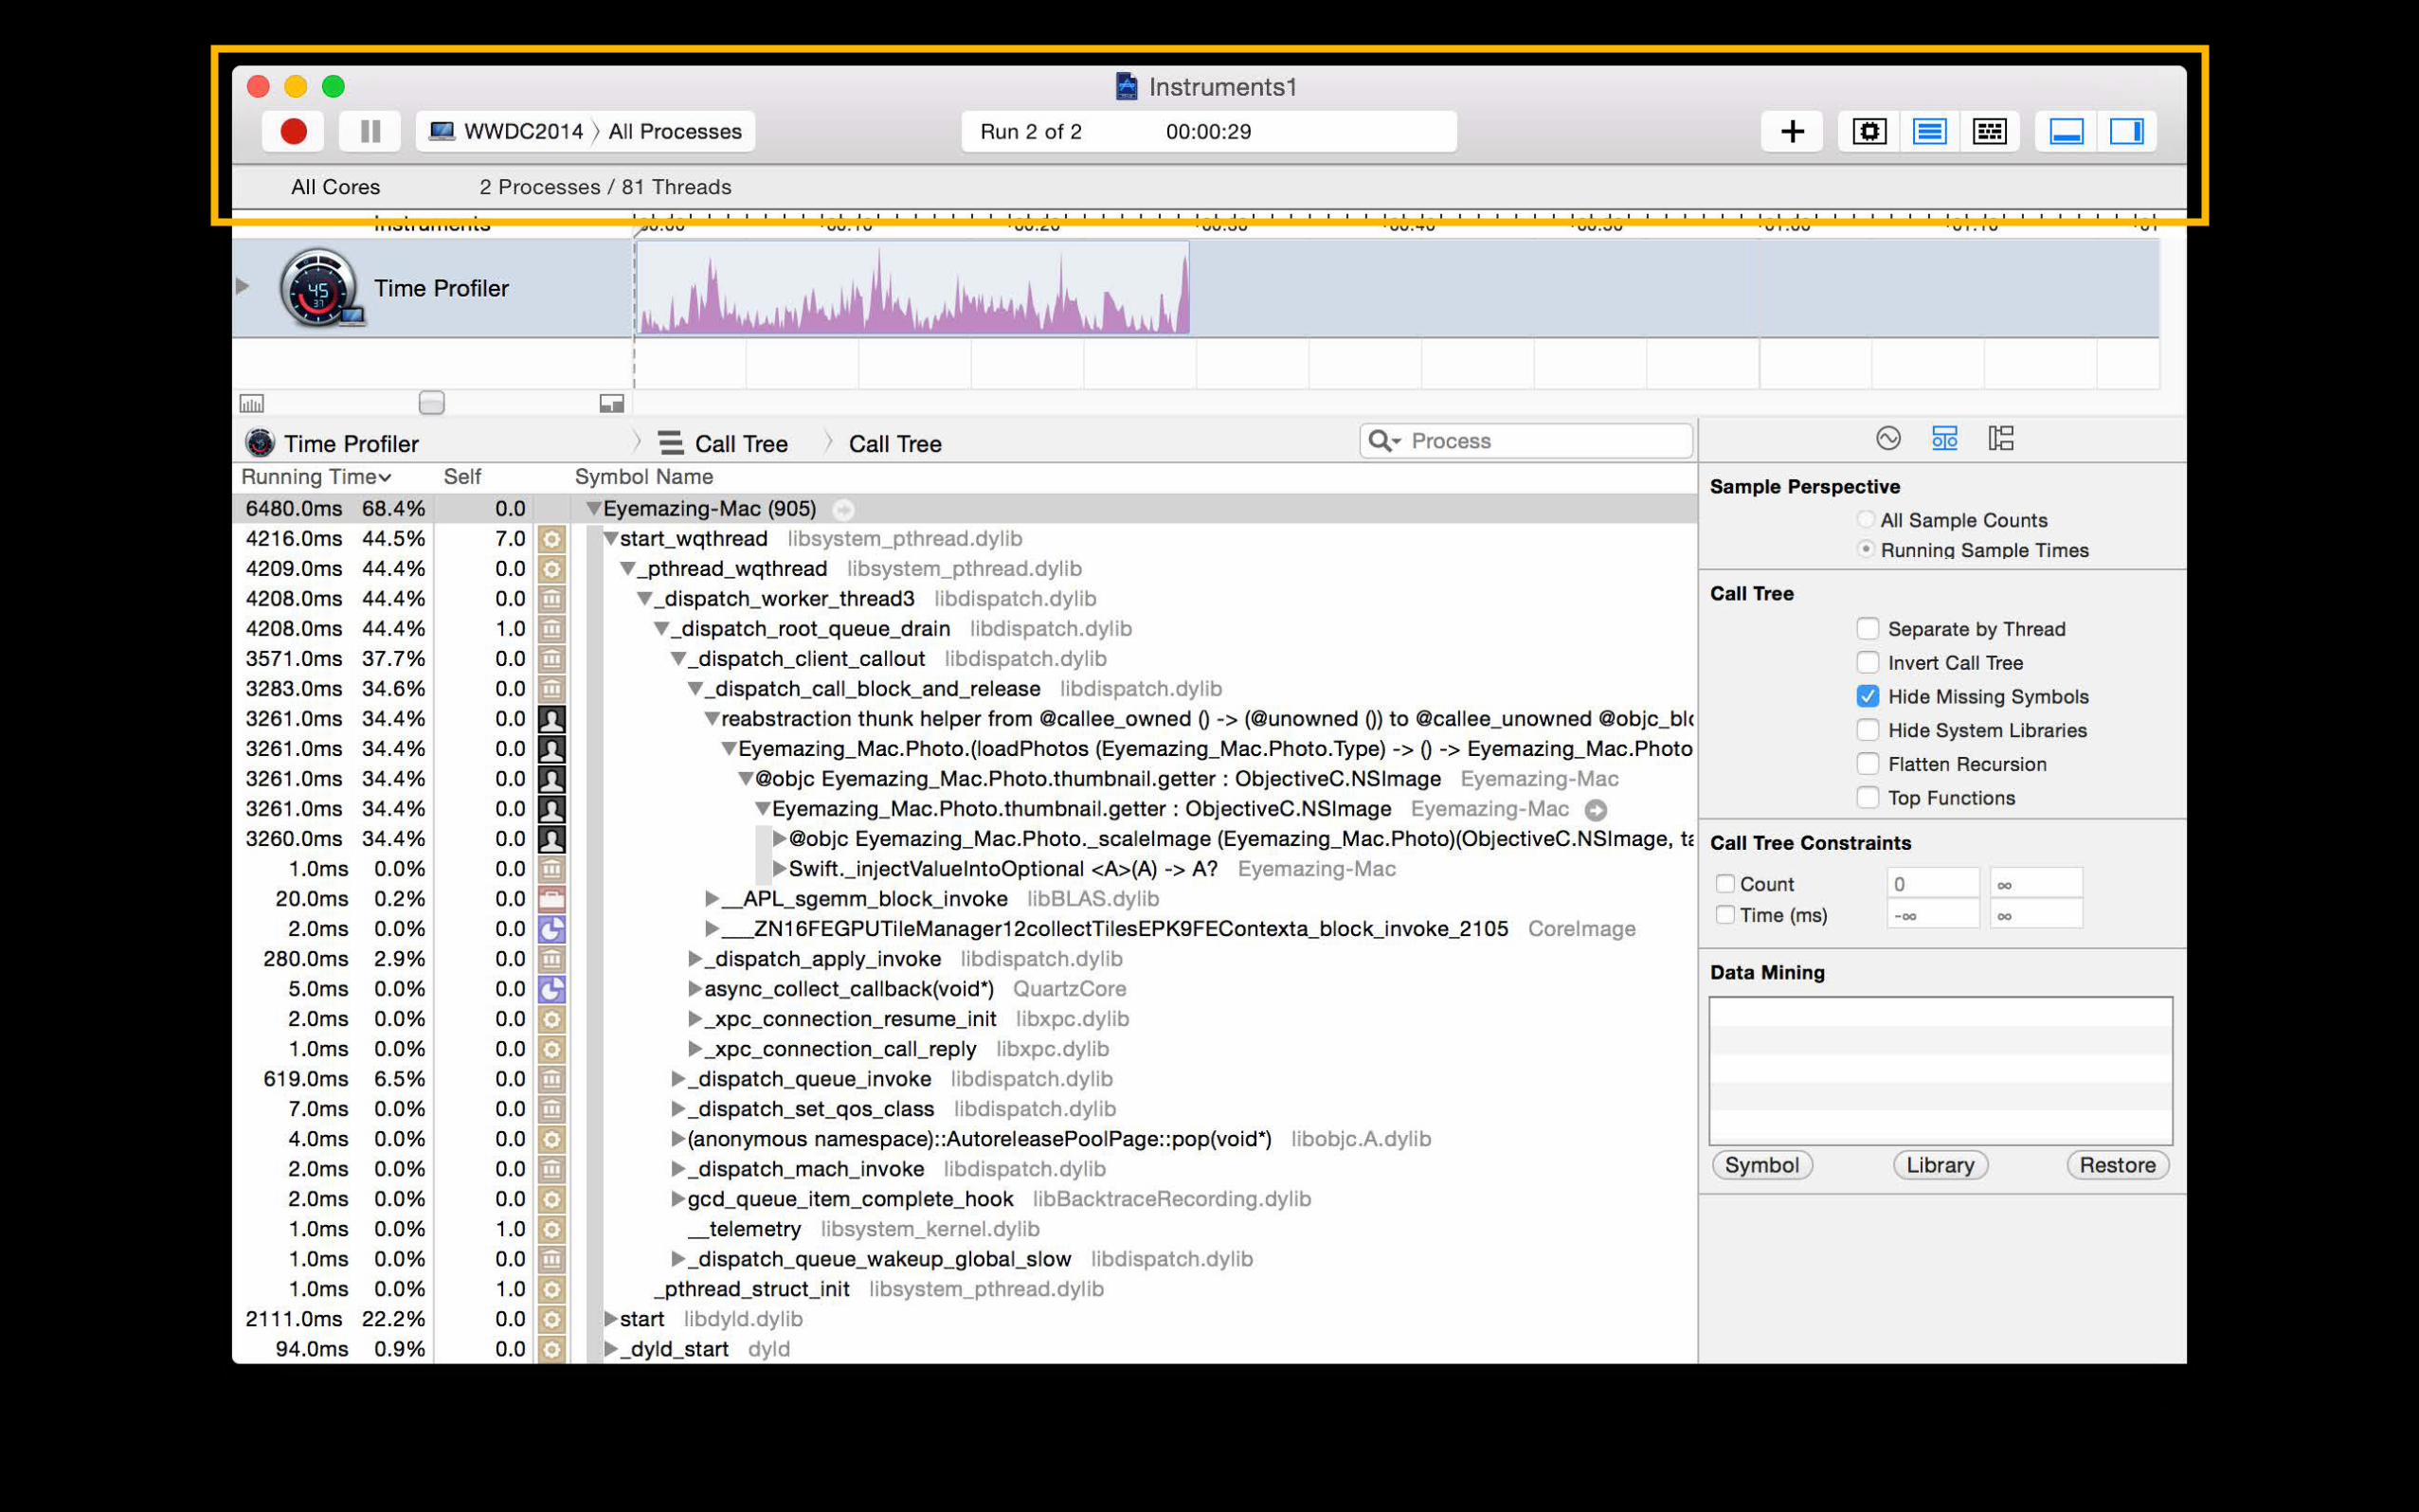
ReviewTrack view
Identify and zoom into problem areas • Drag to apply a time range filter
• Shift+drag to zoom in
• Control+drag to zoom out
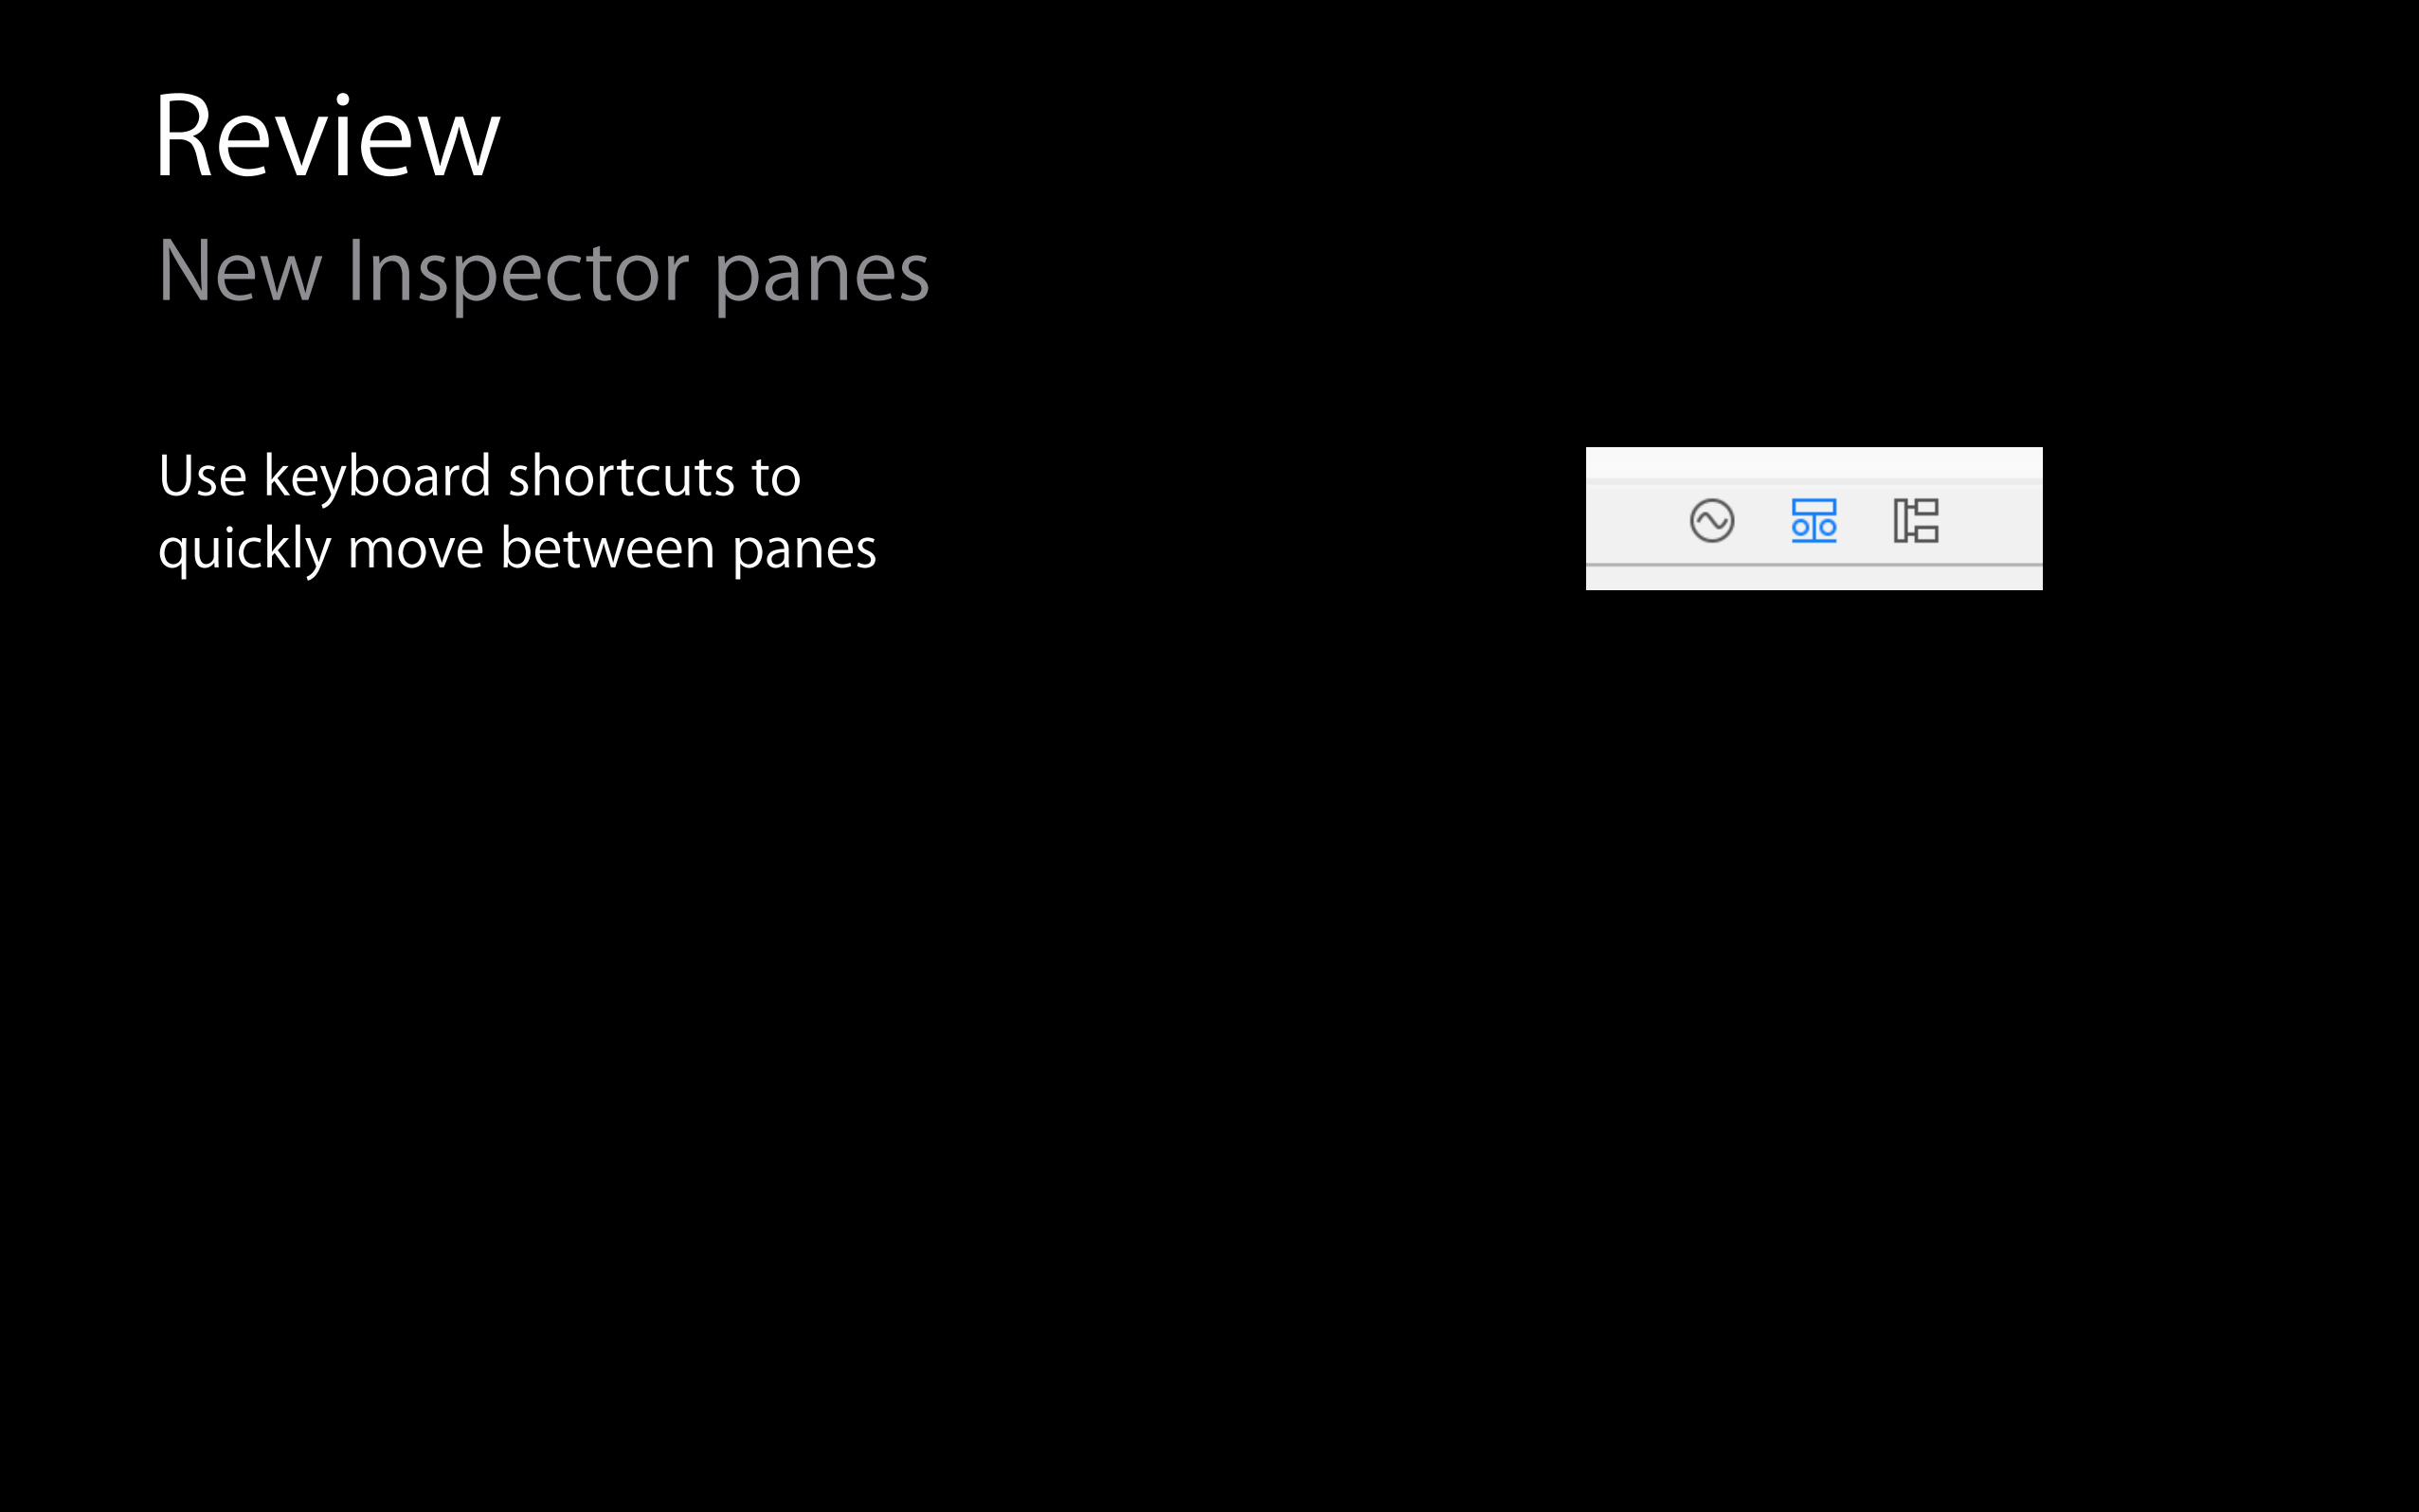
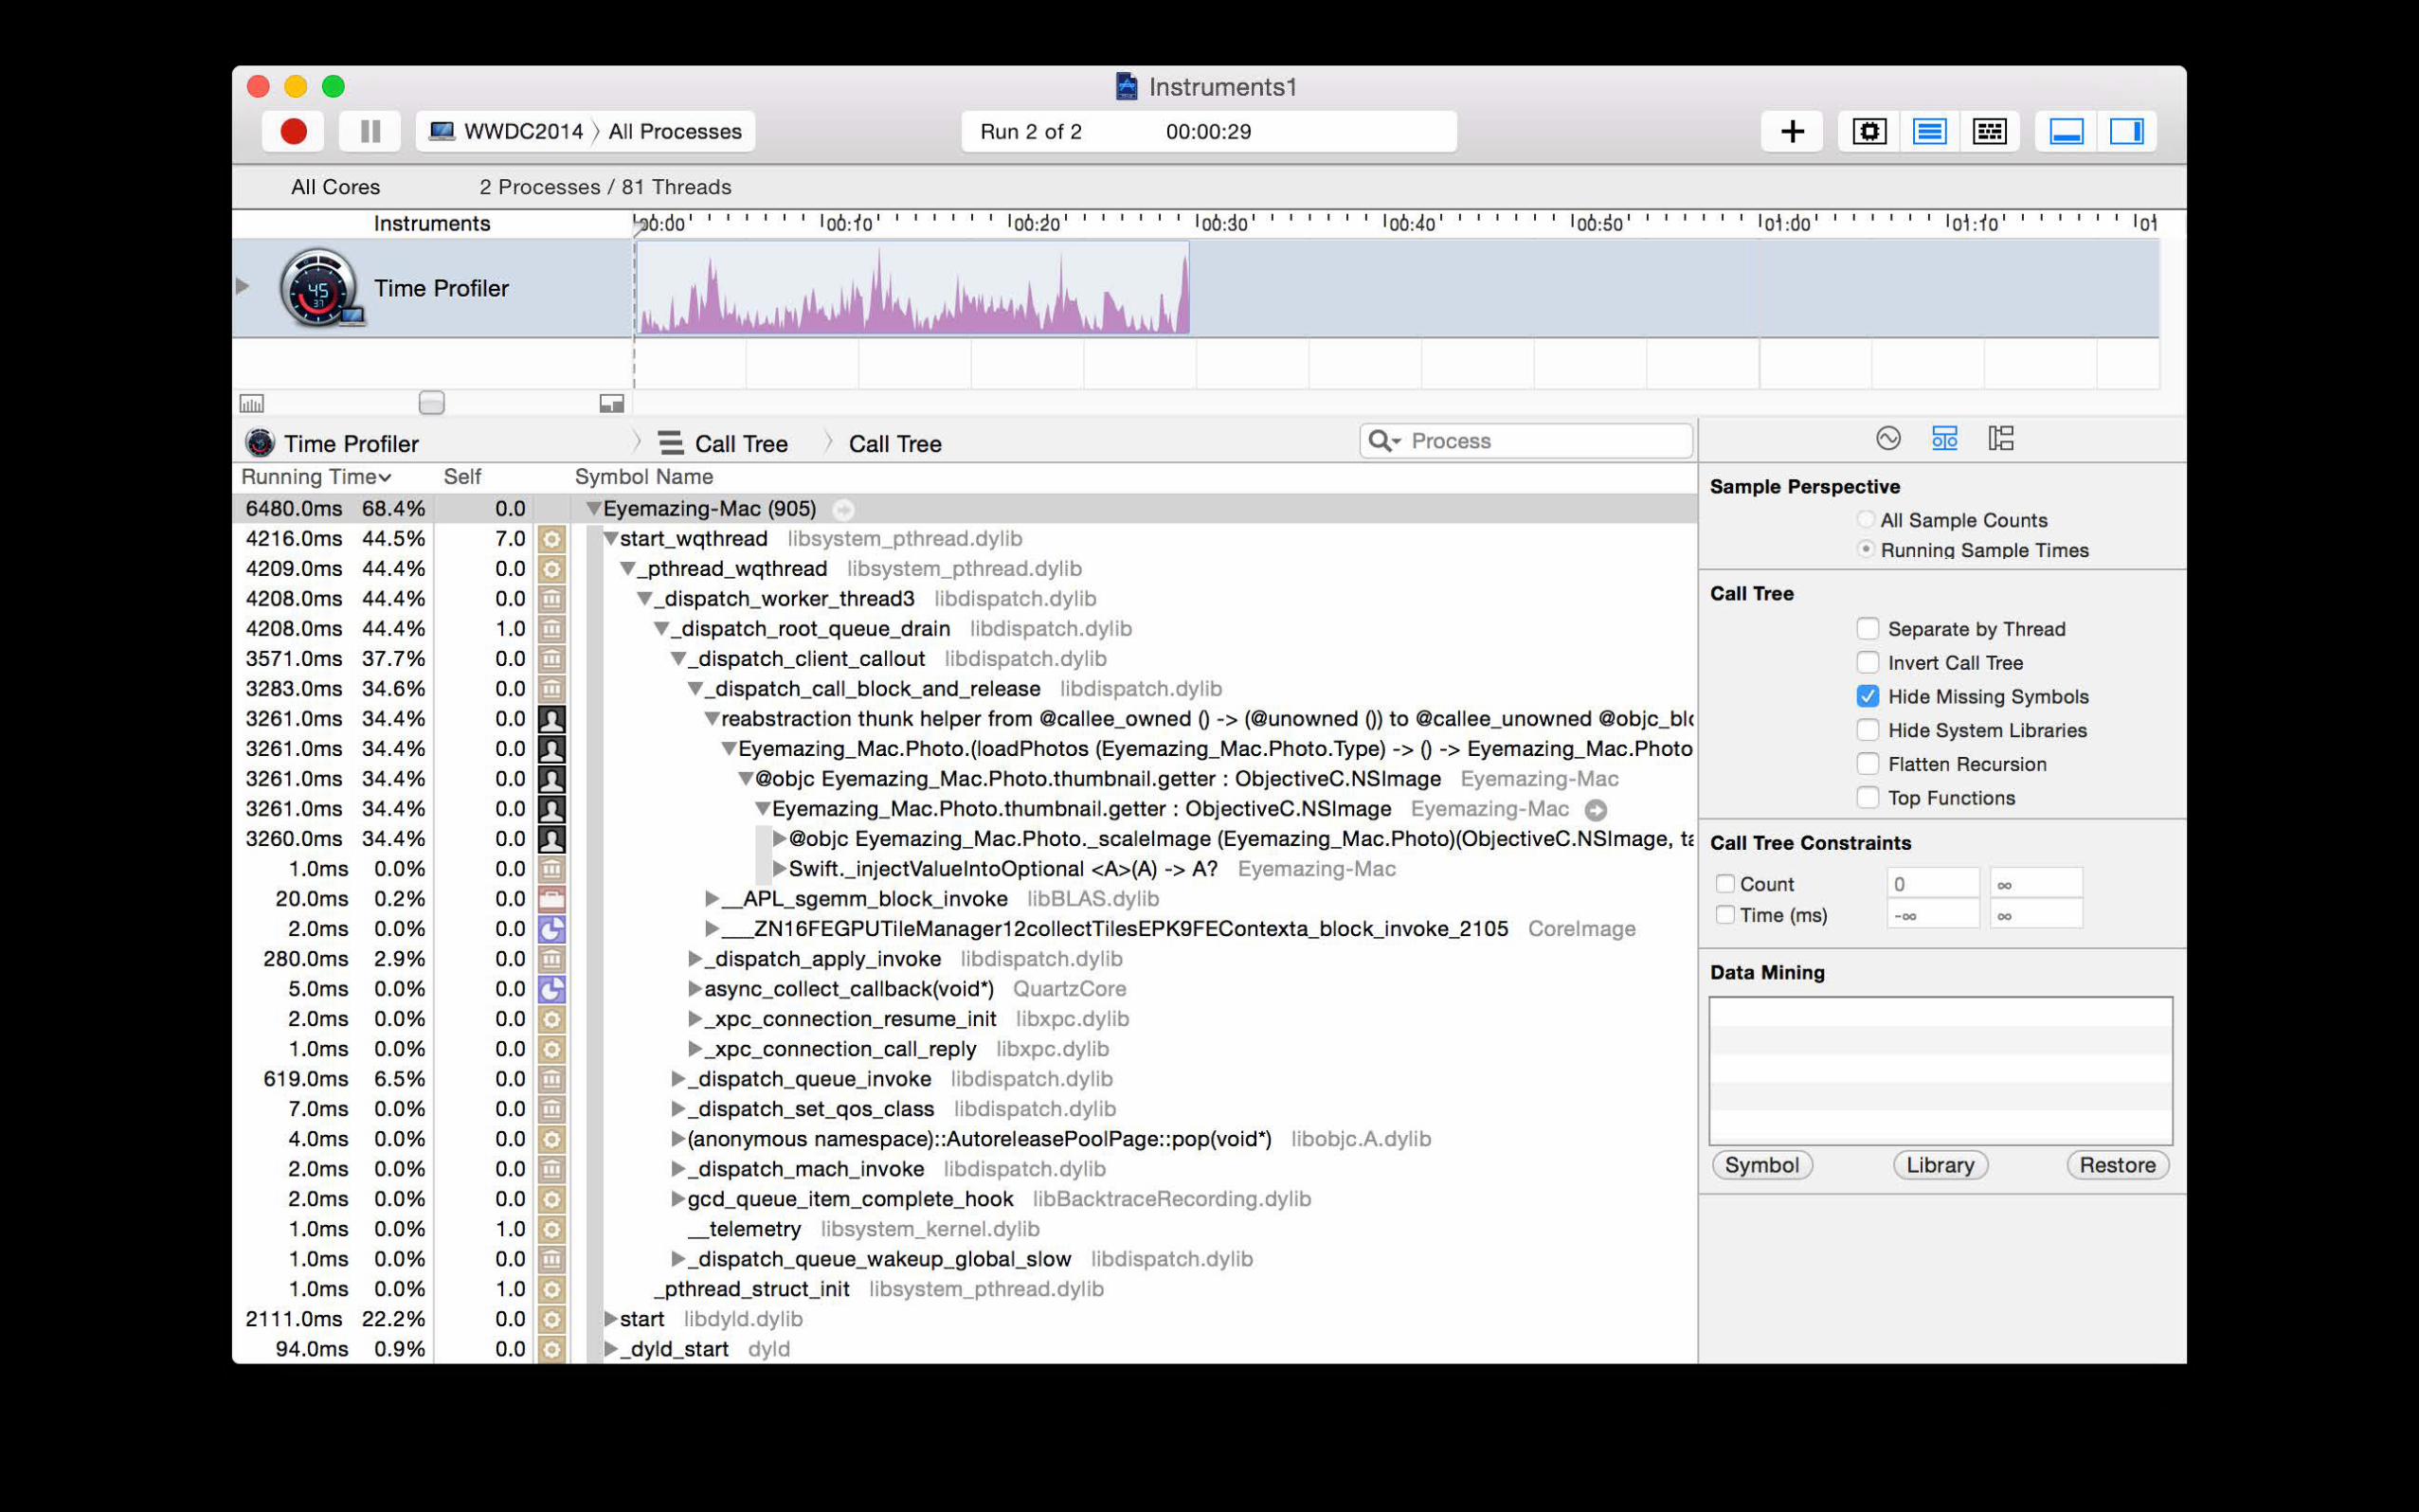
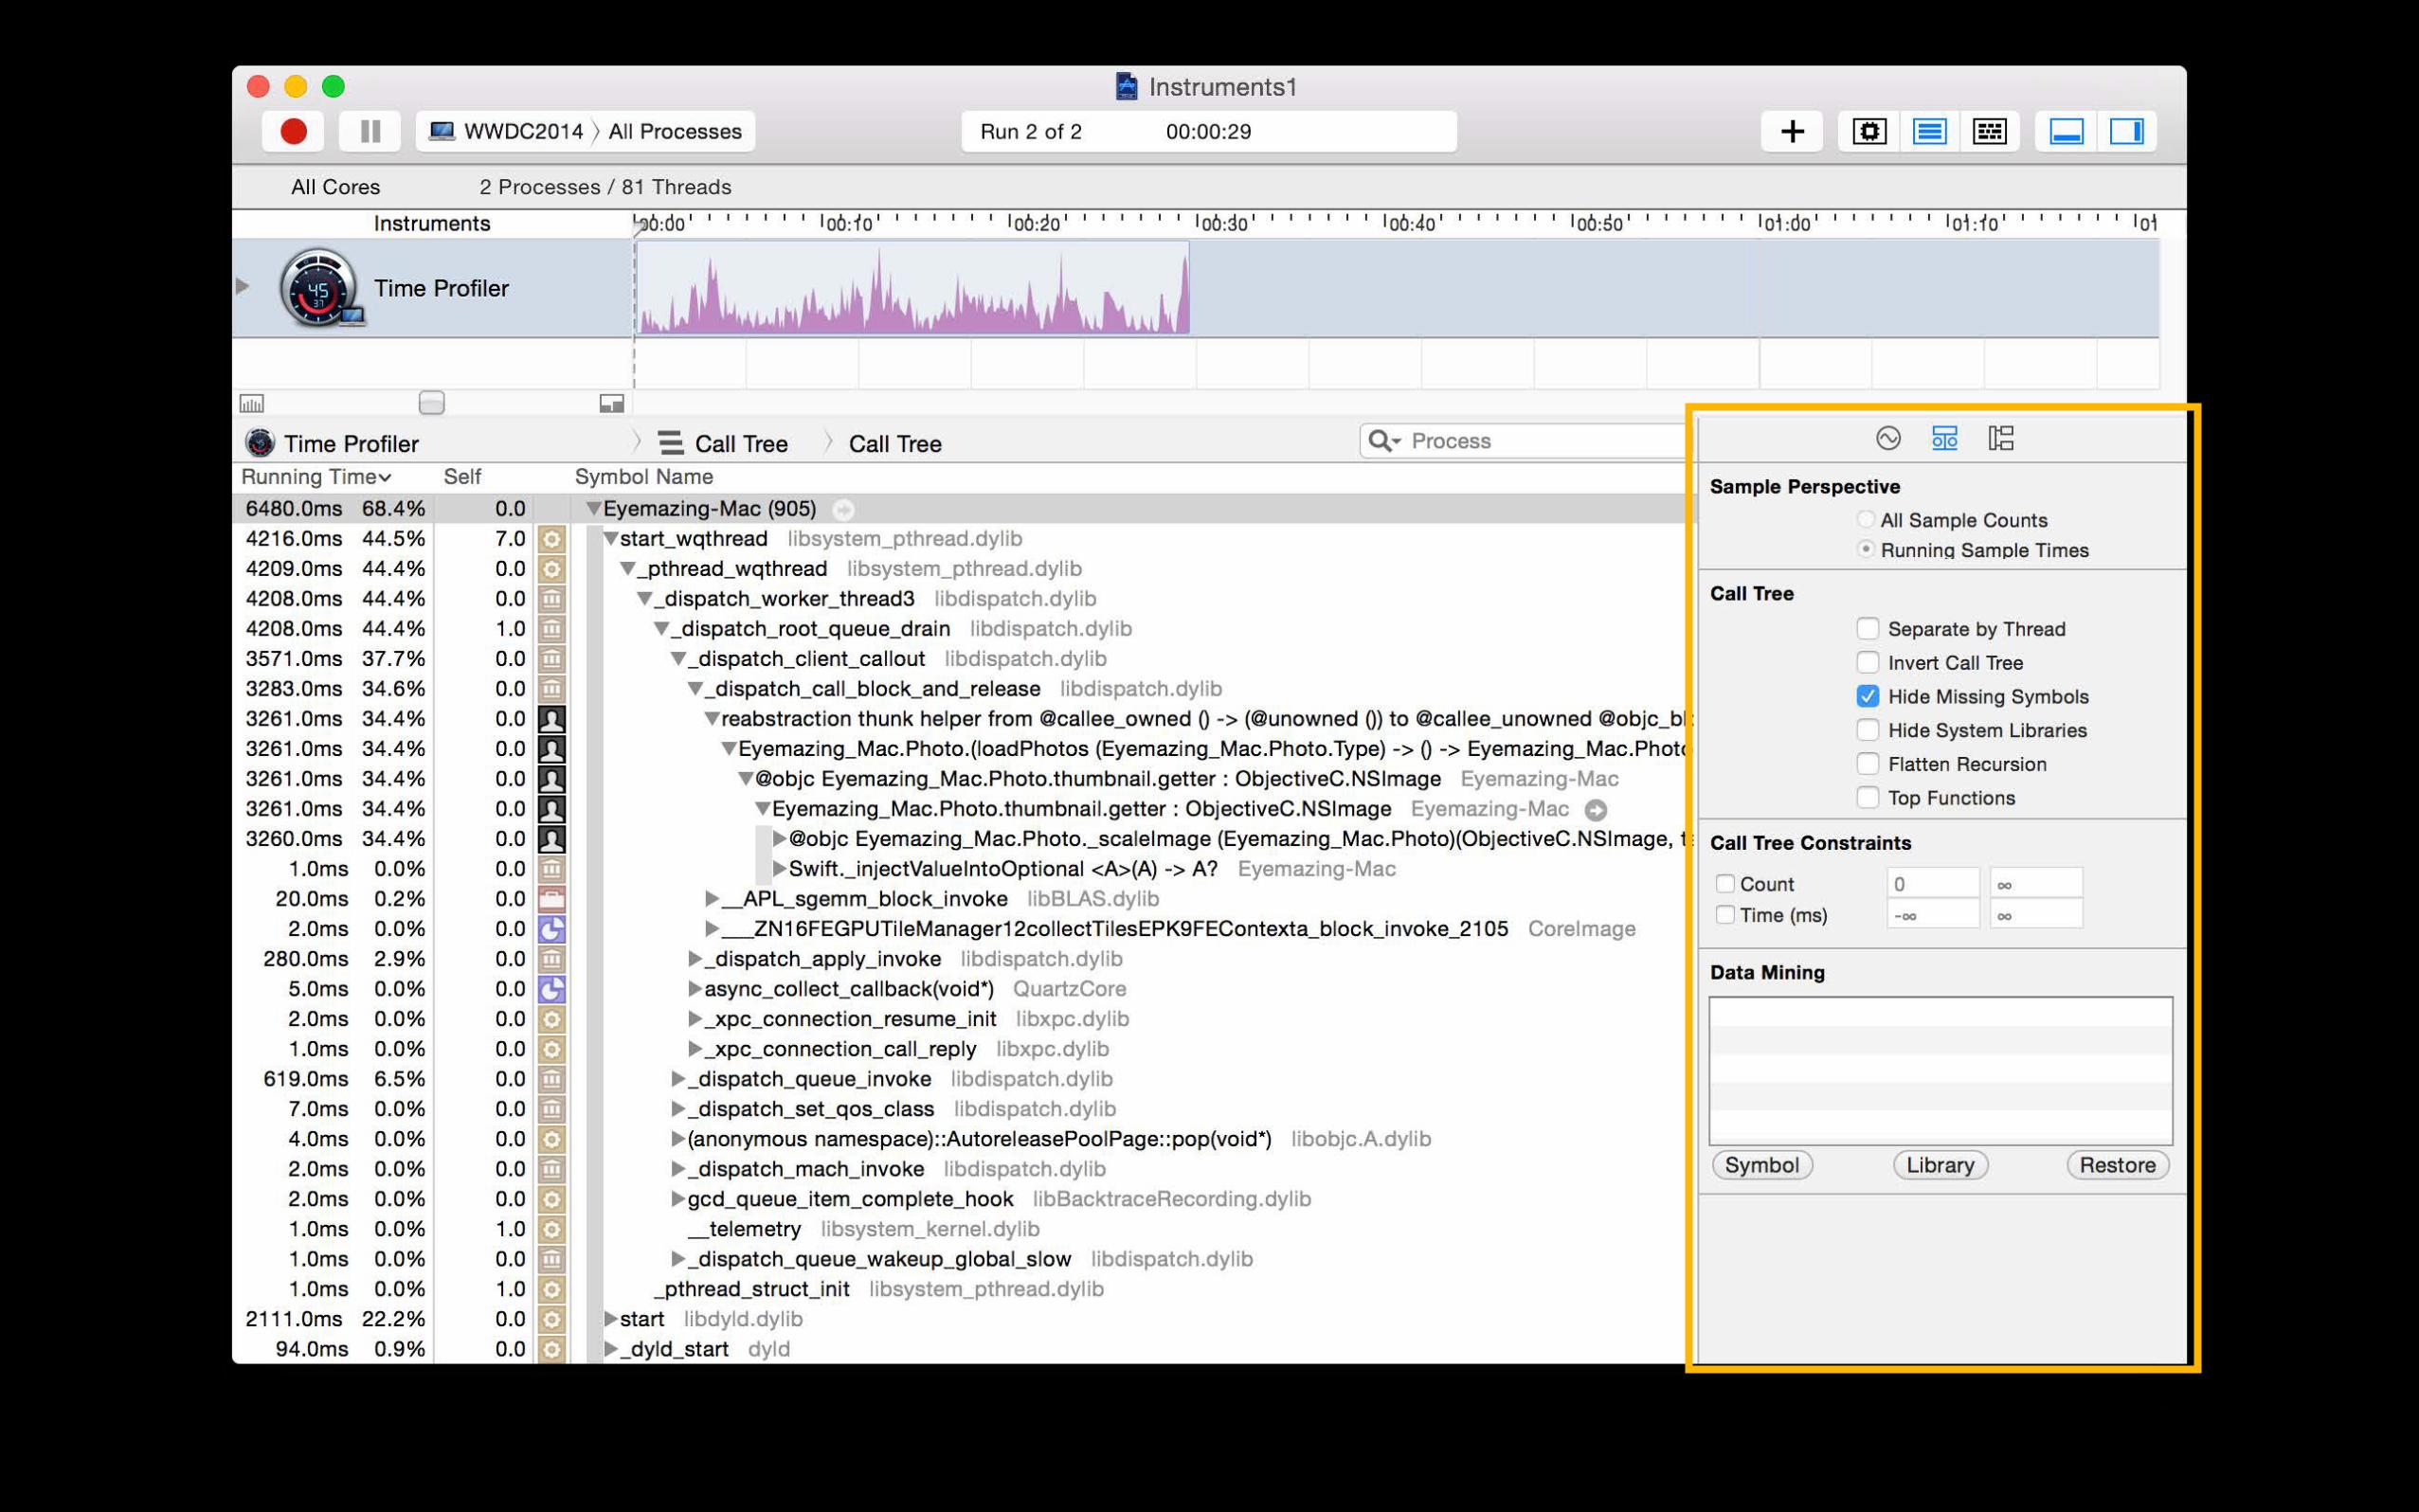
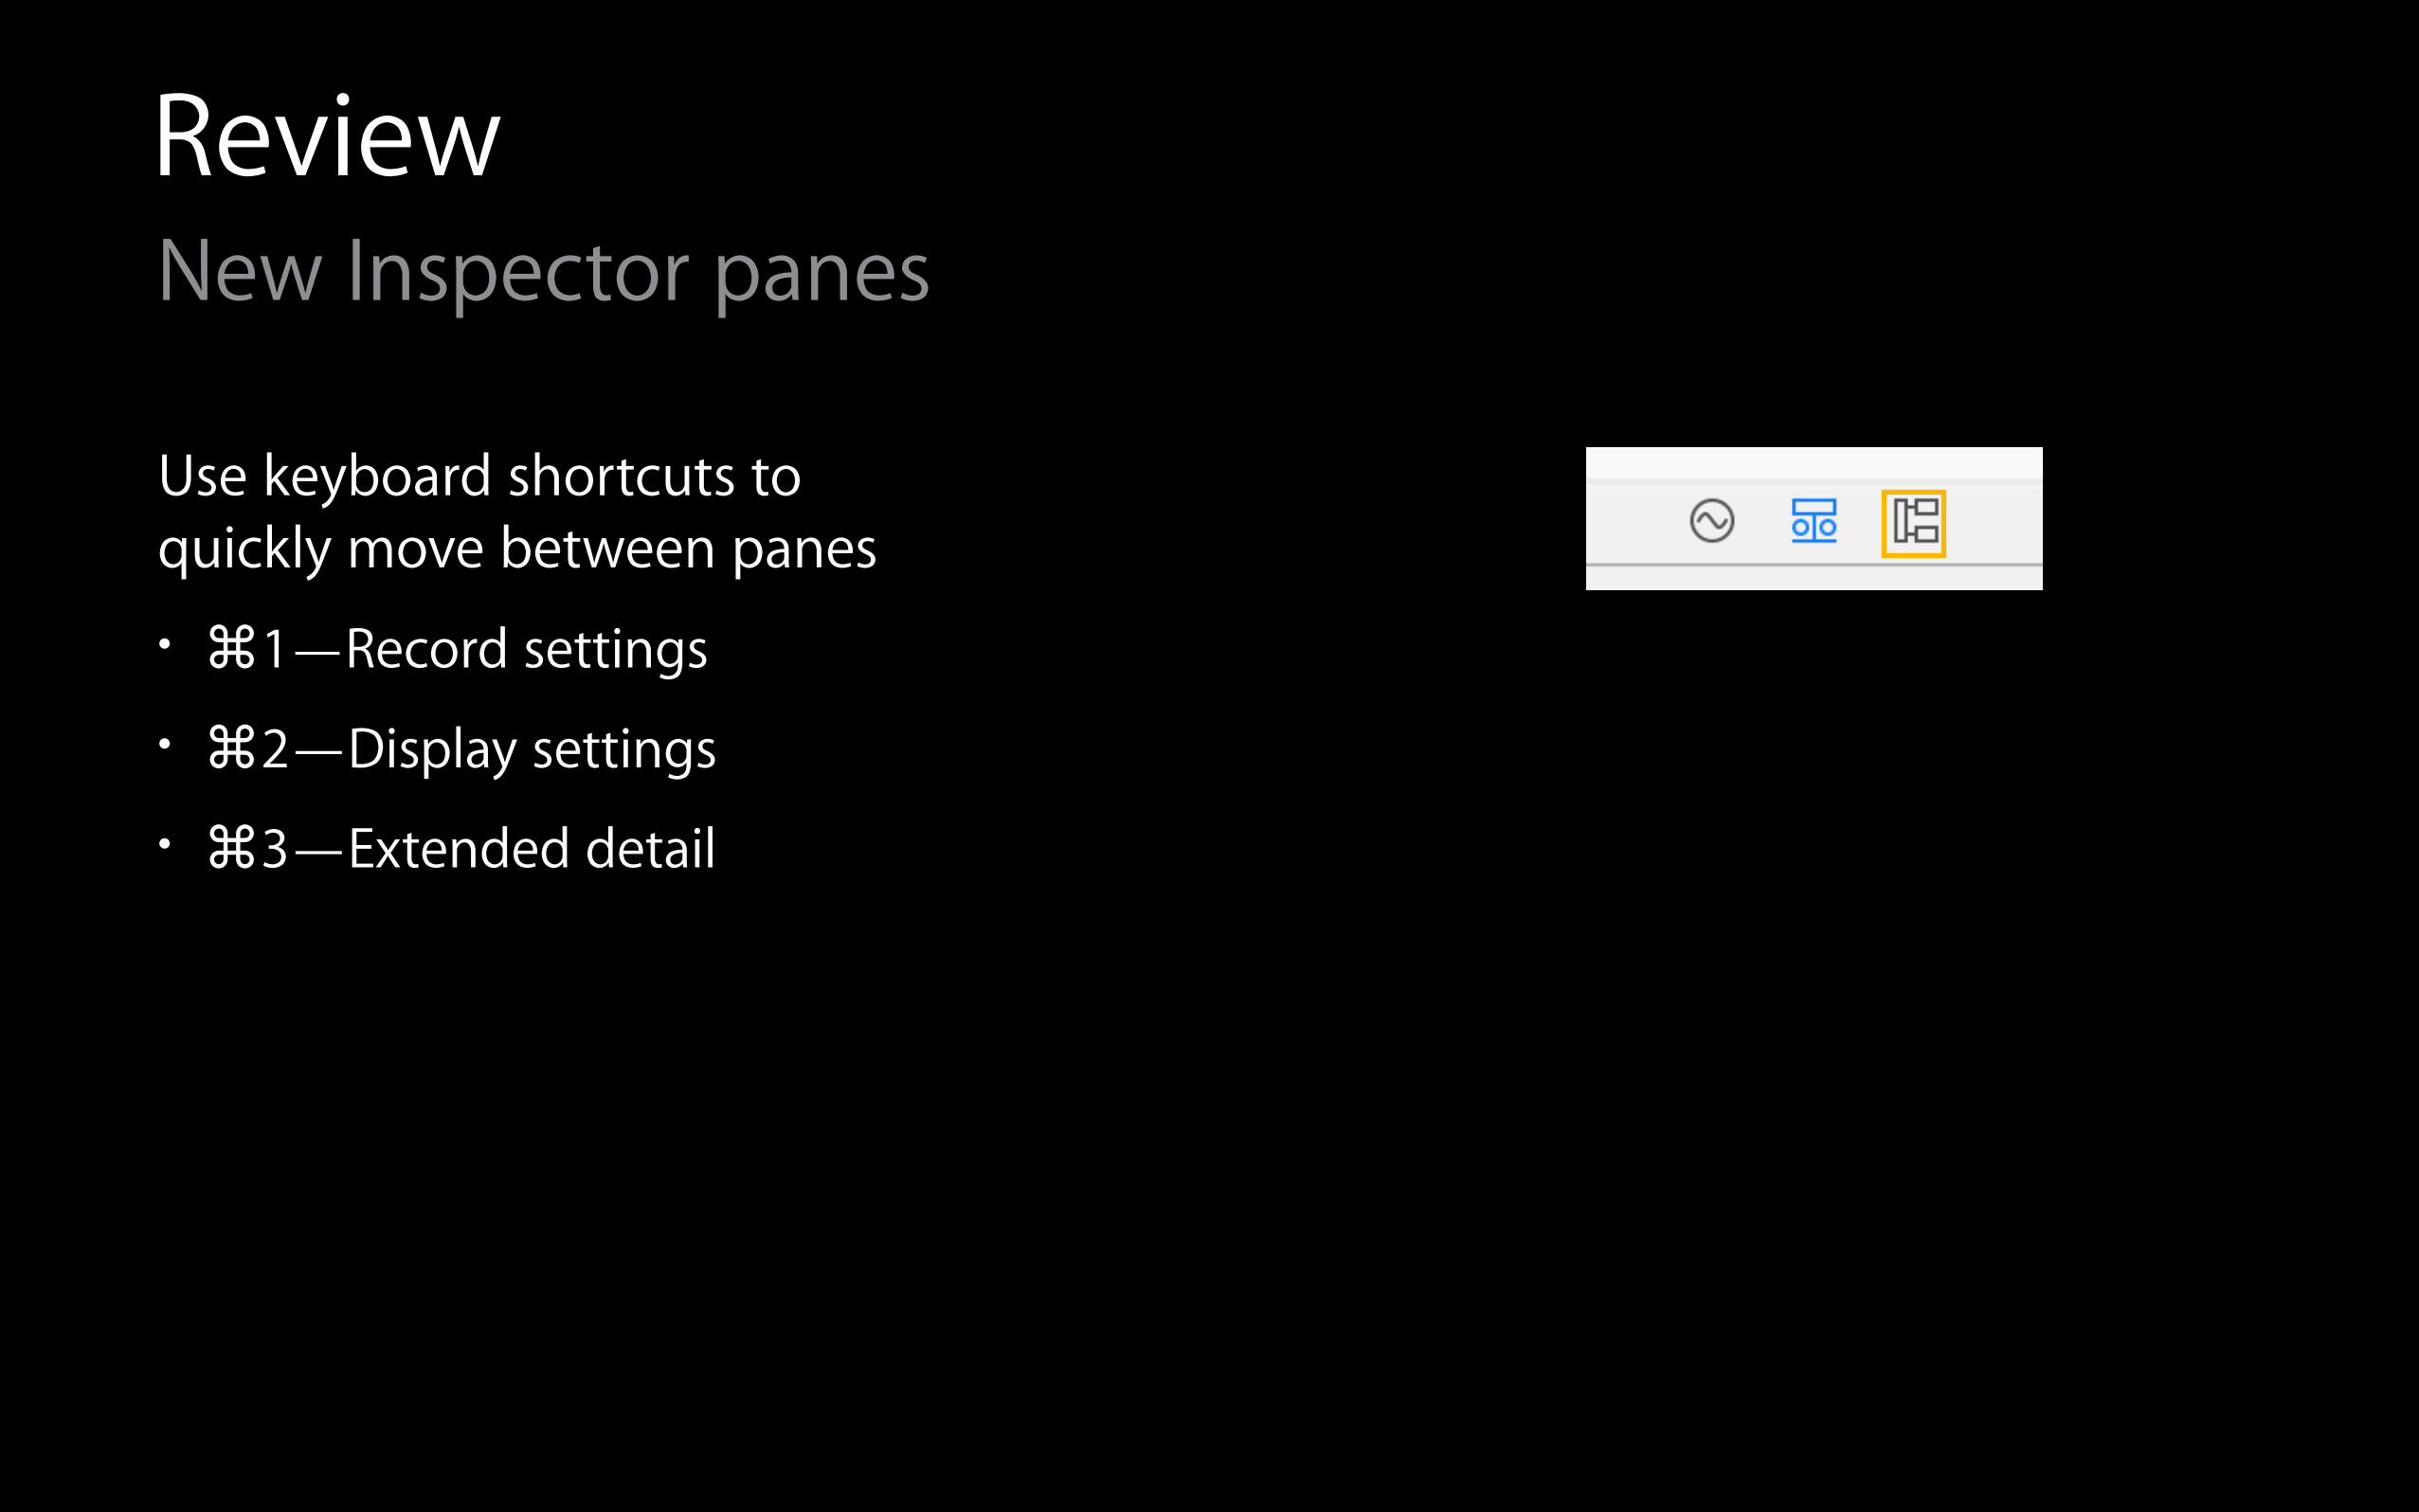
ReviewNew Inspector panes
Use keyboard shortcuts to quickly move between panes
ReviewNew Inspector panes
Use keyboard shortcuts to quickly move between panes
• ⌘1—Record settings
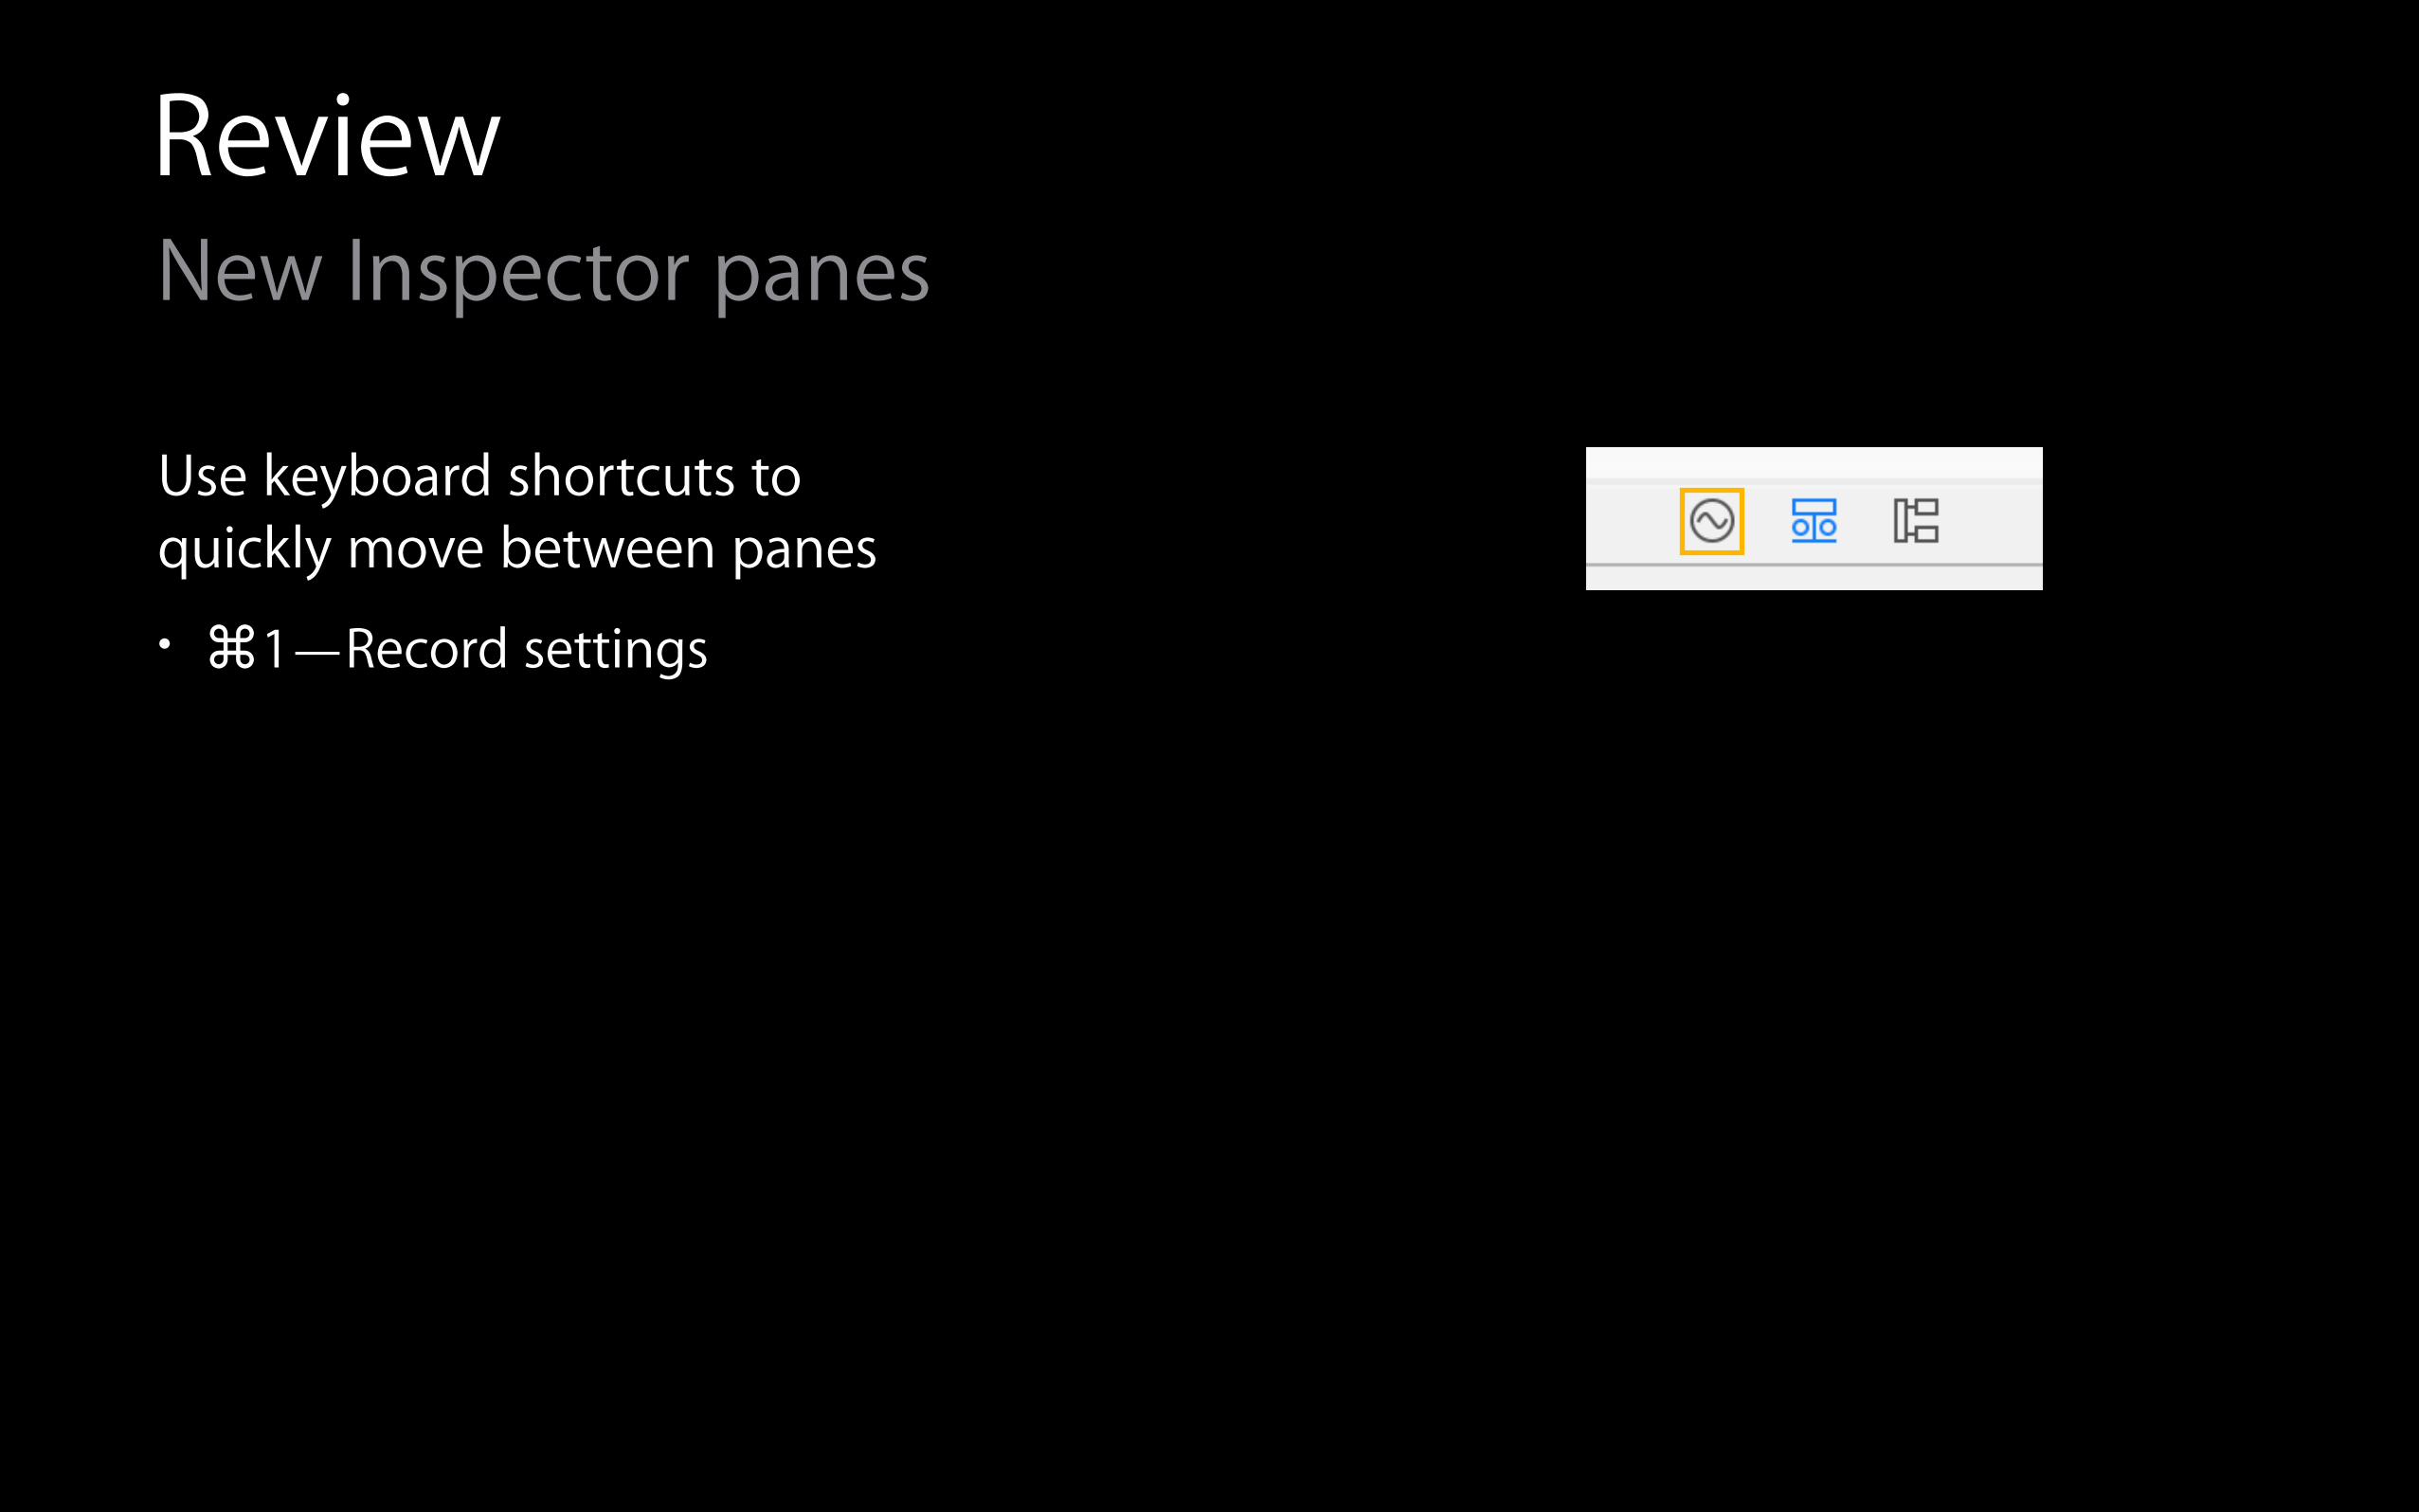
ReviewNew Inspector panes
Use keyboard shortcuts to quickly move between panes
• ⌘1—Record settings
• ⌘2—Display settings
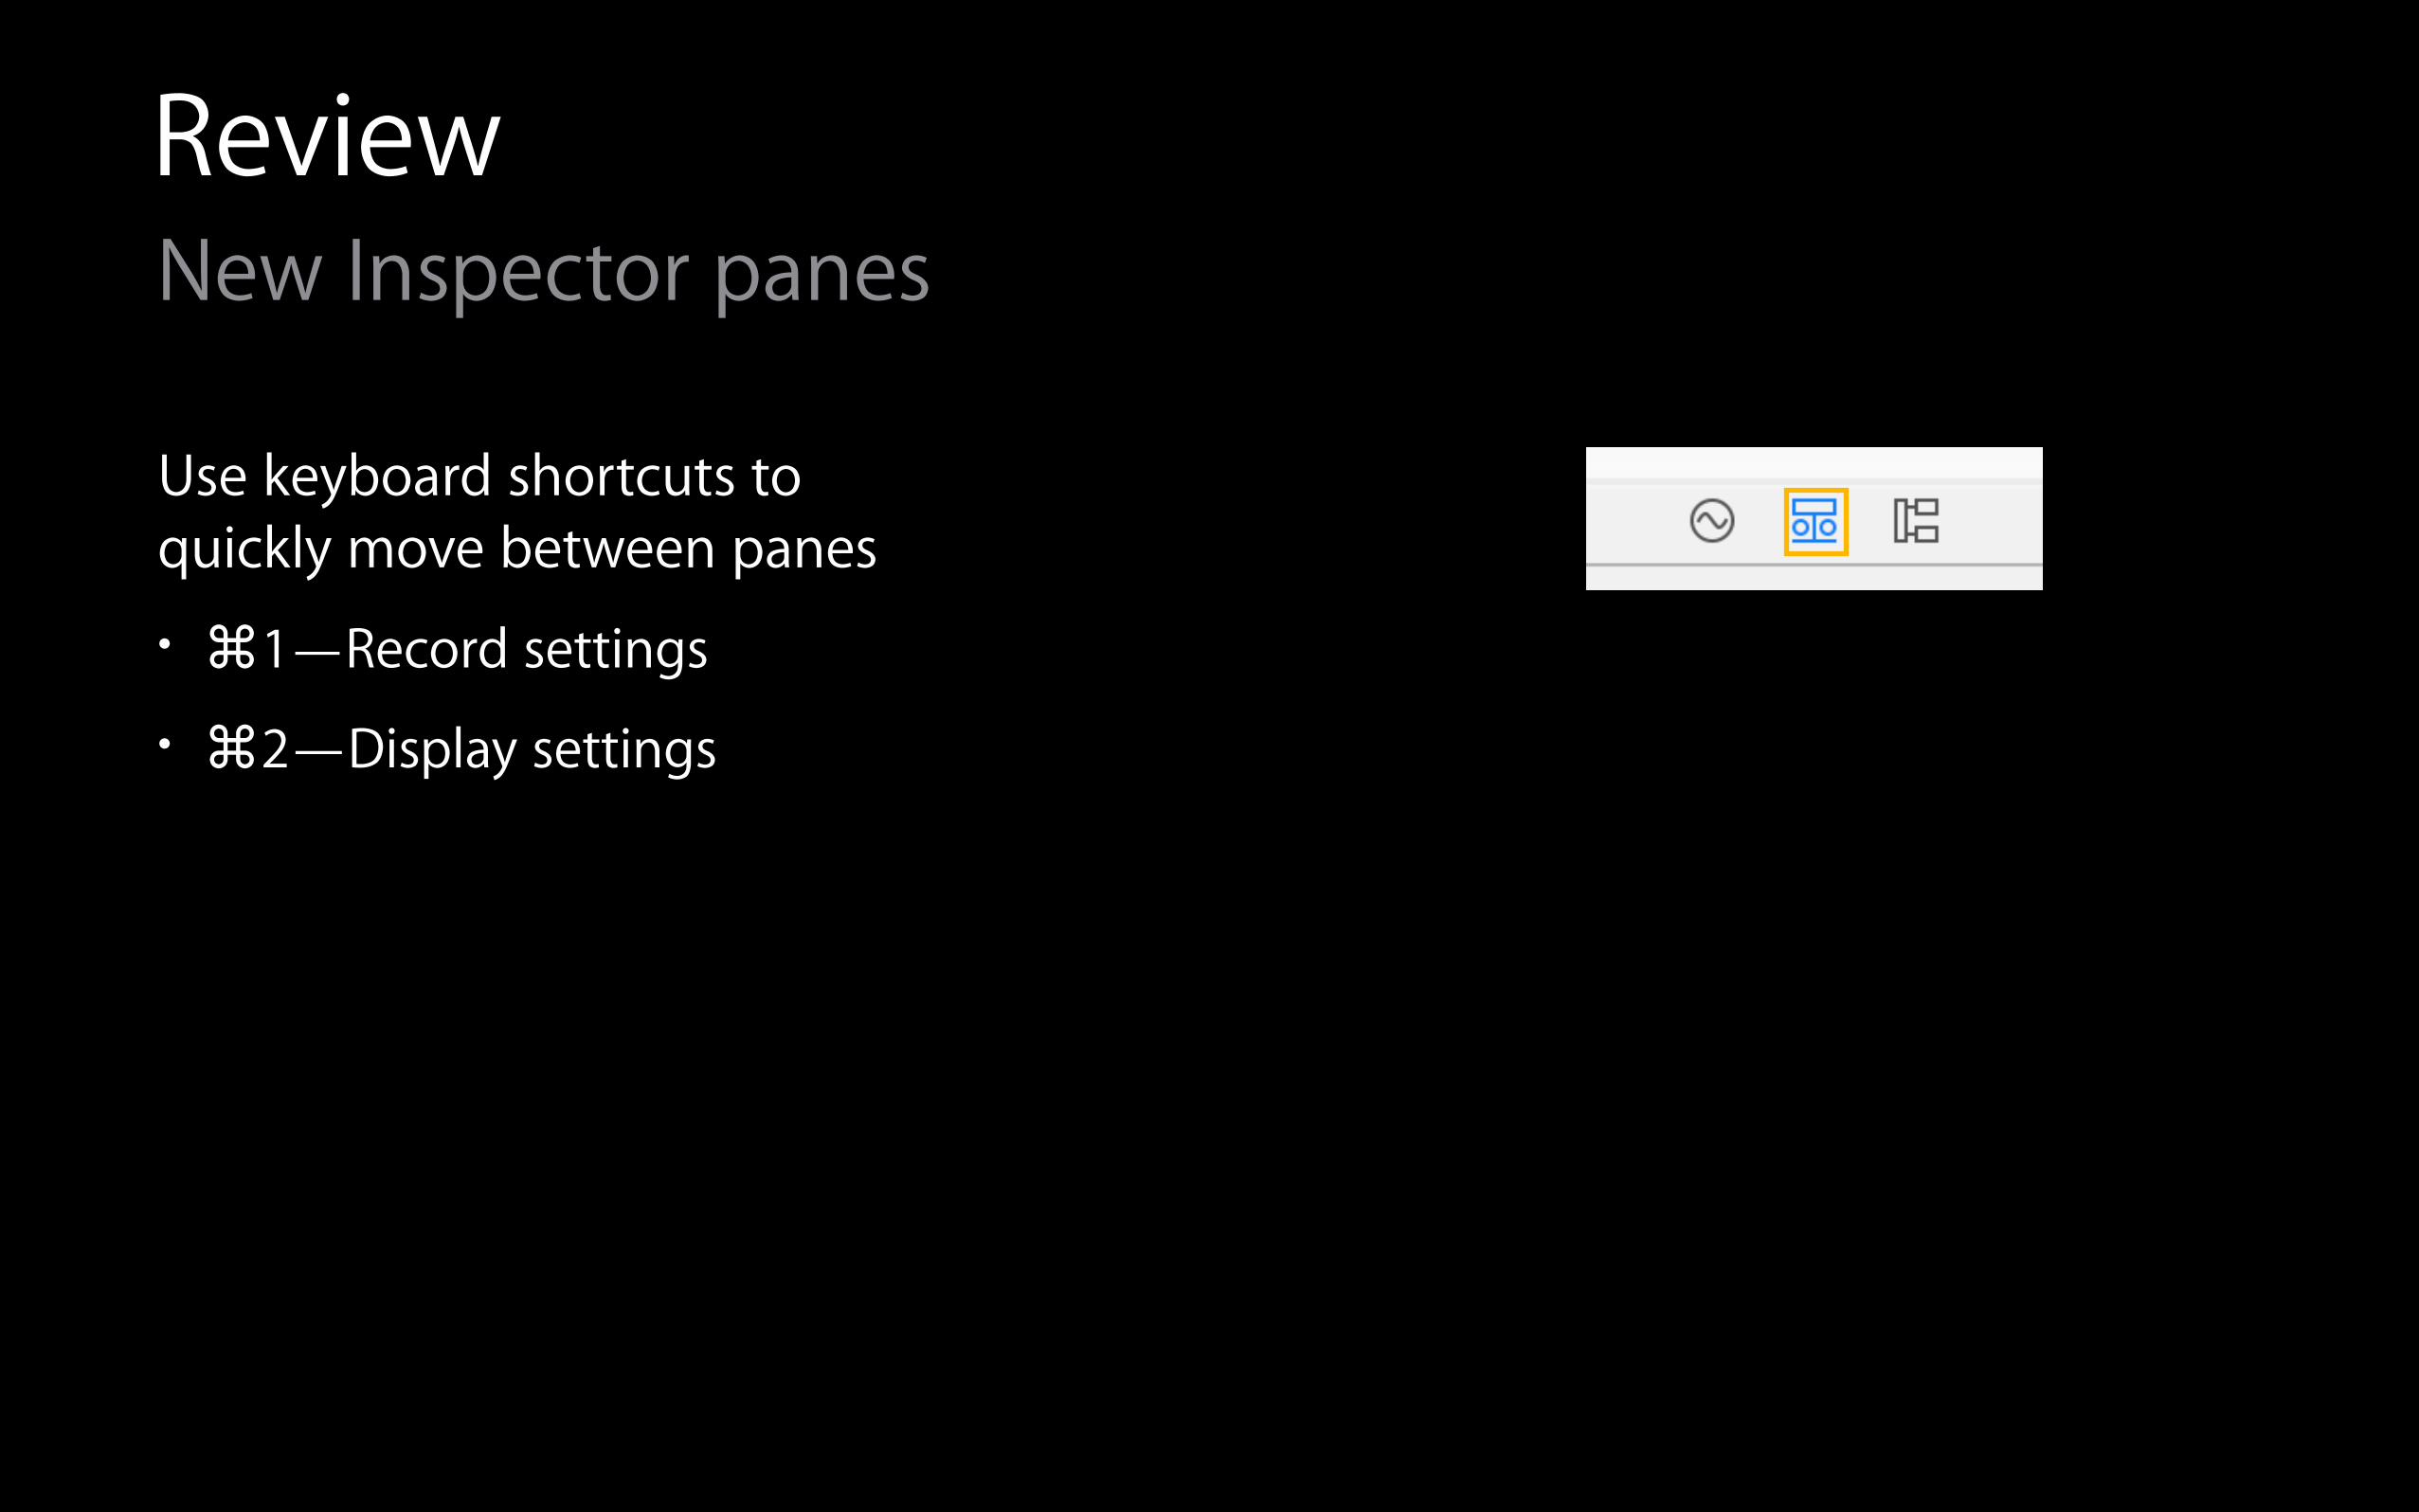
ReviewNew Inspector panes
Use keyboard shortcuts to quickly move between panes
• ⌘1—Record settings
• ⌘2—Display settings
• ⌘3—Extended detail
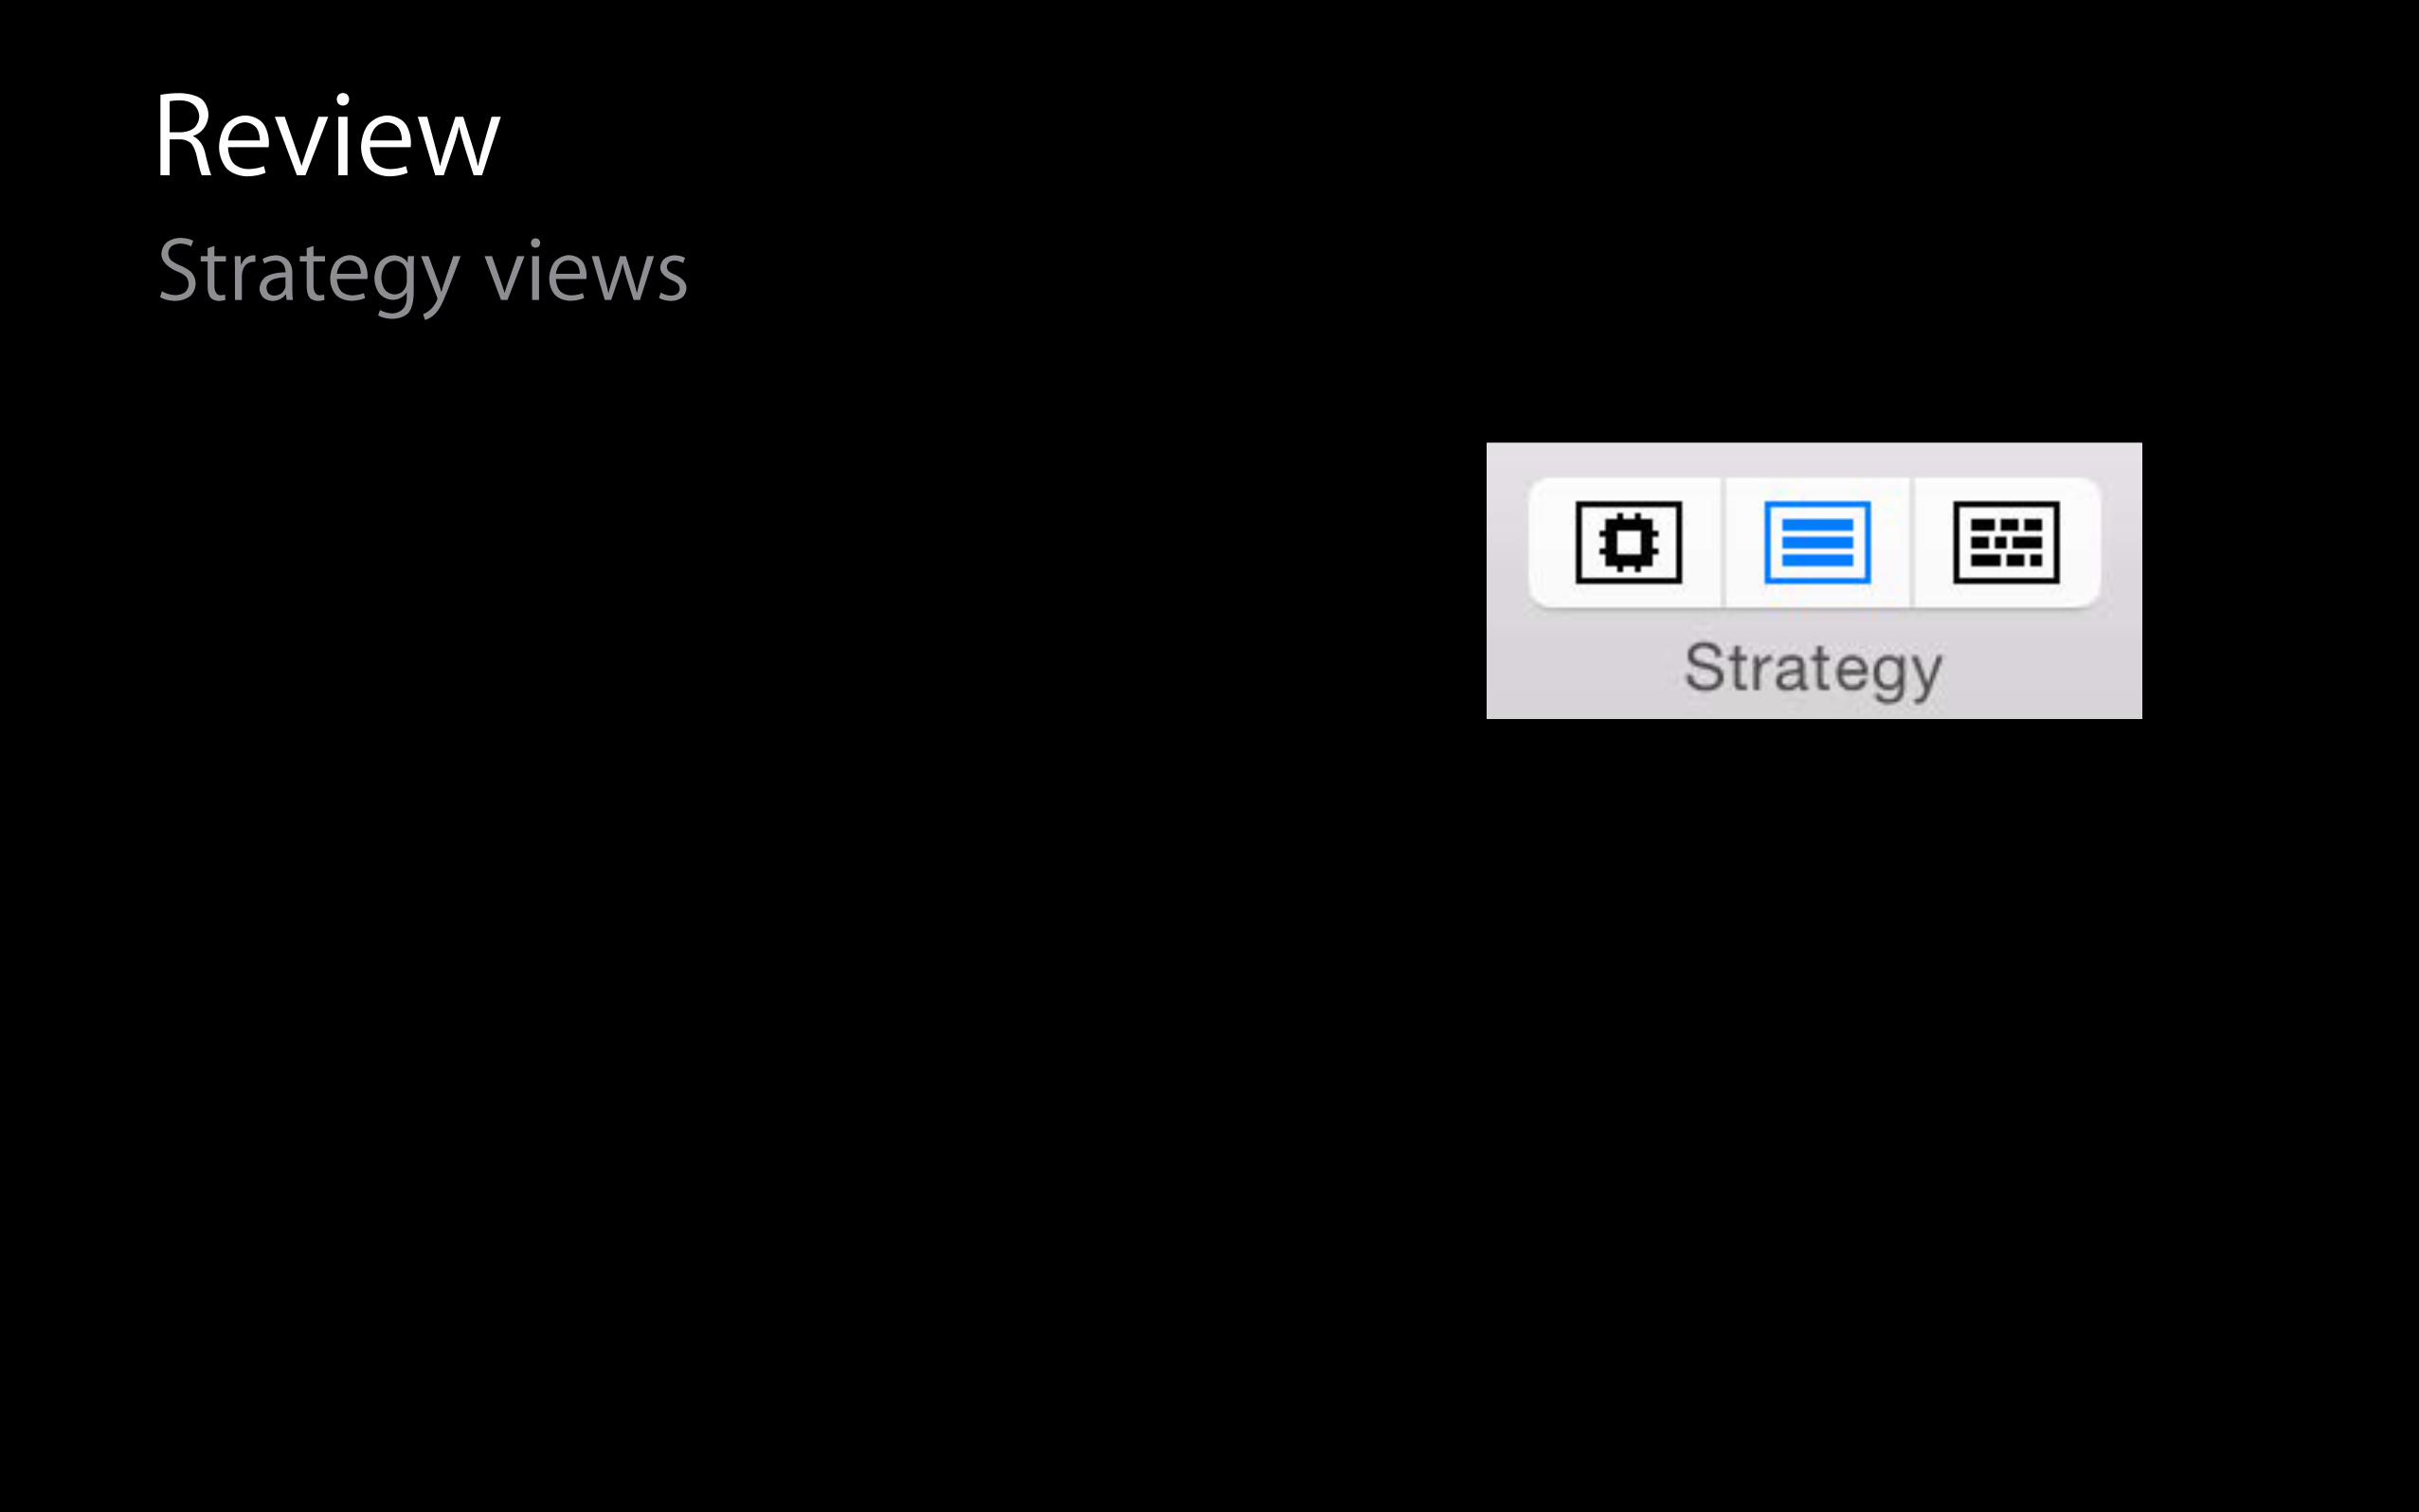
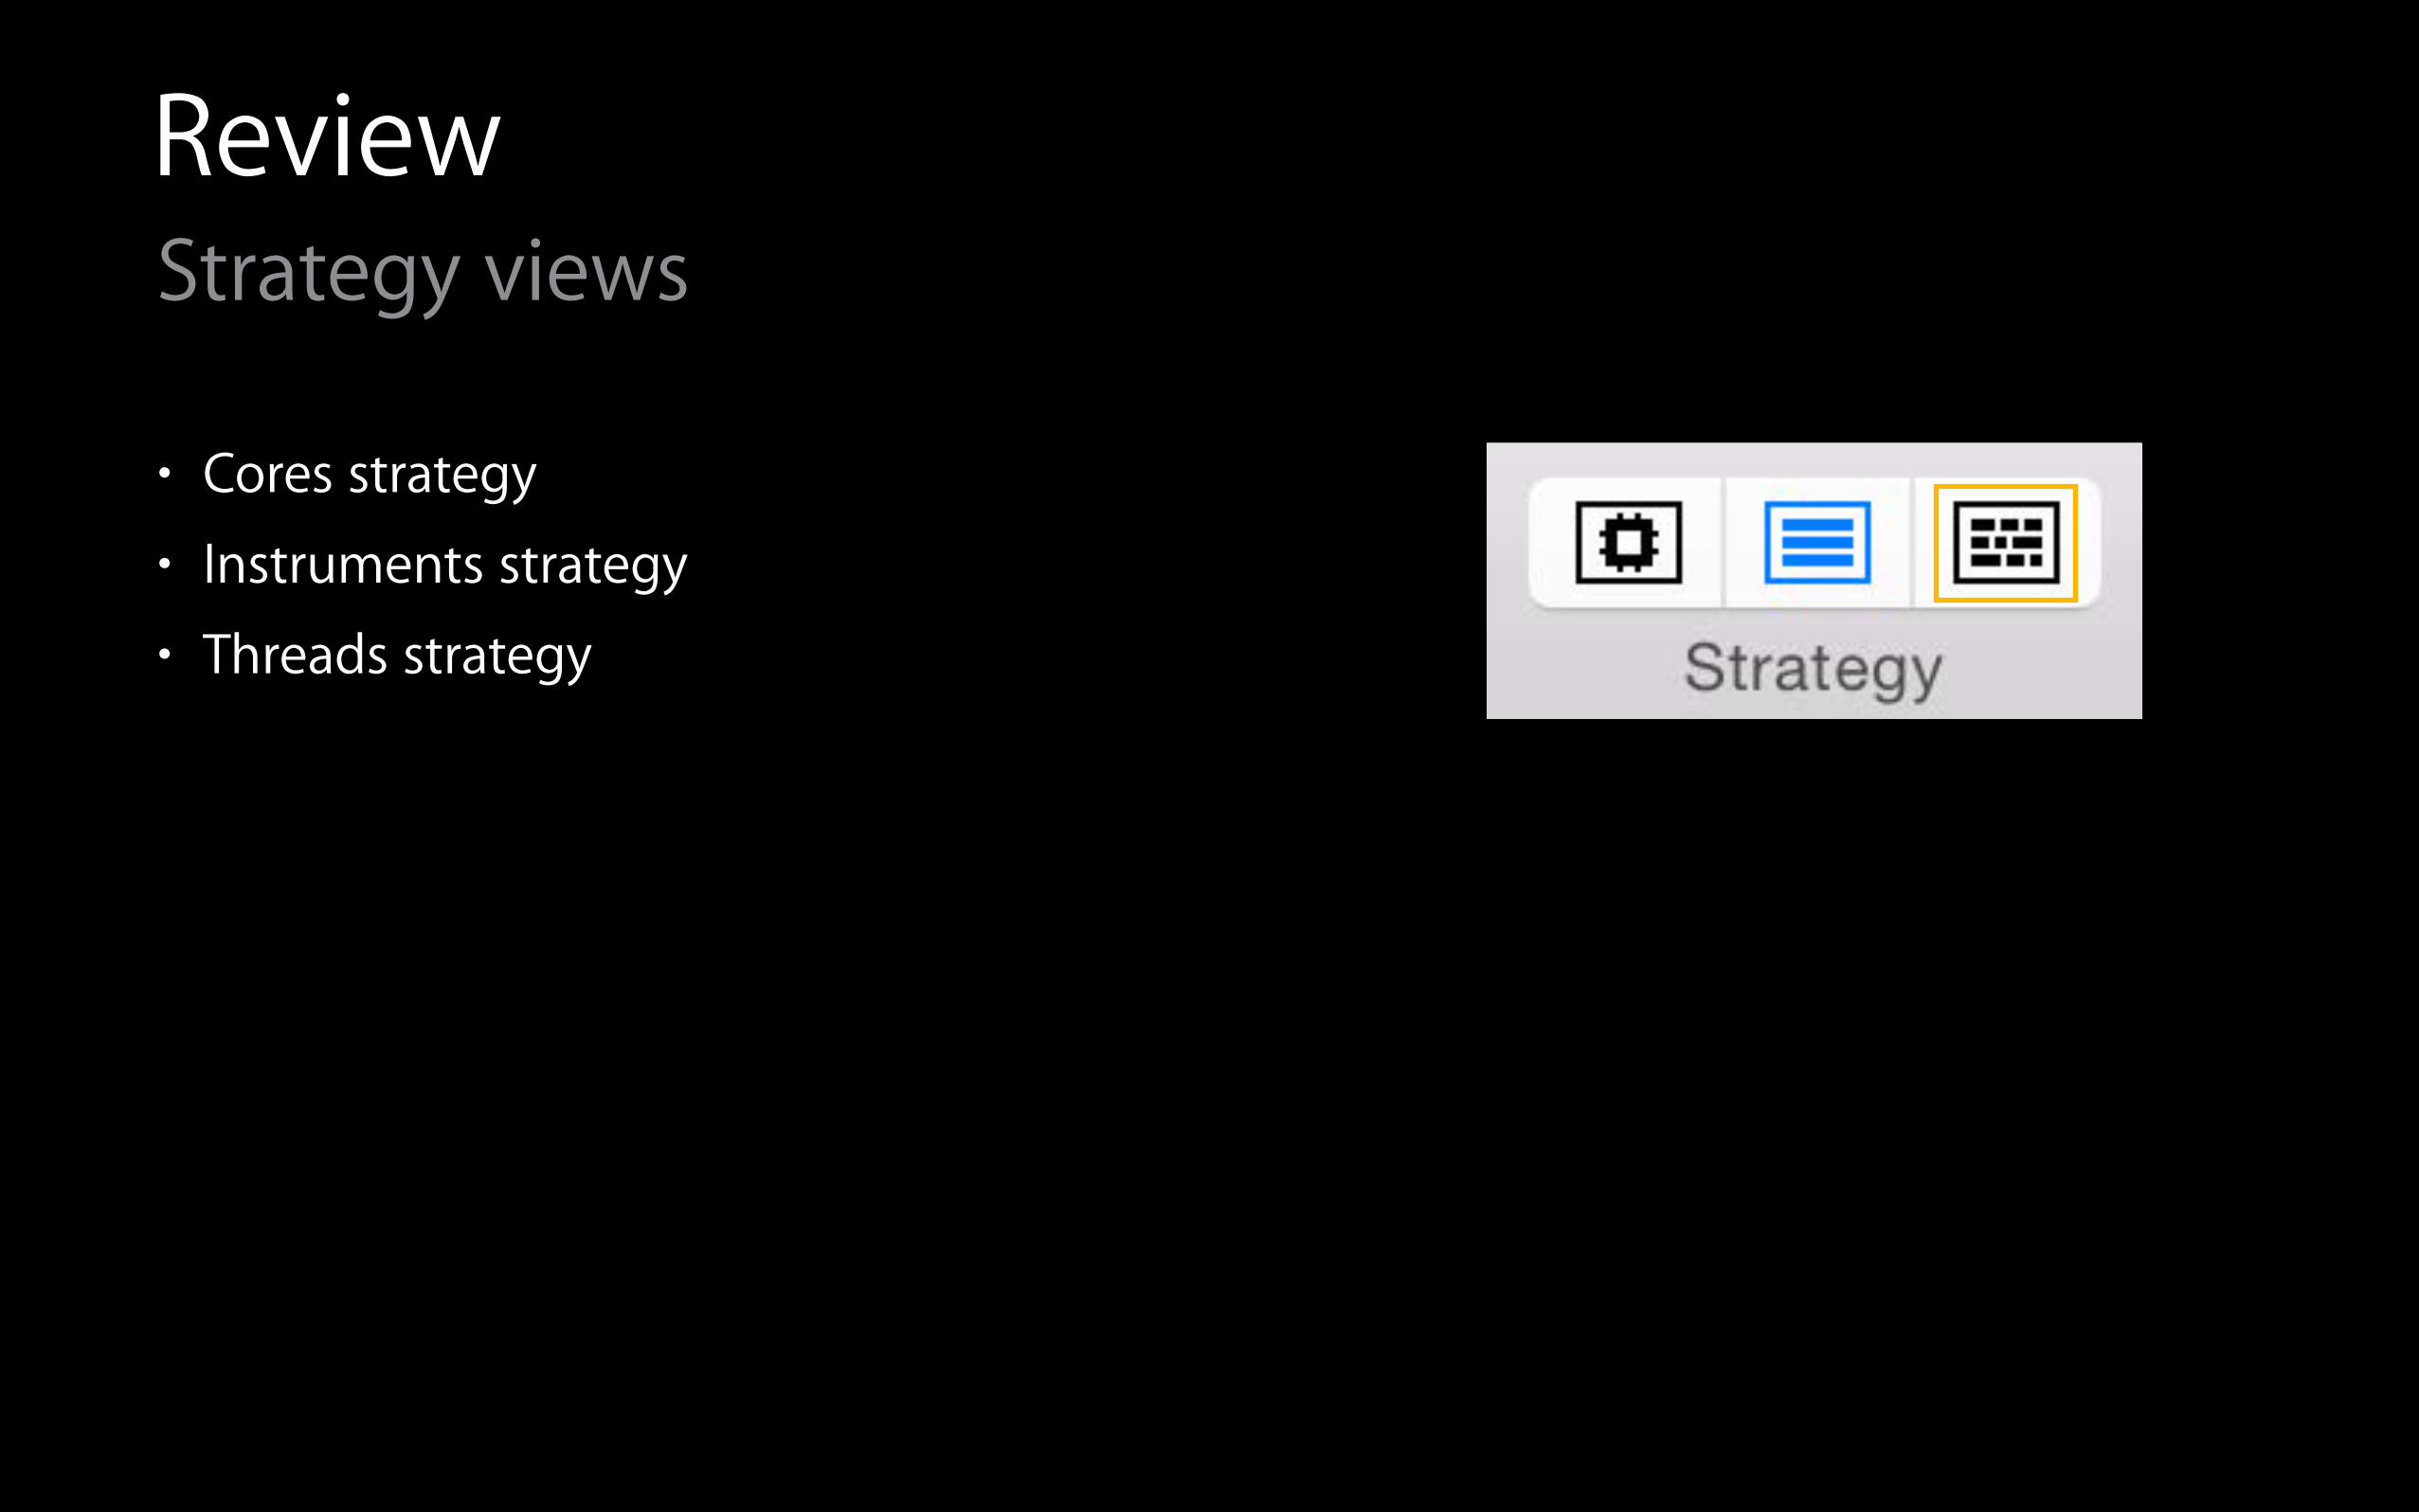
ReviewStrategy views
ReviewStrategy views
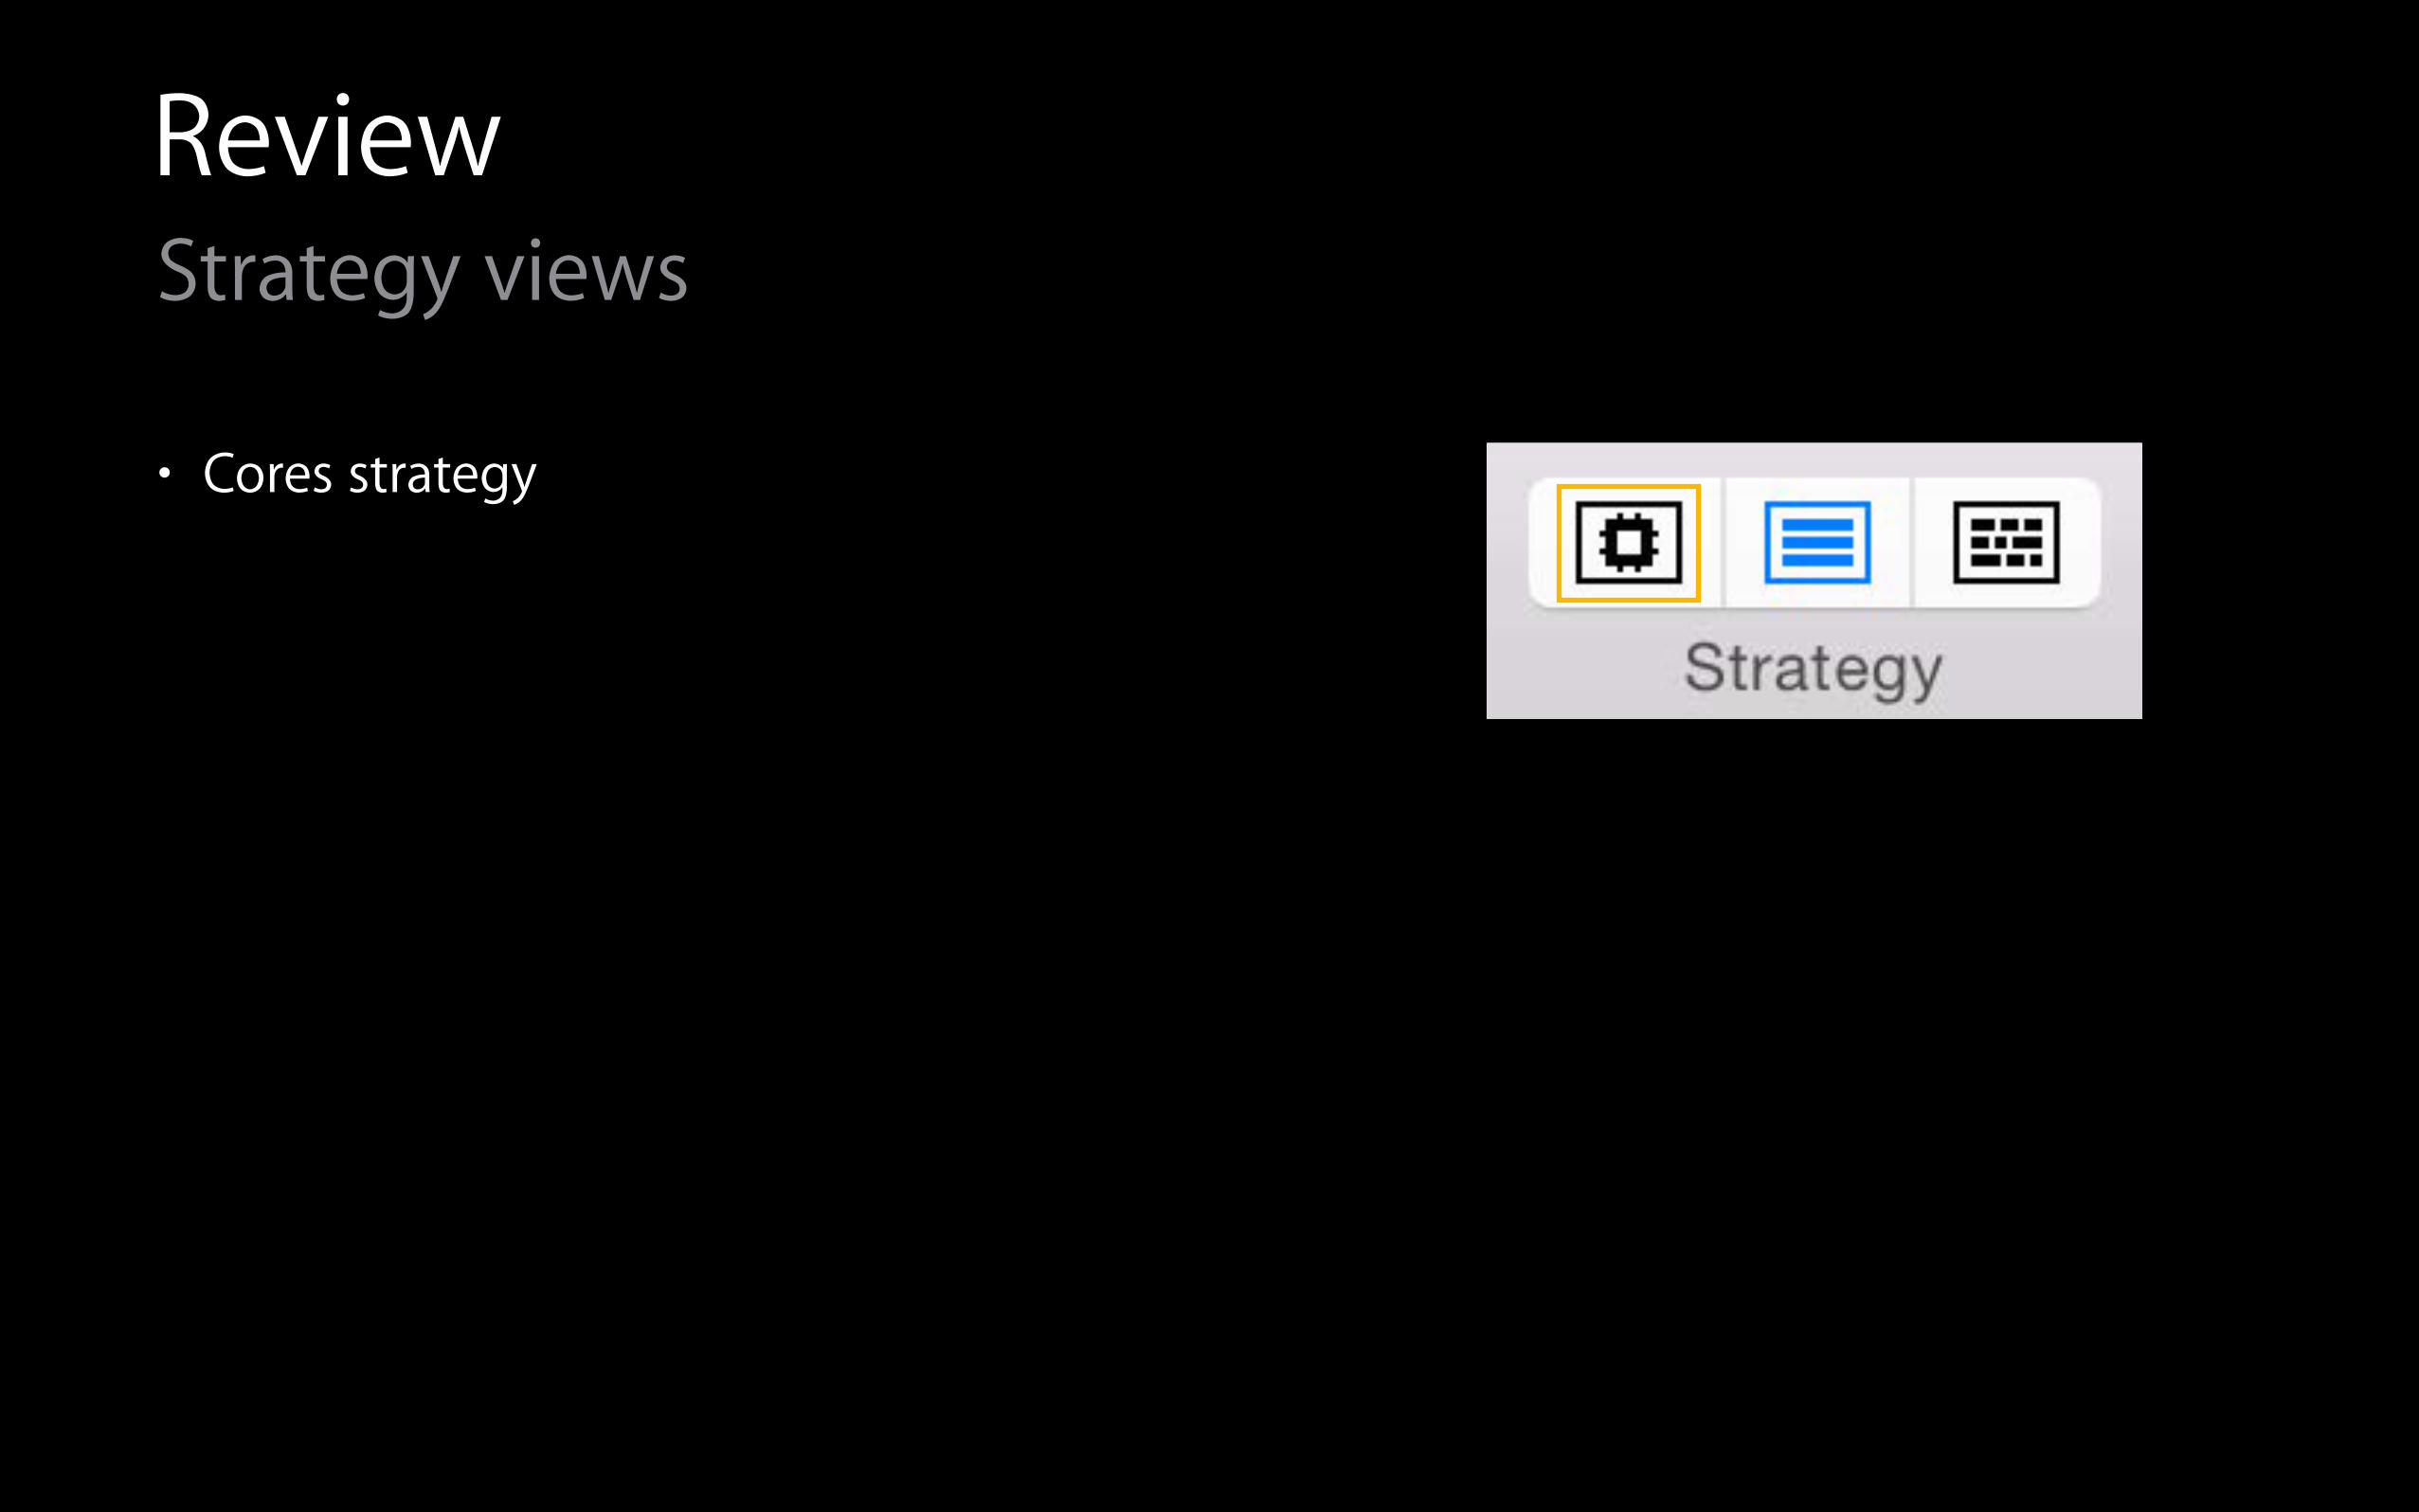
• Cores strategy
ReviewStrategy views
• Cores strategy
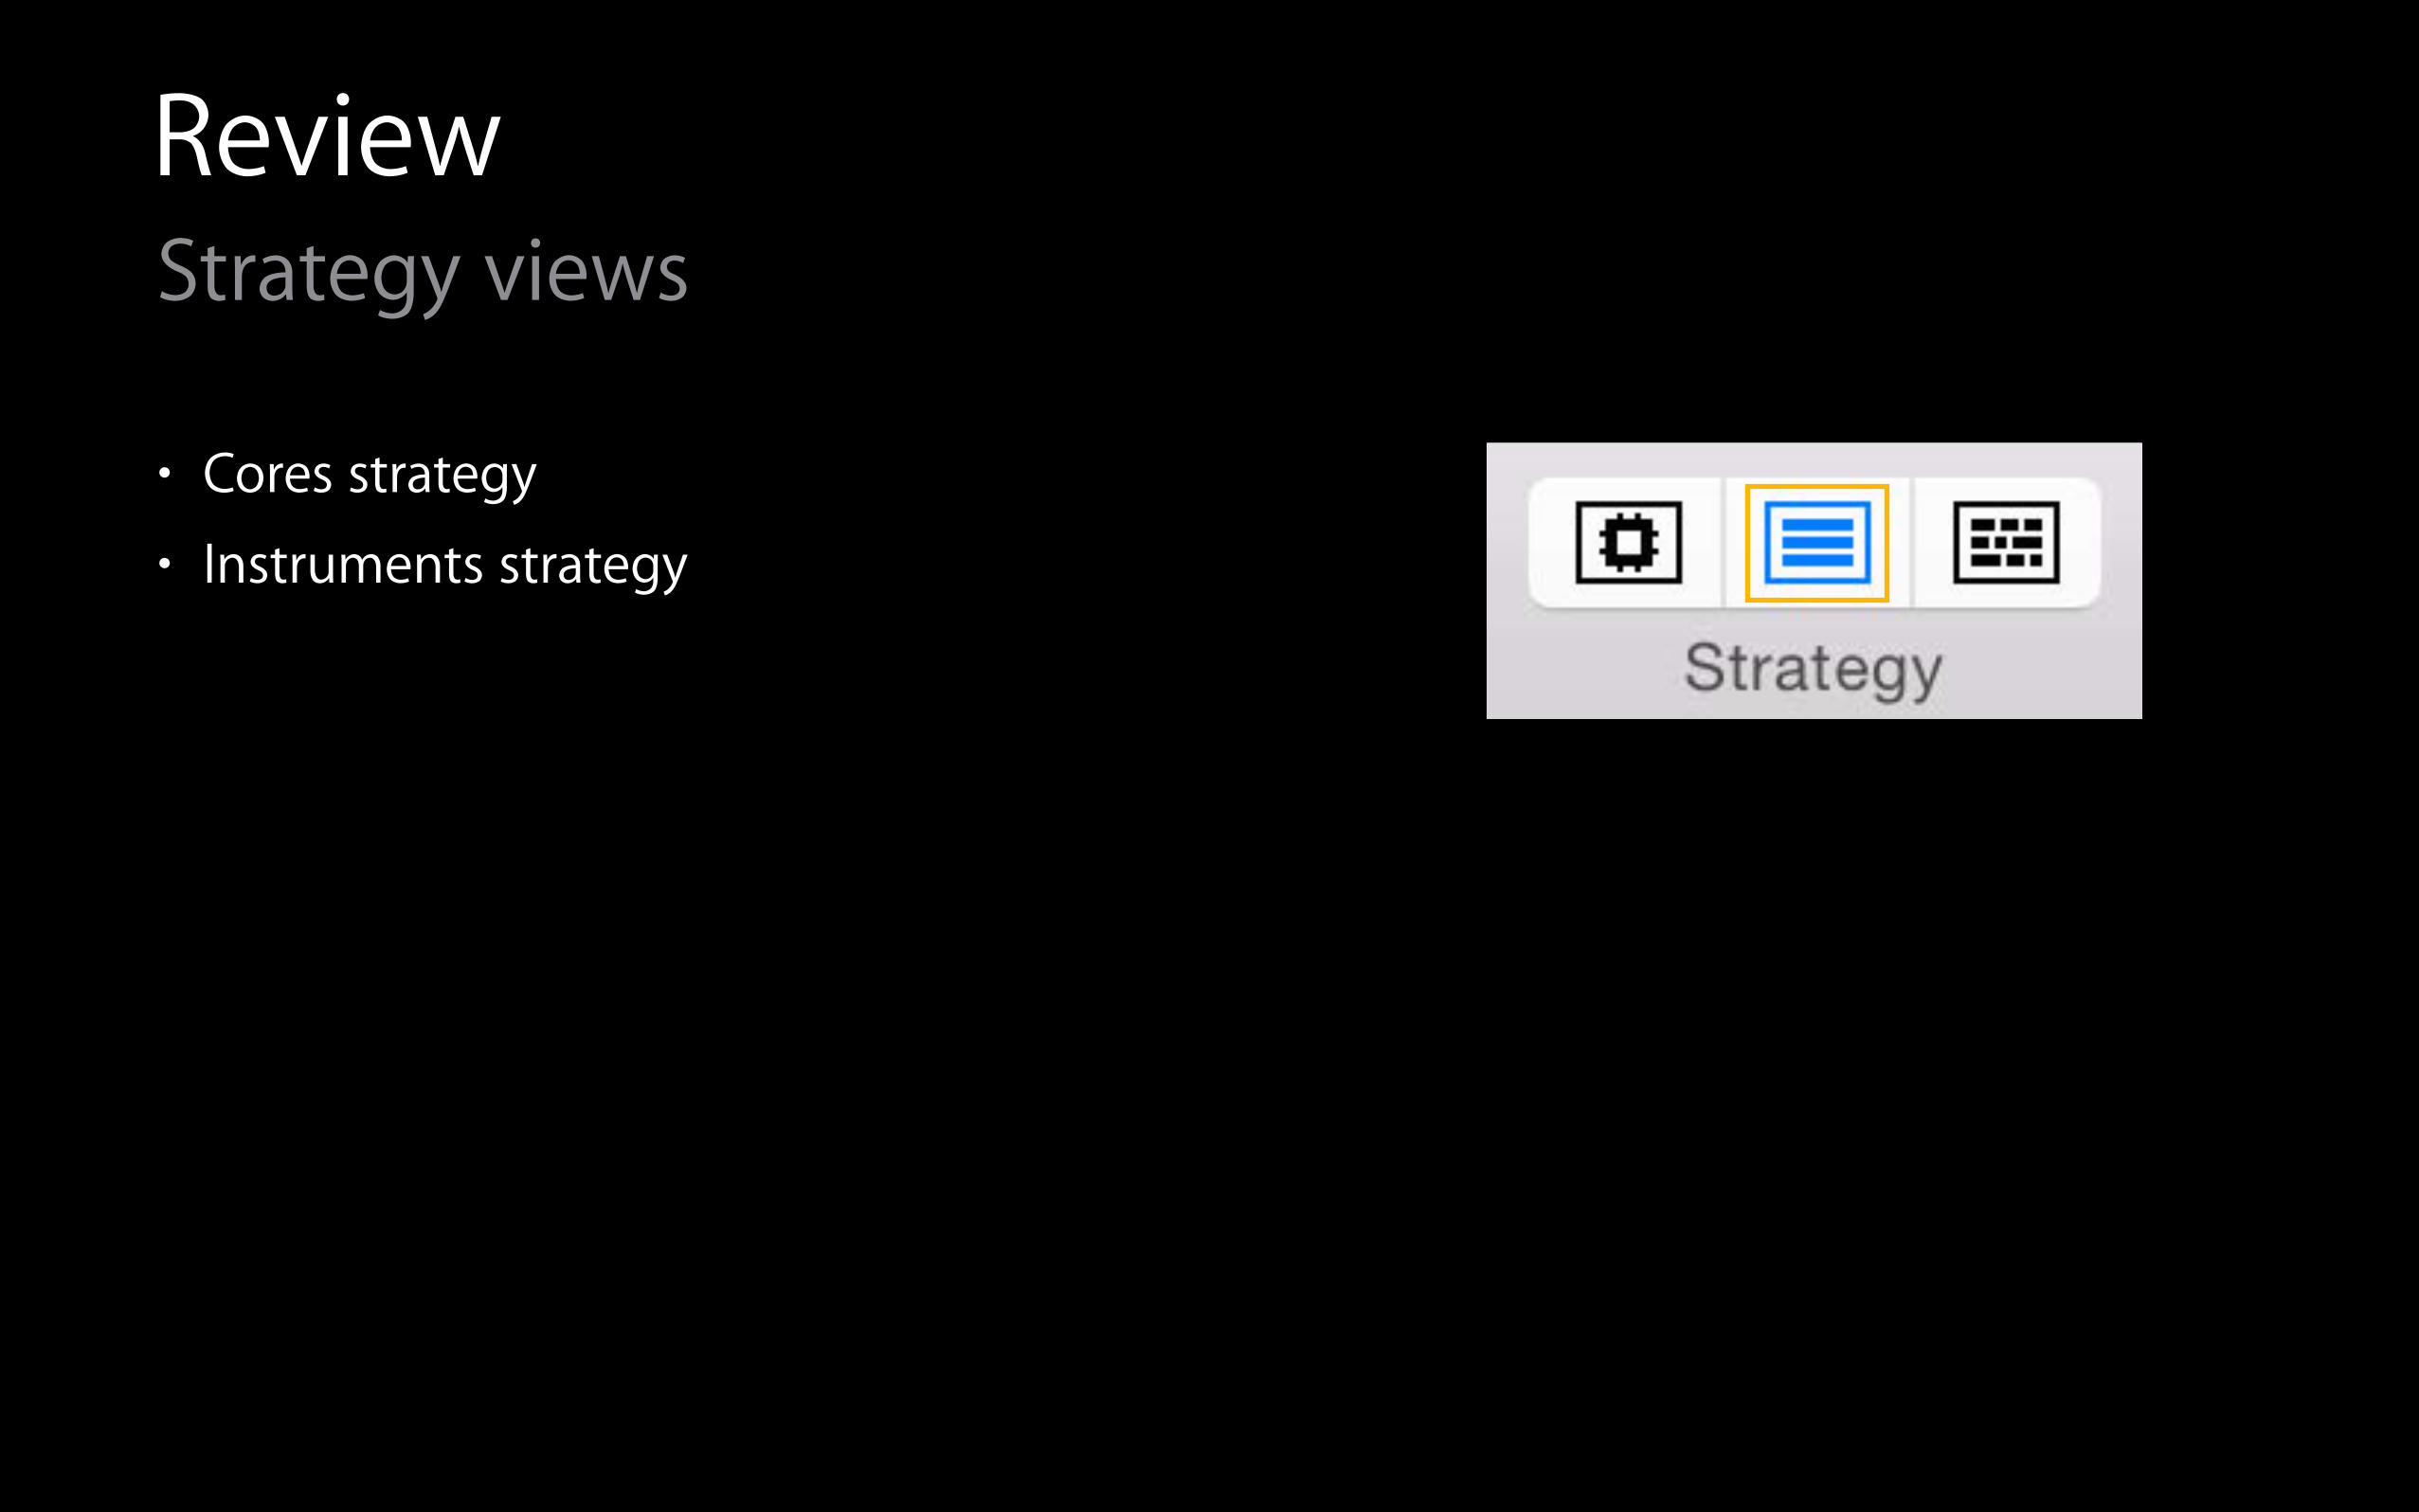
• Instruments strategy
ReviewStrategy views
• Cores strategy
• Instruments strategy
• Threads strategy
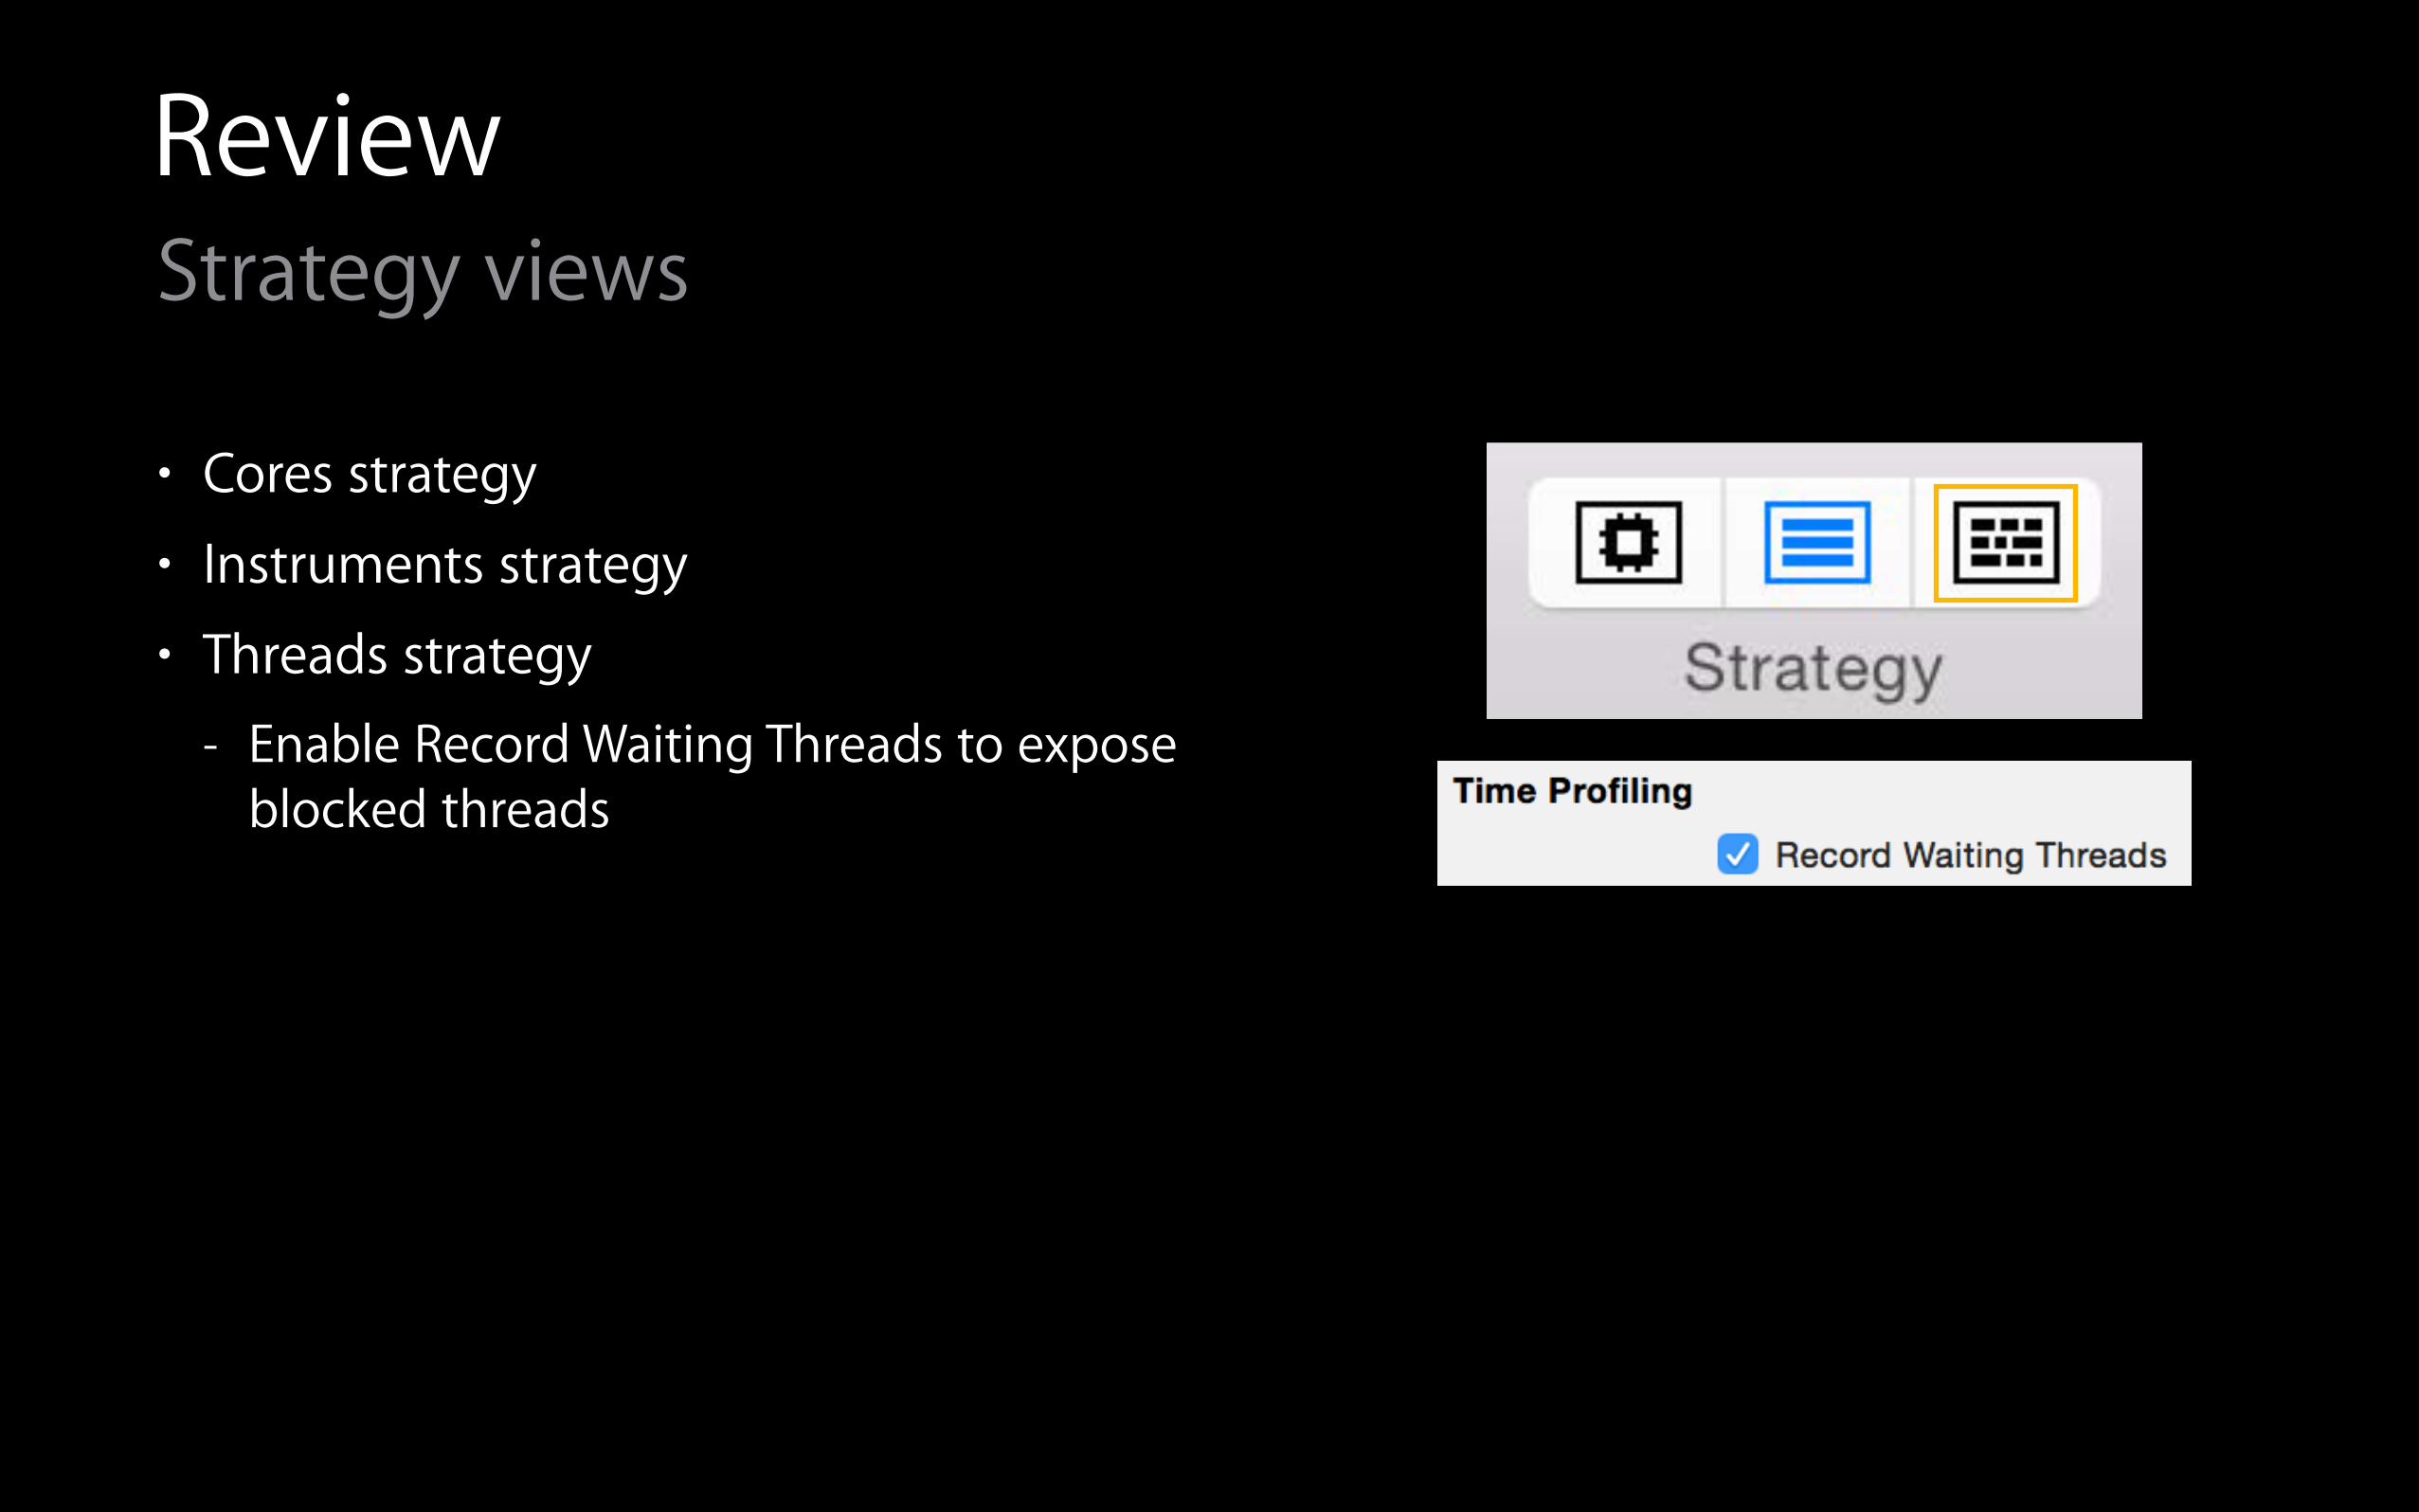
ReviewStrategy views
• Cores strategy
• Instruments strategy
• Threads strategy
- Enable Record Waiting Threads to expose blocked threads
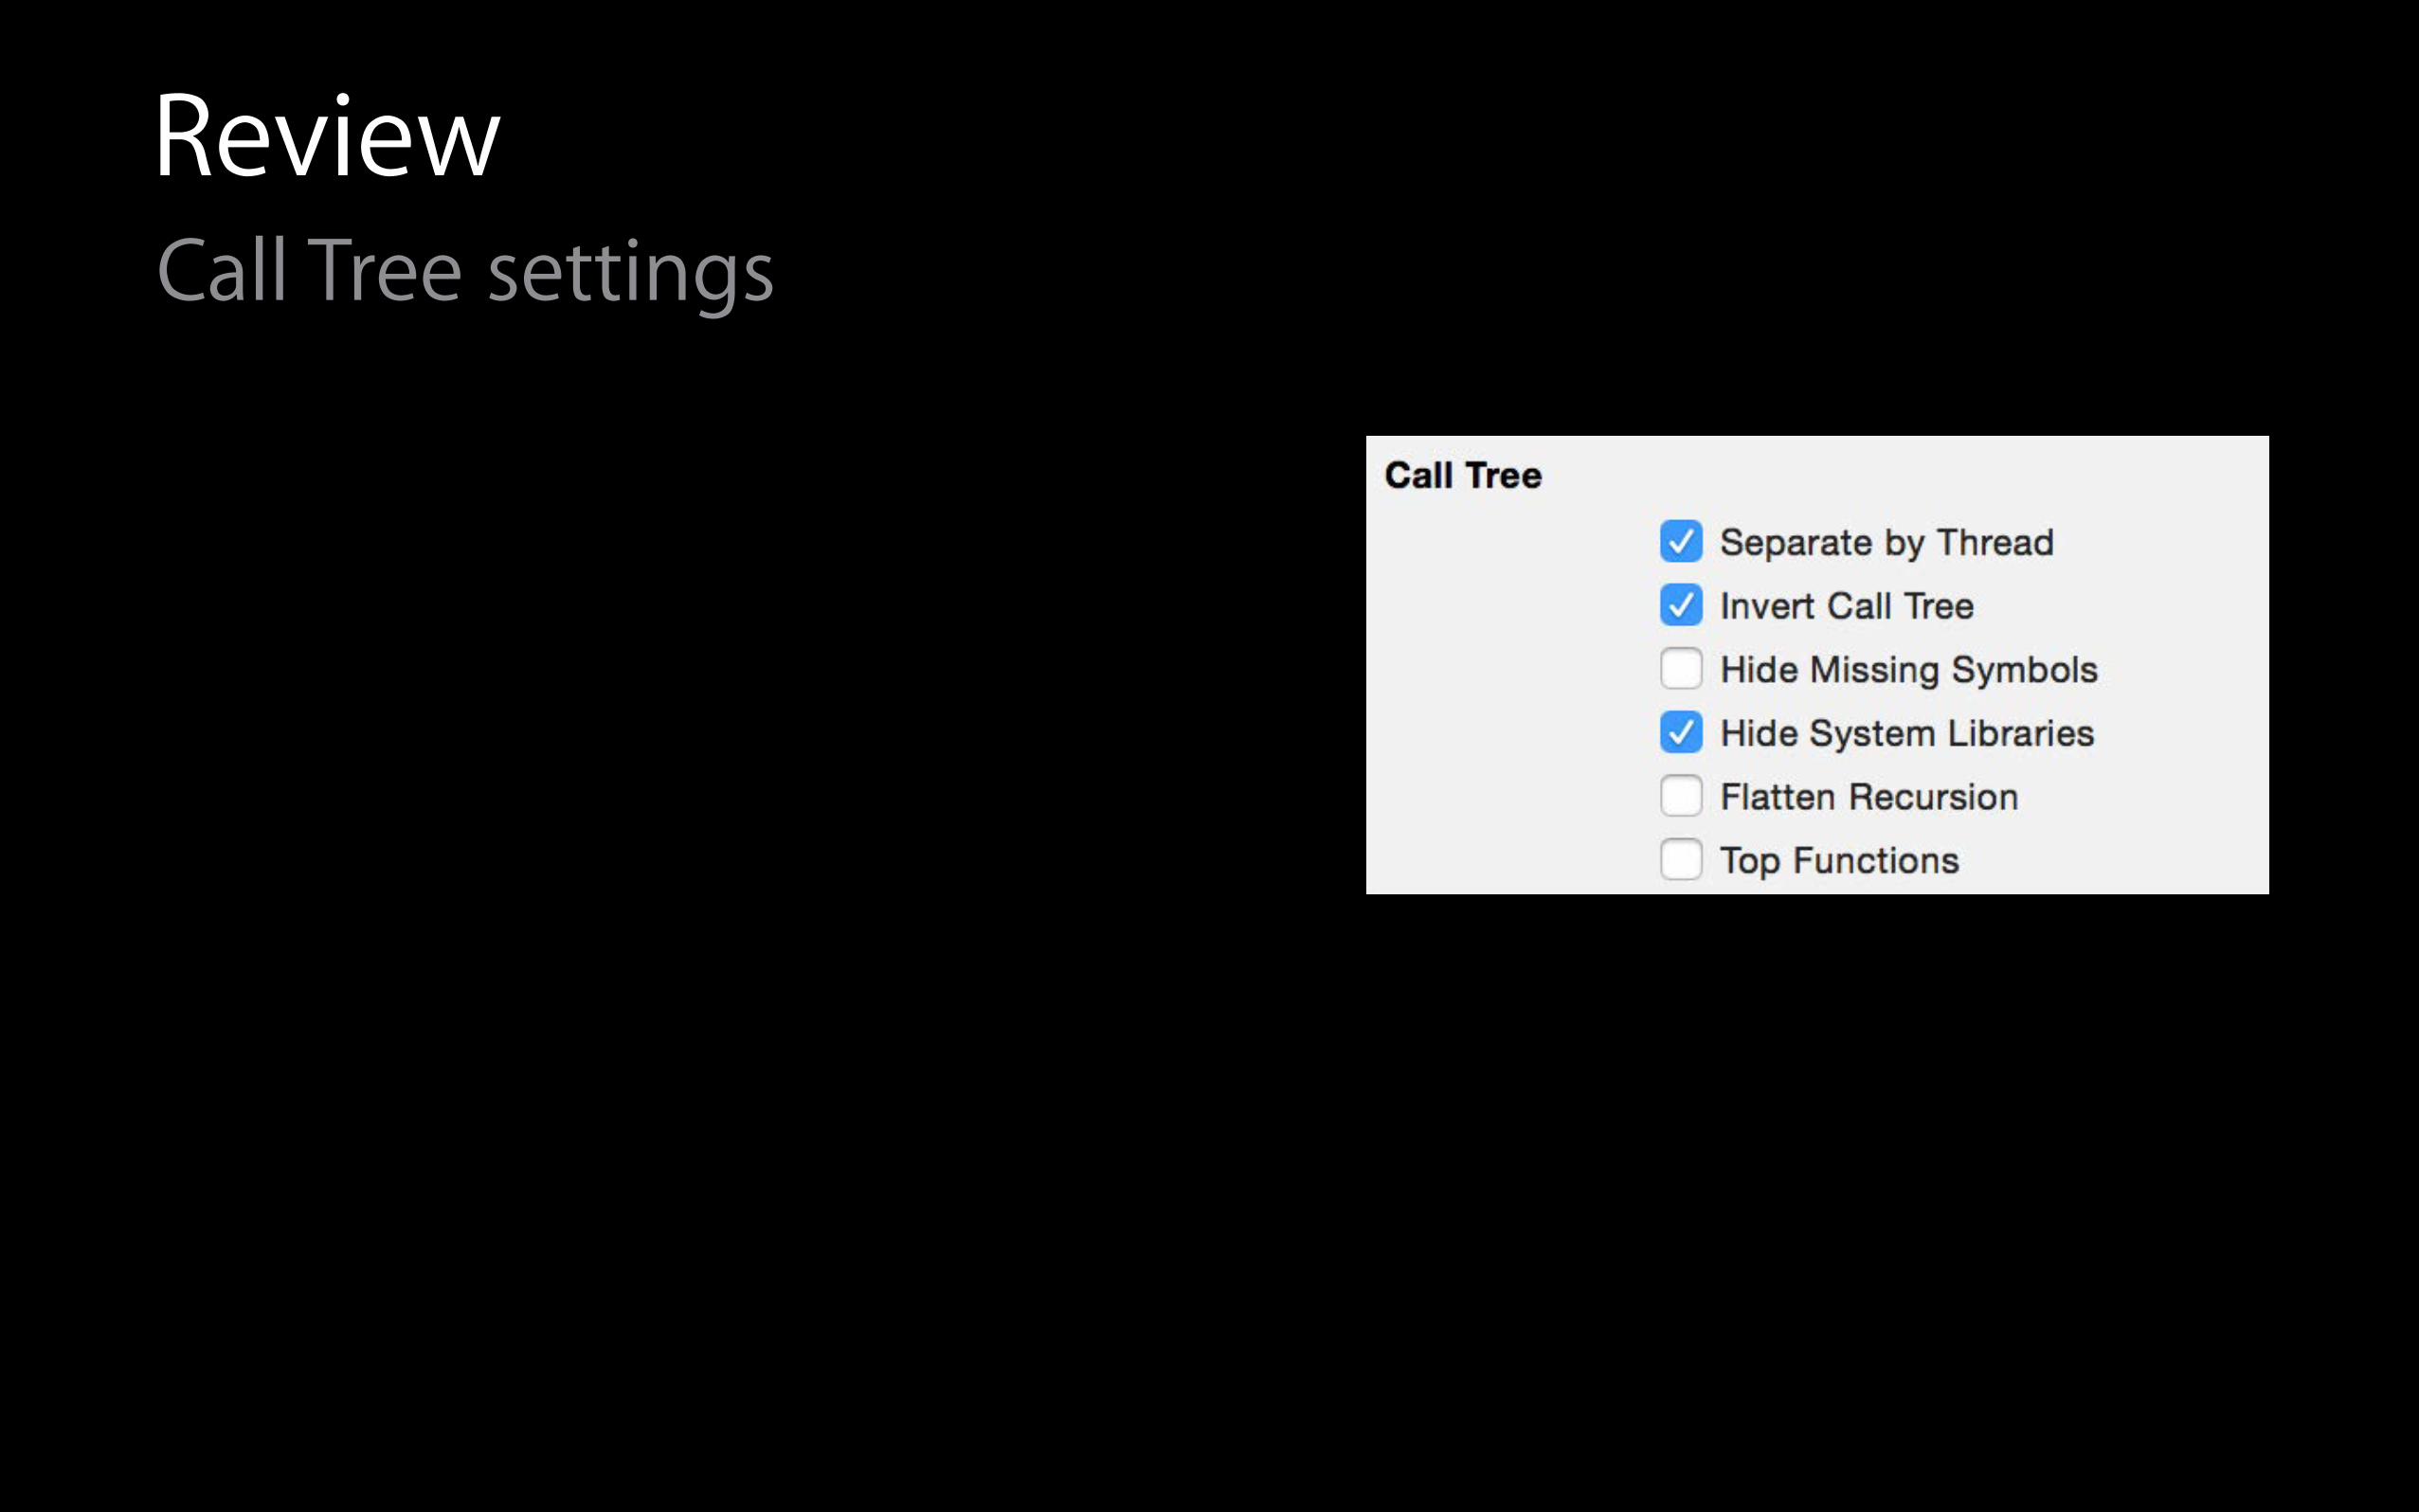
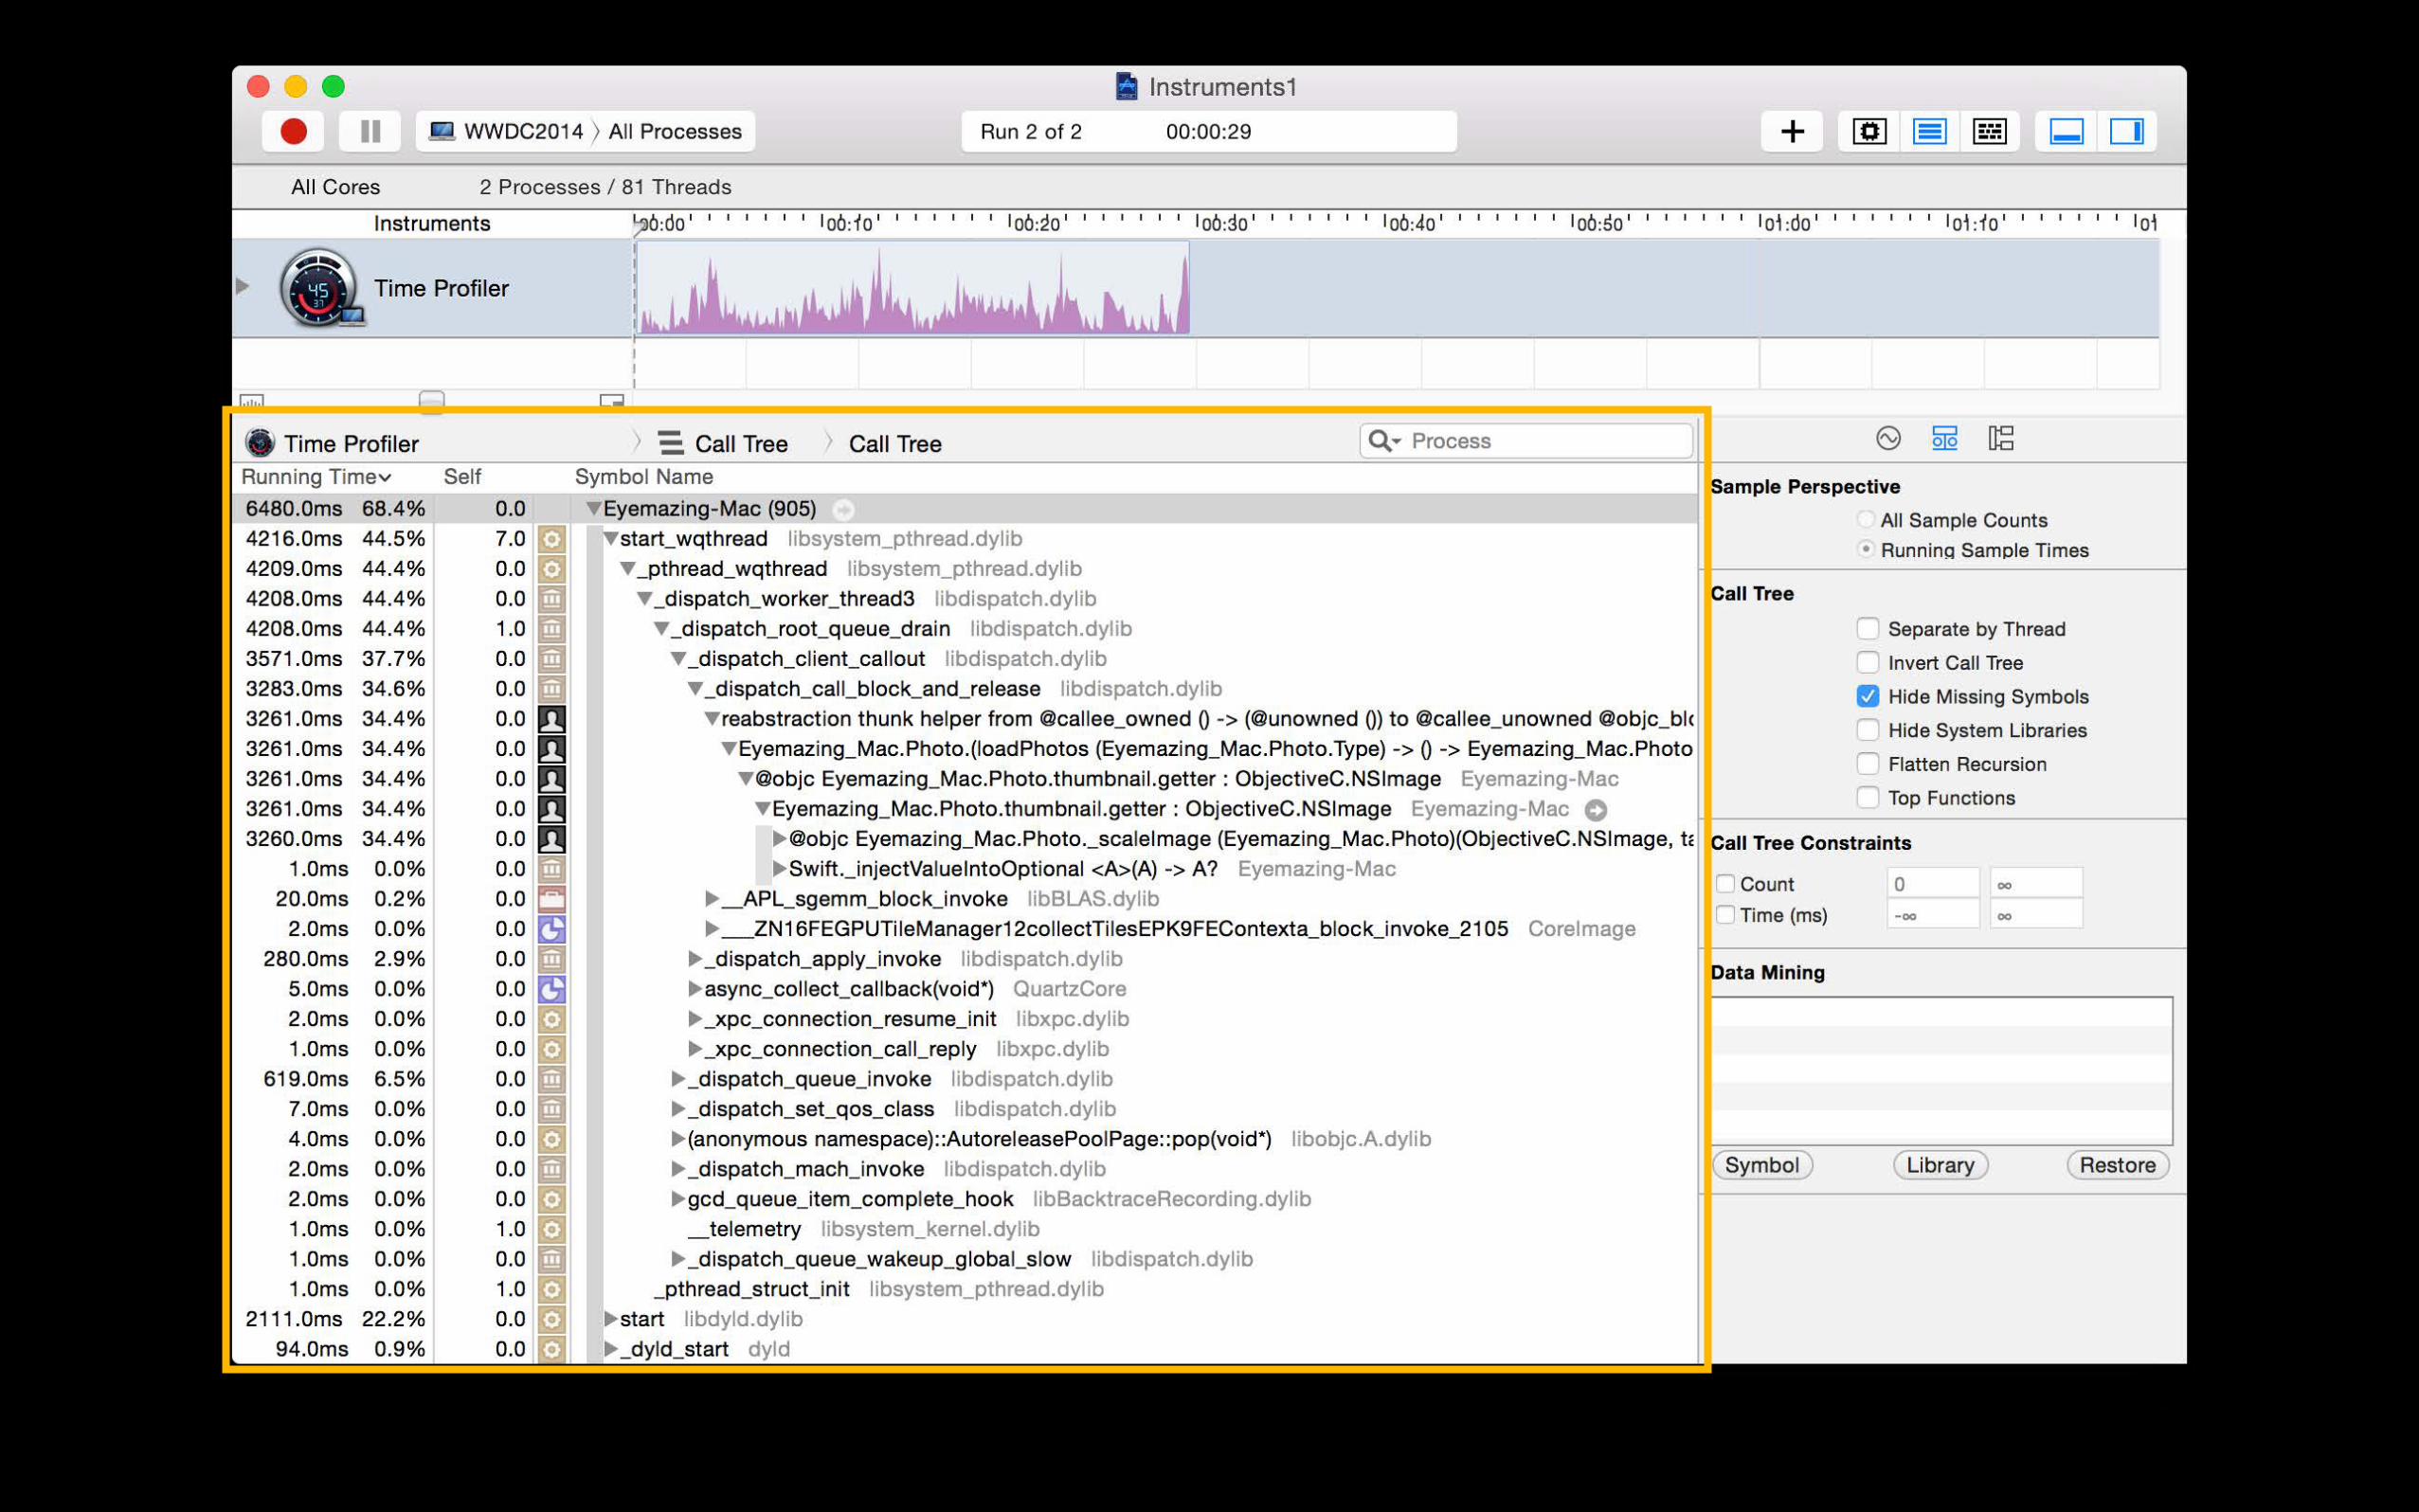
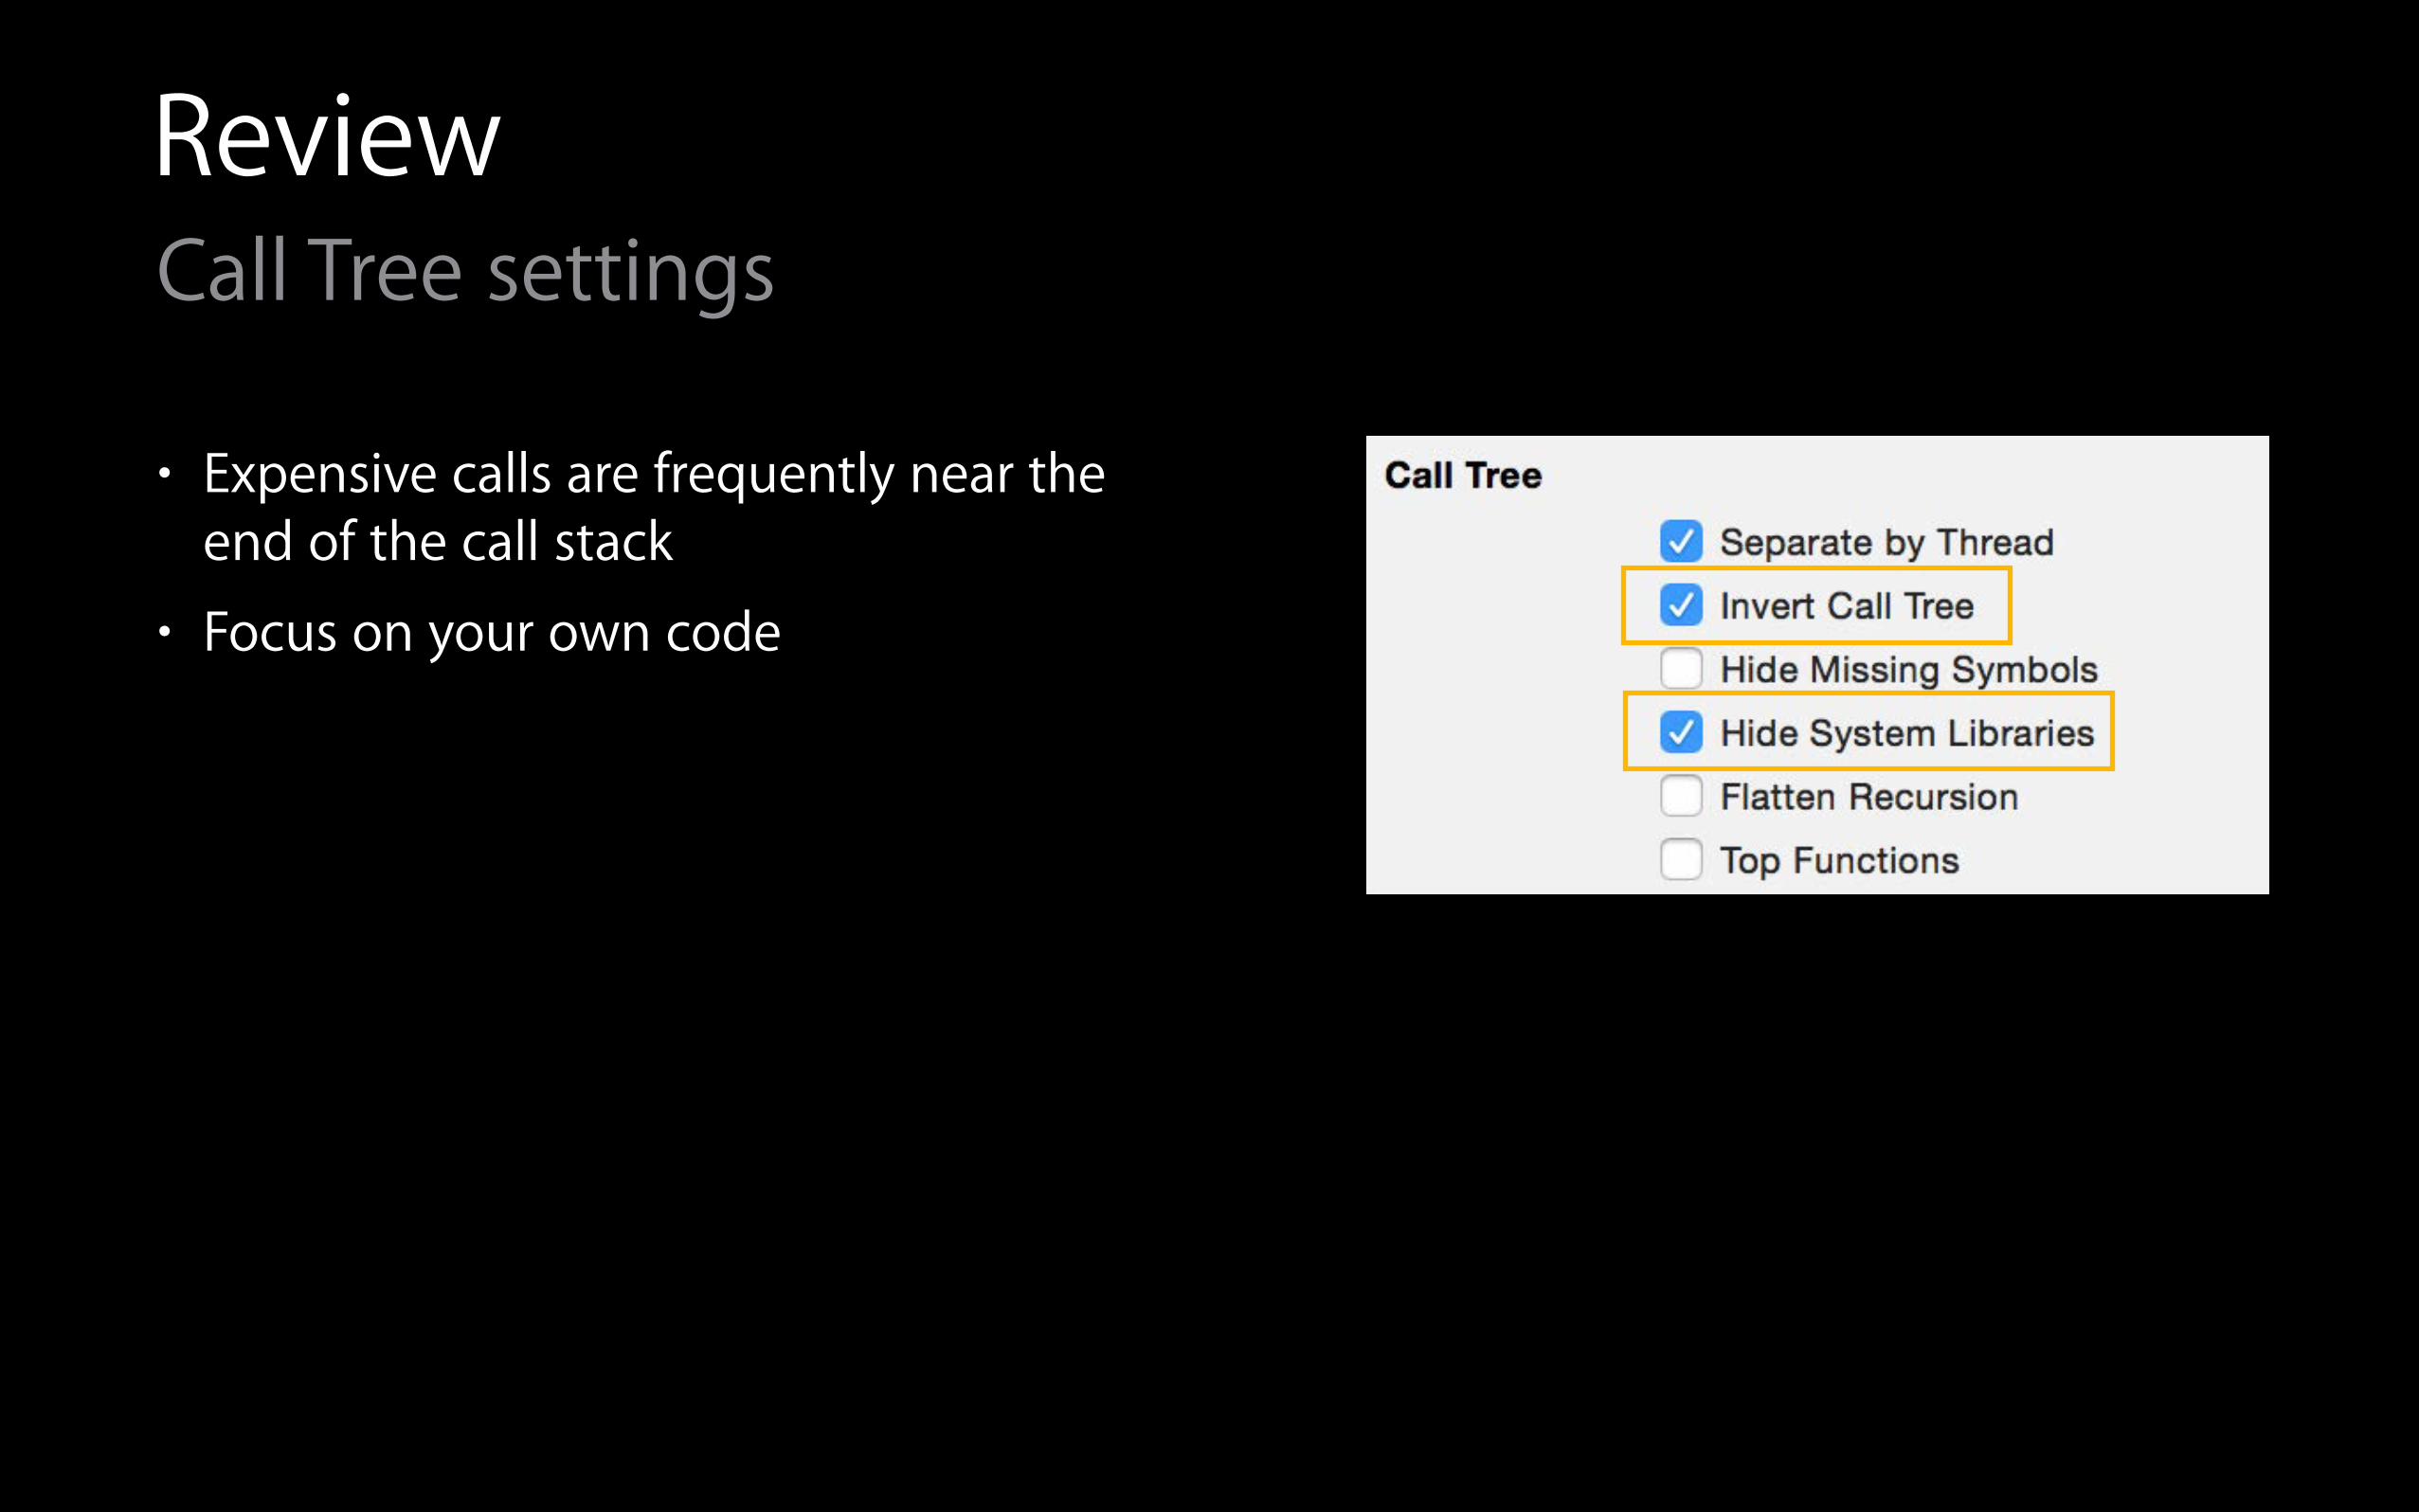
ReviewCall Tree settings
ReviewCall Tree settings
• Expensive calls are frequently near the end of the call stack
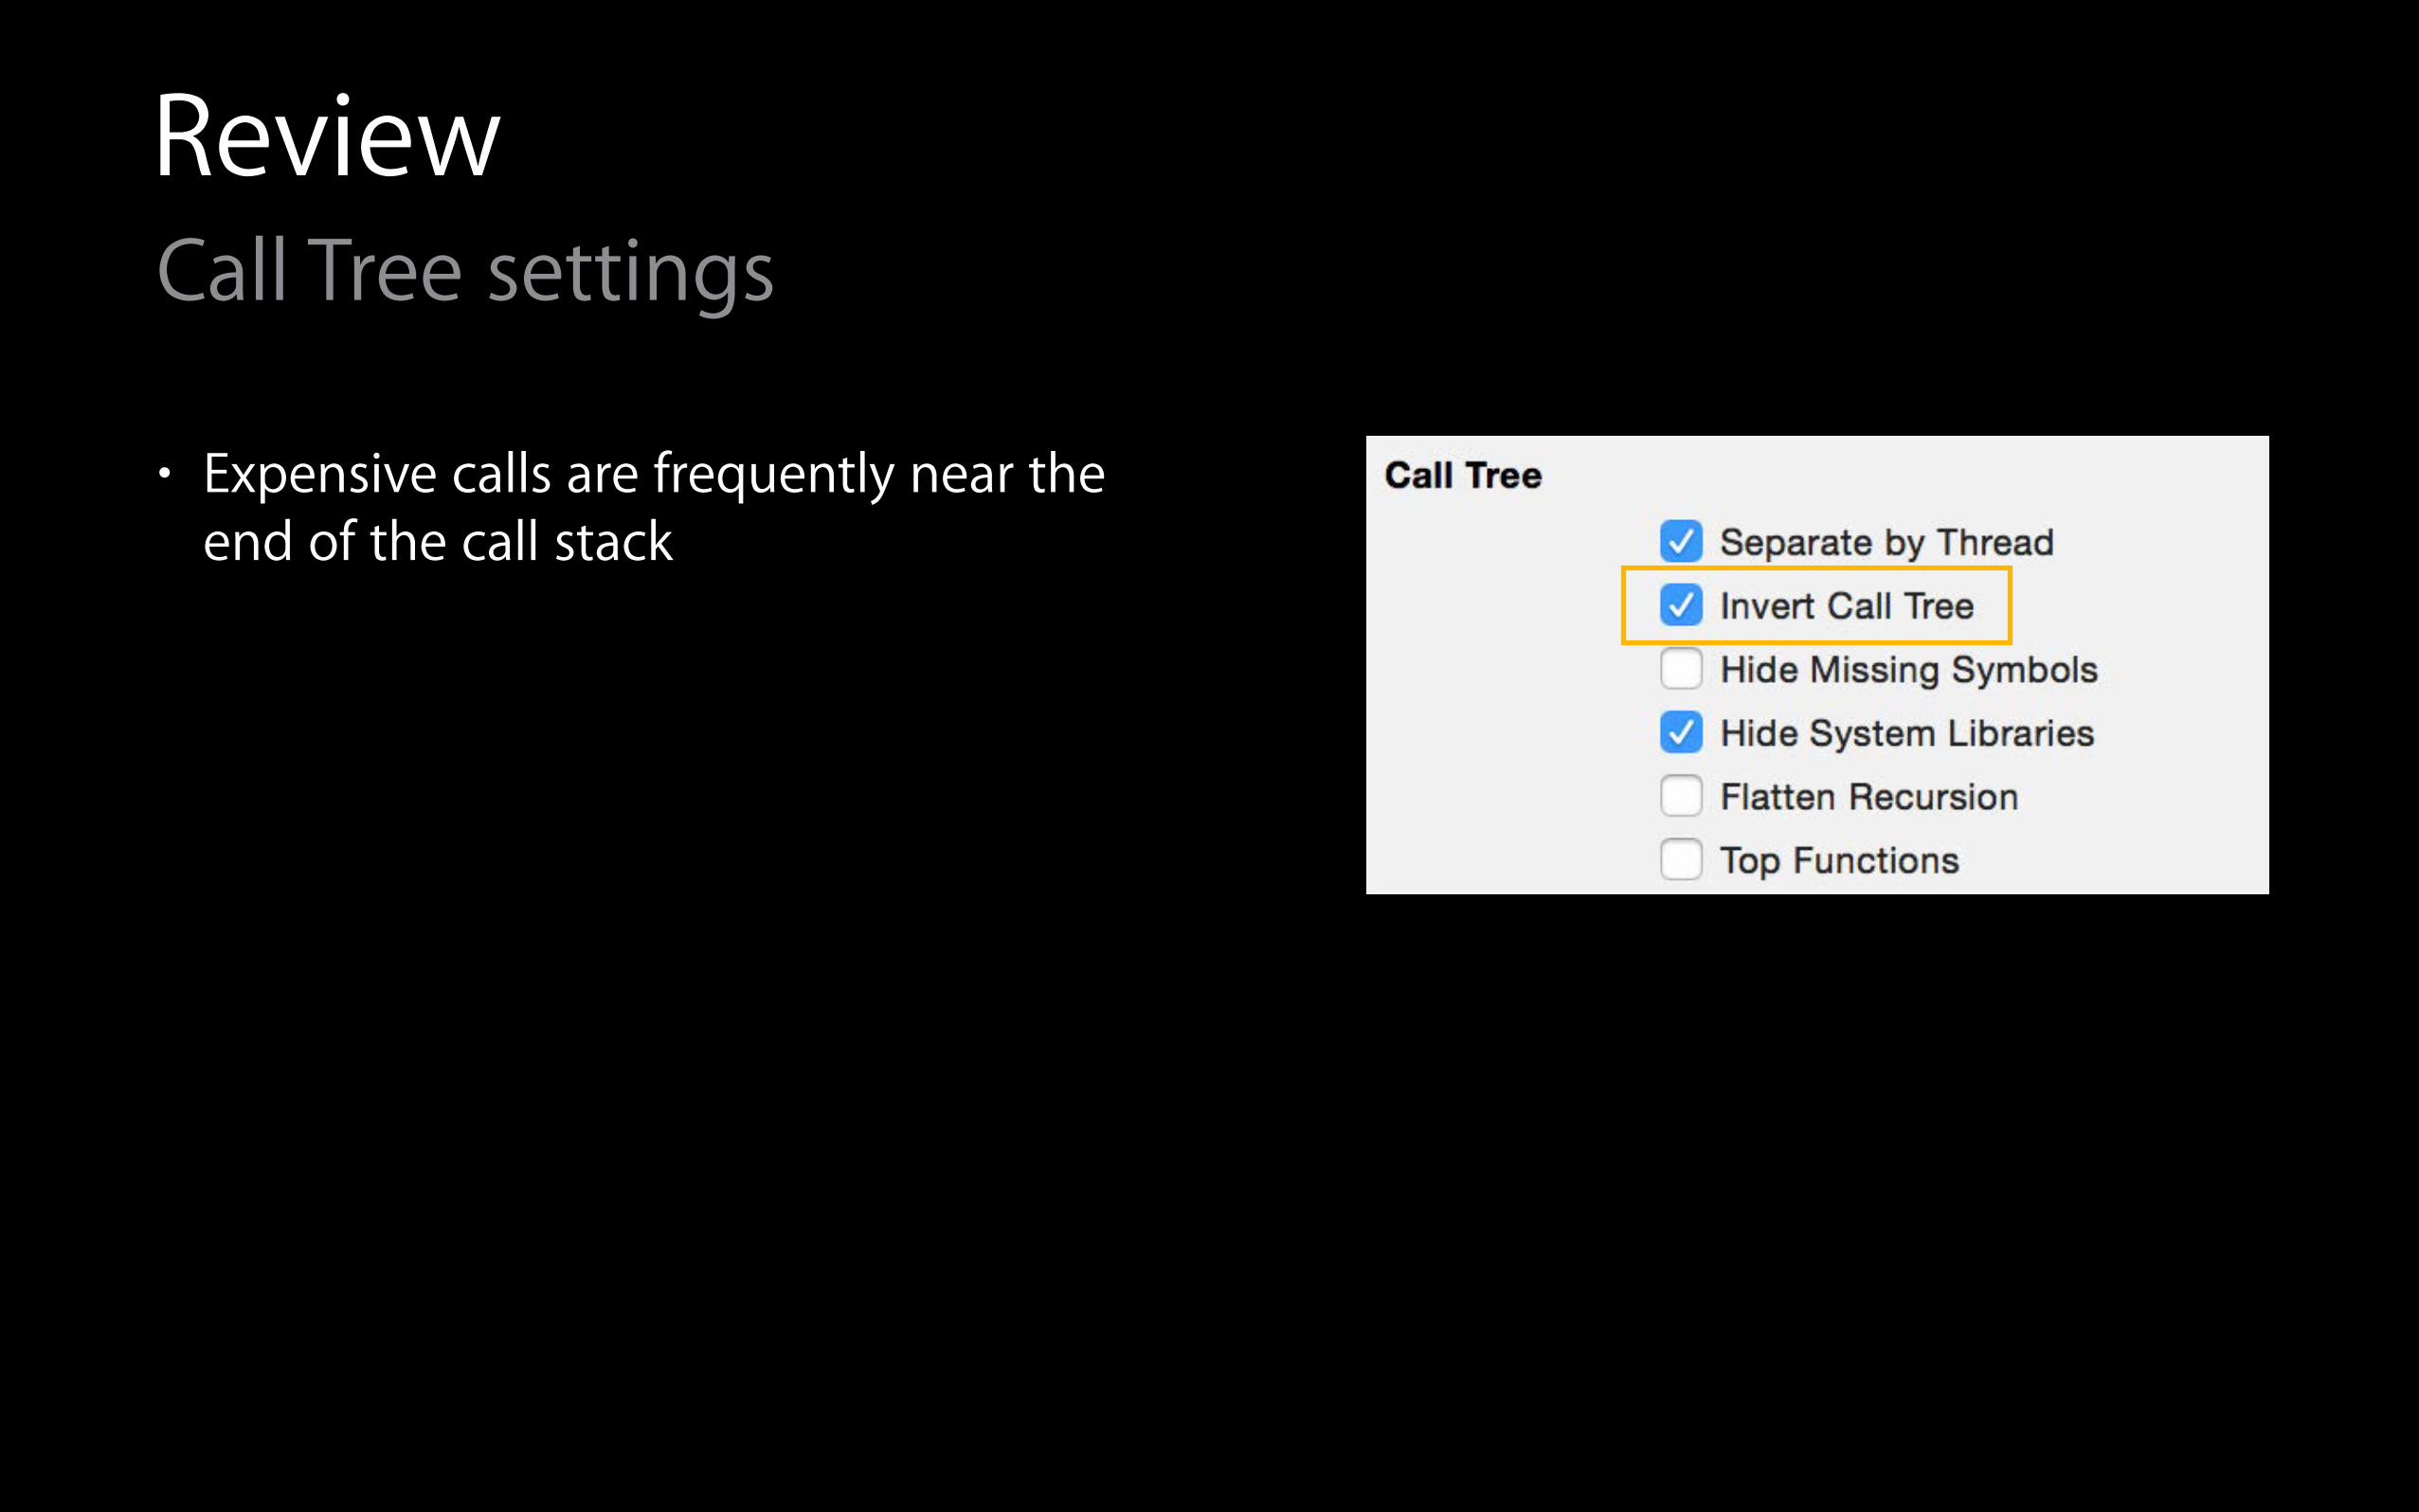
ReviewCall Tree settings
• Expensive calls are frequently near the end of the call stack
• Focus on your own code
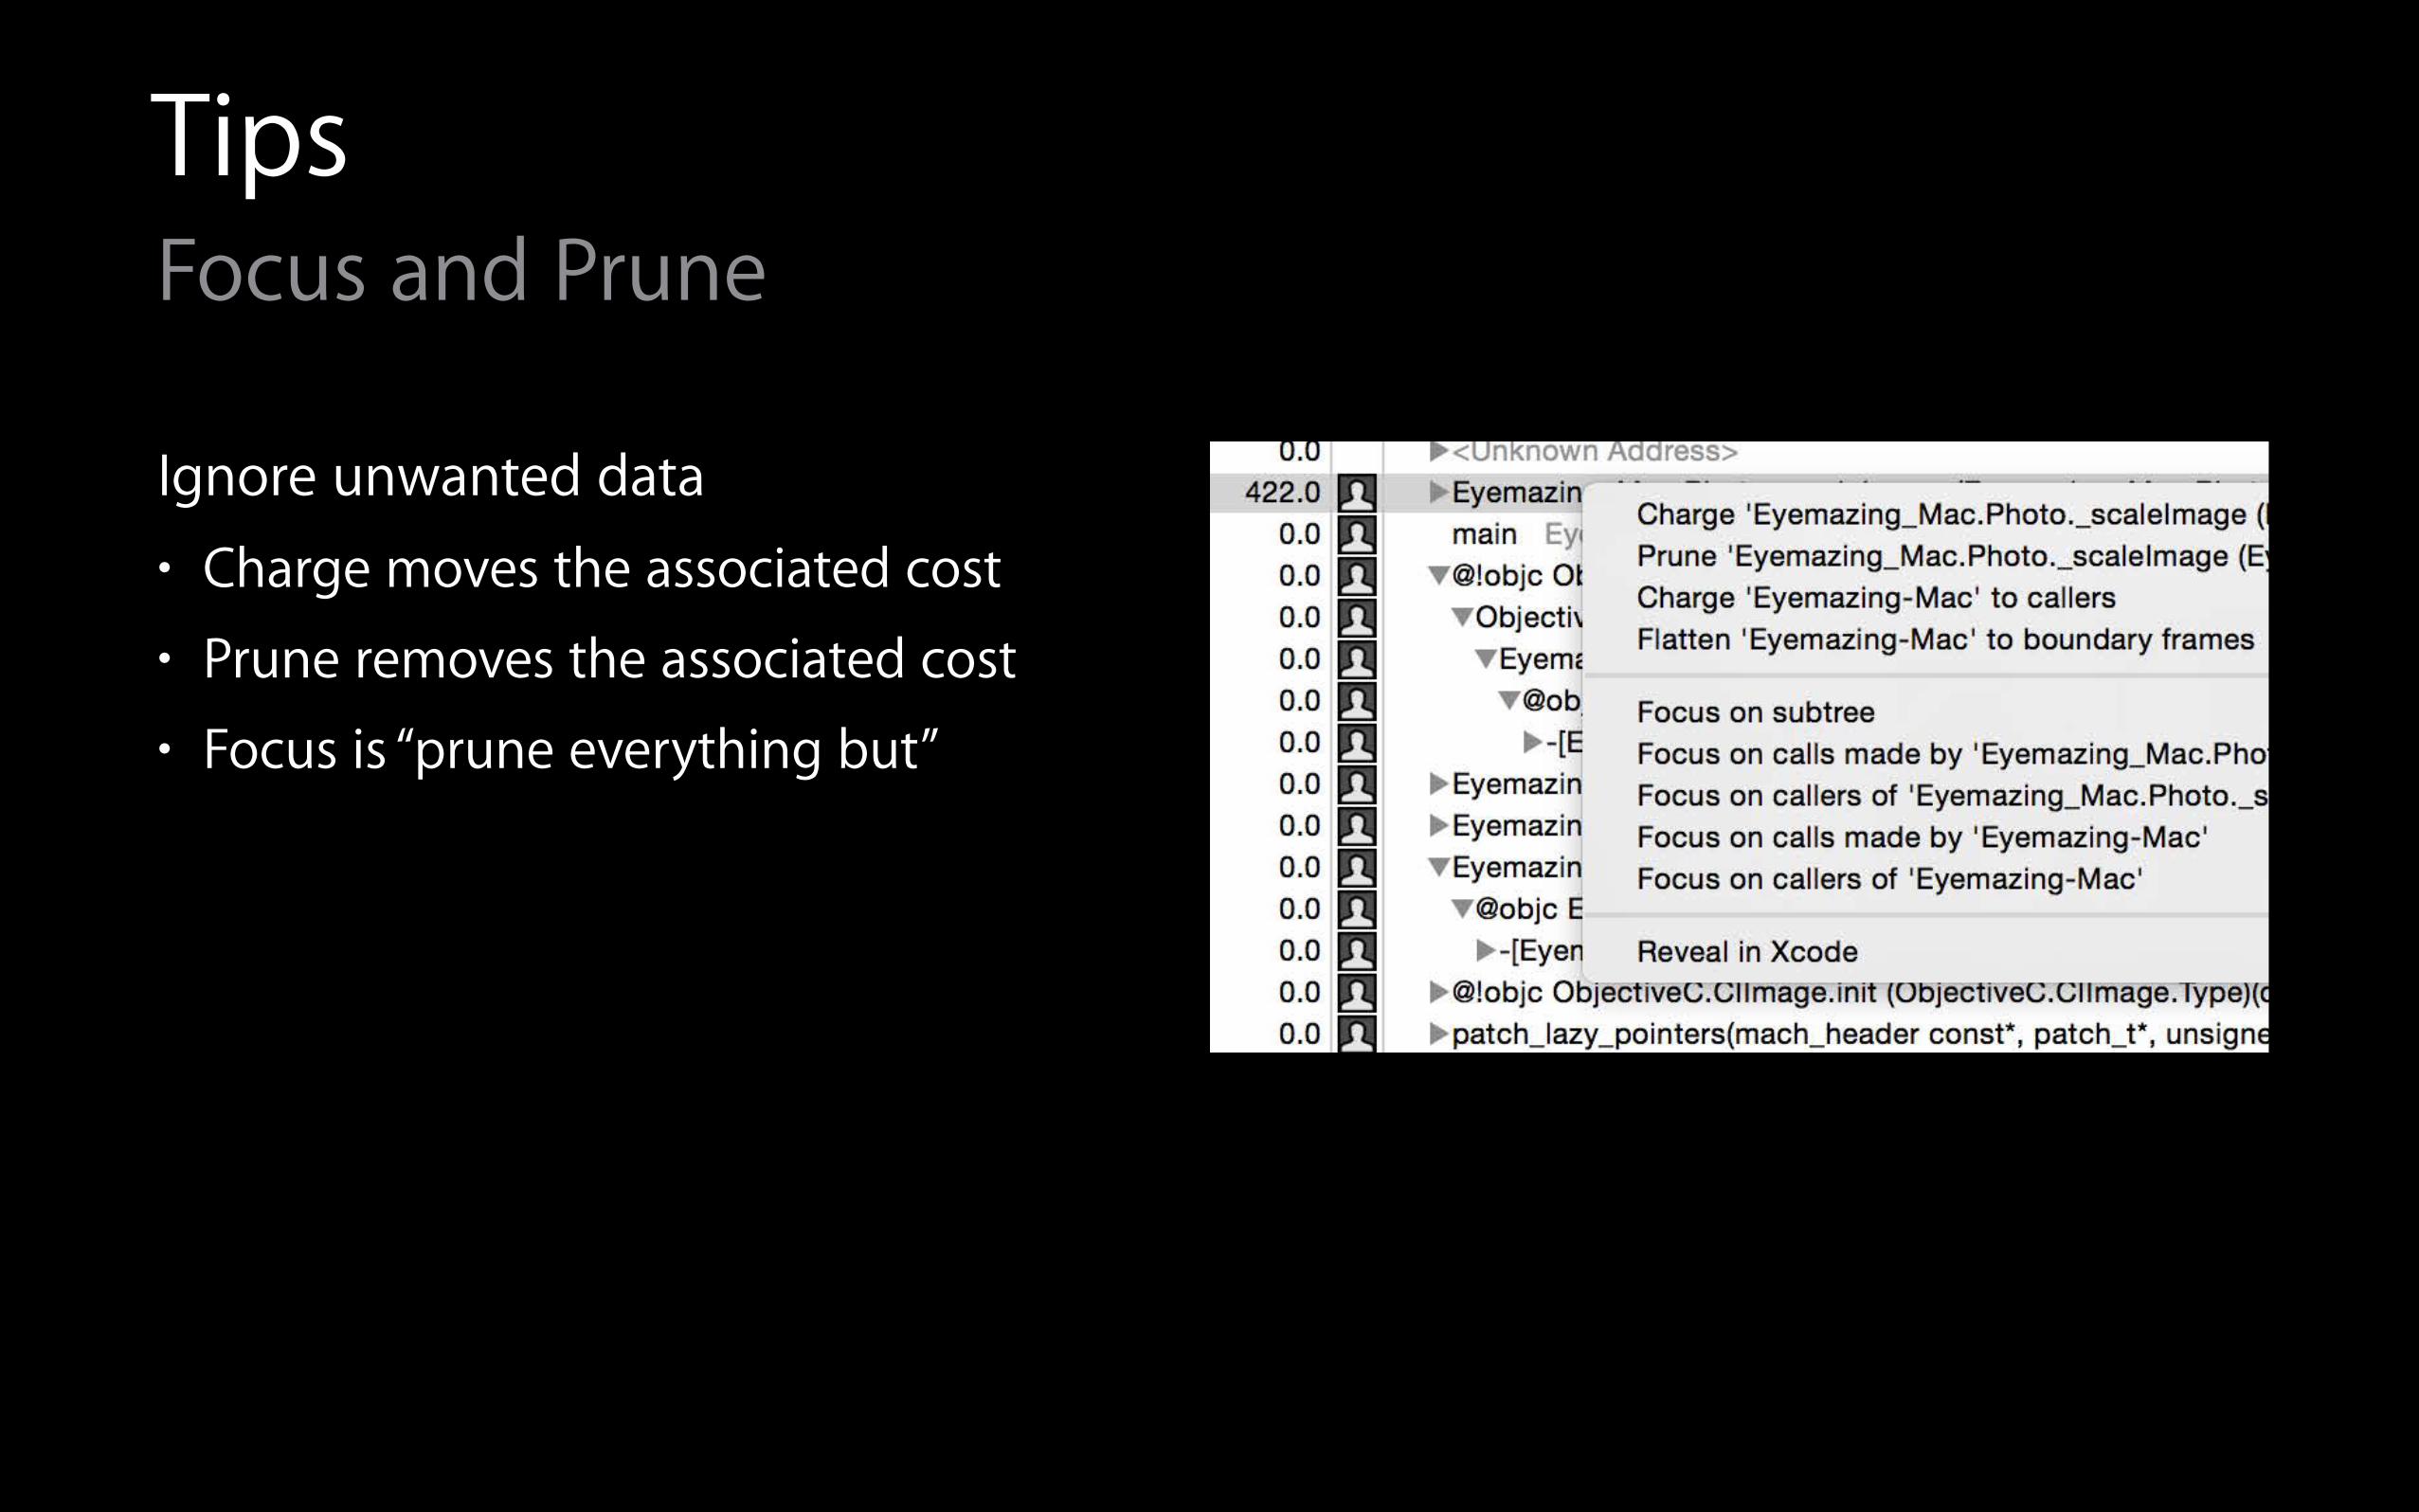
TipsFocus and Prune
Ignore unwanted data • Charge moves the associated cost
• Prune removes the associated cost
• Focus is “prune everything but”

When using Time Profiler
Two More Guidelines

When using Time Profiler• Profile Release builds
Two More Guidelines
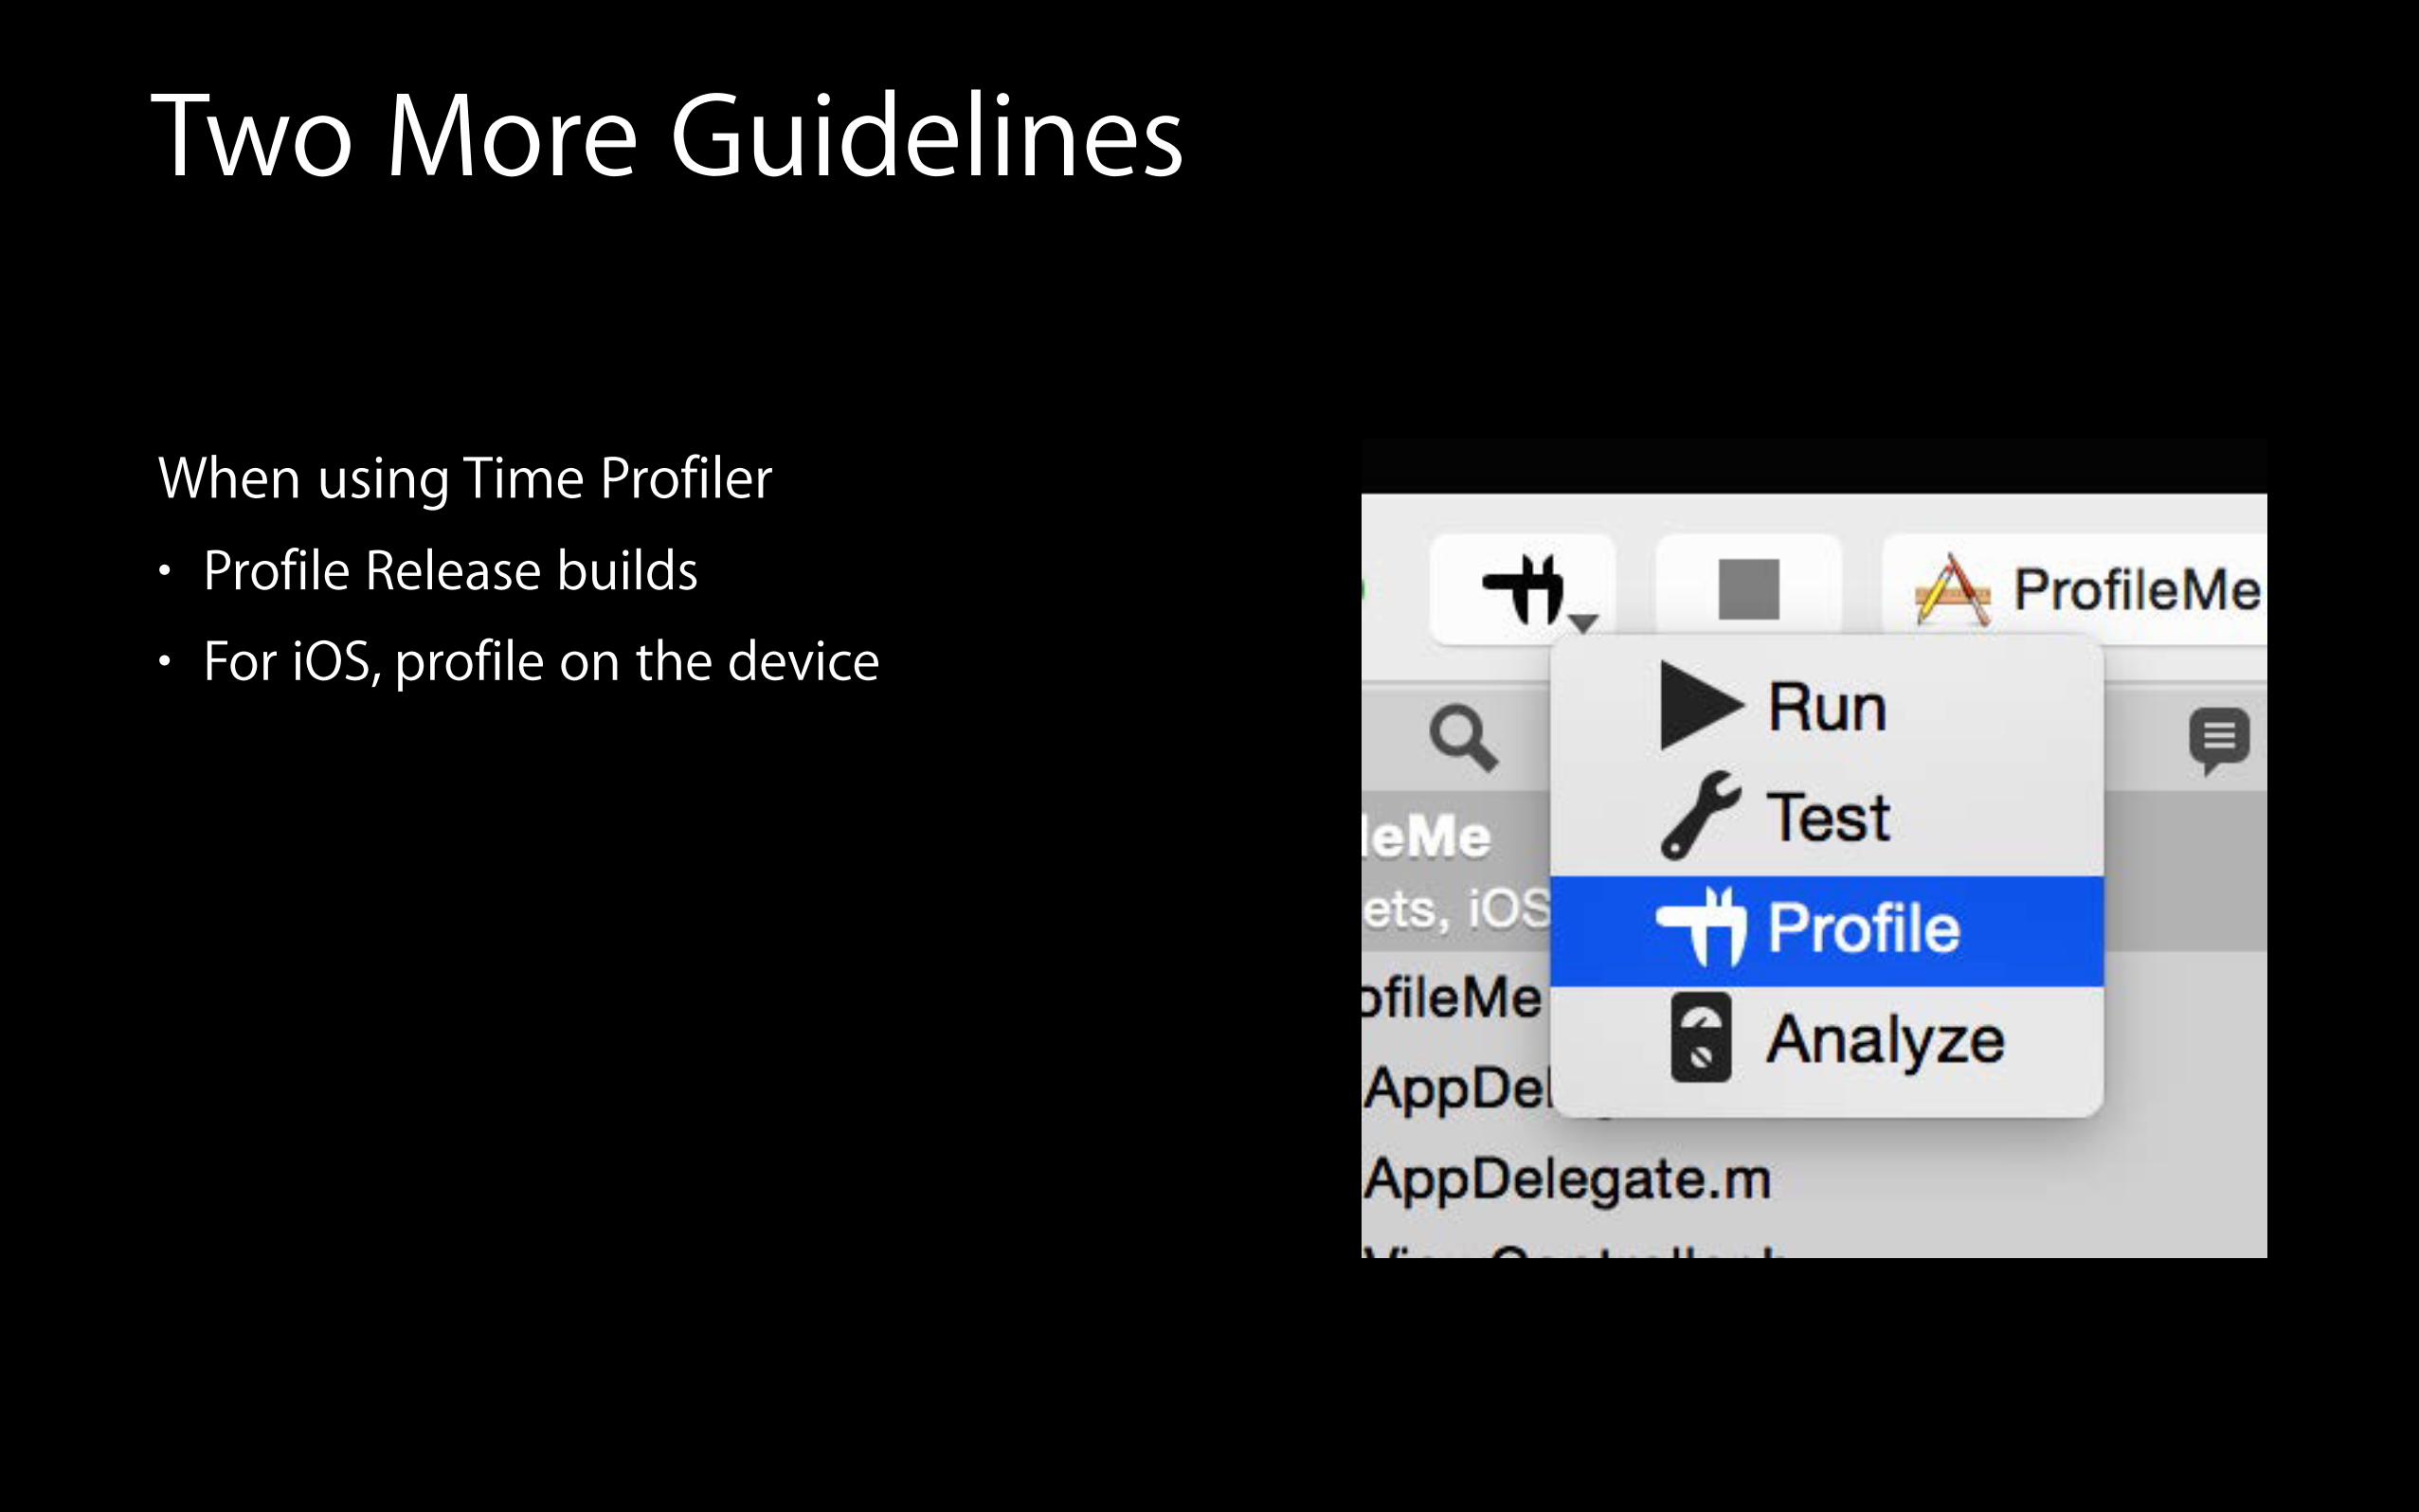
When using Time Profiler• Profile Release builds
• For iOS, profile on the device
Two More Guidelines
Performance Counters
Joe Grzywacz Performance Tools Engineer
What Are Counters?
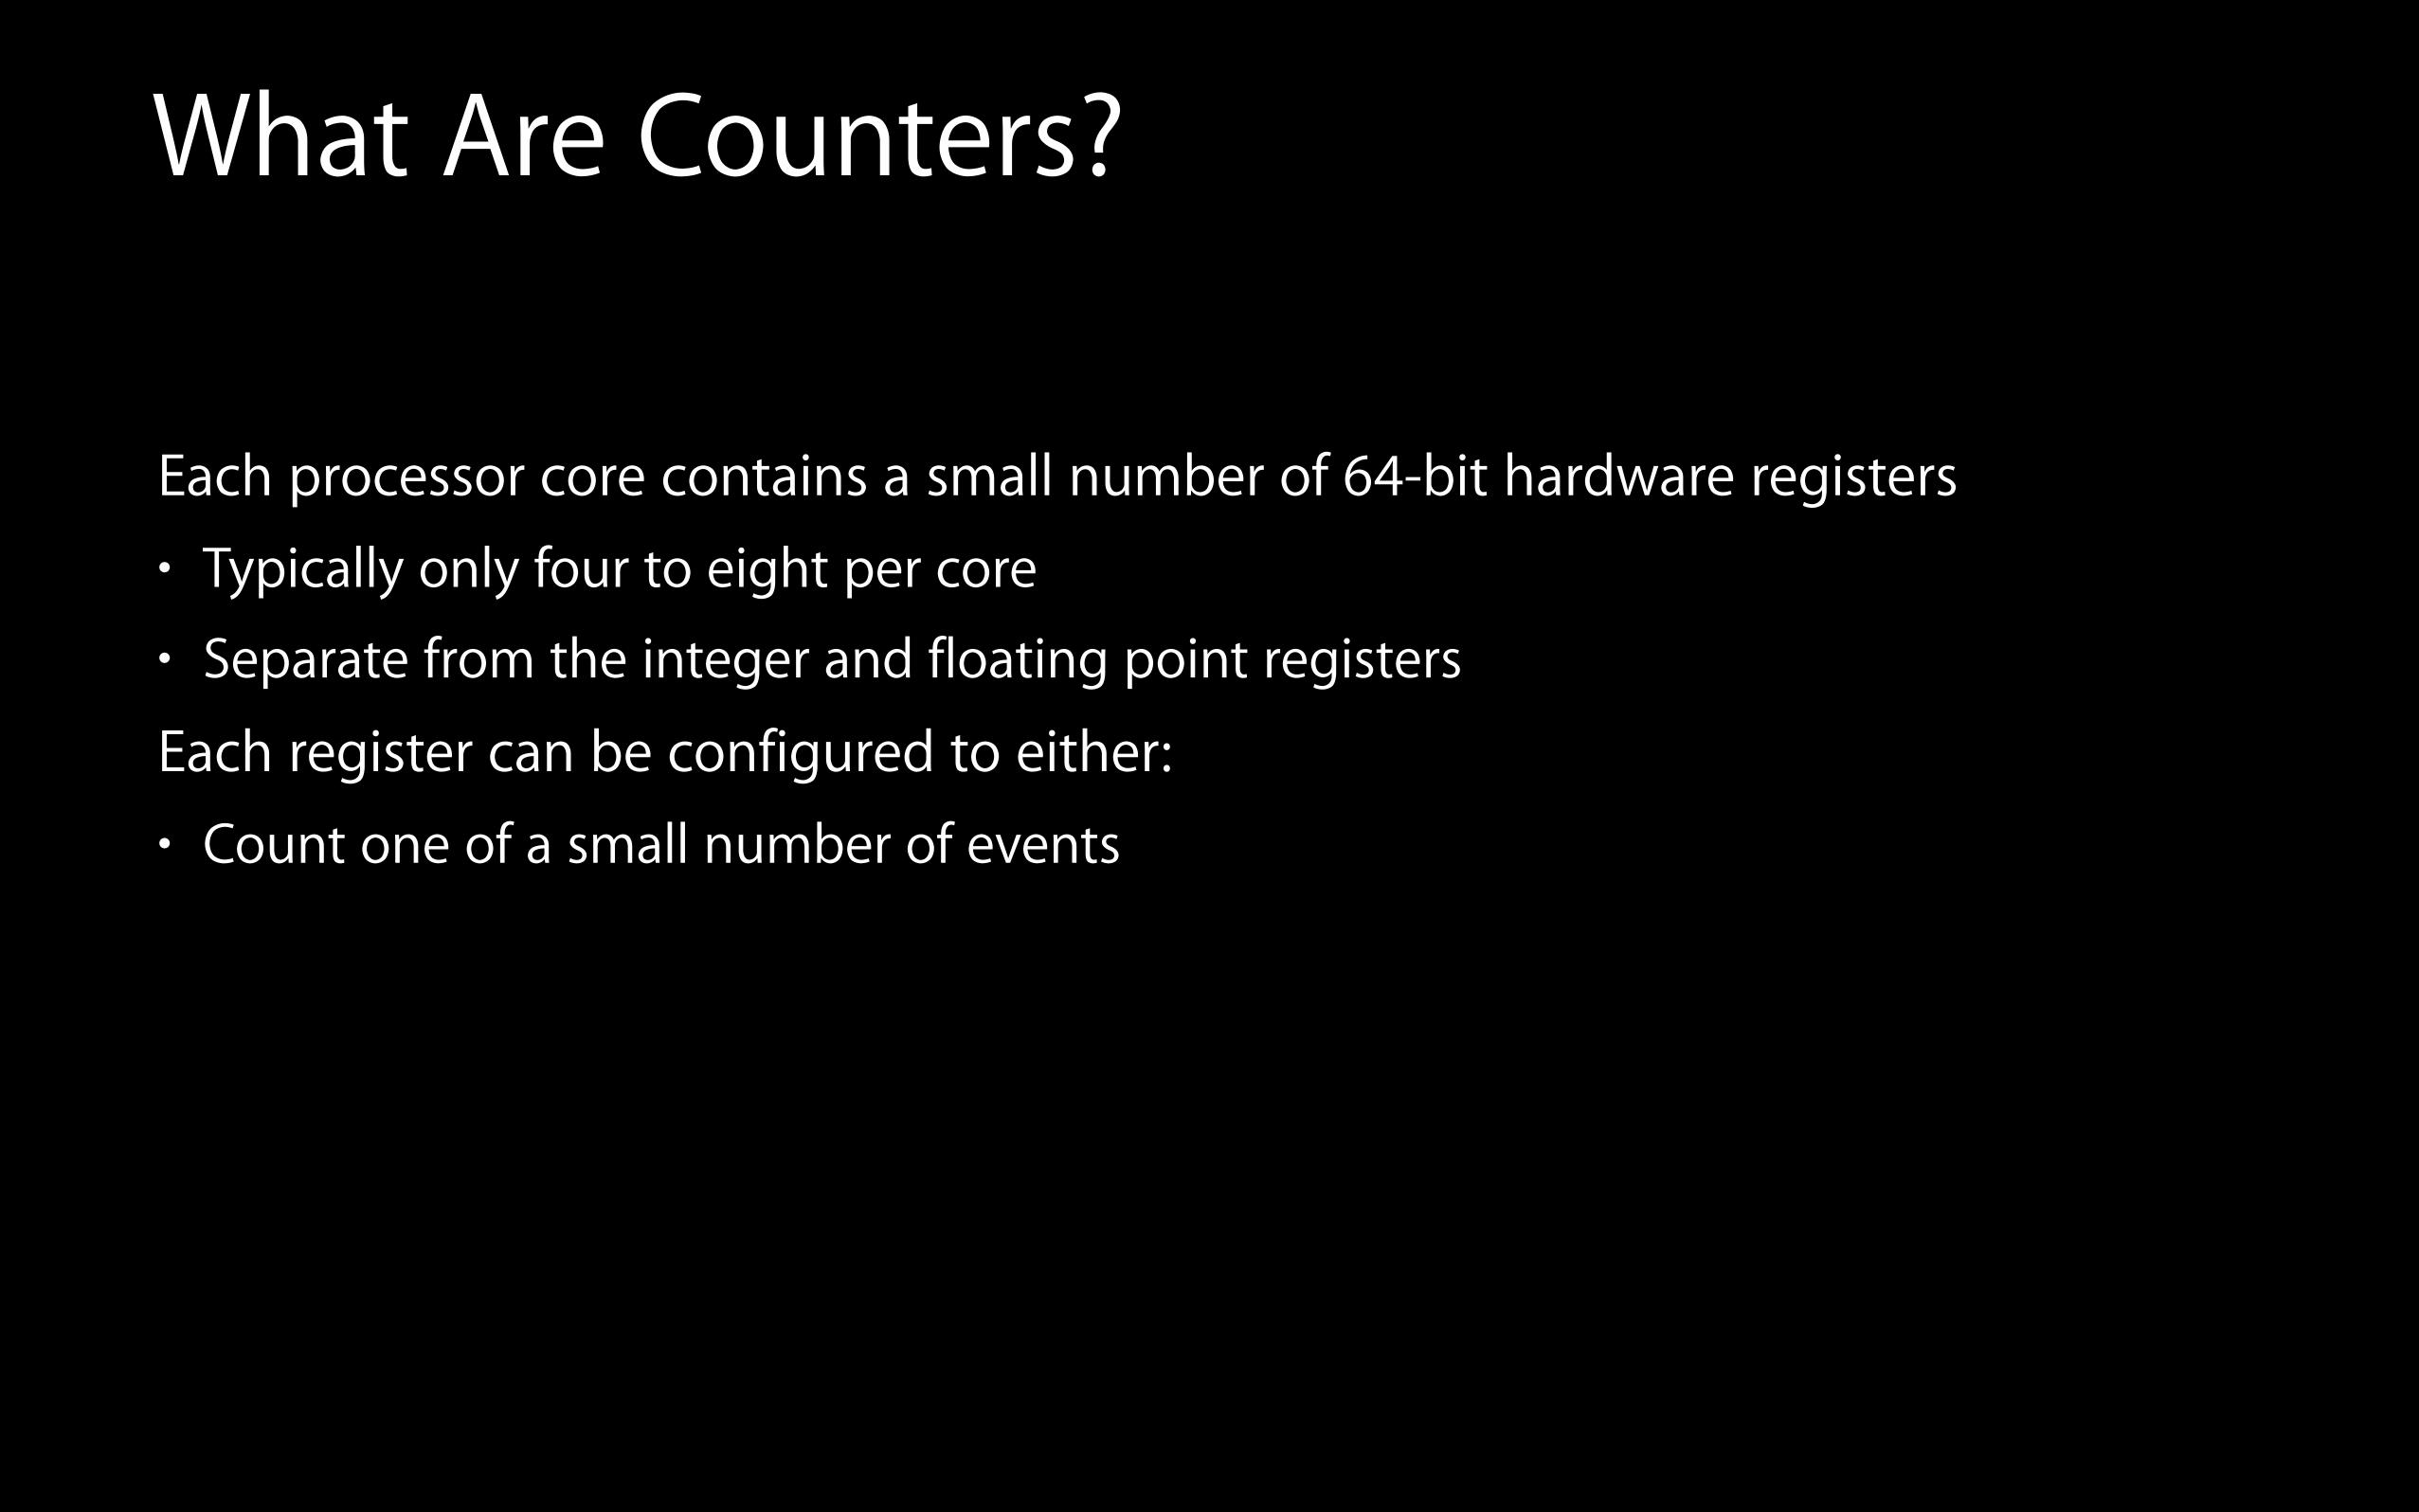
Each processor core contains a small number of 64-bit hardware registers
What Are Counters?
Each processor core contains a small number of 64-bit hardware registers• Typically only four to eight per core
What Are Counters?
Each processor core contains a small number of 64-bit hardware registers• Typically only four to eight per core
• Separate from the integer and floating point registers
What Are Counters?
Each processor core contains a small number of 64-bit hardware registers• Typically only four to eight per core
• Separate from the integer and floating point registers
Each register can be configured to either:
What Are Counters?
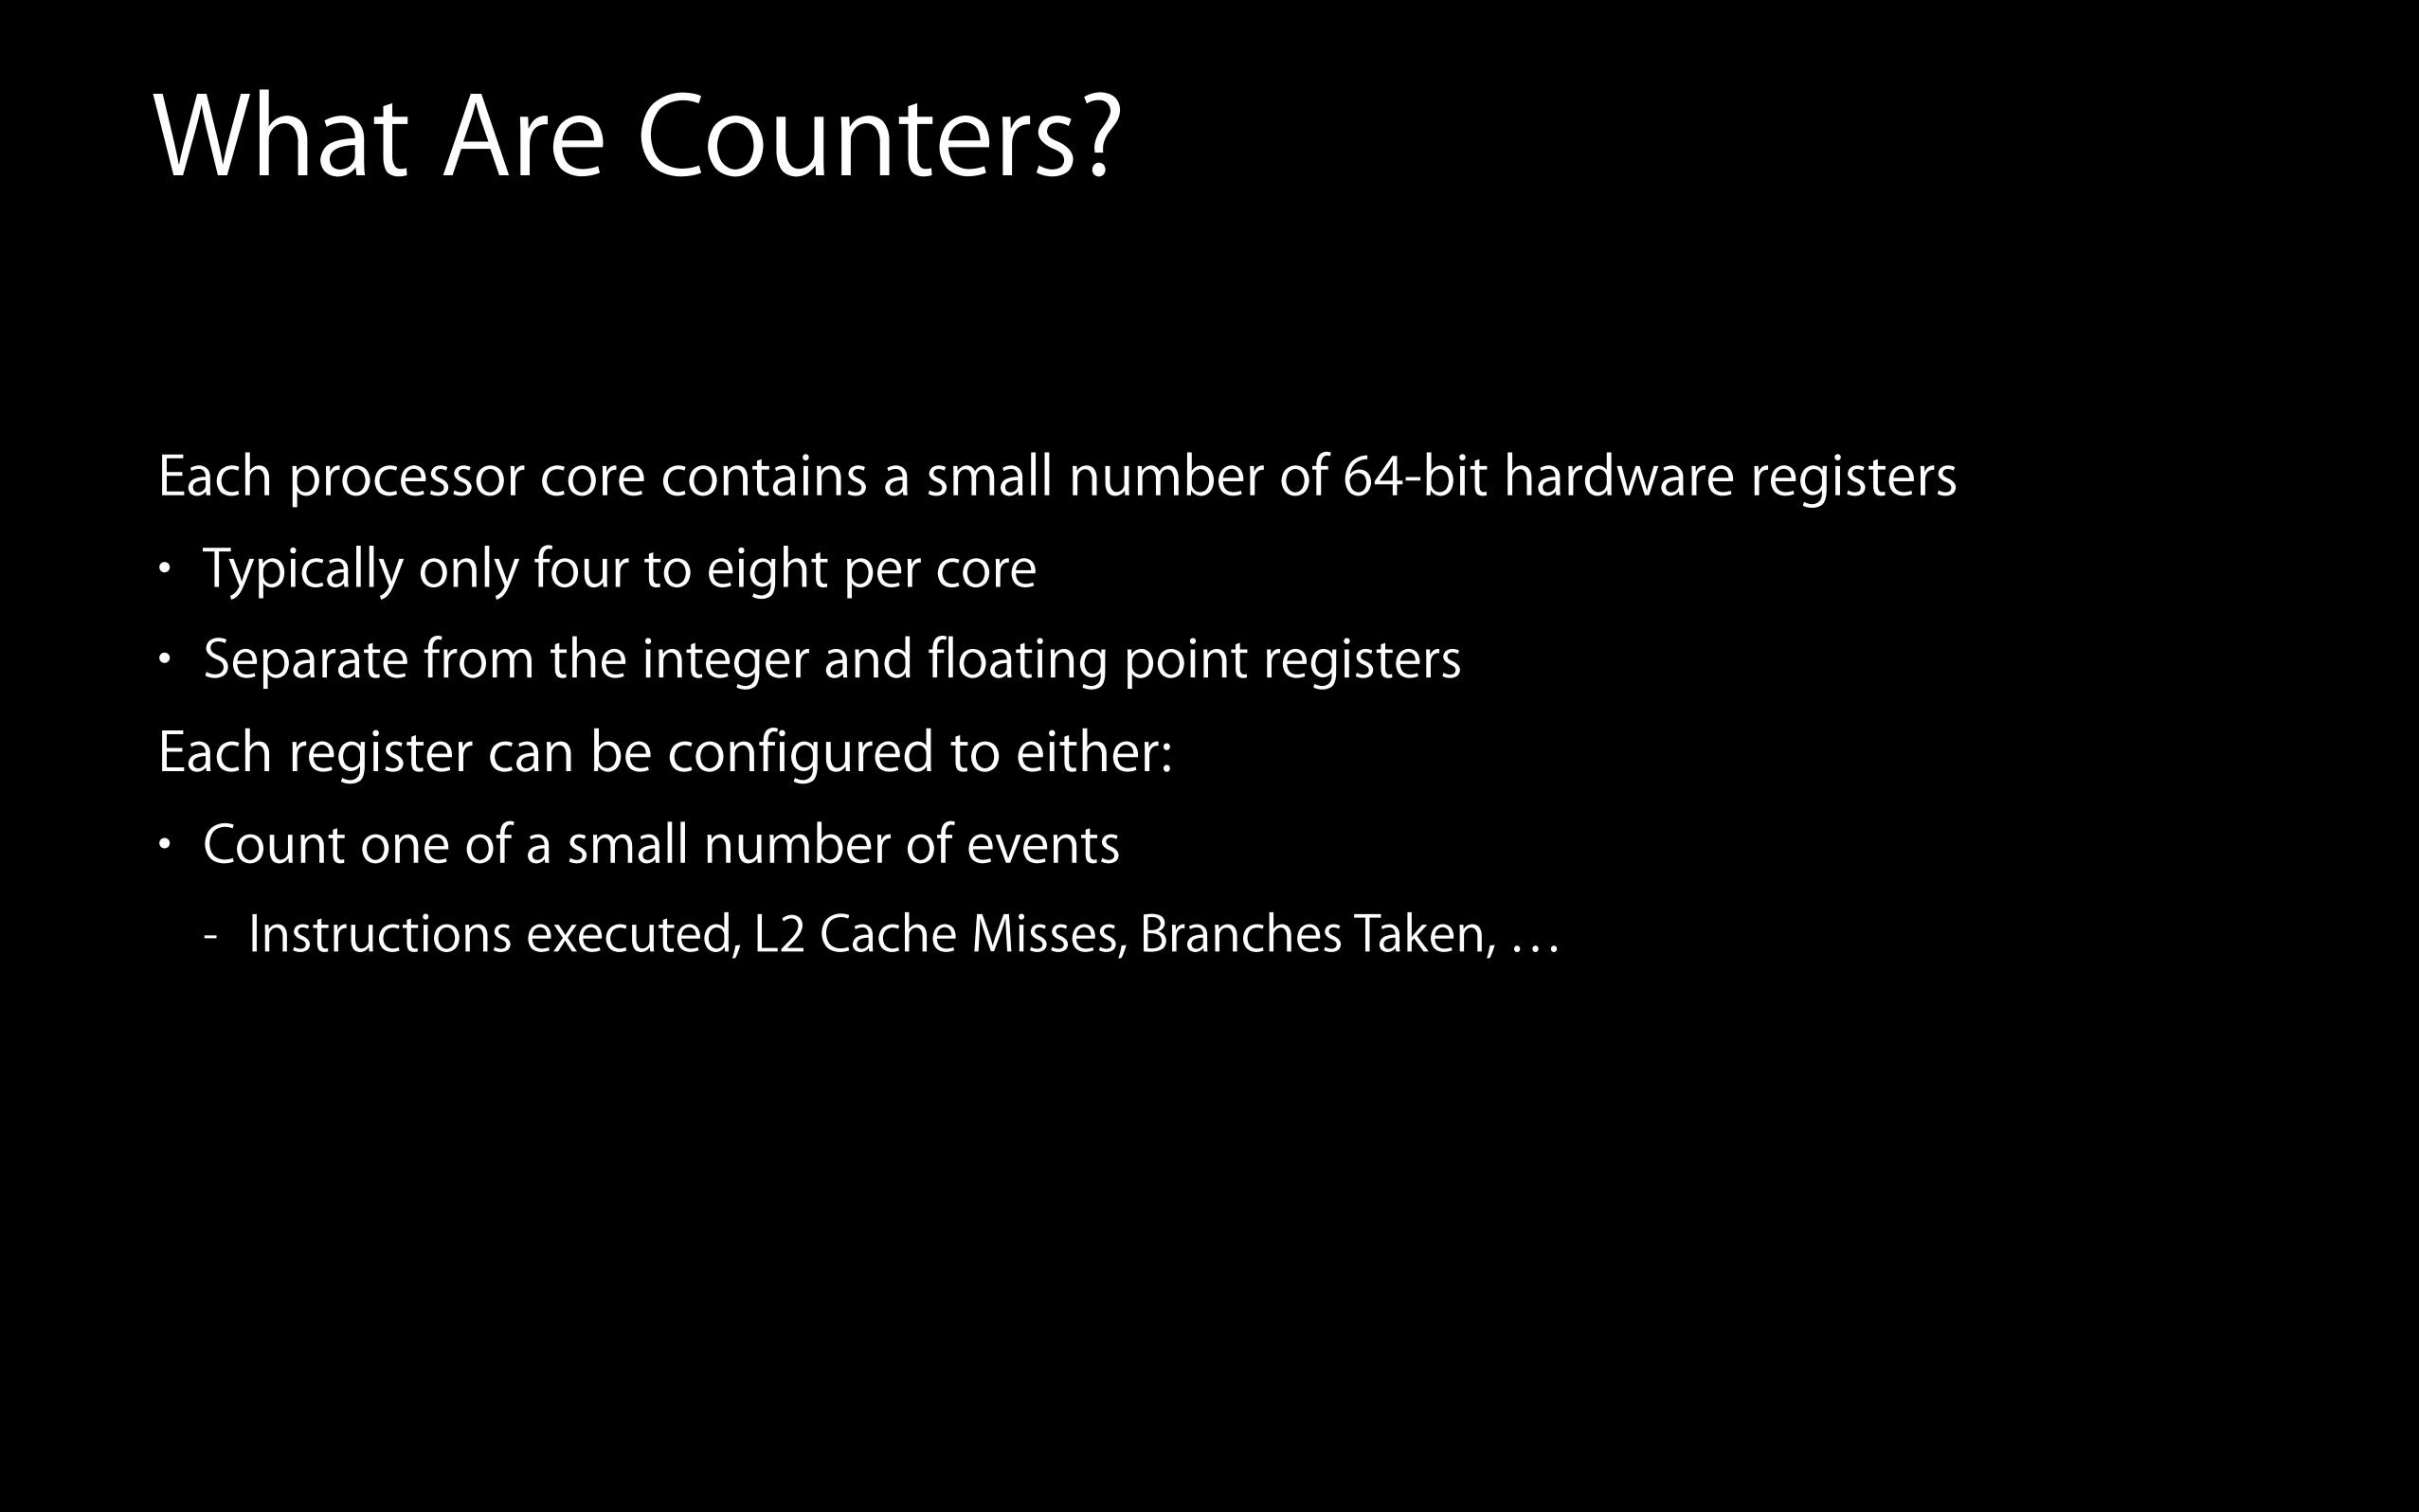
Each processor core contains a small number of 64-bit hardware registers• Typically only four to eight per core
• Separate from the integer and floating point registers
Each register can be configured to either:• Count one of a small number of events
What Are Counters?
Each processor core contains a small number of 64-bit hardware registers• Typically only four to eight per core
• Separate from the integer and floating point registers
Each register can be configured to either:• Count one of a small number of events
- Instructions executed, L2 Cache Misses, Branches Taken, …
What Are Counters?
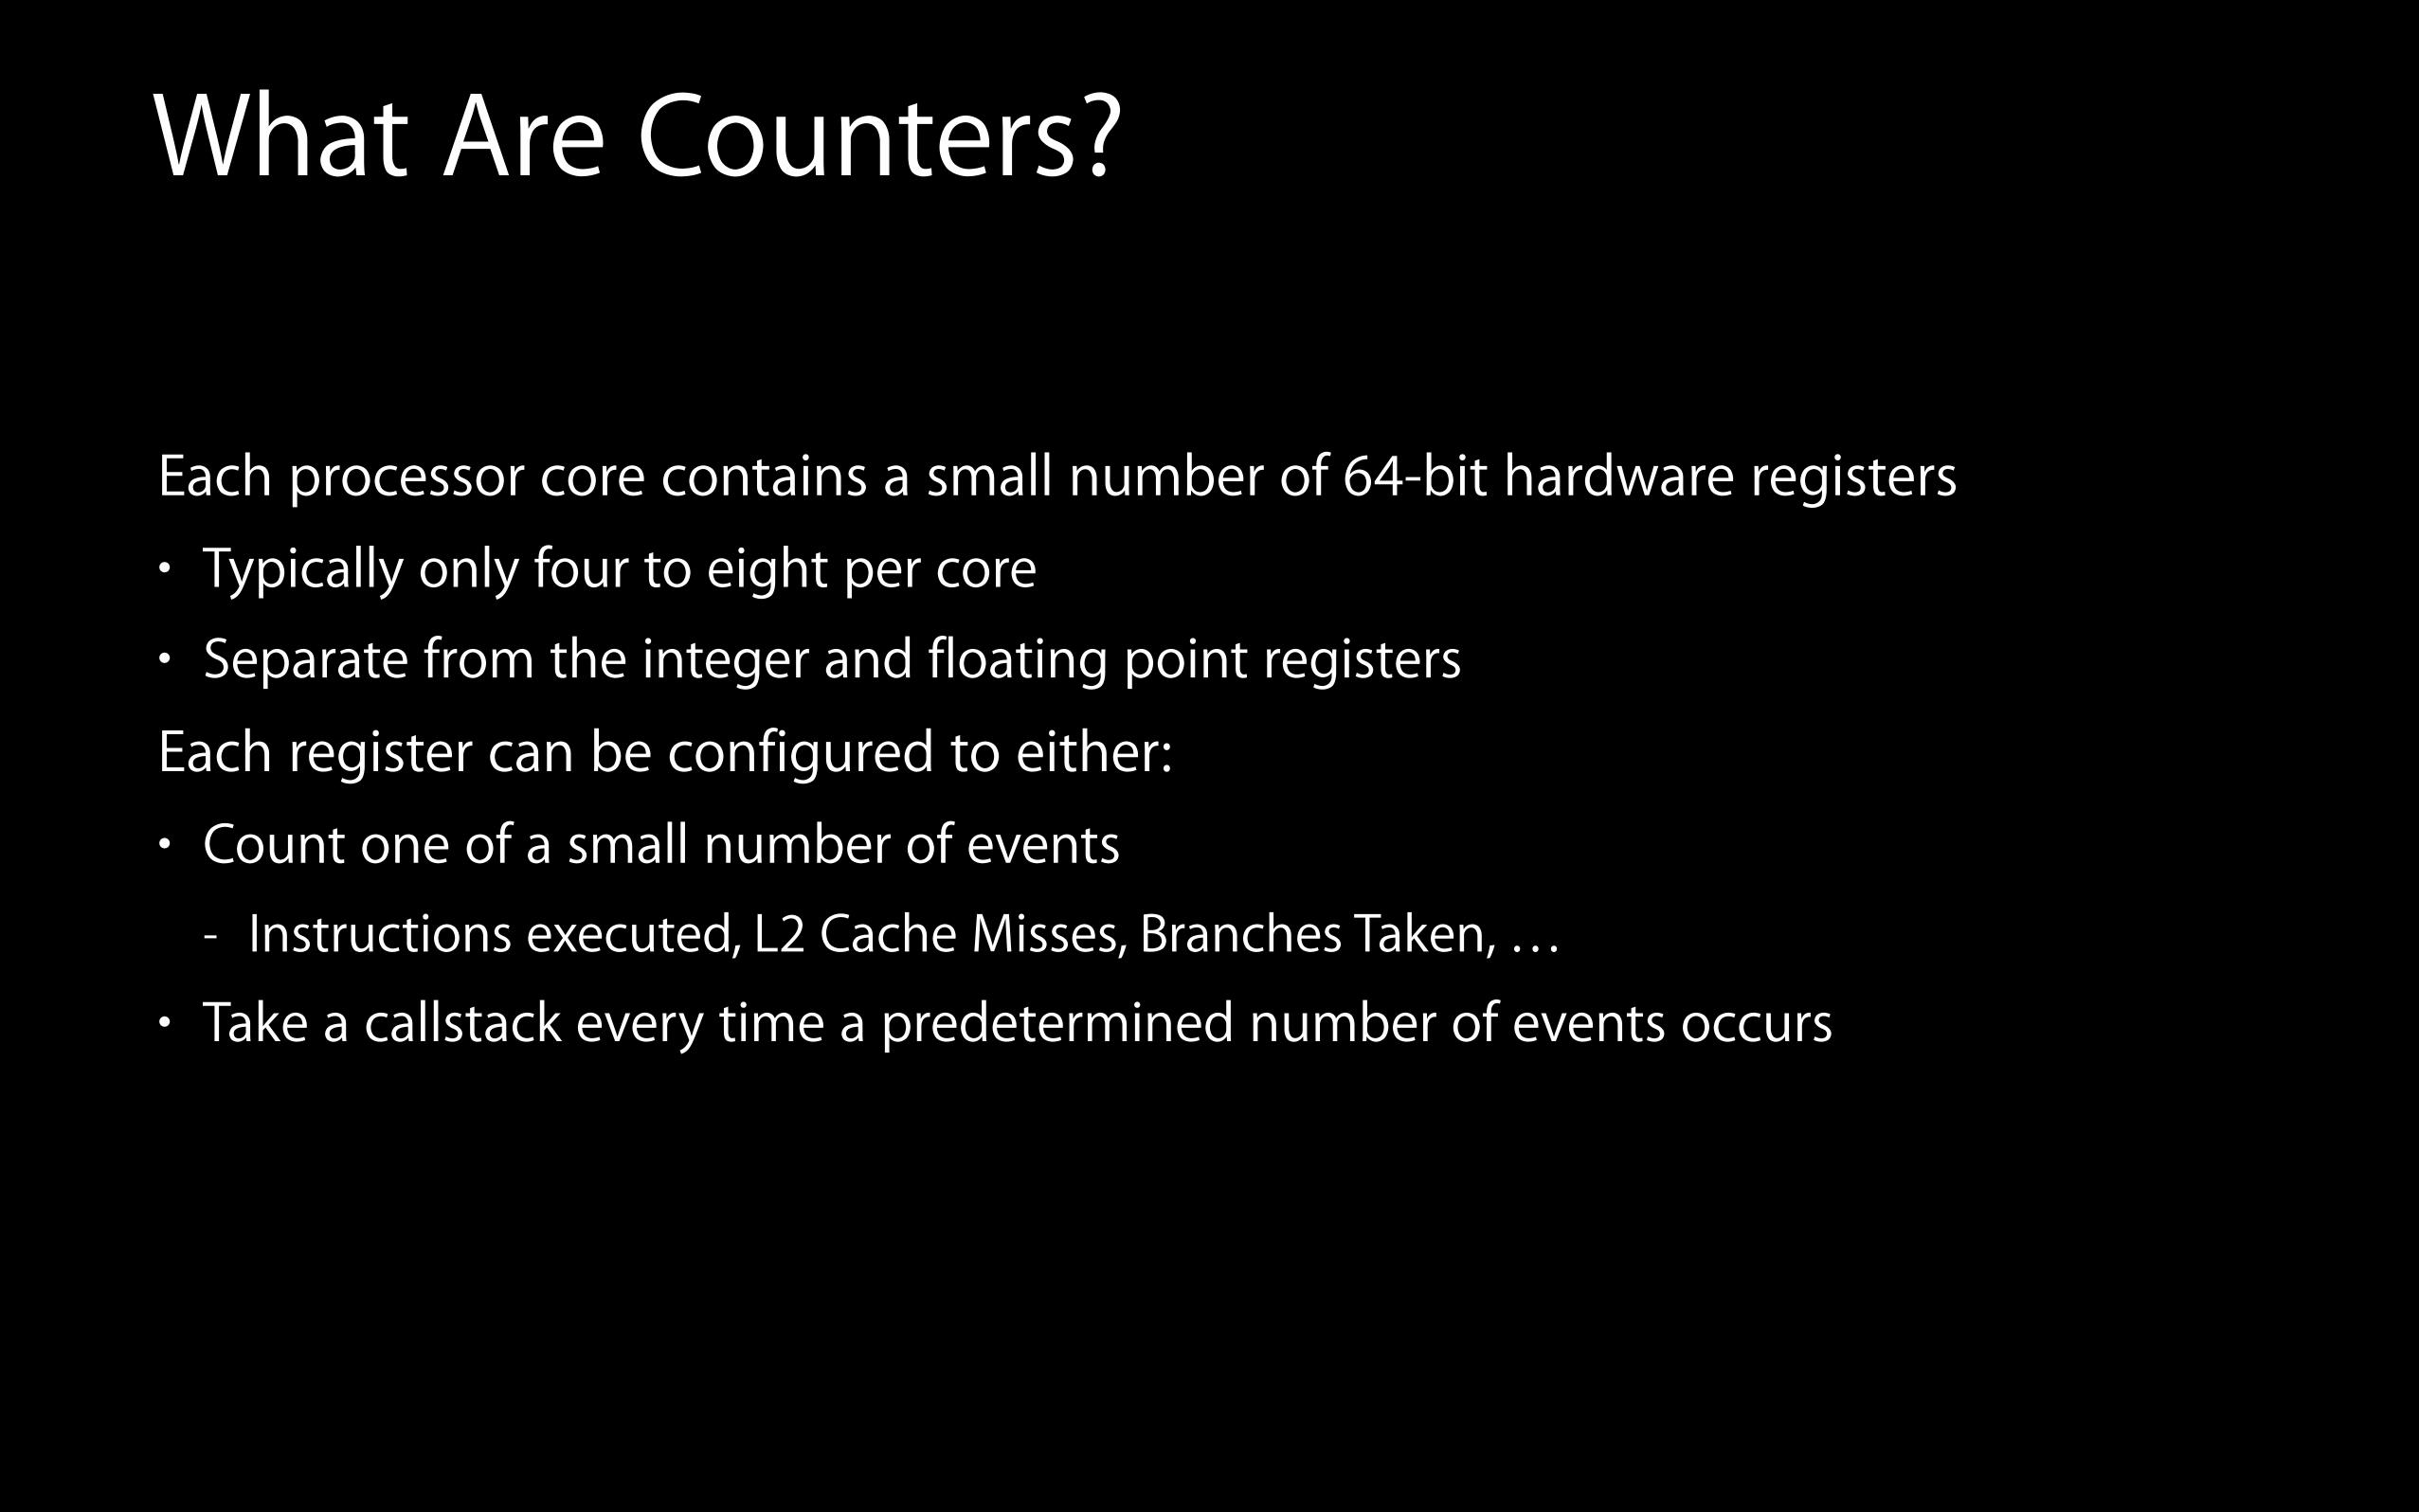
Each processor core contains a small number of 64-bit hardware registers• Typically only four to eight per core
• Separate from the integer and floating point registers
Each register can be configured to either:• Count one of a small number of events
- Instructions executed, L2 Cache Misses, Branches Taken, …
• Take a callstack every time a predetermined number of events occurs
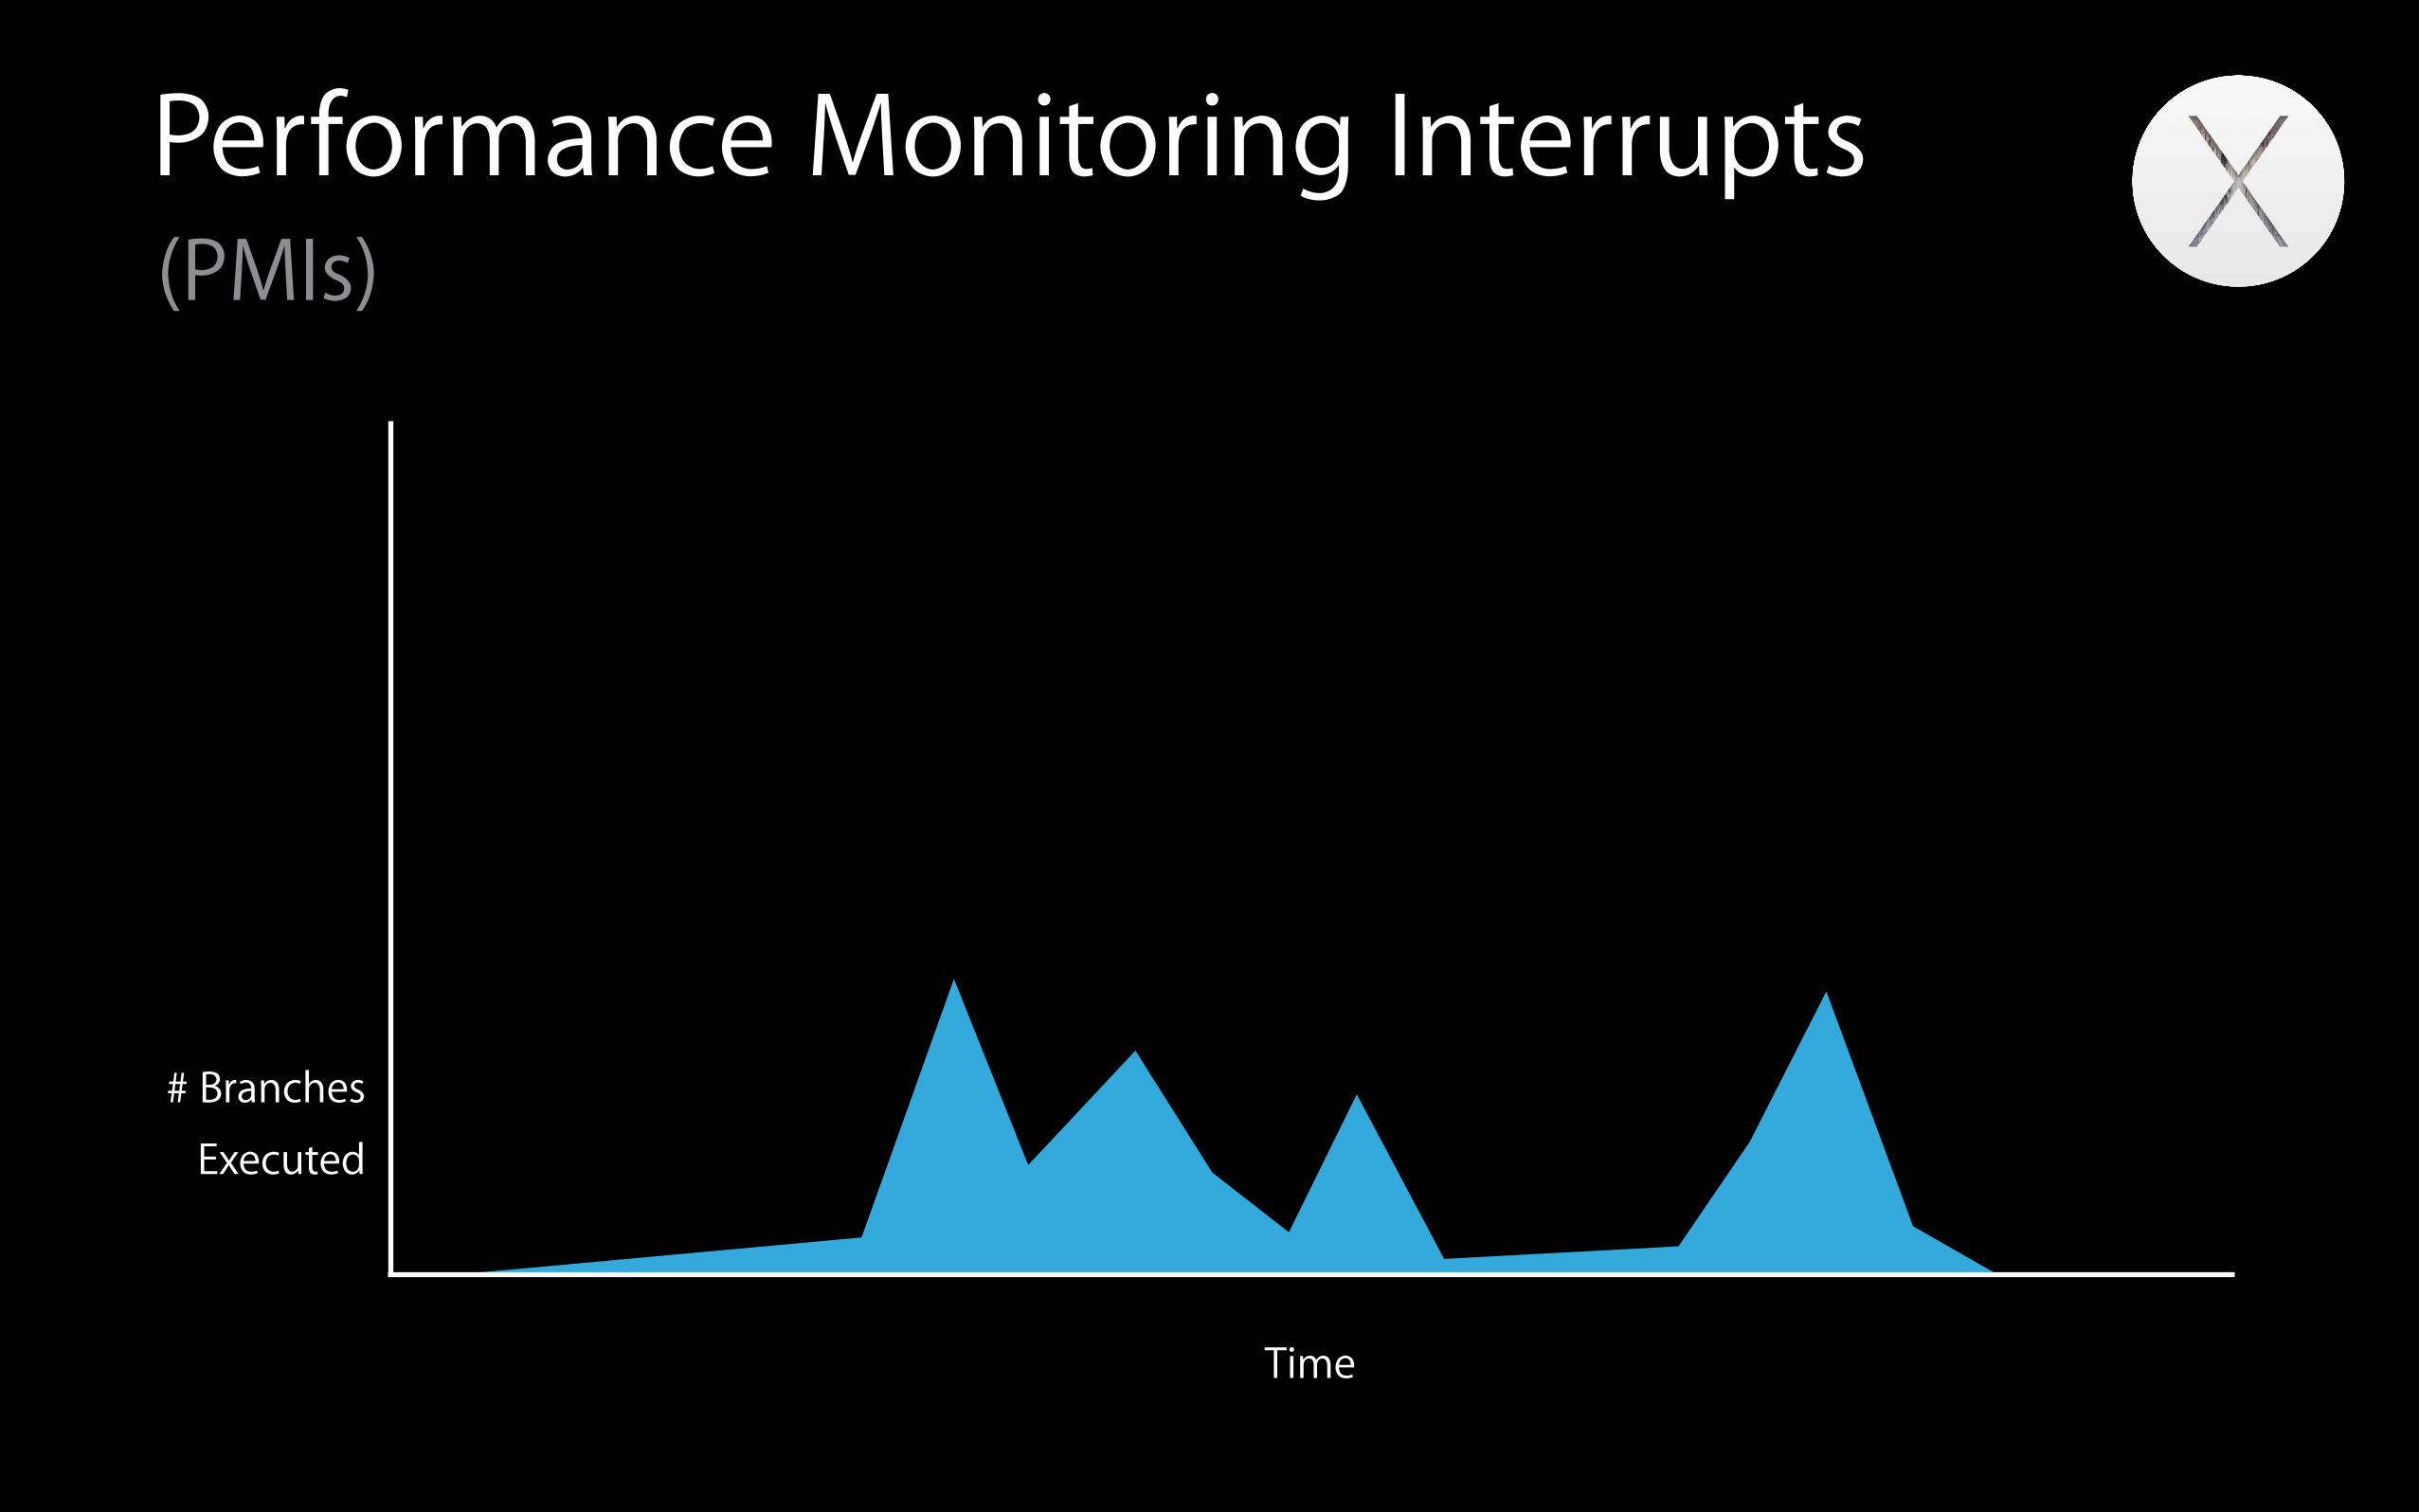
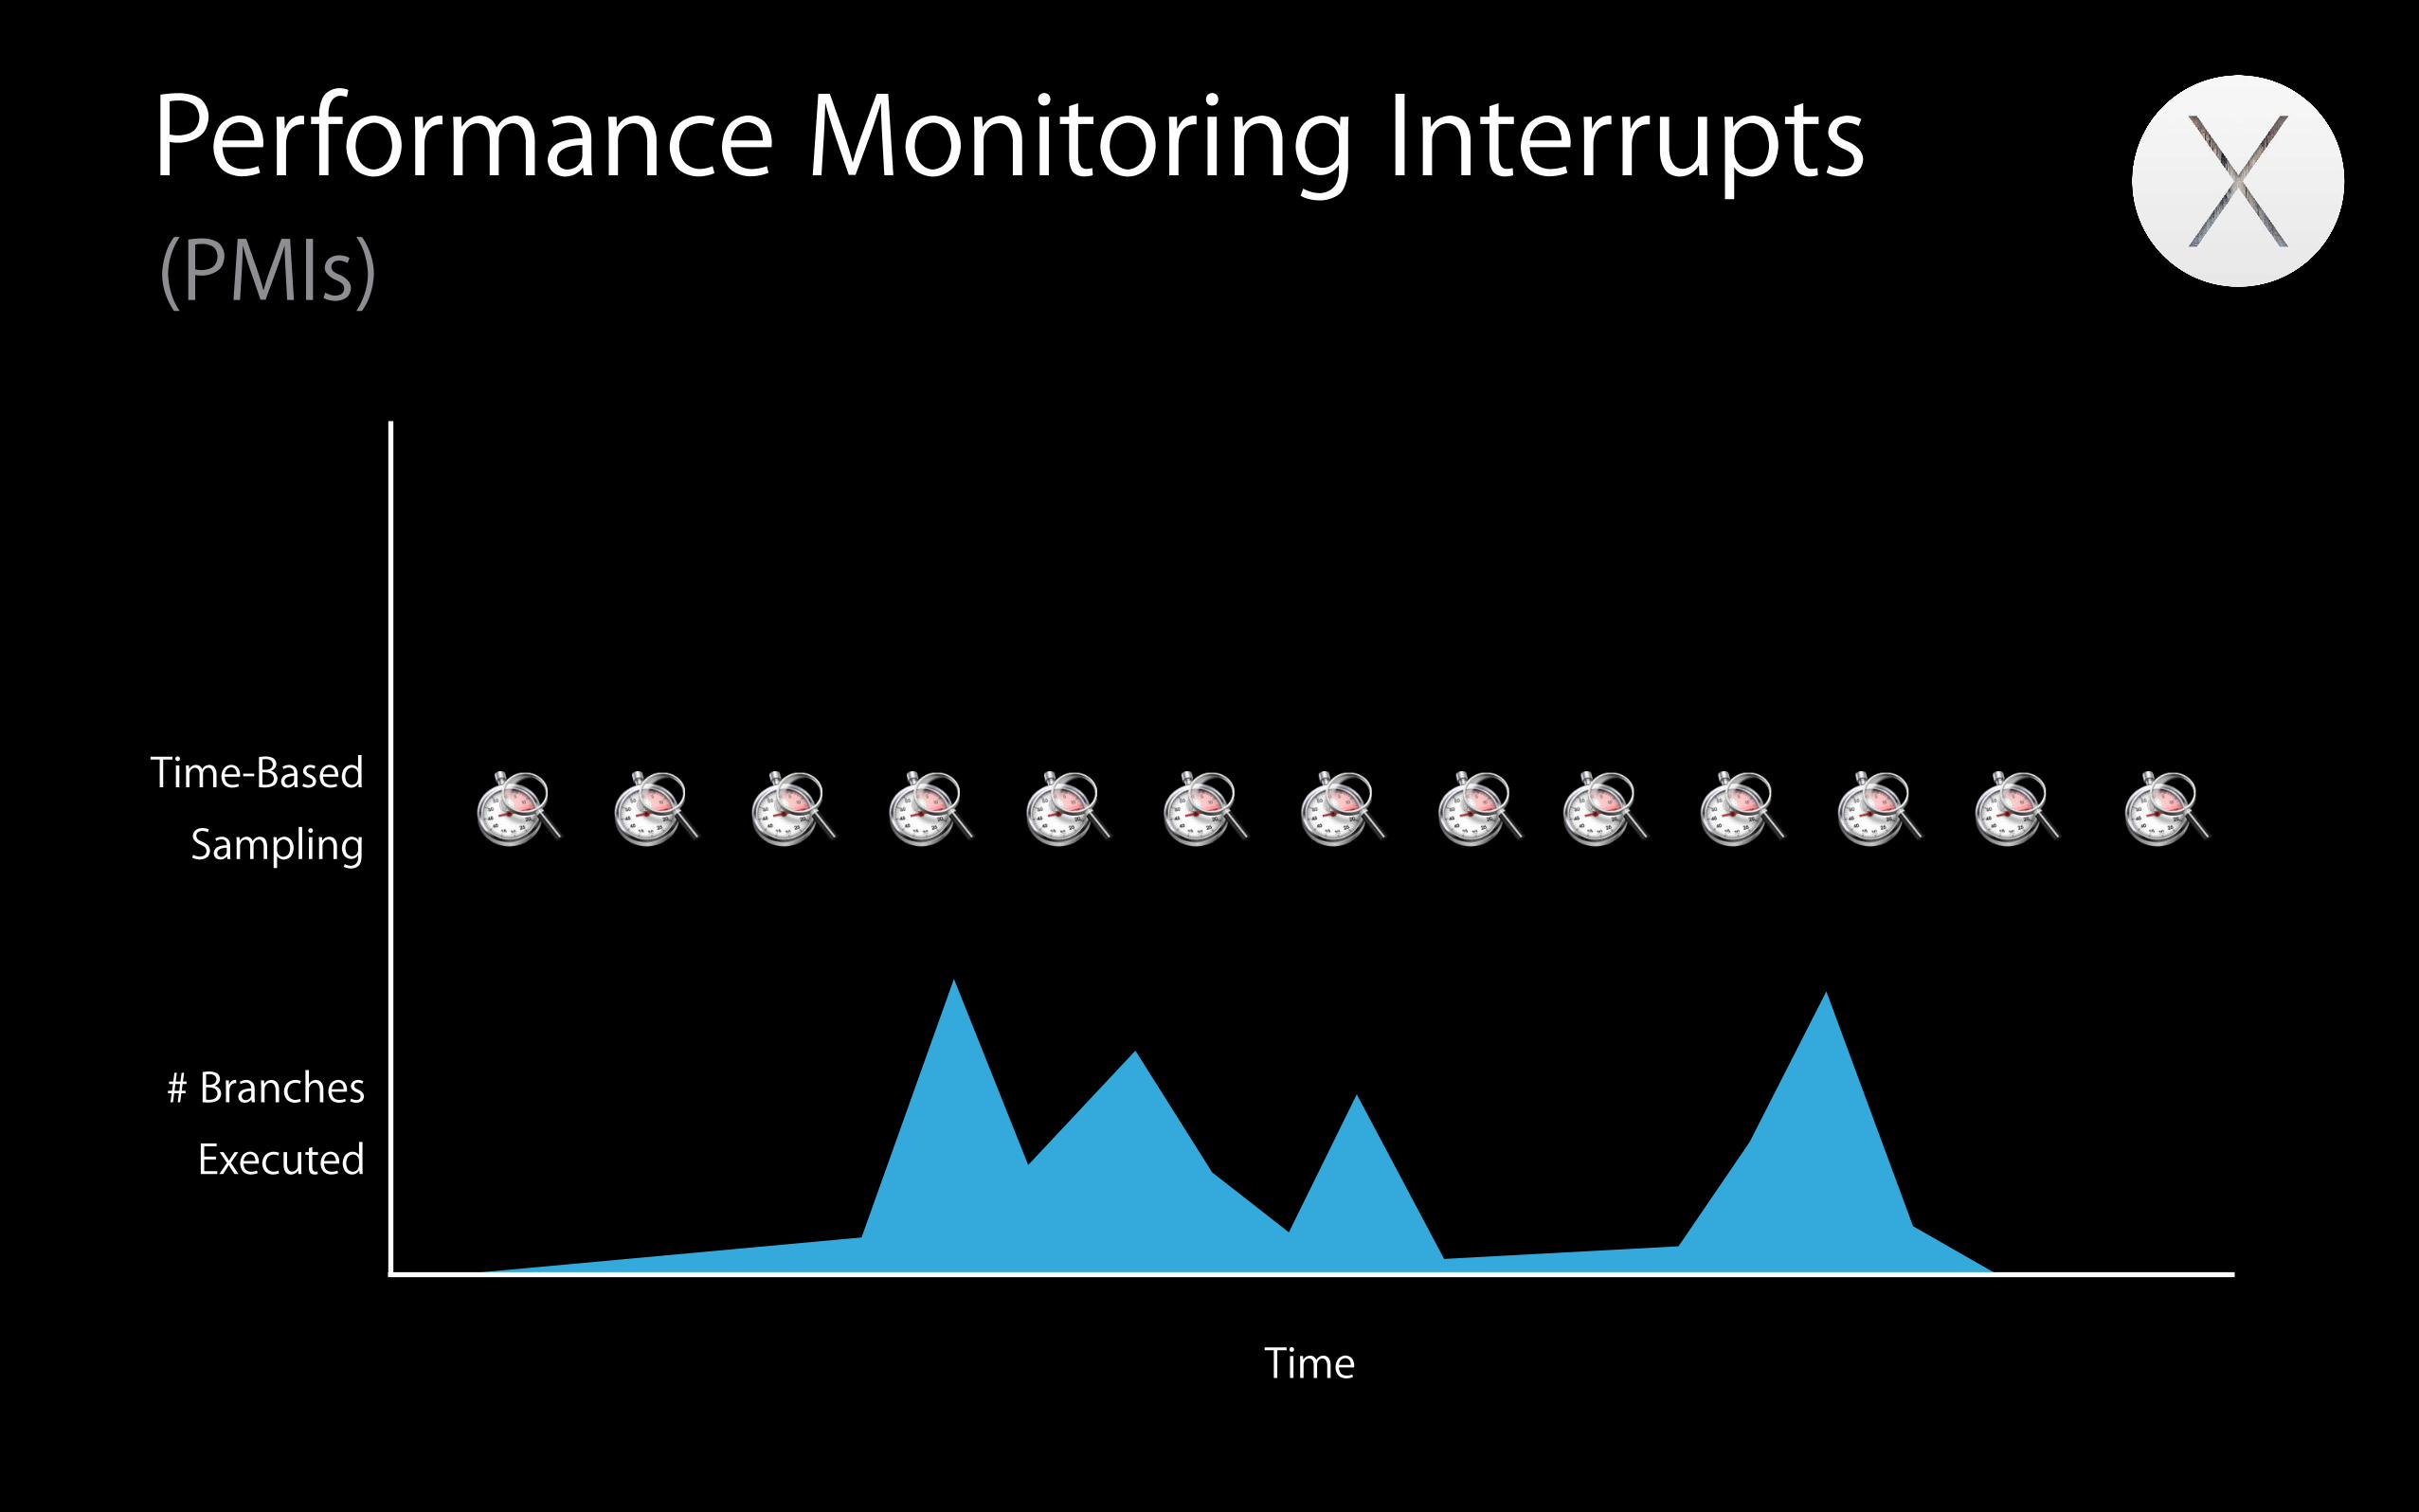
Performance Monitoring Interrupts(PMIs)
Time
# Branches
Executed
Performance Monitoring Interrupts(PMIs)
Time
# Branches
Executed
Time-Based
Sampling
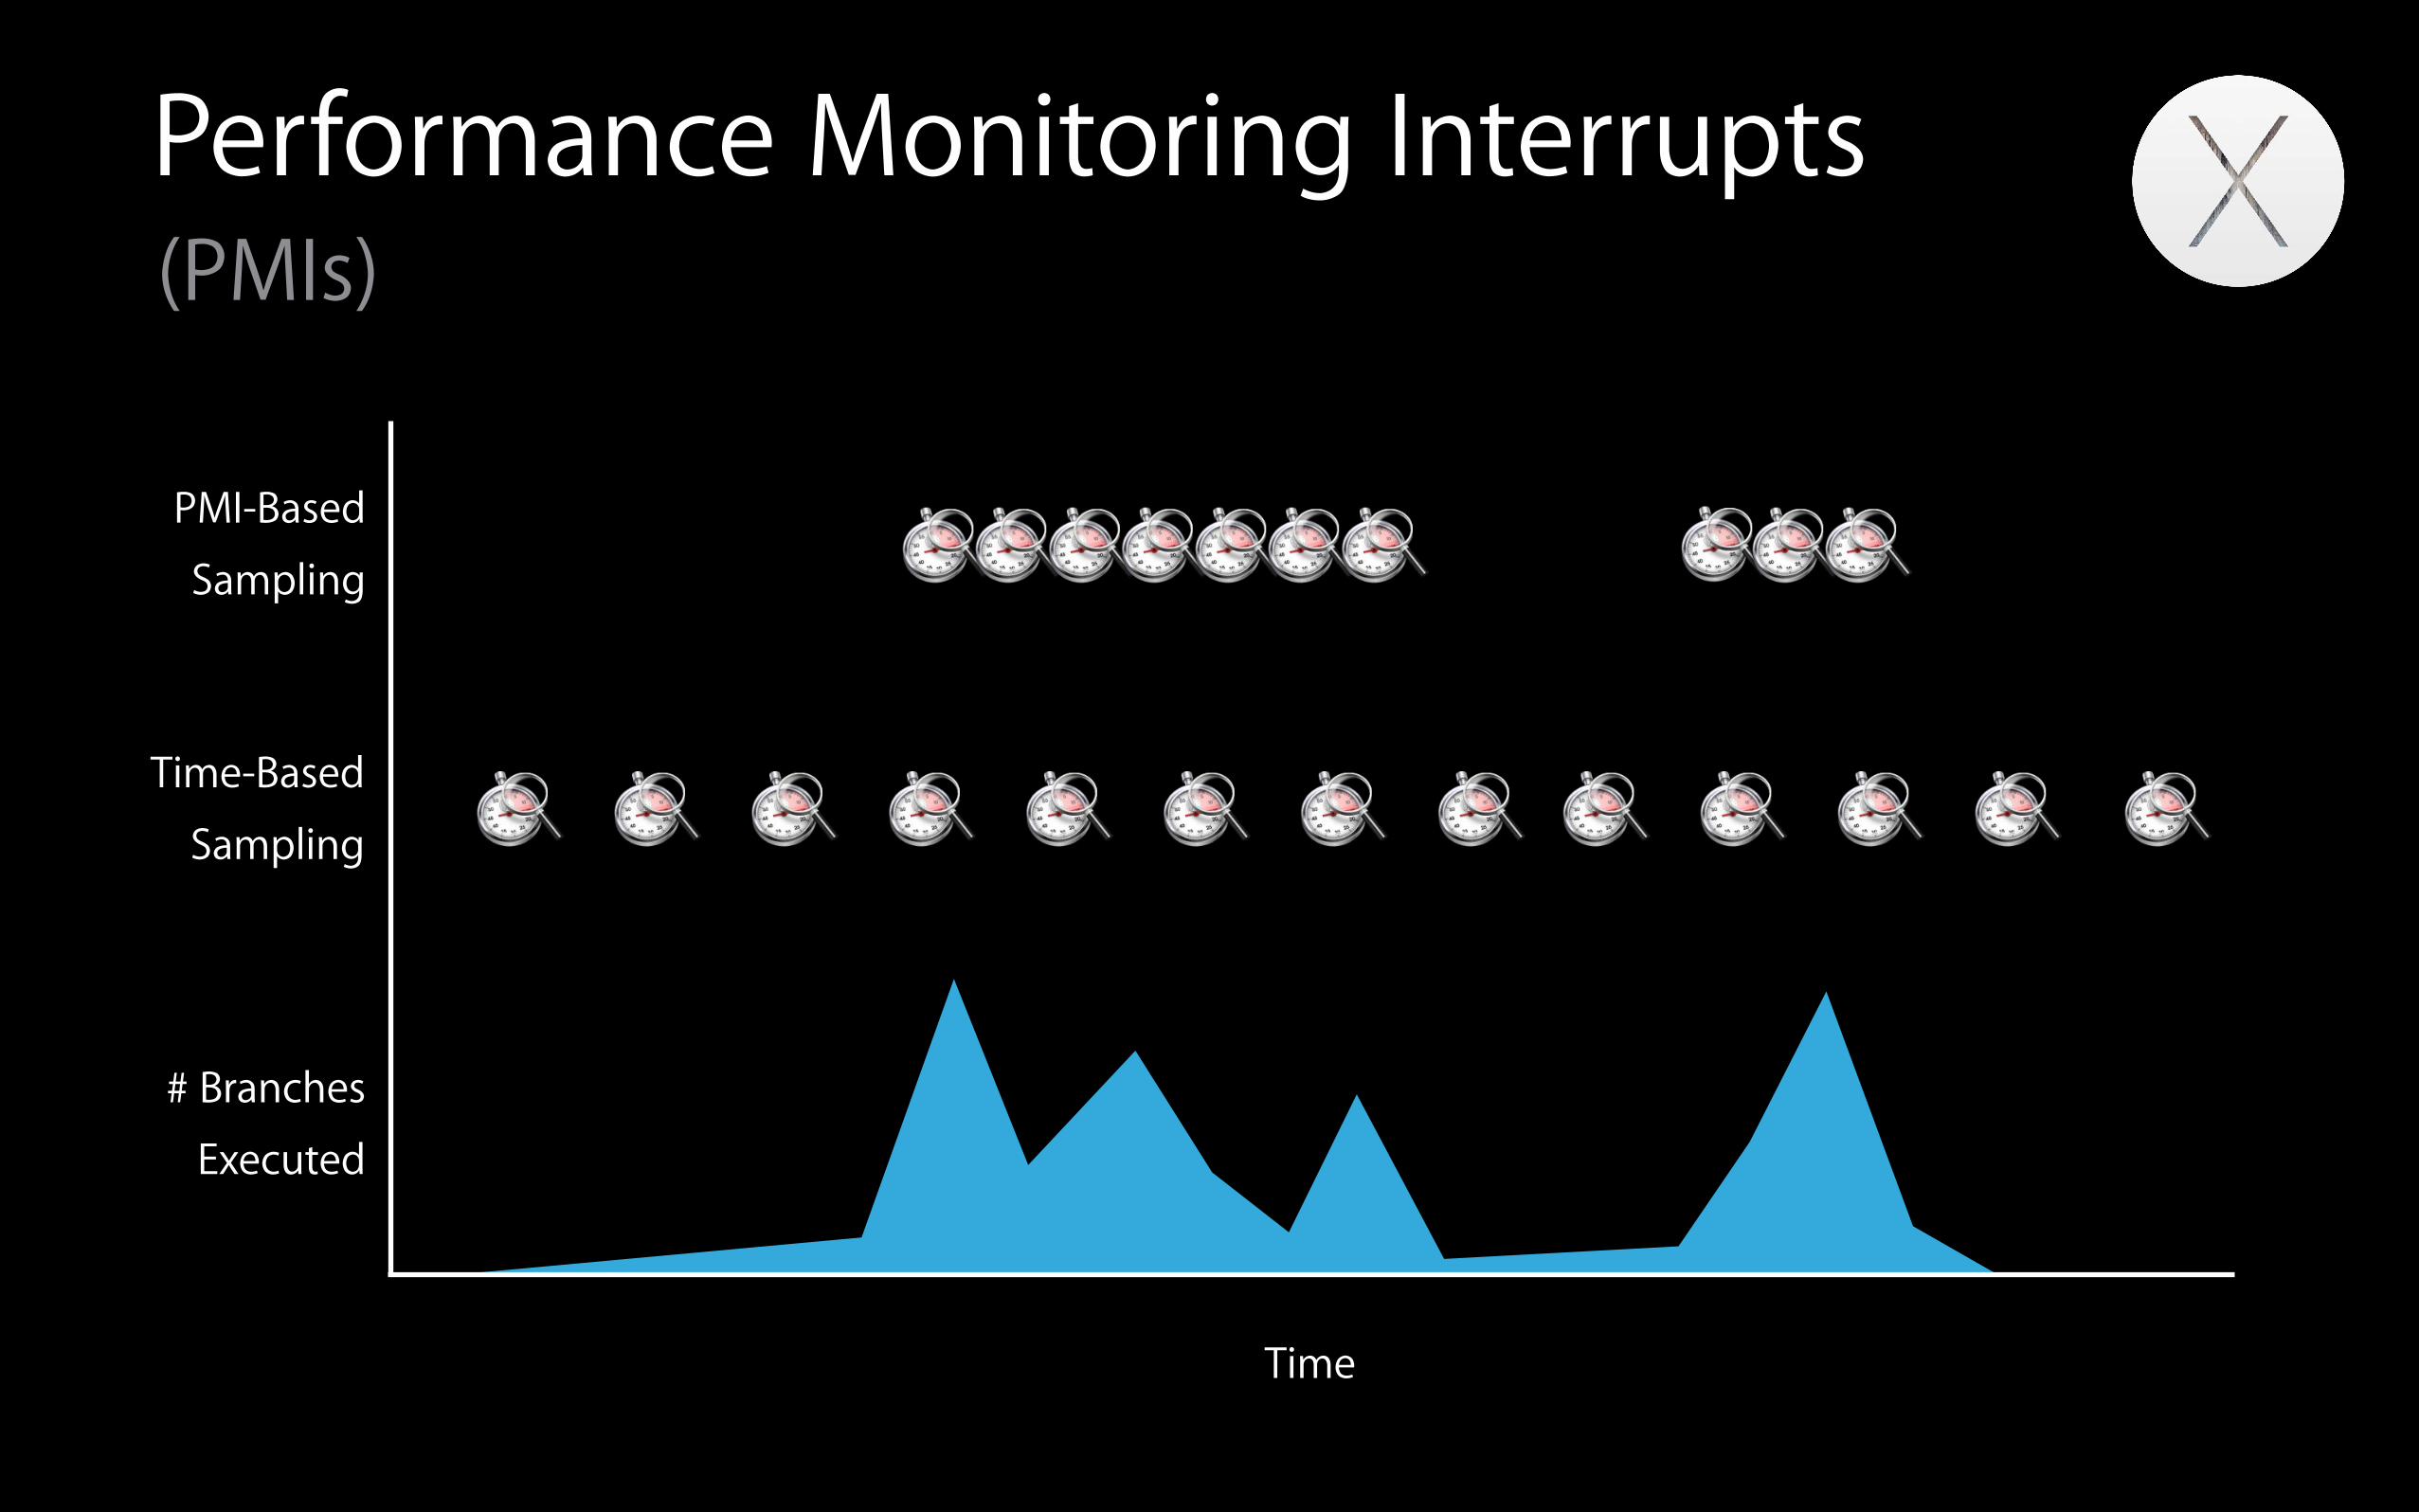
Performance Monitoring Interrupts(PMIs)
Time
# Branches
Executed
PMI-Based
Sampling
Time-Based
Sampling
Performance CountersHow are they useful?
Performance CountersHow are they useful?
Provide a deeper understanding of your app’s performance beyond just time
Performance CountersHow are they useful?
Provide a deeper understanding of your app’s performance beyond just time• How well CPU resources are being used
- Caches, execution units, TLBs, …
Performance CountersHow are they useful?
Provide a deeper understanding of your app’s performance beyond just time• How well CPU resources are being used
- Caches, execution units, TLBs, …
• Runtime process traits - Branch frequency, instruction mix, …
What’s New with Counters
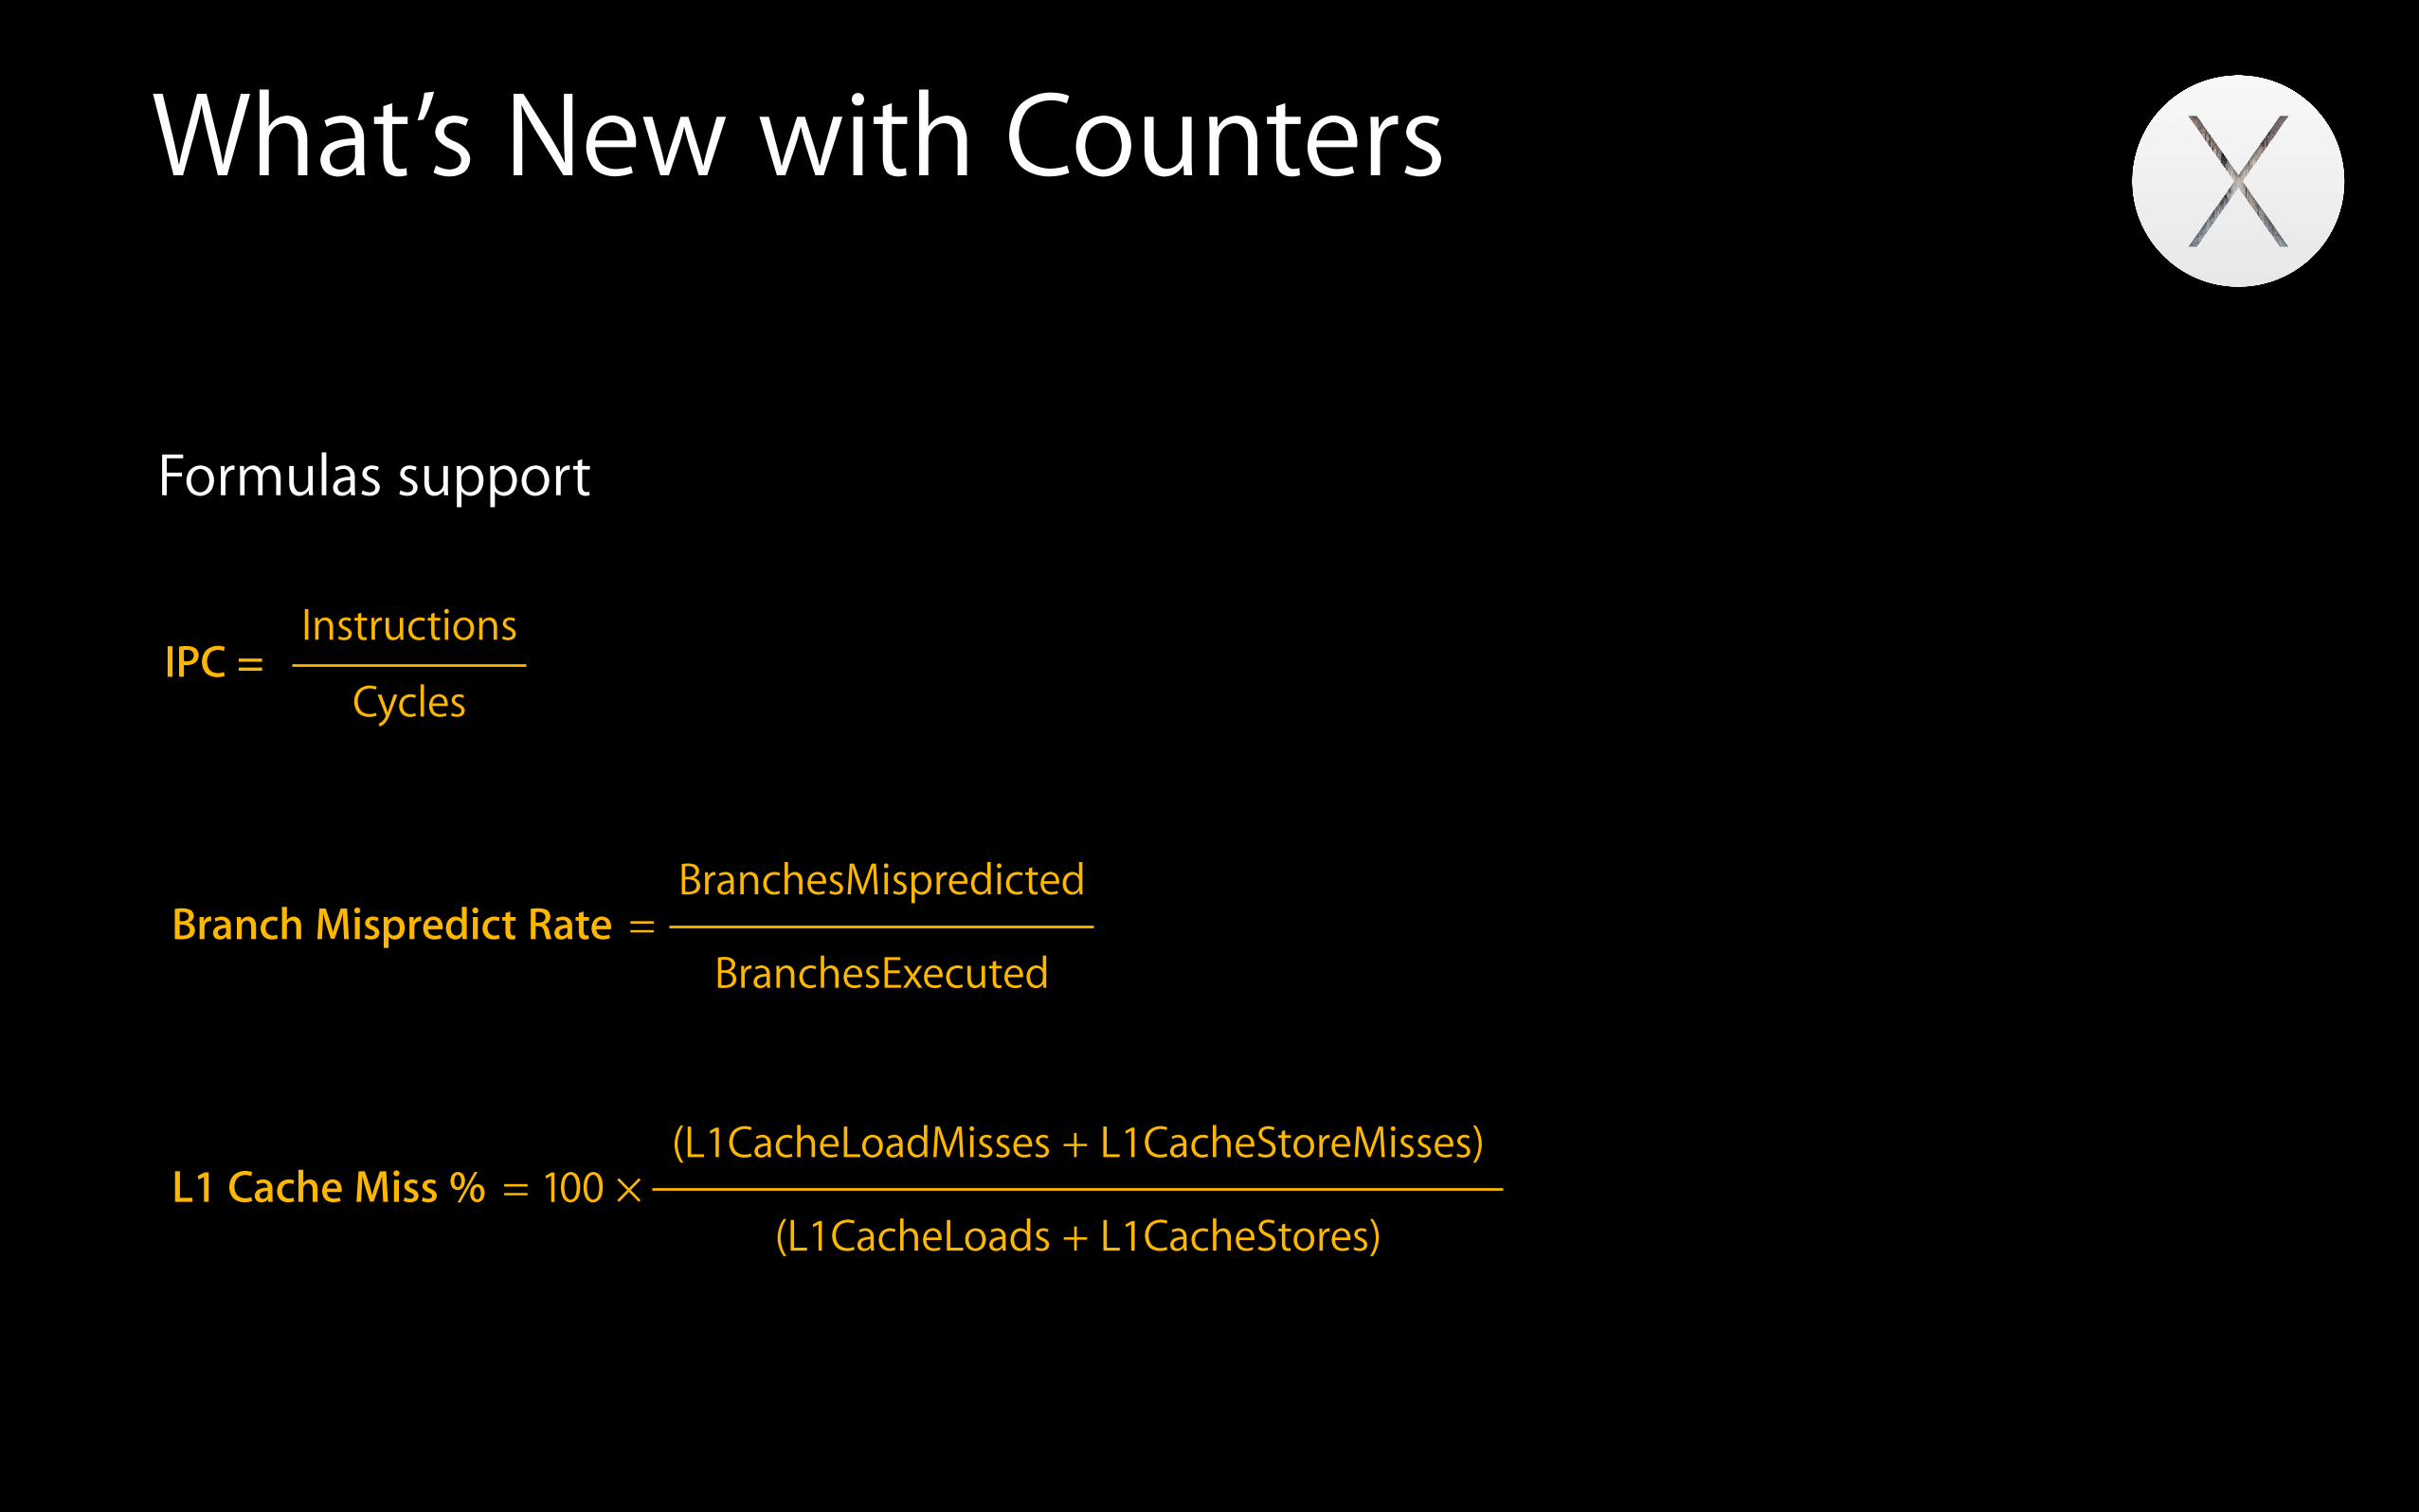
Formulas support
IPC =Instructions
Cycles
=BranchesMispredicted
Branch Mispredict RateBranchesExecuted
=(L1CacheLoadMisses + L1CacheStoreMisses)
L1 Cache Miss %(L1CacheLoads + L1CacheStores)
100 ×
What’s New with Counters
iOS 8 support • 64-bit ARM devices only
What’s New with Counters
iOS 8 support • 64-bit ARM devices only
Event Profiler instrument is deprecated • Same PMI functionality is available within the Counters instrument
DemoiOS Performance Counters
Counters Summary
Counters Summary
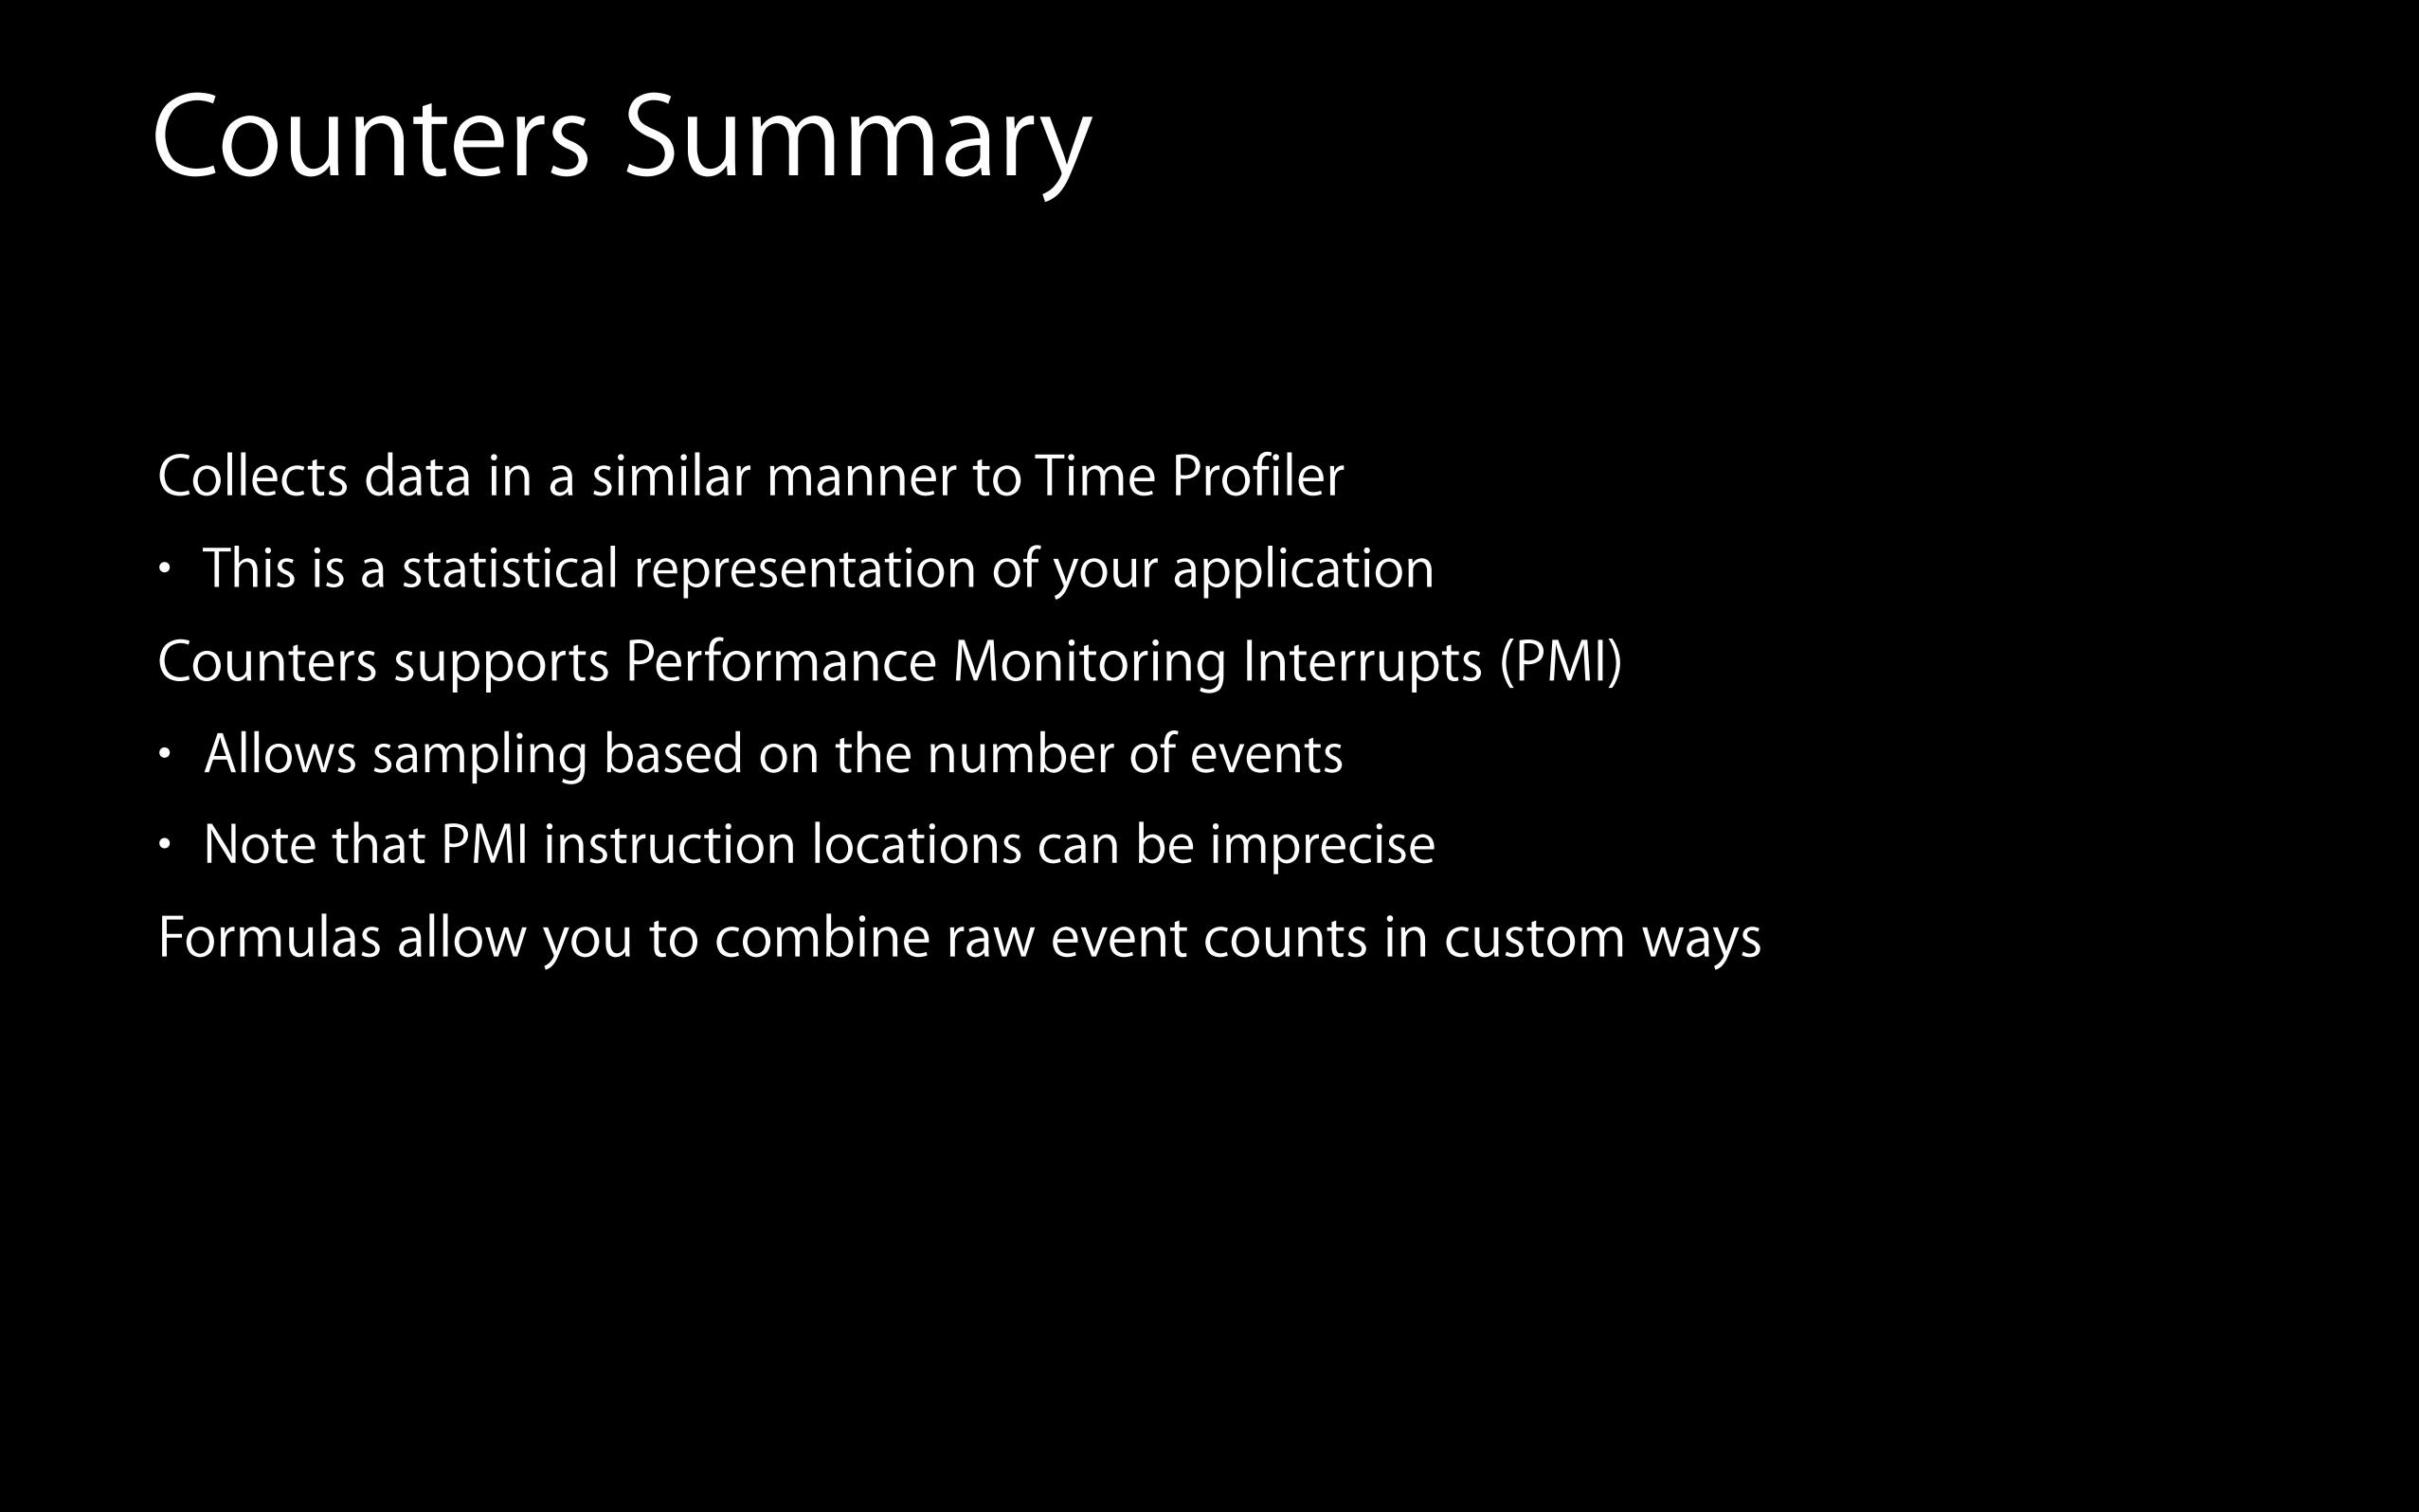
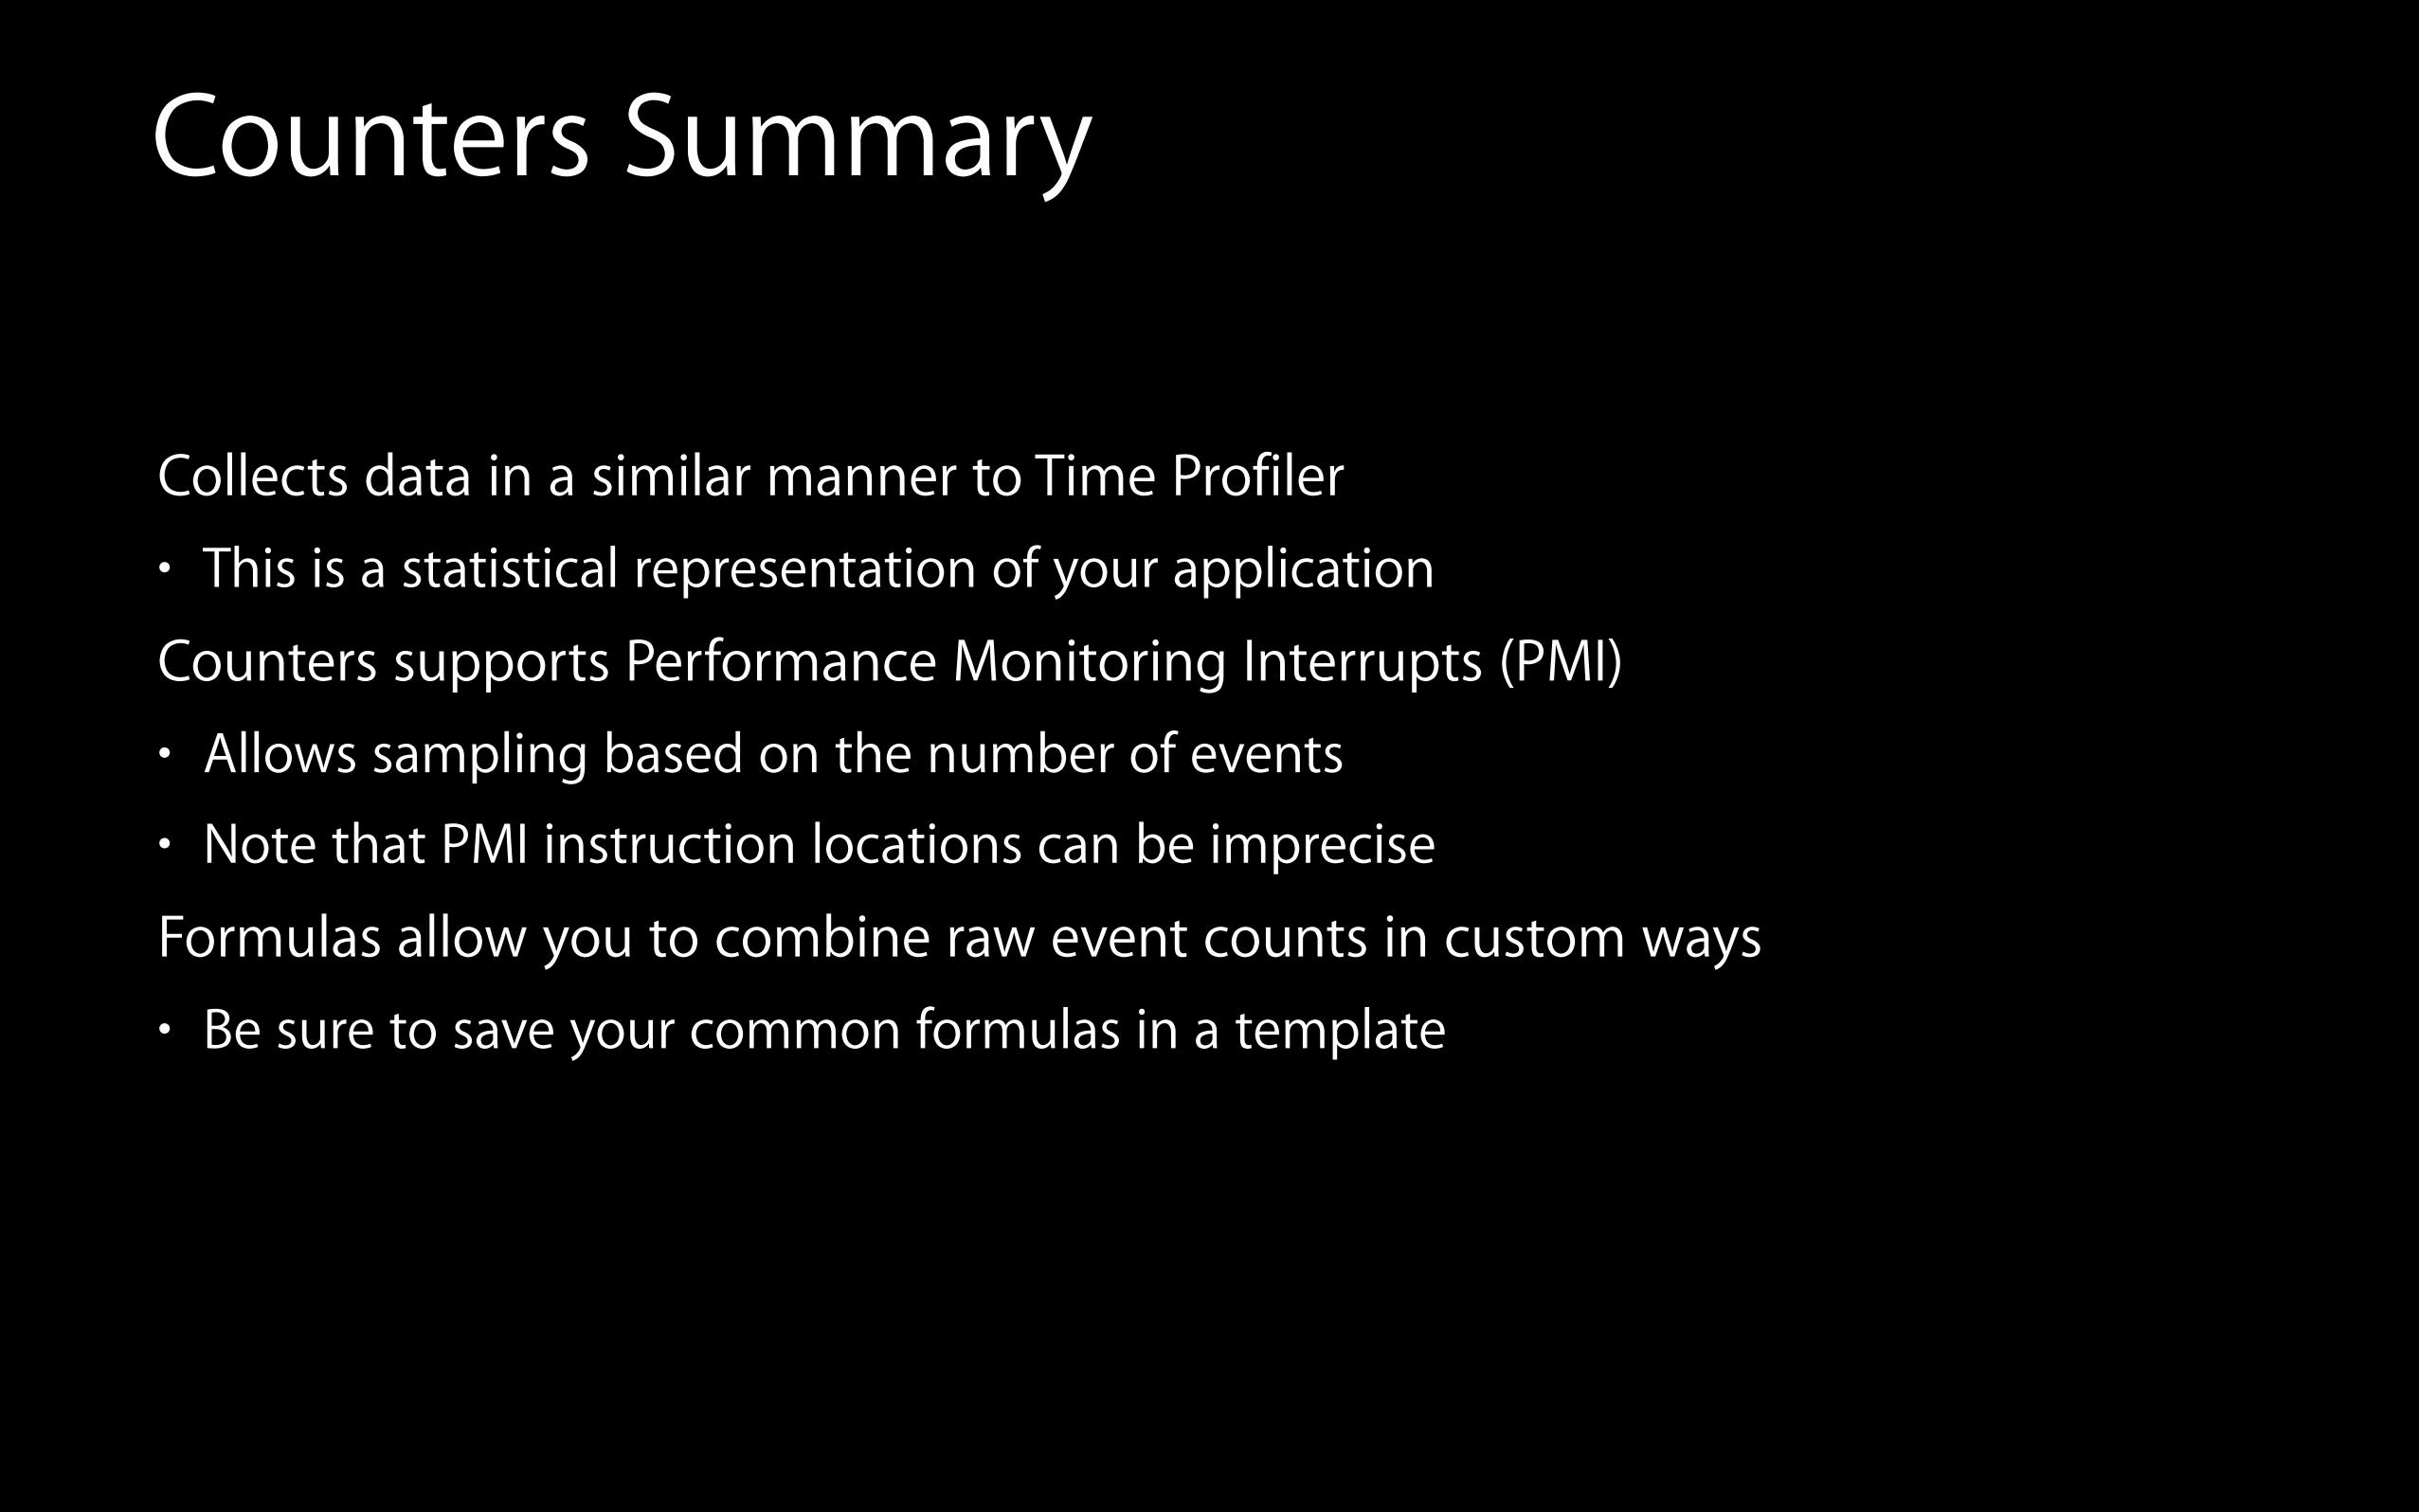
Collects data in a similar manner to Time Profiler
Counters Summary
Collects data in a similar manner to Time Profiler• This is a statistical representation of your application
Counters Summary
Collects data in a similar manner to Time Profiler• This is a statistical representation of your application
Counters supports Performance Monitoring Interrupts (PMI)
Counters Summary
Collects data in a similar manner to Time Profiler• This is a statistical representation of your application
Counters supports Performance Monitoring Interrupts (PMI)• Allows sampling based on the number of events
Counters Summary
Collects data in a similar manner to Time Profiler• This is a statistical representation of your application
Counters supports Performance Monitoring Interrupts (PMI)• Allows sampling based on the number of events
• Note that PMI instruction locations can be imprecise
Counters Summary
Collects data in a similar manner to Time Profiler• This is a statistical representation of your application
Counters supports Performance Monitoring Interrupts (PMI)• Allows sampling based on the number of events
• Note that PMI instruction locations can be imprecise
Formulas allow you to combine raw event counts in custom ways
Counters Summary
Collects data in a similar manner to Time Profiler• This is a statistical representation of your application
Counters supports Performance Monitoring Interrupts (PMI)• Allows sampling based on the number of events
• Note that PMI instruction locations can be imprecise
Formulas allow you to combine raw event counts in custom ways• Be sure to save your common formulas in a template

What’s New with DTrace

What’s New with DTrace
Dynamic tracemem
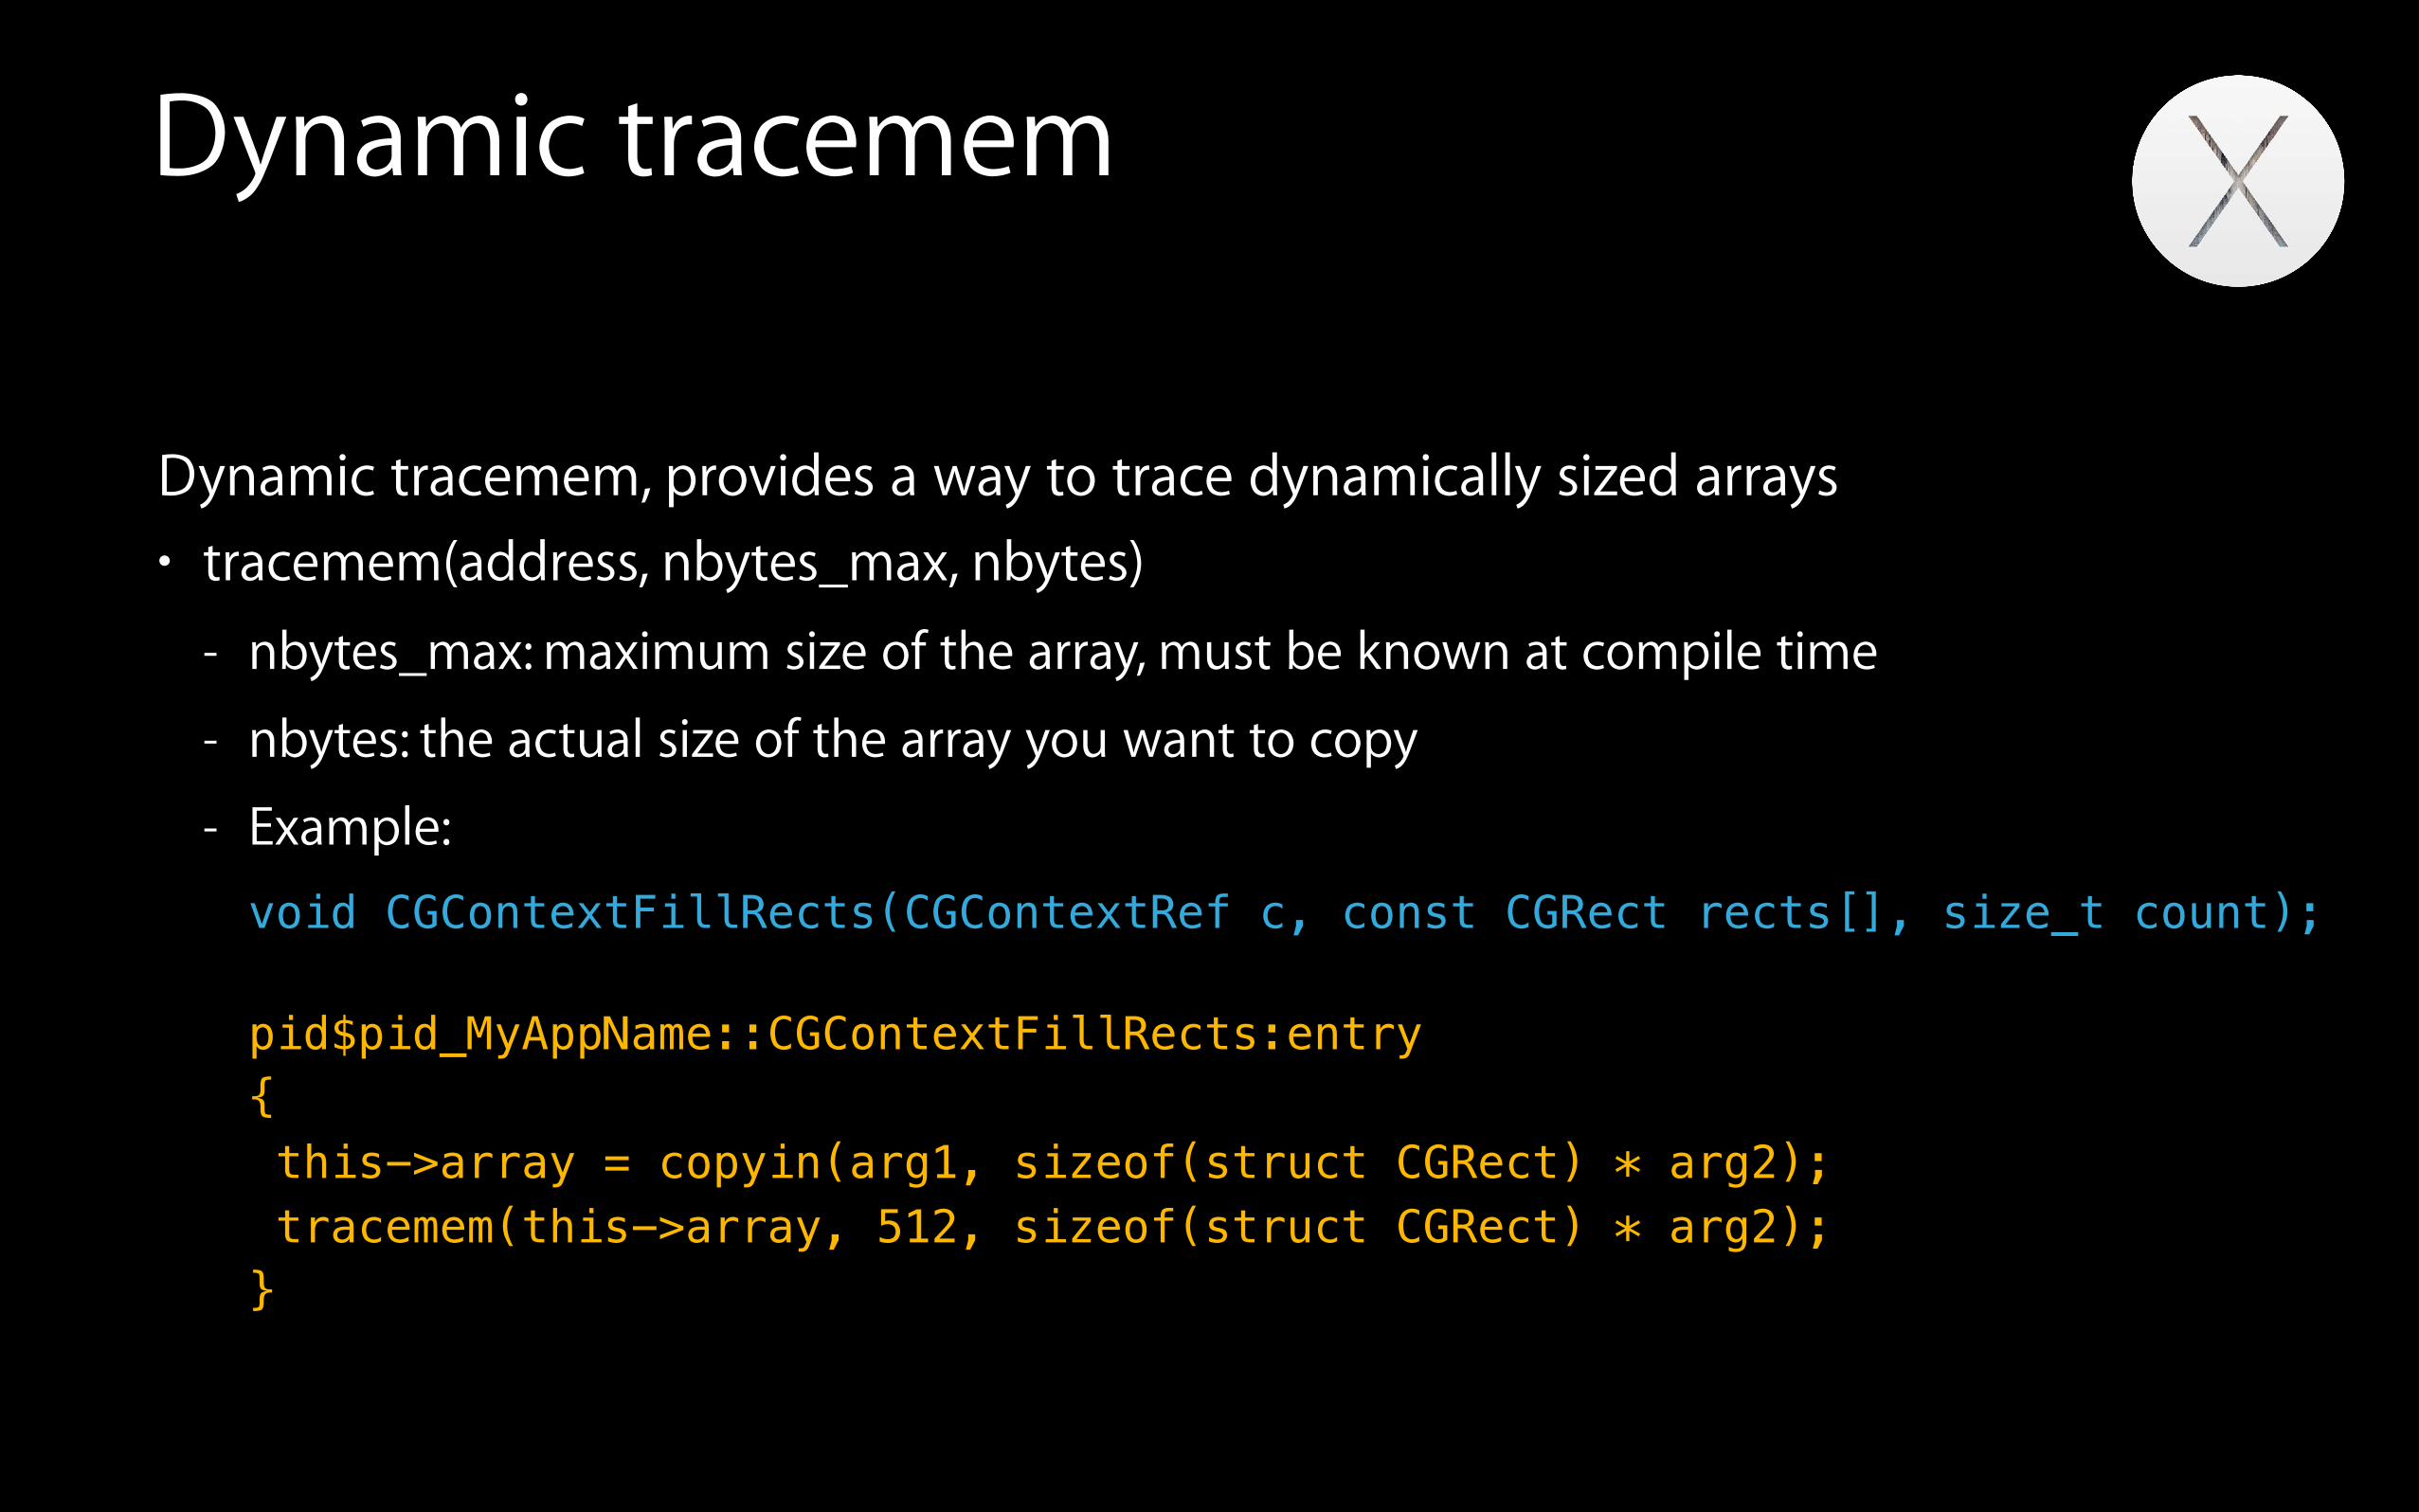
Dynamic tracemem, provides a way to trace dynamically sized arrays • tracemem(address, nbytes_max, nbytes)
- nbytes_max: maximum size of the array, must be known at compile time
- nbytes: the actual size of the array you want to copy
- Example: void CGContextFillRects(CGContextRef c, const CGRect rects[], size_t count); pid$pid_MyAppName::CGContextFillRects:entry { this->array = copyin(arg1, sizeof(struct CGRect) * arg2); tracemem(this->array, 512, sizeof(struct CGRect) * arg2); }
Improved Histograms
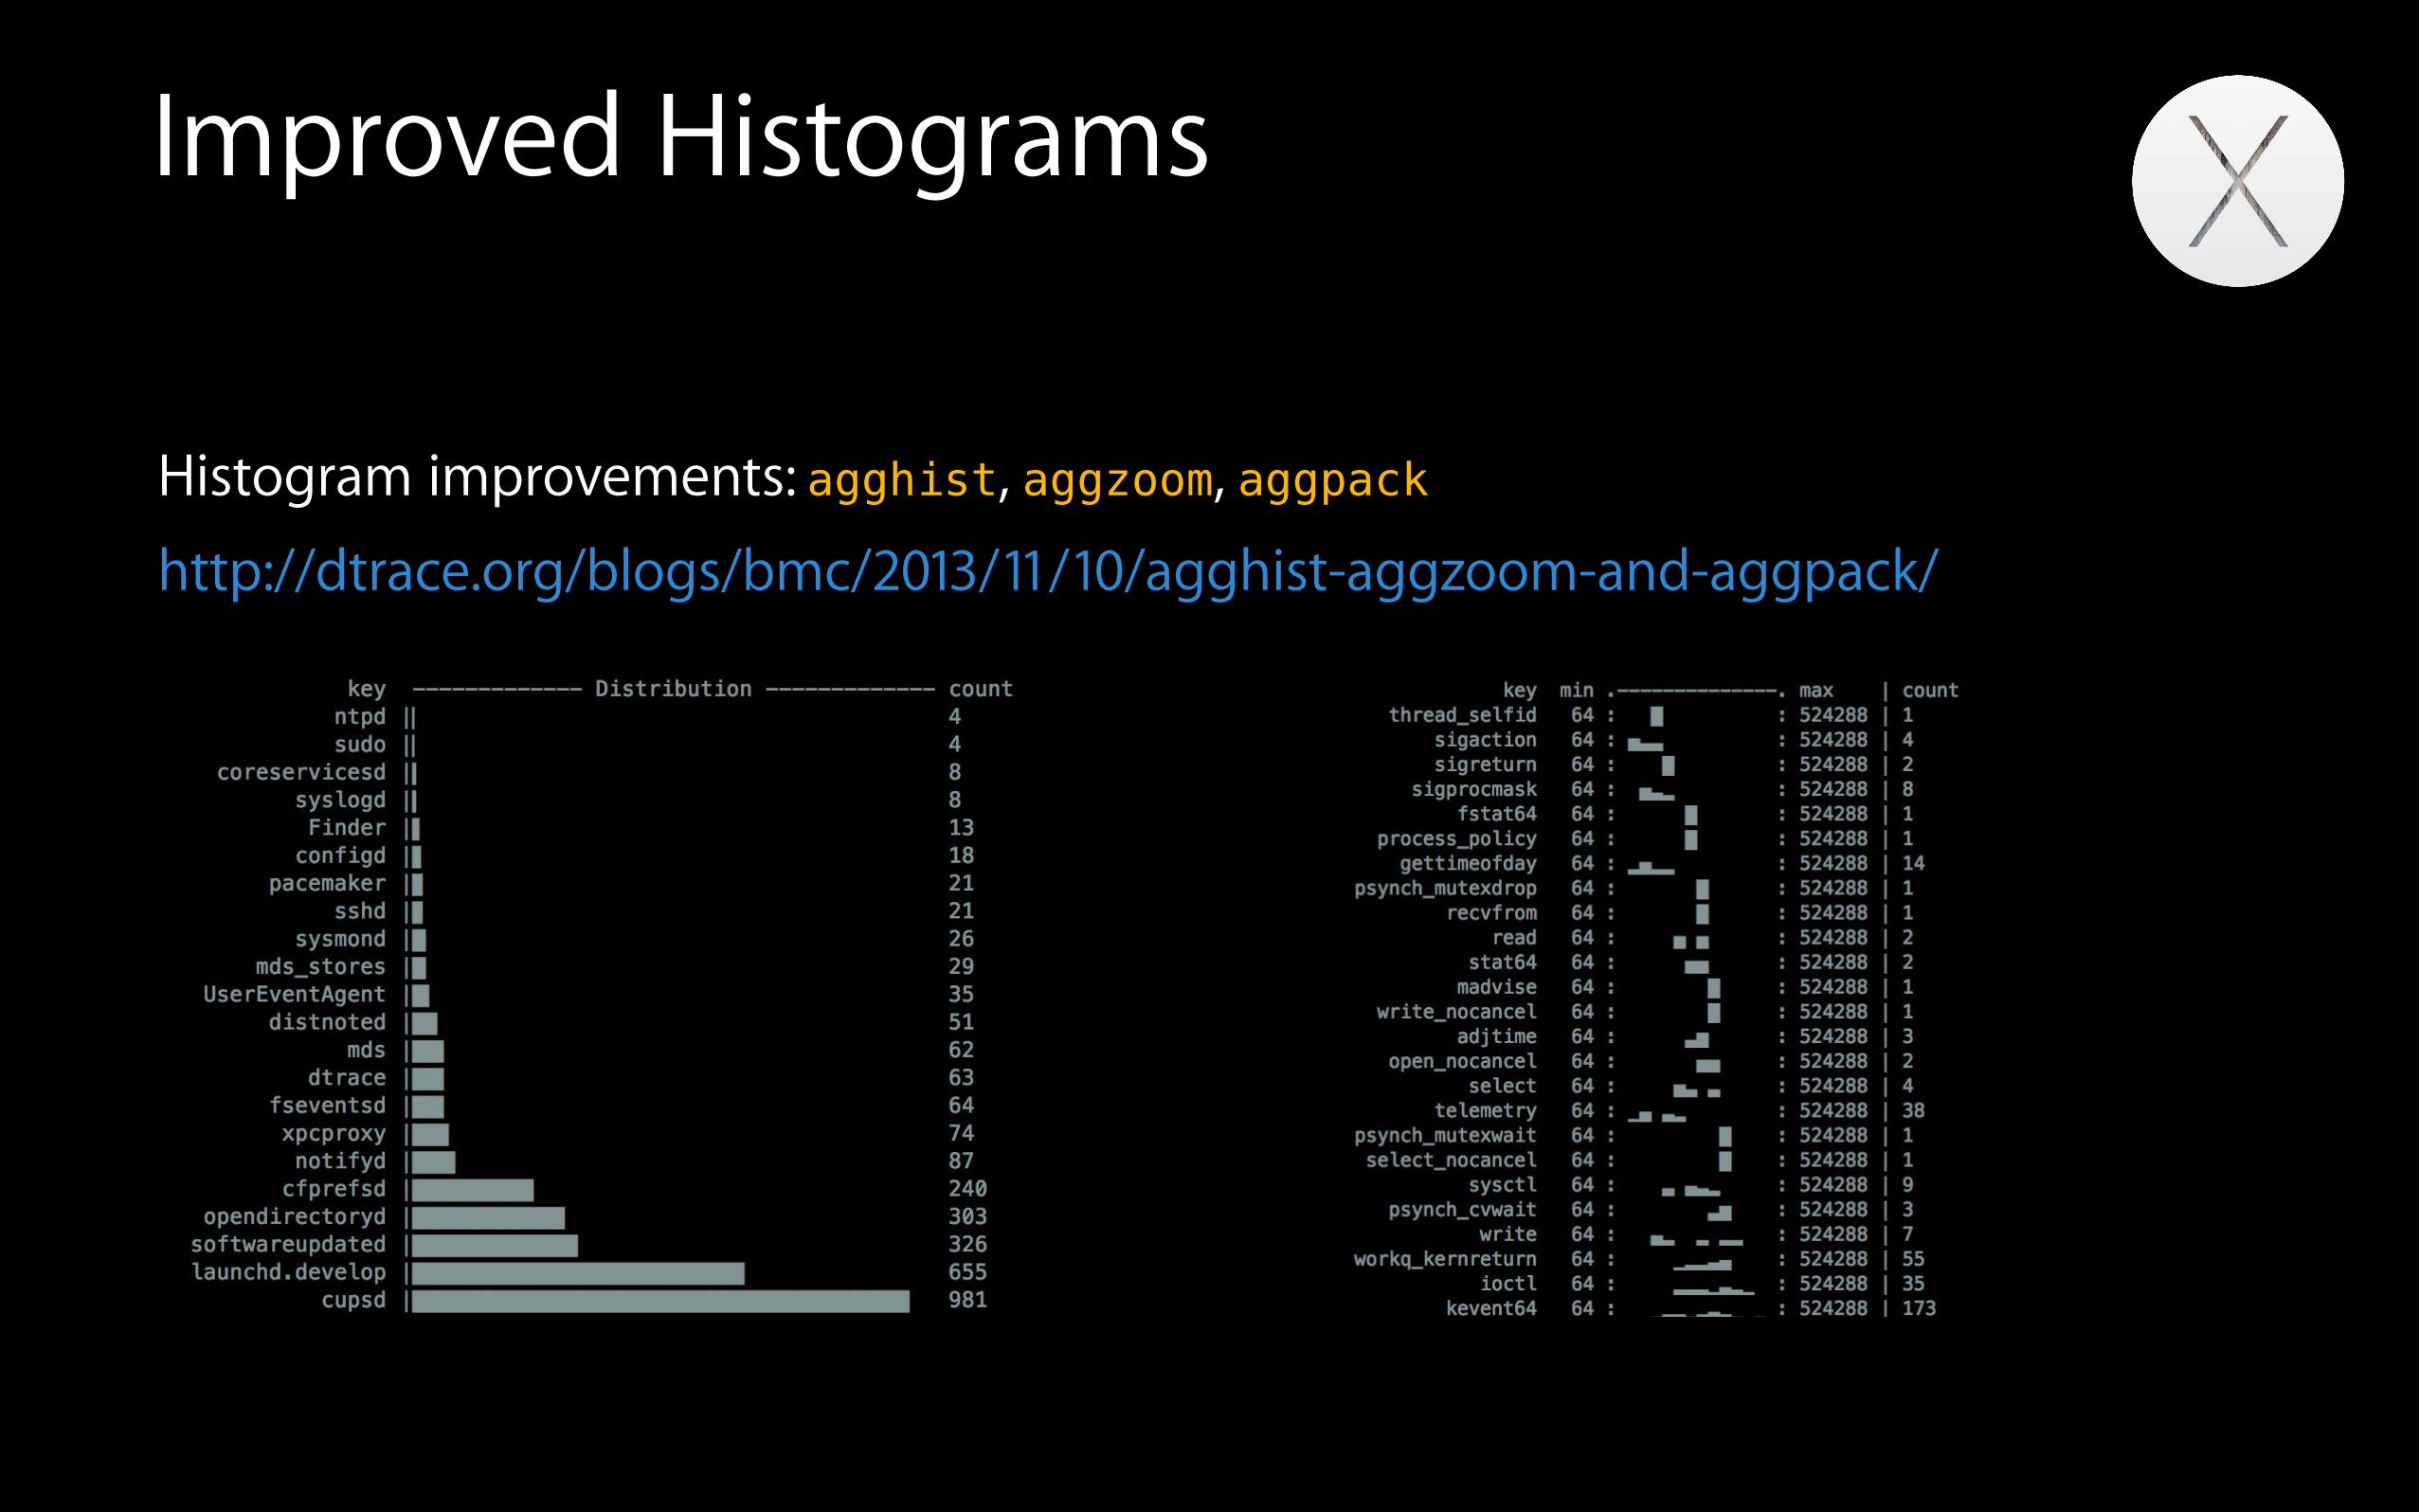
Histogram improvements: agghist, aggzoom, aggpack
http://dtrace.org/blogs/bmc/2013/11/10/agghist-aggzoom-and-aggpack/
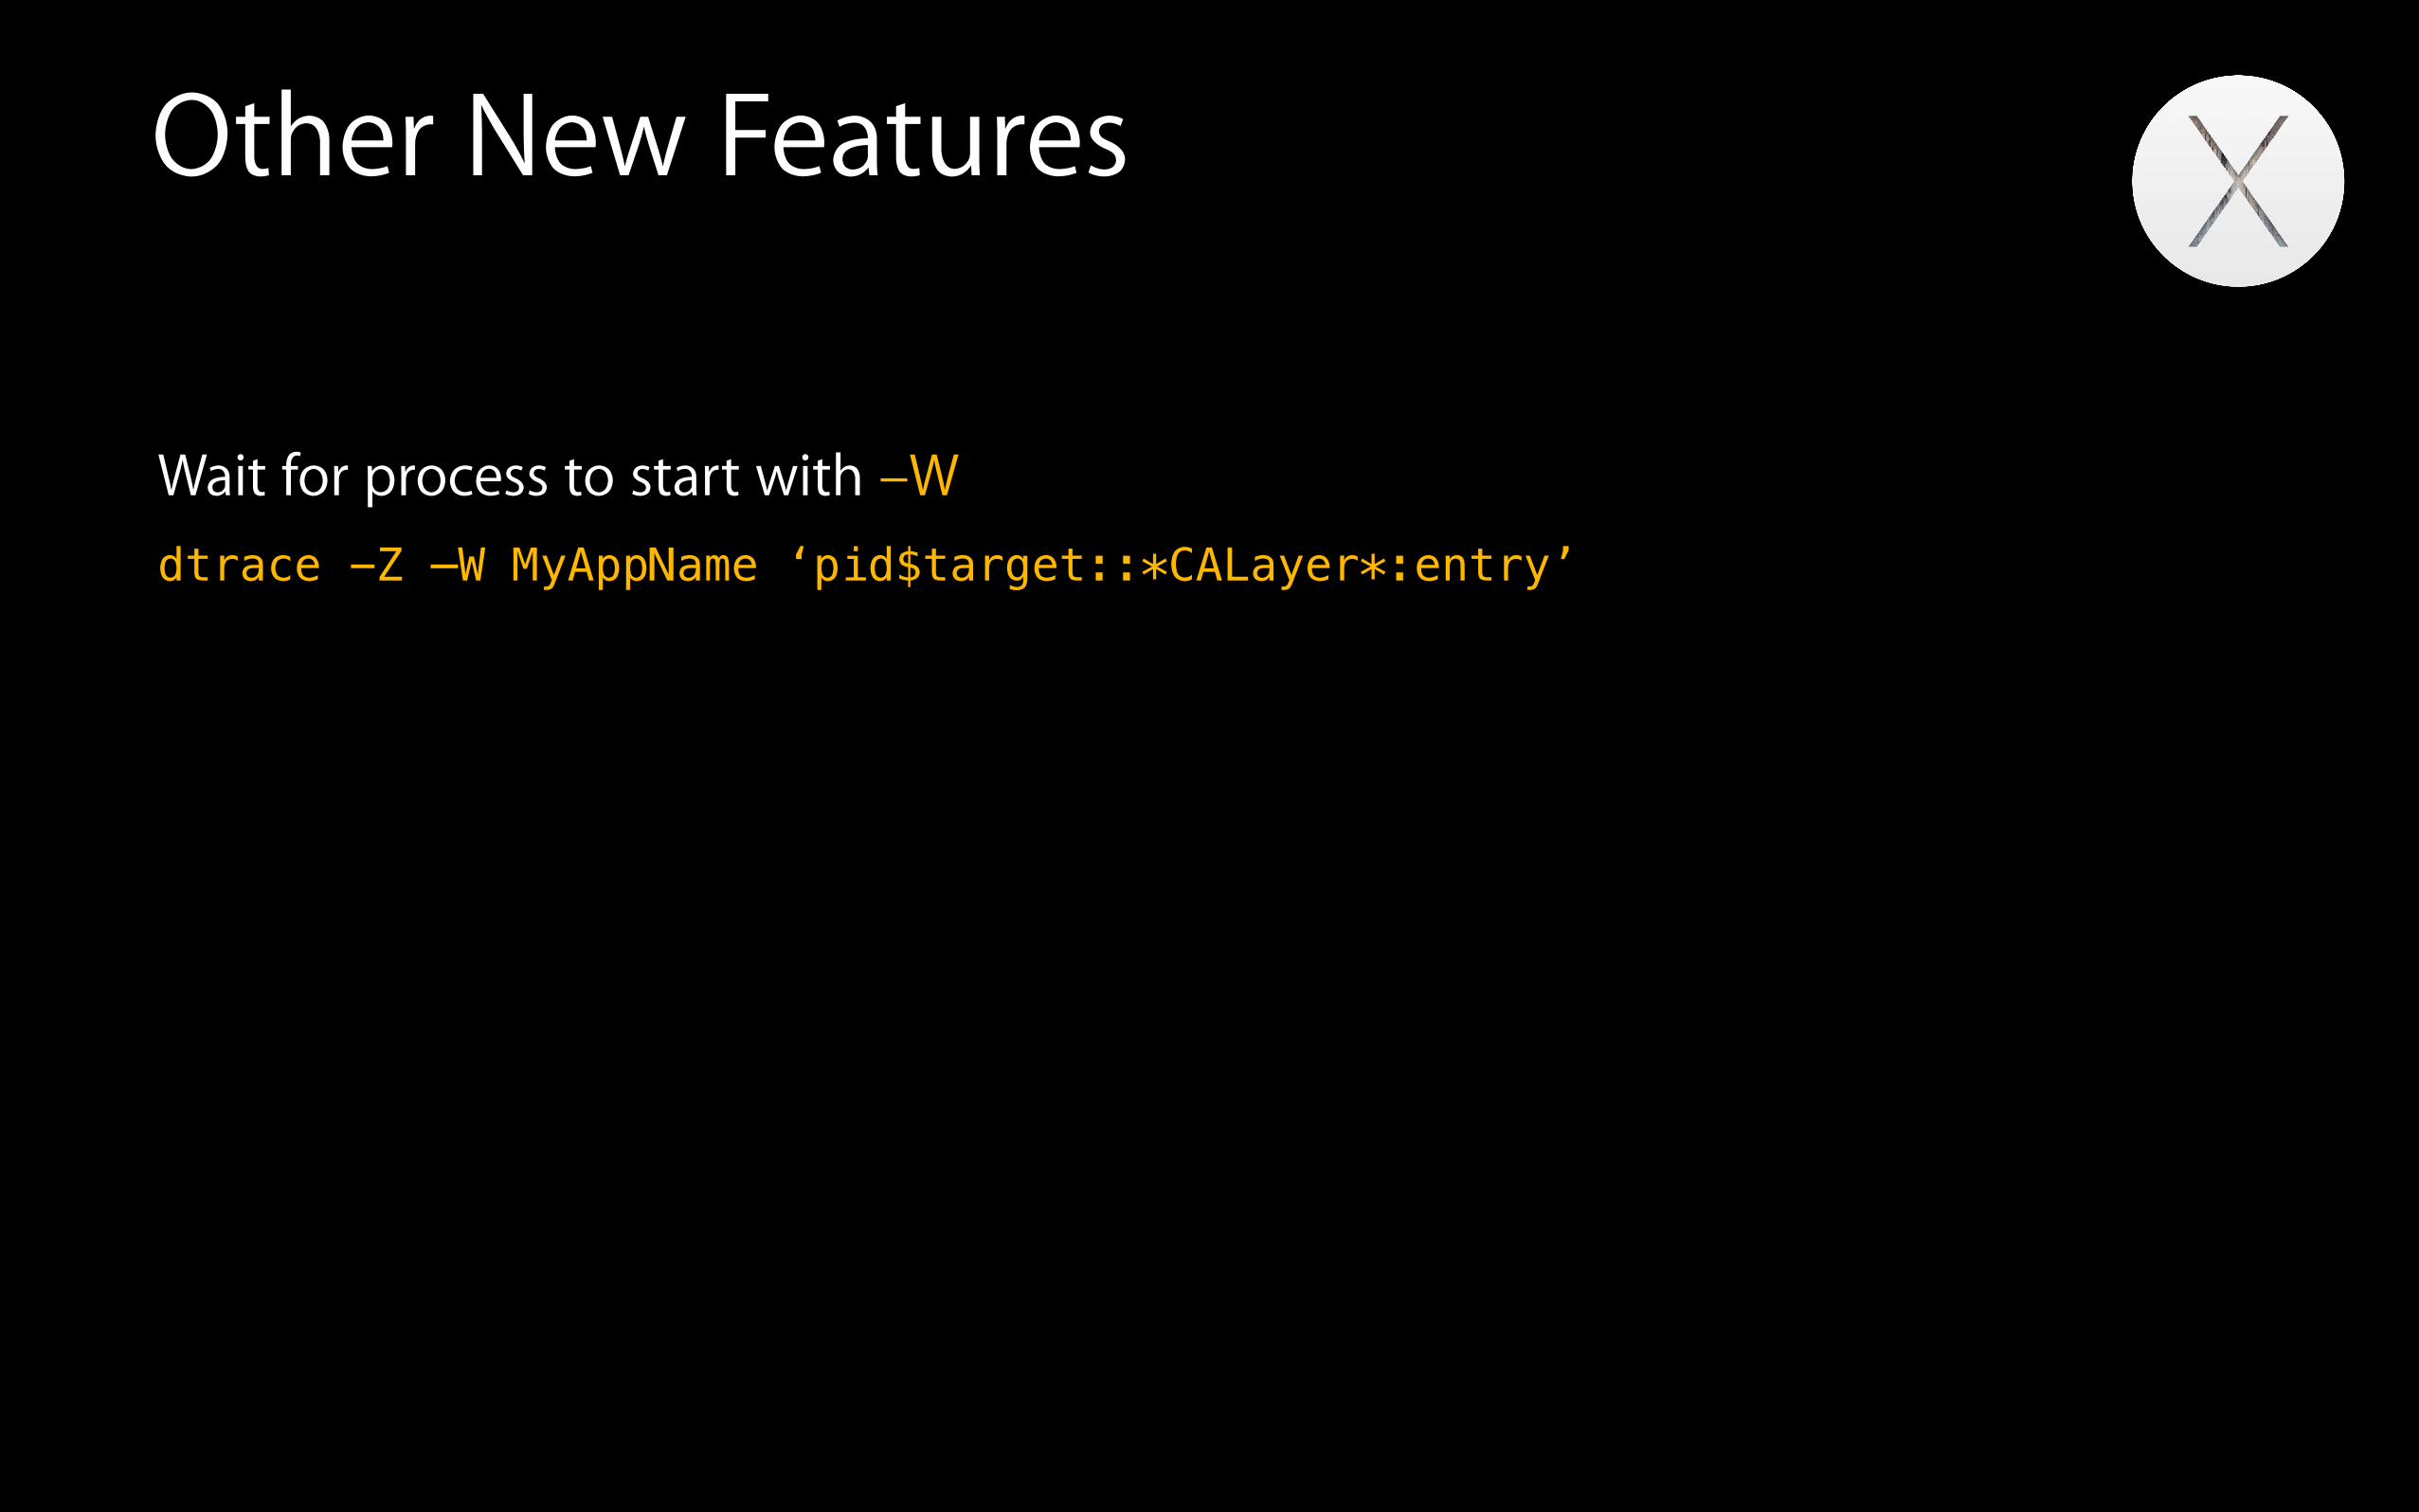
Other New Features
Wait for process to start with –W dtrace -Z —W MyAppName ‘pid$target::*CALayer*:entry’
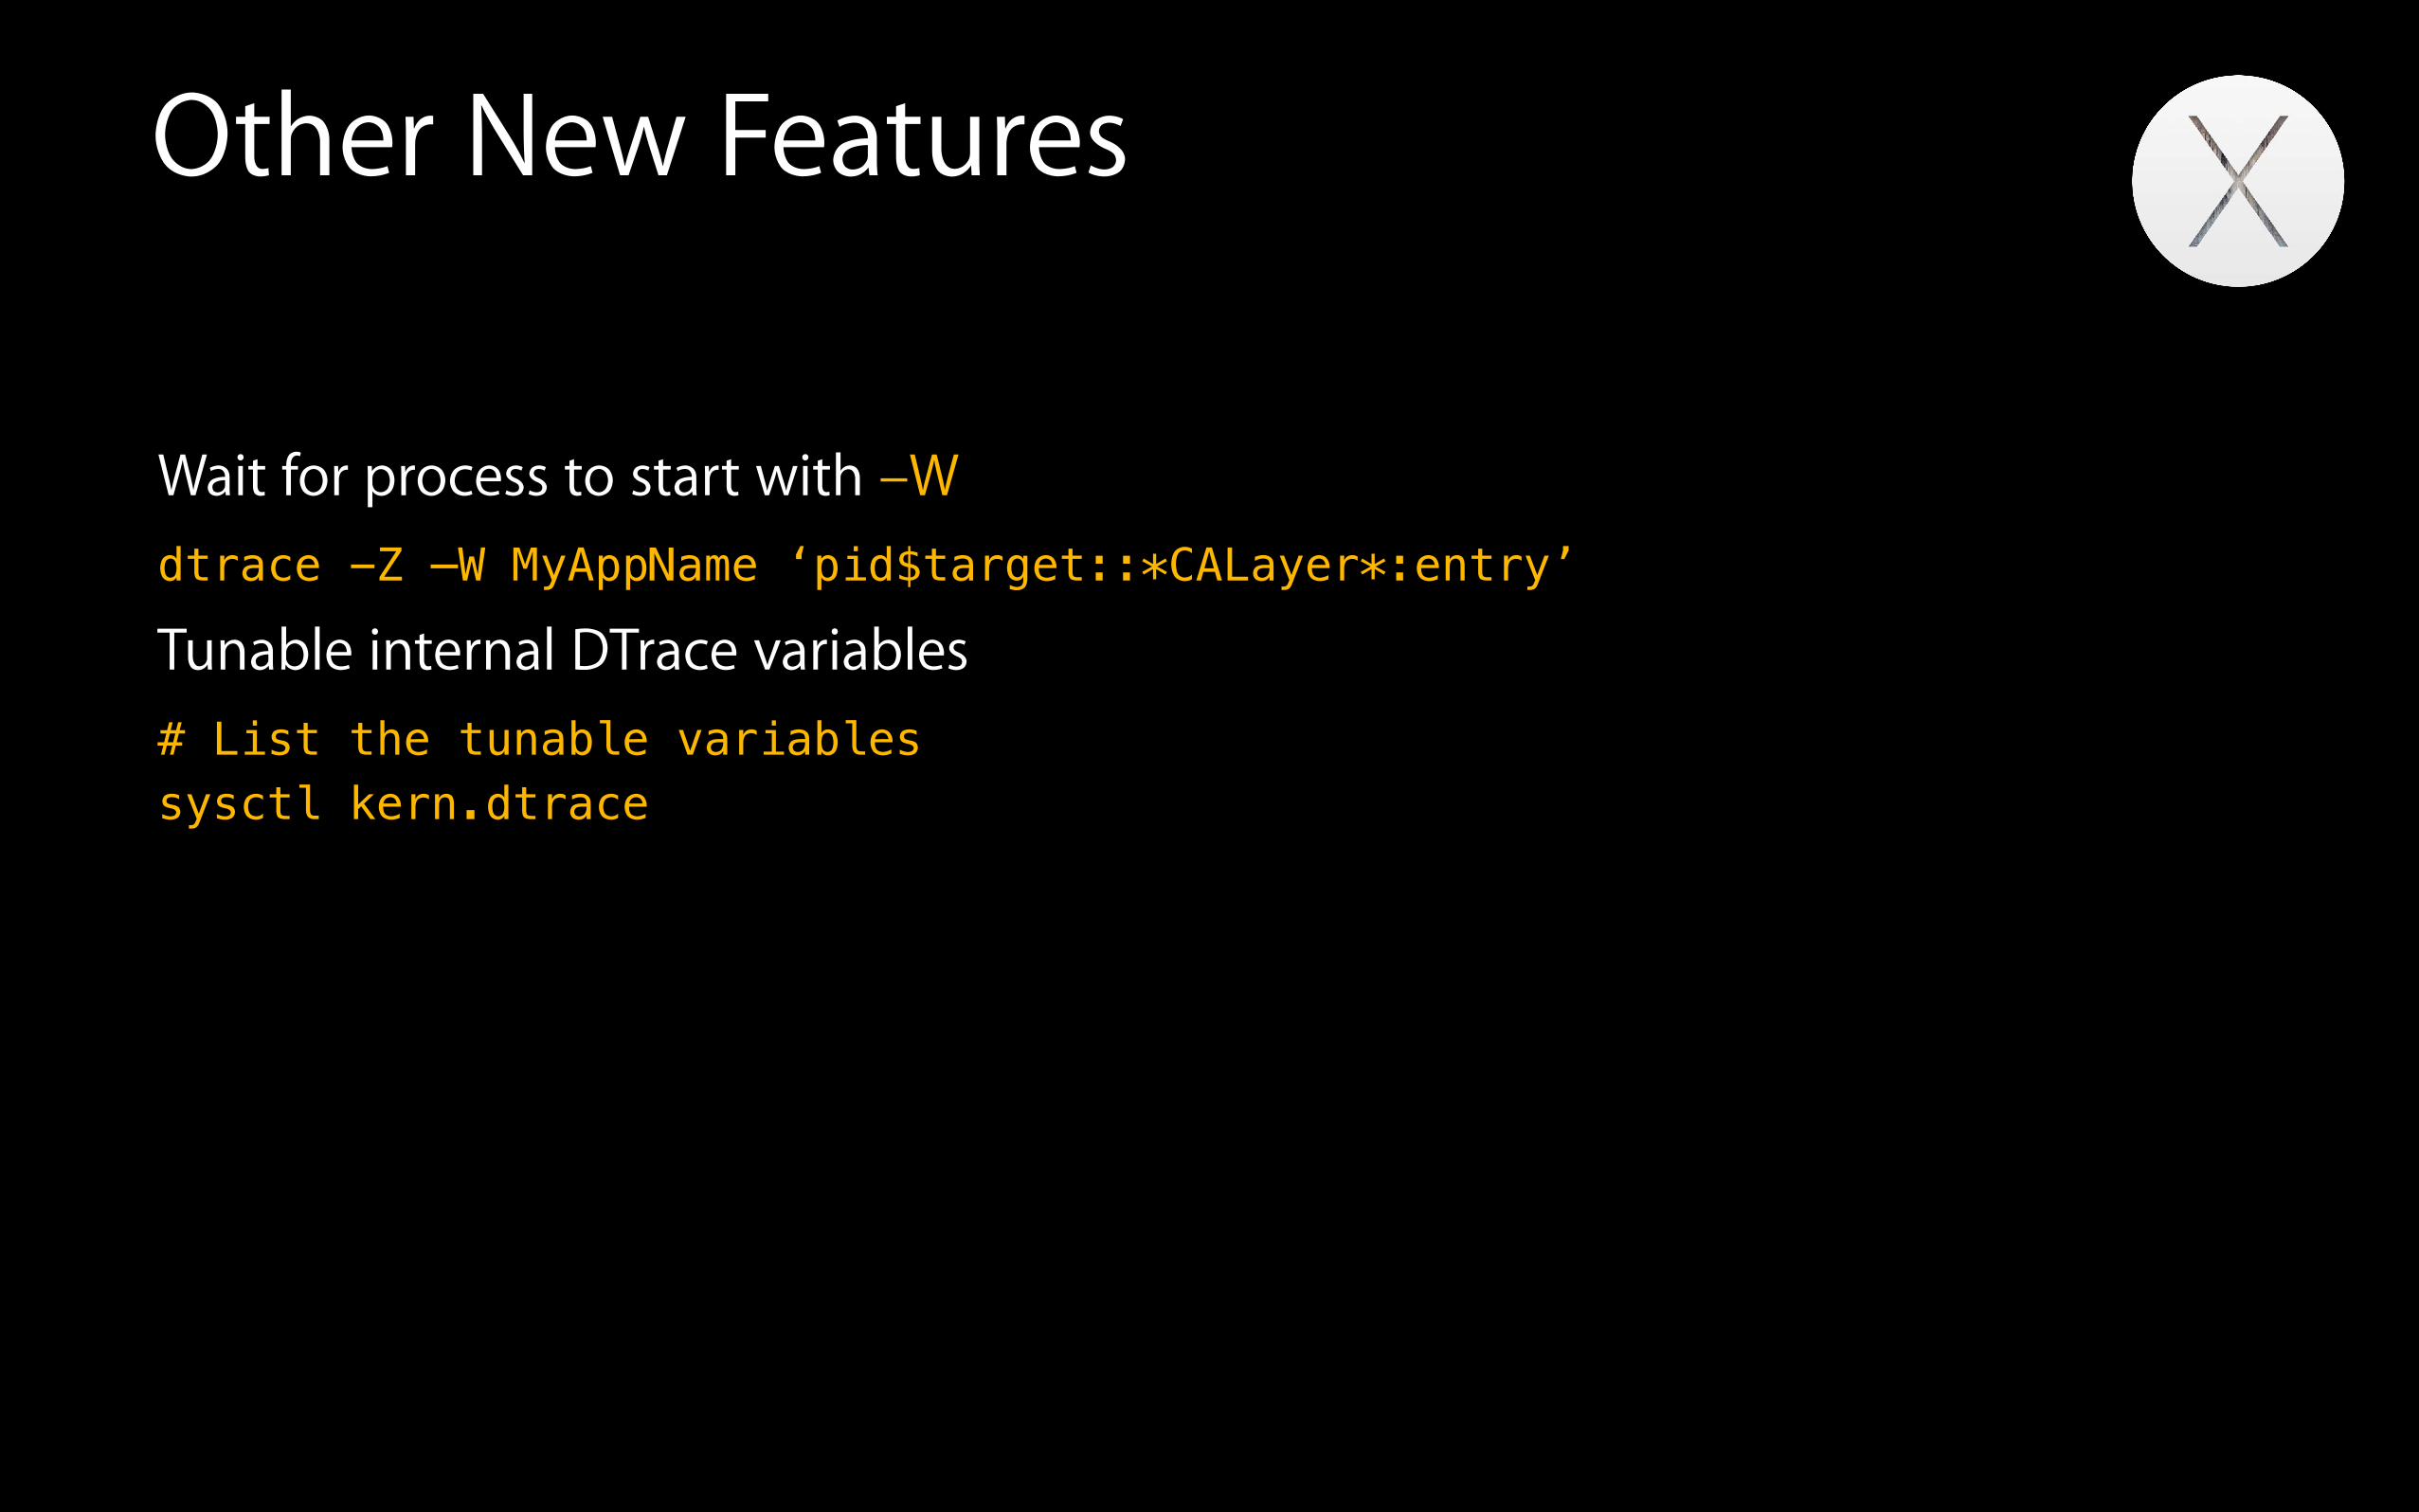
Other New Features
Wait for process to start with –W dtrace -Z —W MyAppName ‘pid$target::*CALayer*:entry’
Tunable internal DTrace variables # List the tunable variables sysctl kern.dtrace
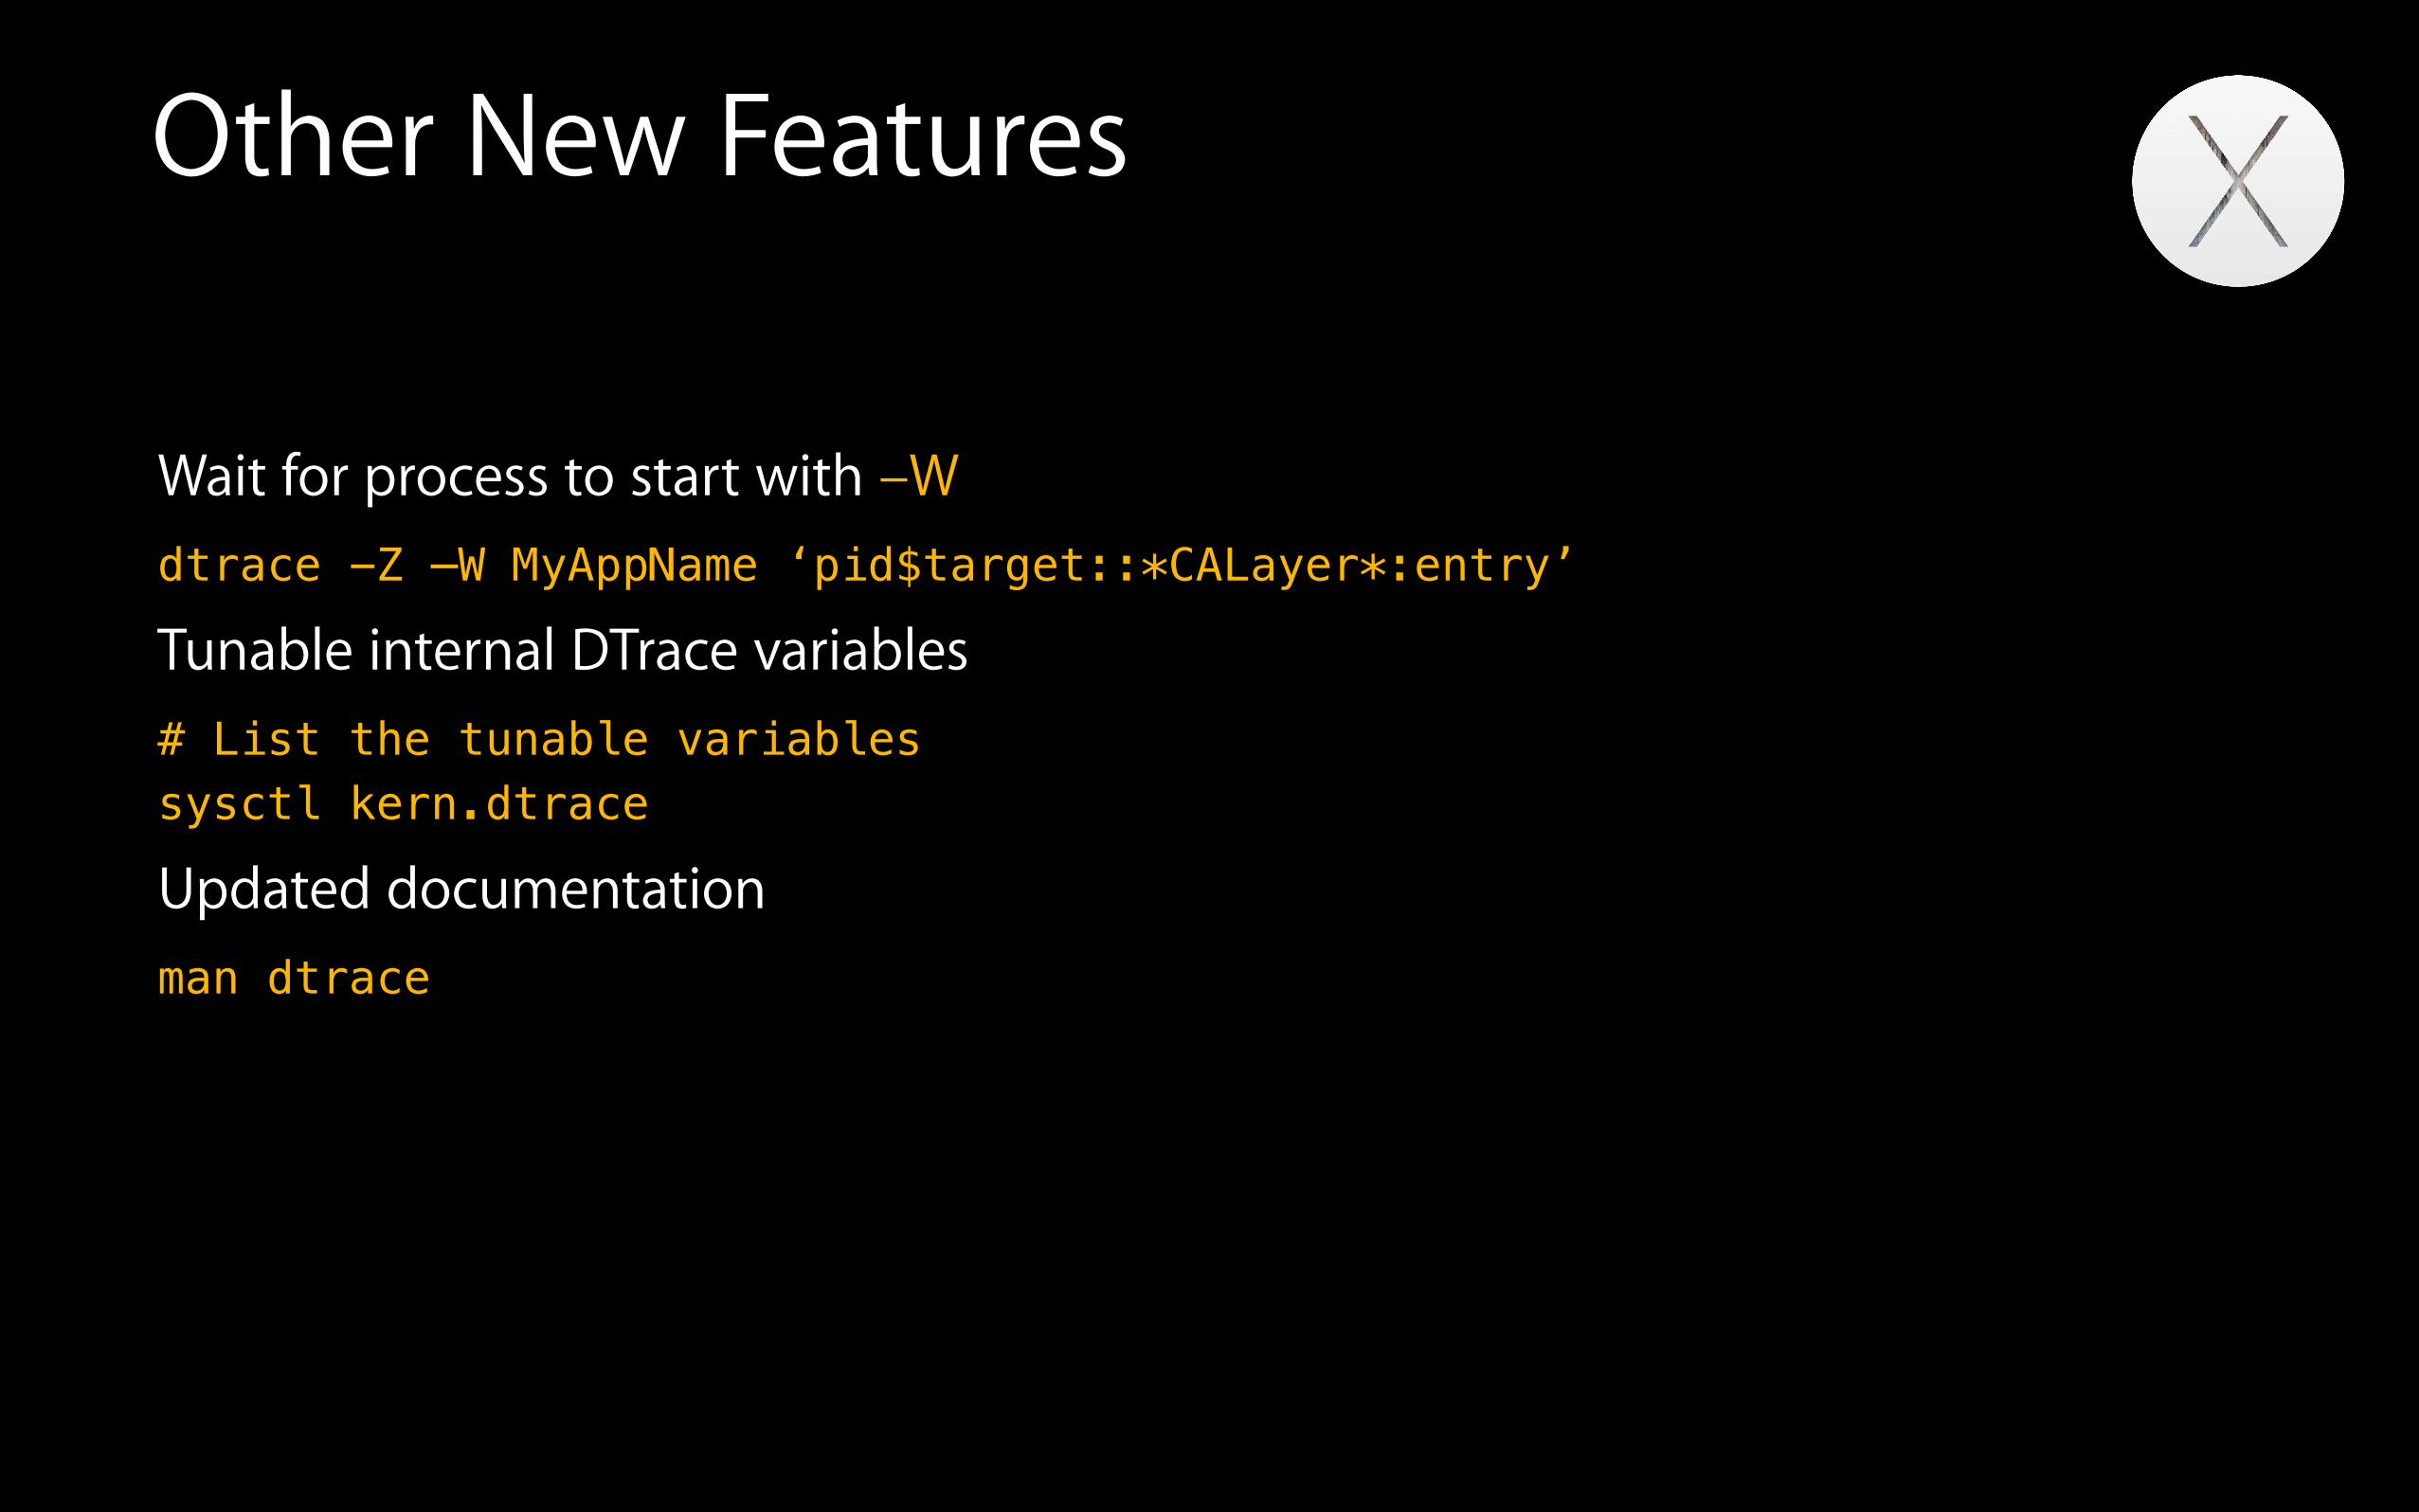
Other New Features
Wait for process to start with –W dtrace -Z —W MyAppName ‘pid$target::*CALayer*:entry’
Tunable internal DTrace variables # List the tunable variables sysctl kern.dtrace
Updated documentation man dtrace
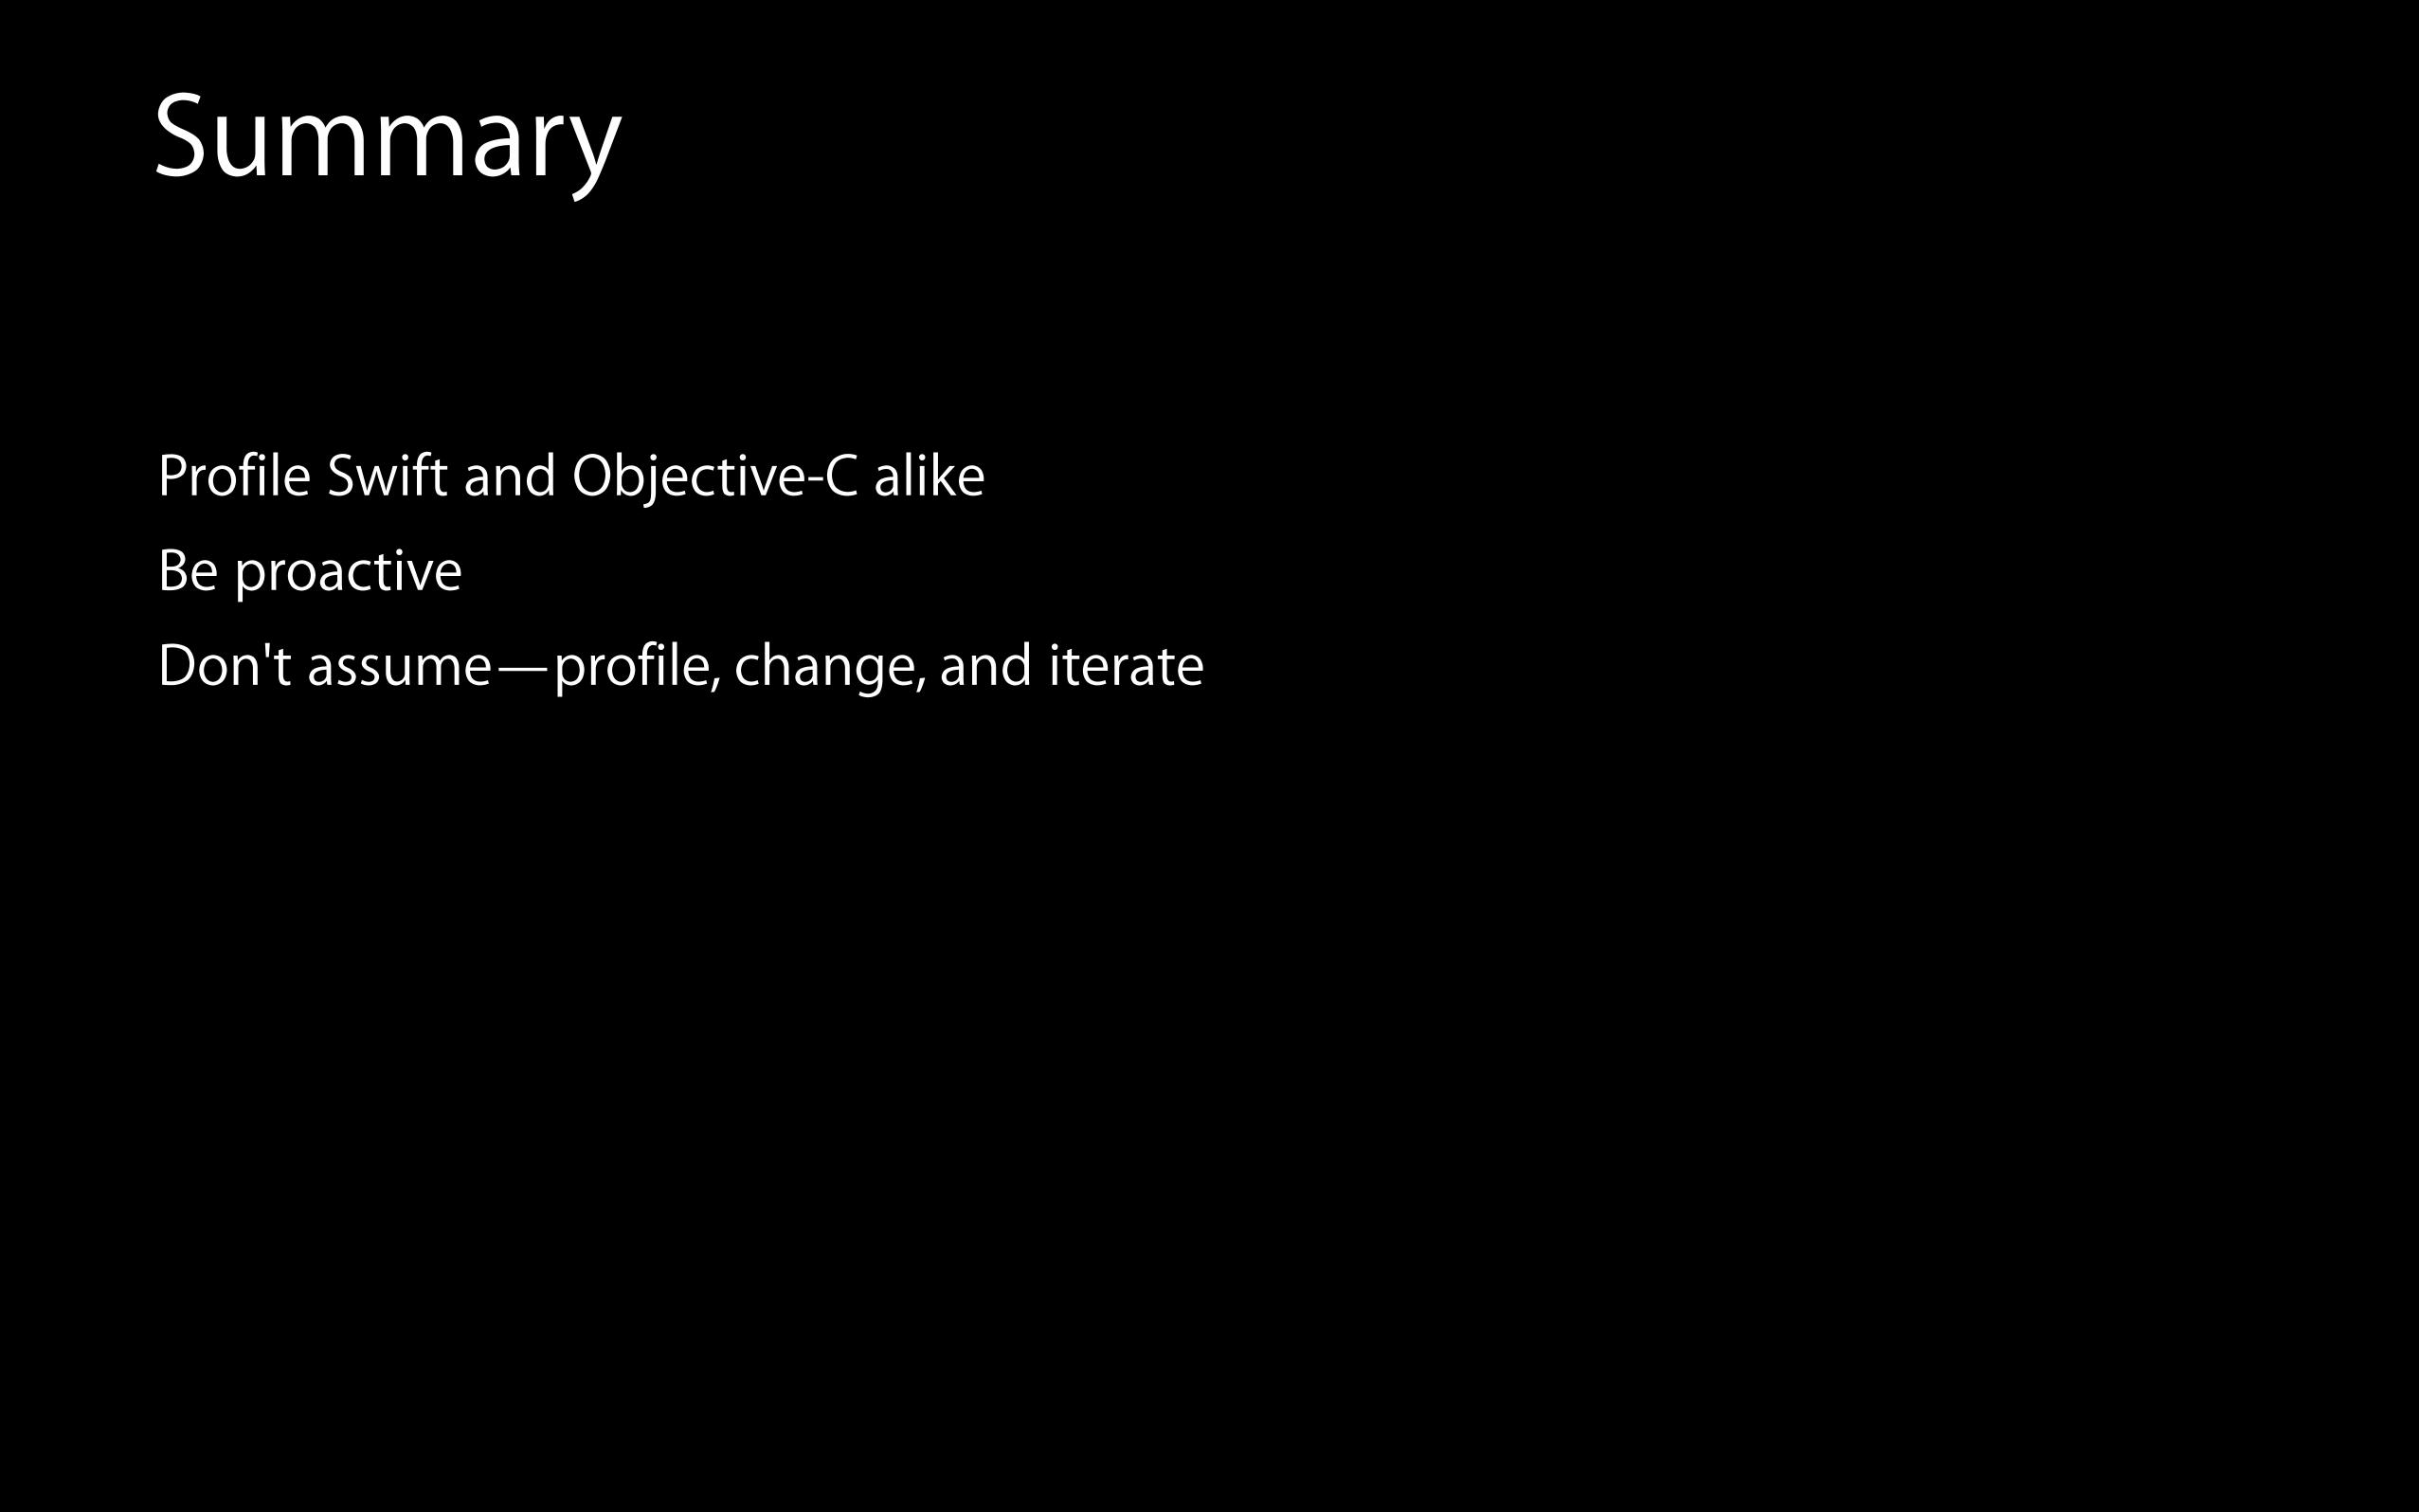
Summary
Profile Swift and Objective-C alike
Be proactive
Don't assume—profile, change, and iterate
More Information
Dave DeLong Developer Tools Evangelist [email protected]
Instruments Documentation Instruments User GuideInstruments User Reference http://developer.apple.com
Apple Developer Forums http://devforums.apple.com
Related Sessions
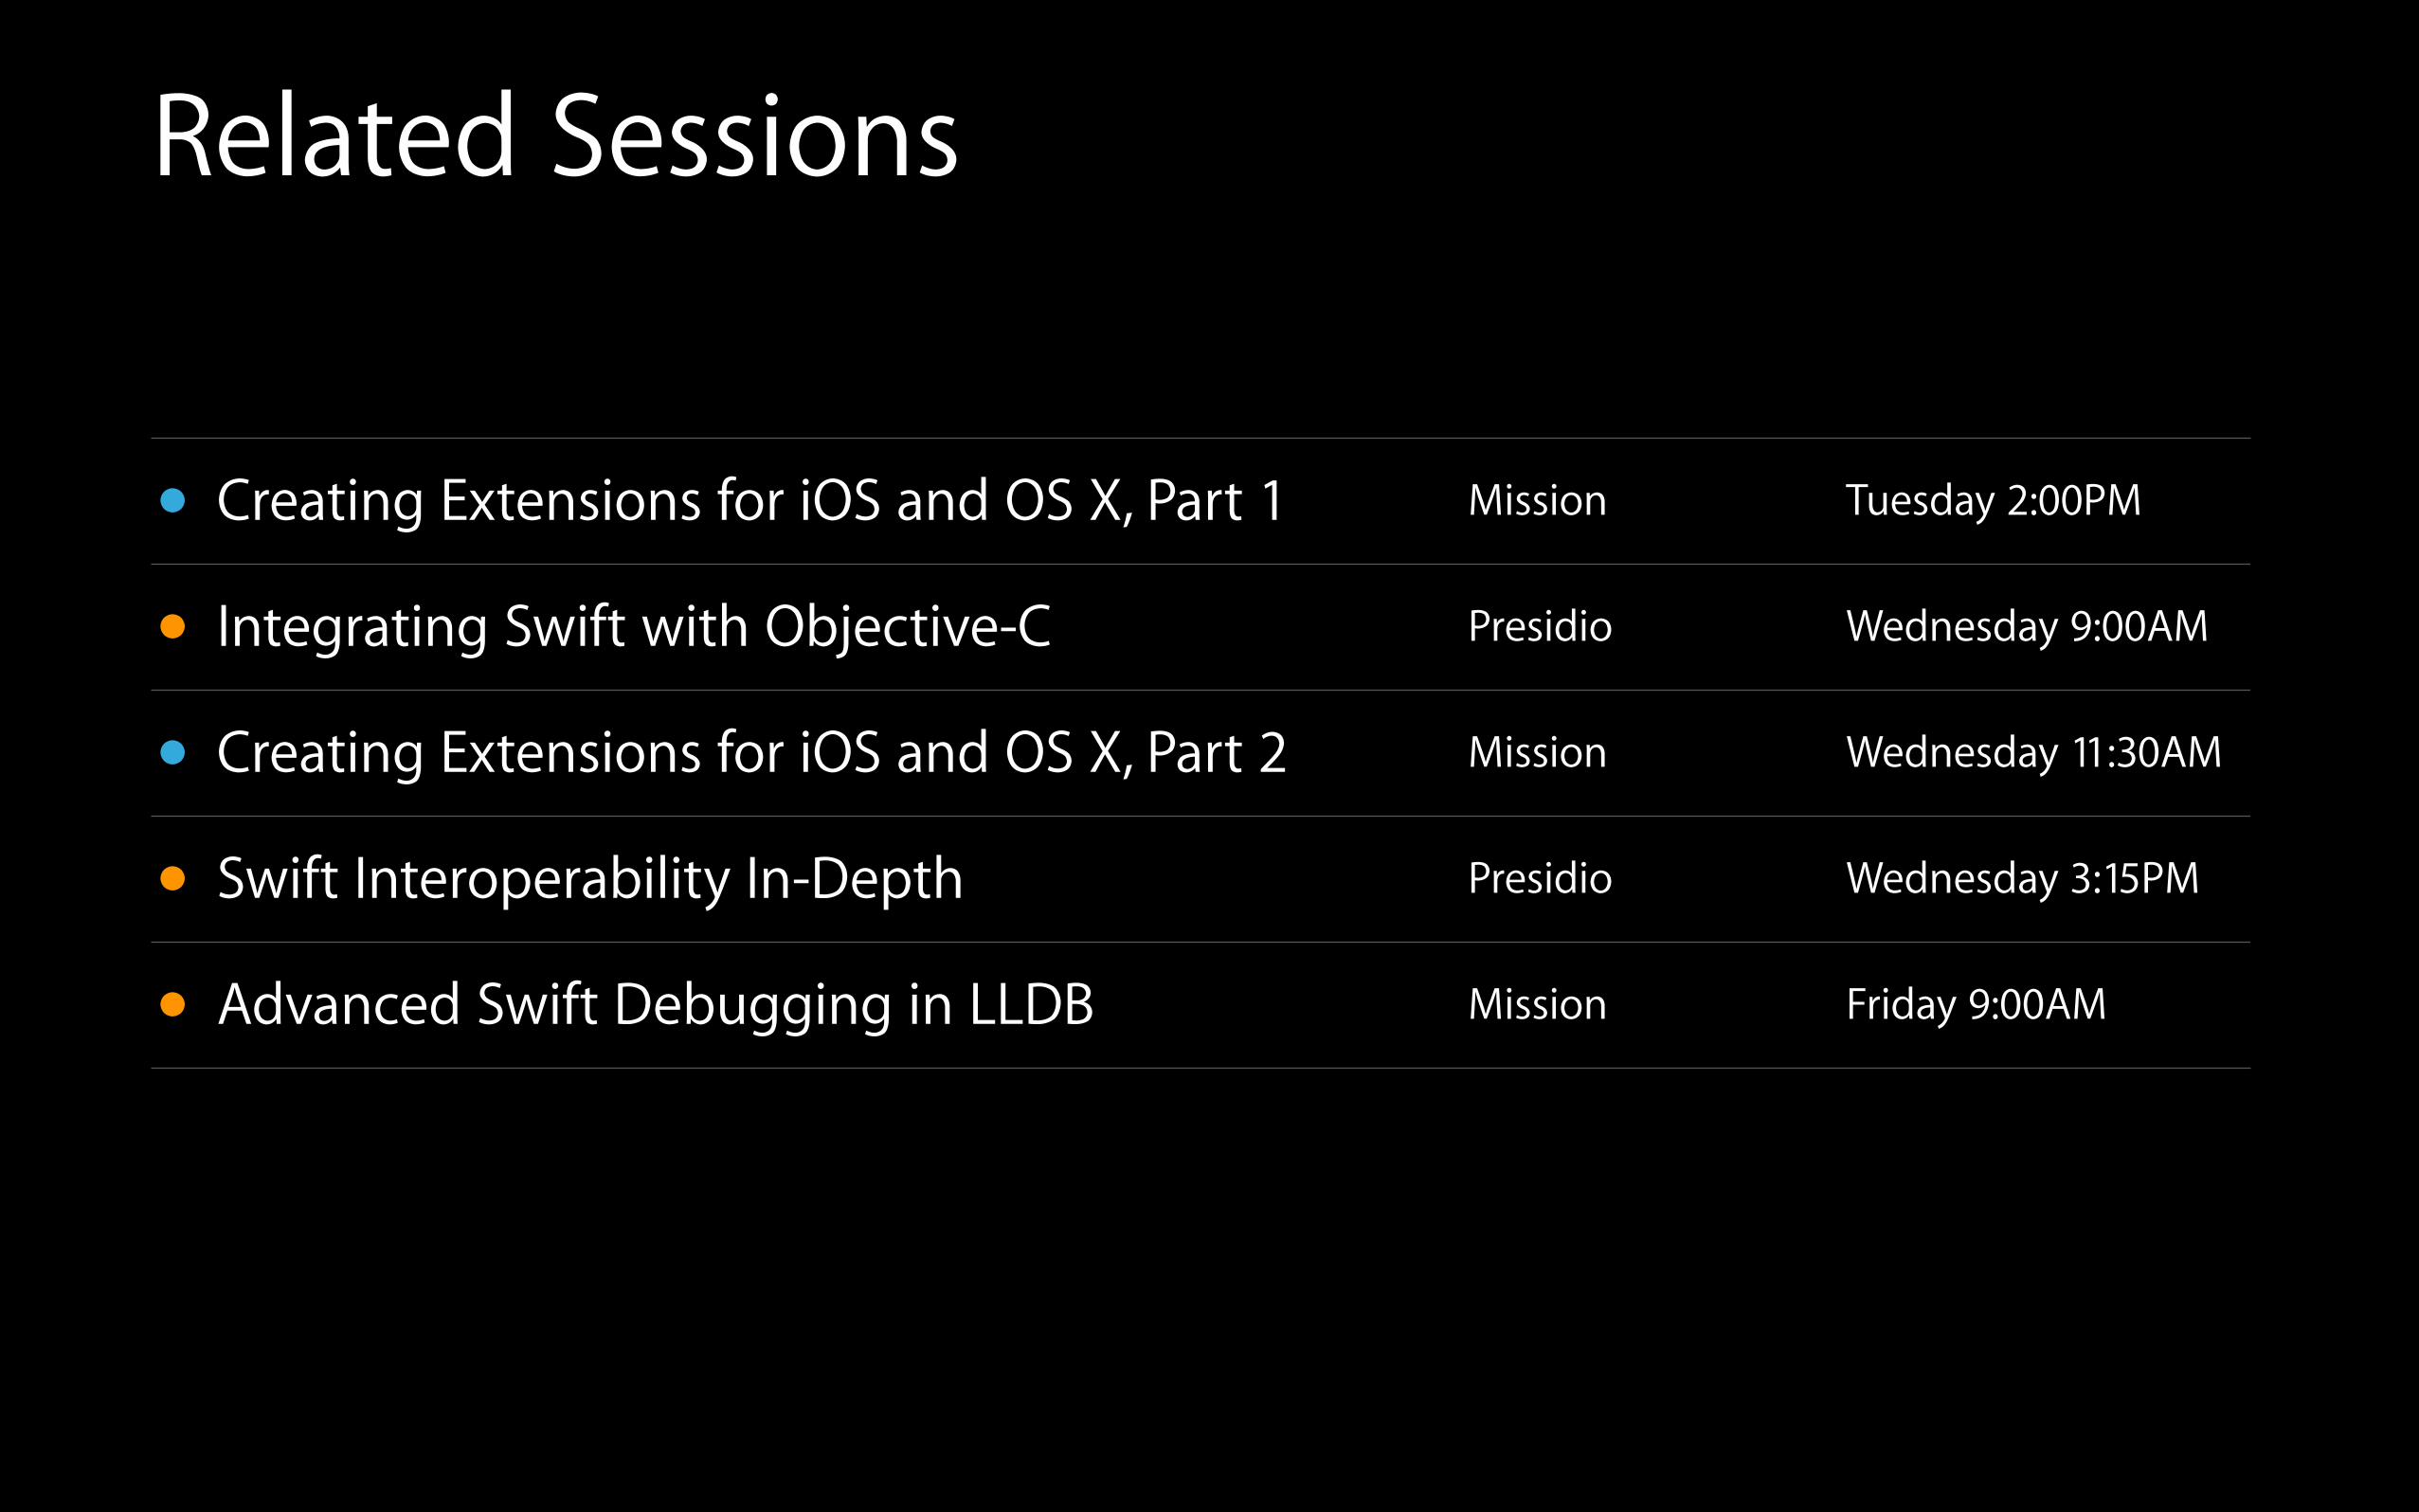
• Creating Extensions for iOS and OS X, Part 1 Mission Tuesday 2:00PM
• Integrating Swift with Objective-C Presidio Wednesday 9:00AM
• Creating Extensions for iOS and OS X, Part 2 Mission Wednesday 11:30AM
• Swift Interoperability In-Depth Presidio Wednesday 3:15PM
• Advanced Swift Debugging in LLDB Mission Friday 9:00AM
Labs
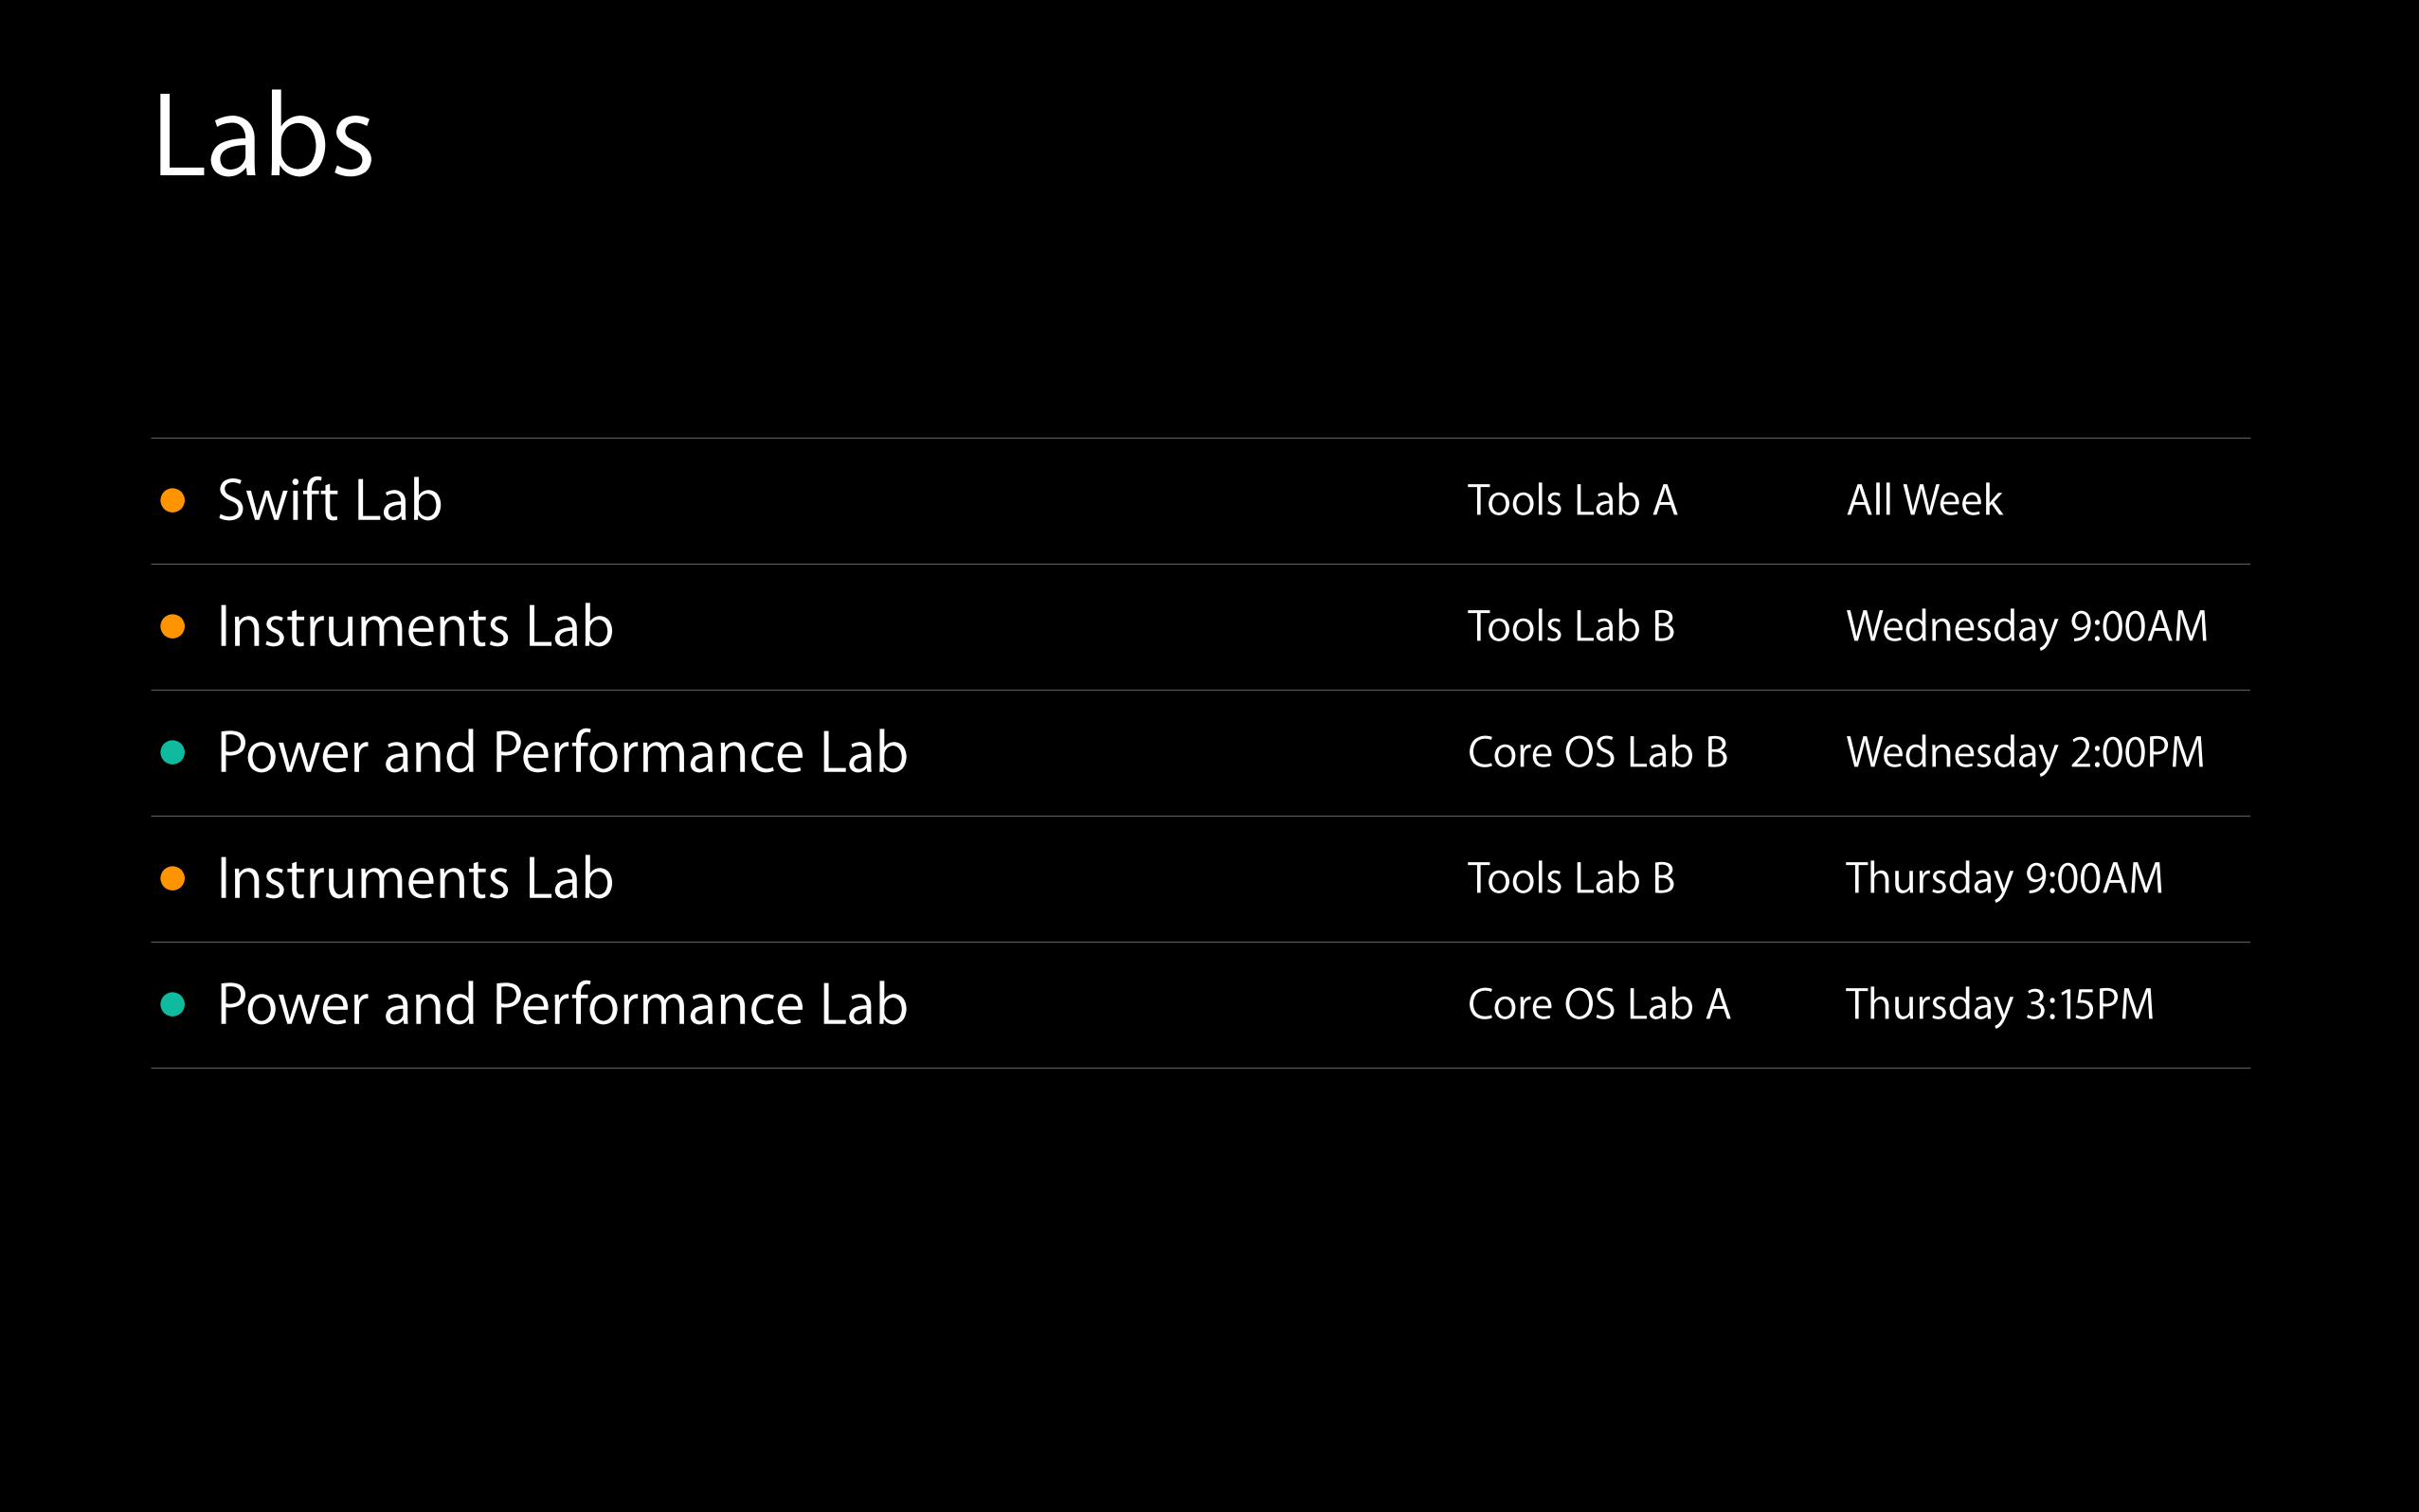
• Swift Lab Tools Lab A All Week
• Instruments Lab Tools Lab B Wednesday 9:00AM
• Power and Performance Lab Core OS Lab B Wednesday 2:00PM
• Instruments Lab Tools Lab B Thursday 9:00AM
• Power and Performance Lab Core OS Lab A Thursday 3:15PM