improving - transportation committee · air cargo warehouses, ... to key freight corridors across...
TRANSCRIPT

IMPROVING THE NATION’S FREIGHT TRANSPORTATION
SYSTEMFINDINGS AND RECOMMENDATIONS
OF THE SPECIAL PANEL ON 21ST CENTURY FREIGHT TRANSPORTATION
HOUSE COMMITTEE ON TRANSPORTATION & INFRASTRUCTURE
October 2013

3Improving the Nation’s Freight Transportation System
ACKNOWLEDGEMENTS
Chairman Duncan, Ranking Member Nadler, and the Members of the Panel on 21st Century Freight Transportation would like to thank the hard-work-ing staff members for all they did to support the Panel’s mission. This effort
would not have been possible without each individual below.
Shant Boyajian Highways and Transit Counsel, T&I CommitteeJim Kolb Minority Highways and Transit Staff Director, T&I CommitteeWard McCarragher Minority Chief Counsel, T&I CommitteeErin Sulla Legislative Staff Assistant, T&I CommitteeJim Tymon Senior Advisor to the Chairman, T&I CommitteeDavid Wegner Minority Water Resources Professional Staff, T&I CommitteeDennis Wirtz Legislative Assistant, T&I CommitteeHelena Zyblikewycz Minority Highways and Transit Counsel, T&I Committee
Tarunpal Dhillon Legal Intern, T&I CommitteeAndrew Mertens Intern, T&I Committee
Don Walker Staff, Congressman DuncanLisette Morton Staff, Congressman NadlerGarrett Bess Staff, Congressman WebsterMatt Colvin Staff, Congressman SiresBobby Fraser Staff, Congressman HannaNick Martinelli Staff, Congresswoman BrownJacob Melcher Staff, Congressman CrawfordBrian Oszakiewski Staff, Congressman LipinskiBrittnee Preston Staff, Congressman MullinRandy Ross Staff, Congressman Gary MillerLaurie Saroff Staff, Congresswoman Hahn

5Improving the Nation’s Freight Transportation System
ContentsPreface............................................................................................................................................................................Page 7Executive Summary.......................................................................................................................................................Page 9The Nation’s Freight System.......................................................................................................................................Page 11
Highways and Trucking Freight Rail Shipping and Ports Inland Waterways Air Cargo Warehouses, Distribution Centers, and the Logistics Industry Pipelines
Recommendations.......................................................................................................................................................Page 45 Funding and Financing Investments Planning and Project Delivery Highways and Trucking Freight Rail Shipping and Ports Inland Waterways Air Cargo
Appendices..................................................................................................................................................................Page 69 A – Panel Scope of Work B – Panel Activities C – Summary of Hearing – “Overview of the United States’ Freight Transportation System” D – Summary of Hearing – “How Southern California Freight Transportation Challenges Impact the Nation” E–SummaryofHearing–“HowLogisticsFacilitateanEfficientFreightTransportationSystem” F – Summary of Hearing – “How Freight Transportation Challenges in Urban Areas Impact the Nation” G – Summary of Hearing – “Perspectives from Users of the Nation’s Freight System” H – Summary of Hearing – “Funding the Nation’s Freight System” I – Summary of Site Visit – Southern California J – Summary of Site Visit – Memphis Region K – Summary of Site Visit – New York City Region L – Summary of Site Visit – Norfolk, Virginia M – Summary of Roundtable Discussion – “Coordinating Federal Efforts to Improve Freight Transportation” N – Summary of Roundtable Discussion – “Navigating the Complexities of America’s Largest Port Facilities”
O – Summary of Roundtable Discussion – “Effectively Coordinating Freight Planning Activities” P – Acronym List Q – Signature Page


7Improving the Nation’s Freight Transportation System
PrefaCe
Chairman Bill Shuster and Ranking Member Nick J. Rahall, II, of the Committee on Transportation and Infra-structure of the House of Representatives created the Panel on 21st Century Freight Transportation in April 2013, to examine the current state of freight transportation in the United States and how improving freight transporta-tion can strengthen the United States economy.
The Panel was constituted under Rule XVIII of the Rules of the Committee on Transportation and Infrastructure to examine issues related to freight mobility across all aspects of the Committee’s jurisdiction. The Panel was led by Chairman John J. Duncan, Jr. and Ranking Member Jerrold Nadler. Also appointed to the Panel were Congressman Gary Miller, Congresswoman Corrine Brown, Congressman Rick Crawford, Congressman Daniel Lipinski, Congressman Richard Hanna, Congressman Albio Sires, Congressman Daniel Webster, Congress-woman Janice Hahn, and Congressman Markwayne Mullin.
The Panel examined the current state of freight transportation in the United States to identify (1) the role freight transportationplaysintheUnitedStateseconomy;(2)waystoincreasetheefficiency,safety,andoverallcon-dition and performance of the Nation’s freight network; (3) how technology assists in the movement of freight; and(4)financingoptionsfortransportationprojectsthatimprovefreightmobility.
To carry out this ambitious work plan, the Panel held six public hearings, three roundtable discussions, traveled to Southern California, the Memphis region, the New York City/Northern New Jersey region, and Norfolk, Vir-ginia,andheldnumerousbriefingswithfreightindustryprofessionalsandotherinterestedparties.ThisreportreflectsthePanel’sfindingsandtherecommendationsitreachedasaresult.


9Improving the Nation’s Freight Transportation System
exeCutive summary
The Panel on 21st Century Freight Transportation conducted hearings, held roundtable discussions, and traveled to key freight corridors across the United States to gain insight into the current state of freight transportation and howimprovingfreighttransportationcanstrengthentheeconomy.ThePanelidentifiedmanychallengesandimpedimentstotheefficientandsafemovementofgoodsinto,outof,andthroughtheUnitedStates.
The Panel found that the current state of highway infrastructure does not adequately serve the needs of those moving goods across the Nation. Not every community is located adjacent to a railroad, airport, waterway, or port, but a consumer good is almost invariably transported along the Nation’s four million miles of highways and roads for at least part of its journey. However, the Highway Trust Fund, from which federal investment in highway infrastructure is disbursed, will soon be insolvent. This fact is especially problematic when one considers that maintenance of the Nation’s existing highway facilities alone would cost hundreds of billions of dollars,andthatoneofeveryfourbridgesintheUnitedStatesisstructurallydeficientorfunctionallyobsolete.Furthermore, a recent study found that congestion cost the United States economy $121 billion in 2011.
While most consumer goods are transported on a truck for at least part of the journey, freight rail provides efficientlong-haulandshort-haulserviceandintegratescloselywiththetruckingindustry.Thereareapproxi-mately 565 freight railroads in the country employing nearly 180,000 workers. These are privately owned com-panies that operate more than 200,000 miles of track throughout the Nation. Because the freight railroads are private entities, they own the infrastructure over which they operate, meaning they also invest heavily in those networks. In 2011, the freight railroads invested over $23 billion in capital expenditures to improve and expand their networks.
Before goods can be transported on trucks or railroads, the goods must be produced, and many of these goods are produced overseas. Over 75 percent of all United States international freight moves by water. Unlike the Highway Trust Fund, the federal fund dedicated for harbor maintenance has a positive balance. Unfortunately, a lack of appropriated funding has resulted in deferred maintenance of federal channels that serve coastal ports. Currently, the constructed depths and widths of entrance channels at 59 major ports are available only 35 per-cent of the time. Given the current expansion of the Panama Canal and the larger ships that will service Ameri-can ports as a result, maintaining authorized channel depths and widths is critical to the stability of the Nation’s import and export market.
United States waterways carried an equivalent of over 100 million truckloads of goods last year. It is estimat-ed that without the barges and towboats operating on the inland waterways, the Nation would need 6.3 million railroad cars or 25 million trucks to haul the difference. However, much of the critical infrastructure for water-borne transportation is in dire need of repair. More than one-half of the locks and dams in the United States are over 50 years old.
Air cargo is the fastest way to ship goods over long distances, and air freight is high-value cargo. Less than three percent of total freight by weight ships by air, but this represents over $6.4 trillion worth of goods per year, which is nearly 35 percent of all freight value.
All aspects of the supply chain rely on the warehousing, distribution center, and logistics industry. Logistics is the planning, execution, and control of a complex organization involving many different moving pieces and interests,allwithinasystemdesignedtoachievespecificobjectives.Byoptimizingthemovementoffreight

10Improving the Nation’s Freight Transportation System
across all modes of transportation, this industry helps ensure the health of the United States economy and the future of the Nation’s global competitiveness.
The Panel found that ten percent of the Nation’s freight movement, by tonnage, travels through pipelines. Pipelines, by their very nature, specialize in the transmission of energy commodities. In that regard, pipelines carry nearly two-thirds of the Nation’s energy supply. Today, there are over 2,600,000 miles of pipelines in the United States—enough to circle the globe about 100 times.
Asaresultofthesefindings,thePanelmakesthefollowingkeyrecommendations.Tosafelyandefficientlymeet the needs of freight movements in the 21st Century, Congress should:
· Direct the Secretary of Transportation, in coordination with the Secretary of the Army and the Com-mandant of the United States Coast Guard, to establish a comprehensive national freight transportation policy and designate a national, multimodal freight network;
· Ensure robust public investment in all modes of transportation on which freight movement relies, and incentivize additional private investment in freight transportation facilities, to maintain and improve the condition and performance of the freight transportation network;
· Promote and expedite the development and delivery of projects and activities that improve and facilitate theefficientmovementofgoods;
· Authorize dedicated, sustainable funding for multimodal freight Projects of National and Regional Sig-nificancethroughagrantprocessandestablishclearbenchmarksforprojectselection.Projectseligiblefor such funding would have a regional or national impact on the overall performance of the multimodal freightnetworkidentifiedbytheSecretaryofTransportation;
· Direct the Secretary of Transportation, in coordination with the Secretary of the Treasury and the Secre-tary of the Army, to identify and recommend sustainable sources of revenue across all modes of trans-portation that would provide the necessary investment in the Nation’s multimodal freight network and aligncontributionswithuseof,andexpectedbenefitofincreasedinvestmentin,suchnetwork;and
· Review, working through the Committee on Transportation and Infrastructure and the Committee on WaysandMeans,theSecretary’sfreightfundingandrevenuerecommendationsanddevelopspecificfunding and revenue options for freight transportation projects prior to Congress’ consideration of the surface transportation reauthorization bill in 2014.
This report includes a detailed discussion of the Nation’s freight network and makes recommendations that will improvethesafety,efficiency,andperformanceofthenation’sfreighttransportationsystem.

11Improving the Nation’s Freight Transportation System
tHe nation’s freiGHt systemintroduCtion
Transportation is important. It is about people and how they live their lives, how they get to work, how they get their children to school, how they buy food, clothes, and other necessities, and how families visit one another around the country. It is also about business. Transportation is critical to how the supply chain functions, how raw materials get to factories, how goods get to market, how food gets from farmers to kitchen tables, and how energyproductsmovefromareasofproductiontoareasofconsumption.Anefficientnationaltransportationnetwork allows business to lower transportation costs, which lowers production costs and enhances productivity andprofits.ItallowsAmericanbusinesstobecompetitiveintheglobalmarketplaceandfortheNation’secon-omy to prosper and grow. One need only look at the Interstate Highway System to see how that investment in thetransportationnetworkhasbenefitedtheNationandencouragedtremendouseconomicgrowthoverthepasttwo generations.
The federal government has historically played a strong role in transportation. In fact, one of the events that precipitated the Constitutional Convention was a longstanding dispute between Virginia and Maryland regard-ing navigation rights on the Potomac River impacted by transportation improvements proposed by President George Washington.
President Washington determined that the new Nation must have the transportation infrastructure in place to facilitate effective trade and communications. However, Washington’s efforts to extend navigation required a formal treaty between Maryland and Virginia, as well as elaborate approvals from other states in the Continental Congress. To settle that dispute he called for a convention to be held in Annapolis in 1786 to address problems with the Articles of Confederation and how the young Nation would move forward on this issue of navigation rights. That summit failed, but it demonstrated to the participants the need to improve the Articles of Confeder-ation.
It was in this context that the Constitutional Convention was called and the Constitution itself drafted. The framers of the Constitution recognized that the Articles of Confederation were not meeting the transportation and commerce needs of a young Nation. The Constitution addressed this issue primarily in the Commerce Clause, which gives the Congress the power to regulate interstate commerce and create, in the words of the Preamble, “a more perfect Union”.1 Furthermore, Article I, Section 8, clause 7 of the Constitution requires the Congresstoestablishpostofficesandpostroads.2 The post roads of the1780s and 1790s became the highway and byway system that the Nation enjoys today.
Over the years, the Nation has continued to invest in critical transportation infrastructure, from the Transconti-nental Railroad to the Panama Canal to the Interstate Highway System. The reason for this continued invest-ment in the transportation network is to ensure that the Nation is connected, supporting the needs of the Nation’s economy and the American people.
As President Dwight D. Eisenhower observed, without the unifying force of commerce and transportation, the United States would be a mere alliance of many separate parts. President Washington recognized this truth in the earliest days of the union, and the Congress must renew its commitment to providing a robust physical plat-form upon which the American people and American businesses can prosper.
1 U.S. ConSt. pmbl.2 U.S. ConSt. art. I, § 8, cl. 7.

12Improving the Nation’s Freight Transportation System
In 2011, the United States transportation system moved 17.6 billion tons of goods, valued at more than $16.8 trillion.3 The Federal Highway Administration estimates that in the next 30 years, there will be 60 percent more freight that must be moved across the Nation.4 To keep up with such demand, it is critical that Congress seek waystoincreasetheefficiency,safety,andoverallconditionandperformanceoftheNation’sfreightnetwork.
Given the multi-modal nature of freight movement, it is important to examine the system as a whole. Goods frequently move back and forth between ocean vessels, highways, railroads, air carriers, inland waterways, ports, and pipelines. Bottlenecks arising at any point on the system can seriously impede freight mobility and driveupthecostofthegoodsimpacted.Forthisreason,improvingtheefficientandsafeflowoffreightacrossall modes of transportation is critical to the health of the United States economy and the future of the Nation’s global competitiveness.
To illustrate this point, in testimony before the Panel on June 26, 2013, United Parcel Service Chief Operating OfficerDavidAbneyoutlinedthemovementofapackagefromNewYorktoGermany.ForthemanufacturertoreceivesuppliesfromCalifornia,assemblethegood,andsendittoitsfinaldestinationinvolves10distinctfreight movements involving three modes of transportation – rail, truck, and air.
In testimony before the Senate Committee on Commerce, Science, and Transportation on June 18, 2009, Rick Gabrielson, Senior Director of International Transportation of the Target Corporation, provided another telling example that demonstrates the intermodal nature of goods movement.5 A simple tee-shirt manufactured over-
3 U.S. Dep’t of tranSp., feD. HigHway aDmin. (fHwa), freigHt faCtS anD figUreS report 10 (2012); U.S. Dep’t of tranSp., reSearCH anD innovative teCH. aDmin. (rita), tranSp. StatiStiCS annUal report 1 (2012).4 Freight Facts and Figures Report, at 9.5 Freight Transportation in America: Options for Improving the Nation’s Network Before the S. Comm. on Commerce, Science, and Transp., 111th Cong. 1 (2009) (statement of Rick Gabrielson, Senior Dir. of Int’l Transp., Target).

13Improving the Nation’s Freight Transportation System
seas moves by truck and ocean vessel before entering the United States at a United States port. It is processed at a nearby sorting facility, where it is combined with similar items arriving from other foreign points of origin. These items are then loaded onto trucks or trains and delivered to a distribution facility, at which point the shirt is combined with other items designated for the same destination. These items are then transported via truck or train, depending on the distance between the distribution facility and the destination. If a customer wants a product shipped directly to their residence or business, Target may utilize cargo aircraft to transport the goods, in addition to trucks, trains, and vessels. Due to the complexity of the supply chain, even the smallest delay at anypointcancausemassiveripplesthroughoutthesystem,resultinginsignificanteconomicloss.


15Improving the Nation’s Freight Transportation System
HiGHways and truCkinG
The Nation’s highway system is an essential part of the freight network. Not every community is located ad-jacent to a railroad, airport, waterway, or port, but a consumer good is almost invariably transported along the Nation’s four million miles of highways and roads for at least part of its journey.
History of the Highway System and the Highway Trust Fund
Federal assistance for highway construction began in the early 20th Century when Congress provided $500,000 for highway construction in the Postal Service Appropriations Act of 1912.6 In 1944, Congress authorized sig-nificantexpandedfederalassistanceforconstructionofa“NationalSystemofInterstateHighways”.7 Without a dedicated source of revenue, however, construction of the Interstate System stalled.
ThelandmarkFederal-AidHighwayActof1956andHighwayRevenueActof1956authorizedsignificantfunding for a 41,000-mile National System of Interstate and Defense Highways and established the Highway TrustFund(HTF)asthemechanismforfinancingtheacceleratedhighwayinvestment.8Tofinancethein-creased authorizations, the Revenue Act increased federal excise taxes paid by highway users and provided that these revenues should be credited to the Highway Trust Fund. This dedicated funding mechanism provided financialcertaintyforthehighwayprogram,includingtheInterstateProgram.The13-yearauthorizationofthe1956 Act gave the states and highway construction industry the continuity needed to develop and build highway projects.6 Postal Service Appropriations Act of 1912, Pub. L. No. 336, 37 Stat. 539 (1912).7 Federal Aid Highway Act of 1944, Pub. L. No. 78-521, 58 Stat. 838 (1944).8 Federal-Aid Highway Act of 1956, Pub. L. No. 84-627, 70 Stat. 374 (1956).

16Improving the Nation’s Freight Transportation System
At its inception, the excise rates for highway use of motor fuels, also known as the gas tax, were 3 cents per gallon. Over the years, however, the tax rate and structure have been revised numerous times, most recently in 1993. Current rates set the gas tax at 18.4 cents per gallon of gasoline and 24.4 cents per gallon of diesel.9
Until major revisions in 1982, all receipts from motor fuel taxes were deposited into the HTF. The Surface Transportation Assistance Act of 1982 increased the tax rates from 4 cents per gallon to 9 cents per gallon, established separate Highway and Mass Transit accounts within the HTF, and deposited 1 cent out of the 9 cents per gallon into the Mass Transit Account.10 Currently, of the 18.4 cents per gallon federal excise tax on gaso-line, 15.44 cents is deposited into the Highway Account, 2.86 cents is deposited into the Mass Transit Account, and 0.1 cent is deposited into the Leaking Underground Storage Tank Trust Fund. Of the 24.4 cents per gallon federal excise tax on diesel, 21.44 cents is deposited into the Highway Account, 2.86 cents is deposited into the Mass Transit Account, and 0.1 cent is deposited into the Leaking Underground Storage Tank Trust Fund. The latest Federal Highway Administration data show that HTF net receipts (excluding General Fund transfers) totaled$40.1billioninfiscalyear2012,with$35.1billiondepositedintotheHighwayAccount,and$5.0billioninto the Mass Transit Account.11
Without an increase in receipts, the cash balance in the Highway Account of the HTF has fallen dramatically.12 Congressaddressedthisneedformoreinvestmentbysignificantlyincreasingauthorizationlevelsforhigh-way programs in the Transportation Equity Act for the 21st Century (TEA-21), the Safe, Accountable, Flexible, EfficientTransportationEquityAct:ALegacyforUsers(SAFETEA-LU),andmostrecentlyintheMovingAhead for Progress in the 21st Century Act (MAP-21).13WhenSAFETEA-LUexpiredattheendoffiscalyear2009, the Federal Highway Administration (FHWA) reported that the balance in the Highway Account was $8.8 billion. However, steps were not taken to increase receipts into the HTF, and the cash balance in the HTF has fallendramatically.TomaintainthesolvencyoftheHTF,betweenfiscalyear2008andfiscalyear2014,Con-gress transferred approximately $54 billion from the General Fund to the HTF.
Unfortunately,currentCongressionalBudgetOffice(CBO)projectionsshowthatthecashbalanceintheHigh-wayAccountwillbedepletedsometimeinfiscalyear2015.AccordingtoCBO,infiscalyear2015,theHigh-way Trust Fund revenue will be less than $39 billion, while expenditures will total more than $53 billion.14 ThesefiguresdonotcapturethefullextentoftheTrustFundshortfallbecauseFHWAwillalsohavetooutlayfundsforprojectsforwhichfundingwasobligatedinpreviousfiscalyears.Thiscashshortfallisprojectedtocontinueinsubsequentyearsifleftunaddressed,withCBOestimatingthattheHTFwillfaceacashdeficitof$132billionoverfiscalyear2012tofiscalyear2023.15
The Interstate System was established as a cost-to-complete system. As a general rule, each route was required tomeetcertaindesignspecifications.Everystatewasprovidedfederalfundingtocover90percentofthecostof constructing its route segments.16 The states were responsible for the remaining 10 percent of the construc-tion cost, as well as for all costs associated with the operation and maintenance of the system.17 Through the
9 fHwa, finanCing feDeral-aiD HigHwayS (2007).10 Surface Transportation Assistance Act of 1982, Pub. L. No. 97-424, 96 Stat. 2097 (1982).11 finanCing feDeral-aiD HigHwayS.12 Id.13 Transportation Equity Act for the 21stCentury,Pub.L.No.105-178;Safe,Accountable,Flexible,EfficientTransportationEquity Act: A Legacy for Users, Pub. L. No. 109-59; Moving Ahead for Progress in the 21st Century Act, Pub. L. No. 112-141.14 How the Financial Status of the Highway Trust Fund Impacts Surface Transportation Programs Before the H. Comm. on Transp. & Infrastructure Subcomm. on Highways & Transit, 113th Cong. 1 (2013) (statement of Kim P. Cawley, Chief, Natural & PhysicalResourcesCostEstimatesUnit,CongressionalBudgetOffice).15 Id.16 Pub. L. No. 84-627, § 108(c).17 Id.

17Improving the Nation’s Freight Transportation System
creationoftheHighwayTrustFundandthefinancingofconstructionoftheInterstateSystem,theFederal-AidHighway Act and Highway Revenue Act gave birth to the modern era of federal involvement in highway infra-structure, known as the Federal-aid Highway Program.18
The Federal-aid Highway Program is a federally assisted, state-managed and -operated program in which the states are responsible for the planning, design, and construction of highway projects, as well as operating and maintainingmajorroads.Thefederalgovernmentprovidesfinancialresourcesandtechnicalassistancetostateand local governments for constructing, preserving, and improving the National Highway System (including the Interstate System) and other urban and rural roads that are eligible for federal aid.
WiththeenactmentofIntermodalSurfaceTransportationEfficiencyAct(ISTEA),theInterstateSystemwasde-clared complete with only a few short segments remaining to be constructed.19ThefinalISTEAfundsforthesesegmentswereapportionedtothestatesinfiscalyear1995.20
Governments at all levels invested $182 billion in 2008 for highways and bridges in the form of capital outlay, maintenance,highwayandtrafficservices,administration,highwaysafetyenforcement,anddebtservice.21 In fiscalyear2012,thefederalcapitalinvestmentinhighwaystotaled$39.9billion.22
However, this level of investment continues to fall far short of the needs of our surface transportation system. According to the United States Department of Transportation (DOT), to maintain the Nation’s highway system at a state of good repair and improve it to meet future demand, all levels of government need to increase outlays specificallyforcapitalinvestmentfrom$91billionto$170billionannuallyovera20-yearperiod.Thisesti-mate does not include operations and maintenance costs.23
Bridges on the Nation’s highway system are also in serious need of increased investment. According to DOT, oneofeveryfourbridgesintheUnitedStatesisstructurallydeficientorfunctionallyobsolete.Ofthe607,380bridgesintheUnitedStates,151,497aredeficient,including66,749structurallydeficientbridgesand84,748functionallyobsoletebridges.Thebacklogofcost-beneficialbridgeinvestmentis$121.2billion.24 To eliminate thebacklogofdeficientbridgesoverthenext20years,DOTestimatesthatannualinvestmentinbridgerepairand replacement must increase from $12.8 billion in 2008 to $20.5 billion annually.25
Economic Impact of the Highway System
Approximately 50 percent of all freight tonnage moved in the United States travels less than 100 miles between origin and destination.26 At this distance, trucks carry almost 85 percent of all of the freight that is moved.27 More than 250 million vehicles traverse the highway system each year, and commercial trucking requires a reliable highway system on which to operate.28 However, each day approximately 12,000 miles of the highway
18 Pub. L. No. 84-627, § 108(a).19 IntermodalSurfaceTransportationEfficiencyActof1991,Pub.L.No.102-240,105Stat.1914(1991).20 Id.21 fHwa & feD. tranSit aDmin. (fta), ConDitionS anD performanCe report to CongreSS (2010).22 Moving Ahead for Progress in the 21st Century Act, Pub. L. No. 112-141 § 1101(a) (1).23 ConDitionS anD performanCe report.24 Id., at 7-17.25 Id., at 7-27.26 freigHt faCtS anD figUreS report, at 10.27 Id., at 11.28 Id., at 20.

18Improving the Nation’s Freight Transportation System
system slow below posted speed limits and an additional 7,000 miles experience stop-and-go conditions.29 Such congestionnegativelyimpactstheefficiencyofthehighwaysystemasareliablemodeoftransportation.
Moreover, America’s reliance on the highway system is growing faster than the system itself. National public highway mileage increased at an average rate of 0.2 percent between 1997 and 2010, while total vehicle miles travelled grew to an average annual rate of 1.3 percent during the same period.30 Congestion has increased as a result of this disparity.
The Texas Transportation Institute’s (TTI) Urban Mobility Report found that congestion in 498 of the Nation’s cities cost the economy $121 billion in 2011, or nearly $750 for every commuter in the country.31Thisfigureisupfromaninflation-adjusted$24billionin1982.32 Of the $121 billion, $27 billion of the delay cost is the effect of congestion on truck operations.33 Furthermore, congestion is becoming a problem that transcends “rush hour,” with about 40 percent of the Nation’s delay occurring in the mid-day and overnight hours, creating anincreasinglyseriousproblemforbusinessesthatrelyonefficientproductionanddelivery.34 TTI estimates thatin2011,theamountoffuelwastedincongestionnearlyreached2.9billiongallons—enoughtofilltheNewOrleans Superdome four times.35
InitsrecentTrafficScorecard,INRIXmadeastartlingdiscovery.Itfoundthatin2013,61oftheNation’s100mostcongestedcitieshaveexperiencedincreasedtrafficcongestionovertheprioryear.36 This is a dramatic shift from 2012, where only 6 cities experienced increased congestion and 94 saw decreases in congestion lev-els.37
The congestion challenges in Southern California provide a sobering example of the tangible harm that con-gestioninflictsontheNation’seconomy.Morethan43percentoftheNation’scontainerizedimportsenterthecountry through Southern California.38TheimportandexporttrafficoftheSouthernCaliforniaportsbenefittheresidents of every region of the United States. Goods imported and exported through Southern California make their way to and from each state, supporting billions of dollars of local economic activity and millions of jobs.39
Whencongestion,bottlenecks,andotherinefficiencieshindertheSouthernCaliforniaregion’sabilitytoimportgoods through its maritime ports and international border crossings or its ability to move these goods through the region, costs rise and transit times increase. These costs are often passed on to consumers. Consequently, the level at which the freight network functions in Southern California tangibly impacts the lives of consumers all across the Nation.
29 Id., at 42.30 ConDitionS anD performanCe report, at 2-8.31 DaviD SCHrank et al., texaS tranSportation inStitUte Urban mobility report 5 (2012), available at http://tti.tamu.edu/documents/mobility-report-2012-wappx.pdf.32 Id., at 5.33 Id.34 Id., at 8.35 Id., at 5.36 inrix, traffiC SCoreCarD annUal report (2012-13), available at http://scorecard.inrix.com/scorecard/summary.asp.37 Id.38 mobility-21, freigHt movement infraStrUCtUre keepS oUr eConomy Competitive, available at http://mobility21.com/wp-content/uploads/2013/02/13dc_goodsmovementtrifold_FINAL_lr.pdf.39 port of loS angeleS, port of long beaCH & alameDa CorriDor tranSportation aUtHority, San peDro bay portS nation-al eConomiC traDe impaCt report (2013), distributed to Panel in May, 2013.

19Improving the Nation’s Freight Transportation System
Furthermore, according to a recent study, more than 16 million jobs in the United States depend on imports.40 This study does not even take into consideration the millions of additional domestic manufacturing jobs that relyonanefficientfreighttransportationnetworktoexportAmerican-madegoods.
Comparing the costs of transporting soybeans to China from the United States and to China from Brazil illus-trates the critical role that the Nation’s freight system plays in the global competitiveness of American industry. Currently, it costs $85.19 to transport one metric ton of soybeans from Davenport, Iowa, to Shanghai, China.41 It costs $141.73 to transport the same amount of soybeans approximately the same distance to Shanghai from North Mato Grosso, Brazil. The United States currently enjoys a competitive advantage because the Nation’s freightsystemismoreefficientandcosteffectivethanBrazil’ssystem.However,Brazilisplanningtoinvest$26 billion to modernize its freight facilities. These advances will dramatically decrease the cost of moving Braziliansoybeanstomarket.Withoutanefficient,highlyfunctioningfreightnetwork,Americanbusinesseswill lose their competitive advantage in the global marketplace.
40 traDe partnerSHip worlDwiDe, importS work for ameriCa (2013), available at http://www.uschamber.com/sites/default/files/reports/ImportsWork_FIN.pdf.41 UniteD Soybean boarD et al., farm to market: a Soybean’S JoUrney from fielD to ConSUmer (2012), available at http://www.soytransportation.org/FarmToMarket/FarmToMarketStudy082012Study.pdf.
20Improving the Nation’s Freight Transportation System
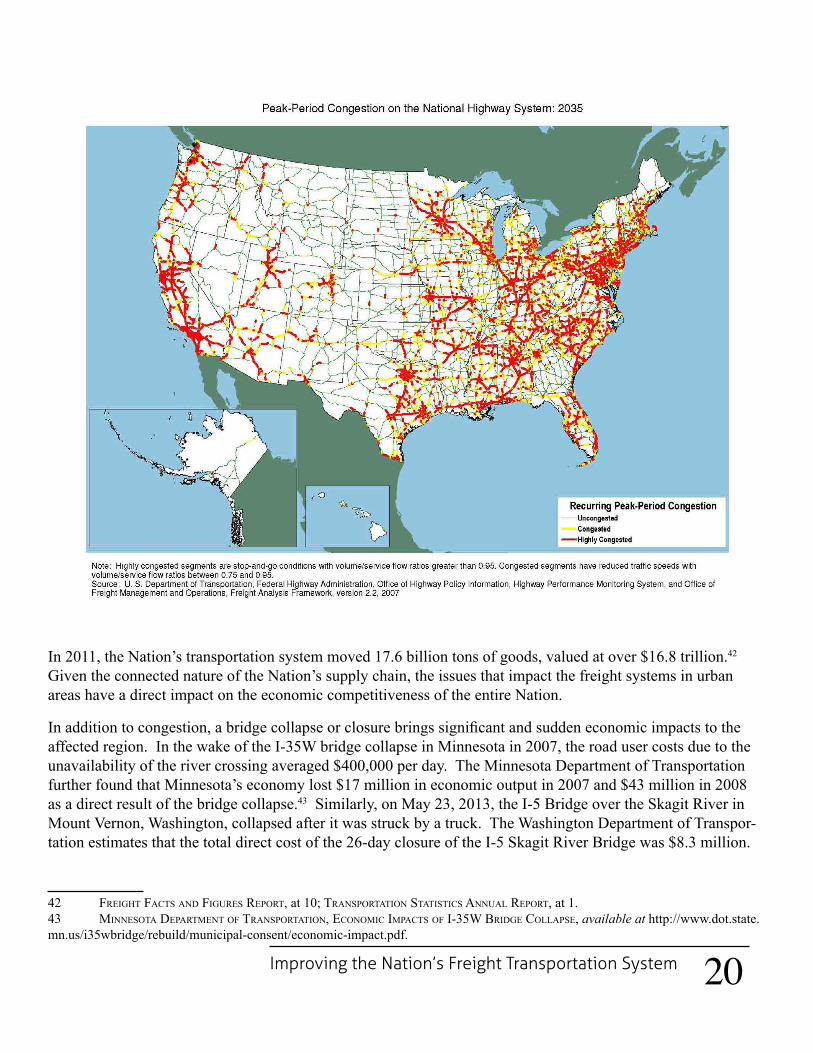
In 2011, the Nation’s transportation system moved 17.6 billion tons of goods, valued at over $16.8 trillion.42 Given the connected nature of the Nation’s supply chain, the issues that impact the freight systems in urban areas have a direct impact on the economic competitiveness of the entire Nation.
Inadditiontocongestion,abridgecollapseorclosurebringssignificantandsuddeneconomicimpactstotheaffected region. In the wake of the I-35W bridge collapse in Minnesota in 2007, the road user costs due to the unavailability of the river crossing averaged $400,000 per day. The Minnesota Department of Transportation further found that Minnesota’s economy lost $17 million in economic output in 2007 and $43 million in 2008 as a direct result of the bridge collapse.43 Similarly, on May 23, 2013, the I-5 Bridge over the Skagit River in Mount Vernon, Washington, collapsed after it was struck by a truck. The Washington Department of Transpor-tation estimates that the total direct cost of the 26-day closure of the I-5 Skagit River Bridge was $8.3 million.
42 freigHt faCtS anD figUreS report, at 10; tranSportation StatiStiCS annUal report, at 1.43 minneSota Department of tranSportation, eConomiC impaCtS of i-35w briDge CollapSe, available at http://www.dot.state.mn.us/i35wbridge/rebuild/municipal-consent/economic-impact.pdf.
21Improving the Nation’s Freight Transportation System
freiGHt rail
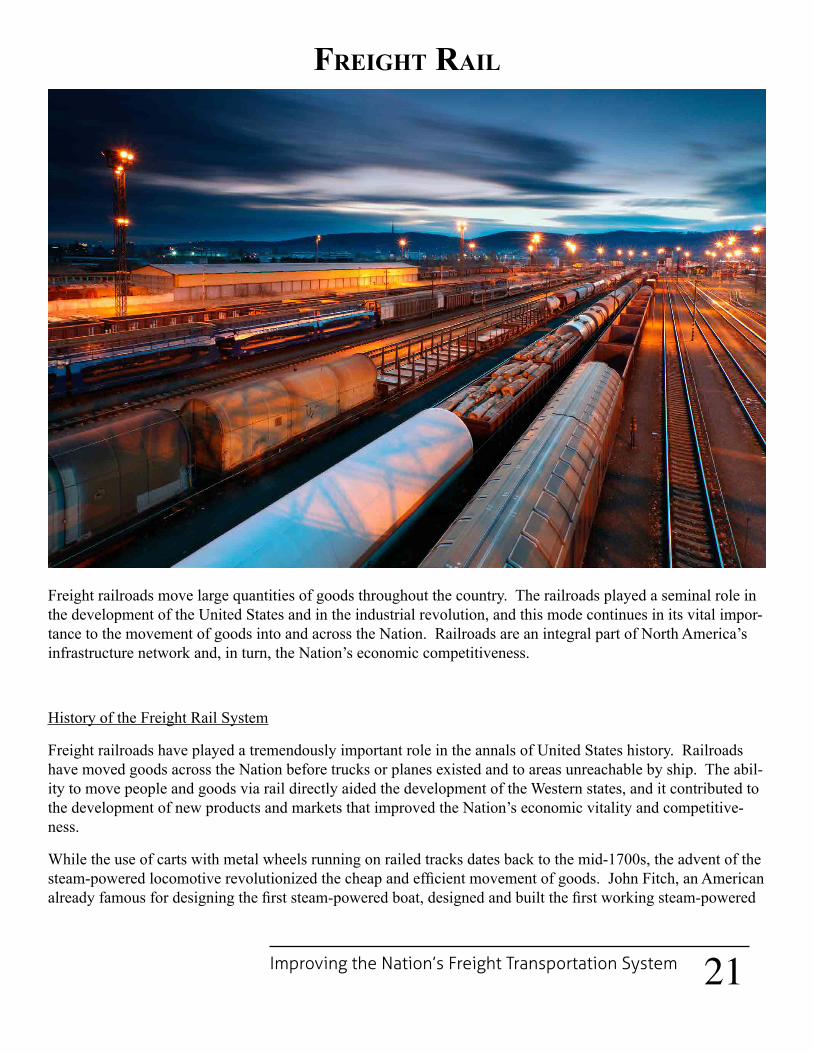
Freight railroads move large quantities of goods throughout the country. The railroads played a seminal role in the development of the United States and in the industrial revolution, and this mode continues in its vital impor-tance to the movement of goods into and across the Nation. Railroads are an integral part of North America’s infrastructure network and, in turn, the Nation’s economic competitiveness.
History of the Freight Rail System
Freight railroads have played a tremendously important role in the annals of United States history. Railroads have moved goods across the Nation before trucks or planes existed and to areas unreachable by ship. The abil-ity to move people and goods via rail directly aided the development of the Western states, and it contributed to the development of new products and markets that improved the Nation’s economic vitality and competitive-ness.
While the use of carts with metal wheels running on railed tracks dates back to the mid-1700s, the advent of the steam-poweredlocomotiverevolutionizedthecheapandefficientmovementofgoods.JohnFitch,anAmericanalreadyfamousfordesigningthefirststeam-poweredboat,designedandbuiltthefirstworkingsteam-powered
22Improving the Nation’s Freight Transportation System
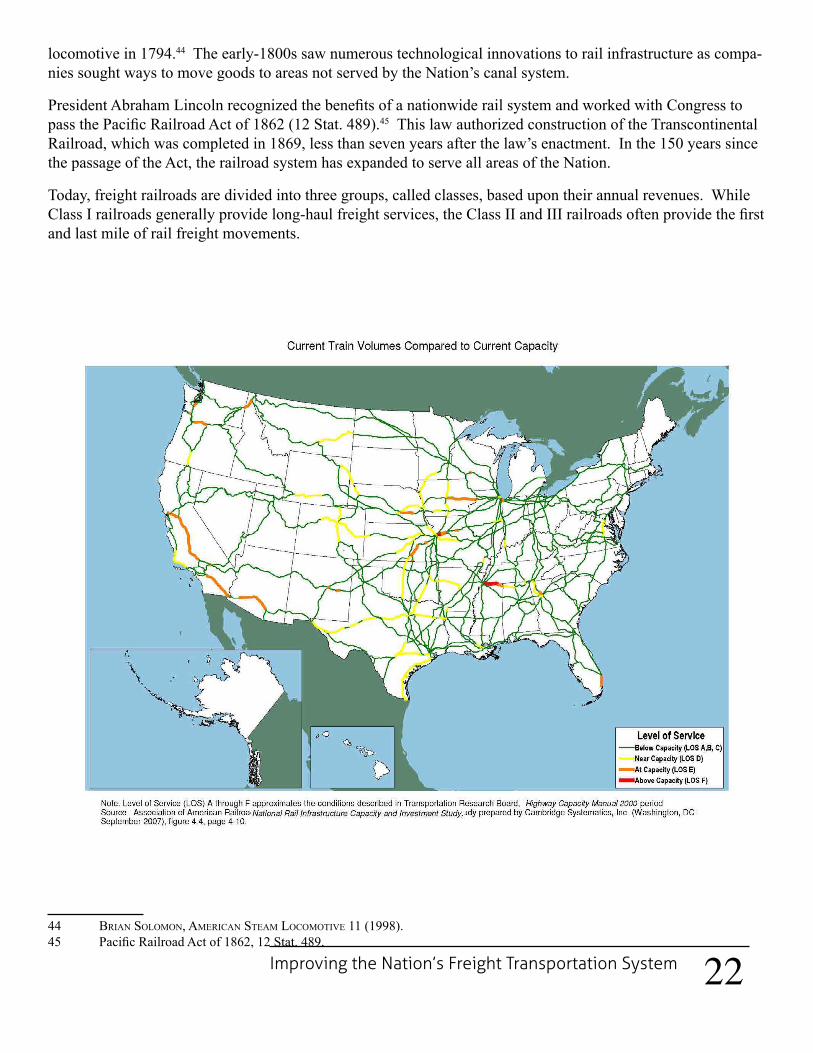
locomotive in 1794.44 The early-1800s saw numerous technological innovations to rail infrastructure as compa-nies sought ways to move goods to areas not served by the Nation’s canal system.
PresidentAbrahamLincolnrecognizedthebenefitsofanationwiderailsystemandworkedwithCongresstopassthePacificRailroadActof1862(12Stat.489).45 This law authorized construction of the Transcontinental Railroad, which was completed in 1869, less than seven years after the law’s enactment. In the 150 years since the passage of the Act, the railroad system has expanded to serve all areas of the Nation.
Today, freight railroads are divided into three groups, called classes, based upon their annual revenues. While ClassIrailroadsgenerallyprovidelong-haulfreightservices,theClassIIandIIIrailroadsoftenprovidethefirstand last mile of rail freight movements.
44 brian Solomon, ameriCan Steam loComotive 11 (1998).45 PacificRailroadActof1862,12Stat.489.
23Improving the Nation’s Freight Transportation System
Economic Impact of the Freight Rail System
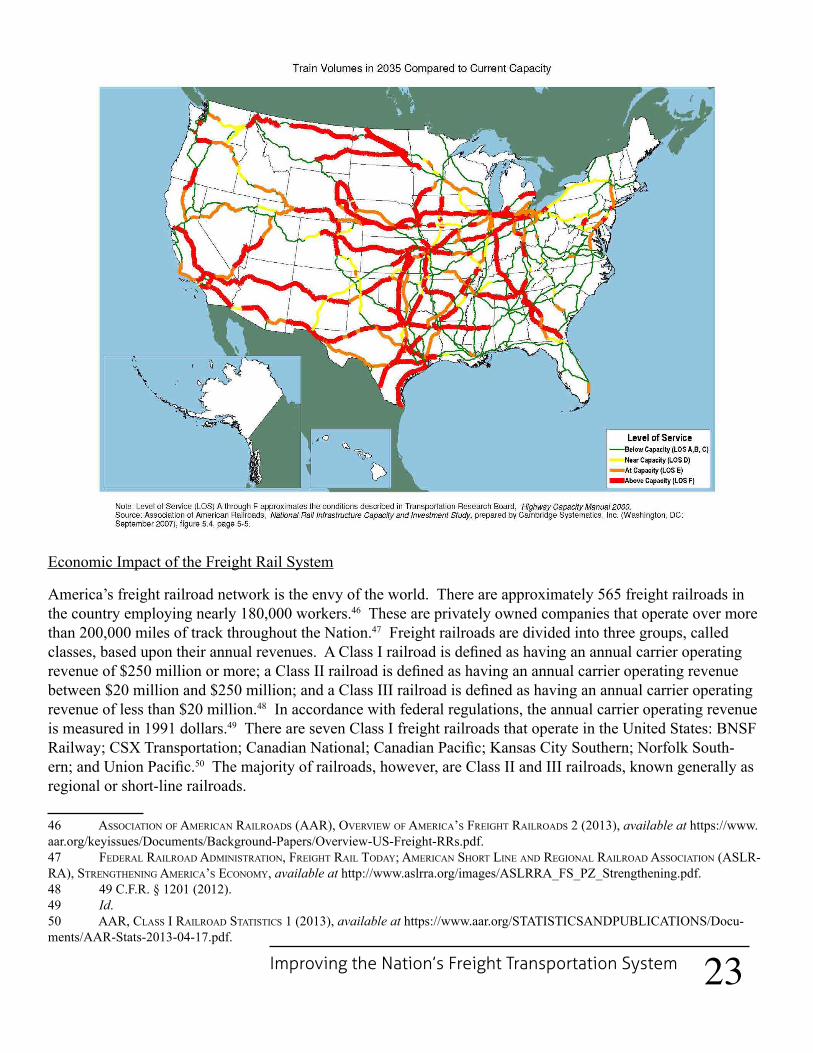
America’s freight railroad network is the envy of the world. There are approximately 565 freight railroads in the country employing nearly 180,000 workers.46 These are privately owned companies that operate over more than 200,000 miles of track throughout the Nation.47 Freight railroads are divided into three groups, called classes,basedupontheirannualrevenues.AClassIrailroadisdefinedashavinganannualcarrieroperatingrevenueof$250millionormore;aClassIIrailroadisdefinedashavinganannualcarrieroperatingrevenuebetween$20millionand$250million;andaClassIIIrailroadisdefinedashavinganannualcarrieroperatingrevenue of less than $20 million.48 In accordance with federal regulations, the annual carrier operating revenue is measured in 1991 dollars.49 There are seven Class I freight railroads that operate in the United States: BNSF Railway;CSXTransportation;CanadianNational;CanadianPacific;KansasCitySouthern;NorfolkSouth-ern;andUnionPacific.50 The majority of railroads, however, are Class II and III railroads, known generally as regional or short-line railroads.
46 aSSoCiation of ameriCan railroaDS (aar), overview of ameriCa’S freigHt railroaDS 2 (2013), available at https://www.aar.org/keyissues/Documents/Background-Papers/Overview-US-Freight-RRs.pdf.47 feDeral railroaD aDminiStration, freigHt rail toDay; ameriCan SHort line anD regional railroaD aSSoCiation (aSlr-ra), StrengtHening ameriCa’S eConomy, available at http://www.aslrra.org/images/ASLRRA_FS_PZ_Strengthening.pdf.48 49 C.F.R. § 1201 (2012).49 Id.50 aar, ClaSS i railroaD StatiStiCS 1 (2013), available at https://www.aar.org/STATISTICSANDPUBLICATIONS/Docu-ments/AAR-Stats-2013-04-17.pdf.
24Improving the Nation’s Freight Transportation System
While Class I railroads generally provide long-haul services, the Class II and III railroads often provide the firstandlastmileofrailfreightmovements.Theproductsmovedbyrailincludeeverythingfromautomobiles,agricultural goods, and consumer products to chemicals, lumber, and energy resources. In all, freight rail carries 43 percent of intercity freight, which is more than any other mode, and for every one rail job, 4.5 other jobs are supported elsewhere in the economy.51 Furthermore, the Department of Commerce estimates that for every $1 invested in the Nation’s rail system, the industry returns $3 to the economy.52
Unlike other modes, the freight railroads own the infrastructure over which they operate, meaning they also invest heavily in those networks. In 2011, the freight railroads invested over $23 billion in capital expenditures to improve and expand their networks.53 This investment is due in large part to the movement toward de-regu-lation of the freight railroads beginning in the 1970s through the Staggers Rail Act of 1980 (P.L. 96-448), and culminating in the Interstate Commerce Commission Termination Act of 1995 (P.L. 104-88).54 Deregulation allowed the freight railroads to price competitively and respond to market forces, which has increased produc-tivity, enhanced safety, lowered average rates, and freed over $500 billion for private investment back into the freight network.55 Furthermore, particular to the Class II and III railroads, deregulation has grown that industry from 8,000 miles of track in 1980 to over 51,000 miles today.56 Class II and III railroads are now the feeder and distribution lines for the network, reaching into small town, rural America to preserve those areas’ connection to the national network.
As noted above, the United States freight railroad industry employs nearly 180,000 workers. More than 160,000 are employed by the seven Class I freight railroads and another 20,000 are employed by the 558 short line and regional freight railroads.57
The United States rail industry is heavily unionized. Approximately 85 percent of Class I employees and around 60 percent of non-Class I employees belong to a union and thus are subject to collective bargaining agreements.58 Collective bargaining agreements between railroads and their employees are governed by the RailwayLaborAct,whichwasfirstpassedin1926.59 Collective bargaining for most other industries is gov-erned by the National Labor Relations Act.60
51 CorriDorS of CommerCe, eConomiC Development, available athttp://www.tradecorridors.com/benefits-of-rail/economic-de-velopment.52 Id.53 Freight and Passenger Rail in America’s Transportation System Before the H. Comm. On Transp. & Infrastructure Sub-comm. on Railroads, Pipelines & Hazardous Materials, 113th Cong. 1 (2013) (statement of Edward R. Hamberger, Pres. & CEO, Ass’n of Am. Railroads).54 Staggers Rail Act of 1980, Pub. L. No. 96-448, 94 Stat. 1895 (1980); Interstate Commerce Commission Termination Act of 1995, Pub. L. No. 104-88, 109 Stat. 803 (1995).55 Jean-Paul Rodrigue, et al., The Geography of Transport Systems, Hofstra University, Department of Global Studies & Geog-raphy (2013), available at http://people.hofstra.edu/geotrans; Brian Slack, Rail Deregulation in the United States, Hofstra University, Department of Global Studies & Geography (2013), available at http://people.hofstra.edu/geotrans/eng/ch9en/appl9en/ch9a1en.html.56 anne Canby, ameriCa’S rail SyStem, available athttp://onerail.org/sites/onerail.org/files/documents/rail-study/rail-info-briefing-rail-system-overview-final-2-22-13.pdf.57 AAR, ClaSS i railroaD StatiStiCS, at 1; aSlrra, StrengtHening ameriCa’S eConomy, at 1.58 aar, ColleCtive bargaining in tHe rail inDUStry 1 (2013), available at https://www.aar.org/keyissues/Documents/Back-ground-Papers/Collective-Bargaining.pdf.59 Railway Labor Act, 44 Stat. 577 (1926).60 ColleCtive bargaining in tHe rail inDUStry, at 1.

25Improving the Nation’s Freight Transportation System
Most Class I railroads and a number of non-Class I railroads bargain on a “national handling” basis. National handling covers more than 90 percent of the Nation’s unionized rail employees.61 Under national handling, a group of railroads acting as a unit negotiates with a union or group of unions for an agreement that applies to all those who participate in the bargaining. The members of each union, however, must ratify their contracts on an individual basis once a tentative agreement is in place. There are currently 13 major unions that represent rail workers.62
61 Id.62 The 13 major rail unions are: the American Train Dispatchers Association, the Brotherhood of Railroad Signalmen, the International Association of Machinists and Aerospace Workers, the International Brotherhood of Boilermakers, Blacksmiths, Forgers and Helpers, the International Brotherhood of Electrical Workers, the National Conference of Firemen and Oilers - SEIU, the Sheet Metal Workers International Association, the Transportation Communications International Union, the Transport Workers Union of America, the United Transportation Union, UNITE-HERE, the Brotherhood of Locomotive Engineers and Trainmen Division of the International Brotherhood of Teamsters, and the Brotherhood of Maintenance of Way Employees Division of the International Broth-erhood of Teamsters.


27Improving the Nation’s Freight Transportation System
sHiPPinG and Ports
Moving people and goods over water is arguably the oldest form of transportation in human history. For mil-lennia, civilizations have depended upon ships to move goods to support nations and economies. Today, the shipping industry is one of the most sophisticated freight networks in the world, transporting the vast majority of goods in international trade and employing millions of people across the globe.
The United States has essentially four coastlines that are responsible for importing and exporting commodi-ties from around the world: the East Coast, the West Coast, the Gulf Coast, and the Great Lakes. Commercial navigationthroughtheArcticOceanalongthenorthcoastofAlaskaloomsasapotentialfifthcoast.Fromourcoastal ports, goods move across the country, primarily by rail and truck. Getting products to market in an efficientandsafemanneriscriticaltokeepingtheeconomymovingandrequiresextensiveintermodalcoordi-nation.
History of the Shipping and Port System
Shipping has had a prominent role in American history from the Nation’s inception. Were it not for the impor-tance of shipping and trade, European explorers would not have discovered North America in search of a navi-gable route to Asia. Additionally, the maritime industry’s ability to quickly and reliably transport raw materials and agricultural products from the colonies to Europe encouraged the development of North America in the 1600s. Ocean shipping provided a direct connection between the colonies and the rest of the world, facilitating trade and encouraging exploration and development of the continent’s vast natural resources.

28Improving the Nation’s Freight Transportation System
Over the years, in a continual effort to stay competitive, the shipping industry has evolved in recognition of changingcommoditiesandemergingmarkets,globalorregionalarmedconflict,challengeswithshippinglongdistances, integrated global trading partners, changing ocean shipping economic conditions, including the emer-gence of extremely large vessels, and demands for new products from international sources.
Whiletherehavebeenmanytechnologicalinnovationstoshipsandportsthatimprovedtheefficiency,range,and capacity of the maritime industry, the invention of the intermodal container by Malcolm McLean in 1955 revolutionized the industry by allowing for standardization of cargo.63 Intermodal containers are reusable steel boxes with standard sizes and connection points that allow for multiple uses on ocean-going cargo ships, trucks, andfreighttrains.Duetothesuperiorefficiencyofthisshippingapproach,globalstandardizationresultedandcontainersbecametheunitofvolumeusedtodefinethecapacityofshipsorports.Today,thetwenty-footequivalent unit (TEU), referencing the size of the standard intermodal container, is now the standard industry metric. The freight industry generally, including ships, trucks, and trains, has been standardized to accommo-datethesafeandefficienttransferofthesecontainersbetweentransportationmodes.
Prior to the use of containers to transport manufactured goods, maritime cargo was primarily loaded by hand in bulkpallets.Containerizationallowedtheshippingindustrytogainefficiencyinthreemainareasand,conse-quently, expand exponentially. First, the use of containers allowed for the quick movement of goods between ship and shore and between truck and train without having to break down and repackage the goods. Second, containers could be unloaded and loaded on various modes of transportation much more quickly than before throughtheuseoflarger,moreefficientgantrycranes.Third,theuseofcontainersgreatlyincreasedthefreightvolume capacity of the entire freight system. For example, ocean-going vessels could stack containers on a ship’s deck and transport more goods than was previously possible by loading cargo only in a ship’s holds.
In addition to containerization, other types of ships have evolved over the years to meet special cargo and trans-port needs. Today, the world’s oceans are plied by a wide assortment of ship types including dry bulk carriers for coal, iron ore, and lumber; specialized ships for hauling agricultural products; fuel tankers for oil and natural gas;roll-on/roll-offcarandvehiclecarriers;andavarietyofspecialtyshipsdesignedtotransportspecificcom-modities, such as wind turbines.
Theshippingindustryiscontinuallyseekingwaystomaximizeitsefficiencyintransport,includingfueluse,whiletakingintoconsiderationthespecificharborsthatashipservices.ShipscarryingcargotoorfromPacificRim countries must continually balance ship design and size with the constraints of the Panama Canal and the logistical constraints of transiting the Mediterranean and Red Seas through the Suez Canal. The constant de-mands for reducing fuel consumption on the open sea and increasing safety in transiting the ingress and egress of straits, approaches, and harbors require a high level of training among licensed mariners and crew. The shift toshipdesignsthatusemoreautomationtechnologieshashelpedtoimproveefficiencieswithoutsacrificingnavigation safety.
63 Anthony J. Mayo & Nitin Nohria, The Truck Driver Who Reinvented Shipping (2005) (excerpted from In Their Time: The Greatest Business Leaders of the Twentieth Century), available at http://hbswk.hbs.edu/item/5026.html.
29Improving the Nation’s Freight Transportation System
Economic Impact of the Shipping and Port System
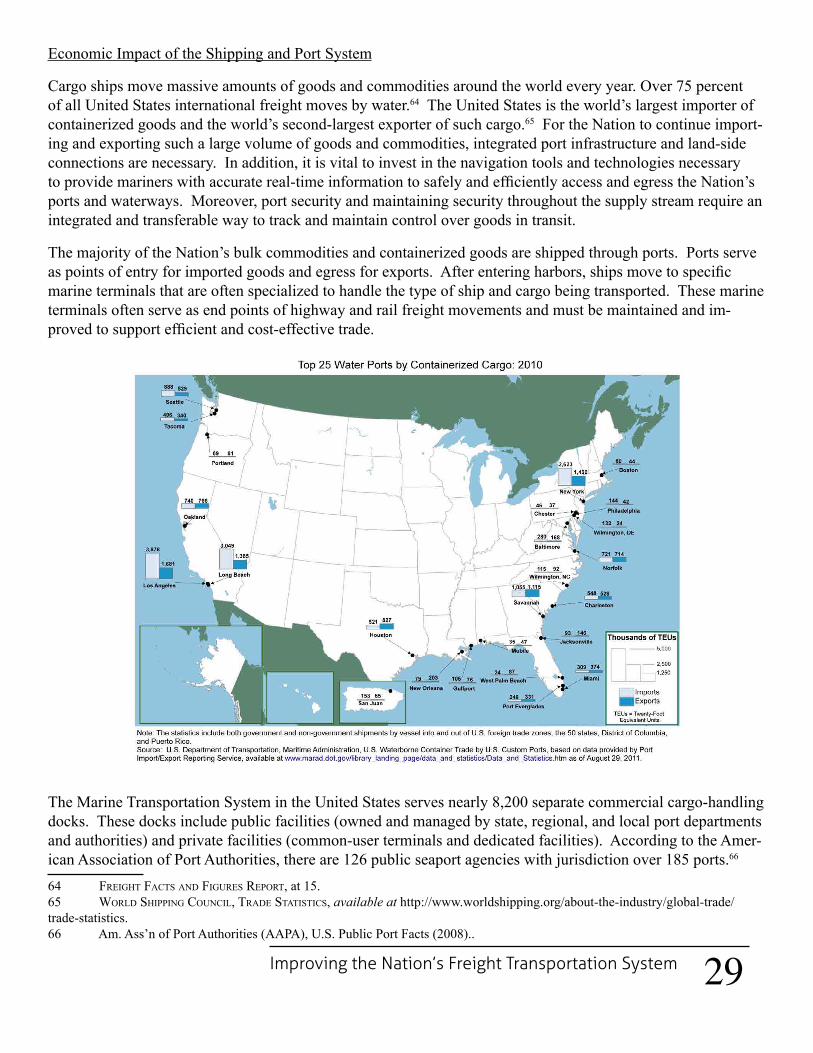
Cargo ships move massive amounts of goods and commodities around the world every year. Over 75 percent of all United States international freight moves by water.64 The United States is the world’s largest importer of containerized goods and the world’s second-largest exporter of such cargo.65 For the Nation to continue import-ing and exporting such a large volume of goods and commodities, integrated port infrastructure and land-side connections are necessary. In addition, it is vital to invest in the navigation tools and technologies necessary toprovidemarinerswithaccuratereal-timeinformationtosafelyandefficientlyaccessandegresstheNation’sports and waterways. Moreover, port security and maintaining security throughout the supply stream require an integrated and transferable way to track and maintain control over goods in transit.
The majority of the Nation’s bulk commodities and containerized goods are shipped through ports. Ports serve aspointsofentryforimportedgoodsandegressforexports.Afterenteringharbors,shipsmovetospecificmarine terminals that are often specialized to handle the type of ship and cargo being transported. These marine terminals often serve as end points of highway and rail freight movements and must be maintained and im-provedtosupportefficientandcost-effectivetrade.
The Marine Transportation System in the United States serves nearly 8,200 separate commercial cargo-handling docks. These docks include public facilities (owned and managed by state, regional, and local port departments and authorities) and private facilities (common-user terminals and dedicated facilities). According to the Amer-ican Association of Port Authorities, there are 126 public seaport agencies with jurisdiction over 185 ports.66 64 freigHt faCtS anD figUreS report, at 15.65 worlD SHipping CoUnCil, traDe StatiStiCS, available at http://www.worldshipping.org/about-the-industry/global-trade/trade-statistics.66 Am. Ass’n of Port Authorities (AAPA), U.S. Public Port Facts (2008)..

30Improving the Nation’s Freight Transportation System
Distribution of the cargo-handling docks and ports by region are as follows:
Location Foreign Only Foreign and Domestic Domestic Only TotalAtlantic 33 560 1,193 1,786Pacific 24 571 1,101 1,696Gulf 17 559 1,560 2,136Great Lakes 3 246 402 651Inland 0 0 1,928 1,928Total 77 1,936 6,184 8,197
Source: United States Army Corps of Engineers67
While large ports dominate the international freight dynamic, smaller ports are critical to supporting and main-taining regional and local economies and sustaining the United States coastwise trade under the Jones Act.
67 am. aSS’n of State HigHway anD tranSp. offiCialS (aaSHto), waterborne freigHt tranSportation 2-2 (2013), available at http://water.transportation.org/SiteCollectionDocuments/WFT-1.pdf.

31Improving the Nation’s Freight Transportation System
Harbor Maintenance Trust Fund
The Water Resources Development Act of 1986 established the Harbor Maintenance Trust Fund (HMTF) for the operation and maintenance (O&M) of harbors.68 The Harbor Maintenance Tax (HMT), an ad valorem tax, is collected on maritime imports and is assessed at a rate of 0.125 percent of cargo value ($1.25 per $1,000 in cargo value).69 The tax revenues are deposited into the Harbor Maintenance Trust Fund from which Congress appropriates funds for dredging harbor channels to cover 100 percent of the United States Army Corps of Engi-neers O&M costs.70 In addition to the tax on imported goods, domestic cargo shippers—shipments from United StatesporttoUnitedStatesport—generateaboutfivepercentoftheHMTrevenueswhilecruiseshipspas-sengers generate less than one percent.71 Cargo and passengers from Alaska, Hawaii, and other United States territories are exempt from the HMT.72 Ports on inland rivers are also exempt from the HMT and are assessed fuel taxes that support the Inland Waterways Trust Fund.73
Currently HMT revenues pay for all the maintenance dredging costs at harbors up to 45 feet deep.74 For deeper harbors, the incremental maintenance cost is 50 percent from the HMTF and 50 percent from the local sponsor, usually the port authority.75Infiscalyear2011,theHMTFcollected$1.38billionbutestimatedexpenditurestotaled only $790 million.76 As a result of collecting more revenue than expenditures year after year, the HMTF balance is more than $7 billion.77 As noted above, these funds may only be used for their statutorily-designat-ed purposes. However, because the HMTF is not an “off-budget” account within the federal budget, the large balanceisusedtomakeitappearthattheNation’sbudgetdeficitislessinagivenyear.78
A lack of appropriated funding has resulted in deferred maintenance of federal channels that serve coastal ports. Currently, the constructed depths and widths of entrance channels at 59 major ports are available only 35 per-cent of the time.
Global Shipping Challenges
Shipping operators select harbors to call based on a number of factors including reliability, speed, cost, safety, security,value-addedservice,availabilityofcargo,andcontributionstooverallprofitabilityandotherbusinessobjectives.79 Ocean carriers have a choice of routes around the globe—they can go around Cape Horn in Afri-ca, the Cape of Good Hope in South America, or through the Suez Canal or the Panama Canal. Over the last several years, two new routes are beginning to open up that could change the dynamics of global ship deliver-ies—the Northeast and the Northwest passages through the Arctic Ocean. In 2013, more than 400 ships applied
68 Water Resources Development Act of 1986, Pub. L. No. 99–662, 100 Stat. 4082 (1986).69 aapa, government relationS prioritieS: water reSoUrCeS 1 (2013), available athttp://www.aapa-ports.org/files/Water%20Resources%202013_1363709492636_1.pdf.70 Id.71 John Frittelli, Harbor Maintenance Trust Fund Expenditures, CongreSSional reSearCH ServiCe, Report No. R41042, January 10, 2011, at 5.72 Id.73 Id.74 Id., at 7.75 Id.76 Staff of Joint Comm. on taxation, 112tH Cong., overview of SeleCteD tax proviSionS relating to tHe finanCing of infra-StrUCtUre 18 (JCX-29-11).77 Dep’t of tHe treaSUry, Harbor maintenanCe trUSt fUnD, Rep. No. 96X8863.78 Harbor Maintenance Trust Fund Expenditures, at 8-9.79 aaSHto, waterborne freigHt tranSportation, at 2-10.

32Improving the Nation’s Freight Transportation System
for permits to transit the Arctic Ocean for commercial transport.80 Using the northern sea route along the Arctic Coast of Russia reduces the transit between East Asia and Western Europe by 21,000 kilometers and reduces the time of transit by one-third.81
The physical dimensions of the Panama Canal have historically limited the size of ships that can transit across thePacifictotheAtlantic,andreverse.ThecurrentsizeofthePanamaCanallimitsshipstoadepthof39feetandawidthofnotmorethan13containersacross.Thisisthedefined“Panamax”dimension.Asshipsbeganto increase in width and depth to accommodate an increased number of containers, the Panama Canal Authority embarked on an expansion of the canal to adapt to “post-Panamax” sized vessels. The expansion of the Panama Canal is scheduled to be completed in 2015 and will allow the next generation of mega-containerships to move between China and the United States East Coast and Gulf Coast ports.
Not all harbors in the United States will be able to handle these post-Panamax sized ships. On the West Coast, the harbors currently able to handle these ships include Los Angeles-Long Beach, California; Oakland, Califor-nia; and Seattle, Washington. On the East Coast, Norfolk, Virginia and Baltimore, Maryland are able to handle post-Panamax ships and New York/New Jersey and Miami, Florida are scheduled to be enlarged to accommo-date these ships over the next several years. On the Gulf Coast, Houston, Texas, is currently dredging to allow for post-Panamax sized ships. Of concern in the global shipping community is the continued support of key shipping hubs and connectivity to and from the rest of the United States. It is critical that the hub ports have adequate connections to distribution points throughout the country. Of equal concern is the ability at these ports to break down the loads from the mega-container ships and transfer container cargo to feeder vessels that can access and support smaller harbors along the East, West, and Gulf Coasts, and in the future, the Great Lakes, via short sea shipping.
Bulk Commodities
The United States has multiple commodities that are desired on the global market, including coal, iron ore, tac-onite,wheat,soybeans,corn,fertilizers,timber,andfinishedwoodproducts.Thesebulkcommoditiesrequirespecificloadingandunloadingfacilities.Asthecommerceofthesecommoditieshasincreasedandbecomemore competitive on a global scale, shippers have moved toward increased modernization and specialization on the products that they ship.
The shifting dynamics of coal, in particular, exemplify this shift in demand and the response of the global bulk shipping community, particularly the increasing global demand for United States-mined coal in Asia and Eu-rope.InNorfolk,Virginia,specificmixesofWestVirginiacoalareincreasinglyshippedtoRotterdam,theNetherlands, or to the Black Sea for distribution to the rest of Europe.
80 SHip anD bUnker, navigating tHe arCtiC’S iCy waterS (2013), available at http://shipandbunker.com/news/world/471456-fathom-spotlight-navigating-the-arctics-icy-waters.81 Jean-Paul Rodrigue, et al., The Geography of Transport Systems: Polar Shipping Routes, Hofstra University, Department of Global Studies & Geography (2013), available at http://people.hofstra.edu/geotrans/eng/ch1en/conc1en/polarroutes.html.
33Improving the Nation’s Freight Transportation System
inland waterways
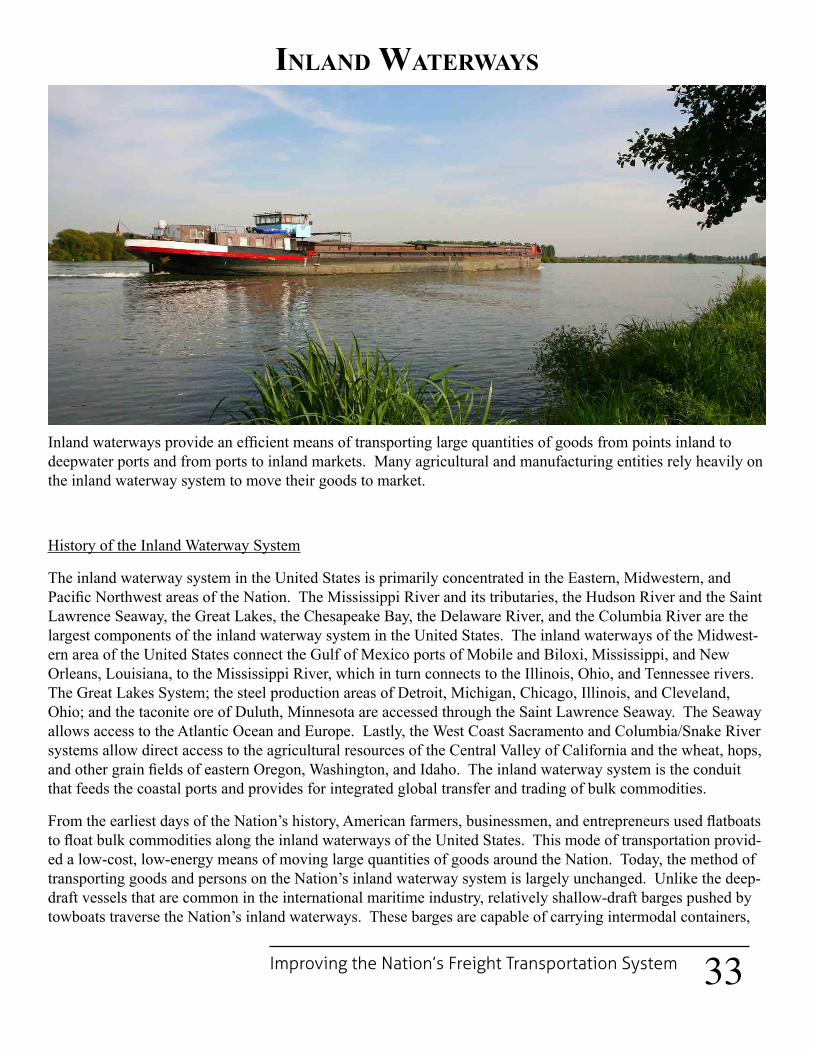
Inlandwaterwaysprovideanefficientmeansoftransportinglargequantitiesofgoodsfrompointsinlandtodeepwater ports and from ports to inland markets. Many agricultural and manufacturing entities rely heavily on the inland waterway system to move their goods to market.
History of the Inland Waterway System
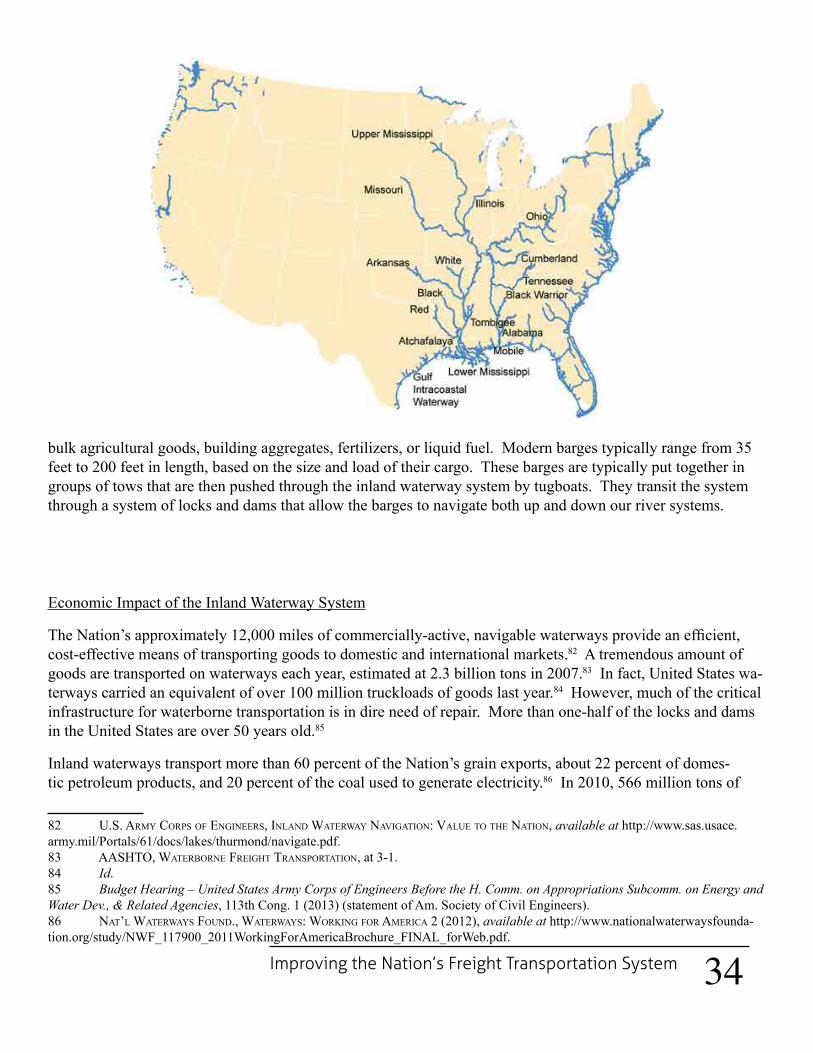
The inland waterway system in the United States is primarily concentrated in the Eastern, Midwestern, and PacificNorthwestareasoftheNation.TheMississippiRiveranditstributaries,theHudsonRiverandtheSaintLawrence Seaway, the Great Lakes, the Chesapeake Bay, the Delaware River, and the Columbia River are the largest components of the inland waterway system in the United States. The inland waterways of the Midwest-ern area of the United States connect the Gulf of Mexico ports of Mobile and Biloxi, Mississippi, and New Orleans, Louisiana, to the Mississippi River, which in turn connects to the Illinois, Ohio, and Tennessee rivers. The Great Lakes System; the steel production areas of Detroit, Michigan, Chicago, Illinois, and Cleveland, Ohio; and the taconite ore of Duluth, Minnesota are accessed through the Saint Lawrence Seaway. The Seaway allows access to the Atlantic Ocean and Europe. Lastly, the West Coast Sacramento and Columbia/Snake River systems allow direct access to the agricultural resources of the Central Valley of California and the wheat, hops, andothergrainfieldsofeasternOregon,Washington,andIdaho.Theinlandwaterwaysystemistheconduitthat feeds the coastal ports and provides for integrated global transfer and trading of bulk commodities.
FromtheearliestdaysoftheNation’shistory,Americanfarmers,businessmen,andentrepreneursusedflatboatstofloatbulkcommoditiesalongtheinlandwaterwaysoftheUnitedStates.Thismodeoftransportationprovid-ed a low-cost, low-energy means of moving large quantities of goods around the Nation. Today, the method of transporting goods and persons on the Nation’s inland waterway system is largely unchanged. Unlike the deep-draft vessels that are common in the international maritime industry, relatively shallow-draft barges pushed by towboats traverse the Nation’s inland waterways. These barges are capable of carrying intermodal containers,
34Improving the Nation’s Freight Transportation System
bulk agricultural goods, building aggregates, fertilizers, or liquid fuel. Modern barges typically range from 35 feet to 200 feet in length, based on the size and load of their cargo. These barges are typically put together in groups of tows that are then pushed through the inland waterway system by tugboats. They transit the system through a system of locks and dams that allow the barges to navigate both up and down our river systems.
Economic Impact of the Inland Waterway System
TheNation’sapproximately12,000milesofcommercially-active,navigablewaterwaysprovideanefficient,cost-effective means of transporting goods to domestic and international markets.82 A tremendous amount of goods are transported on waterways each year, estimated at 2.3 billion tons in 2007.83 In fact, United States wa-terways carried an equivalent of over 100 million truckloads of goods last year.84 However, much of the critical infrastructure for waterborne transportation is in dire need of repair. More than one-half of the locks and dams in the United States are over 50 years old.85
Inland waterways transport more than 60 percent of the Nation’s grain exports, about 22 percent of domes-tic petroleum products, and 20 percent of the coal used to generate electricity.86 In 2010, 566 million tons of
82 U.S. army CorpS of engineerS, inlanD waterway navigation: valUe to tHe nation, available at http://www.sas.usace.army.mil/Portals/61/docs/lakes/thurmond/navigate.pdf.83 aaSHto, waterborne freigHt tranSportation, at 3-1.84 Id.85 Budget Hearing – United States Army Corps of Engineers Before the H. Comm. on Appropriations Subcomm. on Energy and Water Dev., & Related Agencies, 113th Cong. 1 (2013) (statement of Am. Society of Civil Engineers).86 nat’l waterwayS foUnD., waterwayS: working for ameriCa 2 (2012), available at http://www.nationalwaterwaysfounda-tion.org/study/NWF_117900_2011WorkingForAmericaBrochure_FINAL_forWeb.pdf.
35Improving the Nation’s Freight Transportation System
waterborne cargo transited the inland waterways valued at more than $180 billion.87 Local public port districts areeconomicenginesforthecommunitiesinwhichtheyarelocatedandmostareself-sufficientandreceivenoproperty or other tax revenue.
It is estimated that without the barges and towboats operating on the inland waterways, the Nation would need 6.3 million railroad cars or 25 million trucks to haul the difference.88 The domestic maritime industry provides over $100 billion to the Nation’s economy in economic output, annually, and provides more than 33,000 jobs aboard its boats and barges alone.89
Transportinggoodsontheinlandwaterwaysystemalsohassignificantenvironmentalbenefits.Accordingto the Tennessee Valley Authority, “Because one barge can transport as much cargo as 15 rail cars or 60 trac-tor-trailers,waterwaytransportationbenefitstheenvironment.Itreducesfuelconsumptionandemissions,andmakes the roads safer by keeping more trucks off of the highways. River transportation has a direct impact on the prices consumers pay for the things they buy. Soft drinks, ice cream, baked goods and pancake syrup, for example, are all sweetened with high-fructose corn syrup made from grain grown in the Midwest.”90
Inland Waterways Trust Fund
The Inland Waterways Revenue Act of 1978 (26 U.S.C. 9506) and the Water Resources Development Act of1986(WRDA1986;26U.S.C.4042)createdtheinlandwaterwayfinancingmechanism.ThesetwoActsestablished a fuel tax on commercial barges, cost-sharing requirements for inland waterway projects, and the Inland Waterway Trust Fund (IWTF) to hold these revenues and fund these investments. The overall effect of thesechangeswasagreaterfinancialanddecision-makingresponsibilityforcommercialoperatorsontheinlandwaterways system.
WRDA 1986 authorized additional increases to the 1978 Act’s fuel tax and, pursuant to WRDA 1986, the fuel tax is $0.20 per gallon.91Thefueltaxhasnotbeenindexedforinflation.92 WRDA 1986 further stipulated that IWTF construction projects would be funded with 50 percent of the funds derived from the IWTF and the other 50 percent from the General Fund.
Under WRDA 1986, expenditures from the IWTF must be authorized by Congress and funded through appro-priations acts.93 WRDA 1986 also established the Inland Waterways User Board, a federal advisory committee, to provide commercial users an opportunity to inform the priorities for United States Army Corps of Engineers decision-making.
From 1986 to today, the balance in the IWTF has varied considerably. Beginning in 1992, balances increased, reaching their highest level in 2002 at $413 million.94 Beginning in 2005, expenditures began to outpace collec-tions and, concurrently, several projects far exceeded their original cost estimates and balances dropped sharp-ly.SignificantconcernshavebeenraisedastotheeconomicviabilityoftheIWTFunderthepresentfueltax87 Id.88 inlanD waterway navigation: valUe to tHe nation.89 tHe ameriCan waterwayS operatorS, JobS & eConomy: inDUStry faCtS (2013), available at http://www.americanwater-ways.com/initiatives/jobs-economy/industry-facts.90 tenneSSee valley aUtHority, eConomiC SignifiCanCe, available at http://www.tva.gov/river/navigation/economic.htm.91 Water Resources Development Act of 1986, Pub. L. No. 99–662, 100 Stat. 4082 (1986).92 Charles V. Stern, Inland Waterways: Recent Proposals and Issues for Congress, CongreSSional reSearCH ServiCe, Report No. R41430, May 3, 2013, at 9.93 Water Resources Development Act of 1986, Pub. L. No. 99–662, 100 Stat. 4082 (1986).94 Inland Waterways: Recent Proposals and Issues for Congress, at 10.

36Improving the Nation’s Freight Transportation System
approach. Different solvency proposals have been raised by the Administration and the Inland Waterways User Board.
Case Study: Moving Soybeans from Illinois and Iowa to China
To meet the demands of the soybean market in China, farmers in the Midwest have to coordinate their planting and harvest with the shipment of their crop across multiple modes of transportation. The story begins when the soybeansareharvestedinthefieldsofIowaandIllinois,usuallyinSeptemberorearlyOctober.ThesoybeansaremovedfromthefieldtoabargeloadingfacilityontheMississippiRiverbytrucksorrail.Thislegofthejourney typically takes one to four days. The soybeans are subsequently loaded onto river barges within one or two days of arriving at the loading facility, and are organized into tows. The journey by barge tow to the New Orleans, Louisiana area typically takes two weeks. The soybeans are then off-loaded to either short-term stor-age bins or directly onto ocean-going bulk carriers.
The transit to China begins after loading to the bulk carrier. Typically, the coordinated transit of the ship from loadingatNewOrleans,throughtransitofthePanamaCanaltocrossingofthePacifictakesapproximately30days. After arriving in China, the bulk carrier ship is unloaded and the soybeans are transported via truck or rail to distribution points across China.
The point of this case study is to illustrate the critical nature of coordination and communications in getting a product grown in the Midwest to a market in China. Due to the highly competitive market for soybeans, if the transport system in the United States breaks down or does not produce the desired transportation, the Chinese market will shift from buying Illinois and Iowa soybeans to buying Brazilian soybeans. A loss of two to four weeks in delivery to New Orleans could result in China making an economic decision that will impact the local farmers in the Midwest. An integrated process of moving bulk agricultural commodities is required to keep the economics of the system whole.
37Improving the Nation’s Freight Transportation System
air CarGo
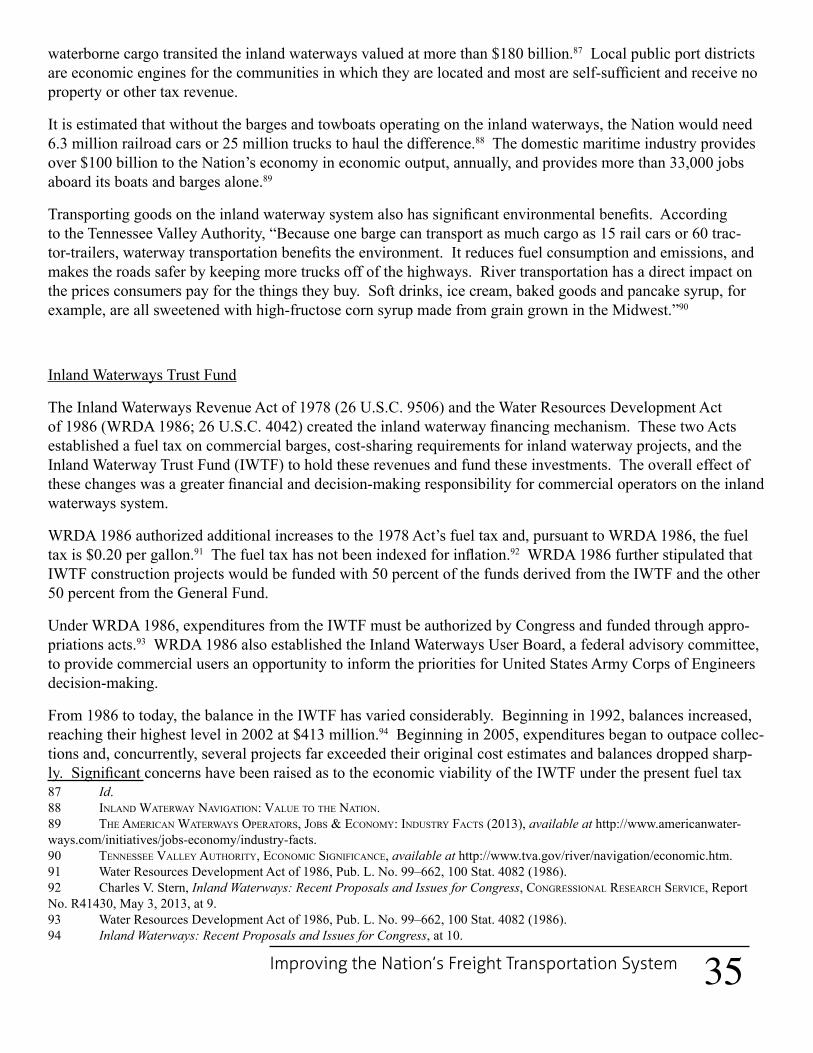
Air cargo carriers play a vital role in transporting goods both in domestic and international supply chains. Air carriers can move cargo quickly and often move goods of particularly high value. Furthermore, in some areas of the country, air freight is the only reliable means of delivering goods.
History of the Air Cargo System and the Airport and Airway Trust Fund
Aviation has played a key role in American transportation for more than 100 years. Aviation is often the fast-est way to move people and goods around the Nation and the world. Since the earliest days of commercial aviation, shippers have been moving goods via air. In World War II, the military needs of the American forces around the world encouraged many technological advances to the ability of aircraft to effectively move freight longdistances.Today,companieslikeFederalExpressandtheUnitedParcelServicemaintainextensivefleetsof cargo aircraft to move millions of parcels and packages around the world every night.
The Airport and Airway Trust Fund (AATF) was created by the Airport and Airway Development and Revenue Act of 1970 to provide dedicated funding for the Nation’s aviation system.95 Revenues are derived from avia-tion-related excise taxes on passengers, cargo, and fuel and in turn provide funding for capital improvements to United States airports. The AATF also provides the majority of funding for the Federal Aviation Administration (FAA),estimatedat71.5percentinfiscalyear2013.96 The FAA accounts funded include: Operations (fund-ed by the General Fund and AATF); Facilities and Equipment, Research, Engineering, and Development; and Grants-in-Aid for Airports. The AATF also funds the Essential Air Services (EAS) account for the Department of Transportation.
95 Airport and Airway Development and Revenue Act of 1970, Pub. L. No. 91-258 (1970).96 feDeral aviation aDminiStration, airport anD airway trUSt fUnD faCt SHeet 2 (2013).

38Improving the Nation’s Freight Transportation System
As established by the Airport and Airway Improvement Act of 1982, funds obligated for the Airport Improve-ment Program (AIP) are drawn from the AATF, which is supported entirely by user fees, fuel taxes, and other similar revenue sources.97 Some examples of these taxes and fees include: 7.5 percent domestic air passenger tickettax;$3.90domesticflightsegmenttax(upfrom$3.70);6.25percentcargowaybilltax;$17.20taxonbothinternationalarrivalsanddepartures(upfrom$16.30);7.5percentfrequentflyerawardtax;$8.60AlaskaandHawaii international air facilities tax (up from $8.20); 19.3 cents per gallon fuel tax for aviation gasoline; 21.8 cents per gallon fuel tax on general aviation jet fuel; 14.1 cents per gallon surcharge on fuel for aircraft used in fractional ownership program (new); and 4.3 cents per gallon fuel tax on commercial airlines.98 Combined with the revenue generated from interest on the Airport and Airway Trust Fund’s cash balance, these taxes and fees generatednearly$11.7billioninfiscalyear2011and$12.6billioninfiscalyear2012.99
Economic Impact of the Air Cargo System
Air freight is high value cargo. Less than three percent of total freight by weight ships by air, but this represents over $6.4 trillion worth of goods per year, which is nearly 35 percent of all freight value.100 Air cargo is trans-ported both in the bellies of passenger aircraft as well as in dedicated all-cargo aircraft on scheduled and non-scheduled service. Currently, there are 33 all-cargo carriers operating 840 cargo aircraft in the United States.101 In2012,aircargocarriersflewover36billionrevenuetonmiles(RTMs).102 Of these 36 billion RTMs, all-car-gocarrierscomprisedalmost80percentofthetotal,withpassengercarriersflyingtheremainder.103
There are four primary drivers to the air cargo industry—competition, connectivity, cost, and perishability.104 Thecompetitionbetweencarrierskeepstheprofitmarginandtheultimatecosttoconsumerslow.Thenumberof airports across the United States and the world ensure that shippers and consumers can move their goods via air freight. While more expensive than other modes of transportation, the cost of shipping a parcel via air is far fromprohibitive.Finally,shippersofperishableandtime-sensitiveproducts,suchaspharmaceuticals,flowers,or fruits and vegetables, require the air cargo industry, which can reliably deliver goods to market in hours.
Air cargo plays an important role in the quick delivery of goods domestically and internationally. Air cargo providesanefficientwaytotransfergoodsorcommoditiesfromoneplacetoanotherinashortperiodoftime.Due to the volume and price constraints of the air cargo industry, air freight specializes primarily in smaller goods and personal parcels.
97 Airport and Airway Improvement Act of 1982, Pub. L. No. 97-248 (1982).98 airport anD airway trUSt fUnD faCt SHeet, at 5.99 Id., at 6.100 How Logistics Facilitate an Efficient Freight Transportation System Before the H. Comm. on Transp. & Infrastructure Panel on 21st Century Freight Transp., 113th Cong. 1 (2013) (statement of Richard H. Fisher, Pres., Falcon Global Edge).101 feDeral aviation aDminiStration (faa), aeroSpaCe foreCaSt for fiSCal yearS 2013-2033 15 (2013), available at http://www.faa.gov/about/office_org/headquarters_offices/apl/aviation_forecasts/aerospace_forecasts/2013-2033/media/2013_Forecast.pdf.102 A revenue ton mile (RTM) is the movement of one ton of freight one mile for revenue.103 aeroSpaCe foreCaSt for fiSCal yearS 2013-2033, at 24.104 loS angeleS worlD airportS, air freigHt at loS angeleS worlD airportS (2013), distributed to Panel in May, 2013.

39Improving the Nation’s Freight Transportation System
wareHouses, distribution Centers, and tHe loGistiCs industry
Warehouse,distributioncenter,andlogisticsprovidersplayakeyroleinalleviatinginefficienciesandbottle-necks in the Nation’s freight system, which can impede mobility and drive up the cost of the impacted goods. By optimizing the movement of freight across all modes of transportation, this industry helps ensure the health of the United States economy and the future of the Nation’s global competitiveness.
History of the Logistics Industry
The warehouse, distribution center, and logistics industry adds value to the supply chain by improving the plan-ning,implementation,andcontroloftheflowofgoodsfrompointoforigintopointofconsumption.Today,nearly all of the Nation’s top executives have some form of logistics strategy. Every Fortune 100 company, and 80 percent of all Fortune 500 companies, employ at least one third-party logistics (3PL) provider to improve their operations.105 In 2011, domestic spending in the logistics and transportation industry totaled nearly $1.3 trillion, roughly 8.5 percent of the Nation’s gross domestic product.106 The growth of the logistics industry far outpaces that of the economy at large, further emphasizing the important value that logistics can have in facili-tatingtheefficientmovementofgoods.107
105 Joseph Bonney, 3PL Learning Curve, JoUrnal of CommerCe, Sept. 2011, at 4A.106 Dep’t of CommerCe, tHe logiStiCS & tranSp. inDUS. in tHe U.S., available at http://selectusa.commerce.gov/industry-snap-shots/logistics-and-transportation-industry-united-states.107 riCHarD armStrong, U.S. 3pl market growS 7%: oUtpaCeS eConomy, available at Http://www.3plogiStiCS.Com
40Improving the Nation’s Freight Transportation System
Third-party logistics providers are also known as freight forwarders or transportation intermediaries. Depend-ing on the industry in which a 3PL operates, the 3PL may also be known as a broker (if involved in the trucking industry), a Non Vessel Operating Common Carrier (if involved in the maritime industry), or an indirect air carrier (if involved in the air freight industry). Despite all of these different names, the essential function is the same. At its most basic level, a 3PL is an entity that facilitates the movement of goods.
One of the earliest 3PLs was the Company Limited of London, established in 1836 by Thomas Meadows.108 Meadows recognized the demand for these intermediary services as the rail transportation and steamship in-dustries expanded. As trade increased between Europe and North America, Company Limited arranged for the transportation of goods from manufacturers to the steamships.109 The logistics provided by Company Limited, however, soon expanded beyond the mere carriage of goods. Meadows realized the value that additional infor-mation could offer, and soon began consulting with his clients on documentation and customs requirements in the country of destination.110
Since Company Limited, 3PLs have traditionally operated as non-asset based companies that arranged for the transportation of a shipper’s goods with another company that owned and operated a common carrier.111 Today, many 3PLs also operate their own trucks, aircraft, warehouses, and distribution centers, in addition to offering the traditional logistical advice and analysis that is the hallmark of the industry.112
Economic Impact of the Logistics Industry
Logistics is the planning, execution, and control of a complex organization involving many different moving piecesandinterests,allwithinasystemdesignedtoachievespecificobjectives.AccordingtotheCouncilofSupply Chain Management Professionals, logistics management is the part of supply chain management “that plans,implements,andcontrolstheefficient,effectiveforwardandreverseflowandstorageofgoods,servicesand related information between the point of origin and the point of consumption in order to meet customers’ requirements.”113
Putsimply,thelogisticsindustryisvaluabletotheNation’sfreightsystembecauselogisticsimprovetheeffi-ciency of the supply chain. To name just a few real-world applications, the use of logistics can ascertain the best mode, or combination of modes, to move a particular product to a particular location, give a small carrier access to a large shipper’s freight, reduce the number of empty containers a trucking company has to carry, eliminate the need for operating distribution centers in-house, and maximize warehouse layout and productivity.
Another key service of the warehouse, distribution center, and logistics industry are value-added services that improvereceivedproductsbeforetheyarerepackagedandshippedtoafinaldestination.Productassembly,inspection, sequencing, re-packaging, and labeling are just some of the many services that the industry provides to add value to the products shipped throughout the world.114 By carefully collecting and analyzing data about 108 Thomas Meadows & Company, Understanding the Freight Business (London: The Company, 1978).109 Id.110 Id.111 tranSp. intermeDiarieS aSS’n (tia), aboUt tHe inDUS., available at http://www.tianet.org/AM/Template.cfm?Section=Edu-cation.112 Id.113 CoUnCil of SUpply CHain management profeSSionalS, SUpply CHain management, available at http://cscmp.org/about-us/supply-chain-management-definitions.114 How Logistics Facilitate an Efficient Freight Transportation System Before the H. Comm. on Transp. & Infrastructure Panel on 21st Century Freight Transp., 113th Cong. 1 (2013) (statement of Mark V. DeFabis, Pres. & CEO, Integrated Distribution Services, Inc.).
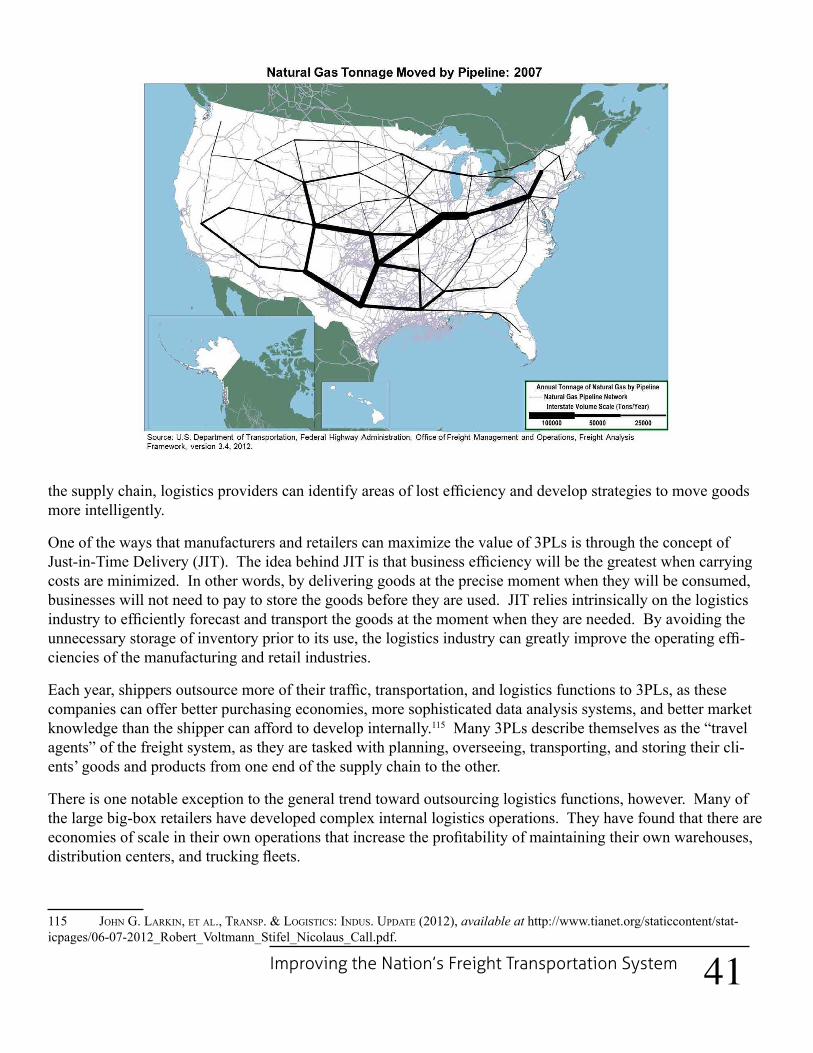
41Improving the Nation’s Freight Transportation System
thesupplychain,logisticsproviderscanidentifyareasoflostefficiencyanddevelopstrategiestomovegoodsmore intelligently.
One of the ways that manufacturers and retailers can maximize the value of 3PLs is through the concept of Just-in-TimeDelivery(JIT).TheideabehindJITisthatbusinessefficiencywillbethegreatestwhencarryingcosts are minimized. In other words, by delivering goods at the precise moment when they will be consumed, businesses will not need to pay to store the goods before they are used. JIT relies intrinsically on the logistics industrytoefficientlyforecastandtransportthegoodsatthemomentwhentheyareneeded.Byavoidingtheunnecessarystorageofinventorypriortoitsuse,thelogisticsindustrycangreatlyimprovetheoperatingeffi-ciencies of the manufacturing and retail industries.
Eachyear,shippersoutsourcemoreoftheirtraffic,transportation,andlogisticsfunctionsto3PLs,asthesecompanies can offer better purchasing economies, more sophisticated data analysis systems, and better market knowledge than the shipper can afford to develop internally.115 Many 3PLs describe themselves as the “travel agents” of the freight system, as they are tasked with planning, overseeing, transporting, and storing their cli-ents’ goods and products from one end of the supply chain to the other.
There is one notable exception to the general trend toward outsourcing logistics functions, however. Many of the large big-box retailers have developed complex internal logistics operations. They have found that there are economiesofscaleintheirownoperationsthatincreasetheprofitabilityofmaintainingtheirownwarehouses,distributioncenters,andtruckingfleets.
115 JoHn g. larkin, et al., tranSp. & logiStiCS: inDUS. UpDate (2012), available at http://www.tianet.org/staticcontent/stat-icpages/06-07-2012_Robert_Voltmann_Stifel_Nicolaus_Call.pdf.

42Improving the Nation’s Freight Transportation System

43Improving the Nation’s Freight Transportation System
PiPelines
Pipelinesprovideasafeandefficientmeansoftransportinglargequantitiesofenergycommoditiesfromwell-head to industry and consumers. Compared to other means of transportation, pipelines offer a capacity and volume advantage, emit few greenhouse gases, and offer an economical way to move energy products over long distances.
History of the Pipeline System
Pipelineshavebeenusedforthousandsofyears.Thefirstapplicationwastotransmitdrinkingwaterandforirrigation,but2,500yearsagoinChina,pipelineswereadaptedtotransportnaturalgas.Thisisthefirstknowninstance whereby a pipeline transmitted hydrocarbons.
In the United States, pipelines have been used since the late 1700s.116 Today, there are over 2,600,000 miles of pipelines in the United States—enough to circle the globe about 100 times. Most pipelines are owned by inde-pendent pipeline operators, not by oil and gas companies.117 Pipelines are jointly regulated by the Pipelines and Hazardous Materials Safety Administration (PHMSA) and the Federal Energy Regulatory Commission (FERC). PHMSA is responsible for ensuring that pipelines are safe, reliable, and environmentally sound and oversees pipeline construction, maintenance, and operation.118 FERC regulates approval, permitting, and siting for inter-state pipelines and sets rates on a pipeline-by-pipeline basis.119
Today, the term “pipelines” generally refers to all aspects of the physical infrastructure related to the transmis-sionofenergyproducts.Theseelementsincludethepipeandfittings,equipmentattachedtothepipes,suchasvalves, compressor units, pump stations, metering stations, and terminals or storage facilities, to name just a few.120
116 Dnv gl, HazarDoUS liqUiD anD natUral gaS tranSmiSSion pipelineS (2013), distributed to Panel in October, 2013.117 Id., at 13.118 Id., at 12.119 Id.120 Id., at 6.
44Improving the Nation’s Freight Transportation System
Economic Impact of the Pipeline System
Ten percent of the Nation’s freight movement, by tonnage, travels through pipelines.121 Natural gas provides almost 25 percent of the Nation’s total energy consumption, and petroleum provides approximately an addition-al 40 percent of energy consumption. Taken together, pipelines carry nearly two-thirds of the energy used in the United States.122 These commodities need to be transported quickly and safely, and pipelines move these prod-uctsefficientlyatahighvolume.PipelinesplayanimportantroleinensuringthattheNation’senergycom-moditiesaremovedquickly,safely,andefficiently,andinsodoing,pipelinessupporttheothermodesoffreighttransportation, as well.
121 freigHt faCtS anD figUreS report, at 9.122 HazarDoUS liqUiD anD natUral gaS tranSmiSSion pipelineS, at 5.
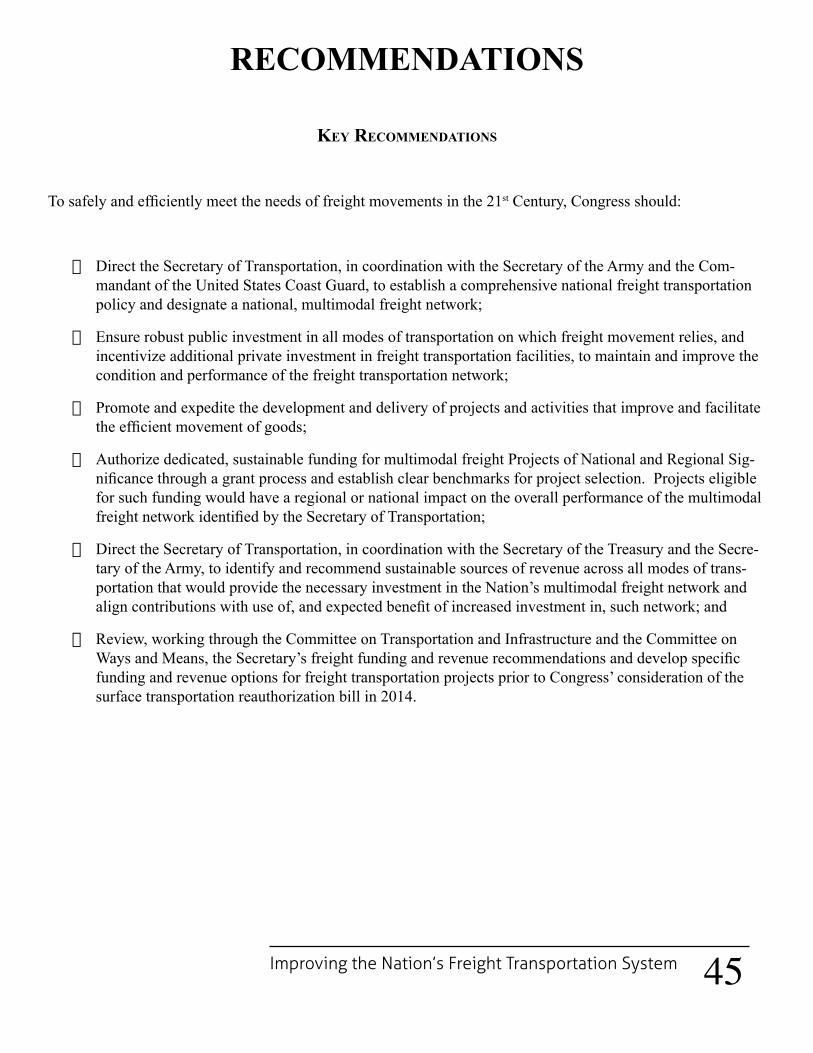
45Improving the Nation’s Freight Transportation System
reCommendations
key reCommendations
Tosafelyandefficientlymeettheneedsoffreightmovementsinthe21st Century, Congress should:
· Direct the Secretary of Transportation, in coordination with the Secretary of the Army and the Com-mandant of the United States Coast Guard, to establish a comprehensive national freight transportation policy and designate a national, multimodal freight network;
· Ensure robust public investment in all modes of transportation on which freight movement relies, and incentivize additional private investment in freight transportation facilities, to maintain and improve the condition and performance of the freight transportation network;
· Promote and expedite the development and delivery of projects and activities that improve and facilitate theefficientmovementofgoods;
· Authorize dedicated, sustainable funding for multimodal freight Projects of National and Regional Sig-nificancethroughagrantprocessandestablishclearbenchmarksforprojectselection.Projectseligiblefor such funding would have a regional or national impact on the overall performance of the multimodal freightnetworkidentifiedbytheSecretaryofTransportation;
· Direct the Secretary of Transportation, in coordination with the Secretary of the Treasury and the Secre-tary of the Army, to identify and recommend sustainable sources of revenue across all modes of trans-portation that would provide the necessary investment in the Nation’s multimodal freight network and aligncontributionswithuseof,andexpectedbenefitofincreasedinvestmentin,suchnetwork;and
· Review, working through the Committee on Transportation and Infrastructure and the Committee on WaysandMeans,theSecretary’sfreightfundingandrevenuerecommendationsanddevelopspecificfunding and revenue options for freight transportation projects prior to Congress’ consideration of the surface transportation reauthorization bill in 2014.


47Improving the Nation’s Freight Transportation System
fundinG and finanCinG investments
The United States is at a crossroads. Study after study has indicated that the Nation’s infrastructure is crum-bling.ThisdeteriorationintheconditionoftheNation’sroadwaypavementsandbridgescanaffecttheefficien-cy of goods movement and increase costs associated with freight transportation. Without an increased public and private sector investment in the most critical freight infrastructure facilities, the Nation’s long-term econom-ic and business competitiveness will suffer.
While a strong freight transportation network is critical to the Nation’s long-term competitiveness, it is well documentedthatinfrastructureinvestmentatalllevelsofgovernmentisinsufficienttokeepupwithoperation,maintenance, and capital needs of existing facilities, let alone make investments in critically needed new facili-ties. Moreover, there is no dedicated source of federal revenue for important multimodal freight projects.
Despitethiswelldocumentedneedforadditionalinfrastructureinvestment,theCongressionalBudgetOfficeprojections show that the primary source of federal funding for surface transportation investment –– the High-wayTrustFund––willrunoutofmoneyearlyinfiscalyear2015.Thiswillrequireadditionalrevenuebeidentifiedtoensurethatstateandlocalpartnershavetheresourcesnecessarytomaintainexistingfacilities.
It is important to note that throughout the Panel’s deliberations, many of the users of the transportation network — such as truckers, barge operators, manufacturers, and business owners — have expressed a willingness to contribute more to the system, as long as their investment will be used to maintain and upgrade the facilities on which their livelihoods rely.
Surface Transportation Commissions
Congress established the National Surface Transportation Policy and Revenue Study Commission (Policy Com-mission)intheSafe,Accountable,Flexible,EfficientTransportationEquityAct:ALegacyforUsers(SAFE-TEA-LU), and charged it with forecasting the surface transportation system necessary to support our economy 50 years in the future. The Policy Commission report was issued in January 2008.
The Policy Commission report:
· Identifiedasignificantsurfacetransportationinvestmentgapandcalledforanannualinvestmentlevelof between $225 billion and $340 billion––by all levels of government and the private sector––over the next 50 years to upgrade all modes of surface transportation (highways, bridges, public transit, freight rail and intercity passenger rail) to a state of good repair. The current annual capital investment from all government sources in road and bridge infrastructure is $182 billion.
· Proposed that the federal fuel taxes be raised by between 25 cents and 40 cents per gallon to address the funding gap and the rate increase be indexed to the construction cost index and phased in over a period of years.
· Found that the fuel tax would continue to be a viable revenue source for surface transportation at least through 2025. Thereafter, the most promising alternative user fee revenue measure appears to be a

48Improving the Nation’s Freight Transportation System
vehicle miles traveled (VMT) fee, provided that substantial privacy and collection cost issues can be addressed.
· Called for other user-based fees to be utilized to assist in addressing the shortfall, such as container fees for freight projects and ticket taxes for passenger rail improvements.
· Called for tax policy changes to incentivize expansion of intermodal networks.
· Proposed the expanded use of “congestion pricing” on Federal-aid highways in major metropolitan areas be utilized under conditions that protect the public interest, and restricted the use of revenues generated through congestion pricing to transportation purposes in the travel corridors where the fees are imposed.
· Stipulated that public-private partnerships should be encouraged to attract additional private investment to the surface transportation system, provided that conditions are included to protect the public interest and the movement of interstate commerce.
SAFETEA-LU also created the National Surface Transportation Infrastructure Financing Commission (Financ-ing Commission). The Financing Commission was charged with analyzing future highway and transit needs andthefinancesoftheHighwayTrustFundandmakingrecommendationsregardingalternativeapproachestofinancingtransportationinfrastructure.TheFinancingCommission’sreportwasissuedinFebruary2009.
The Financing Commission report:
· Found an annual surface transportation investment gap of between $46 billion to $64 billion between 2008 and 2035.
· Concluded that, while there were concerns with the long-term viability of the gas tax, in the near term:
o Thegastaxshouldbeincreasedby10centspergallon,andindexedtoinflation;
o Thedieseltaxshouldbeincreased15centspergallon,andindexedtoinflation;
o Heavy Vehicle Use Tax (HVUT), which has not been increased since 1983, should be doubled and indexed; and
o Trucktiresexcisetaxshouldbeindexedtoinflation.
· Calledforaswitchtoamoredirectformof“userpay”chargesoverthelong-term,specificallycallingfor the transition to a VMT fee system. Recognizing that the system is not viable in the near term, the report recommended that the transition to such a system be targeted for completion by 2020.
· Recognizedtheimportantroleinnovativefinancingapproaches,suchaspublic-privatepartnershipsandgovernmentfinancialprograms,canplayasasupplementarysourceoffinancing.However,foundthatthesetypesoffinancinginstrumentsareheavilydependentonnewrevenuesourcesthatcanbeleveragedto repay upfront capital investments.

49Improving the Nation’s Freight Transportation System
The Financing Commission report also notes, with regard to proposed National Infrastructure Banks, that any such entity should be structured in a manner that addresses actual funding and credit market gaps and should targetassistancetoprojectsthatareessentialtothenationalnetworkbutthatlackaccesstosufficientresourcesthrough existing programs. The report urges Congress to ensure that any such entity is appropriately integrated with or a logical extension of current programs, especially the Transportation Infrastructure Finance and Inno-vation Act (TIFIA) program. The Financing Commission warns that the potential role of a new infrastructure financingentityshouldbeexaminedinthecontextoflong-termfundingneedsandnotonlyasanimmediateresponse to the current disruption in the credit markets.
Freight-Based Financing Options
The reports from the Financing Commission and the Policy Commission discussed potential freight-related chargesthatcouldbeinstitutedinthefuture.Belowisasummarythefindingsonfouroptionstogeneratereve-nue to pay for freight-related projects—customs duties and fees, a freight waybill tax, a weight-distance tax, and a container tax.
The Financing Commission evaluated the advantages and disadvantages of each option based on its reve-nue-raisingpotential,sustainability,andflexibility;implementationandadministrationconsiderations;econom-icefficiencyandimpact;equity;andapplicabilitytootherlevelsofgovernment.
Customs Duties and Fees—The Financing Commission found that a portion of the revenues from existing customs duties potentially could be dedicated to transportation infrastructure tied to the movement of those goods—effectively a transfer from the General Fund. While customs duties and fees would be reasonable for a small, dedicated intermodal fund, the large gaps in coverage make it a poor broad-based funding method.
· Allocating a portion of existing customs duties would require no major administrative effort or ex-pansion of legal authority. Alternatively, a transportation use surcharge could be added to the existing customs duty and fee schedule and dedicated to freight transportation infrastructure.
· The Financing Commission found that imposition of a 3.5 percent transportation surcharge would pro-vide approximately $1 billion annually. An increase in the Customs Merchandise Processing Fee by 70 percent would also yield $1 billion annually.
· However, increasing revenues from customs duties and fees may not be consistent with international rules governing trade. Additionally, these fees do not reach the United States exporters who generate much of the local highway use around the port.
· An infrastructure customs fee could be structured to relate to system use (e.g., fee revenues could be dedicatedtoinfrastructureneedsatthepointtheyarecollected)andcouldhavethebenefitofaddress-ing border infrastructure needs that arise from both homeland security and transportation infrastructure requirements that create chokepoints.
Freight Waybill Tax—A freight waybill tax would serve as a sales tax on the shipping costs for freight. Such a tax could be modeled on the aviation system tax, in which passenger and freight users who rely on the same

50Improving the Nation’s Freight Transportation System
infrastructureandcarriersallcontributetofundthesystem.Theair-freightwaybilltaxcurrentlyprovidesfivepercent of contributions to the federal Airport and Airway Trust Fund.
· Asmallpercentagetaxratecouldraisesignificantrevenueswithstrongsustainability.A0.1percenttaxon all truck freight waybills would raise about $620 million annually; thus a 0.16 percent rate would raise $1 billion per year.
· A freight waybill tax would be expensive to administer due to the high number of taxpayers and the as-sociatedfiling,auditing,andenforcementrequirements.Inaddition,thewaybillistypicallypaidbythereceiverofgoods;however,insomecasesitispaidbythebenefitingcargoowneroutsideoftheUnitedStates Thus, determining how and from whom to collect the tax could be complex.
· Privatefleets(e.g.,Wal-MartandGeorgia-Pacific)wouldnotbeassessedthefeeunlesswaybill-likecosts were estimated and imputed to the private company.
· Such a tax would be an indirect user fee, but with less connection to use than the current motor fuel tax (afreightwaybilltaxgenerallyreflectsdistancebutmoreheavilyequatestothevalueofthefreight).
· While a freight waybill tax would be reasonably equitable, the tax would be related to transportation costs and not system use. In addition, without the implementation of an imputed waybill on captive shippers, the tax would miss as much as one-half of the goods movement industry.
· TheCommissionfoundthattheprocessofresolvingthisgapcreatessignificantimplementationandadministration costs and would be subject to evasion.
Weight-Distance Tax—Weight-distancetaxesarefeesimposedonthemilestraveledbyspecificvehicleclasses, which take into account the weight and load of a vehicle and essentially impose a premium on heavier vehicles to recover the added wear and tear they cause to the system. This tax can be based on a combination of the actual weight being carried for each trip and the number of miles traveled, on the weight of the truck and the number of axles, or on the average vehicle weight plus load weights. Currently, Oregon, Kentucky, New Mexi-co, and New York use state-based variations of the weight-mile tax in combination with a fuel tax (Oregon does not charge a fuel tax for commercial trucks).
· The administrative costs of a weight-distance tax can be high. However, Oregon’s tax rates are based on the average weight carried by a vehicle of each class, and, thus, trucking companies only need to keep track of mileage rather than mileage and weight.
· Evasion has been an issue for states with weight-distance taxes (though if states moved to a high-tech system such as Oregon plans to implement, that would cut down on evasion).
· Weight and weight-mile taxes closely correlate system use and costs, including the costs that freight trucks impose on highways. However, these taxes do little to promote targeted investment at key points ofthesystemaffectingefficiency(likebottlenecks).Therefore,theCommissionfoundsuchataxwouldbe better suited as a funding source for system-wide maintenance.
· Both a weight-only and a weight-distance tax would place a larger tax burden on low-value/high-weight commodities.

51Improving the Nation’s Freight Transportation System
Container Tax—A per container fee could be collected at port gates or via a toll collection system in the imme-diate vicinity of a port and dedicated to an intermodal investment fund. The Port of Long Beach charged con-tainer fees to fund the Alameda Corridor project.
· The complexity of actual collection of a national container tax would depend on how the fee is applied. The Commission cautions that duplicative container fees at individual ports coupled with a national fee would be administratively burdensome for shippers and pre-emption of states’ ability to impose their own container charge would be problematic as local fees are used to help states fund relief of port con-gestion.
· A container fee potentially could miss movements at inland waterways and at cross-border or other ports of entry, and it could possibly not account for non-containerized freight movements like bulk cargo. Such a tax could also disadvantage United States ports in competition with those in Mexico and Canada.
· A container tax would be imposed generally on shippers and would not account for non-containerized movements suck as bulk shipments of commodities or large pieces of equipment like tractors or wind-mill blades.
· The Commission found that while the container tax is a possibility for funding intermodal projects, its limited coverage makes it a weak option for large-scale funding needs.
Trust Funds
Congress has created four trust funds that collect user fees and disburse revenue for transportation infrastruc-ture, including projects key to freight mobility.
Highway Trust Fund—The Federal-Aid Highway Act of 1956 established the Highway Trust Fund (HTF). The revenues capitalizing the Highway Trust Fund are collected primarily from users of the highway system through federal taxes on fuels and various taxes on trucks.
Since enactment of this legislation, funding from the Highway Trust Fund has been provided to states via formula for the planning and construction of key highway projects that enable the movement of freight. Most highway-related freight projects, as well as some freight rail and freight intermodal projects, are currently eligi-ble to receive funding under one or more existing federal surface transportation programs. Many large freight projects, however, are multimodal in scope, and some aspects of these projects may be ineligible for funding from the HTF. This puts project sponsors in the position of having to cobble together funding for large multi-modal freight projects from a variety of different sources.
TheHTFisalsofacingasignificantrevenueshortfall,raisingquestionsabouttheabilityoftheHTFtosus-taincurrentinvestmentlevels.Inrecentyears,outlaysfromtheHTFhavebeensignificantlygreaterthantheamountofrevenuescollectedinhighwayuserfeerevenues.Asaresult,betweenfiscalyear2008andfiscalyear 2014, Congress has transferred approximately $54 billion from the General Fund to maintain the solvency oftheHTF.ThisHTFsolvencyissueisexpectedtocontinue,withtheCongressionalBudgetOfficeprojectingthattheHTFwillfaceacashdeficitof$132billionoverfiscalyear2012tofiscalyear2023.

52Improving the Nation’s Freight Transportation System
Harbor Maintenance Trust Fund––The harbor maintenance tax (HMT) is an existing revenue mechanism that supports the federal Harbor Maintenance Trust Fund (HMTF) through an ad valorem tax on the value of pas-senger tickets and declared commercial cargo loaded onto or unloaded from vessels using federally maintained harbors. The HMT is assessed at a rate of 0.125 percent of cargo value ($1.25 per $1,000 in cargo value). The HMT could be increased and dedicated to an intermodal investment fund (or existing revenues from the tax could be redirected to such a fund). In recent years, HMTF annual expenditures appropriated for harbor mainte-nancehaveremainedrelativelyflat.
· While increasing the HMT would not require major administrative effort or expansion of legal authority, the portion of the tax imposed on imports could create issues with international rules governing trade (similar to issues associated with increasing customs duties and fees). Additionally, the HMT does not reach the United States exporters who generate much of the local highway use around ports.
· An HMT increase could be structured to relate to system use if the proceeds were dedicated to infra-structure needs at or near ports of entry, particularly seaports. In this case, there would be relatively high geographic equity and a reasonable level of user equity if funding were spent on infrastructure to support ports.
Inland Waterways Trust Fund—The Inland Waterways Trust Fund (IWTF) is capitalized by a fuel tax on commercial barges and cost-sharing requirements for inland waterway projects. From 1986 to today, the bal-ance in the IWTF has varied considerably. Beginning in 1992, balances increased reaching their highest level in 2002 at $413 million. Beginning in 2005, expenditures began to outpace collections and concurrently several projectsfarexceededtheiroriginalcostestimatesandbalancesdroppedsharply.Significantconcernshavebeenraised as to the economic viability of the IWTF under the present fuel tax approach.
Airport and Airway Trust Fund—The Airport and Airway Trust Fund (AATF) provides dedicated funding for the Nation’s aviation system, including air freight functions. Revenues are derived from aviation-related ex-cise taxes on passengers, cargo, and fuel and in turn provide funding for capital improvements to United States airports.
Transportation Investment Generating Economic Recovery (TIGER) and Projects of National and Regional Significance(PNRS)
The Transportation Investment Generating Economic Recovery (TIGER) discretionary grant program is funded through the General Fund of the Treasury and administered by the Department of Transportation (DOT). The TIGER program was originally created as part of the American Recovery and Reinvestment Act of 2009 and is a competitive grant program whereby DOT distributes appropriated funds for transportation infrastructure proj-ects around the Nation. The TIGER program has been funded every year since its inception in 2009.
Under DOT’s TIGER grants, many freight projects have successfully received funding. However, due to the demand and structural limitations of the TIGER program as well as the large expense of many key freight trans-portationfacilities,thedollaramountofeachgrantunderTIGERisgenerallyinsufficienttofund
53Improving the Nation’s Freight Transportation System
individualfreightprojectsinsignificantmeasure.Assuch,theTIGERprogramishelpfulinbringingfreightprojectsonline,butwithoutadditionalresourcesisinsufficientasameansoffundingforsuchfacilities,inandof itself.
SimilarinmanywaystotheTIGERprogramistheProjectsofNationalandRegionalSignificance(PNRS)pro-gram authorized by Congress in SAFETEA-LU and reauthorized in the Moving Ahead for Progress in the 21st Century Act (MAP-21). This program provides competitive grant funding for high-cost surface transportation projectsthatprovidesignificantnationalandregionaleconomicbenefitsandincreaseglobalcompetitiveness.MAP-21authorized$500millionforthePNRSprogramfromtheGeneralFundforfiscalyear2013.Assuch,the PNRS program is subject to annual appropriations and has not yet received funding.
Transportation Infrastructure Finance and Innovation Act (TIFIA)
Another tool that project sponsors have in funding large-scale infrastructure projects is the Transportation InfrastructureFinanceandInnovationAct(TIFIA)program,whichiscapitalizedat$1billioninfiscalyear2014. The TIFIA program provides federal credit assistance to project sponsors through low interest-rate loans. Through participation in the TIFIA program, federal funds can be leveraged to provide greater purchasing pow-er for large transportation facilities.
Railroad Rehabilitation & Improvement Financing (RRIF)
The Railroad Rehabilitation & Improvement Financing (RRIF) program was originally established by the Trans-portation Equity Act for the 21st Century (TEA-21), and later amended by SAFETEA-LU. Under this program, the Federal Railroad Administration is authorized to provide direct loans and loan guarantees up to $35 billion tofinancedevelopmentofrailroadinfrastructure.Thefundingmaybeusedto(1)acquire,improve,orrehabil-itate intermodal or rail equipment or facilities, including track, components of track, bridges, yards, buildings andshops;(2)refinanceoutstandingdebtincurredforacquisition,improvement,orrehabilitationofrailequip-ment or facilities; and (3) develop or establish new intermodal or railroad facilities. Eligible applicants include railroads, state and local governments, government-sponsored authorities and corporations, joint ventures that include at least one railroad, and limited option freight shippers who intend to construct a new rail connection. Direct loans can fund up to 100 percent of a railroad project with repayment periods of up to 35 years and inter-est rates equal to the federal government’s cost of borrowing.
State Transportation Funding Packages
Many states are also faced with inadequate funding to address their transportation needs. As a result, states such as Virginia, Maryland, Wyoming, Arkansas, and Vermont have recently passed measures to increase state reve-nue for transportation projects.
For instance, in May 2013, Virginia Governor Bob McDonnell signed a statewide transportation funding plan that he had worked with the state legislature to develop. The proposal, HB 2313, “Virginia’s Road to the Fu-ture”, raises revenue through a variety of sources including: eliminating the excise taxes on gasoline and diesel and replacing them with sales taxes on gasoline and diesel; increasing the state sales tax; and imposing a fee on alternative fuel vehicles. The plan is expected to provide approximately $6 billion in additional transportation
54Improving the Nation’s Freight Transportation System
funding (more than $3.4 billion in additional statewide transportation funding, more than $1.5 billion in addi-tional funding for Northern Virginia, and more than $1 billion in additional funding for Hampton Roads) over thenextfiveyears.
Public-Private Partnerships (PPPs)
In addition to the public grant funding, individual states have begun using public-private partnerships (PPPs) to stretch governmental contributions to large freight transportation projects. A recent PPP at the Port of Baltimore provides a prime example of a freight transportation facility that was brought online as a result of cooperative planning and development between private industry and governmental entities.
In January 2010, the Maryland Port Administration and a private port operator entered a 50-year lease and concession agreement for the Seagirt Marine Terminal at the Port of Baltimore. Under the agreement, the port operator is responsible for daily operations and the construction of a new 50-foot berth, including four ship-to-shore cranes. The port operator will also make hundreds of millions of dollars of capital improvements to the terminal. After making an annual payment to the Maryland Port Authority, the port operator will receive the net revenues from the business developed by the expanded terminal facility.
Tosafelyandefficientlymeettheneedsoffreightmovementsinthe21st Century, Congress should:
· Ensure robust public investment in all modes of transportation on which freight move-ment relies, and incentivize additional private investment in freight transportation facili-ties, to maintain and improve the condition and performance of the freight transportation network.
· Direct the Secretary of Transportation, in coordination with the Secretary of the Treasury and the Secretary of the Army, to identify and recommend sustainable sources of revenue across all modes of transportation that would provide the necessary investment in the Nation’s multimodal freight network and align contributions with use of, and expected benefitofincreasedinvestmentin,suchnetwork.
· Review, working through the Committee on Transportation and Infrastructure and the Committee on Ways and Means, the Secretary’s freight funding and revenue recommen-dationsanddevelopspecificfundingandrevenueoptionsforfreighttransportationproj-ects prior to Congress’ consideration of the surface transportation reauthorization bill in 2014.
· Authorize dedicated, sustainable funding for multimodal freight Projects of National and RegionalSignificancethroughagrantprocessandestablishclearbenchmarksforprojectselection. Projects eligible for such funding would have a regional or national impact on theoverallperformanceofthemultimodalfreightnetworkidentifiedbytheSecretaryofTransportation.
· Encouragepublic-privatepartnershipsandtheuseofinnovativefinancingforfreightproj-ects.

55Improving the Nation’s Freight Transportation System
PlanninG and ProjeCt delivery
Planning and project delivery are key to any functioning transportation system. Many governmental and non-governmental entities are involved in this process. When it comes to the planning and delivery of large freight projects with regional or national importance, this process becomes more complicated and important becauseitcaninvolvemultiplejurisdictionsandrequiresignificantcoordinationamongvariousentities.
Transportation Planning Process
Generally, state departments of transportation, metropolitan planning organizations (MPOs), and rural planning commissions work together to create a statewide transportation improvement plan (STIP) listing all of the sur-face transportation projects that are eligible for funding. In addition to the STIP, these organizations may also work together to create a long-range transportation improvement plan with proposals for future consideration.
The Moving Ahead for Progress in the 21st Century Act created a new apportionment for metropolitan plan-ning. Prior to MAP-21, metropolitan planning activities were funded as a set-aside from the formula programs. Under MAP-21, states are required to use funds under this program for statewide and nonmetropolitan trans-portation planning activities and are required to make funds available to MPOs for metropolitan transportation planning activities. The amount of funds allocated to each MPO within a state is determined by a number of factors, including population, air quality, status of transportation planning, and transportation needs of the met-ropolitan area.
Planning Freight Projects
While the general transportation planning process is the same for projects that directly impact freight movement andthosethatdonot,freightprojectsoftenhavedifficultycompetingwithotherprojects.Thereareanumberofpossiblereasonsforthisdifficulty,includingdifficultyaccountingforthepublicbenefitsoftheseprojectsandconcernsoverprovidingfundingfromonejurisdictionforprojectsthatmayprimarilybenefitanotherjuris-diction. Large freight projects often add additional layers of complexity. Many freight projects are located in urban areas, and city governments or port authorities often take a leading role in developing plans for these proj-ects. Furthermore, freight projects often cross state boundaries, implicating multiple state departments of trans-portation and MPOs. Given that planning bodies are responsible for focusing on the needs and issues of their specificjurisdiction,planningforandadvancingmulti-jurisdictionalprojectsrequiressignificantcoordination.
Project Delivery
The environmental review process required under the National Environmental Policy Act (NEPA) is designed to bring all the relevant interested parties into the process so that their concerns will be considered adequately throughout the review. The process applies to projects being advanced with environmental impact statements, and can be applied, at the discretion of the Secretary of Transportation, to projects being advanced with other environmentaldocuments.Astheleadagency,DOTisresponsiblefordefiningtheproject’spurposeandneed,

56Improving the Nation’s Freight Transportation System
after public comments and interagency participation. DOT is also responsible for developing a range of alterna-tives to be considered for the project.
Completing a major highway project can take 15 years, but only a fraction of that time involves actual construc-tion. MAP-21 streamlined this review process for highway projects by requiring the Secretary to set deadlines to make sure all environmental approvals occur within four years, by providing categorical exclusions to the environmentalreviewprocessforcertainprojectsthatmeetspecificcriteria,andbyrequiringtheComptrollerGeneral to conduct a study on which state laws and procedures provide the same level of environmental protec-tion as Federal law. This process does not apply to other modes of transportation.
Case Study: CREATE Project
Chicago is the largest freight rail hub in North America. Today, six of the seven Class I railroads converge in theregion,accountingforthemovementofapproximatelyonequarterofallUnitedStatesfreightrailtrafficandone-halfofallUnitedStatesintermodalrailtraffic.Chicago’santiquatedrailinfrastructurehasledittobecomethe largest United States freight rail chokepoint.
To help mitigate the rail-related congestion in the Chicago region and meet the future demand for freight rail serviceacrossthecountry,theChicagoRegionEnvironmentalandTransportationEfficiencyProgram(CRE-ATE) was created ten years ago as a public-private partnership between the Chicago Department of Transpor-tation, Illinois Department of Transportation, freight railroads, United States Department of Transportation, Metra, and Amtrak to help mitigate the rail-related congestion in the Chicago region. CREATE consists of 70 individual projects including 25 highway-rail grade separations, six passenger-freight rail grade separations, rail infrastructure improvements, technology upgrades, viaduct improvements, grade crossing safety enhancements, and signalization.
As of May 2013, there were 17 projects completed, 11 projects under construction, 21 projects in design and environmental review, and 21 projects yet to begin. To date, over $1.2 billion has been committed to CREATE, but the total estimated cost for completion is $3.3 billion. When complete, CREATE will enhance passen-ger rail service, reduce motorist delays, increase public safety, improve air quality, create and retain jobs, and strengthen economic competitiveness. CREATE demonstrates how many organizations and interest groups can cometogethertoeffectivelyplanandfundalargefreightprojectthatwillimprovetheefficiency,safety,andperformance of the freight system in the region and across the Nation.
57Improving the Nation’s Freight Transportation System
Tosafelyandefficientlymeettheneedsoffreightmovementsinthe21st Century, Congress should:
· Direct the Secretary of Transportation, in coordination with the Secretary of the Army and the Commandant of the United States Coast Guard, to establish a comprehensive national freight transportation policy and designate a national, multimodal freight network.
· Prioritize solutions to modernize infrastructure and utilize technology to reduce conges-tiontoimprovetheflowoffreight.
· Require metropolitan and statewide planning agencies to consider the supply chain, freight movement, and regional and national freight priorities when setting short- and long-range goals and when developing transportation improvement plans.
· Require metropolitan and statewide planning agencies to solicit the participation of freight industry professionals and affected communities when setting short- and long-range goals and when developing transportation improvement plans.
· Require the Secretary of Transportation to identify corridor-based solutions to freight mo-bility, taking into account the Nation’s entire transportation network.
· Require critical freight infrastructure owners and operators to develop cyber vulnerability assessmentsandcyberincidentresponseplans,aspartofexistingsector-specificsecurityassessments and plans required by the Department of Homeland Security. For ports, these assessments should be done as part of the assessments required under 46 U.S.C. 70102, and these plans should be done as part of the plans required under 46 U.S.C. 70103.
· Establish policies and set benchmarks to accelerate the transition from project develop-ment to construction for freight projects.
· Identify and encourage the use of low-cost measures to alleviate highway congestion.
· Direct the Secretary of Transportation to promulgate the rulemaking required under 23 U.S.C. 150(c), establishing performance measures by which States can assess the quality of freight movement on the Interstate System.
· Direct the Secretary of Transportation to identify performance goals and performance measures by which States can assess the quality of freight movement across all modes of transportation.
· Cut red tape and encourage the Secretary of Transportation to streamline project delivery across all modes of transportation.

59Improving the Nation’s Freight Transportation System
HigHways and Trucking
As discussed above, the Highway Trust Fund faces pending insolvency. Without new revenue, the Trust Fund will be unable to provide states with necessary resources to maintain and improve the Federal-aid Highway System.Theconditionofroadwaypavementsandbridgescanaffecttheefficiencyofgoodsmovementandincrease costs associated with freight transportation. Highways are key to the Nation’s freight network, because almost all consumer goods travel on the highway system for some portion of the journey.
Section 1115 of MAP-21 required the Secretary of Transportation to designate a primary highway freight net-work of 27,000 centerline miles. The purpose of this network is to identify the infrastructure facilities that are most important to the movement of freight on the Nation’s highways. Final designation of the primary freight network is due imminently.
Tosafelyandefficientlymeettheneedsoffreightmovementsinthe21st Century, Congress should:
· Ensure that states have the resources necessary to maintain and improve freight movement on Federal-aid Highways by addressing the looming shortfall in the Highway Trust Fund with sustainable revenue.
· Encourage the Secretary of Transportation to complete the Comprehensive Truck Size and Weight Limits Study conducted in accordance with section 32801 of the Moving Ahead for Progress in the 21st Century Act as thoroughly and judiciously as possible.
· DirecttheSecretaryofTransportationtodeterminewhetherthedefinitionoftheprimaryhighwayfreightnetworkpursuantto23U.S.C.167issufficienttoaddressthenationalhighway freight network.
· Encourage states, localities, and the private sector to designate resources for commercial driver training to be made available to all organizations that provide such training.


61Improving the Nation’s Freight Transportation System
freiGHt rail
Freightrailprovidesefficientlong-haulandshort-haulserviceandintegratescloselywiththetruckingindus-try. Because the freight railroads are private entities, they own the infrastructure over which they operate, meaning they also invest heavily in those networks. In 2011, the freight railroads invested over $23 billion in capital expenditures to improve and expand their networks. The RRIF loan program is a vehicle that the federal government can use to leverage this private investment and deliver projects that are key for intermodal freight mobility.
Positive Train Control (PTC) refers to the technologies designed to stop or slow a train automatically before certain accidents that are caused by human error can occur. PTC is statutorily required to be installed by the end of 2015 for certain routes. For a variety of reasons, PTC is an unprecedented technology challenge. Freight railroads have already invested billions of dollars to meet this deadline, but there are many technological and non-technological barriers that remain.
Tosafelyandefficientlymeettheneedsoffreightmovementsinthe21st Century, Congress should:
· Encourage adequate investment in rail corridor projects that facilitate freight movement.
· Direct the Secretary of Transportation to conduct stronger outreach to freight railroads aboutthepotentialbenefitsoftheRailroadRehabilitationandImprovementFinancing(RRIF) loan program, and improve the process for approving applications.
· Work with the Secretary of Transportation, freight and passenger railroads, commuter rail-roads, railroad employee representatives, and other interested parties to evaluate proposals to extend the deadline for installation of Positive Train Control regulations, mandated pursuant to the Rail Safety Improvement Act of 2008 (P.L. 110-432).

63Improving the Nation’s Freight Transportation System
sHiPPinG and Ports
As discussed above, the Harbor Maintenance Trust Fund maintains a positive balance, yet there is still a large backlog of maritime infrastructure projects that need to be completed. Wisely utilizing existing revenues is the firststeptowardimprovingtheefficiencyandreliabilityofthiscriticalaspectoftheNation’sfreightsystem.
Tosafelyandefficientlymeettheneedsoffreightmovementsinthe21st Century, Congress should:
· Appropriate funds annually from the Harbor Maintenance Trust Fund in an amount equal to the revenue collected by the Trust Fund.
· Draw down the $7 billion balance of the Harbor Maintenance Trust Fund, without ad-versely affecting appropriations for other programs, projects, and activities carried out by the Corps of Engineers for other authorized purposes.
· Expand eligible uses of Harbor Maintenance Trust Fund expenditures to include other activities in the water that are adjacent to navigation channels.
· Direct the Secretary of the Army, in consultation with the Secretary of Transportation and the Commandant of the United States Coast Guard, to prioritize maritime development projects, including port deepening projects, in the Corps of Engineer’s annual budget submission.
· Encourage the full utilization of marine highways to expand the capacity of the freight transportation network, alleviate surface transportation congestion, and ensure the reliable movement of freight via short sea shipping.
· Direct the Secretary of Transportation, in coordination with the Secretary of the Treasury and the Secretary of the Army, to study the degree to which shippers, seeking to avoid payment of the Harbor Maintenance Tax, divert cargo bound for the United States from the Nation’s ports. This study should expand upon the July 2012 study conducted by the Federal Maritime Commission.
· Encourageportsandintermodalfacilitiestomaximizeefficiencythroughoff-peakcargomovement.
· Encourage, coordinate, and support navigation technology research, development, and investmenttoimprovenavigationsafetyandefficiencyandreducetheriskofaccidentsand disruption of the freight network.


65Improving the Nation’s Freight Transportation System
inland waterways
Inland waterways are vitally important to the health of the Nation’s economy. It is estimated that without the barges and towboats operating on the inland waterways, the Nation would need 6.3 million railroad cars or 25 million trucks to haul the difference. However, much of the critical infrastructure for waterborne transportation is in dire need of repair. More than one-half of the locks and dams in the United States are over 50 years old.
Tosafelyandefficientlymeettheneedsoffreightmovementsinthe21st Century, Congress should:
· Authorize adequate funding for operations and maintenance of the Nation’s inland water-ways system.
· Direct the Secretary of the Army, in coordination with the Secretary of the Treasury, to assessfinancingoptionsfortheinlandwaterwayssystem.
· Work with the Inland Waterways User Board, states, and other interested parties to plan and prioritize federal investment in the inland waterways system.

67Improving the Nation’s Freight Transportation System
air CarGo
Air cargo is the fastest way to ship goods over long distances, and air freight is high value cargo. Less than three percent of total freight by weight ships by air, but this represents over $6.4 trillion worth of goods per year, which is nearly 35 percent of all freight value. Today, the Federal Aviation Administration (FAA) is re-sponsible for ensuring the safe navigation of aircraft within the Nation’s airspace. However, the basic elements oftheFAAsystemhavenotchangedsignificantlyinover60years.TheNextGenerationAirTransportationSystem (NextGen) is FAA’s solution, employing new technology, modernized procedures, and resulting in add-ed capacity, increased productivity, and greater safety.
Tosafelyandefficientlymeettheneedsoffreightmovementsinthe21st Century, Congress should:
· Authorizeadequatefundingandprogrammaticsupporttoimplementnewairtrafficcon-trol technologies and operational capabilities to facilitate the transition to the Next Gener-ation Air Transportation System supporting the Nation’s air freight system.

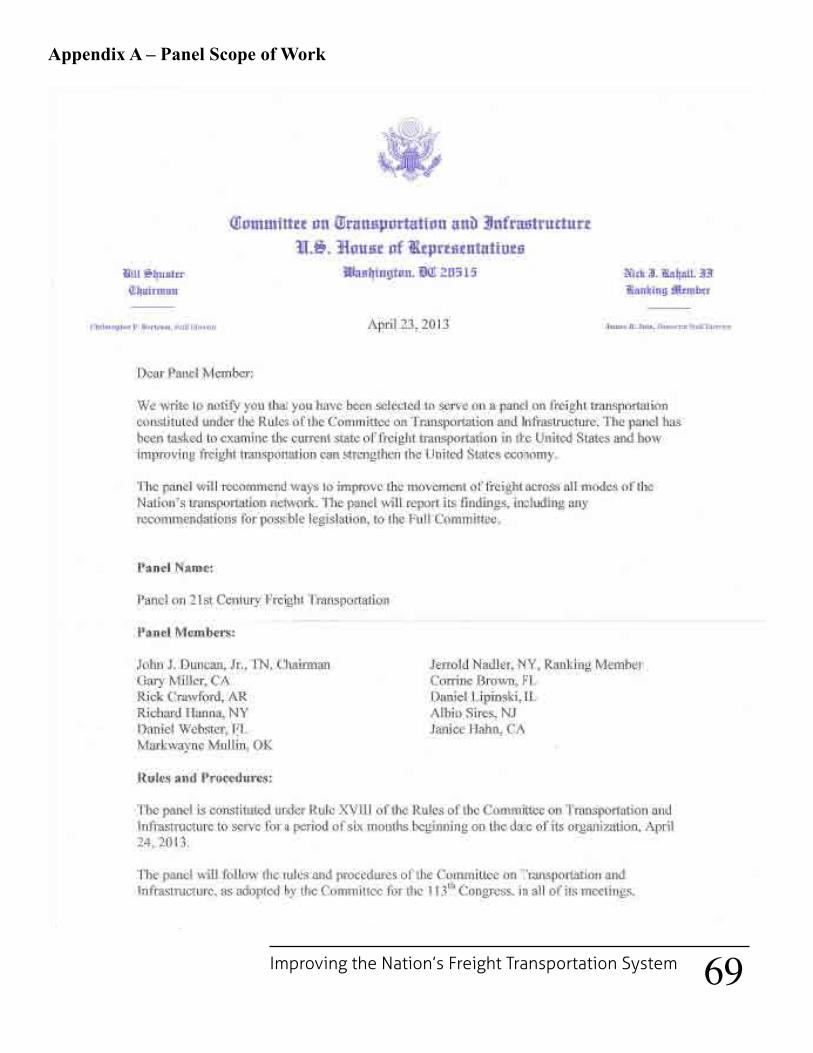
69Improving the Nation’s Freight Transportation System
Appendix A – Panel Scope of Work

70Improving the Nation’s Freight Transportation System

71Improving the Nation’s Freight Transportation System


73Improving the Nation’s Freight Transportation System
Appendix B – Panel Activities
DATE TITLEApril 24, 2013 Hearing – “Overview of the United States’ Freight Transportation System”May 15, 2013 Roundtable Policy Discussion – “Coordinating Federal Efforts to Improve
Freight Transportation”May 28, 2013 to May 31, 2013
Site Visit – Southern California
May 29, 2013 Roundtable Policy Discussion – “Navigating the Complexities of America’s Largest Port Facilities”
May 30, 2013 Hearing – “How Southern California Freight Transportation Challenges Impact the Nation”
June 20, 2013 to June 21, 2013
Site Visit – Memphis Region
June 26, 2013 Hearing–“HowLogisticsFacilitateanEfficientFreightTransportationSystem”
July 17, 2013 Roundtable Policy Discussion – “Effectively Coordinating Freight Planning Activities”
July 25, 2013 to July 27, 2013
Site Visit – New York City Region
July 26, 2013 Hearing – “How Freight Transportation Challenges in Urban Areas Impact the Nation”
August 22, 2013 to August 23, 2013
Site Visit – Norfolk, Virginia
October 1, 2013 Hearing – “Perspectives from Users of the Nation’s Freight System”October 10, 2013 Hearing – “Funding the Nation’s Freight System”


75Improving the Nation’s Freight Transportation System
Appendix C – Summary of Hearing – “Overview of the United States’ Freight Transporta-tion System”
Overview
The Panel on 21st Century Freight Transportation met on Wednesday, April 24, 2013, at 10:00 a.m., in 2167 RayburnHouseOfficeBuildingtoreceivetestimonyrelatedtotheimportanceoffreighttransportationtotheUnited States economy. At this hearing, the Panel received testimony on the current operation of the freight network,whatchallengesimpactitsperformance,andwhatcanbedonetoimprovetheefficiencyandsafetyoffreight transportation.
Points of Discussion
· The Nation’s freight transportation network affects the day-to-day lives of every citizen, and given its multimodal nature, the system as a whole and how its parts work together need to be examined and im-proved for future capacity and demand.
· As an essential part of the Nation’s freight network, the highway system moves approximately 50 percent of all freight moved in the United States via trucking. Unfortunately, the negative impacts of congestionslowtheefficiencyofthehighwaysystemasareliablefreightmode.
· Carrying more freight than any other mode of surface transportation over long distances, railroads carry 43 percent of intercity freight and are continually working to improve and expand their networks.
· With respect to ports and maritime freight movement, cargo ships move 75 percent of international freighteveryyearbywater.Tocontinueefficientlyexportingsuchalargevolumeofgoods,investmentis necessary in port infrastructure and land-side connections.
· Air cargo carriers play a large role in transporting goods in both domestic and international supply chains, moving cargo quickly and often moving goods of high value.
· Asthesafestandmostefficientwaytotransporthazardousmaterials,pipelinesplayanimportantroleindelivering crucial products such as natural gas throughout the country.

76Improving the Nation’s Freight Transportation System
Witnesses
Fred Smith, Chairman,President,andChiefExecutiveOfficer
FedEx Corporation
CharlesW.Moorman,Chairman,President,andChiefExecutiveOfficer
Norfolk Southern Corporation
James Newsome, PresidentandChiefExecutiveOfficer
South Carolina Ports Authority
Derek Leathers, President
Werner Enterprises
Edward Wytkind, President, Transportation Trades Department
AFL-CIO

77Improving the Nation’s Freight Transportation System
Appendix D – Summary of Hearing – “How Southern California Freight Transportation Challenges Impact the Nation”
Overview
The Panel on 21st Century Freight Transportation met on Thursday, May 30, 2013 at the historic Santa Fe Depot located at 1170 West 3rd Street, San Bernardino, California, to receive testimony related to ways the freight chal-lenges of Southern California impact the Nation. During this hearing, the Panel received testimony on the cur-rent operation of the freight network in Southern California, the unique challenges that impact its performance, and how these issues resonate throughout the country and impact the freight system as a whole.
Points of Discussion
· The multimodal Southern California freight system is one of the most important gateways in the entire country, incorporating ports, international border crossings, highways, railways, and air cargo facilities. Creating 60,000 local jobs, the freight industry in Southern California brings in over $30 billion in local, state, and federal tax revenue yearly.
· Southern California ranks as the third-largest manufacturing region in the Nation.
· Congestion,bottlenecks,andotherinefficiencieshindertheSouthernCaliforniaregion’sabilitytoim-port and move goods throughout the Nation, increasing costs and transit times.
· Given the connected nature of the Nation’s supply chain, the issues impacting this region’s freight system have a direct and tangible impact on the economic competitiveness of states thousands of miles away.
Witnesses
Kome Ajise, Deputy Director for Planning and Modal Programs
California Department of Transportation

78Improving the Nation’s Freight Transportation System
Hasan Ikhrata, Executive Director
Southern California Association of Governments
Marnie O’Brien Primmer, Executive Director
Mobility 21
Scott Moore, Vice President for Public Affairs
UnionPacific
MikeFox,PresidentandChiefExecutiveOfficer
Fox Transportation
RickRichmond,FormerChiefExecutiveOfficer
Alameda Corridor-East Construction Authority

79Improving the Nation’s Freight Transportation System
Appendix E – Summary of Hearing – “How Logistics Facilitate an Efficient Freight Trans-portation System”
Overview
The Panel on 21st Century Freight Transportation met on Wednesday, June 26, 2013 at 1:00 p.m. in 2167 Ray-burnHouseOfficeBuildingtoreceivetestimonyrelatedtotheimpactofthelogisticsindustryontheUnitedStates freight network. During the hearing, the Panel received testimony concerning the correlation between logisticsandaproductive,efficient,andsafenationalfreightsystemandsuggestionstostrengthenthisrelation-ship.
Points of Discussion
· The logistics industry is one of the most valuable parts of the Nation’s freight system because it im-provestheefficiencyofthesupplychain.
· Logisticsprovidersplayakeyroleinalleviatinginefficienciesandbottlenecks,whichimpedefreightmobility and drive up the cost of goods.
· Manufacturers and retailers can maximize the value of third-party logistics by using the concept of Just-in-TimeDelivery,minimizingcarryingcostsandincreasingbusinessefficiency.
Witnesses
DavidAbney,ChiefOperatingOfficer
United Parcel Service
Tracy Rosser, Senior Vice President, Transportation
Walmart Corporation
80Improving the Nation’s Freight Transportation System
Scott Satterlee, Senior Vice President, Transportation
C.H. Robinson
MarkDeFabis,PresidentandChiefExecutiveOfficer
International Development Systems
Richard Fisher, President
Falcon Global Edge
EdHamberger,PresidentandChiefExecutiveOfficer
Association of American Railroads

81Improving the Nation’s Freight Transportation System
Appendix F – Summary of Hearing – “How Freight Transportation Challenges in Urban Areas Impact the Nation”
Overview
The Panel on 21st Century Freight Transportation met on Friday, July 26, 2013 at 1:30 p.m. at the Alexander Hamilton United States Custom House, located at One Bowling Green, New York, New York. The Panel received testimony related to the ways in which urban freight challenges impact the Nation. During this hear-ing, the Panel received testimony concerning the operation of the freight network in urban areas, the unique challenges that impact performance in these areas, and how these issues impact the rest of the Nation’s freight system.
Points of Discussion
· Freight transportation in urban areas is complex and sensitive, and mitigated by several dueling factors. Given the interconnected nature of the Nation’s freight transportation system, issues that impact one region of the country inevitably have a ripple effect throughout the entire network.
· Congestion remains one of the most costly hurdles for urban area freight transportation. Congestion, by increasing transit times, increases the cost of goods for consumers.
· State transportation departments and metropolitan planning organizations generally work together to cre-ate a long term strategy for urban freight planning. However, freight projects that cross state lines often havedifficultycompetinginastate-basedformulaprogram.Planningandadvocatingformulti-jurisdic-tionalprojectsrequiresignificantcoordinationamongstseveralgroups.
· The New York City metropolitan area experiences some of the most critical freight challenges of any re-gioninthecountry,particularlytheabilitytomovegoodsefficientlyacrosstheHudsonRiver.Withouta viable alternative, trucking across ageing and congested infrastructure is the best option to move goods throughout the region.
Witnesses
Patrick Foye, Executive Director
Port Authority of New York and New Jersey
82Improving the Nation’s Freight Transportation System
WilliamFlynn,PresidentandChiefExecutiveOfficer
Atlas Air Worldwide Holdings
Gerry Coyle, Vice President for Environmental & Sustainability
Evans Network
William Goetz, Resident Vice President for New York City, New Jersey, and Philadelphia
CSX Transportation

83Improving the Nation’s Freight Transportation System
Appendix G – Summary of Hearing – “Perspectives from Users of the Nation’s Freight System”
Overview
The Panel on 21st Century Freight Transportation met on Tuesday, October 1, 2013, at 2:00 p.m., in 2167 Ray-burnHouseOfficeBuildingtoreceivetestimonyrelatedtothewaysinwhichtheagricultureandmanufacturingindustries rely on the Nation’s freight transportation system to remain competitive. At this hearing, the Panel receivedtestimonyonthespecificfreighttransportationneedsoftheseindustriesandtheimpactthatthelevelof performance of the freight system has on the ability of these industries to remain competitive.
Points of Discussion
· Depending on the particularities of the goods being produced, manufacturers often have unique freight transportationneeds.ThesophisticationandefficiencyoftheNation’sfreightsystemallowforman-ufacturers to deliver goods in a way that supports the competitiveness of the industry. However, more investment is needed to support growth.
· The manufacturing and agriculture industries are concerned that the Nation’s current failure to adequate-ly invest in infrastructure will cede past gains to global competitors, especially in the agriculture indus-try.
· Aside from general issues related to the market for agricultural commodities, transportation costs are themostsignificantfactorimpactingthebottomlineforfarmersandotherparticipantsintheagricultureindustry.
Witnesses
Tom Kadien, Senior Vice President, Consumer Packaging
International Paper
F. Edmond Johnston, III, Sustainability Manager
DuPont

84Improving the Nation’s Freight Transportation System
William Roberson, Materials & Logistics Manager
Nucor Steel Berkeley
Bill J. Reed, Vice President, Public Affairs
Riceland Foods, Inc.
85Improving the Nation’s Freight Transportation System
Appendix H – Summary of Hearing – “Funding the Nation’s Freight System”
Overview
The Panel on 21st Century Freight Transportation met on Thursday, October 10, 2013, at 1:00 p.m., in 2167 RayburnHouseOfficeBuildingtoreceivetestimonyrelatedtothewaysinwhichfreightprojectscanbefund-ed. At this hearing, the Panel received testimony on the various proposals on ways to raise new revenue and use existing revenue more wisely in the funding of freight infrastructure projects across the Nation.
Points of Discussion
· Most highway-related freight projects, as well as some freight rail and freight intermodal projects, are currently eligible to receive funding under one or more existing federal surface transportation programs. Many large freight projects, however, are multimodal in scope, and some aspects of these projects may be ineligible for funding from the Highway Trust Fund. Freight projects that cross state lines often have difficultycompetinginastate-basedhighwayformulaprogram.Freightprojectsalsoreceivefederalassistance through the Harbor Maintenance Trust Fund, the Transportation Investment Generating Eco-nomic Recovery grants, and Transportation Infrastructure Finance and Innovation Act grants.
· Freight infrastructure facilities are in need of upgrading and current federal funding available for freight projects still leaves states with unmet needs. Additional federal resources are needed to address the Na-tion’s freight transportation needs.
· Some states have recently passed measures to increase state revenue for transportation projects. States have also explored public-private partnerships to fund freight projects.
Witnesses
The Honorable Sean T. Connaughton, Secretary
Virginia Department of Transportation
Leif Dormsjo, Deputy Secretary
Maryland Department of Transportation
86Improving the Nation’s Freight Transportation System
Robert D. Atkinson, President
Information Technology and Innovation Foundation
Jack L. Schenendorf, Of Counsel
Covington & Burling, LLP
David Seltzer, Co-Founder
Mercator Advisors
87Improving the Nation’s Freight Transportation System
Appendix I – Summary of Site Visit – Southern California
Overview
In order to gain a better understanding of freight movement in the region and to hear from local stakeholders, members and staff of the Panel on 21st Century Freight Transportation traveled to different areas of Southern California from Tuesday, May 28 to Friday, May 31, 2013.
Sites Visited
· OnTuesday,May28,2013,MembersandstaffreceivedabriefingonthecargooperationsatLosAnge-les International Airport, and then toured the cargo operations of the Mercury Air Group. Later in the day,theymetwithofficialsfromtheLosAngelesMetropolitanTransportationAuthority.
· OnWednesday,May29,2013,Membersandstaffreceivedabriefingonportoperationsfromofficialsofthe Port of Los Angeles and Port of Long Beach; toured the International Transportation Services Ter-minal and the Middle Harbor Redevelopment Project at the Port of Long Beach; toured the Port of Los AngelesandthePortofLongBeachbyboat,accompaniedbyofficialsfrombothportsandlocalfreightstakeholders; and Members held a roundtable discussion with industry stakeholders on port operations at the APM Terminal.
· On Thursday, May 30, 2013, Members and staff traveled on BNSF rail cars up the Alameda Corridor to the intermodal rail yard in Hobart, and out the Alameda Corridor East towards San Bernardino. Mem-bersandstaffreceivedbriefingsonthefacilitiesenroutebyBNSFseniorofficersandlocalstakeholders.Upon arriving in San Bernardino, Members and staff visited the BNSF San Bernardino Rail Yard. Mem-bersheldafieldhearingentitled“HowSouthernCaliforniaFreightTransportationChallengesImpactthe Nation.”


89Improving the Nation’s Freight Transportation System
Appendix J – Summary of Site Visit – Memphis Region
Overview
On Thursday, June 20 and Friday, June 21, 2013, Members and staff of the Panel on 21st Century Freight Trans-portation traveled to the Memphis region for a series of site visits, meetings, and a working lunch discussion.
Sites Visited
· OnThursday,June20,2013,MembersandstafftouredtheFedExfacilitieswithseniorofficersfromtheFedExCorporation.ThetourincludedtheflightsimulatorsFedExusestotraintheirpilots,adiscussionofthe33-footdoubletrailerconfiguration,theboxmatrixsortingfacility,andthesmallpackagesortingfacility.
· On Friday, June 21, 2013, MembersandstaffreceivedabriefingoninlandwaterwaysissuesandthePort of Memphis from the Executive Director of the port, a senior United States Army Corps of Engi-neersofficial,andaplantmanagerforCargill;touredtheportfacilities;andmetwithfreightstakehold-ers at the Mid-South Community College in West Memphis, Arkansas.

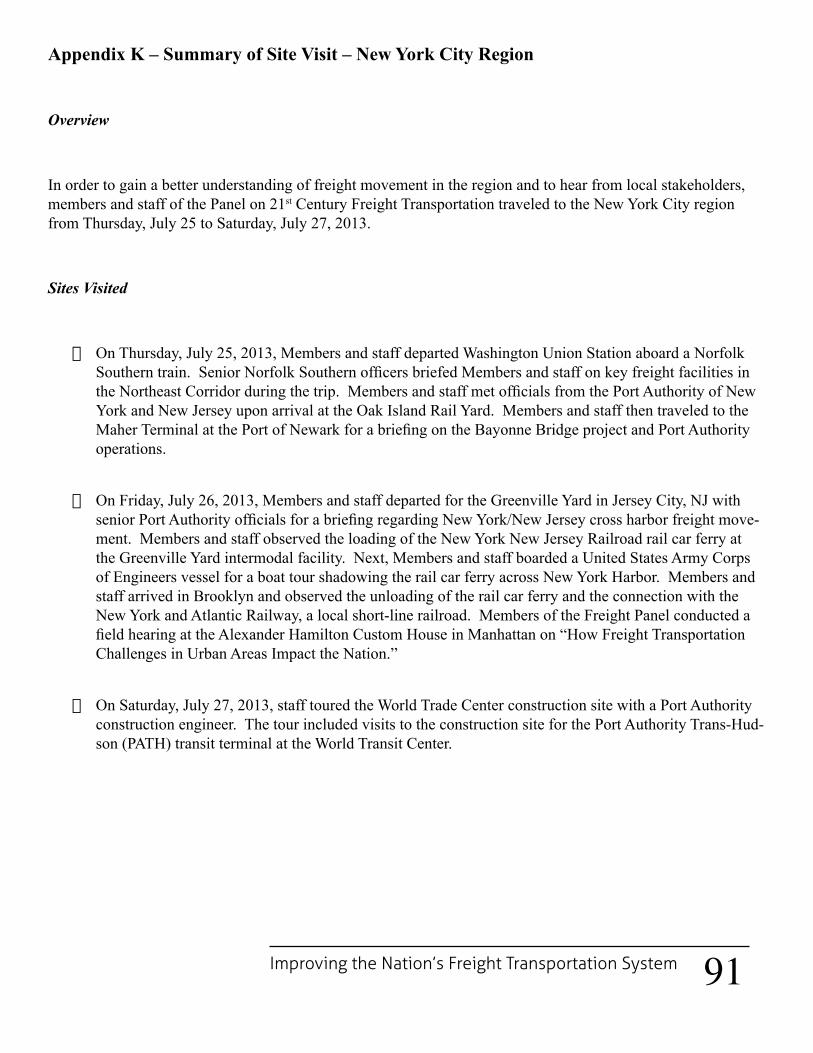
91Improving the Nation’s Freight Transportation System
Appendix K – Summary of Site Visit – New York City Region
Overview
In order to gain a better understanding of freight movement in the region and to hear from local stakeholders, members and staff of the Panel on 21st Century Freight Transportation traveled to the New York City region from Thursday, July 25 to Saturday, July 27, 2013.
Sites Visited
· On Thursday, July 25, 2013, Members and staff departed Washington Union Station aboard a Norfolk Southerntrain.SeniorNorfolkSouthernofficersbriefedMembersandstaffonkeyfreightfacilitiesintheNortheastCorridorduringthetrip.MembersandstaffmetofficialsfromthePortAuthorityofNewYork and New Jersey upon arrival at the Oak Island Rail Yard. Members and staff then traveled to the MaherTerminalatthePortofNewarkforabriefingontheBayonneBridgeprojectandPortAuthorityoperations.
· On Friday, July 26, 2013, Members and staff departed for the Greenville Yard in Jersey City, NJ with seniorPortAuthorityofficialsforabriefingregardingNewYork/NewJerseycrossharborfreightmove-ment. Members and staff observed the loading of the New York New Jersey Railroad rail car ferry at the Greenville Yard intermodal facility. Next, Members and staff boarded a United States Army Corps of Engineers vessel for a boat tour shadowing the rail car ferry across New York Harbor. Members and staff arrived in Brooklyn and observed the unloading of the rail car ferry and the connection with the New York and Atlantic Railway, a local short-line railroad. Members of the Freight Panel conducted a fieldhearingattheAlexanderHamiltonCustomHouseinManhattanon“HowFreightTransportationChallenges in Urban Areas Impact the Nation.”
· On Saturday, July 27, 2013, staff toured the World Trade Center construction site with a Port Authority construction engineer. The tour included visits to the construction site for the Port Authority Trans-Hud-son (PATH) transit terminal at the World Transit Center.


93Improving the Nation’s Freight Transportation System
Appendix L – Summary of Site Visit – Norfolk, Virginia
Overview
In order to gain a better understanding of the operations at the Port of Virginia and at the Norfolk Southern Coal Pier 6, staff for the Panel on 21st Century Freight Transportation traveled to Norfolk, Virginia on Thursday, Au-gust 22 and Friday, August 23, 2013.
Sites Visited
· OnThursday,August22,2013,stafftouredtheNorfolkInternationalTerminalandreceivedabriefingon port operations. The chief of the port police force was also present to discuss port security issues. Next, staff departed for the APM terminal, a state of the art, privately-owned and constructed terminal that is operated by the Port of Virginia under a lease agreement with Maersk. Staff visited and were briefed at both a traditional container loading facility and an automated container facility. Security and coordination of vessels with both rail and truck land-side transport were reviewed. At the completion of the container review, staff boarded the vessel CMA CGM Samson for a tour and discussion on ship con-tainer loading and transport, and a working lunch with vessel crew. Later, staff departed for the United StatesCoastGuardBasePortsmouthforabriefingonCoastGuardoperationswiththeCaptainofthere-gion. Discussions focused on the management of the harbor, safety protocols and issues associated with coordinatingvesseltrafficinandoutoftheharborfacilities.StaffalsotouredtheCraneyIslandfacility,which is used by the Port of Virginia to store dredge material and is the future site of terminal expansion at the Port of Norfolk.
· OnFriday,August23,2013,staffreceivedabriefingontheNorfolkSouthernCoalPier6andweregiv-en a tour of operations at the pier.


95Improving the Nation’s Freight Transportation System
Appendix M – Summary of Roundtable Policy Discussion – “Coordinating Federal Efforts to Improve Freight Transportation”
Overview
The Panel on 21st Century Freight Transportation met on Wednesday, May 15, 2013, at 10:00 a.m., in 2253 RayburnHouseOfficeBuildingtoparticipateinaroundtablediscussiononfederaleffortstoimprovefreighttransportation. The Panel heard from participants from the United States Department of Transportation (DOT) and the United States Army Corps of Engineers.
Points of Discussion
· DOT has the primary responsibility in the Administration to develop freight transportation policy; the United States Army Corps of Engineers (Corps) also plays a role in transportation infrastructure. Spe-cifictofreighttransportation,theCorpscarriesoutconstructionandmaintenanceofnavigationchannelsand the inland waterways system which are critical pieces of the Nation’s freight transportation system.
· These two departments work together through a Memorandum of Understanding, establishing a collabo-rative relationship to improve the Nation’s transportation system and infrastructure.
· The Freight Policy Council, created by DOT in August 2012, has been working with states to develop state freight plans as required by Section 1118 of the Moving Ahead for Progress in the 21st Century Act. MAP-21 also requires the development of a National Freight Strategic Plan to assess the conditions and performance of the National Freight Network, identifying points of congestion, forecasting freight volumes, and identifying major trade gateways, among other objectives.
· The National Freight Network is required by Section 1115 of MAP-21 to be designated by October 1, 2013; DOT is currently in the process of meeting this requirement. This primary freight network will consist of 27,000 centerline miles of existing roadways, with the option of expanding this limitation by no more than 3,000 additional centerline miles. The purpose of this network is to identify the infrastruc-ture facilities that are most important to the movement of freight on the Nation’s highways.
96Improving the Nation’s Freight Transportation System
Participants
The Honorable John Porcari, Deputy Secretary
United States Department of Transportation
The Honorable Jo-Ellen Darcy, Assistant Secretary (Civil Works)
United States Department of the Army

97Improving the Nation’s Freight Transportation System
Appendix N – Summary of Roundtable Policy Discussion – “Navigating the Complexities of America’s Largest Port Facilities”
Overview
The Panel on 21st Century Freight Transportation met on Wednesday, May 29, 2013, at 1:30 p.m., at the Port of Los Angeles Administration building, located at 425 South Palos Verdes Street, San Pedro, California to partic-ipate in a roundtable discussion on port facilities and freight transportation. The Panel heard from stakeholders in the Southern California freight transportation community.
Points of Discussion
· As one of the most important trade gateways in the country, the freight system in Southern California is multimodal, incorporating ports, international border crossings, interstate highways, railroads, air cargo facilities, refrigeration facilities, and distribution and warehouse clusters.
· Therearemanyinfrastructure,capacity,andefficiencychallengesfacingthePortsofLosAngelesandLong Beach to maintain their competitiveness in the global economy. As the eighth largest port facility intheworld,takentogether,bothPortsareundergoingmajorcapitalimprovementstofightthesechal-lenges and to strengthen the national freight system.
· The Ports of Los Angeles and Long Beach handle more than 40 percent of all containers entering the United States and contribute an import tax to the Harbor Maintenance Trust Fund. The Ports of LA and Long Beach receive back less money than they pay into the Harbor Maintenance Trust Fund.
· ImprovingtheefficiencyofmovingcargothroughtheharborcomplexrequirescoordinationbetweentheDepartment of Homeland Security and the United States Coast Guard to ensure safety in the transport of materials in and out of the harbor. Both ports are investing in expanding container facilities to accom-modate post-Panamax sized vessels.
· Given the challenges affecting this region, the importance of sustainable, long-term funding for trans-portation infrastructure in delivering freight projects is the key to a successful economic future for the Nation’s freight system.

98Improving the Nation’s Freight Transportation System
Participants
Chris Lytle, Executive Director
Port of Long Beach
Michael Christensen, Deputy Executive Director
Port of Los Angeles
JeffBurgin,SeniorVicePresidentandChiefOperatingOfficer
Pasha Stevedoring & Terminals
Alan McCorkle, Senior Vice President
APM Terminals
VictorLaRosa,PresidentandChiefExecutiveOfficer
Total Transportation Services, Inc.
Michael Antonovich, Chairman
Metropolitan Transportation Authority
Michael Gasparo, Manager for Ship Assist
Crowley
Rav Familathe, International Vice President (Mainland)
International Longshore and Warehouse Union
99Improving the Nation’s Freight Transportation System
Appendix O – Summary of Roundtable Policy Discussion – “Effectively Coordinating Freight Planning Activities”
Overview
The Panel on 21st Century Freight Transportation met on Wednesday, July 17, 2013, at 10:00 a.m., in 2253 Ray-burnHouseOfficeBuildingtoparticipateinaroundtablediscussiononeffectivelycoordinatingfreightplan-ningactivities.ThePanelheardfromplanningofficialsatthefederal,state,regional,andlocallevels.
Points of Discussion
· Planning is key to any functioning transportation system, and freight planning itself is complicated be-causeitinvolvesmultiplejurisdictionsandrequiresignificantcoordinationamongseveralparties.
· State departments of transportation, metropolitan planning organizations (MPOs), and rural planning commissions work together to create a statewide transportation improvement plan with proposals for fu-ture consideration. The Moving Ahead for Progress in the 21st Century Act created a new apportionment for metropolitan planning, requiring states to make more funds available for MPOs.
· Since freight projects are usually complex and involve several different parties, planning for and ad-vancingtheseprojectsrequiressignificantcoordination.ThePanelheardsuggestionsonhowfreightplanning stakeholders can effectively coordinate efforts to ensure the timely and well planned delivery of freight transportation facilities and whether additional ways for these entities to cooperate on the plan-ningoflargefreightprojectscanbeidentified.
· There are a number of challenges that may impede the effective coordination of the planning for large freight projects, especially since freight projects often cross state boundaries, implicating multiple state departments of transportation and MPOs.
Participants
The Honorable Polly Trottenberg, Undersecretary for Policy
United States Department of Transportation

100Improving the Nation’s Freight Transportation System
Richard Biter, Assistant Secretary for Intermodal Systems Development
Florida Department of Transportation
Don Kopec, Deputy Executive Director for Programming and Operations
Chicago Metropolitan Agency for Planning
Amy Kessler, Director of Community Development and Regional Planning
North Central Pennsylvania Regional Planning and Development Commission
Andrew Lynn, Director of Planning and Regional Development
Port Authority of New York and New Jersey

101Improving the Nation’s Freight Transportation System
Appendix P – Acronym List
3PL Third-Party Logistics
AATF Airport and Airway Trust Fund
AIP Airport Improvement Program
CREATE ChicagoRegionEnvironmentalandTransportationEfficiencyProgram
DOT United States Department of Transportation
EAS Essential Air Services
FAA Federal Aviation Administration
FERC Federal Energy Regulatory Commission
FHWA Federal Highway Administration
HMT Harbor Maintenance Tax
HMTF Harbor Maintenance Trust Fund
HTF Highway Trust Fund
HVUT Heavy Vehicle Use Tax
ISTEA IntermodalSurfaceTransportationEfficiencyAct
IWTF Inland Waterway Trust Fund
JIT Just-in-Time Delivery
MAP-21 Moving Ahead for Progress in the 21st Century Act
MPO Metropolitan Planning Organization
NEPA National Environmental Policy Act
NextGen Next Generation Air Transportation System
O&M Operation and Maintenance
PHMSA Pipelines and Hazardous Materials Safety Administration
PNRS ProjectsofNationalandRegionalSignificance
PPP Public-Private Partnership
PTC Positive Train Control
RTM Revenue Ton Mile
102Improving the Nation’s Freight Transportation System
SAFETEA-LU Safe,Accountable,Flexible,EfficientTransportationEquityAct:ALegacyforUsers
STIP Statewide Transportation Improvement Plan
TEA-21 Transportation Equity Act for the 21st Century
TEU Twenty-foot Equivalent Unit
TIFIA Transportation Infrastructure Finance and Innovation Act
TIGER Transportation Investment Generating Economic Recovery
TTI Texas Transportation Institute
VMT Vehicle Miles Traveled
WRDA Water Resources Development Act
103Improving the Nation’s Freight Transportation System
Appendix Q – Signature Page
