improving small scale irrigation performance in ethiopia...
TRANSCRIPT
Amélioration des Performanc Improving Irrig
Improving small-scale irrigation pthrough on the job training o
Experience of the AP
Philippe Lempérière, Martin Van der Schans IWMI Addi
Subregional Office for Nile Basin andP.O. Box 5689, Addis Ababa, Ethiopia, Telephone: +251
Location: ILRI Campus, Wereda 17, Kebele 21 Africa Office: Private Bag X813, Silverton 0127, Pretoria, South Africa. L
South Africa Telephone: +27-12-845 9100. Facsimile
Headquarters: P.O. Box 2075, Colombo, Sri Lanka. Location: Telephone: +94-11-2787 404. Facsimile: +94-11-2786 854. E-ma
APPIA es des Périmètres Irrigués en Afrique
ation Performance in Africa
erformance in Ethiopia f extension officers: PIA project
s Ababa.
September 2004.
Eastern Africa -1- 463215, Fax: +251-1-461252 , Addis Ababa, Ethiopia
ocation: 141 Cresswell Street, Weavind Park, Pretoria,
: +27-12-845 9110
127 Sunil Mawatha, Battaramulla, Sri lanka il: [email protected]. Website: www. Iwmi.org
1
Improving small-scale irrigation performance in Ethiopia through on the job training of extension officers: Experience of the APPIA project.
Introduction The APPIA project is funded by the French government and implemented by IWMI. APPIA is a French Acronym meaning “Improving Irrigation Performance in Africa”. This project aims to constitute irrigation professional networks that share information to improve irrigation performance. An important aspect of the project is training of project partners to rapidly diagnose the performance of irrigation systems and propose solutions to improve it in a relatively short (max. 2 months) period. More extensive monitoring will be done in the following years to see whether the performance is indeed improved by the proposed solutions. A guidebook on “Participatory Rapid Diagnosis and Action planning for farmer managed Irrigated Agricultural Systems (PRDA)” has been developed and then field-tested by 69 irrigation professionals on 18 selected irrigation schemes, 8 (or 9? – cf. table 2) in Ethiopia and 10 in Kenya as part of the APPIA project. Their experiences and comments have been utilized to write the final version of the guidebook. Most examples used in the guidebook are taken from the selected schemes. Results of the diagnosis have been shared among the stakeholders in the different irrigation schemes and have also been used to identify topics for complementary studies, develop other training materials, experiment new practices and technology. This document presents first the approach followed to train project partners to do a PRDA as well as the main findings on the eight (or nine??) selected schemes in the Amhara and Oromya Regions of Ethiopia. 1. PRDA in brief PRDA is an approach for analyzing and improving irrigation performance. The diagnosis aims to identify the limiting factors to main criteria of performance: farmers’ productivity and irrigation schemes sustainability. Action plan to improve performance can have three components: (1) increase capital investments and inputs, (2) improve organizations responsible for O&M, and (3) enhance individual farming skills. Farmers’ ownership of action plan must be seen as both a major outcome of PRDA and a crucial factor of success since farmers will implement it with support from extension organizations, or development organizations. PRDA methodology and tools are an adaptation of several participatory methods to the situation of irrigated agricultural systems:
Rapid Rural Appraisal (RRA): rapid assessment according to criteria set by the researcher Participatory Rural Appraisal (PRA): facilitating discussion amongst farmers and sharing
of information with and amongst farmers.
2
Participatory Learning and Action (PLA): Farmers and researchers learn throughout the project cycle and use these lessons to engage in individual or joint action.
These participatory approaches are combined with existing methodologies for Benchmarking and Rapid Appraisal (give some references re. these existing methodologies??) that have been modified to suit the scale and limited quantitative data availability of farmer managed irrigation schemes. The guidebook explains the Rapid Diagnosis and Action Planning for Irrigated Agricultural Systems in a practical manner. Chapter 1 is a general introduction of the methodology. Chapter 2 gives an overview of the overall method and different steps of the process; it also explains the relation with this training. In chapter 3, the constituents of irrigation systems are introduced; they are used throughout the whole PRDA. Chapter 4 lists the possible sources of information on these constituents. The participative assessment tools that will be used during the PRDA are described in Chapter 5. Chapter 6 gives some practical tips and advice on how to conduct a PRDA. Finally, a series of “Reporting Sheets” are given that can be used to write down and analyze results after fieldwork. 1.1. Target people and organizations PRDA is primarily meant for frontline staff and senior staff of extension organizations wanting to improve / modernize their services to irrigating farmers by assessing their requirements or interests. Combined results of several irrigation schemes can be used to collect general policy recommendations. Secondly, designing and implementing organizations can use the approach to rapidly evaluate the quality of past irrigation development or rehabilitation projects and thereby identify priority areas for future interventions and improvements. 1.2. Target irrigation schemes PRDA approach has been developed:
• For group based irrigation schemes or clusters of individual schemes • In which most operation and maintenance is performed by farmers. • With a view to the situation in Sub-Saharan Africa
1.3. Conceptual framework PRDA uses a conceptual model for irrigated agricultural systems that enables a broader focus not only on technology but also on farmers’ practices and the enabling environment. Four main constituents are considered that are in close interaction with each other:
1. Irrigation scheme: the physical infrastructure to deliver water to irrigated land. Farmers and their organizations have to take into account the technical constraints due to the design and construction of their irrigation scheme.
2. Plot use: Agricultural production depends largely on farmers’ decisions regarding type of
crops, agricultural techniques, allocation of labor, inputs and capital to make use of their irrigated plots.
3
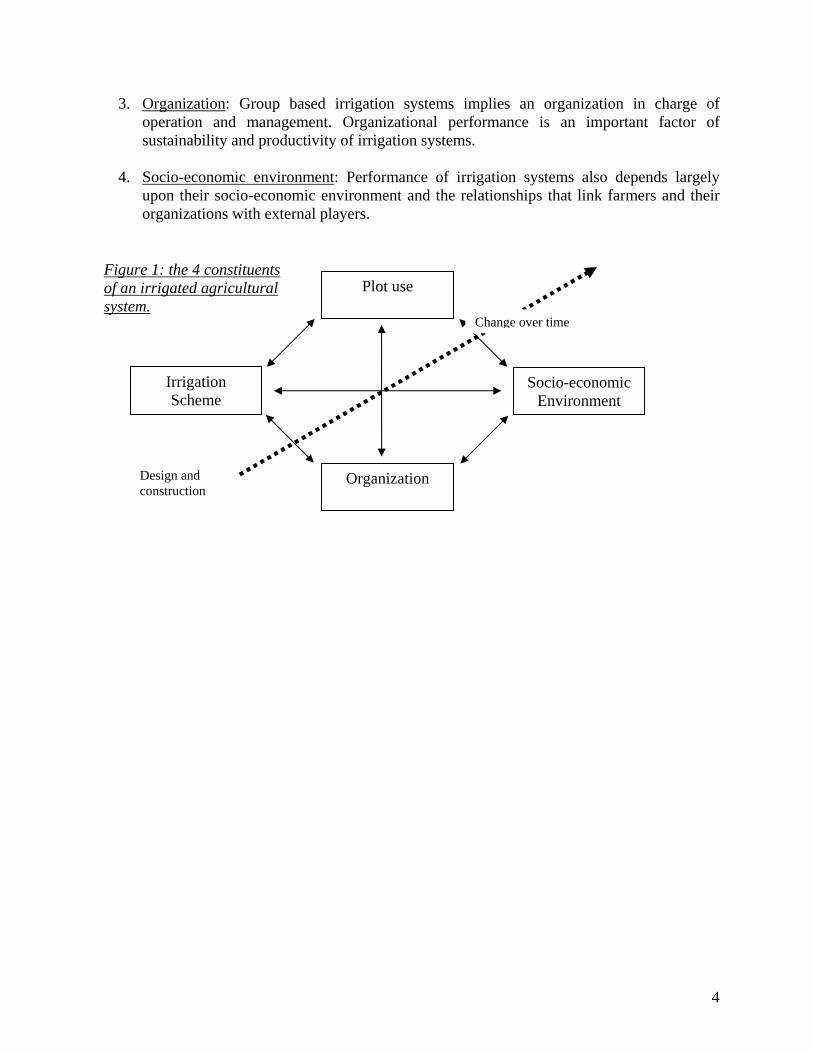
3. Organization: Group based irrigation systems implies an organization in charge of operation and management. Organizational performance is an important factor of sustainability and productivity of irrigation systems.
4. Socio-economic environment: Performance of irrigation systems also depends largely
upon their socio-economic environment and the relationships that link farmers and their organizations with external players.
Irrigation Scheme
Design and construction
Plot useFigure 1: the 4 constituentsof an irrigated agricultural system.
Change over time
Socio-economic Environment
Organization
4
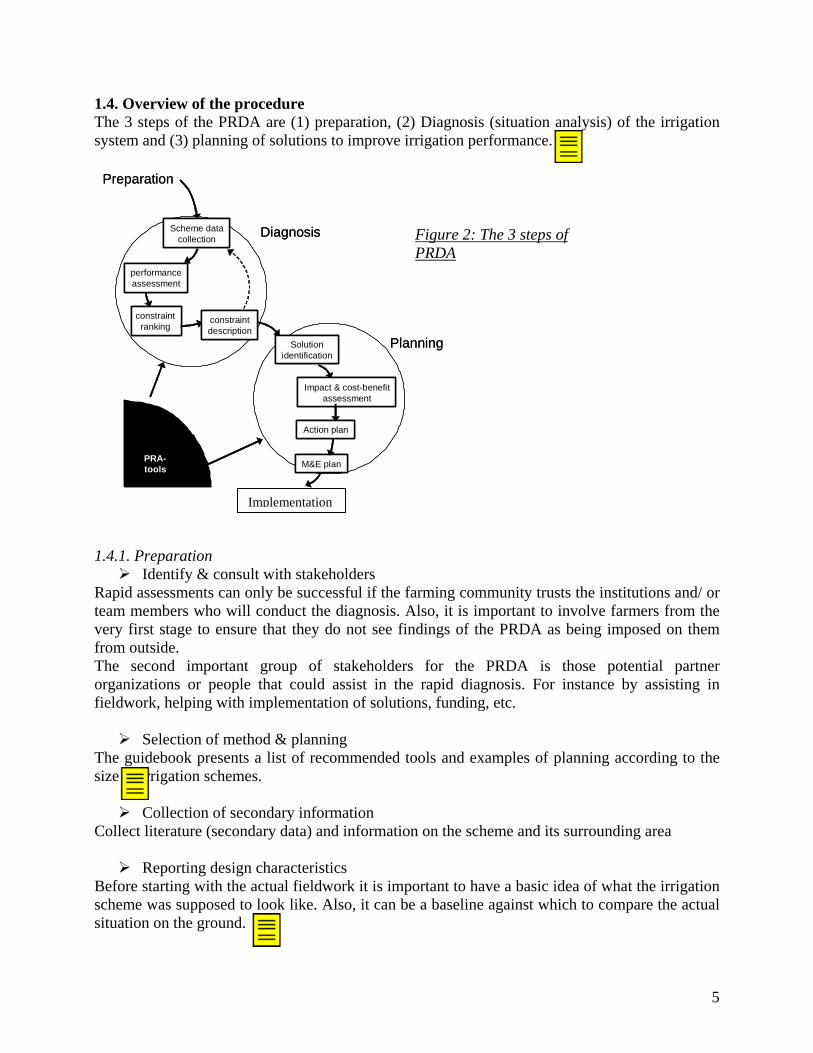
1.4. Overview of the procedure The 3 steps of the PRDA are (1) preparation, (2) Diagnosis (situation analysis) of the irrigation system and (3) planning of solutions to improve irrigation performance.
Scheme datacollection
constraintranking
constraintdescription
Solutionidentification
Action plan
Diagnosis
Planning
Preparation
PRA-tools
performanceassessment
Impact & cost-benefitassessment
M&E plan
Scheme datacollection
constraintranking
constraintdescription
Solutionidentification
Action plan
Diagnosis
Planning
Preparation
PRA-tools
performanceassessment
Impact & cost-benefitassessment
M&E plan
Figure 2: The 3 steps of PRDA
n 1.4.1. Preparation
Identify & consRapid assessments canteam members who wivery first stage to ensufrom outside. The second importanorganizations or peopfieldwork, helping with
Selection of meThe guidebook presensize of irrigation schem
Collection of seCollect literature (seco
Reporting desigBefore starting with thscheme was supposed situation on the ground
Implementatio
ult with stakeholders only be successful if the farming community trusts the institutions and/ or ll conduct the diagnosis. Also, it is important to involve farmers from the re that they do not see findings of the PRDA as being imposed on them
t group of stakeholders for the PRDA is those potential partner le that could assist in the rapid diagnosis. For instance by assisting in implementation of solutions, funding, etc.
thod & planning ts a list of recommended tools and examples of planning according to the es.
condary information ndary data) and information on the scheme and its surrounding area
n characteristics e actual fieldwork it is important to have a basic idea of what the irrigation to look like. Also, it can be a baseline against which to compare the actual .
5
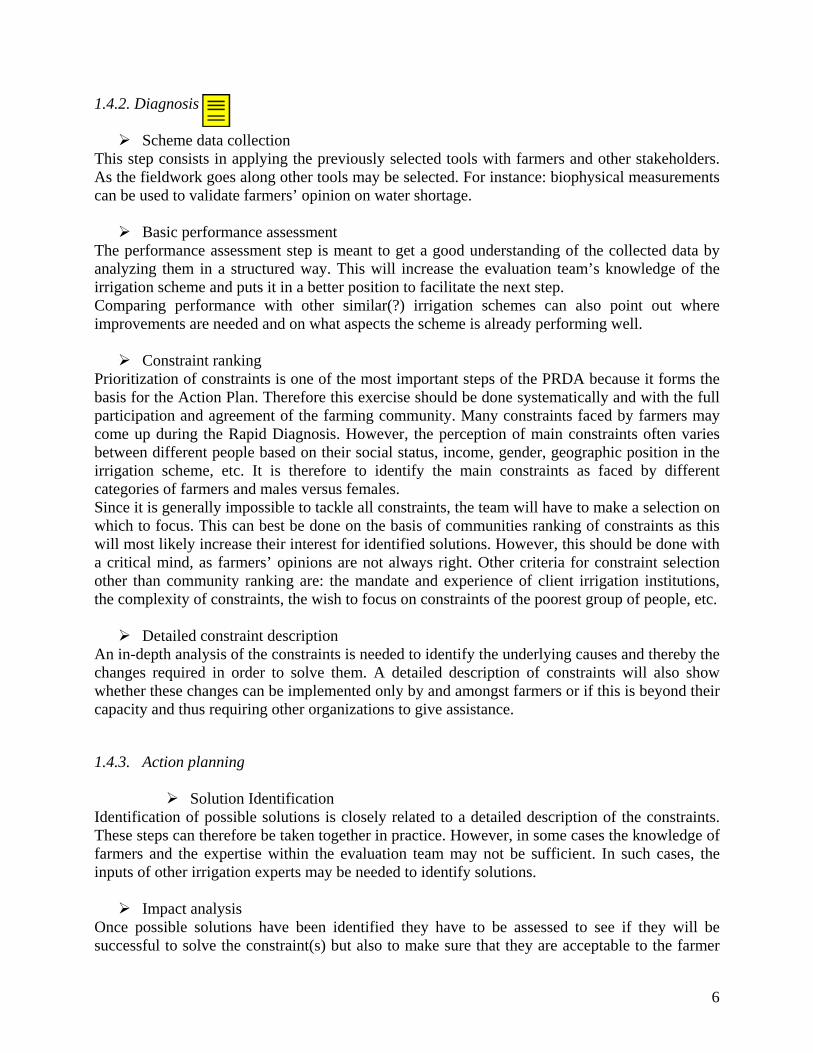
1.4.2. Diagnosis
Scheme data collection This step consists in applying the previously selected tools with farmers and other stakeholders. As the fieldwork goes along other tools may be selected. For instance: biophysical measurements can be used to validate farmers’ opinion on water shortage.
Basic performance assessment The performance assessment step is meant to get a good understanding of the collected data by analyzing them in a structured way. This will increase the evaluation team’s knowledge of the irrigation scheme and puts it in a better position to facilitate the next step. Comparing performance with other similar(?) irrigation schemes can also point out where improvements are needed and on what aspects the scheme is already performing well.
Constraint ranking Prioritization of constraints is one of the most important steps of the PRDA because it forms the basis for the Action Plan. Therefore this exercise should be done systematically and with the full participation and agreement of the farming community. Many constraints faced by farmers may come up during the Rapid Diagnosis. However, the perception of main constraints often varies between different people based on their social status, income, gender, geographic position in the irrigation scheme, etc. It is therefore to identify the main constraints as faced by different categories of farmers and males versus females. Since it is generally impossible to tackle all constraints, the team will have to make a selection on which to focus. This can best be done on the basis of communities ranking of constraints as this will most likely increase their interest for identified solutions. However, this should be done with a critical mind, as farmers’ opinions are not always right. Other criteria for constraint selection other than community ranking are: the mandate and experience of client irrigation institutions, the complexity of constraints, the wish to focus on constraints of the poorest group of people, etc.
Detailed constraint description An in-depth analysis of the constraints is needed to identify the underlying causes and thereby the changes required in order to solve them. A detailed description of constraints will also show whether these changes can be implemented only by and amongst farmers or if this is beyond their capacity and thus requiring other organizations to give assistance.
1.4.3. Action planning
Solution Identification Identification of possible solutions is closely related to a detailed description of the constraints. These steps can therefore be taken together in practice. However, in some cases the knowledge of farmers and the expertise within the evaluation team may not be sufficient. In such cases, the inputs of other irrigation experts may be needed to identify solutions.
Impact analysis Once possible solutions have been identified they have to be assessed to see if they will be successful to solve the constraint(s) but also to make sure that they are acceptable to the farmer
6
community. In practice these two issues are related since solutions that are not accepted by farmers are usually also not successful. Therefore, the assessment of solutions has to be done together with the farming communities. However, as with the identification of solutions, the local knowledge may not always be sufficient to assess the solutions. In such cases it may be a good idea to first pilot test / demonstrate the possible solution on a small portion of the scheme or to take a group of farmers to another irrigation scheme (exchange visit) where the solution has already been implemented.
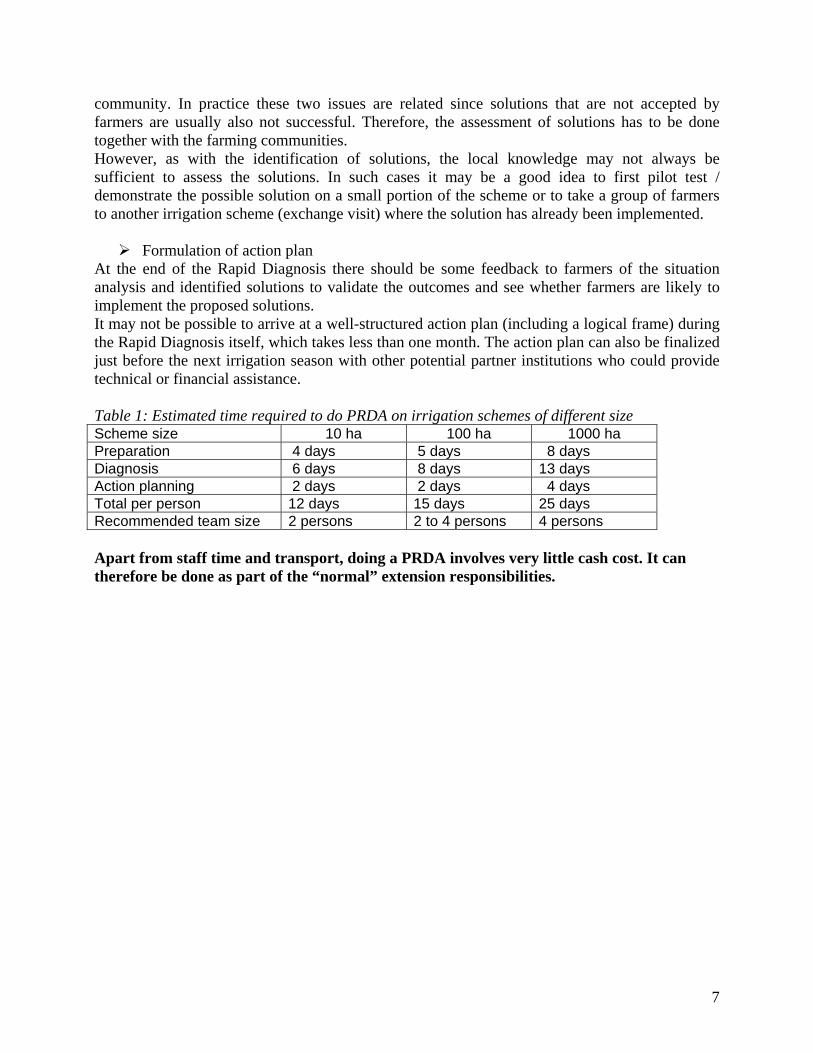
Formulation of action plan At the end of the Rapid Diagnosis there should be some feedback to farmers of the situation analysis and identified solutions to validate the outcomes and see whether farmers are likely to implement the proposed solutions. It may not be possible to arrive at a well-structured action plan (including a logical frame) during the Rapid Diagnosis itself, which takes less than one month. The action plan can also be finalized just before the next irrigation season with other potential partner institutions who could provide technical or financial assistance. Table 1: Estimated time required to do PRDA on irrigation schemes of different size Scheme size 10 ha 100 ha 1000 ha Preparation 4 days 5 days 8 days Diagnosis 6 days 8 days 13 days Action planning 2 days 2 days 4 days Total per person 12 days 15 days 25 days Recommended team size 2 persons 2 to 4 persons 4 persons Apart from staff time and transport, doing a PRDA involves very little cash cost. It can therefore be done as part of the “normal” extension responsibilities.
7
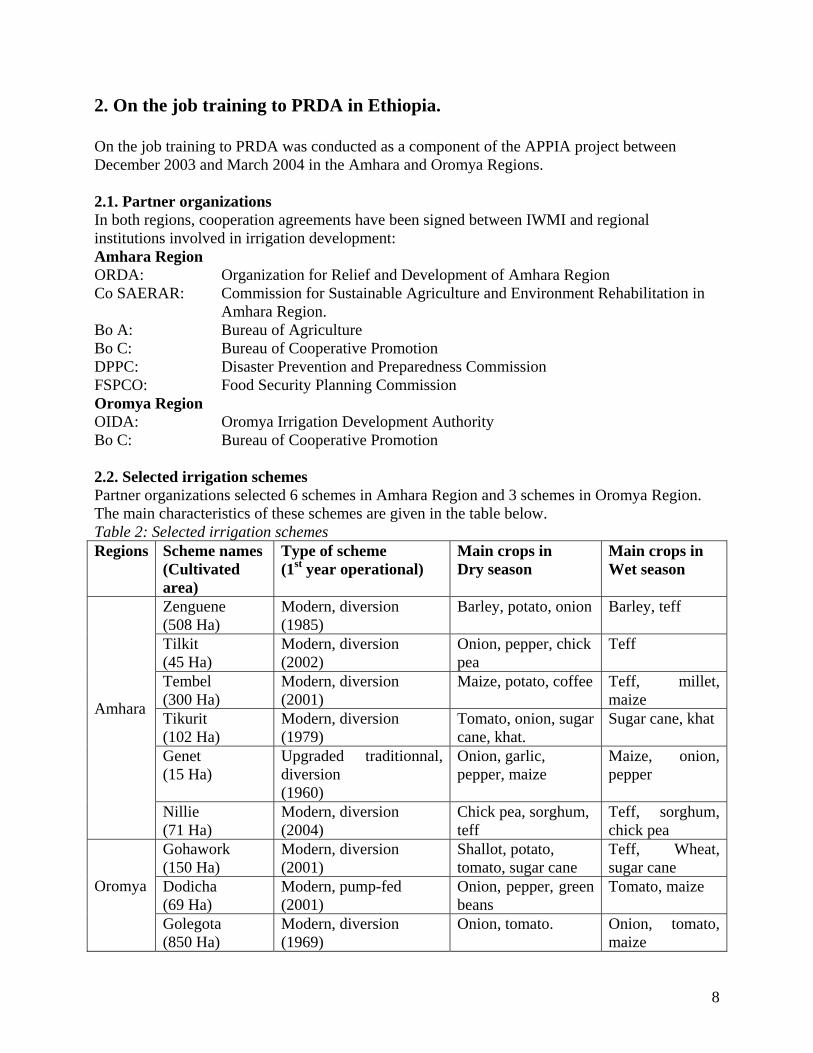
2. On the job training to PRDA in Ethiopia. On the job training to PRDA was conducted as a component of the APPIA project between December 2003 and March 2004 in the Amhara and Oromya Regions. 2.1. Partner organizations In both regions, cooperation agreements have been signed between IWMI and regional institutions involved in irrigation development: Amhara Region ORDA: Organization for Relief and Development of Amhara Region Co SAERAR: Commission for Sustainable Agriculture and Environment Rehabilitation in
Amhara Region. Bo A: Bureau of Agriculture Bo C: Bureau of Cooperative Promotion DPPC: Disaster Prevention and Preparedness Commission FSPCO: Food Security Planning Commission Oromya Region OIDA: Oromya Irrigation Development Authority Bo C: Bureau of Cooperative Promotion 2.2. Selected irrigation schemes Partner organizations selected 6 schemes in Amhara Region and 3 schemes in Oromya Region. The main characteristics of these schemes are given in the table below. Table 2: Selected irrigation schemes Regions Scheme names
(Cultivated area)
Type of scheme (1st year operational)
Main crops in Dry season
Main crops in Wet season
Zenguene (508 Ha)
Modern, diversion (1985)
Barley, potato, onion Barley, teff
Tilkit (45 Ha)
Modern, diversion (2002)
Onion, pepper, chick pea
Teff
Tembel (300 Ha)
Modern, diversion (2001)
Maize, potato, coffee Teff, millet, maize
Tikurit (102 Ha)
Modern, diversion (1979)
Tomato, onion, sugar cane, khat.
Sugar cane, khat
Genet (15 Ha)
Upgraded traditionnal, diversion (1960)
Onion, garlic, pepper, maize
Maize, onion, pepper
Amhara
Nillie (71 Ha)
Modern, diversion (2004)
Chick pea, sorghum, teff
Teff, sorghum, chick pea
Gohawork (150 Ha)
Modern, diversion (2001)
Shallot, potato, tomato, sugar cane
Teff, Wheat, sugar cane
Dodicha (69 Ha)
Modern, pump-fed (2001)
Onion, pepper, green beans
Tomato, maize Oromya
Golegota (850 Ha)
Modern, diversion (1969)
Onion, tomato. Onion, tomato, maize
8
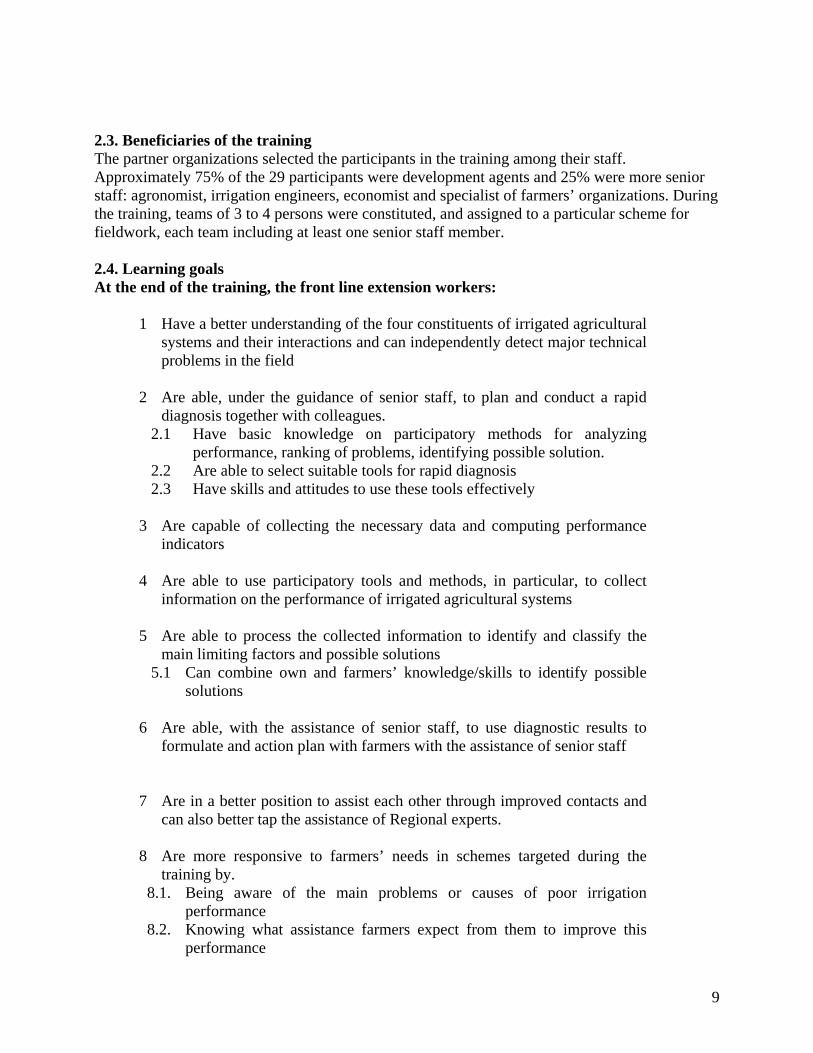
2.3. Beneficiaries of the training The partner organizations selected the participants in the training among their staff. Approximately 75% of the 29 participants were development agents and 25% were more senior staff: agronomist, irrigation engineers, economist and specialist of farmers’ organizations. During the training, teams of 3 to 4 persons were constituted, and assigned to a particular scheme for fieldwork, each team including at least one senior staff member. 2.4. Learning goals At the end of the training, the front line extension workers:
1 Have a better understanding of the four constituents of irrigated agricultural systems and their interactions and can independently detect major technical problems in the field
2 Are able, under the guidance of senior staff, to plan and conduct a rapid diagnosis together with colleagues.
2.1 Have basic knowledge on participatory methods for analyzing performance, ranking of problems, identifying possible solution.
2.2 Are able to select suitable tools for rapid diagnosis 2.3 Have skills and attitudes to use these tools effectively
3 Are capable of collecting the necessary data and computing performance
indicators
4 Are able to use participatory tools and methods, in particular, to collect information on the performance of irrigated agricultural systems
5 Are able to process the collected information to identify and classify the main limiting factors and possible solutions
5.1 Can combine own and farmers’ knowledge/skills to identify possible solutions
6 Are able, with the assistance of senior staff, to use diagnostic results to formulate and action plan with farmers with the assistance of senior staff
7 Are in a better position to assist each other through improved contacts and
can also better tap the assistance of Regional experts.
8 Are more responsive to farmers’ needs in schemes targeted during the training by.
8.1. Being aware of the main problems or causes of poor irrigation performance
8.2. Knowing what assistance farmers expect from them to improve this performance
9
In addition to the above, the senior participants:
9 Are able to design and coordinate a Rapid Diagnosis and Action planning of irrigated agricultural systems
10 Can write a report that is accountable and reflects Rapid Diagnosis results and Action plan in an easily understandable manner to outsiders
11 Know the main problems faced by farmers and front line extension workers that can be associated with / attributed to design and turnover procedures of irrigation schemes.
2.5. Pedagogic principles The pedagogic principles used are based on “learning-by-doing” and “learning-from-each-other.” Classroom training is done before fieldwork to guide and orient it, and after the fieldwork to capitalize the lessons learnt. Both fieldwork and classroom training aim to put participants in a position where they have to mobilize knowledge to carry out work instead of being passive recipients of information. The classroom training sessions themselves therefore favor pro-active training methods such as workgroups and brainstorming. Due consideration is given to the knowledge and experience of the participants by building in time for them to exchange ideas and experiences or to call upon each other’s expertise.
10
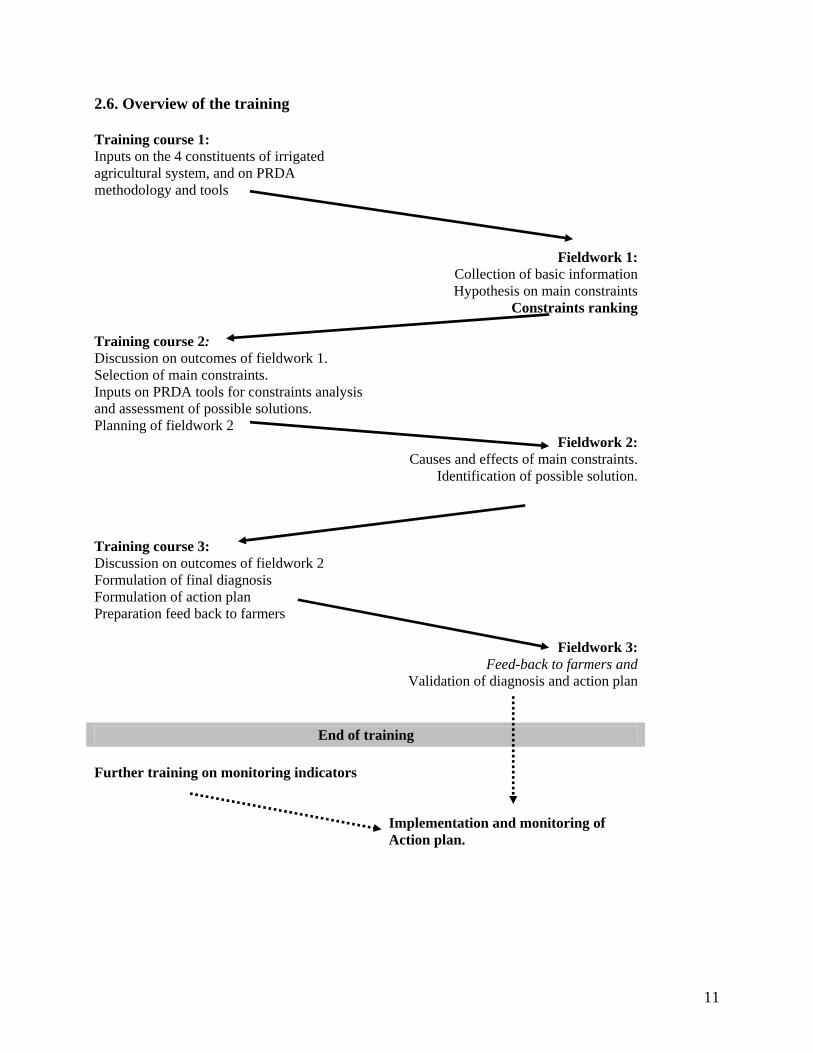
2.6. Overview of the training Training course 1: Inputs on the 4 constituents of irrigated agricultural system, and on PRDA methodology and tools
Fieldwork 1:
Collection of basic information Hypothesis on main constraints
Constraints ranking
Training course 2: Discussion on outcomes of fieldwork 1. Selection of main constraints. Inputs on PRDA tools for constraints analysis and assessment of possible solutions. Planning of fieldwork 2
Fieldwork 2: Causes and effects of main constraints.
Identification of possible solution.
Training course 3: Discussion on outcomes of fieldwork 2 Formulation of final diagnosis Formulation of action plan Preparation feed back to farmers
Fieldwork 3:
Feed-back to farmers and Validation of diagnosis and action plan
End of training Further training on monitoring indicators
Implementation and monitoring of Action plan.
11
2.7. Duration Training course 1 6 days Fieldwork 1 10 days Training course 2 5 days Fieldwork 2 5 days Training course 3 4 days Fieldwork 3 1 day Total 31 days 2.8. Training materials Participants were provided with copies of the “Manual: Participatory Rapid Diagnosis and Action Planning”, which is a handbook containing a step-by-step overview of PRDA. Each training session refers to specific pages of that manual so that participants do not have to take notes during classroom sessions. The manual also contains a format to take notes and analyze results in the field. The following materials were made available for the activities during classroom training sessions and fieldwork:
- Participant’s handbook (see above) - Flip chart, markers, tape - Notebooks and pens - Pebbles or beans.
12
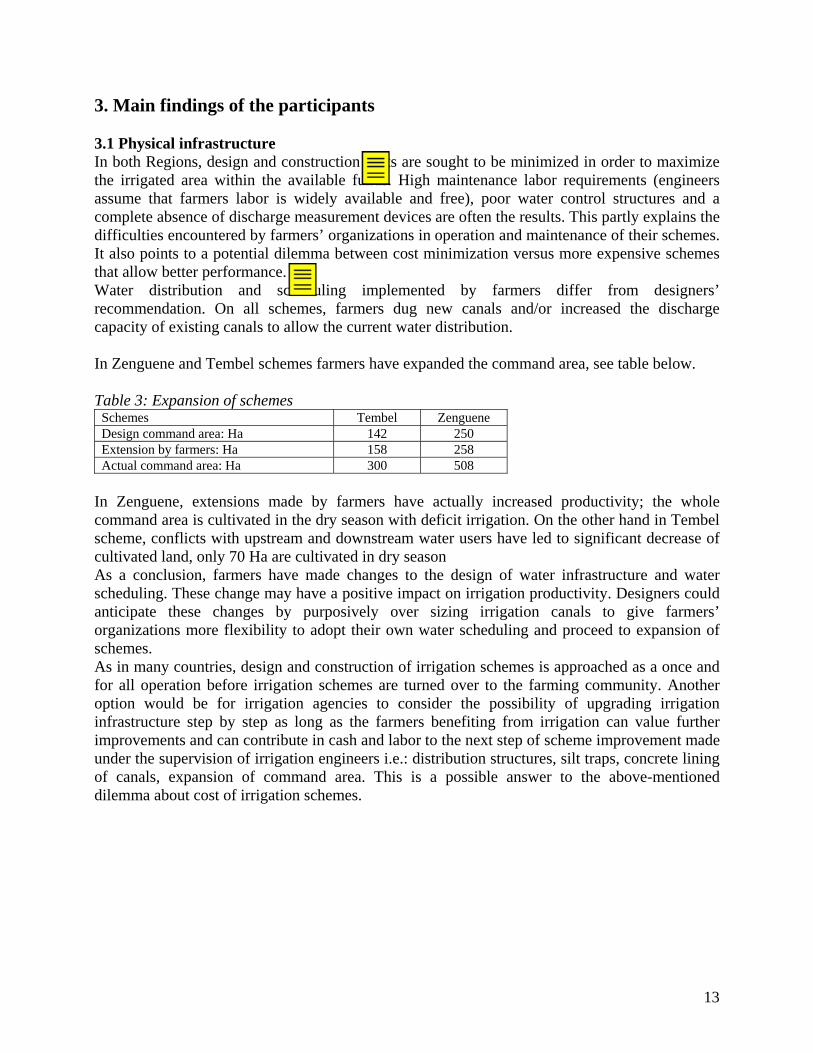
3. Main findings of the participants 3.1 Physical infrastructure In both Regions, design and construction costs are sought to be minimized in order to maximize the irrigated area within the available funds. High maintenance labor requirements (engineers assume that farmers labor is widely available and free), poor water control structures and a complete absence of discharge measurement devices are often the results. This partly explains the difficulties encountered by farmers’ organizations in operation and maintenance of their schemes. It also points to a potential dilemma between cost minimization versus more expensive schemes that allow better performance. Water distribution and scheduling implemented by farmers differ from designers’ recommendation. On all schemes, farmers dug new canals and/or increased the discharge capacity of existing canals to allow the current water distribution. In Zenguene and Tembel schemes farmers have expanded the command area, see table below. Table 3: Expansion of schemes
Schemes Tembel Zenguene Design command area: Ha 142 250 Extension by farmers: Ha 158 258 Actual command area: Ha 300 508
In Zenguene, extensions made by farmers have actually increased productivity; the whole command area is cultivated in the dry season with deficit irrigation. On the other hand in Tembel scheme, conflicts with upstream and downstream water users have led to significant decrease of cultivated land, only 70 Ha are cultivated in dry season As a conclusion, farmers have made changes to the design of water infrastructure and water scheduling. These change may have a positive impact on irrigation productivity. Designers could anticipate these changes by purposively over sizing irrigation canals to give farmers’ organizations more flexibility to adopt their own water scheduling and proceed to expansion of schemes. As in many countries, design and construction of irrigation schemes is approached as a once and for all operation before irrigation schemes are turned over to the farming community. Another option would be for irrigation agencies to consider the possibility of upgrading irrigation infrastructure step by step as long as the farmers benefiting from irrigation can value further improvements and can contribute in cash and labor to the next step of scheme improvement made under the supervision of irrigation engineers i.e.: distribution structures, silt traps, concrete lining of canals, expansion of command area. This is a possible answer to the above-mentioned dilemma about cost of irrigation schemes.
13
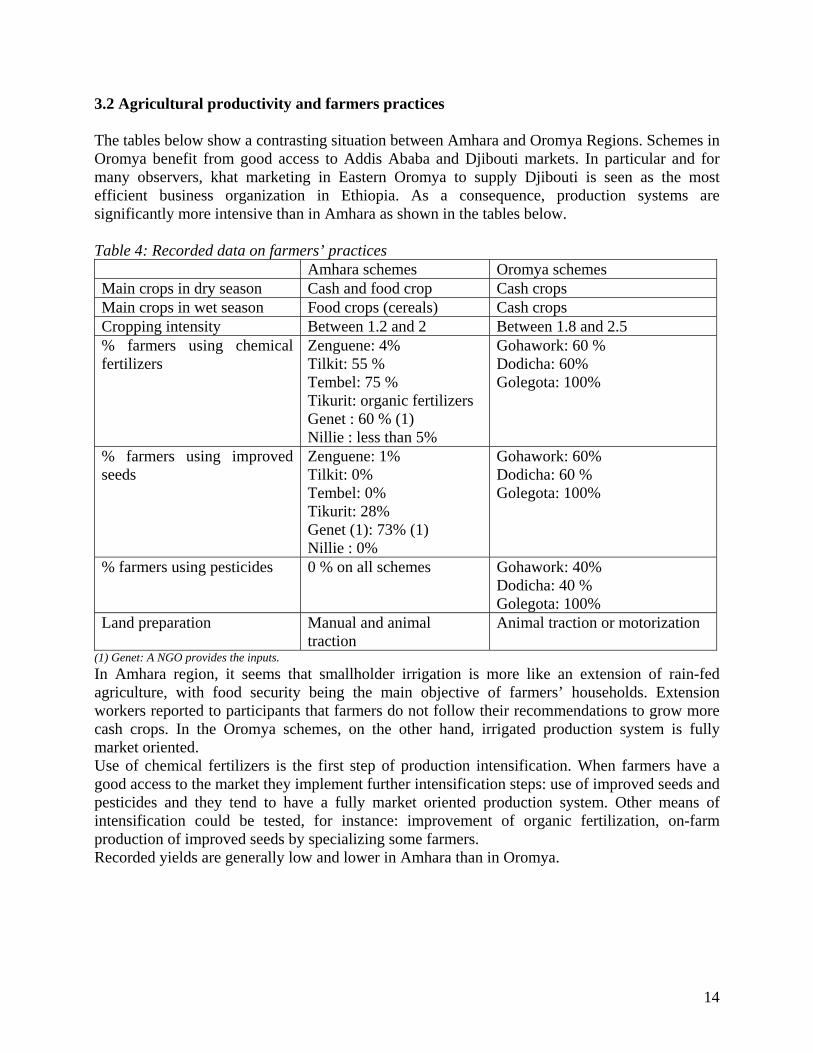
3.2 Agricultural productivity and farmers practices The tables below show a contrasting situation between Amhara and Oromya Regions. Schemes in Oromya benefit from good access to Addis Ababa and Djibouti markets. In particular and for many observers, khat marketing in Eastern Oromya to supply Djibouti is seen as the most efficient business organization in Ethiopia. As a consequence, production systems are significantly more intensive than in Amhara as shown in the tables below. Table 4: Recorded data on farmers’ practices Amhara schemes Oromya schemes Main crops in dry season Cash and food crop Cash crops Main crops in wet season Food crops (cereals) Cash crops Cropping intensity Between 1.2 and 2 Between 1.8 and 2.5 % farmers using chemical fertilizers
Zenguene: 4% Tilkit: 55 % Tembel: 75 % Tikurit: organic fertilizers Genet : 60 % (1) Nillie : less than 5%
Gohawork: 60 % Dodicha: 60% Golegota: 100%
% farmers using improved seeds
Zenguene: 1% Tilkit: 0% Tembel: 0% Tikurit: 28% Genet (1): 73% (1) Nillie : 0%
Gohawork: 60% Dodicha: 60 % Golegota: 100%
% farmers using pesticides 0 % on all schemes Gohawork: 40% Dodicha: 40 % Golegota: 100%
Land preparation Manual and animal traction
Animal traction or motorization
(1) Genet: A NGO provides the inputs. In Amhara region, it seems that smallholder irrigation is more like an extension of rain-fed agriculture, with food security being the main objective of farmers’ households. Extension workers reported to participants that farmers do not follow their recommendations to grow more cash crops. In the Oromya schemes, on the other hand, irrigated production system is fully market oriented. Use of chemical fertilizers is the first step of production intensification. When farmers have a good access to the market they implement further intensification steps: use of improved seeds and pesticides and they tend to have a fully market oriented production system. Other means of intensification could be tested, for instance: improvement of organic fertilization, on-farm production of improved seeds by specializing some farmers. Recorded yields are generally low and lower in Amhara than in Oromya.
14
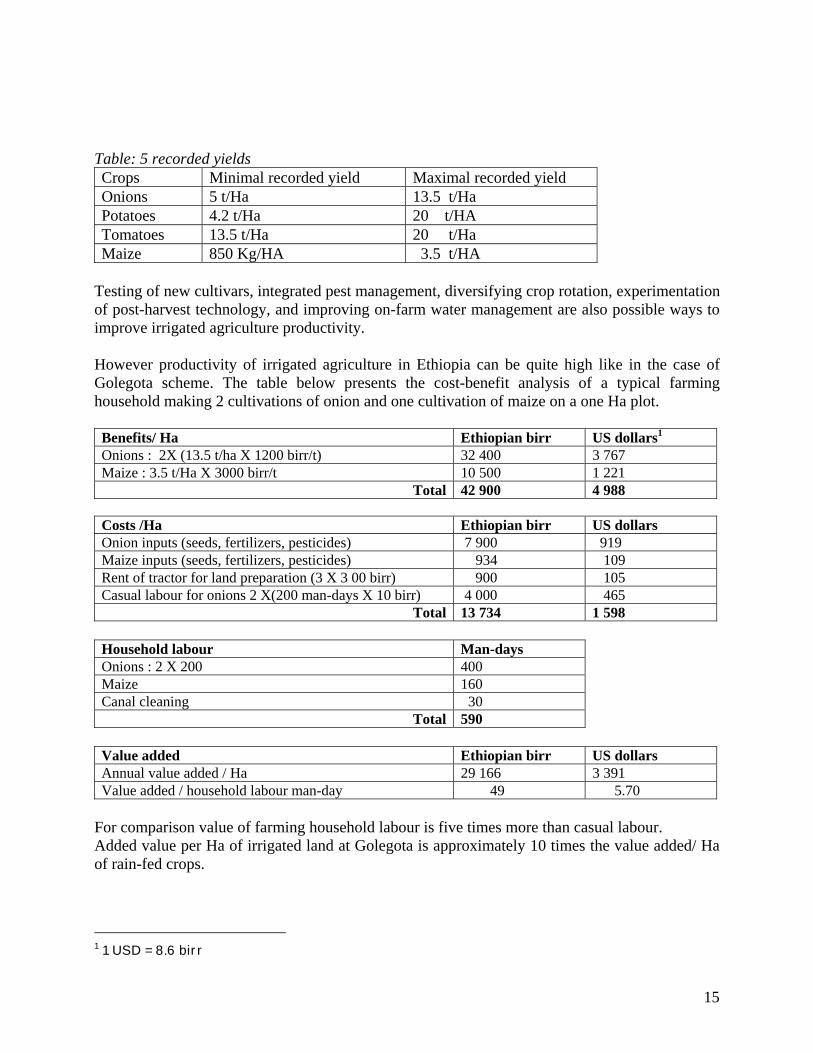
Table: 5 recorded yields Crops Minimal recorded yield Maximal recorded yield Onions 5 t/Ha 13.5 t/Ha Potatoes 4.2 t/Ha 20 t/HA Tomatoes 13.5 t/Ha 20 t/Ha Maize 850 Kg/HA 3.5 t/HA
Testing of new cultivars, integrated pest management, diversifying crop rotation, experimentation of post-harvest technology, and improving on-farm water management are also possible ways to improve irrigated agriculture productivity. However productivity of irrigated agriculture in Ethiopia can be quite high like in the case of Golegota scheme. The table below presents the cost-benefit analysis of a typical farming household making 2 cultivations of onion and one cultivation of maize on a one Ha plot. Benefits/ Ha Ethiopian birr US dollars1 Onions : 2X (13.5 t/ha X 1200 birr/t) 32 400 3 767 Maize : 3.5 t/Ha X 3000 birr/t 10 500 1 221
Total 42 900 4 988 Costs /Ha Ethiopian birr US dollars Onion inputs (seeds, fertilizers, pesticides) 7 900 919 Maize inputs (seeds, fertilizers, pesticides) 934 109 Rent of tractor for land preparation (3 X 3 00 birr) 900 105 Casual labour for onions 2 X(200 man-days X 10 birr) 4 000 465
Total 13 734 1 598 Household labour Man-days Onions : 2 X 200 400 Maize 160 Canal cleaning 30
Total 590 Value added Ethiopian birr US dollars Annual value added / Ha 29 166 3 391 Value added / household labour man-day 49 5.70
For comparison value of farming household labour is five times more than casual labour. Added value per Ha of irrigated land at Golegota is approximately 10 times the value added/ Ha of rain-fed crops.
1 1 USD = 8.6 birr
15
3.3 Farmers’ organizations Two main types of farmers’ organization are in charge of scheme management: Water Users Association (WUA) or “traditional” Water Users Committee on one hand, Irrigation Cooperative on the other hand. Operation and minor maintenance (canal cleaning) are generally well implemented by farmers’ organizations. However although farmers participation rate in minor maintenance is high the number of man-days per farmers per year seems too low to avoid problems of siltation and over-topping in canals. Minor maintenance is generally performed once a year before starting the dry season irrigation campaign. Furthermore, canal cleaning often leads to change of canal cross-section and to water delivery problems at plot level. Regional irrigation agencies carry out major maintenance and rehabilitation of schemes. The main weaknesses of farmer organizations are:
- Lack of financial capacity; as a consequence even repair works that require a little money to buy materials or to support some external assistance are seen as major maintenance and have to await the intervention of irrigation agencies. Collection of water fees and proper financial management could solve the problem.
- Management of water shortage: About 25% of the command area (tail end farmers) in Zenguene and Tembel, and 50% in Dodicha do not receive sufficient water in dry season.
- Relation with external players: Farmers’ organizations are not pro-active in establishing relations with external players: up stream or down stream water users, merchants and input suppliers. They hardly express their needs to irrigation agencies and extension services although they think they are very important stakeholders of the success of their scheme. Some observers speak about the so called “dependency syndrom”. The fact that in most schemes farmers do not rank their organization as the most important one for success of their scheme tends to confirm this fact.
The irrigation cooperatives of the selected schemes are too recently established to assess their capacity for marketing, input supply and credit distribution. Currently these functions are not or very poorly performed except in Tilkit scheme where Kebele administration and CoSAERAR officers are actually “nursing” the cooperative. A priori, combining O&M and marketing/input supply in one organization (Irrigation cooperative) might turn out to be ineffective. It may be advisable to have one organization to address the issue of O&M, which requires a somehow “forced” cooperation among water users. Input supply and marketing should be cooperation on a voluntary basis leading farmers to organize themselves because of their common interest. In Kenya, for instance, the few cases of combination of Water Users Association dealing with O&M and a cooperative society dealing with input supply and marketing have all collapsed. Irrigation cooperative of the selected schemes were formed on the initiative of government agencies in the fist year the schemes were in operation. This leads to questions about the real interest of farmers for this type of organization. The fact that in some schemes a majority of farmers are not members of the cooperative tends to support the view that they see little interest in it. The size of schemes should also be considered -- is it worth to establish a cooperative for a 45 Ha scheme like Tilkit? Alternative options like forming informal groups to buy inputs or market produce together should be assessed. On the other hand, the formation of a cooperative at
16
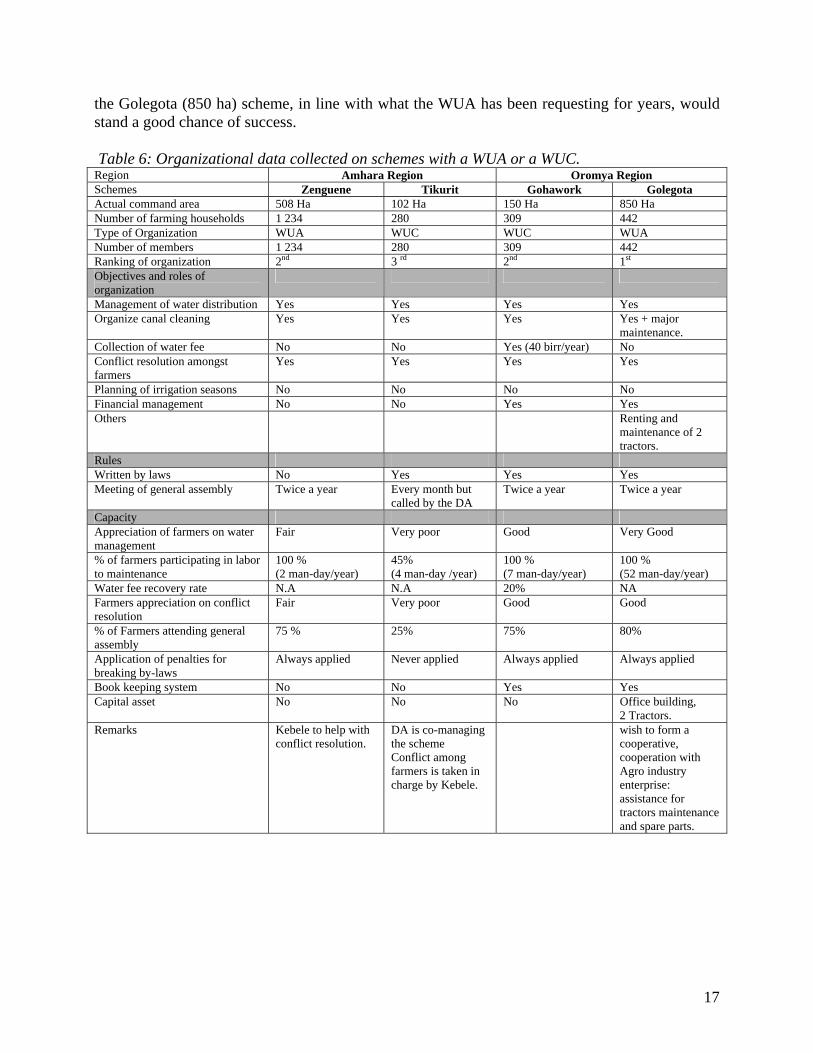
the Golegota (850 ha) scheme, in line with what the WUA has been requesting for years, would stand a good chance of success. Table 6: Organizational data collected on schemes with a WUA or a WUC. Region Amhara Region Oromya Region Schemes Zenguene Tikurit Gohawork Golegota Actual command area 508 Ha 102 Ha 150 Ha 850 Ha Number of farming households 1 234 280 309 442 Type of Organization WUA WUC WUC WUA Number of members 1 234 280 309 442 Ranking of organization 2nd 3 rd 2nd 1st Objectives and roles of organization
Management of water distribution Yes Yes Yes Yes Organize canal cleaning Yes Yes Yes Yes + major
maintenance. Collection of water fee No No Yes (40 birr/year) No Conflict resolution amongst farmers
Yes Yes Yes Yes
Planning of irrigation seasons No No No No Financial management No No Yes Yes Others Renting and
maintenance of 2 tractors.
Rules Written by laws No Yes Yes Yes Meeting of general assembly Twice a year Every month but
called by the DA Twice a year Twice a year
Capacity Appreciation of farmers on water management
Fair Very poor Good Very Good
% of farmers participating in labor to maintenance
100 % (2 man-day/year)
45% (4 man-day /year)
100 % (7 man-day/year)
100 % (52 man-day/year)
Water fee recovery rate N.A N.A 20% NA Farmers appreciation on conflict resolution
Fair Very poor Good Good
% of Farmers attending general assembly
75 % 25% 75% 80%
Application of penalties for breaking by-laws
Always applied Never applied Always applied Always applied
Book keeping system No No Yes Yes Capital asset No No No Office building,
2 Tractors. Remarks Kebele to help with
conflict resolution. DA is co-managing the scheme Conflict among farmers is taken in charge by Kebele.
wish to form a cooperative, cooperation with Agro industry enterprise: assistance for tractors maintenance and spare parts.
17
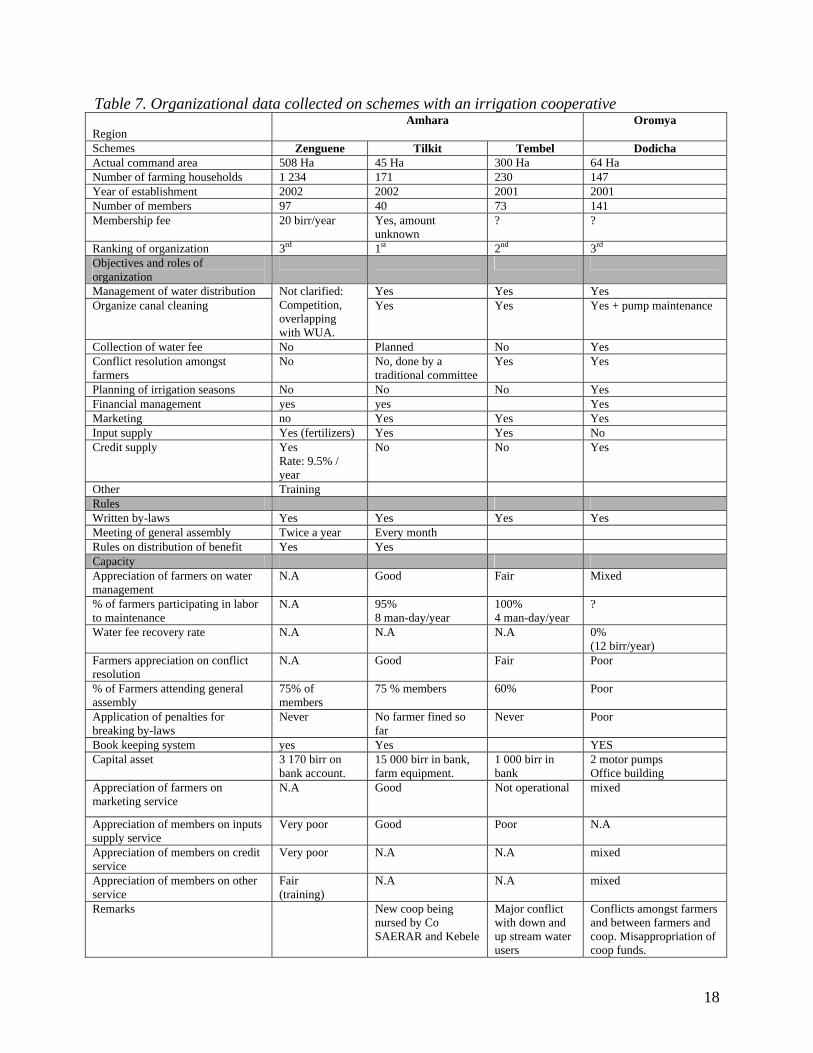
Table 7. Organizational data collected on schemes with an irrigation cooperative Region
Amhara Oromya
Schemes Zenguene Tilkit Tembel Dodicha Actual command area 508 Ha 45 Ha 300 Ha 64 Ha Number of farming households 1 234 171 230 147 Year of establishment 2002 2002 2001 2001 Number of members 97 40 73 141 Membership fee 20 birr/year Yes, amount
unknown ? ?
Ranking of organization 3rd 1st 2nd 3rd Objectives and roles of organization
Management of water distribution Yes Yes Yes Organize canal cleaning
Not clarified: Competition, overlapping with WUA.
Yes Yes Yes + pump maintenance
Collection of water fee No Planned No Yes Conflict resolution amongst farmers
No No, done by a traditional committee
Yes Yes
Planning of irrigation seasons No No No Yes Financial management yes yes Yes Marketing no Yes Yes Yes Input supply Yes (fertilizers) Yes Yes No Credit supply Yes
Rate: 9.5% / year
No No Yes
Other Training Rules Written by-laws Yes Yes Yes Yes Meeting of general assembly Twice a year Every month Rules on distribution of benefit Yes Yes Capacity Appreciation of farmers on water management
N.A Good Fair Mixed
% of farmers participating in labor to maintenance
N.A 95% 8 man-day/year
100% 4 man-day/year
?
Water fee recovery rate N.A N.A
N.A 0% (12 birr/year)
Farmers appreciation on conflict resolution
N.A Good Fair Poor
% of Farmers attending general assembly
75% of members
75 % members 60% Poor
Application of penalties for breaking by-laws
Never No farmer fined so far
Never Poor
Book keeping system yes Yes YES Capital asset 3 170 birr on
bank account. 15 000 birr in bank, farm equipment.
1 000 birr in bank
2 motor pumps Office building
Appreciation of farmers on marketing service
N.A Good Not operational mixed
Appreciation of members on inputs supply service
Very poor
Good Poor N.A
Appreciation of members on credit service
Very poor N.A N.A mixed
Appreciation of members on other service
Fair (training)
N.A N.A mixed
Remarks New coop being nursed by Co SAERAR and Kebele
Major conflict with down and up stream water users
Conflicts amongst farmers and between farmers and coop. Misappropriation of coop funds.
18
Socio-economic environment
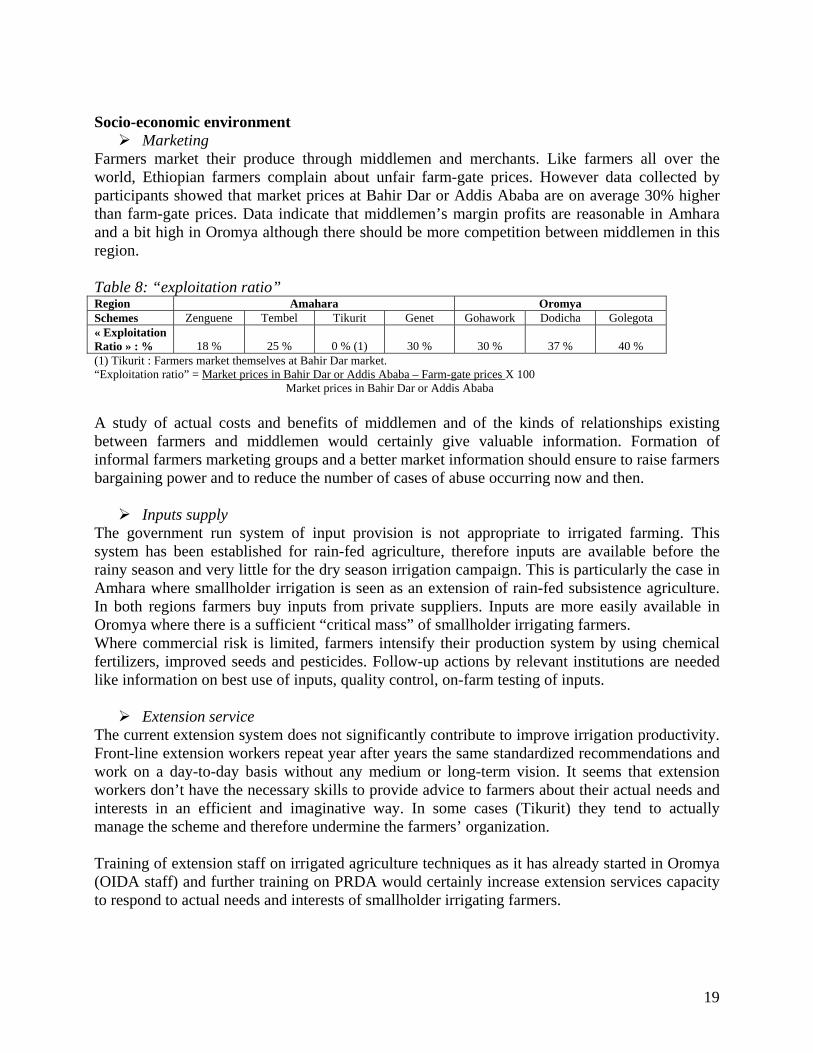
Marketing Farmers market their produce through middlemen and merchants. Like farmers all over the world, Ethiopian farmers complain about unfair farm-gate prices. However data collected by participants showed that market prices at Bahir Dar or Addis Ababa are on average 30% higher than farm-gate prices. Data indicate that middlemen’s margin profits are reasonable in Amhara and a bit high in Oromya although there should be more competition between middlemen in this region. Table 8: “exploitation ratio” Region Amahara Oromya Schemes Zenguene Tembel Tikurit Genet Gohawork Dodicha Golegota « Exploitation Ratio » : %
18 %
25 %
0 % (1)
30 %
30 %
37 %
40 %
(1) Tikurit : Farmers market themselves at Bahir Dar market. “Exploitation ratio” = Market prices in Bahir Dar or Addis Ababa – Farm-gate prices X 100 Market prices in Bahir Dar or Addis Ababa A study of actual costs and benefits of middlemen and of the kinds of relationships existing between farmers and middlemen would certainly give valuable information. Formation of informal farmers marketing groups and a better market information should ensure to raise farmers bargaining power and to reduce the number of cases of abuse occurring now and then.
Inputs supply The government run system of input provision is not appropriate to irrigated farming. This system has been established for rain-fed agriculture, therefore inputs are available before the rainy season and very little for the dry season irrigation campaign. This is particularly the case in Amhara where smallholder irrigation is seen as an extension of rain-fed subsistence agriculture. In both regions farmers buy inputs from private suppliers. Inputs are more easily available in Oromya where there is a sufficient “critical mass” of smallholder irrigating farmers. Where commercial risk is limited, farmers intensify their production system by using chemical fertilizers, improved seeds and pesticides. Follow-up actions by relevant institutions are needed like information on best use of inputs, quality control, on-farm testing of inputs.
Extension service The current extension system does not significantly contribute to improve irrigation productivity. Front-line extension workers repeat year after years the same standardized recommendations and work on a day-to-day basis without any medium or long-term vision. It seems that extension workers don’t have the necessary skills to provide advice to farmers about their actual needs and interests in an efficient and imaginative way. In some cases (Tikurit) they tend to actually manage the scheme and therefore undermine the farmers’ organization. Training of extension staff on irrigated agriculture techniques as it has already started in Oromya (OIDA staff) and further training on PRDA would certainly increase extension services capacity to respond to actual needs and interests of smallholder irrigating farmers.
19
20
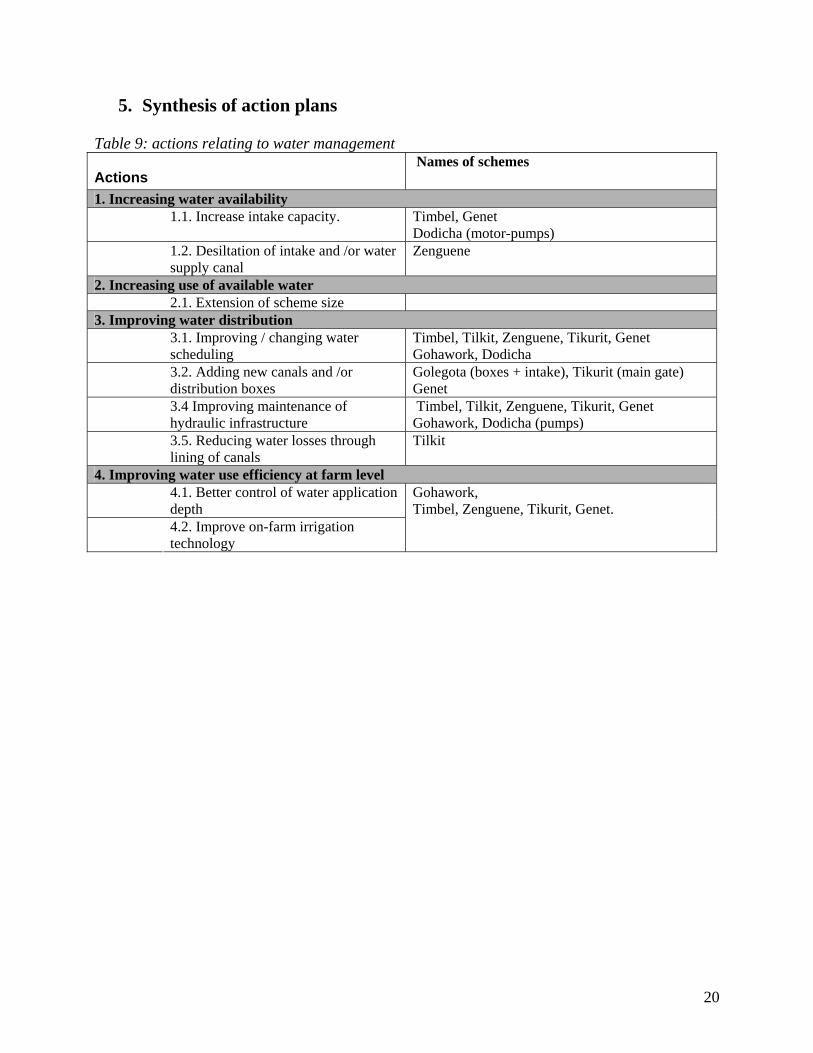
5. Synthesis of action plans Table 9: actions relating to water management
Actions Names of schemes
1. Increasing water availability 1.1. Increase intake capacity. Timbel, Genet
Dodicha (motor-pumps) 1.2. Desiltation of intake and /or water
supply canal Zenguene
2. Increasing use of available water 2.1. Extension of scheme size 3. Improving water distribution 3.1. Improving / changing water
scheduling Timbel, Tilkit, Zenguene, Tikurit, Genet Gohawork, Dodicha
3.2. Adding new canals and /or distribution boxes
Golegota (boxes + intake), Tikurit (main gate) Genet
3.4 Improving maintenance of hydraulic infrastructure
Timbel, Tilkit, Zenguene, Tikurit, Genet Gohawork, Dodicha (pumps)
3.5. Reducing water losses through lining of canals
Tilkit
4. Improving water use efficiency at farm level 4.1. Better control of water application
depth 4.2. Improve on-farm irrigation
technology
Gohawork, Timbel, Zenguene, Tikurit, Genet.
21
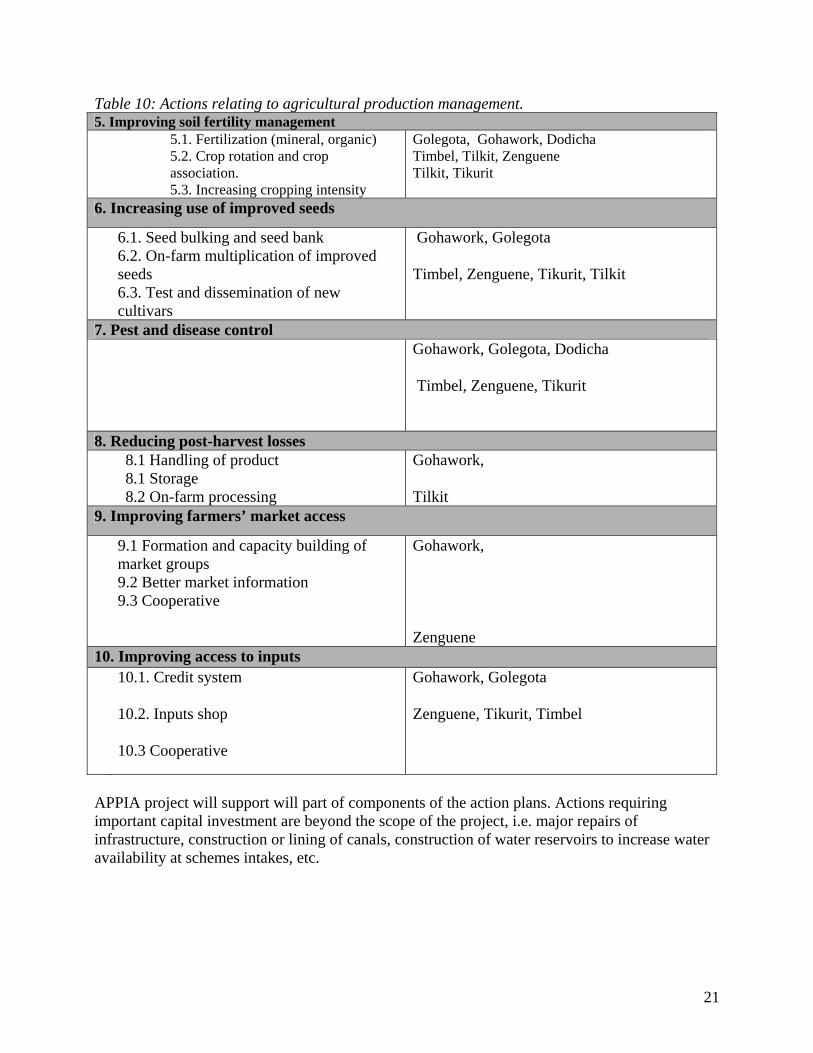
Table 10: Actions relating to agricultural production management. 5. Improving soil fertility management 5.1. Fertilization (mineral, organic)
5.2. Crop rotation and crop association. 5.3. Increasing cropping intensity
Golegota, Gohawork, Dodicha Timbel, Tilkit, Zenguene Tilkit, Tikurit
6. Increasing use of improved seeds
6.1. Seed bulking and seed bank 6.2. On-farm multiplication of improved seeds 6.3. Test and dissemination of new cultivars
Gohawork, Golegota Timbel, Zenguene, Tikurit, Tilkit
7. Pest and disease control Gohawork, Golegota, Dodicha
Timbel, Zenguene, Tikurit
8. Reducing post-harvest losses 8.1 Handling of product
8.1 Storage 8.2 On-farm processing
Gohawork, Tilkit
9. Improving farmers’ market access
9.1 Formation and capacity building of market groups 9.2 Better market information 9.3 Cooperative
Gohawork, Zenguene
10. Improving access to inputs 10.1. Credit system
10.2. Inputs shop 10.3 Cooperative
Gohawork, Golegota Zenguene, Tikurit, Timbel
APPIA project will support will part of components of the action plans. Actions requiring important capital investment are beyond the scope of the project, i.e. major repairs of infrastructure, construction or lining of canals, construction of water reservoirs to increase water availability at schemes intakes, etc.
22
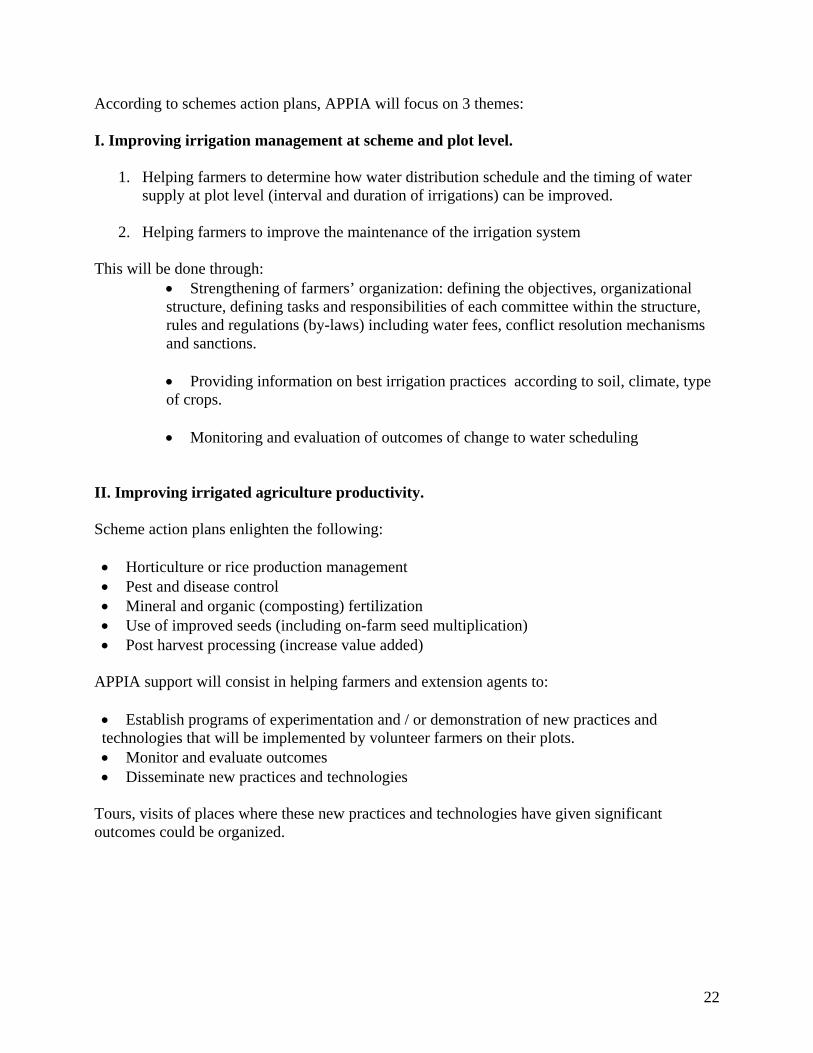
According to schemes action plans, APPIA will focus on 3 themes: I. Improving irrigation management at scheme and plot level.
1. Helping farmers to determine how water distribution schedule and the timing of water supply at plot level (interval and duration of irrigations) can be improved.
2. Helping farmers to improve the maintenance of the irrigation system
This will be done through:
• Strengthening of farmers’ organization: defining the objectives, organizational structure, defining tasks and responsibilities of each committee within the structure, rules and regulations (by-laws) including water fees, conflict resolution mechanisms and sanctions.
• Providing information on best irrigation practices according to soil, climate, type of crops.
• Monitoring and evaluation of outcomes of change to water scheduling
II. Improving irrigated agriculture productivity. Scheme action plans enlighten the following: • Horticulture or rice production management • Pest and disease control • Mineral and organic (composting) fertilization • Use of improved seeds (including on-farm seed multiplication) • Post harvest processing (increase value added)
APPIA support will consist in helping farmers and extension agents to: • Establish programs of experimentation and / or demonstration of new practices and technologies that will be implemented by volunteer farmers on their plots. • Monitor and evaluate outcomes • Disseminate new practices and technologies
Tours, visits of places where these new practices and technologies have given significant outcomes could be organized.
23
III. Improving input supply and marketing. Scheme action plans enlighten: • Constitution of marketing groups • Increase farmers market information • Diversification of production, more market oriented choice of crops and crop rotation • Contract farming • Seed bulking and seed bank. • Access to credit These issues are linked to macro-economic factors such as prices, banking / credit systems, national market organization and international market conditions (rice, export products, cost of imported chemicals) that are far beyond the scope of APPIA. APPIA intervention will be limited to action aiming at strengthening farmers’ organization for : • Inputs supply (fertilizers and seed bulking):
Establish mechanisms at scheme level to identify what types of inputs are needed, and estimate quantity requirements. Raise farmers’ negotiation power with input providers, establishment of inputs supply contracts.
• Marketing: improving farmers’ market access through formation of marketing groups, establishing contracts with traders.
• Providing training on financial management at WUA or farming household levels.
24
CONCLUSION Training to PRDA methodology took 31 days for groups of approximately 20 persons and to finalize diagnosis and action plan of 5 small scale irrigation schemes. Apart from staff time the training involves very little cash cost, it can therefore become a regular activity of irrigation institutions, NGOs and vocational training centers. The manual explains in a straightforward manner how to do a PRDA, hence it can also be used by trainers to plan training sessions with or without the support of IWMI-APPIA project. For trained personal, doing a PRDA would take two to four weeks depending on size of scheme. Main difficulty encountered during training sessions were due to the fact that many participants had difficulties to draw conclusions from observed facts whenever it they contradicted their opinion on farmers capacity and actions or the philosophy of their respective institution. This points to need for extension personal for a change of attitude. Farmers’ ownership of diagnosis and action plan is the main outcome of PRDA and a major factor of success to implement the action plan. The farming community represented by its organizations such as WUA or irrigation cooperative will be the main stakeholder and will take the leading responsibility in implementing the action plan with the support of extension services. Implementation of action plans would also be a mean to test and check the validity of the diagnosis.