improving highway safety with intelligent transportation … · improving highway safety with...
TRANSCRIPT
Improving Highway Safety with Intelligent Transportation
Systems
Jessica Hutton
BS Civil Engineering 2003 University of Missouri-Columbia
August 6, 2003
Sponsored by
and

Hutton
2
Table of Contents
About the Author 2
Wise Program 2
Acknowledgements 3
Introduction 4
Causes of Highway Fatalities and Accidents 8
Key Players 15 Government 15
Non-Government 19
Transportation Reauthorization 21 President’s Proposal 21
Congressional Criticisms 25
Other Recommendations 28
State of ITS X Available Technologies 33
Future Technologies 37
Benefits realized 38
Roadblocks to deployment 40
Recommendations 42
Conclusions 47
Works Cited 49

Hutton
3
About the Author
Jessica Hutton received her BS in Civil Engineering from the University of Missouri-
Columbia in May, 2003. She will begin her career with the Missouri Department of
Transportation as a Traffic Engineering when she returns to Missouri at the end of the
summer. She has also begun taking classes toward a Masters in Public Administration with
an emphasis in public policy at the Truman School of Public Affairs at the University of
Missouri. She participated in the Washington Internships for Students in Engineering in the
summer of 2003, and was sponsored by the American Society of Civil Engineers.
The WISE Program
The Washington Internships for Students of Engineering, created in 1980, is the joint effort
of the National Science Foundation and several professional engineering societies. Each
summer, 12 to 16 engineering students from around the country apply to take part in the
WISE program to become familiar with the intersection of science and technology and public
policy. The WISE program strives to make the future leaders of the engineering profession
aware of the ways in which they can and should participate in important legislative and
regulatory policy decisions. During the ten weeks of the program, students work with a
mentor from their sponsoring society to choose and research a relevant technical policy issue.
During the last week of the program, the students present their analyses of the subject in a
final presentation, and the completed papers are published on the WISE website in the
Journal of Engineering and Public Policy. Students also participate in meetings with various
congressional leaders and committees, executive office departments, and governmental and
private research groups. WISE interns are housed on the George Washington Campus and are
provided a stipend during their stay.
Hutton
4
Acknowledgements
I would like to thank the American Society of Civil Engineers for choosing to continue to
participate in the WISE program at a time when it would have been easy to remove from the
budget. ASCE has given me an office, computer, internet access and phone, as well as any
needed supplies during my stay in D.C. this summer. The Government Relations staff,
including my mentor, Martin Hight, has provided me with resources and guidance throughout
the project. I would also like to thank Dr. Jim Dennison, who served as Faculty Member in
Residence to this year’s WISE interns. He provided motivation, guidance and an abundance
of patience throughout the phases of our projects.

Hutton
5
Introduction Each year, over 42,000 people lose their lives on our nation’s roads. The losses associated with these accidents include not only the lives of those involved, but also the time spent in stopped or slowed traffic, excess fuel consumption, the cost of health care, and tax dollars spent on emergency response. The total cost reaches over $230 billion, according to a GAO report in 2001.1 Productivity loss accounts for $81 billion of the total cost, medical expenses cost $32.6 billion, and property damages make up $59 billion of the $230 billion. This is roughly equivalent to $820 for every person living in the United States. Although the rate of highway fatalities has steadily decreased, considering the increase in the number of vehicle miles traveled each year, the number of fatalities has remained flat, and transportation-related deaths remain the number one cause of death among people ages 1 to 34.2 The cost to society in lives, wasted fuel and time, emergency services and decreased productivity is unacceptable and must be reduced.
Highway fatalities and fatality rate
0
10,000
20,000
30,000
40,000
50,000
60,000
1960
1965
1970
1975
1980
1985
1990
1991
1992
1993
1994
1995
1996
1997
1998
1999
2000
2001
0.0
1.0
2.0
3.0
4.0
5.0
6.0
Fatalities
Fatality Rate (per 100 million VMT)
1 General Accounting Office. “Factors Contributing to Traffic Crashes and NHTSA’s Efforts to Address Them.” GAO-03-744R. May 22, 2003. < www.gao.gov/new.items/d03730t.pdf > June 10, 2003. 2 Runge, Jeffery W. Administrator, National Highway Traffic Safety Administration. “Testimony before the Subcommittee on Highways, Transit and Pipelines, Committee on Transportation and Infrastructure, United States House of Representatives.” May 21, 2003. < http://www.house.gov/transportation/highway/05-21-03/runge.pdf > June 24, 2003.
Figure 1: Number and rate of highway fatalities.

Hutton
6
The Transportation Equity Act for the 21st Century, which authorized surface
transportation spending from 1998 till 2003, expires September 30, 2003. This only gives
Congress a few months to set the policy guidelines for transportation programs and spending
recommendations for the next several years. In May 2003, President Bush submitted his
Safe, Accountable, Flexible and Efficient Transportation Equity Act, or SAFETEA, which
follows in the footsteps of its predecessors, ISTEA and TEA-21, and has recently been
introduced in both houses of Congress. As the name of the bill suggests, the main focus is on
transportation safety, and one of SAFETEA’s main objectives is to reduce the number of
highway deaths from 1.5 to 1.0 fatality per 100 million vehicle miles traveled by 2008.3 The
bill allocates significant resources to safety programs, creates a Blue Ribbon Panel, and
encourages states to implement their own safety strategies by allowing funding flexibility for
safety programs that are working. Both houses of Congress are drafting reauthorization
legislation, and several other organizations are providing recommendations for overall
funding levels and policies in the reauthorization as well.
In order to determine the best way to allocate limited funding to programs that
effectively and efficiently work toward the goal of highway safety, it is important to
understand the significant factors leading to car accidents. Reports show that most car
accidents are caused by a combination of human factors, road conditions, and vehicle failure.
Many programs have been implemented to address driving behavior, such as “click-it or
ticket” campaigns and state legislation that reduces legally allowable blood alcohol levels of
drivers. The automobile industry is continually developing better restraining systems, crash
avoidance systems, and vehicle location devices. Research has also been conducted to create
intelligent infrastructure and driver warning systems. In order to significantly increase
highway safety, all three strategies—behavior modification and driver education, vehicle
safety, and smart infrastructure—must be used in conjunction with one another.
While safety is the highest priority, reducing congestion on our nation’s highway has
also become a major concern. Between 1985 and 1995, the number of vehicle miles traveled
per year has increased 37 percent, while the number of lane miles constructed has only
3 Office of Management and Budget. Department of Transportation. Budget FY 2004. < http://whitehouse.gov/omb/budget/fy2004/transportation.html > July 24, 2003.
Hutton
7
increase by 1 percent over the same time period.4 Road construction crews are at work in
more locations for longer periods of time as they try to increase capacity to meet the growing
demand. Even so, congestion in many urban areas continues to increase. Safety in work
zones and congested areas is becoming increasingly important, and improving the safe,
efficient flow of traffic on congested highways is essential.
The standard solution to increased congestion is building more highway lane miles.
Although more roadway miles do mean more capacity and less congestion, it is an expensive
solution. In many urban areas, the number of lane-miles that can be added to a system is not
only limited by the staggering cost, but also by the amount of space available for
construction. Funding for safety is typically invested into educational and behavioral
programs that focus on seatbelt use and decreasing impaired driving. Although reducing the
number of alcohol-related incidents and the number of fatalities that could have been
prevented with seatbelt use is important, it is not the only safety precaution available.
Increasing funding for behavioral programs begins to have diminishing returns at some point.
A 100 percent compliance with traffic safety laws will never be realized, no matter how
much money is invested in the programs. Safer and smarter highway infrastructure,
intelligent vehicle applications and systems capable of warning drivers of potential hazards
can be, in many cases, very efficient ways of minimizing the consequences of traffic
violations and impaired driving.
Several Intelligent Transportation Systems (ITS) exist to help control the flow of
traffic, coordinate signal timing to reduce conflict in intersections, pass important traffic
information along to drivers, warn travelers of inclement weather conditions, reduce
congestion along toll roads with electronic fare collection, and reduce the number of red-light
and speeding violations with automatic enforcement devices. ITS can also be used to gather
data and report it to emergency response teams so that response times are reduced. Many of
these technologies have been in existence long enough for useful information regarding their
effectiveness, cost and benefits to be obtained, and much of this information is being
collected in a national database. Some technologies are cutting edge and are only in the
concept or preliminary experimental phases. As the information becomes available, it is
4 American Road and Transportation Builders Association. “The Federal Highway Program and Highway Safety.” 1998. < www.ntweek.org/campaigns/econ1.pdf > August 1, 2003.
Hutton
8
necessary that the lessons learned from each implementation be passed along to other
researchers and DOTs, so the benefits of available technologies can be realized by all
communities. Ideally, as states and communities continue to invest in transportation
infrastructure projects, they will incorporate ITS strategies that make sense for each project.
The goal is to eventually create a national system, capable of real time communication that
safely and efficiently moves people, goods and services across the country.

Hutton
9
Background: Causes of highway accidents and fatalities The causes of vehicle accidents fall into three main categories: human factors, road
and environmental conditions, and vehicle failure or malfunction. But rarely is any accident
the result of a single, easily determined cause. In many cases, circumstances leading to a
crash involve factors from more than one of the categories. For example, an accident
involving a young driver whose breaks aren’t functioning properly driving on icy pavement
has several contributing factors, even though only one may be named in the accident report.
A report published by the General Accounting Office claims that human factors, which
include speeding, violating traffic laws, inattention, age, effects of alcohol and drugs, and
decision errors, most often contribute to accidents. Roadway environment, such as roadside
hazards, poor road design, pavement conditions and weather, closely follow human factors,
with vehicle factors being the least common contributor to crashes.5
In order to determine the most effective approaches to reduce highway deaths,
injuries, and related costs to acceptable levels, it is necessary to have an accurate and
complete picture of the causes and circumstances of traffic accidents. The last
comprehensive study on the causes of highway accidents was conducted in the 1970’s,6 and
much advancement in road and vehicle safety and changes in driver attitudes have changed
transportation safety issues in the past three decades.
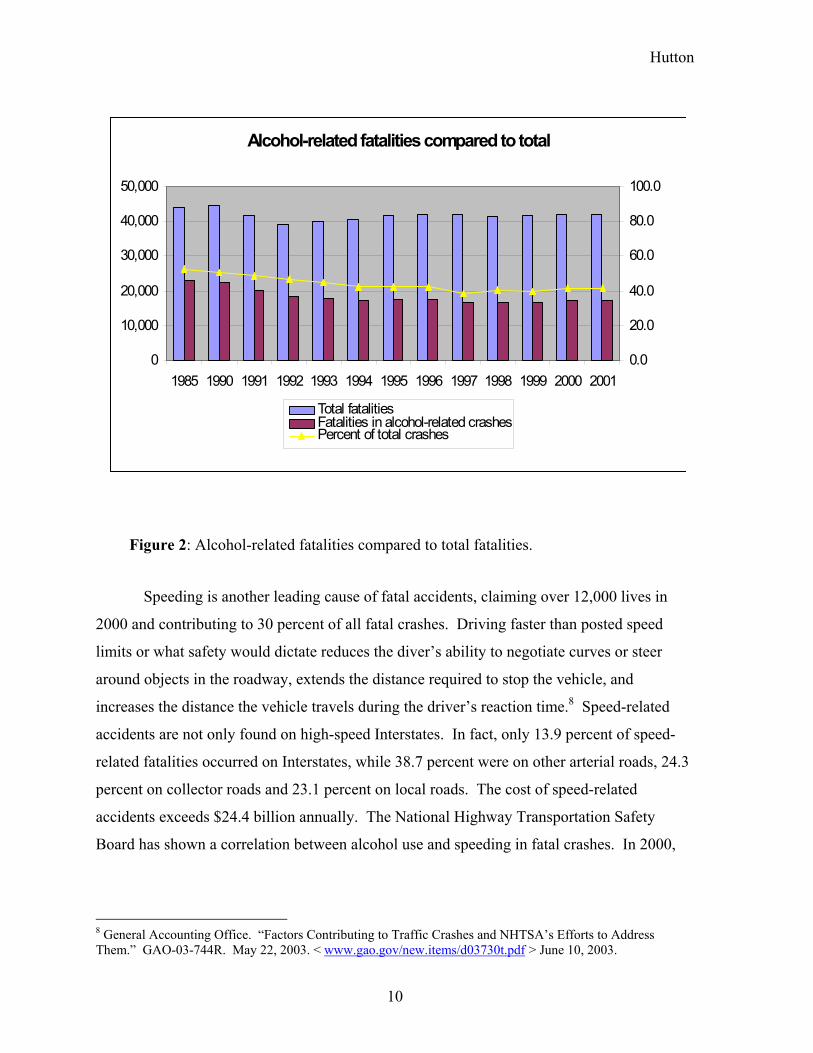
Alcohol-related traffic accidents claimed nearly 18,000 lives in 2002, and driver
impairment due to alcohol is the single most contributing factor to accidents. Although the
rate of alcohol-related fatalities has steadily declined from about 59.6 percent of the total
highway deaths in 1982 to about 39.7 percent in 1999, the percentage has increased in each
of the past three years, and was 41.9 percent in 2002. The rate of alcohol-related highway
fatalities was 0.65 deaths per 100 million vehicle miles traveled in 1997, and has had almost
no further decline since.7
5 General Accounting Office. “Factors Contributing to Traffic Crashes and NHTSA’s Efforts to Address Them.” GAO-03-744R. May 22, 2003. < www.gao.gov/new.items/d03730t.pdf > June 10, 2003. 6 Runge, Jeffery W. Administrator, National Highway Traffic Safety Administration. “Testimony before the Subcommittee on Highways, Transit and Pipelines, Committee on Transportation and Infrastructure, United States House of Representatives.” May 21, 2003. < http://www.house.gov/transportation/highway/05-21-03/runge.pdf > June 24, 2003. 7 General Accounting Office. “Factors Contributing to Traffic Crashes and NHTSA’s Efforts to Address Them.” GAO-03-744R. May 22, 2003. < www.gao.gov/new.items/d03730t.pdf > June 10, 2003.
Hutton
10
Speeding is another leading cause of fatal accidents, claiming over 12,000 lives in
2000 and contributing to 30 percent of all fatal crashes. Driving faster than posted speed
limits or what safety would dictate reduces the diver’s ability to negotiate curves or steer
around objects in the roadway, extends the distance required to stop the vehicle, and
increases the distance the vehicle travels during the driver’s reaction time.8 Speed-related
accidents are not only found on high-speed Interstates. In fact, only 13.9 percent of speed-
related fatalities occurred on Interstates, while 38.7 percent were on other arterial roads, 24.3
percent on collector roads and 23.1 percent on local roads. The cost of speed-related
accidents exceeds $24.4 billion annually. The National Highway Transportation Safety
Board has shown a correlation between alcohol use and speeding in fatal crashes. In 2000,
8 General Accounting Office. “Factors Contributing to Traffic Crashes and NHTSA’s Efforts to Address Them.” GAO-03-744R. May 22, 2003. < www.gao.gov/new.items/d03730t.pdf > June 10, 2003.
Alcohol-related fatalities compared to total
0
10,000
20,000
30,000
40,000
50,000
1985 1990 1991 1992 1993 1994 1995 1996 1997 1998 1999 2000 20010.0
20.0
40.0
60.0
80.0
100.0
Total fatalitiesFatalities in alcohol-related crashesPercent of total crashes
Figure 2: Alcohol-related fatalities compared to total fatalities.
Hutton
11
while only ten percent of nonspeeding underage drivers were intoxicated, 23 percent of
speeding underage drivers were under the influence of alcohol.9
Speeding contributes to fatal accidents more often when weather conditions create
poor road environment. In 2000, speeding was a factor in 27 percent of accidents on dry
roads, 34 percent of accidents on wet roads and 48 percent of accidents on icy roads.
Speeding is also a contributing factor in 27 percent of work zone fatalities. Crashes in
construction and work zones is a growing concern as the number of fatalities in these areas
increased from 868 in 1999 to 1,093 in 2000.10
Almost one-third of all crashes are rear-end collisions. The National Transportation
Safety Board investigated 9 rear-end collisions in which 20 people died and 181 were
injured. In each of these accidents, the driver had a degraded perception of traffic conditions
ahead. None of the drivers tested positive for alcohol or drugs. In some cases, glare, fog or
smoke inhibited the driver’s ability to see upcoming traffic. In other cases, the driver was not
able to detect that traffic had slowed to a halt due to congestion at work zones or accident
scenes. Some drivers may have been distracted or fatigued. A study by Daimler-Benz in
1992 claimed that if drivers are given and additional 0.5 seconds of warning time, 60 percent
of rear-end collisions can be prevented and an extra full second could prevent almost 90
percent of rear-end collisions.11
Seatbelt use, which has increased from 14 percent in 1983 to 75 percent today, has
helped to reduce the number of fatalities on the road.12 However, it is estimated that if the
national average of safety belt use increased from the current 75 percent to 90 percent,
approximately 4,000 lives would be saved annually.13
Driver age is also a significant contributing factor in fatal accidents. Although the
highway fatality rate has been cut in half since 1980, highway vehicle miles traveled have
9 United States Department of Transportation. Federal Highway Administration. “Status of the Nation's Highways, Bridges, and Transit: 2002 Conditions and Performance Report.” Chapter 5: Highway Safety Performance. < http://www.fhwa.dot.gov/policy/2002cpr/ch5.htm > July 8, 2003. 10 Ibid. 11 National Transportation Safety Board. “Vehicle- and Infrastructure-Based Technology for the Prevention of Rear-end Collisions.” NTSB # SIR-01/01. June 16, 2002. <http://ntsb.gov/publictm/2001/SIR0101.htm> 12 General Accounting Office. “Factors Contributing to Traffic Crashes and NHTSA’s Efforts to Address Them.” GAO-03-744R. May 22, 2003. < www.gao.gov/new.items/d03730t.pdf > June 10, 2003. 13 Mineta, Norman Y. Transmittal Letter to the Honorable Richard B. Cheney, President of the Senate. May 12, 2003. < http://www.fhwa.dot.gov/reauthorization/transletter051203cheney.htm > June 12, 2003.

Hutton
12
increased, and are projected to continue their growth rate for the next decade. Younger and
older drivers are expected to increase, and these groups have the highest risk of becoming
involved in an accident. In the next 20 years, the number of drivers over 70 will double, and
these drivers often have poor vision, medication side-effects and slower reaction times.
Drivers under 25 are most likely to be killed in crashes because they have the highest
intoxication rates and the lowest seat-belt use.14
Although roadway environment is believed to be the second most prevalent factor
leading to traffic fatalities, it is difficult to quantify the extent to which it contributes. Poor
road design, location of medians, lack of shoulders, access points, intersection geometry,
sharp curves, poor stopping sight distance, improper speed limits, and roadside hazards all
increase the chances of highway accidents and fatalities. Weather conditions that decrease
visibility and reduce friction on the road are also considered in this category.15 The National
Highway Traffic Safety Administration’s (NHTSA) crash database contains limited
information on how these design features and weather conditions contribute to accidents.16 It
is estimated that poor road conditions and outdated alignments contribute to about 13,000
road-related fatalities in the U.S. each year, almost a third of the total.17
Intersections are prime locations for fatal crashes. One third of rural crashes and one
half of urban crashes occur at intersections. Intersections require drivers to be more aware of
their environment. Decisions have to be based on many factors, including presence of
oncoming traffic, often from more than one direction, speed of oncoming traffic, and traffic
signals or signs. Slight judgment errors can easily lead to accidents in these situations.18 A
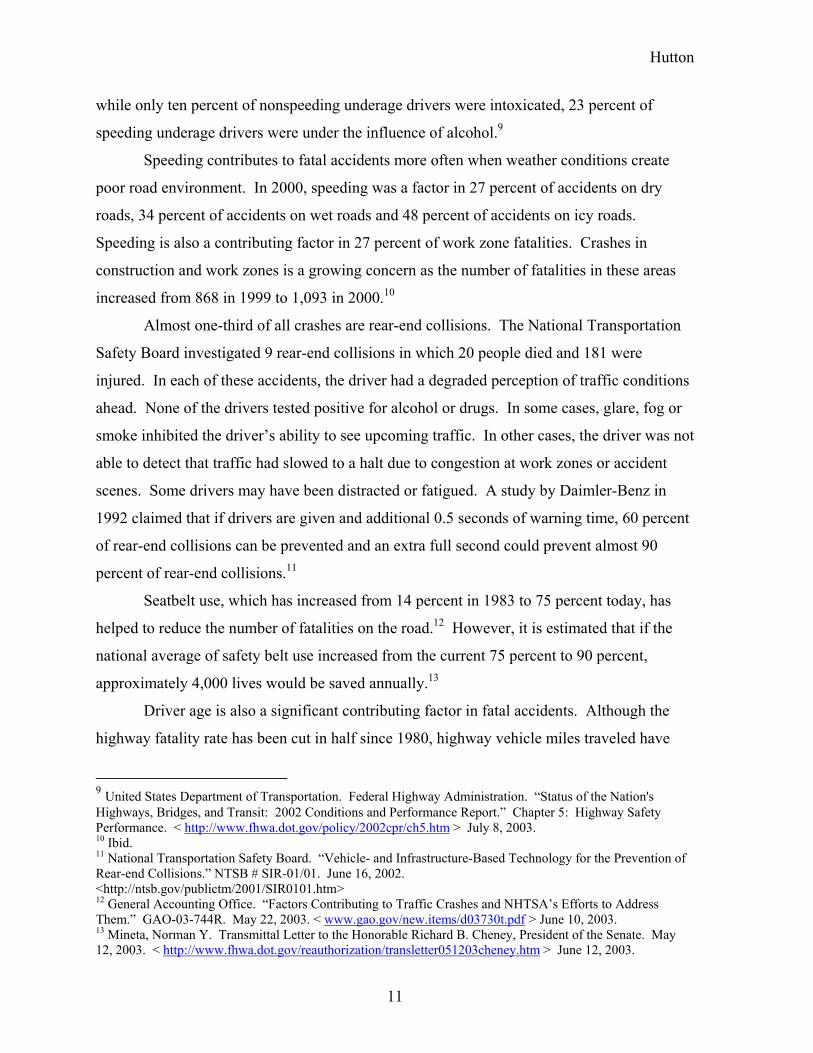
greater number of fatalities occur in rural systems than in urban systems. In the past decade,
fatality rates on rural systems are more than twice the rate on urban systems, with local roads
in rural areas demonstrating the highest fatality rates. Urban freeways and expressways
14 American Association of State Highway and Transportation Officials. “Highway Safety: Facing the Growing Challenge.” < http://www.transportation.org/download/issues/hwysafety2003.pdf > June 25th, 2003. 15 General Accounting Office. “Factors Contributing to Traffic Crashes and NHTSA’s Efforts to Address Them.” GAO-03-744R. May 22, 2003. < www.gao.gov/new.items/d03730t.pdf > June 10, 2003. 16 Ibid. 17 American Road and Transportation Builders Association. “ARTBA Calls for Minimum $50 Billion Per Year Federal Highway Investment in Next Program Reauthorization to Maintain System Conditions.” Press release April 9, 2001. < http://www.artba.org/news/press_releases/2001/04-09-01a.htm > July 21,2003. 18 United States Department of Transportation. Federal Highway Administration. “Status of the Nation's Highways, Bridges, and Transit: 2002 Conditions and Performance Report.” Chapter 5: Highway Safety Performance. < http://www.fhwa.dot.gov/policy/2002cpr/ch5.htm > July 8, 2003.
Hutton
13
showed the greatest decrease in fatality rate since 1993, while rural interstates have shown an
increase in fatality rates.19 Although two-lane roads only account for half of the total vehicle
miles traveled, 77 percent of all fatal motor vehicle accidents occur on these types of roads.20
Fatality Rates per 100 million Vehicle Miles Traveled
-
0.50
1.00
1.50
2.00
2.50
3.00
3.50
4.00
4.50
5.00
1980 1985 1990 1995 1996 1997 1998 1999 2000 2001
Rural SystemsUrban SystemsTotal
Vehicle design is an important factor in whether or not accidents will be fatal.
Although in 2002 it was found that only about 2 percent of the 32 million crashes in 1997
could be directly linked to a vehicle-related factor, vehicle design affects handling in
different situations. Vehicles with a higher center of gravity, such as SUVs, are much more
likely to roll over than are passenger cars. Passengers in vehicles that roll over have a lower
likelihood of surviving and accident. In 2002, fatalities in rollover crashes involving pick-up
trucks and SUVs accounted for 53 percent of the increase in traffic deaths.21
19 Ibid 20 American Road and Transportation Builders Association. “ARTBA Calls for Minimum $50 Billion Per Year Federal Highway Investment in Next Program Reauthorization to Maintain System Conditions.” Press release April 9, 2001. < http://www.artba.org/news/press_releases/2001/04-09-01a.htm > July 21,2003. 21 General Accounting Office. “Factors Contributing to Traffic Crashes and NHTSA’s Efforts to Address Them.” GAO-03-744R. May 22, 2003. < www.gao.gov/new.items/d03730t.pdf > June 10, 2003.
Figure 3: Fatality rates by type of road system.

Hutton
14
Large trucks account for a disproportionate number of fatal accidents. While large
trucks only make up 4 percent of the registered vehicles in the U.S. and 7 percent of the
traffic volume, they are involved in 13 percent of all fatal crashes.22 These accidents also
tend to be more expensive, because often more resources and time are needed to clear the
accident. Not only is productivity decreased and fuel wasted while travelers sit in
congestion, but also damage to the truck and its cargo is a costly loss.
Once the causes of accidents are understood, the question then becomes how to spend
the funding allocated for safety and Intelligent Transportation Systems. The National Motor
Vehicle Crash Causation Survey, as outlined in the President’s SAFETEA proposal, will
work to clearly identify key areas of concern and define specific needs for improvement and
change in our safety strategies. SAFETEA also requires that states have an incident
reporting system in place within two years.23 The United States Department of
Transportation’s (U.S. DOT) Bureau of Transportation Statistics (BTS) has also developed a 22 United States Department of Transportation. Federal Highway Administration. “Status of the Nation's Highways, Bridges, and Transit: 2002 Conditions and Performance Report.” Chapter 5: Highway Safety Performance. < http://www.fhwa.dot.gov/policy/2002cpr/ch5.htm > July 8, 2003. 23 Intelligent Transportation Society of America. “SAFETEA: Questions and Answers about the TSM&O and ITS Provisions.” ITS Cooperative Deployment Network Newsletter. May 29, 2003. < http://www.nawgits.com.icdn/safetea/safetea_qa.html > June 19, 2003.
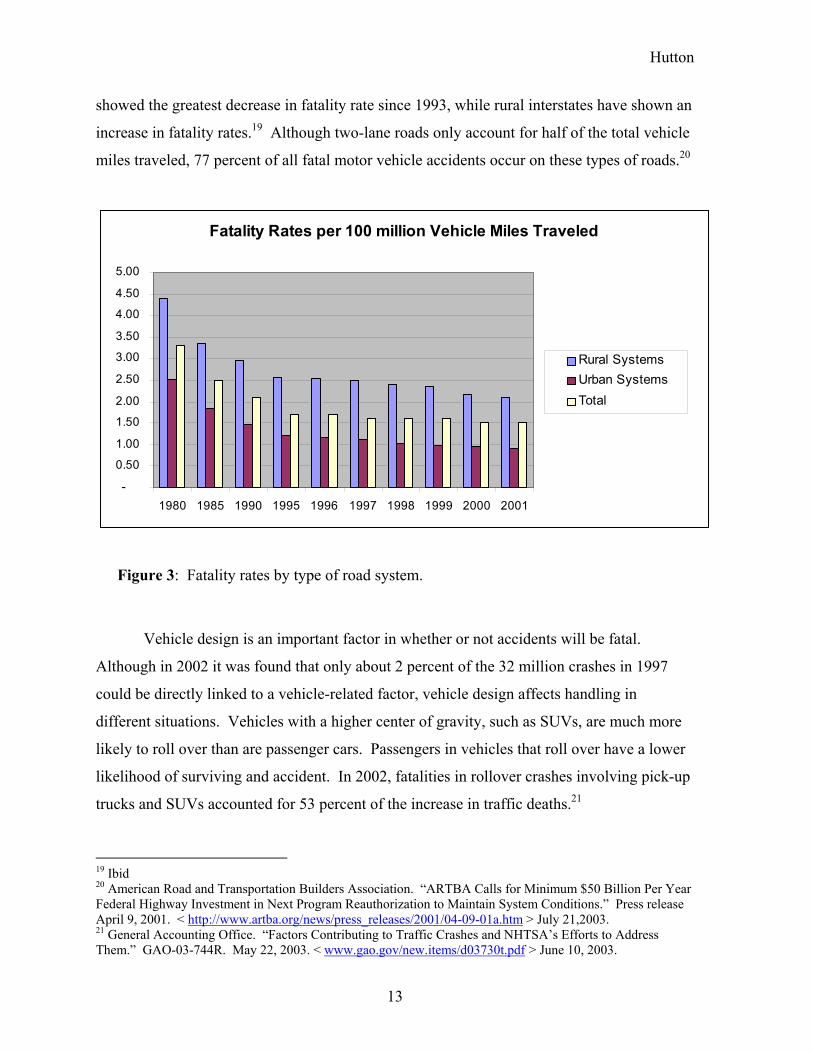
Figure 4: Highway fatalities by type.
Highway Fatalities by Type (2000)
16,653
15,905
12,350
8,632
5,587
4,739
3,318
1,093
690
0 2,000 4,000 6,000 8,000 10,000 12,000 14,000 16,000 18,000 20,000
Alcohol Involved Fatalities
Single Vehicle Run Off the Road Fatalities
Speeding Related Fatalities
Intersection Related Fatalities
Interstate Highway Fatalities
Pedestrian Fatalities
Tree Related Fatalities
Work Zone Fatalities
Bicyclist Fatalities
Hutton
15
Safety Data Initiative to improve the quality of transportation data in order to identify and
minimize risk factors. BTS developed and DOT approved a Safety Data Action Plan after a
series of national conferences and workshops with stakeholders, which includes ten research
projects to improve data quality. Research topics include developing better data on accident
precursors, reporting “near-miss” data to gather information that may prevent future
accidents, exploring ways to use new technology in data collection, and developing reporting
guidelines so that the same categories of information are reported in the same way for all
accidents.24
Although accident rates have been declining in every major area of transportation, the
diminishing gains suggest that some safety programs may be reaching their performance
limits.25 Alternatives to standard safety programs aimed at encouraging people to wear seat
belts and enforcing stricter laws regarding driving under the influence of alcohol or drugs
need to be established. The decisions drivers make will always be uncontrollable and
unpredictable to a certain extent. Making the roads and vehicles smarter and safer can
minimize the consequences of driver error, helping to protect the victims of another driver’s
poor judgment.
24 Bureau of Transportation Statistics. “Safety Data Initiative.” < http://www.bts.gov/sdi/ > July 1, 2003. 25 Ibid.
Hutton
16
Key players and their roles Several groups, both public and private, are stakeholders in the surface transportation
reauthorization. A few of the organizations that have given recommendations, proposals or
testimony regarding the levels and distribution of safety or ITS funding under the
reauthorization have been briefly described below. It should be noted that all of the
organizations mentioned below believe improving the nation’s highway system and highway
safety are high priorities. Although there are several groups that oppose higher investment in
highway infrastructure for various reasons, they were not included in the scope of this paper.
Government groups
The President and the Secretary of Transportation presented to Congress in May
2003, their transportation reauthorization plan, the “Safe, Accountable, Flexible, and
Efficient Transportation Equity Act of 2003.” As the name suggests, one of SAFETEA’s
primary goals is to make the highways safer, by reducing the number of incidents, injuries
and fatalities that occur on our roads every year. In his transmittal letter to the Senate,
Secretary Norman Mineta cites the 43,000 lives lost and economic impact of $230 billion
dollars each year due to motor vehicle crashes and states, “We have a moral, as well as an
economic, obligation to address immediately the problem of transportation safety.” By
emphasizing the goal to reduce the number of lives lost on the highways, the administration
will work to gain the support of the public and lawmakers for their reauthorization plan.26
The United States Department of Transportation is the primary federal agency
responsible for “shaping and administering policies and program to protect and enhance the
safety, adequacy, and efficiency of the transportation system and services.” As with the
other federal agencies, the Department of Transportation works with President’s Office of
Management and Budget each year to provide congress with requests for funding the DOT’s
various programs and projects. The Secretary oversees eleven individual operating
administrations, including the Federal Highway Administration (FHWA), the National
Highway Traffic Safety Administration (NHTSA), the Federal Motor Carrier Safety
Administration (FMCSA), the Federal Railroad Administration (FRA) and the Federal
26 Mineta, Norman Y. Transmittal Letter to the Honorable Richard B. Cheney, President of the Senate. May 12, 2003. < http://www.fhwa.dot.gov/reauthorization/transletter051203cheney.htm > June 12, 2003.
Hutton
17
Transit Administration (FTA), which each handle different aspects of highway safety.27 In
1994, the Department of Transportation established the Intelligent Transportation Systems
Joint Program Office, housed in the FHWA, to coordinate and lead the ITS research and
deployment among the previously listed agencies.28
The Federal-Aid Highway Program is one of the two main programs within the
Federal Highway Administration. This program provides the states with federal financial
assistance to construct and improve roads and bridges on the National Highway System and
in urban and rural areas. Funds are used for general improvements and safety development.
The FHWA also provides technical expertise and training to its partners, such as state DOTs,
in several areas, including highway safety, intelligent transportation systems, and research,
development and technology transfer. Policies and guidelines are developed by the FHWA
to achieve the goals of safety and economic development.29
The National Highway Traffic Safety Administration is responsible for reducing the
human and economic losses resulting from vehicle crashes by setting and enforcing motor
vehicle and equipment safety standards. NHTSA provides grants to the states to aid in safety
programs aimed at reducing the threat of drunk drivers, increasing safety belt and child safety
seat usage, and providing information on safety topics. NHTSA also works to determine the
most effective means of working toward safety improvements by conducting research on
driver behavior and traffic safety.30
The ITS Joint Program Office, formally established in 1994, seeks to provide
leadership for ITS research, development, testing and deployment, to guide policy
coordination and to ensure resource accountability. The ITS Management Council, chaired
by the Deputy Secretary of Transportation, provides policy guidance, while the ITS Strategic
Planning Group, made up of surface transportation leaders throughout the department,
provides planning guidance. The individual program administrations, such as FHWA,
27 United States Department of Transportation. Office of the Historian. “The United States Department of Transportation: A brief History.” < http://isweb.tasc.dot.gov/Historian/history.htm > June 25, 2003. 28 United States Department of Transportation. “ITS Program Coordination.” < http://www.its.dot.gov/itsweb/jpostaff/backgrd.htm > June 25, 2003. 29 United States Department of Transportation. Federal Highway Administration. “Who We Are and What We Do.” < http://www.fhwa.dot.gov/whoweare/whoare4.htm > June 25, 2003. 30 United States Department of Transportation. National Highway Traffic Safety Administration. “About the National Highway Traffic Safety Administration.” < http://www.nhtsa.dot.gov/nhtsa/whatis/overview/ > June 25, 2003.
Hutton
18
NHTSA, FTA, FRA, and FMCSA are responsible for ITS implementation. The national ITS
program seeks to improve the efficiency and safety of the nation’s surface transportation
system using advanced technology for both information and infrastructure based
approaches.31
State Departments of Transportation also play a critical role in highway safety and the
deployment of ITS. Most of the categorically funded federal highway programs provide 80
percent of the funds, while the states are required to provide the other 20 percent. The
previous two surface transportation reauthorizations have worked to increase the flexibility
that states have with the use of federal funds. Although federal money often comes with
mandates, these mandates are becoming increasingly performance-based, allowing the state
DOTs more freedom in how to achieve the performance goals. State and local transportation
officials have a much clearer understanding of the specific transportation needs and strengths
in their region, and typically are best suited for determining what types of programs, whether
for construction, highway safety, or ITS deployment are most appropriate for their state,
county or town.
The National Transportation Safety Board (NTSB) is an independent federal agency
that investigates significant accidents and issues safety recommendations to prevent similar
accidents from occurring in the future. Although the NTSB is primarily concerned with
investigating all civil aviation accidents, it also investigates selected highway accidents and
transportation accidents involving recurring problems. The NTSB has no regulatory or
enforcement powers but is known for being impartial, and most of its recommendations are
adopted. Currently, the NTSB lists the three most wanted safety improvements on the
highway as being primary seat belt enforcement laws, commercial truck and bus safety and
youth highway safety. NTSB highway studies and special reports range in topic from driver
fatigue to brake system failures of trucks to school bus safety.32
Funding for the Department of Transportation ultimately comes from Congress, who
authorizes, allocates and appropriates federal dollars. Currently both the House and the
Senate are considering the President’s reauthorization proposal, SAFETEA, and drafting
31 United States Department of Transportation. “ITS Program Coordination.” < http://www.its.dot.gov/itsweb/jpostaff/backgrd.htm > June 25, 2003. 32 National Transportation Safety Board. “History and Mission.” < http://www.ntsb.gov.Abt_NTSB/history.htm > June 25, 2003.

Hutton
19
their own proposals. The authorization legally provides for the existence of the programs
associated with surface transportation. The current authorization expires September 30th,
2003, so the Congress has only a few months to pass a reauthorization in order to legally
continue the operation of the Department of Transportation. The Intermodal Surface
Transportation Equity Act (ISTEA) and the Transportation Equity Act for the 21st Century
(TEA-21), SAFETEAS predecessors, were both six-year authorizations, and it is expected
that the next reauthorization will have the same life-span. However, it is likely that a six-
year plan may not be agreed upon by both House and Senate before the current
reauthorization expires. If this happens, Congress would likely pass a reauthorization that
basically extends the current policy and funding levels for a short period of time, perhaps six
months or a year, until a long term reauthorization can be developed and agreed to.33
Authorization bills not only lay out the policy and funding levels for the programs it
authorizes, but must also provide sources of funding to support those programs. In general,
the Appropriations committee will appropriate the level of funding specified in the
authorization. Most of the programs are categorical and the funding they provide to each
state is based on a formula described in the authorization. However, discretionary funds,
which are not automatically distributed to the states by formula, are often earmarked for
projects that benefit the Appropriators’ constituents.34
The congressional ITS Caucus was formed in 2001 to raise awareness of and support
for intelligent transportation systems during the reauthorization of transportation funding.
The caucus created and advisory committee of experts in ITS technologies, who decided to
focus on congestion, safety and transportation security, because they believe these are the
three most important issues that are most likely to benefit from the use of ITS.35 Many
members of the ITS Caucus are on the committees drafting the surface transportation
reauthorization legislation. The ITS Caucus advisory committee provides recommendations
to Congress on the benefits of different funding scenarios for ITS research, development,
deployment and operations.
33 Upchurch, Dr. John. ASCE fellow to the U.S. House Committee on Transportation and Infrastructure, Subcommittee on Highways and Transit. Personal Interview. July 14, 2003. 34 Ibid. 35 “Recommendations of the Congressional ITS Caucus Advisory Committee.” February 14, 2003. < http://www.itsa.org/subject.nsf/926a8faa89b0667e86256c91005e0425/425d52b2367ba58b85256d0e0029416d/$FILE/2.14.03%20Advisory%20Committee%20Recommendations.doc > July 10, 2003.
Hutton
20
Non-government groups
The Intelligent Transportation Society of America (ITS America or ITSA) serves as
an advisory committee to the United States Department of Transportation and works to
develop partnerships between the public and private sectors to use advanced technologies to
increase the safety and efficiency of surface transportation. ITS America strives to identify,
develop, integrate and deploy these advanced technologies by promoting awareness and
acceptance of technology solutions in transportation. Government agencies at all levels,
foreign and domestic, companies involved in ITS development, universities, research
organizations and others interested in intelligent transportation systems make up the
membership of ITS America.36
The American Road and Transportation Builders Association (ARTBA), which
represents an industry that generates more than $200 billion in U.S. economic activity and
employs 2.2 million Americans, has been advocating strong federal investment in
transportation infrastructure for over a century. In recent decades, ARTBA has also been
recognized as a leader in highway work zone safety, holding two national conferences on the
issue in 1985 and 1994, and helping to establish the National Work Zone Safety Clearing
House in 1998. ARTBA played a vital role in both the 1991 and 1998 Surface
Transportation reauthorizations by providing legislative recommendations, and will
undoubtedly play an important role in the current reauthorization.37
The American Association of State Highway and Transportation Officials
(AASHTO) is a nonprofit association, representing the transportation departments in all 50
states, D.C and Puerto Rico. AASHTO works to advocate transportation policies, facilitate
institutional change, provide technical services and demonstrate the contributions of
transportation. The goal of AASHTO is to advance the development, maintenance and
operation of an integrated national transportation system.38 AASHTO has developed specific
36 The Intelligent Transportation Society of America. “About ITS America.” < http://www.itsa.org/new.nsf/vLookupAboutITSA/$first?OpenDocument > June 25, 2003. 37 American Road and Transportation Builders Association. “A Century of Service to the U. S. Transportation Construction Industry.” http://www.artba.org/about_artba/history/overview.htm June 25, 2003. 38 American Association of State Highway and Transportation Officials. “Organization Overview.” < http://www.transportation.org/aashto/organization.nsf/homepage/overview > June 25, 2003.

Hutton
21
recommendations for the reauthorization of TEA-21 in several categories, including highway
safety, operations and ITS, and research.
The American Society of Civil Engineers (ASCE), a professional society made up of
over 140,000 individual members, works not only to keep their members informed of
important legislation and policy that affects civil engineers, but also to promote a strong
relationship between the legislature and practicing engineers. In the case of the
transportation reauthorization, ASCE provides its members with information on what the
legislation might mean to them, whether specific policies work toward or against ASCE’s
goals, and strategies for informing members of congress of technically sound policies to
achieve those goals. ASCE also publishes a report card rating the condition of the roads,
bridges, transit and other infrastructure in the nation, and estimates the level of investment
needed to maintain and improve the system.
These organizations are only a few of the many groups who have an interest in the
policies and funding levels laid out in the reauthorization of TEA-21. Other stakeholders
include the Transportation Construction Coalition, a group of 27 national associations and
labor unions with a direct market interest in the federal transportation programs, and the
Institute of Transportation Engineers, an international individual member educational and
scientific association of professionals who are responsible for meeting society's needs for
safe and efficient surface transportation worldwide. Although the Subcommittee on
Highways and Transit under the Transportation and Infrastructure Committee in the House
and the Subcommittee on Transportation and Infrastructure under the Environment and
Public Works committee in the Senate are the most involved in the reauthorization, several
committees and subcommittees have role in funding transportation. In the house, the bill was
also referred to the Committees on Ways and Means, the Budget, Science, Resources, the
Judiciary, Energy and Commerce, Government Reform, and Rules. In the Senate, the
Commerce, Science and Transportation Committee also has jurisdiction over parts of the
reauthorization.

Hutton
22
Transportation Reauthorization
The President’s proposal The Intermodal Surface Transportation Efficiency Act of 1991 (ISTEA), and the
Transportation Equity Act for the 21st century (TEA-21) of 1998 provided the foundation for
addressing the nation’s present and future transportation challenges. ISTEA provided the
states with unprecedented flexibility to solve their local problems while still working toward
national goals. TEA-21 ensured that all highway user fees go toward highway, transit and
safety programs, and that funding levels are guaranteed by a budgetary firewall mechanism.39
The President’s proposal for transportation reauthorization, the Safe, Accountable, Flexible,
and Efficient Transportation Equity Act of 2003 (SAFETEA), works to further this trend and
to give states and local partners more tools and greater responsibility to plan and implement
unique solutions in key program areas. In the area of highway safety, states would be
rewarded for their increased safety performance with increased funds and the flexibility to
use them on behavioral safety programs, such as seatbelt usage, or infrastructure safety
projects.40 SAFETEA contains several sections relating specifically to funding for safety and
ITS.
Safety funding
In his testimony before the House Subcommittee on Highways, Transit and Pipelines,
Jeffrey Runge, and administrator in the National Highway Traffic Safety Administration
(NHTSA), stated that the new core highway safety infrastructure program established in
SAFETEA, called the Highway Safety Improvement Program will more than double the
level of safety funding in TEA-21, providing $7.5 billion over the 6-year authorization
period. States would not only be given funding for safety, but they would also be encouraged
to formulate their own comprehensive safety plans.
39 United States House of Representatives. Committee on Transportation and Infrastructure. “Administration’s ‘Inadequate’ Highway & Transit Funding Proposal Criticized by Congressional Panel.” Press release May 15, 2003. < http://www.house.gov/transportation/press/press2003/release88.html > June 9, 2003. 40 Runge, Jeffery W. Administrator, National Highway Traffic Safety Administration. “Testimony before the Subcommittee on Highways, Transit and Pipelines, Committee on Transportation and Infrastructure, United States House of Representatives.” May 21, 2003. < http://www.house.gov/transportation/highway/05-21-03/runge.pdf > June 24, 2003.
Hutton
23
Significant proportions of the money allocated for highway safety in the SAFETEA
proposal goes toward increased use of seat belts. NHTSA’s Section 402 safety programs will
be more streamlined in SAFETEA, providing $1.05 billion over the six-year authorization
period to the basic formula grant program. The new Safety Belt Performance Grant
encourages states to pass primary safety belt laws and to achieve greater usage rates and
provides up to $100 million a year to reward states that do so. Additional grants for
improving safety belt usage rates provide $182 million over the six-year period. In certain
circumstances, states my use up to 100 percent of their grant money for infrastructure
investments eligible under the Highway Safety Improvement Program.
Although the statistics show that passengers wearing seatbelts are much more likely
to survive accidents than those who are not restrained, seatbelt usage fails to prevent
accidents from occurring. It has also been shown that the average lifetime cost for a
critically injured accident survivor is $1.1 million.41 Although the value of human life is not
measurable, preventing accidents from occurring will do much more to lower the $230
billion in associated costs than will decreasing fatalities by promoting seatbelt usage.
The General Performance Grant, also under section 402, provides state $340 million
over the six-year period in incentives to reduce motor vehicle fatalities, alcohol-related
fatalities, and pedestrian and bicycle fatalities. Up to 50 percent of these grants can be used
for the new Highway Safety Improvement Program (HSIP) activities, and according to
section 151, which outlines flexibility for safety initiatives, up to 50 percent of the money
available to states for the HSIP can be used for activities in section that are not eligible for
assistance under the HSIP section.42
Section 150 describes the role of the states and the DOT in the new Highway Safety
Improvement Program. In order to receive funds under this section, each state is required to
develop its individual HSIP, which provides a process to identify and analyze highway safety
problems and opportunities and produces a program of projects for funding under section
150. The Secretary will establish implementing guidelines, including adopting strategic,
41 Runge, Jeffery W. Administrator, National Highway Traffic Safety Administration. “Testimony before the Subcommittee on Highways, Transit and Pipelines, Committee on Transportation and Infrastructure, United States House of Representatives.” May 21, 2003. < http://www.house.gov/transportation/highway/05-21-03/runge.pdf > June 24, 2003. 42 United States Senate. S.1072: Safe, Accountable, Flexible, and Efficient Transportation Equity Act of 2003. May 15, 2003. < http://thomas.loc.gov/cgi-bin/query/F?c108:1:./~c108bI1Wx5:e100485: > June 9, 2003.
Hutton
24
performance-based goals for the states’ HSIPs that focus resources on areas of greatest need
and compliment programs developed under section 402, advancing traffic records data
collection and analysis on all public roads to identify hazardous locations and other dangers
to motorists, bicyclists and pedestrians, determining priorities for improvements, and
evaluating the results achieved by safety improvements projects carried out under this
section. States will report to the Secretary, according to the schedule and requirements he
determines.43
ITS funding
SAFETEA requests a total of approximately $1.7 billion in funding for Intelligent
Transportation Systems over the next six years. This is a 20 percent increase from the $1.3
billion authorized in TEA-21. Jeffery Paniati, FHWA Associate Administrator for
Operations and Acting Director of the U.S. DOT ITS Joint Program Office explained the ITS
funding available under SAFETEA in an interview with the ITS Cooperative Deployment
Network. There are three main programs that fund ITS. The ITS Performance Incentive is a
categorical program that provides $135 million a year by formula to the states. States are
also given a share of the $25 million a year for Commercial Vehicle Information Systems
and Networks. The third program is a two percent set-aside of National Highway System
funds for intermodal connectors. Funding for ITS exists in some of the other programs as
well. For example, the Infrastructure Performance and Maintenance Program is focused on
projects that can be completed quickly to maintain the system and increase performance.
This program provides a million dollars of Surface Transportation Program funding to the
states by formula specifically to address traffic choke points or congestion. States can decide
to use the funding to preserve the system or for ITS to manage and control traffic to achieve
this goal. TEA-21 ensured that funding for ITS would be available under the National
Highway System (NHS), Surface Transportation Program (STP), and Congestion Mitigation
and Air Quality (CMAQ) Improvement Program, but Paniati suggests that SAFETEA takes
this a step further by providing incentives for ITS and developing a categorical program for
ITS funding. SAFETEA emphasizes information acquisition and sharing and gives greater
43 United States Senate. S.1072: Safe, Accountable, Flexible, and Efficient Transportation Equity Act of 2003. May 15, 2003. < http://thomas.loc.gov/cgi-bin/query/F?c108:1:./~c108bI1Wx5:e100485: > June 9, 2003.
Hutton
25
flexibility to regional institutions, which are the central components of supporting ITS
deployment. SAFETEA has gone further toward mainstreaming ITS in both its funding and
language by defining the role that ITS plays in management and operations.44
Research and Development funding
SAFETEA would provide the NHTSA’s highway safety research and development
program $559.5 million over the six year period. This program collects and disseminates
highway safety data and supports state highway safety behavioral programs and activities.
Research under this program is meant to provide scientific basis for the effectiveness of
certain safety measures to ensure that tax dollars are spent on programs that can provide
results. Much of the program is focused on behavioral research, such as impaired driving
programs, safety belt and child safety seat law enforcement, speed management, aggressive
driving, fatigue and inattention.45
Section 402 provides a key provision for undertaking a comprehensive National
Motor Vehicle Crash Causation Survey, funded out of the highway safety research and
development program at $10 million a year. The survey will provide data based on currant
assumptions of traffic patterns, vehicle technologies, driver attitudes and vehicle designs,
which have changed significantly since the last comprehensive survey was completed in the
1970’s. States are also provided incentives to improve traffic records data with a $300
million grant program.46 The survey will be directed by the proposed National Blue Ribbon
Commission on Highway Safety, which would be comprised of the Secretary of
Transportation, administrators from the NHTSA, FHA, FMCSA, and the FRA, and 10 people
appointed by the Secretary representing states, the safety community, law enforcement
agencies, public health officials and related House and Senate committees. The Committee
is authorized to spend $8 million over the length of the study, and will provide Congress with
an initial report by September 2006, giving legislative recommendations to reduce highway
44 Intelligent Transportation Society of America. “SAFETEA: Questions and Answers about the TSM&O and ITS Provisions.” ITS Cooperative Deployment Network Newsletter. May 29, 2003. < http://www.nawgits.com.icdn/safetea/safetea_qa.html > June 19, 2003. 45 Runge, Jeffery W. Administrator, National Highway Traffic Safety Administration. “Testimony before the Subcommittee on Highways, Transit and Pipelines, Committee on Transportation and Infrastructure, United States House of Representatives.” May 21, 2003. < http://www.house.gov/transportation/highway/05-21-03/runge.pdf > June 24, 2003. 46 Ibid.
Hutton
26
fatalities, and will give the final report by February 2009, with further recommendations for
safety strategies and funding levels.47
Congressional Criticisms Transportation and Infrastructure Committee Chairman, Representative Don Young
(R-AK), praises the Bush reauthorization proposal for putting such a strong emphasis on
saving lives, but claims that one-third of all fatal traffic accidents are caused by substandard
road conditions or roadside hazards. Congressman Young’s committee is supporting a
reauthorization totaling $375 billion dollars as compared to the President’s $247 billion
plan.48 Young states that the Department of Transportation’s “2002 Conditions &
Performance” report indicates that in order maintain and improve the nation’s bridges,
highways and transit systems, $75 billion will need to be invested annually. He also claims
that SAFETEA’s highway funding levels were not adjusted for inflation, and that in 2003
dollars, TEA-21 actually provided more highway funding that the President’s proposal.49
In May 2003, Global Insight published a report that analyzed the economic impacts of
the funding levels supported by the House Transportation and Infrastructure Committee and
compared them to a baseline representing the funding proposed by the administration. The
report found that increasing highway funding from $247 billion in the next six years to $375
billion over the same period would result in a $48 billion increase to the Gross Domestic
Product (GDP) each year, and that for each dollar invested in highway and transit capitol
outlays, more than $2.50 in economic activity will be generated. The report also predicted
that consumer spending would increase $98 billion and that a $129 billion increase in
consumer disposable income would be realized. Federal tax receipts would increase by $102
47 United States Senate. S.1072: Safe, Accountable, Flexible, and Efficient Transportation Equity Act of 2003. May 15, 2003. < http://thomas.loc.gov/cgi-bin/query/F?c108:1:./~c108bI1Wx5:e100485: > June 9, 2003. 48 United States House of Representatives. Committee on Transportation and Infrastructure. “Administration’s ‘Inadequate’ Highway & Transit Funding Proposal Criticized by Congressional Panel.” Press release May 15, 2003. < http://www.house.gov/transportation/press/press2003/release88.html > June 9, 2003. 49 United States House of Representatives. Committee on Transportation and Infrastructure. “Administration’s Highway & Transit Funding Levels are Inadequate to Meet America’s Growing Surface Transportation Needs.” Press Release May 14, 2003. < http://www.house.gov/transportation/press/press2003/release86.html > June 9, 2003.

Hutton
27
billion due to increased economic activity, which would help to reduce the federal deficit.50
According to a previous report, the Committee’s proposal would create 1.3 million new jobs
in all 50 states. At a press conference discussing the Global Insight report, Chairman Young
said, “Our substantial increase in highway and transit funding will help address America’s
growing congestion and safety problems. But our proposal will also have another positive
benefit and that will be in giving a major boost to our nation’s economy.”51
In order to fund a $375 billion authorization, a level on which the House Committee
seems unwilling to budge, sources of revenue are going to have to be identified. The
administration is opposed to increases any taxes for any reason; however, if the authorization
does not pass this year, it will meet even stiffer opposition next year when the president is
seeking reelection. Several sources of funding for Chairman Young’s $375 billion plan are
being considered. For example, the cash balance in the Highway Trust Fund is currently
between $18 and $20 billion dollars. Many believe that this level could be dropped to around
$8 billion without significantly increasing the risk of running out of funds. The interest on
this account, unlike any other account, is currently being transferred to the general fund
instead of remaining in the Highway Trust Fund. The current tax subsidy on Ethanol-based
fuel, which was originally meant to encourage the use of ethanol, results in a cost about 2.5
cents lower per gallon than gasoline. Although many in the ethanol producing mid-west may
disagree, some people feel that ethanol tax subsidy should be eliminated. Improving
collection practices to reduce tax and fee evasion is also a means of finding additional
revenue.52
Although all of these strategies would provide more funding for surface
transportation, even all working together, they would not produce the $128 billion dollar
difference between the President’s proposal and Young’s proposal. In order to fully fund a
$375 billion reauthorization, an increase in user fees is necessary. This increase could
50 Cuomo, Robert and Joyce Brimmer. “Impact of the Bipartisan House Transportation and Infrastructure Committee’s FY 2004-2009 Highway and Public Transportation Investment Proposal on the US Economy.” Global Insight. May 13, 2003. 51 United States House of Representatives. Committee on Transportation and Infrastructure. “House Highway & Transit Funding Proposal Would Substantially Benefit National Economy, According to Economic Forecast Report.” Press Release May 13, 2003. < http://house.gov/transportation/press/press2003/release82.html > July 10, 2003. 52 Upchurch, Dr. John. ASCE fellow to the U.S. House Committee on Transportation and Infrastructure, Subcommittee on Highways and Transit. Personal Interview. July 14, 2003.

Hutton
28
increase at a rate proportional to the annual increase in the Consumer Price Index (CPI).
Some even advocate a retroactive increase, beginning in 1993. This would immediately
increase the gas tax to the point at which it would be if it had been following the CPI since
1993. This would increase the gas tax about five cents from the current level of 18.4 cents,
and would continue increasing it from that point each year.53 Although the bipartisan
leadership of the Transportation and Infrastructure Committee supports raising revenues, the
House Majority Leader Tom Delay (R-TX), following the lead of the White House, has
voiced strong opposition to increasing or indexing user fees.54
The Senate also supports a reauthorization level higher than the Administration’s
$247 billion, although not as high as what the House is considering. Of the President’s
proposal, Senator Inhofe (R-OK), Chairman of the Environment and Public Works
Committee, said, “SAFETEA focuses on reducing highway fatalities and injuries, reducing
congestion, protecting the environment, increasing funding flexibility for state and local
governments, and providing economic stimulus the nation’s economy—all worthy goals.
Unfortunately, the funding proposed in the President’s bill is inadequate.”55 The
Environment and Public Works Committee will likely introduce legislation authorizing $311
billion over six years. The Senate is less likely to support an immediate increase user fees,
but several lawmakers seem open to the idea of indexing the gasoline tax to increase with
inflation.56 The Senate Commerce, Science, and Transportation Committee, whose
subcommittee on Surface Transportation and Merchant Marine has jurisdiction over the
Surface Transportation Board, the Federal Railroad Administration, the Motor Carrier
Industry, Transportation Safety, and Hazardous Materials Transportation, recently approved
the Surface Transportation Safety Reauthorization Act of 2003. The bill authorizes funding
for National Highway Traffic Safety Administration, Federal Motor Carrier Safety
53 Upchurch, Dr. John. ASCE fellow to the U.S. House Committee on Transportation and Infrastructure, Subcommittee on Highways and Transit. Personal Interview. July 14, 2003. 54 Intelligent Transportation Society of America. “TEA-21 Reauthorization Update.” July 11, 2003. < http://www.itsa.org/ITSNEWS.NSF/0/50663ff4197f722685256d600069c946?OpenDocument > July 21, 2003. 55 United States Senate. Committee on Environment and Public Works. “Inhofe Introduces President Bush’s Transportation Legislation.” Press Release May 19, 2003. < http://www.senate.gov/~epw/Releases/release_05-19-03.htm > July 21, 2003. 56 Intelligent Transportation Society of America. “TEA-21 Reauthorization Update.” July 11, 2003. < http://www.itsa.org/ITSNEWS.NSF/0/50663ff4197f722685256d600069c946?OpenDocument > July 21, 2003.

Hutton
29
Administration, and the Hazardous Materials Transportation Safety program. This bill will
be offered as an amendment to the TEA-21 reauthorization legislation when it is considered
by the full Senate.57
Recommendations from other groups In March, Dr. Mike Walton, Chairman of the Intelligent Transportation Society of
America’s Board of Directors, testified before Congress on the needs of the nation’s surface
transportation system. While recognizing that investment into advanced transportation
technologies cannot replace investment in highway and transit infrastructure, it can ensure
that the system is operating at optimal efficiency. He stated that “the continued and
expanded integration of ITS into our nation’s surface transportation system is a necessary
and prudent investment in the future of that system.”
Specifically, Dr. Walton outlines four recommendations to Congress that would work
to advance the federal ITS program and ITS America’s goal of an Integrated Network of
Transportation Information. First, he recommends a new formula-based categorical program
for the deployment, operations and management of ITS. Second, multiple Comprehensive
Area Deployment Initiatives (CADI) should be authorized to demonstrated the integration of
data from automobiles, transit systems, rail, trucks, and ITS traffic operation centers. Next,
enhanced flexibility of program funds from the STP, NHS and CMAQ are recommended for
operations and regional coordination. Finally, Dr. Walton emphasizes the need to accelerate
research, education and program support for ITS.58
When considering the reauthorization of TEA-21, the advisory committee to the
Congressional ITS Caucus chose to focus on three critical issues related to ITS: congestion,
safety and surface transportation security. The advisory committee detailed the five steps
they felt the reauthorization must include in order to move closer to realizing the full
57 United States Senate. Committee on Commerce, Science and Transportation. “Committee Passes Surface Transportation Safety Reauthorization Act of 2003.” Press release June 26, 2003. < http://commerce.senate.gov/newsroom/printable.cfm?id=205587 > July 29, 2003. 58 Intelligent Transportation Society of America. “ITS America Chairman Testifies Before Congress.” The ITS Legislative Report. March 18, 2003. <http://www.itsa.org/subject.nsf/926a8faa89b0667e86256c91005e0425/425d52b2367ba58b85256d0e0029416d/$FILE/3.18.03%20The%20ITS%20Legislative%20Report.doc > July 10, 2003.

Hutton
30
potential of ITS in these areas. The five steps, as listed in the advisory committee’s
recommendations are as follows:59
1. Increase the amount of money available for surface transportation, including for ITS.
2. Provide the financial resources needed to accelerate the deployment of ITS technologies with the capacity to reduce traffic congestion, enhance highway safety, and augment surface transportation security.
3. Increase funding for operating and managing ITS technologies via the new ITS program, and enhance the flexibility and accessibility of STP, National Highway System, and Congestion Mitigation and Air Quality Improvement funds for these same purposes without time limitations.
4. Accelerate ITS research, education, and program support to help public- and private-sector ITS deployers make the best use of technology to provide service to citizens better, faster, and cheaper, and to augment surface transportation security.
5. Implement procedural changes affecting the federal role in ITS transportation projects to encourage the acceleration of ITS deployment and research.
Under the first step, the committee advocates the creation of a new funding program
for ITS deployment, operations, and management. It also encourages increasing funding for
ITS research, education and program support. The report provides cost estimates for three
different funding scenarios for ITS: Subsistence, Minimum Desirable, and Breakthrough.
The breakthrough level describes the level of funding needed to immediately improve
traveler safety, reduce congestion and enhance security, and would provide a total of $8.16
billion over the six-year period, with about 80 percent going to deployment, operations and
management and 20 percent going to education, research and program support. The portion
going to deployment would come from a formula-based categorical program, and if states did
not use the funding for ITS, they would lose it. Providing incentives for the states to deploy
ITS will help create a comprehensive national system for safety and congestion reduction and
will likely increase competition among vendors, leading to new technologies.
The Minimum Desirable funding level, the lowest level possible to begin to see
improvements in safety and congestion, would provide a total of $5.2 billion over the
authorization period. The funding for general ITS deployment would be distributed to the
states through the formula-based categorical program described for the Breakthrough level.
59 “Recommendations of the Congressional ITS Caucus Advisory Committee.” February 14, 2003. < http://www.itsa.org/subject.nsf/926a8faa89b0667e86256c91005e0425/425d52b2367ba58b85256d0e0029416d/$FILE/2.14.03%20Advisory%20Committee%20Recommendations.doc > July 10, 2003.
Hutton
31
This level was believed to be the lowest level that could be divided 51 ways and still provide
states the resources to deploy some ITS systems. In order to develop a comprehensive
national ITS system, even the smallest rural states must deploy some ITS.
The Subsistence funding level provides $2.1 billion over six years and is the
minimum funding needed to keep the ITS progress to date from eroding. Instead of dividing
the money among states, funding will be provided on a competitive basis through an
application process established by the U.S. DOT. States would be encouraged to augment
these funds with funds from other programs, such as STP, CMAQ, HNS or local funds. At
this funding level, over a third of the funds will be devoted to education, research and
program support. The committee believes that increases in research have a direct correlation
to effectiveness of current and future ITS. The more money invested in research, the better
return we will get on the money invested in deployment. The level of funding available for
ITS in the President’s proposal falls short even of this Subsistence level funding.
The Congressional ITS Caucus Advisory Committee also makes recommendations
for procedural changes to accelerate ITS implementation and research. These changes
include simplifying the application process for ITS funds and using alternative methods of
awarding contracts. The standard low bid contracts are appropriate when technology isn’t
changing rapidly and when the owner’s expectations of final results can be clearly stated in
the beginning of the project. Fixed price, lump sum and unit cost contracts are standard in
similar situations. However, the technology associated with ITS can change so rapidly that
contractors and owners need more flexibility. Procurement methods such as government-
wide acquisition contracts and task order contracts allow an agency to select the most
qualified contractor and provide the ability to make changes as they arise during the
project.60
The American Association of State Highway and Transportation Officials’
(AASHTO) recommendations support the FHWA’s National Intelligent Transportation
Systems program ten-year plan61, increasing the highway program to $45 billion dollars in
60 “Recommendations of the Congressional ITS Caucus Advisory Committee.” February 14, 2003. < http://www.itsa.org/subject.nsf/926a8faa89b0667e86256c91005e0425/425d52b2367ba58b85256d0e0029416d/$FILE/2.14.03%20Advisory%20Committee%20Recommendations.doc > July 10, 2003. 61 American Association of State Highway and Transportation Officials. “Operations and ITS: Getting the Most from our Transportation System.” March 2003. < http://www.transportation.org/download/issues/ops_its.pdf > June 25th, 2003.
Hutton
32
order to provide an extra $1 billion for states to invest in safety programs for rural two-lane
roads, and providing the states incentive-based flexibility in the use of their highway funds.62
AASHTO has developed specific recommendations for surface transportation
reauthorization, such as increasing ITS research funding to $125 million per year and ITS
Deployment program funding to $142 million per year. This money would be used to
continue work on ITS standards, architecture and training, research human factors, remote
sensing and intelligent vehicles, and implement programs such as the 511 traveler
information system, National Incident Reporting System and the commercial vehicle
information system network. AASHTO also recommends that $500 million per year from
increased resources be used for better surveillance, traffic control and traveler information.
These recommendations are consistent with the recommendation of the Congressional ITS
Caucus to accelerate deployment of a National Transportation Information System.63
AASHTO also recommends increasing the FHWA’s Surface Transportation Research
Program by 50 percent to $300 million annually. Priorities for this funding include
supporting research and technology transfer and preparing students for careers in
transportation by increasing funding for the University Transportation Centers, doubling the
Local Transportation Assistance Program and increasing national-level research. AASHTO
also supports funding a Future Strategic Highway Research Program at $450 million over the
six year of the reauthorization period to accelerate progress toward a few high-priority
objectives. The National Academy of Sciences would administer the program through the
U.S. DOT and under the guidance of state DOTs through AASHTO. The major goals of the
program include making highways safer through the use of new technology, and reducing
traffic delays due to crashes, breakdowns, bad weather, work zones and other special events
by reducing the frequency and effects of these events.64
The American Road and Transportation Builders Association (ARTBA) has
developed a proposal for reauthorization as well, and in testimony before the House
Highways and Transit subcommittee last July, recommend ramping up federal highway 62 American Association of State Highway and Transportation Officials. “Highway Safety: Facing the Growing Challenge.” < http://www.transportation.org/download/issues/hwysafety2003.pdf > June 25th, 2003. 63 American Association of State Highway and Transportation Officials. “Operations and ITS: Getting the Most from our Transportation System.” March 2003. < http://www.transportation.org/download/issues/ops_its.pdf > June 25th, 2003. 64 American Association of State Highway and Transportation Officials. “Research: Saving Lives, Time, and Money.” < http://www.transportation.org/download/issues/research2003.pdf > June 25, 2003.
Hutton
33
investment by $5 billion each year, to reach a level of $60 billion by 2009. Over the same
period, ARTBA suggests increasing transit funding to $14 billion. The reauthorization levels
recommended compliment the U.S. Department of Transportation’s Conditions and
Performance Report that $75 billion will be needed annually to maintain the existing traffic,
safety, and physical conditions.65 ARTBA urges Congress and the Bush Administration to
consider a combination of six revenue options to reach this level of funding, including
spending down the balance in the Highway Trust Fund, increasing user fees by one to two
cents, eliminating federal motor fuel fee evasion, eliminating the tax subsidy on ethanol-
based motor fuels, fostering tax-exempt financing and innovative financing mechanisms for
transportation capital projects, and indexing the motor fuels tax to the Consumer Price Index.
The ARTBA plan for the reauthorization of TEA-21 calls for a variety of safety-
related provisions, including establishing a $1 billion per year federal program improve
safety on rural two-lane roads, where a majority of highway fatalities occur. Other
recommendations include increasing federal involvement in roadway construction work zone
safety initiatives, strengthening federal roadway infrastructure safety programs, and
increasing federal support for highway research and technology transfer to $1 billion per
year.66 Another innovative suggestion involved the creation of toll-financed, truck-only
lanes to improve safety and add to the capacity of the nation’s highway network.67
The proposals outlined in this section represent only a small portion of all the
recommendations by only a few of the many stakeholders in the issue. These particular
groups and recommendations were chosen in an attempt to capture the ITS and safety-related
recommendations from the most influential groups representing the greatest number of
constituents.
65 American Road and Transportation Builders Association. “Two Cents Makes Sense.” Press release July 16, 2002. < http://www.artba.org/news/press_releases/2002/07-16-02.htm > July 21, 2003. 66 American Road and Transportation Builders Association. “ARTBA Calls for Minimum $50 Billion Per Year Federal Highway Investment in Next Program Reauthorization to Maintain System Conditions.” Press release April 9, 2001. < http://www.artba.org/news/press_releases/2001/04-09-01a.htm > July 21,2003. 67 American Road and Transportation Builders Association. “Two Cents Makes Sense.” Press release July 16, 2002. < http://www.artba.org/news/press_releases/2002/07-16-02.htm > July 21, 2003.
Hutton
34
Benefits of ITS
Intelligent Transportation systems, as defined by the Intelligent Transportation
Society of America, “encompass a broad range of wireless and wireline communications-
based information, control and electronics technologies. When integrated into the
transportation system infrastructure, and in vehicles themselves, these technologies help
monitor and manage traffic flow, reduce congestion, provide alternate routes to travelers,
enhance productivity, and save lives, time and money.”68 The ITS Joint Program Office in
the U.S. Department of Transportation publishes annual reports describing the available ITS
technologies, the benefits that have been realized in their deployment, and the unit and
system costs of ITS for specific projects. Intelligent Transportation Systems can be divided
into two main categories, intelligent infrastructure and intelligent vehicles, and in both,
numerous technologies exist to minimize the risk of an accident occurring, reduce injury and
fatality rates in accidents, and provide the driver with valuable, timely information with
which to make critical decisions on the road.
Available Technologies69
Arterial and freeway management systems communicate information to the driver in
one or more ways through the use of traffic detectors, traffic signals, dynamic message signs
and highway advisory radio. Surveillance technologies that monitor traffic flow, such as
cameras and sensors enable valuable information to be passed along to the driver. Signals
can be coordinated throughout metropolitan areas to adjust the phase times depending on
traffic conditions. Signals can also be preempted for emergency vehicles, which not only
improves response times, but also reduces the risk of intersection accidents involving
responders. Pedestrian and bicycle-actuated signals can be coordinated into the system as
well. ITS technologies can aid in traffic management techniques such as reversible flow
lanes and lane restrictions. Dynamic message signs can be used to post information on the
changing direction of traffic flow and restrictions throughout the day and night. Automated
enforcement programs that increase compliance with speed limits, traffic signals, and 68 The Intelligent Transportation Society of America. “About ITS America.” < http://www.itsa.org/new.nsf/vLookupAboutITSA/$first?OpenDocument > June 25, 2003. 69 United States Department on Transportation. Federal Highway Administration. “Intelligent Transportation Systems Benefits and Costs 2003 Update.” May 2003. < http://www.itsdocs.fhwa.dot.gov/jpodocs/repts_te/13772.html > June 17, 2003.
Hutton
35
aggressive driving laws may also be included in these management systems. On the freeway,
ramp meters can be used on entrance ramps to optimize travel speeds on the freeway and
ramp meter wait times.
Incident management systems reduce traffic congestion related to vehicle crashes and
other incidents by decreasing detection time, reducing response time, and minimizing the
time needed to bring traffic back to normal conditions. Intelligent infrastructure and
intelligent vehicle technologies work together in these types of systems to provide incident
information to responders and travelers. Inductive loop detectors, acoustic roadway detectors
and camera systems, as well as wireless enhanced 911 systems, and vehicle technologies
such as mayday and automated collision notification systems help detect incidents quickly.
Even roadside call boxes can help response teams locate accidents. Response times can be
decreased by computer aided dispatch systems and response routing systems. Dynamic
message signs and highway advisory radio help travelers negotiate around incidents and aid
in quick clearance and reopening of lanes, reducing congestion and minimizing delays.
Emergency response systems use many of the same notification, dispatch and
emergency guidance technologies that were described in incident response systems. Both of
these systems are often used in conjunction with the traffic management systems as well.
Emergency response systems improve public safety by decreasing notification and response
times to traffic crashes and hazardous materials incidents and can provide safety to
responders traveling to and from incident scenes and managing traffic during emergency
evacuations. Advanced automated collision notification (ACN) can improve response time,
especially in rural areas, where travel time to a hospital is greater than in a metropolitan area
and the consequences of injuries can be more severe. These ACN systems can provide more
than just the location of the vehicle, such as the passengers’ medical information and crash
characteristics. Technologies called telemedicine systems link medical facilities to
ambulances, allowing doctors to advise emergency responders on en route treatments. Two-
way communication systems between emergency vehicles and dispatchers, and public and
private agencies aid in evacuation operations where many agencies must work toward a
coordinated plan. Automated Vehicle Location technology can help track emergency vehicle
fleets during the evacuation effort.
Hutton
36
Electronic Payment Systems such as Electronic Toll Collection (ETC) at toll plazas
work to increase efficiency and convenience of toll collection. Were ETC has been used,
throughput has been improved and fuel consumption and emissions have been reduced.
Some studies have shown that crashes at toll plazas with ETC have increased, probably due
to confusion regarding plaza configuration and differences in speed between vehicles with
and without ETC transponders. As this technology develops, it will become possible for
drivers to pass through toll collection stations on the main roadway without have to slow
down or negotiate toll booths.
Traveler information systems can provide information to the driver both before a trip
and during a trip. Pre-trip information may be posted on websites to provide weather
forecasts, expected trip times, and route planning. Information regarding travel to and from
special events may also be provided. The designated 511 telephone number provides access
to travel information after the driver has begun his or her trip, and is being implemented in
areas around the country. Roadside information such as dynamic message signs and highway
assistance radio is usually operated under the previously discussed arterial and freeway
management systems. Most information provided by each of these technologies is regional
and sometimes multi-modal. The systems can reduce congestion by encouraging transit use
during peak travel times or in heavy traffic areas, can encourage drivers to change the time of
their trips, and can help drivers plan alternative routes.
Crash prevention and safety strategies work to reduce the risk of operators and
occupants of vehicles, as well as pedestrians and cyclists. Commercial trucks are made
aware of dangerous ramps, curves or downgrades through road geometry warning systems.
Accidents at highway-rail crossings can be reduced with systems that minimize the risk of
collisions between trains and school buses or vehicles carrying hazardous materials.
Intersection detection systems can advise drivers of the presence and direction of
approaching traffic at rural intersections in order to reduce approach speeds. Drivers can be
made aware of pedestrians entering crosswalks by pedestrian safety systems that
automatically activate in-pavement lighting. Bicycle warning systems tell drivers when a
cyclist is present in an upcoming stretch of roadway, which improves the safety of the
cyclist, especially in tunnels or on narrow bridges. Systems using radar to detect large
Hutton
37
animals in the roadway are being tested. These systems would be used upstream of frequent
crossing areas and would flash warning lights to drivers when large animals were present.
Roadway operations and maintenance ITS can maximize traffic flow through and
around construction work zones while protecting the safety of both the travelers and the
workers. These systems can stand alone or be used in conjunction with existing traffic
management systems to provide information to travelers on the status of work, control travel
speeds, notify divers of changed lane configuration, and estimate travel times and delays.
Other uses of ITS in this area can help DOT’s by providing fleet tracking information and
automated data collection for monitoring the condition of highway infrastructure.
Driver Assistance Systems within the vehicle can provide information to help drivers
make decisions in unfamiliar areas or hazardous conditions, and can monitor the condition of
the driver and the vehicle. Navigation systems using Global Positioning Systems and
integrated communication systems can reduce driver error, improve driver decisions, and
make on-the-fly rerouting decisions possible. On-board monitoring systems that provide
real-time data can be used in commercial vehicles to report the condition of cargo and
provide information regarding the mechanical condition of vehicles equipped with in-vehicle
diagnostics.
Collision Notification Systems can be manual, such as Mayday, or automatic (ACN)
and alert emergency responders of the location and severity of incidents on the roadway.
Some advanced ACN systems use a combination of GPS, in-vehicle crash sensors and
wireless communication to provide call centers and responders with information on the crash
location and the number and nature of passenger injuries. These systems can provide
responders with what type of equipment is needed, what modes of transportation will be
required for injured passengers and where the nearest medical facility is located. These
systems are installed in some high-end luxury cars in the factory and are available to others
as after-market installations.
Hutton
38
Benefits Already Realized70
Individual ITS technologies, systems of ITS and networks of systems have already
been implemented in many places around the country. Data from many of these projects
have been collected and recorded, and the improvements in safety, travel times, and
congestion reduction are being realized already. Although deployment and operations costs
are known for these operations, and it is widely accepted that ITS can be a cost effective
means of alleviating congestion, it is difficult to determine the cost/ benefit ratio of
individual applications with regard to safety applications. However, many studies of the
benefits of ITS cite safety improvements after deployment, and a few examples are listed
here.
• In some cases, red-light violations have decreased 20 to 75 percent with the use of
automated enforcement traffic signals.
• Freeway management systems using ramp meters can reduce accidents 15 to 50
percent. In a six-week study of a freeway management in Minneapolis-St. Paul,
Minnesota, it was shown that the ramp meters used reduced crashes by 21 percent,
decreased travel time by 22 percent, and increased freeway capacity by 10 percent.
• In Pennsylvania from 1993 to 1997, traffic and incident management systems reduced
incidents by 40 percent. The Coordinated Highways Action Response Team in
Maryland was shown to reduce the duration of incidents approximately 55 percent in
both 1999 and 2000. Yearly savings in states where incident management systems
reduced delays were between $1.2 and $1.8 million a year.
• In Albuquerque, New Mexico, ITS applications in operations and maintenance during
a construction project at the “Big I” interchange reduced incident clearance times 44
percent with the use of motorist assistance patrols and a temporary traffic
management center.
• Downhill speed warning signs in Colorado decreased the number of truck accidents
by 13 percent and the runaway ramp usage by 24 percent in four years.
70 United States Department on Transportation. Federal Highway Administration. “Intelligent Transportation Systems Benefits and Costs 2003 Update.” May 2003. < http://www.itsdocs.fhwa.dot.gov/jpodocs/repts_te/13772.html > June 17, 2003.

Hutton
39
• In Idaho, drivers reduced their speeds by an average of 35 percent when dynamic
message signs provided weather related warnings and only nine percent when the
signs were not used.
• A modeling study by the National Highway Traffic Safety Administration showed
that collision warning systems would be effective in over half of all crash situations,
including 75 percent of rear-end crashes where the lead vehicle is not moving.
• A three year study of Automatic Collision notification systems in both urban and
suburban area of Erie County, New York showed that notification time for vehicles
with ACN was less than one minutes, with some notification time as long as two
minutes. The average notification times for cars without the technology averaged
around three minutes, with some as long as 30 to 45 minutes.
• Traveler information systems in Cincinnati and Northern Kentucky may have reduced
fatalities by 3.2 percent.
• The 511 traveler information line is now available to over 45 million people in 17
states. More than 7.3 million calls have been placed, and 99 percent of surveyed
users report that the information has helped them avoid traffic problems, save time,
and reduce frustration.
These examples are only a few examples of the benefits of ITS directly related to
safety. Indirectly, safety is increased when congestion is decreased and when drivers are
informed of potential hazards or dangerous zones on the roadways.
Future Technologies
Most Collision Warning Systems, which include intersection collision warning,
obstacle detection, lane change collision warning, road departure warning, and forward and
rear impact warning, are still in the research and testing phases. These are in-vehicle
technologies that use microwave radar and machine vision to detect unsafe lane-keeping
typical of drowsy drivers, vehicles or in adjacent lanes, obstacles or animals in the vehicle’s
path, or quickly approaching vehicles in front of or behind the driver. Visual and audible
alerts warn drivers when these things are detected. Warning signs in the rear of the vehicle
can warn followers when they are too close or approaching too quickly. When a driver does

Hutton
40
not respond to warnings by braking, the vehicle may take over and begin to brake
automatically.71
Other in-vehicle technologies being developed include vision enhancement and safety
event recorders. Vision enhancement technologies may be able to improve visibility at night
or in low light conditions, during foggy conditions, in drifting snow, and in other inclement
weather conditions. Safety event recorders are similar to a black box in an aircraft, collecting
vehicle performance data, video data and data from radar sensors, and can provide valuable
information concerning the circumstances of an accident just prior to and during the
incident.72
The Intelligent Transportation Society of America published in January 2002 a ten
year vision for the National Intelligent Transportation Systems program called “Delivering
the Future of Transportation.” In the next decade, the plan sets specific goals, such as saving
5,000-7,000 lives each year and significantly reducing the severity of accidents by 2011,
saving $20 billion a year in highway operations costs, reducing gasoline consumption by one
billion gallons each year, providing current information to all to aid in travel choices, and
increasing security by improving detection and response times to national emergencies or
dangerous national events, all through the use of ITS. In the coming decade, drivers will
have access to a national network of transportation information, vehicles will alert drivers to
potentially dangerous situations, and the culture of transportation will shift to a focus on
customer satisfaction.73
Revolutionary changes to the world’s transportation system farther in the future, such
as flying cars, magnetic rail transit, which can travel faster than an airplane, and self-driven
cars, which will require the occupant to supply only a destination, are currently being
researched and developed. These technologies will help to reduce the need for greater
capacity on our highways, but will bring a new set of challenges to traffic safety and
management.
71 United States Department on Transportation. Federal Highway Administration. “Intelligent Transportation Systems Benefits and Costs 2003 Update.” May 2003. < http://www.itsdocs.fhwa.dot.gov/jpodocs/repts_te/13772.html > June 17, 2003. 72 Ibid. 73 Intelligent Transportation Society of America. “Delivering the Future of Transportation.” Summary of The National Intelligent Transportation Systems Program Plan: A Ten Year Vision.” January 2002. < www.itsa.org/resources.nsf/Files/PPRA_Popular_Final/ $file/PPRA_Popular_Final.pdf > July 25, 2003.
Hutton
41
Roadblocks to ITS deployment
The level of ITS deployment around the nation ultimately depends on the state and
local transportation organizations. The culture and attitudes toward making ITS a priority
vary greatly from state to state. While some states are already realizing the benefits ITS can
provide in traffic management and traveler safety, other states have not even explored these
possibilities. Although much of the funding provided by the various transportation programs
can be used for ITS, some states may need further incentives to begin to implement ITS
solutions, such as categorical formula-based programs specifically for deployment of ITS.74
Although transportation organizations spend money on the research and development
of vehicle technologies, intelligent vehicle systems are typically paid for by the driver when
he or she purchases the car. Intelligent vehicle systems are becoming more common in
newer vehicles, but by no means have they become the standard. In order to benefit from a
collision warning system or a collision notification technology, the driver has to be willing
and able to buy a more expensive vehicle or to have an expensive system installed. But as
the cost of these systems decrease, it will become more likely that they will be found in
economy cars as well as luxury automobiles. In the future, government mandates could
require all new vehicles produced in the country to include these technologies, just as has
happened with seatbelts and airbags.
In 2001, the American Society of Civil Engineers published the Report Card for
America’s Infrastructure. The Report Card gave the nation’s roads a D+, bridges a C, and
transit a C-. A third of the major roads in the country are in poor or mediocre, meaning that
they are in need of improvements immediately or in the near future, and outdated road and
bridge design, safety features, and pavement conditions are responsible for 30 percent of fatal
accidents on the highways. It was estimated in 1998 that an investment of approximately
$10.6 billion a year for 20 years is needed to improve the 29 percent of the nation’s bridges
that are structurally deficient or obsolete. The Report Card also claims that transit spending
will have to increase by 41 percent to maintain the system in its present condition, as
ridership continues to increase faster than highway and airline transportation.75
74 74 Upchurch, Dr. John. ASCE fellow to the U.S. House Committee on Transportation and Infrastructure, Subcommittee on Highways and Transit. Personal Interview. July 14, 2003. 75 American Society of Civil Engineers. “Renewing America’s Infrastructure: A Citizen’s Guide.” 2001. < http://www.asce.org/pdf/citizens_guide.pdf > July 22, 2003.
Hutton
42
As most states continue to experience revenue shortfalls and seek ways to balance
their budgets, funding for transportation projects is reduced to only the absolutely necessary
projects or those which have already been started. Although ITS solutions can be very cost
effective ways of stretching the capacity of existing roads, they cannot repair structural
deficiencies or poor pavement conditions that are already present. States are forced to focus
on repair and rehabilitation projects before they can begin to implement new ITS
technologies.

Hutton
43
Recommendations
1. Increase overall highway funding.
First and most importantly, overall funding for surface transportation must be
increased. Although the House Transportation and Infrastructure Committee seems
committed to providing a six year authorization of $375 billion, this still falls short of $450
billion needed to provide the $75 billion a year suggested in the Department of
Transportation’s 2002 Conditions and Performance Report. The Federal Highway
Administration estimates that $76 billion a year until 2020 will be needed to maintain the
current conditions of highways and bridges, and $107 billion a year to effectively improve
the highway system. The level needed to maintain today’s average conditions requires an 18
percent increase in surface transportation funding from 2000, and the level to improve
requires an increase of 65%.76 The level of funding proposed by the administration, a mere
$247 billion for six years, is far too little to improve or even maintain the nation’s aging
infrastructure.
A GAO report published in June 2003 looks at the investment trends in highway
infrastructure by federal, state and local governments. The study found that over the past 20
years, federal investment has increased 83 percent, while state and local investment increased
166 percent. Since 1982, highway funding has increased from $29.6 billion annually to $66
billion. When compared to the increase in the nation’s fiscal capacity, measured by GDP, the
nation’s highway investment has remained flat, with states showing a stronger level of effort
than the federal government.77 Although some may argue that a tighter budget will actually
encourage states to implement efficiency-increasing ITS solutions, the development and
implementation of new technologies cannot even be investigated while bridges are
structurally deficient and pavement quality is so poor that vehicle damage and personal
injury due to road conditions costs more than repaving the roads. The reauthorization needs
to provide the funding to bring the nation’s highway system into the 21st century.
In order to provide the level of funding suggested by the U.S. DOT, new revenue will
have to be generated. The funds made available by strategies such as reducing the balance in
76 General Accounting Office. “Trends in Federal and State Capital Investment in Highways.” GAO-03-744R. June 18, 2003. < www.gao.gov/new.items/d03744r.pdf > July 10, 2003. 77 Ibid.
Hutton
44
the Highway Trust Fund will only make a small dent in the extra $200 billion dollars over six
years that will be needed. Reducing tax and fee evasion, increasing the Ethanol tax to match
that of gasoline and returning the interest earned by the highway trust fund back into its own
account will also be very small steps toward a large goal. Although no one likes to pay
higher taxes, an increased user fee is a fair and needed way to fund improvements to the
nation’s transportation system. As we’ve seen in the past, one-time fixed increases provide
short-term funds for an ever increasing need. An immediate increase in the user fee needs to
be implemented to provide the needed funding for this reauthorization. In order to provide
lasting funds, the user fee must increase yearly in proportion to the Consumer Price Index.
If the Congress is serious about passing a reauthorization that provides $128 billion
more than the administration’s proposal, and is prepared to increase user fees in order to fund
it, it is critical that the reauthorization be passed as soon as possible. Currently, the President
does not support an increased user fee; however, as reelection approaches, the administration
will only become more strongly apposed to any sort of tax increase. Since it is unlikely that
a six-year authorization will pass before TEA-21 expires at the end of September, the US
DOT will be forced to rely on temporary continuations of the policy and funding levels
outlined in the existing authorization. The country’s surface transportation system cannot
afford several more years of inadequate funding. A long-term reauthorization, when it is
finally passed, must provide higher levels of funding.
2. Create formula-based categorical ITS funding.
The reauthorization of TEA-21 must provide minimum categorical funding for ITS
deployment and operations. Some states have already begun to recognize the benefits of
deploying ITS systems, but others have not. Although the needs for ITS vary from state to
state and area to area, some applications are most effective when available to all travelers
throughout the country. Information provided by calling the 511 number may help drivers
make decisions about which path to take in or around cities hundreds of miles down the road.
Availability of systems that aid in communication and response to hazardous material spills
and other security issues is important everywhere in the country.
Formula-based funding also helps reduce earmarking funds for specific projects. As
elected officials working for a specific constituency, members of Congress work to bring as
Hutton
45
much funding for special projects to their districts as possible. The desire to be reelected
may overcome a sense of fairness, or a need for efficiency and effectiveness when it comes
to allocating funds. Although it might be necessary to create specific development areas
where higher levels of resources are used in one place to study the benefits of coordinated
networks of systems, creating a formula based category would give every region access to
minimum funding to implement essential ITS solutions.
3. Complete a comprehensive study of factors leading to crashes and fatalities.
A comprehensive survey of highway accidents and surrounding circumstances must
be completed. Although accident statistics are currently being recorded, it is important to
create national guidelines for what information is obtained and how it is recorded.
Uniformity in the language used to describe the circumstances and outcomes of accidents is
crucial to accurately categorizing and comparing factors that lead to accidents, property
damage, injuries and fatalities. ITS technologies can be used to keep real-time data on
highway incidents, so that patterns can be identified and remedied in a timely manner. A
clear understanding of the roles played by driver, vehicle and roadway in every accident will
help guide the allocation of resources aimed at improving highway safety.
4. Understand the cost/benefit ratio of all highway safety programs, including
education, behavior modification, law enforcement, construction and ITS strategies.
Once the causes of accidents are understood, the cost/benefit ratio of various safety
programs must be determined in order to maximize the ability of each dollar invested in
safety to prevent accidents and save lives. Individual components of intelligent infrastructure
and intelligent vehicles must be compared in effectiveness to “click it or ticket” and “Don’t
Drink and Drive” campaigns. The right balance of driver education, law enforcement, better
highway design, high performance materials and better construction techniques, and
intelligent transportation will ensure that tax dollars are being spent to save lives. Figure 5,
taken from the GAO report “Factors Contributing to Traffic Crashes and NHTSA’s Efforts to
Address Them” in 2003, shows the distributions of the National Highway Traffic Safety
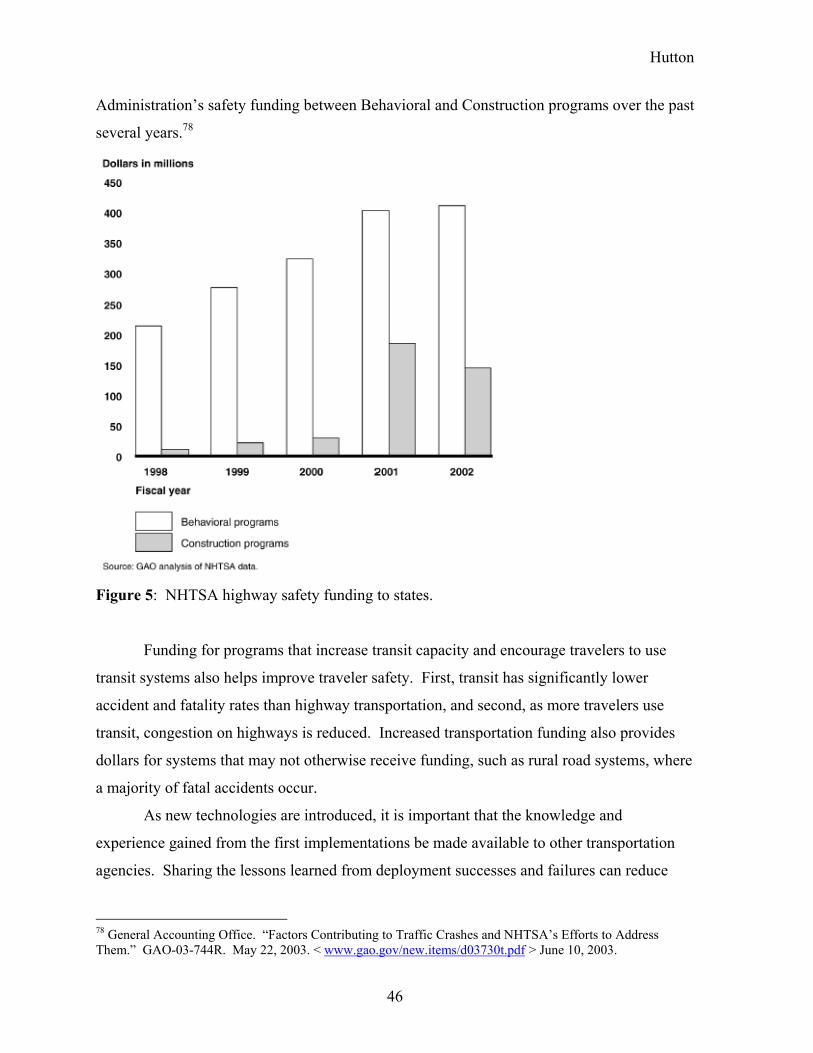
Hutton
46
Administration’s safety funding between Behavioral and Construction programs over the past
several years.78
Figure 5: NHTSA highway safety funding to states.
Funding for programs that increase transit capacity and encourage travelers to use
transit systems also helps improve traveler safety. First, transit has significantly lower
accident and fatality rates than highway transportation, and second, as more travelers use
transit, congestion on highways is reduced. Increased transportation funding also provides
dollars for systems that may not otherwise receive funding, such as rural road systems, where
a majority of fatal accidents occur.
As new technologies are introduced, it is important that the knowledge and
experience gained from the first implementations be made available to other transportation
agencies. Sharing the lessons learned from deployment successes and failures can reduce
78 General Accounting Office. “Factors Contributing to Traffic Crashes and NHTSA’s Efforts to Address Them.” GAO-03-744R. May 22, 2003. < www.gao.gov/new.items/d03730t.pdf > June 10, 2003.
Hutton
47
redundant costly mistakes, and can narrow the scope of and speed future research in similar
technologies.
Government contracting practices should also be modified to encourage the use of
new technologies on government highway construction projects. Low bidding discourages
contractors from using higher-risk, but potentially cost- and time-saving construction
practices. Using low bid practices on intelligent highway systems that involve new
technology applications may compromise the quality of system installed and end up costing
the project more in the long run. Quality and performance based contracts may help to
ensure the government is getting the best system at the best price. Government can also
provide incentives to contractors to use the high-risk construction techniques by sharing the
risk or providing tax benefits. As new practices become more commonly used, the risk
associated with them decreases and they become the norm. This saves the tax payers money
and time.
5. Provide state and local transportation agencies with flexibility to implement
solutions that work for them.
The flexibility of state and local transportation organizations to decide how and when
to implement new technologies in highway systems must be preserved and even increased.
Federal highway programs should allow the flexibility for states to use funds for ITS
deployment as well. Funding directed for safety purposes should not be limited to behavioral
and educational programs, but should also be available for safety-improving ITS
applications. Funding flexibility encourages the states to find and use the safety strategies
that are most effective at addressing their specific concerns.

Hutton
48
Conclusion Few can argue that reducing the number of highway fatalities and the time and
resources wasted in congestion should not be one of the nation’s priorities. For several years,
safety funding has focused on changing driver behavior, by encouraging seatbelt use and
discouraging drunk driving. Programs have included public information, driver education,
making seatbelt and impaired driving laws more stringent and making enforcement stricter.
And although the rate of fatalities has been decreasing over the past several years,
considering the increased number of vehicle miles traveled each year, the total number of
highway fatalities has been holding steady for the past several years, and has actually
increased in the past year. As the rate of decline in accidents starts to level off, it is
necessary to question if our safety programs have reached the limits of their effectiveness.
Driver error can never be completely eliminated, and driver behavior cannot be
controlled or predicted in all circumstances. In order to continue to decrease the number of
roadway accidents and fatalities, new approaches to highway safety will need to be
developed in highway safety programs. Technologies exist to make the highway
infrastructure and vehicles safer. Investment in the development and implementations of
new applications of these technologies has the potential to make significant advancements in
the nation’s goal to reduce highway fatalities. Just as the introduction of seatbelts and crash-
worthy vehicle frames significantly reduced the number of highway deaths in the 1980’s and
airbags increased accident survivability in the early 1990’s, making new vehicle and
infrastructure technologies the standard in construction projects and vehicle production has
the potential to once again show significant decreases in the incident rate on our nation’s
roadways.
Providing drivers with information in real-time about the traffic, construction and
weather conditions can help alleviate congestion by giving drivers the option of choosing
alternate routes. Variable message signs that warn drivers of upcoming obstacles or reduced
speed limits can increase reaction time enough to prevent accidents. Communication
systems capable of reporting incidents as they happen to law enforcement and emergency
response can provide more immediate medical attention and reduces the time to clear the
accident. Technologies such as ramp metering, electronic toll collection, and variable speed
Hutton
49
limits and lane controls make the existing highways more efficient, decreasing congestion
and delays by increasing the road’s capacity.
Intelligent Transportation Systems can also be used to gather important traffic data,
and can record information about the time, location, traffic conditions, road conditions, and
direct and indirect causes of each incident and near-miss as it occurs. This information can
then be used to determine priorities for highway improvements and investment into
technologies that address specific needs. This process will help ensure that the money
invested in the transportation infrastructure and in safety programs is used in the most
efficient way possible.
In order to create a connected intelligent system of roadways in the country, it is not
only necessary to provide funding for ITS development, but also to provide more
transportation dollars in general. It makes little sense for states to invest in ITS if they are
struggling for the necessary funding to keep their bridges structurally sound and their
pavement quality acceptable. The details of preventing individual highway incidents can
only be addressed when the risk of recurring accidents due to poor road quality or disasters
due to bridge failure are not a concern. When the funding is available to maintain and
improve the basic infrastructure, states can then begin to incorporate the highway safety
technologies available in their construction and repair projects.

Hutton
50
Works Cited American Association of State Highway and Transportation Officials. “Highway Safety:
Facing the Growing Challenge.” < http://www.transportation.org/download/issues/hwysafety2003.pdf > June 25th, 2003.
American Association of State Highway and Transportation Officials. “Operations and ITS:
Getting the Most from our Transportation System.” March 2003. <http://www.transportation.org/download/issues/ops_its.pdf > June 25th, 2003.
American Association of State Highway and Transportation Officials. “Organization
Overview.” <http://www.transportation.org/aashto/organization.nsf/homepage/overview > June 25, 2003.
American Association of State Highway and Transportation Officials. “Research: Saving
Lives, Time, and Money.” < http://www.transportation.org/download/issues/research2003.pdf > June 25, 2003.
American Society of Civil Engineers. “Renewing America’s Infrastructure: A Citizen’s
Guide.” 2001. < http://www.asce.org/pdf/citizens_guide.pdf > July 22, 2003. American Road and Transportation Builders Association. “ARTBA Calls for Minimum $50
Billion Per Year Federal Highway Investment in Next Program Reauthorization to Maintain System Conditions.” Press release April 9, 2001. < http://www.artba.org/news/press_releases/2001/04-09-01a.htm > July 21,2003.
American Road and Transportation Builders Association. “A Century of Service to the U. S.
Transportation Construction Industry.” http://www.artba.org/about_artba/history/overview.htm June 25, 2003.
American Road and Transportation Builders Association. “The Federal Highway Program
and Highway Safety.” 1998. < www.ntweek.org/campaigns/econ1.pdf > August 1, 2003.
American Road and Transportation Builders Association. “Two Cents Makes Sense.” Press
release July 16, 2002. < http://www.artba.org/news/press_releases/2002/07-16-02.htm > July 21, 2003.
Bureau of Transportation Statistics. “Safety Data Initiative.” < http://www.bts.gov/sdi/ >
July 1, 2003. Cuomo, Robert and Joyce Brimmer. “Impact of the Bipartisan House Transportation and
Infrastructure Committee’s FY 2004-2009 Highway and Public Transportation Investment Proposal on the US Economy.” Global Insight. May 13, 2003.
Hutton
51
General Accounting Office. “Factors Contributing to Traffic Crashes and NHTSA’s Efforts to Address Them.” GAO-03-744R. May 22, 2003. <www.gao.gov/new.items/d03730t.pdf > June 10, 2003.
General Accounting Office. “Trends in Federal and State Capital Investment in Highways.”
GAO-03-744R. June 18, 2003. < www.gao.gov/new.items/d03744r.pdf > July 10, 2003.
Intelligent Transportation Society of America. “About ITS America.”
<http://www.itsa.org/new.nsf/vLookupAboutITSA/$first?OpenDocument > June 25, 2003.
Intelligent Transportation Society of America. “Delivering the Future of Transportation.”
Summary of The National Intelligent Transportation Systems Program Plan: A Ten Year Vision.” January 2002. < www.itsa.org/resources.nsf/Files/PPRA_Popular_Final/ $file/PPRA_Popular_Final.pdf> July 25, 2003.
Intelligent Transportation Society of America. “ITS America Chairman Testifies Before
Congress.” The ITS Legislative Report. March 18, 2003. <http://www.itsa.org/subject.nsf/926a8faa89b0667e86256c91005e0425/425d52b2367ba58b85256d0e0029416d/$FILE/3.18.03%20The%20ITS%20Legislative%20Report.doc > July 10, 2003.
Intelligent Transportation Society of America. “SAFETEA: Questions and Answers about
the TSM&O and ITS Provisions.” ITS Cooperative Deployment Network Newsletter. May 29, 2003. < http://www.nawgits.com.icdn/safetea/safetea_qa.html > June 19, 2003.
Intelligent Transportation Society of America. “TEA-21 Reauthorization Update.” July 11,
2003. <http://www.itsa.org/ITSNEWS.NSF/0/50663ff4197f722685256d600069c946?OpenDocument > July 21, 2003.
Mineta, Norman Y. Transmittal Letter to the Honorable Richard B. Cheney, President of the
Senate. May 12, 2003. <http://www.fhwa.dot.gov/reauthorization/transletter051203cheney.htm > June 12, 2003.
National Transportation Safety Board. “History and Mission.”
<http://www.ntsb.gov.Abt_NTSB/history.htm > June 25, 2003. National Transportation Safety Board. “Vehicle- and Infrastructure-Based Technology for
the Prevention of Rear-end Collisions.” NTSB # SIR-01/01. June 16, 2002. <http://ntsb.gov/publictm/2001/SIR0101.htm >

Hutton
52
Office of Management and Budget. Department of Transportation. Budget FY 2004. <http://whitehouse.gov/omb/budget/fy2004/transportation.html > July 24, 2003.
“Recommendations of the Congressional ITS Caucus Advisory Committee.” February 14,
2003. <http://www.itsa.org/subject.nsf/926a8faa89b0667e86256c91005e0425/425d52b2367ba58b85256d0e0029416d/$FILE/2.14.03%20Advisory%20Committee%20Recommendations.doc > July 10, 2003.
Runge, Jeffery W. Administrator, National Highway Traffic Safety Administration.
“Testimony before the Subcommittee on Highways, Transit and Pipelines, Committee on Transportation and Infrastructure, United States House of Representatives.” May 21, 2003. < http://www.house.gov/transportation/highway/05-21-03/runge.pdf > June 24, 2003.
United States Department of Transportation. “ITS Program Coordination.”
<http://www.its.dot.gov/itsweb/jpostaff/backgrd.htm > June 25, 2003. United States Department on Transportation. Federal Highway Administration. “Intelligent
Transportation Systems Benefits and Costs 2003 Update.” May 2003. < http://www.itsdocs.fhwa.dot.gov/jpodocs/repts_te/13772.html > June 17, 2003.
United States Department of Transportation. Federal Highway Administration. “Status of
the Nation's Highways, Bridges, and Transit: 2002 Conditions and Performance Report.” Chapter 5: Highway Safety Performance. <http://www.fhwa.dot.gov/policy/2002cpr/ch5.htm > July 8, 2003.
United States Department of Transportation. Federal Highway Administration. “Who We
Are and What We Do.” < http://www.fhwa.dot.gov/whoweare/whoare4.htm> June 25, 2003.
United States Department of Transportation. National Highway Traffic Safety
Administration. “About the National Highway Traffic Safety Administration.” <http://www.nhtsa.dot.gov/nhtsa/whatis/overview/ > June 25, 2003.
United States Department of Transportation. Office of the Historian. “The United States
Department of Transportation: A brief History.” < http://isweb.tasc.dot.gov/Historian/history.htm > June 25, 2003.
United States House of Representatives. Committee on Transportation and Infrastructure.
“Administration’s Highway & Transit Funding Levels are Inadequate to Meet America’s Growing Surface Transportation Needs.” Press Release May 14, 2003. < http://www.house.gov/transportation/press/press2003/release86.html > June 9, 2003.
United States House of Representatives. Committee on Transportation and Infrastructure.
“Administration’s ‘Inadequate’ Highway & Transit Funding Proposal Criticized by
Hutton
53
Congressional Panel.” Press release May 15, 2003. < http://www.house.gov/transportation/press/press2003/release88.html > June 9, 2003.
United States House of Representatives. Committee on Transportation and Infrastructure.
“House Highway & Transit Funding Proposal Would Substantially Benefit National Economy, According to Economic Forecast Report.” Press Release May 13, 2003. < http://house.gov/transportation/press/press2003/release82.html > July 10, 2003.
United States Senate. S.1072: Safe, Accountable, Flexible, and Efficient Transportation
Equity Act of 2003. May 15, 2003. < http://thomas.loc.gov/cgi-bin/query/F?c108:1:./~c108bI1Wx5:e100485: > June 9, 2003.
United States Senate. Committee on Commerce, Science and Transportation. “Committee
Passes Surface Transportation Safety Reauthorization Act of 2003.” Press release June 26, 2003. <http://commerce.senate.gov/newsroom/printable.cfm?id=205587 > July 29, 2003.
United States Senate. Committee on Environment and Public Works. “Inhofe Introduces
President Bush’s Transportation Legislation.” Press Release May 19, 2003. < http://www.senate.gov/~epw/Releases/release_05-19-03.htm > July 21, 2003.
Upchurch, Dr. John. ASCE fellow to the U.S. House Committee on Transportation and
Infrastructure, Subcommittee on Highways and Transit. Personal Interview. July 14, 2003.