improvements in the 20th century reanalysis …...improvements in the 20th century reanalysis...
TRANSCRIPT
Improvementsinthe20thCenturyReanalysisVersion3
LauraC.Slivinski1,2,GilbertP.Compo1,2,JeffreyS.Whitaker2,PrashantD.Sardeshmukh1,2
1CooperativeInstituteforResearchinEnvironmentalSciences2EarthSciencesResearchLab,NOAA
20th CenturyReanalysisversion3
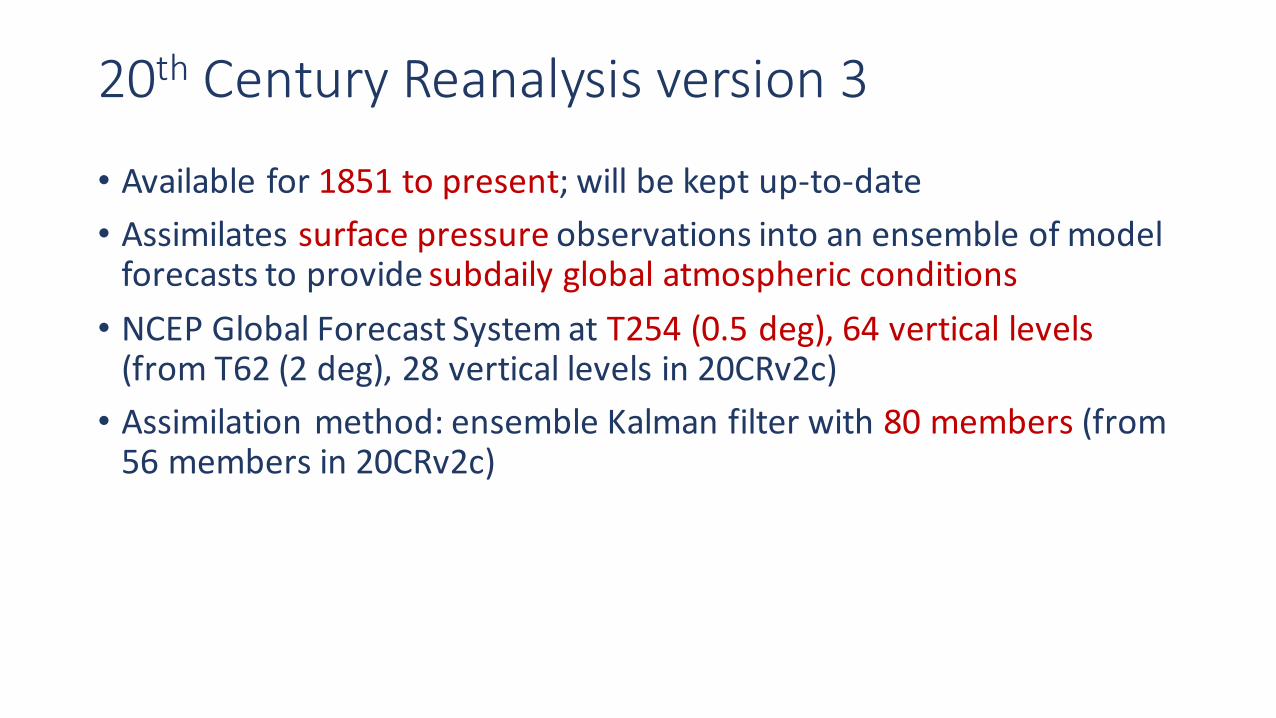
• Availablefor1851topresent;willbekeptup-to-date• Assimilatessurfacepressureobservationsintoanensembleofmodelforecaststoprovidesubdailyglobalatmosphericconditions• NCEPGlobalForecastSystematT254(0.5deg),64verticallevels(fromT62(2deg),28verticallevelsin20CRv2c)• Assimilationmethod:ensembleKalmanfilterwith80members(from56membersin20CRv2c)

20th CenturyReanalysisversion3
• Availablefor1851topresent;willbekeptup-to-date• Assimilatessurfacepressureobservationsintoanensembleofmodelforecaststoprovidesubdailyglobalatmosphericconditions• NCEPGlobalForecastSystematT254(0.5deg),64verticallevels(fromT62(2deg),28verticallevelsin20CRv2c)• Assimilationmethod:ensembleKalmanfilterwith80members(from56membersin20CRv2c)
• Version3addressesseveralissuesin20CRv2c:fordetails,seeposter“Biasesinthe20th CenturyReanalysisVersion2c”,PosterSession#2,Wedafternoon.

20th CenturyReanalysisversion3Improvementsover20CRv2c
• Adaptivelocalization&inflation:improveuncertaintyquantification
• Improvedmethodtoavoidnumericalinstabilities
• Biascorrectionappliedtomarineobservationspriorto1870

20th CenturyReanalysisversion3Improvementsover20CRv2c
• Adaptivelocalization&inflation:improveuncertaintyquantification
• Improvedmethodtoavoidnumericalinstabilities
• Biascorrectionappliedtomarineobservationspriorto1870

Uncertaintyquantificationinreanalysis
Ensemblespread←→confidence• Asobservationsbecomemorefrequent,theconfidenceintheestimates
increases(uncertaintydecreases.)• Theprocessofassimilationcausestheensemblespreadtodecrease:thiscan
resultinoverconfidentestimates.• Solution:“inflate”theensemblespreadafterassimilation.
EnsemblespreadofsealevelpressureovertheUS,20CRv2c
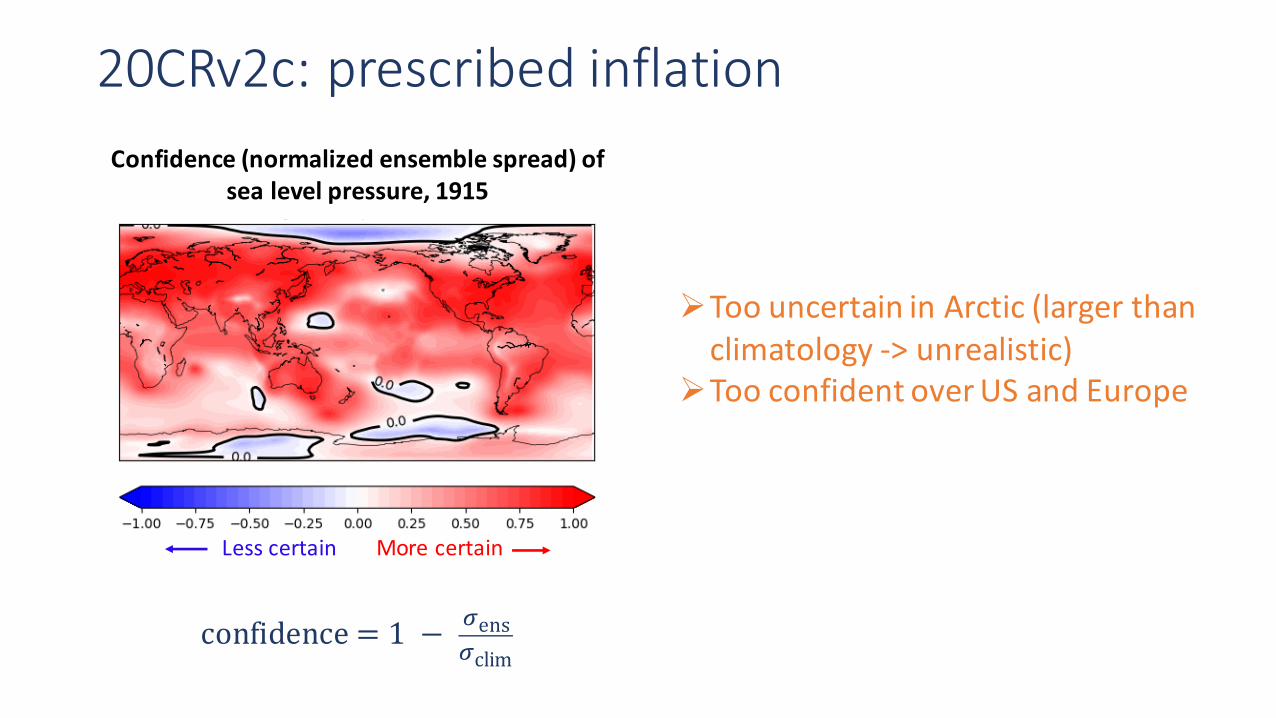
20CRv2c:prescribedinflation
confidence = 1 − ,ens,clim
Confidence(normalizedensemblespread)ofsealevelpressure,1915
MorecertainLesscertain
ØToouncertaininArctic(largerthanclimatology->unrealistic)
ØTooconfidentoverUSandEurope

20CRv3:adaptiveinflationalgorithm20CRv3:usesrelaxation-to-prior-spread(WhitakerandHamill,2012)
• Amountofinflationisproportionaltotheamountofavailableobservations(atthattimeandlocation)
• Denseobservationnetwork->moreinflation
• Sparseobservationnetwork->lessinflation
Inflationparameter,1Feb1915

20CRv2c,prescribedinflation
20CRv3,adaptiveinflation
Confidence(normalizedensemblespread)ofsealevelpressure,1915
ØToouncertaininArctic(largerthanclimatology->unrealistic)
ØTooconfidentoverUSandEurope
ØMorecertaintyinArcticØMorespreadoverUSandEurope

20th CenturyReanalysisversion3Improvementsover20CRv2c
• Adaptivelocalization&inflation:improveuncertaintyquantification
• Improvedmethodtoavoidnumericalinstabilities
• Biascorrectionappliedtomarineobservationspriorto1870

BasicensembleKalman filter
ToavoiddiscontinuitiesandinstabilitiesfromanalysisstepsintheensembleKalmanfilter,20CRv2cusedadigitalfiltertosmoothoutjumps.
x x
time
forecast update
observation

Toavoiddiscontinuitiesandinstabilitiesfromanalysissteps,20CRv2cusedadigitalfiltertosmoothoutjumps.
Thedigitalfilterturningon/offcausedartificial3-hourlyjumpsinprecipitationratesfromconsecutive3-hourforecastwindows.
Difference: precipitation between forecast hours 3to 6 minus hours 0 to 3, averaged over 2000-2005
Globalavg=0.73mm/day
Digitalfilterartifactsin20CRv2c

Solution:IAU(IncrementalAnalysisUpdate)toavoidunbalancedgravitywavesinanalysisstep(Bloometal,1996;LeiandWhitaker,2016)
20CRv2cdifferenceinprecipitationrate(hours3-6minushours0-3),avg.over2000-2005
20CRv3difference inprecipitationrate(hours3-6minushours0-3),avg.over2000-2005
Globalavg=0.73mm/day Globalavg=0.02mm/day

20th CenturyReanalysisversion3Improvementsover20CRv2c
• Adaptivelocalization&inflation:improveuncertaintyquantification
• Improvedmethodtoavoidnumericalinstabilities
• Biascorrectionappliedtomarineobservationspriorto1870

Globalsealevelpressure(SLP)
• 20CRv2chasanobviouslow-pressurebiaspriorto1870
• Dryairmasswasupdatedduringassimilation
• Shipobservationswerebiasedlow
20CRv2csealevelpressureanomaly,1854(from1981-2010climatology)
globalSLPaverage:1009.0hPa

Dryairmassconservation&shipbiascorrection
20CRv3conservingdryairmass
ØNolongerincrementingdryairmass;instead,fixat98.3050kPa(Trenberth&Smith,2005)
globalSLPaverage:1009.0hPa 1011.4hPa
Sealevelpressureanomaly,1854(from1981-2010climatology)20CRv2c
incrementingdryairmass
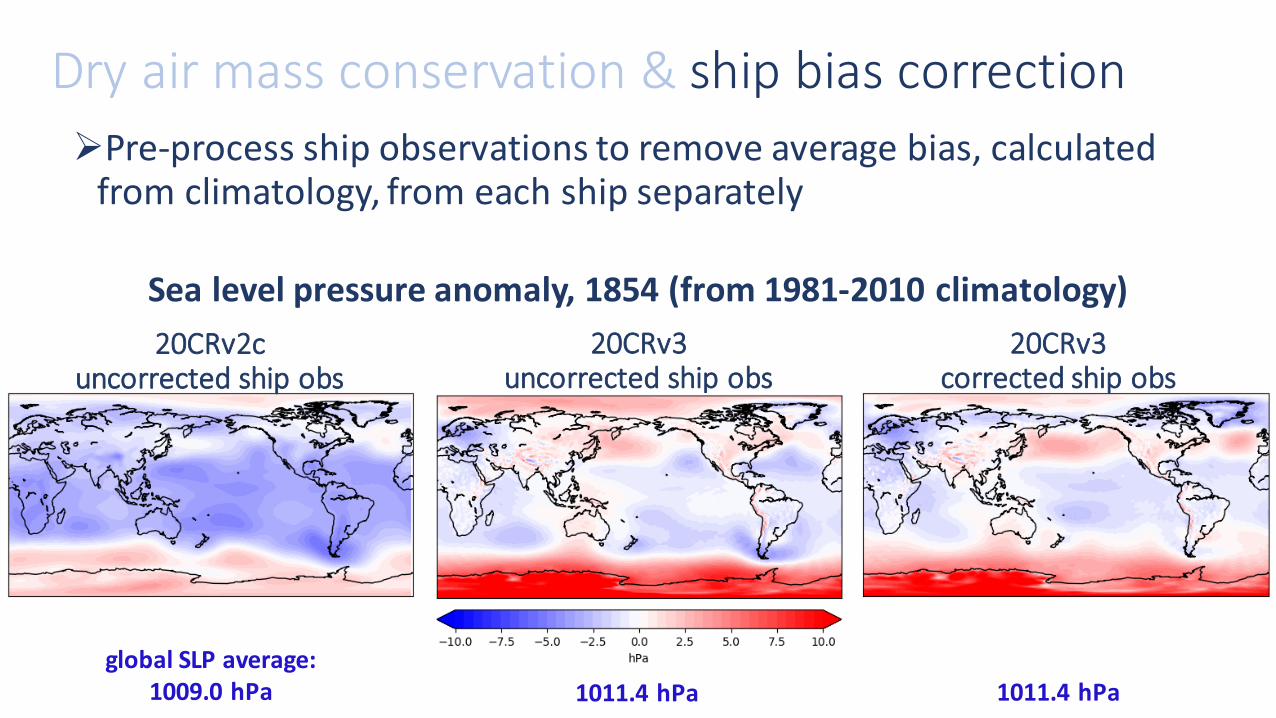
Dryairmassconservation&shipbiascorrection
20CRv2cuncorrectedshipobs
20CRv3uncorrectedshipobs
20CRv3correctedshipobs
ØPre-processshipobservationstoremoveaveragebias,calculatedfromclimatology,fromeachshipseparately
globalSLPaverage:1009.0hPa 1011.4hPa 1011.4hPa
Sealevelpressureanomaly,1854(from1981-2010climatology)
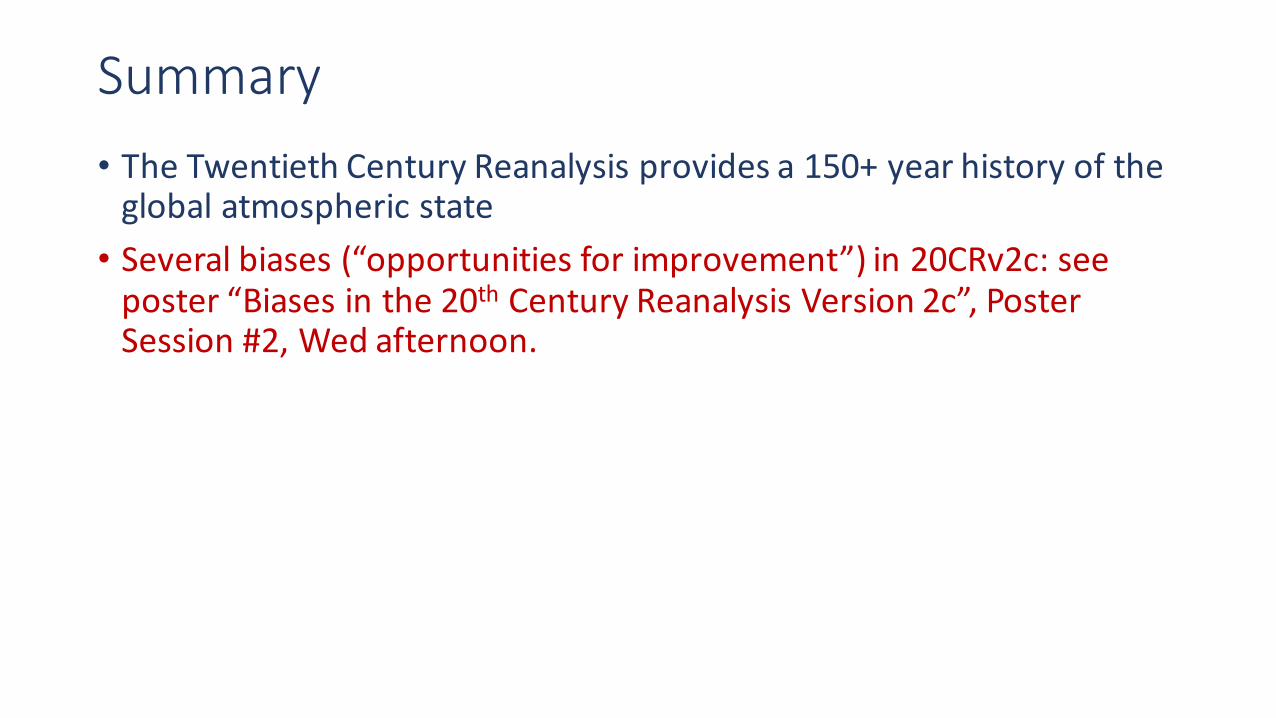
Summary• TheTwentiethCenturyReanalysisprovidesa150+yearhistoryoftheglobalatmosphericstate• Severalbiases(“opportunitiesforimprovement”)in20CRv2c:seeposter“Biasesinthe20th CenturyReanalysisVersion2c”,PosterSession#2,Wedafternoon.

Summary• TheTwentiethCenturyReanalysisprovidesa150+yearhistoryoftheglobalatmosphericstate• Ensemblemethodprovidesameasureofconfidence• Newinflationalgorithmpreventsover-tighteningensembleindenselyobservedregions,withoutincreasingthespreadinsparselyobservedregions(Importantforassessingchanges inclimatevariability)

Summary• TheTwentiethCenturyReanalysisprovidesa150+yearhistoryoftheglobalatmosphericstate• Ensemblemethodprovidesameasureofconfidence• Newinflationalgorithmpreventsover-tighteningensembleindenselyobservedregions,withoutincreasingthespreadinsparselyobservedregions(Importantforassessingchanges inclimatevariability)
• Otherimprovementsinversion3:• Higherresolution• Improveddataassimilationalgorithm• Conservingdryairmass• Biascorrectionappliedtoearly19th C.marineobservations

References• Anderson, J.L.andS.L.Anderson, 1999:AMonteCarloimplementation ofthenonlinear filteringproblemtoproduceensembleassimilationsandforecasts.Mon.Wea.Rev.127, 2741–2758.
• Bloom, S.C., L.L. Takacs, A.M. DaSilva,and D. Ledvina, 1996: Dataassimilationusing incrementalanalysisupdates.Mon.Wea.Rev.,124, 1256–1271.
• Compo,G.P.etal,2011:TheTwentiethCenturyReanalysisProject.Q.J.R.Meteorol.Soc.,137:1–28.• Lei,L.&J.S.Whitaker,2016:Afour-dimensional incrementalanalysisupdatefortheensembleKalmanfilter.Mon.Wea.Rev.,144, 2605-2621.
• Slivinski, L.C.;G.PCompo; J.S.Whitaker;andP.D.Sardeshmukh (inprep):Improvements totheTwentiethCenturyReanalysisversion2c.
• Trenberth,K.E.andL.Smith, 2005: TheMassoftheAtmosphere:AConstraintonGlobalAnalyses. J.Climate, 18, 864–875.
• Whitaker, J.S.,G.P.Compo,X.Wei,andT.M.Hamill, 2004: ReanalysiswithoutRadiosondesUsingEnsembleDataAssimilation. Mon.Wea.Rev.,132, 1190–1200.
• Whitaker, J.S.andT.M.Hamill,2012:Evaluatingmethods toaccountforsystemerrorsinensembledataassimilation.Mon.Wea.Rev.,140, 3078-3089.
Thankyou!

Extraslides

Ensemblespread(representationofuncertainty)20CRv2c:multipliedensemblecovariancebyapredeterminedinflationparameter.
• Jumpsintime• Seamsinspace
AdaptedfromCompoetal(2011)
Ensemblespreadvstemporalspreadforairtemperature(at250hPa)overS.Atlantic
DegK
1.0
2.0
3.0
1851 20111891 1931 1971
1851 – 1890 1891 – 1920 1921 – 19501951 – 2012

Ensemblespread(representationofuncertainty)20CRv2c:multipliedensemblecovariancebyapredeterminedinflationparameter.
• Jumpsintime• Seamsinspace
AdaptedfromCompoetal(2011)
Ensemblespreadvstemporalspreadforairtemperature(at250hPa)overS.Atlantic
DegK
1.0
2.0
3.0
1851 20111891 1931 19711951
Ø Ensemblespreadislargerthantemporalspread[climatology]
Ø Jumpin1951,wheninflationparameterisincreased
1851 – 1890 1891 – 1920 1921 – 19501951 – 2012

Solution:updateinflationalgorithm20CRv3:usesrelaxation-to-prior-spread(RTPS)[WhitakerandHamill(2012)]
• Amountofinflationisproportionaltotheamountofavailableobservations(atthattimeandlocation)
20CRv2c:multipliedensemblecovariancebyapredeterminedinflationparameter.
• Jumpsintime• Seamsinspace
• Denseobservationnetwork->moreinflation
• Sparseobservationnetwork->lessinflation
AdaptedfromCompoetal(2011)
1851 – 1890 1891 – 1920 1921 – 19501951 – 2012

Uncertaintyinsealevelpressure,JFM(1915-1918)Normalizedbyclimatologicaluncertainty
MorecertainLesscertain
ØToomuchuncertaintyinArctic(largerthanclimatology->unrealistic)
ØTooconfidentoverUSandEurope
20CRv2c

Uncertaintyinsealevelpressure,JFM(1915-1918)Normalizedbyclimatologicaluncertainty
MorecertainLesscertain
ØToomuchuncertaintyinArctic(largerthanclimatology->unrealistic)
ØTooconfidentoverUSandEurope
ØMorecertaintyinArcticØMorespreadoverUSandEuropeØUnresolvedissue:largespreadinsouthernhighlatitudes
20CRv2c 20CRv3

Actualvs.expectedRMSE(SLP)
ØActualmeansquareerror=meansquareddifferencebetweenobservationandfirst-guess
ØExpectedmeansquareerror=(varianceoffirstguessensemble)+(observationerrorvariance)
ØMeantakeninspaceandtime,thentakesquareroot

1915 1916 1917 19180
0.5
1
1.5
2
2.5
3
3.5
4
Erro
r (hP
a)
0
50
100
150
200
250
300
350
400
num
. obs
. per
ana
lysi
s
Northern Hemisphere (20N:90N)
Actualvs.expectedRMSE(SLP)
1915 1916 1917 19180
0.5
1
1.5
2
2.5
3
3.5
4
Erro
r (hP
a)
0
5
10
15
20
25
30
35
40
45
50
num
. obs
. per
ana
lysi
s
Southern Hemisphere (20S:90S)
1915 1916 1917 19180
0.5
1
1.5
2
2.5
3
3.5
4
Erro
r (hP
a)
0
50
100
150
200
250
300
350
400
num
. obs
. per
ana
lysis
Northern Hemisphere (20N:90N)
v2c, actualv2c, expv3, actualv3, exp
ØConsistentimprovementfromv2ctov3ØNH:v3hassmallererrorsthanv2c;actualandexpectedRMSE’sarecloserØSH:v3actualRMSElowerthanexpectedRMSE,andlowerthanv2cactualRMSE
Nobs,v3
Nobs,v2c
Nobs,v3Nobs,v2c

Ensemblespread(representationofuncertainty)Ensemblespread(SLP)forJFM,1915-1918:20CRv2c Ensemblespread(SLP)forJFM1915-1918:20CRv3
20CRv2c:ØToomuchspreadinArctic(largerthanclimatology->unrealistic)
ØToolittlespreadoverUSandEurope(overlyconfident.)
20CRv3:ØLessspreadinArcticØMorespreadoverUSandEuropeØUnresolvedissue:largespreadinsouthernhighlatitudes
Lesscertain

Normalization:climatologicaluncertaintyofSLP
Normalization:Divideensemblespreadbyclimatologicalspread(temporalspreadofanalysisover1981-2010)andsubtractfrom1.

SLPspreadnormalizedbyclimatologicalspread
Red->morecertainty(thanclimatology)Blue->lesscertainty(thanclimatology)White=climatologicaluncertainty
20CRv3hasincreasedcertaintyintheArctic,andincreasedspreadindata-richregions(suchastheUS&Europe)
MorecertainLesscertain

Improveddataassimilationalgorithm
ToavoiddiscontinuitiesandinstabilitiesfromanalysisstepsintheensembleKalmanfilter,20CRv2cusedadigitalfiltertosmoothoutjumps.
x x
time
forecast update
observation

00Z 09Z06Z03Z 15Z12Z
unforced Unforcedforecast
Initialanalysis(assimilatingobsin6-hourperiod,usingunforcedforecast)
Ultimateestimatefrompreviousstep
Observation
Solution:IAU(IncrementalAnalysisUpdate)toavoidunbalancedgravitywavesinKalmanupdatestep(LeiandWhitaker,2016)

00Z 09Z06Z03Z 15Z12Z
unforced
△x03△x06
△x09
Unforcedforecast
Initialanalysis(assimilatingobsin6-hourperiod,usingunforcedforecast)
Ultimateestimatefrompreviousstep
Observation
Solution:IAU(IncrementalAnalysisUpdate)toavoidunbalancedgravitywavesinKalmanupdatestep(LeiandWhitaker,2016)

00Z 09Z06Z03Z 15Z12Z
unforced
△x03△x06
△x09
Unforcedforecast
Initialanalysis(assimilatingobsin6-hourperiod,usingunforcedforecast)
Ultimateestimate(forcedby△xfromstateatinitialtime)
Observation
Solution:IAU(IncrementalAnalysisUpdate)toavoidunbalancedgravitywavesinKalmanupdatestep(LeiandWhitaker,2016)

Solution:IAU(IncrementalAnalysisUpdate)toavoidunbalancedgravitywavesinanalysisstep(LeiandWhitaker,2016)
1.0
0.0
mm/day
2000 2002 2004
20CRv2c20CRv3
Globalaverageprecip.diff(hours3:6minushours0:3)
Globalavg=0.73mm/day
Globalavg=0.02mm/day
TheIAUschemein20CRv3hasconsistentlydiminishedtheartificialjumpsinprecipitationratebetweenhours0to3andhours3to6,visiblein20CRv2c.
20CRv2cdifferenceinprecipitationrate(hours3-6minushours0-3),avg.over2000-2005
20CRv3difference inprecipitationrate(hours3-6minushours0-3),avg.over2000-2005

Averageprecipitation&comparison
Globalavg=3.09mm/day
Globalavg=3.20mm/day
Globalavg=2.69mm/day
Both20CRv2cand20CRv3slightlyoverestimateannualprecipitation,but20CRv3avoidsthespectralringingvisiblein20CRv2c.
Comparison tomonthlydatafromtheGlobalPrecipitationClimatologyProject(GPCP)

Timeseriesofglobally-averagedsealevelpressure(SLP)DJF MAM
JJA SON
20CRv2cAMIPERA20CERA-Interim
Shading=+/- onestandarddeviation(forensembleestimates)

Timeseriesofglobally-averagedsealevelpressure(SLP)DJF MAM
JJA SON
20CRv2chasanobviouslow-pressurebiasinthe1850s(4hPainallseasons)
20CRv2cAMIPERA20CERA-Interim
Shading=+/- onestandarddeviation(forensembleestimates)

Biasedshipobservationsin1850s
Pa
20CRv2c:assimilatedall(QC’d)shipobservations Identicalexperimentto20CRv2c,butassimilated~10%fewershipobservations
Analysisincrements(analysisminusfirst-guess)ofSLP,time-averagedover1851-1853
Assimilatingtheshipobservationsinthistimeperiodacttopulltheanalysisdown,suggestingthattheshipsarebiasedlow.
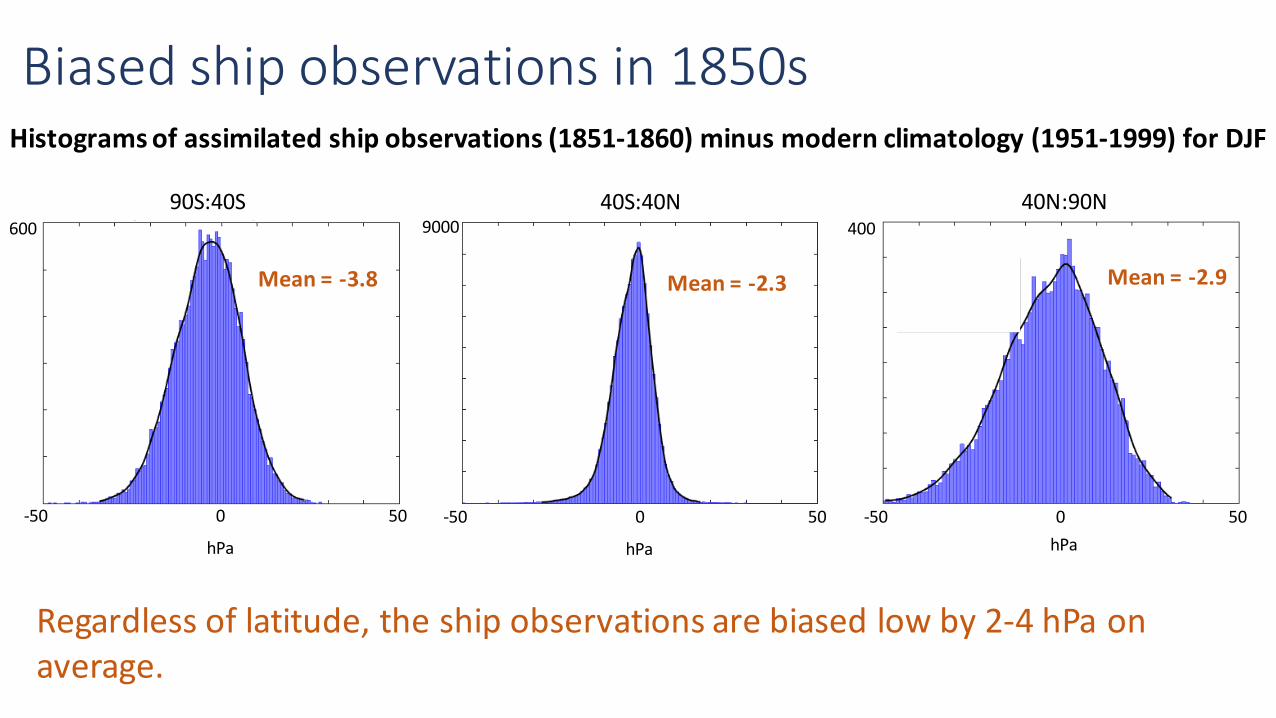
Biasedshipobservationsin1850sHistogramsofassimilatedshipobservations(1851-1860)minusmodernclimatology(1951-1999)forDJF
90S:40S 40N:90N40S:40N
-50 0 50 -50 0 50 -50 0 50
600 9000 400
hPa hPa hPa
Mean=-3.8 Mean=-2.3 Mean=-2.9
Regardlessoflatitude,theshipobservationsarebiasedlowby2-4hPaonaverage.

Cause:biasedshipobservations
20CRv2c:assimilatedall(QC’d)shipobservations Identicalexperimentto20CRv2c,butassimilated~10%fewershipobservations
Analysisestimateminusmodernclimatology[1951-2000]ofSLP,averagedover1851-1853
AssimilatingmoreshipsinthistimeperiodbringstheoverallSLPdownbyabout3hPa,whencomparedtoamodernclimatology.
hPa

Obsminusfirst-guess,Jan1856 Obsminusclimatology(1951-2000),Jan1856
Ø SignandsizeofbiasvariesacrossshiptracksØ Theoverallbehaviorof(obs– f.g.)biasissimilarto(obs– clim)biasØ Potentialbiascorrectionfor20CRv3:pre-processtheobservationsbasedon
(obs– clim)biasescalculatedusingthe20CRv2cclimatology
Individualshiptracks
hPa

Preliminarytest– biascorrectionbyship
fromPhilipBrohan,UKMetOffice
hPa
-10
5
0
-5
1800 1850 1900
AnnualaverageSLPbiasinICOADS3observations(+/- 2std.dev.)
Ø “Bias”– differencebetweenobservationsandmodernclimatology(1981-2010,from20CRv2c)Ø Preliminarybiascorrection– removethemeanoffsetfromeachindividualship

Preliminarytest– biascorrectionbyship
fromPhilipBrohan,UKMetOffice
hPa
-10
5
0
-5
-10
5
0
-5
1800 1850 1900 1800 1850 1900
AnnualaverageSLPbiasinICOADS3observations(+/- 2std.dev.)
AnnualaverageSLPbiasinICOADS3observations(+/- 2std.dev.)afterprelim.biascorrection
Ø “Bias”– differencebetweenobservationsandmodernclimatology(1981-2010,from20CRv2c)Ø Preliminarybiascorrection– removethemeanoffsetfromeachindividualshipØ Producesdesiredeffect,butcouldremoverealsignalsØ Onlypossibleforidentifiableships

TimeseriesofSLP,averagedover60S:90S20CRv2cAMIPERA20CERA-Interim
DJF MAM
JJA SON
Shading=+/- onestandarddeviation(forensembleestimates)
Highpressurebiasinsouthernhighlatitudesinearly1900sin20CRv2candERA20C.ParticularlyapparentinERA20CduringDJFseason.