improved farm soil mapping using near infrared reflection...
TRANSCRIPT
Improved Farm Soil Mapping Using Near Infrared Reflection Spectroscopy
Johanna Wetterlind Faculty of Natural Resources and Agricultural Sciences
Department of Soil and Environment Skara
Doctoral Thesis Swedish University of Agricultural Sciences
Skara 2009
Acta Universitatis agriculturae Sueciae
2009:68
ISSN 1652-6880 ISBN 978-91-576-7415-9 © 2009 Johanna Wetterlind, Skara Print: SLU Repro, Uppsala 2009
Cover: Soil and near infrared reflection spectrum (photo: S and J. Wetterlind)
Improved farm soil mapping using near infrared reflection spectroscopy
Abstract Information on soil texture, soil organic matter content (SOM), nutrient status and pH is fundamental for efficient crop production and for minimising negative effects on the environment. Farmers obtain this information, on which decisions on fertiliser and lime requirements are based, through farm soil mapping. Although there is a general awareness that within-field and within-farm variations might not be adequately captured using conventional sample point density, simply increasing the number of sample pointes would increase the cost to unacceptable levels.
In this thesis, near infrared reflection (NIR) spectroscopy was used to obtain more accurate information on within-field or within-farm variations in a number of soil properties. One central objective was to estimate the within-field variation in N mineralisation, to allow for improved N fertilisation strategies. Another was the development of economically feasible strategies for increasing sample point density in conventional farm soil mapping for improved decision support in precision agriculture.
The results presented here show that NIR spectroscopy can be used to estimate N mineralisation (measured as plant N uptake) in fields with large variations in SOM, and that the additional predictive capacity of NIR compared with SOM is related to variations in soil texture.
The results also demonstrate that it is possible to make small farm-scale calibrations with a very limited number of calibration samples for clay and SOM content, producing information at a considerably higher density than conventional farm soil mapping. Within-field calibrations for pH and easily available P, K and Mg-AL also proved possible, but more calibration samples were needed. Predictions for silt failed regardless of the number of calibration samples.
Keywords: Farm soil mapping, diffuse near infrared reflection spectroscopy, pedometrics, nitrogen mineralisation, pH, plant-available nutrients
Author’s address: Johanna Wetterlind, SLU, Department of Soil and Environment, P.O. Box 234, 532 23 Skara, Sweden E-mail: [email protected]

4

5
Contents
List of Publications 7
Abbreviations 9
Introduction 11
Objectives 15
Soil variation 17 Geostatistics 18 Precision agriculture 19
Digital soil mapping 21 Remote and proximal sensing 21 Pedometrics 22
Farm soil mapping 25 Farm soil mapping in Sweden 25
Near infrared reflection spectroscopy 27 Short history and definition 27 Physics and chemistry behind NIR spectroscopy 28
Materials and methods 31 N mineralisation study (Paper I) 32 Farm soil mapping strategies (Papers II-IV) 33 NIR measurements (Papers I-IV) 37 Analyses of NIR spectra (Papers I-IV) 38
Calibration 38 Validation A 39 Evaluation 39
NIR for measuring spectrally active soil properties 41 Soil texture 41 SOM and total N 42
NIR for measuring spectrally inactive soil properties 45

6
pH A 45 Plant mineral nutrients 46 Soil N mineralisation 47
Potential N mineralisation 47 Actual N mineralisation 47
Calibrations at different scales 51
Strategies for dense farm soil mapping 53
Conclusions and future work 59 N mineralisation (Paper I) 59
Future work 60 Farm soil mapping strategies (Papers II-IV) 60
Future work 61 Current limits and applications of the method 61
References 63
Acknowledgements 71

7
List of Publications
This thesis is based on the work contained in the following papers, referred to by Roman numerals in the text:
I Wetterlind, J., Stenberg, B. & Jonsson, A. (2008). Near infrared reflectance spectroscopy compared with soil clay and organic matter content for estimating within-field variation in N uptake in cereals. Plant and Soil 302, 317-327.
II Wetterlind, J., Stenberg, B. & Söderström, M. (2008). The use of near infrared (NIR) spectroscopy to improve soil mapping at the farm scale. Precision Agriculture 9(1-2), 57-69.
III Wetterlind, J., Stenberg, B. & Söderström, M. Increased sample point density in farm soil mapping by local calibration of near infrared prediction models. (Submitted).
IV Wetterlind, J. & Stenberg, B. Near infrared spectroscopy for within field soil characterisation – Small local calibrations compared with national libraries augmented with local samples. (Submitted).
Papers I-II are reproduced with the permission of the publishers.

8
The contribution of Johanna Wetterlind to the papers included in this thesis was as follows:
I Wetterlind did the planning of the study together with Stenberg and Jonsson, was responsible for the field experiments and carried out most of the field sampling. Performed NIR measurements and the data analyses, assisted by Stenberg. Wrote the manuscript assisted by the co-authors.
Papers II - IV are based on data collected from the same study brought about by Stenberg and Söderström, who were responsible for the general aim. Wetterlind participated in the planning of the field experiments and the field sampling.
II Was responsible for the scope and aim, together with the co-authors. Stenberg made the NIR calibrations and Wetterlind performed the geostatistical analyses, assisted by Söderström. Wrote the manuscript assisted by the co-authors.
III Was responsible for the scope and aim, together with the co-authors. Performed the data analysis. Wrote the manuscript assisted by the co-authors.
IV Was responsible for the scope and aim together with the co-author. The NIR calibrations were performed by Wetterlind and Stenberg. Performed supplementary data analysis. Wrote the manuscript assisted by the co-author.

9
Abbreviations
-AL Ammonium acetate lactate-extractable C Carbon DSM Digital soil mapping ECa Apparent soil electrical conductivity FAO Food and Agriculture Organization of the United Nations GIS Geographical information system GNSS Global navigation satellite system K Potassium Mg Magnesium MIR Mid infrared N Nitrogen NIR Near infrared reflectance P Phosphorus PCA Principle component analyses PCR Principle component regression PLSR Partial least squared regression RMSD Root mean squared deviation RMSE Root mean squared error RMSECV Root mean squared error of cross validation RMSEP Root mean squared error of prediction RPD Ratio of performance to deviation SEC Standard error of calibration SEP Standard error of prediction SOC Soil organic carbon SOM Soil organic matter SWIR Short wavelength infrared VisNIR Visible and near infrared reflection

10

11
Introduction
Farm soil mapping is the main source of information available to farmers on soil nutrient status, texture and soil organic matter (SOM) content, to act as decision support for fertilisation and liming strategies. The advance of precision agriculture or site-specific farming over the last 20 years, with global navigation satellite systems (GNSS) technology and the development of geographical information systems (GIS) and variable rate technology, has increased the requirements on farm soil mapping to provide reliable information on e.g. plant nutrient contents at a high spatial resolution.
Nitrogen (N) is one of the most important plant nutrients and is often limiting in agriculture ecosystems (Hopkins, 1995). However, an excessive supply of N enhances the risk of decreased yields and yield quality due to lodging (Gooding & Davies, 1997) and losses to the surrounding environment, primarily through leaching, adding to eutrophication of surface waters (Carpenter et al., 1998). It is therefore important both economically and environmentally to match N supply with crop demand. The fertiliser demand is dependent on potential yield and N supplied by the soil (Delin et al., 2005). Nitrogen is present in the soil mainly as soil organic matter (SOM). Normally about 5% of the SOM is organic N, and between 1 and 4% of the organic N is mineralised during the growing season, thus becoming plant-available (Havlin et al., 1999). However, the net mineralisation can vary widely within fields and years. For example, differences of over 100 kg N ha-1 during a growing season have been reported within one single 15 ha field (Delin & Lindén, 2002).
There are a variety of methods for estimating potential N mineralisation, including laboratory incubation experiments, assessments of microbial biomass and activity as well as chemical soil extraction procedures. However, the practical applications for fertilisation recommendations on
12
farms are limited (Olfs et al., 2005). Estimations of N mineralisation are not included in farm soil mapping in Sweden.
According to existing practice, the conventional sample point density in farm soil mapping in Sweden is one bulked sample per hectare and more expensive analyses such as soil texture and SOM content are only analysed on every second or third sample or not at all. Since soil properties can vary greatly within fields (e.g. van Vuuren et al., 2006) this is often not enough for decision support in site-specific farming, which requires detailed resolution and a sufficient number of samples for the use of geostatistical techniques (Webster & Oliver, 1992). However, increasing the number of conventional laboratory analyses would be too expensive for farmers to implement, demonstrating a need for new methods allowing for denser soil sampling.
Near infrared reflection (NIR) spectroscopy has attracted interest among soil scientists as a possible technique for improved soil analyses owing to rapid, non-destructive, cheap measurements as well as possibilities to determine several soil properties simultaneously (Viscarra Rossel et al., 2006). A number of studies have shown the potential of NIR to predict soil texture (e.g. Islam et al., 2003; Shepherd & Walsh, 2002; Chang et al., 2001; Ben-Dor & Banin, 1995b) as well as soil organic carbon (C) and SOM (e.g. Udelhoven et al., 2003; Chang et al., 2001; Reeves et al., 1999; Sudduth & Hummel, 1991). Other soil mapping properties such as plant mineral nutrients and pH have been estimated with NIR in a number of studies with promising, though varying, results (e.g. Christy, 2008; McCarty & Reeves, 2006; Viscarra Rossel et al., 2006; van Groenigen et al., 2003; Dunn et al., 2002). These soil properties are more or less spectrally featureless, but might be estimated indirectly due to correlations to more spectrally active properties (Chang et al., 2001; Ben-Dor & Banin, 1995a). NIR has also been related to potentially mineralisable N derived from aerobic and anaerobic incubations (Fystro, 2002; Shepherd & Walsh, 2002; Chang et al., 2001; Dunn et al., 2000) and has been used with promising results to estimate N uptake in crops (Stenberg et al., 2005; Dunn et al., 2000; Börjesson et al., 1999).
The NIR technique requires calibration against values from conventional analyses. In the majority of the published field-scale NIR calibrations, a substantial amount of samples were included in the calibrations, sometimes corresponding to more than five samples per ha (e.g. He et al., 2007; McCarty & Reeves, 2006; Viscarra Rossel et al., 2006). Compared with the conventional sample point density in farm soil mapping in Sweden, the

13
potential advantage of using NIR spectroscopy in practice is lost when using more than five times as many reference samples.
This thesis deals with ways of applying NIR spectroscopy in farm soil mapping at the farm or field scale with a minimum amount of calibration samples, to obtain information on soil texture, pH and plant nutrients, including plant-available N, at a high spatial resolution.

14
15
Objectives
The main objective of this thesis was to study the possibility of using NIR spectroscopy in farm soil mapping at the field or farm scale in order to improve the knowledge of within-field variations in the soil and thus increase the precision in arable production and environmental counter measures. The field and farm scale involves a focus on small-scale calibrations with few calibration samples. One important focus area in the present study was the estimation of within-field variation in N mineralisation to allow for improved N fertilisation strategies. The other focus area was to achieve economically feasible strategies for increasing the sample point density in conventional farm soil mapping for better decision support in precision agriculture. Specific objectives were to:
compare field-scale NIR calibrations with the use of clay and SOM as predictors for plant N uptake in plots without N fertilisation (Paper I),
develop strategies for using farm-scale NIR calibrations to increase sample point density in farm soil mapping while reducing the number of conventional laboratory analyses (Papers II and III),
compare local farm-scale calibrations with Swedish national calibrations for within-field and within-farm variation, including a strategy for augmenting local samples to the national calibration sample set (Paper IV).

16

17
Soil variation
Soil consists of a heterogeneous mixture of mineral particles of different sizes derived from weathered rock and sediments, organic particles consisting of organic compounds in different stages of decomposition, living organisms, water, air and different chemicals such as mineral nutrients associated with the particles or the soil solution. For the microorganisms, protozoa, animals, fungi and plant roots inhabiting soil, the environment can be very diverse over short distances, changing from aerobic to anaerobic, wet to dry or nutrient-rich to nutrient-poor within micrometer distances (Sylvia et al., 1998) (Figure 1).
Figure 1. Soil habitat <1 mm in both directions. After an original drawing by Kim Luoma in Sylvia et al. (1998).
Soil-forming factors such as parent material, climate, topography,
vegetation and human impact have over time resulted in a variety of different soils over the world, ranging from very old, highly weathered soils in equatorial and tropical South America, Africa, Asia and Australia to relatively young soils shaped by the latest great ice advance as in Scandinavia (Strahler & Strahler, 1978).

18
The soil-forming processes also work on a regional scale, sometimes dividing farms or fields into parts with very different soil types (e.g. Sjöstorp in Papers III and IV). Together with processes acting on local field scale, this results in sometimes very large variations in soil properties within a seemingly homogeneous field (van Vuuren et al., 2006). This has consequences for plant production, since the growing conditions can differ over the fields in terms of plant nutrients and water availability (Delin & Lindén, 2002; Delin & Berglund, 2005).
Geostatistics
Soil variability and spatial dependency can be described using geostatistical methods (McBratney & Pringle, 1997). These are based on the regionalised variable theory, which assumes that the spatial variation in a variable can be divided into three components: i) a structural component with a constant mean or a trend; ii) a spatially correlated but random component (the variation in the regionalised variable); and iii) spatially uncorrelated random noise caused by measurement error and very short-range spatial variation (Burrough & McDonnell, 1998). The interpolation technique using geostatistics, named kriging after D.G. Krige, utilises information on the spatial correlation described in an experimental variogram presenting the semivariance between pairs of samples at different distances. Figure 2 shows a schematic variogram with the nugget being random short distance noise (iii above), the sill being the maximum variance and the range being the distance at which there is spatial correlation (Burrough & McDonnell, 1998). One drawback with this method is that it requires a rather large number of samples. For example, at least 100 observations have been recommended as a minimum to calculate a reliable variogram (Webster & Oliver, 1992).
nugget
range
sill
Lag
Sem
ivar
ianc
e
nugget
range
sill
Lag
Sem
ivar
ianc
e
Figure 2. Schematic example of a variogram where lag is the distance between sampling points. The points shown in the variogram are mean values for all pairs separated by a certain distance.

19
Precision agriculture
Site-specific farming aims to utilise knowledge of within-field variations in the management of the fields in question, e.g. by variable rate fertilisation and liming. By adapting the inputs according to the requirements in different parts of the field, possibly leading to better utilisation of plant nutrients, both economic and environmental benefits can be achieved (Bouma, 1999).
The development during the past 20 years of global navigation satellite systems (GNSS), geographical information systems (GIS) and techniques for variable rate application has made it possible to adjust inputs over the field in a fairly automated way. However, one of the remaining challenges is the collection of the necessary data at a reasonable cost. It is difficult to state a universally valid number of samples needed, since this depends on the variation and the area represented by a sample (Oliver et al., 1997). Conventional laboratory analyses are often time-consuming and costly, which makes it difficult to simply intensify existing farm soil mapping practices. Within-field analyses at a high spatial resolution that does not require any collection of samples for laboratory analyses would be preferable.

20
21
Digital soil mapping
Digital Soil Mapping (DSM) is defined as: "the creation and the population of a geographically referenced soil database generated at a given resolution by using field and laboratory observation methods coupled with environmental data through quantitative relation-ships" (Working Group on Digital Soil Mapping, 2009).
DSM can utilise data collected from e.g. remote sensors, proximal sensors and digital elevation models to produce soil maps with limited use of relatively expensive fieldwork and laboratory analyses (McBratney et al., 2003). Instead of the static polygon-based soil maps, digital maps, possibly with associated uncertainties, can be stored and manipulated in GIS, allowing for a variety of analyses and the possibility of developing dynamic soil maps (McBratney et al., 2003).
The development of DSM depends on having high quality datasets, but collection of soil data is often a limiting factor according to Lagacherie (2008), who identified three complementary ways to overcome this:
"i) develop optimal sampling methods, ii) use as much as possible legacy soil data and iii) develop new soil sensors for accurate and cost-effective estimation of soil properties".
Remote and proximal sensing
In remote sensing, data are collected without any contact with the object of interest, which means that the technique is non-invasive. The term remote sensing is mostly associated with aerial photos and satellite images, but can also be applied to e.g. gravity meters that measure variations in the distribution of gravity and sonar equipment that measures differences in the distribution of acoustic waves (Lillesand & Kiefer, 2000).

22
The advantage with remote sensing techniques is the rational collection of information over large geographical areas. A weakness is that remote sensing only receives information on the topmost layer of the soil, often corresponding to a few millimetres (Viscarra Rossel et al., 2009).
Proximal soil sensors are field-based, non-invasive or invasive techniques to measure soil properties from a distance of not more than approximately 2 m above the soil surface (Viscarra Rossel et al., 2009). The advantage with using proximal sensors is the possibility to collect information in the field on soil variability at a higher resolution than with conventional measurements. Moreover, compared with strictly remote sensing techniques such as satellite images, it is often possible to collect information from both topsoil and subsoil (Viscarra Rossel et al., 2009).
Examples of proximal sensors include sensors for measuring soil electrical conductivity (e.g. Sudduth et al., 2005), ground-penetrating radar for measuring soil moisture content (Lunt et al., 2005), acoustic sensors for measuring compaction layers (Grift et al., 2005), soil strength sensors for measuring mechanical resistance (Adamchuk et al., 2008), electrochemical sensors using ion-selective electrodes for measuring pH (Adamchuk et al., 2006) and diffuse near and mid infrared reflectance (NIR and MIR) spectroscopy for the prediction of several soil constituents and properties (e.g. Viscarra Rossel et al., 2006; Islam et al., 2003; Udelhoven et al., 2003; Chang et al., 2001).
Thus NIR spectroscopy can be used both as a remote sensing and proximal sensing technique.
Pedometrics
The official definition of pedometrics is: "The application of mathematical and statistical methods for the study of the distribution and genesis of soils" (Pedometric Commission, 2009).
The term was coined by Alex McBratney, who describes it as a neologism derived from the Greek roots pedos, meaning soil, and metron, meaning measurement, to be used analogously to other words such as e.g. chemometrics and geometrics (Preface, 1994). Near infrared spectroscopy is a common research area in pedometrics, and is an example of the use of new tools and techniques for analyses of soil properties over space and time (Minasny & McBratney, 2008).
An overview of pedometric techniques is given by McBratney et al. (2000) including e.g. i) the use of fuzzy-set theory in soil classification; ii) the
23
use of what they call "the classical approach" referred to as CLORPT1 techniques, which are described as the use of information such as climate, organisms, chronology and land information in deterministic, empirical models, e.g. simple and multiple linear regressions, regression trees, generalised adaptive models and neural network models; iii) the use of geostatistical techniques including various forms of ordinary and simple kriging; and iv) the use of hybrid techniques described as various combinations of geostatistical and CLORPT methods such as universal kriging, cokriging, regression kriging, kriging with external drift and factorial kriging.
1 In McBratney et al. (2000) CLORPT refers to Jenny's (1941) (in McBratney et al., 2000)
"Factors of Soil Formation" S = f(CL,O,R,P), where S is soil property as a function of CL = climate, O = organisms, R = relief, P = parent material and T = time (see also Jenny, 1946).

24
25
Farm soil mapping
Due to an urgent need for increased agricultural production, systematic soil surveys were started in many European countries during the 1950s (The European Soil Information System, 1999). This resource-driven collection of information, often including profile description, soil classification and soil quality aspects, is found all over the world (though not in Sweden) and is still continuing. The scales of these surveys may vary from 1:2000 in some national surveys up to 1:250 000 or 1:1 or 5 million at European or global level (e.g. Food and Agriculture Organization of the United Nations (FAO)) (The European Soil Information System, 1999). Parallel to this is the more farmer-driven information collection at farm-scale to allow for economically optimised crop production. The design of these farm soil mapping systems differs somewhat in different countries. For example, in Finland a minimum of one composite sample every 5 hectares with resampling every 5 years is required to obtain subsidies for environmental purposes (for the period 2007-2013), although it is stressed that having more samples usually pays off in practice (Markkarteringstjänst, 2009). In Denmark, one sample per 1-3 ha is recommended for non site-specific management or when the sampling is based on ECa measurements or biomass and/or yield maps, and 2 samples per ha for site-specific farming without ECa measurements (LandbrugsInfo, 2003).
Farm soil mapping in Sweden
Farm soil mapping started in Sweden in the 1920s (Fredriksson, 1961) but become more common during the Second World War, partly due to shortages of fertiliser products during that time period (Franck, 1943). The chemical method for estimating "easily available" plant nutrients used in Sweden today, the ammonium acetate lactate method, was introduced in

26
1958, mostly for analyses of P and K (Egnér et al., 1960). Already from the beginning the soil sampling strategy was based on point sampling, with 2-4 samples comprising 7-8 sub-samples with an area of about 10 m2 each per ha (Fredriksson, 1961). The recommendations also included visual and manual estimation of SOM content and soil texture at the time of the sampling. However, these observations were not always made and eventually, they were phased out. The number of samples per hectare was reduced over time to about 1 ha-1.
The early soil maps from the 1940s and 1950s were entirely filled in with different colours representing P and K classes, making them resemble the interpolated soil maps of today. The completely coloured areas were later replaced by stamped circles and dots.
The soil sampling density recommended today by the Swedish Board of Agriculture is based on good soil sampling practice developed by Markkarteringsrådet (Swedish Soil Mapping Panel), a body that includes a number of representatives of the agricultural community, such as the Swedish Board of Agriculture, Swedish University of Agricultural Sciences, Swedish Rural Economy and Agricultural Societies, as well as a number of commercial companies and chemical laboratories. The recommended sampling density is one sample per hectare, or more if the field has large variations in soil texture (Hansson et al., 2002). However, the soil sampling requirement to obtain subsidies for environmental protection measures in Sweden is a farm soil map not older than 10 years with pH, P-AL and K-AL analysed in one sample per hectare and soil texture in one sample per 1-3 hectares (Jordbruksverket, 2009).

27
Near infrared reflection spectroscopy
The advantages with using NIR spectroscopy compared with many conventional laboratory measurements are minimal sample preparation, no need for hazardous chemicals, rapidity and identification of multiple properties from one spectrum (Batten, 1998). Apart from collecting soil samples, the technique also allows for development of in-field measurements (Christy 2008; Maleki et al., 2008).
Short history and definition
Near infrared reflection is said to have been discovered in 1800 by William Herschel, who found increasing temperatures beyond the red end of the spectrum, which he first referred to as "radiant heat" (Hindle, 1997). The first near infrared spectrum was measured by Abney & Festing in 1881 (Davies, 2005) but it was not until the 1960s and 1970s, that the technique really started gaining in interest when the possibility of using NIR spectroscopy for analyses of the quality of agricultural samples was demonstrated (Batten, 1998).
In this thesis, the near infrared part of the electromagnetic spectrum is defined as the wavelengths between 780 and 2500 nm (Figure 3) (Sheppard et al., 1985). This is a common definition used by people working with
Ultra VioletInfrared
Near Mid Far380 780 2500 50000 nm
Vis-ible
γ-Ray X-Ray UVRadio Waves
IR Micro ShortUHF Med LongCosmic
Ray
10 nm
10-7 nm 10-7 nm
Ultra VioletInfrared
Near Mid Far380 780 2500 50000 nm
Vis-ible
γ-Ray X-Ray UVRadio Waves
IR Micro ShortUHF Med LongCosmic
Ray
10 nm
10-7 nm 10-7 nm
Figure 3. Electromagnetic spectrum based on Figure 1 in Davies (2005).
28
NIR spectroscopy in the laboratory or under field conditions in proximal sensors (perhaps with slightly different starting points between 700 and 780 nm). However, in the area of remote sensing, e.g. satellite images, NIR is often defined as 0.7-1.3 µm wavelength, with 1.3-3.0 µm wavelength sometimes referred to as mid infrared (MIR) (Lillesand & Kiefer, 2000) or as short wavelength infrared (SWIR) (e.g. Huang et al., 2009).
Physics and chemistry behind NIR spectroscopy
Reflection spectra are a mixture of physical and chemical information. The physical part is due to the influence of particle size and surface structures on the diffuse reflectance (Dahm & Dahm, 2004) while the chemical part is due to absorption of energy by molecular bonds.
Absorption in the NIR region is due to overtones and combination bands of fundamental vibrations (stretching and bending) of OH, CH, NH, CO, CN and NO bonds in the mid infrared region. In simplified terms, light is absorbed if the energy (which is directly related to frequency or wavelength) corresponds to the difference in energy between two vibrational states (quantum numbers) in a molecular bond. These energy levels are bond-specific but are also affected by the surrounding environment, e.g. type of functional group, neighbouring molecules and hydrogen bonds. This means that a particular molecule only absorbs light at certain wavelengths, thus allowing for identification of molecules or substances due to different absorption patterns. Overtones occur when the energy of a wavelength is absorbed due to correspondence to a change in more than one vibrational state (an increase in quantum number greater than one), while combination bands occur when the energy from one wavelength is shared between two or more vibrations (Miller, 2004).
The same molecule can give rise to several overtones and combination bands over the NIR region. The intensity of overtones and combination bands is also weaker than the fundamental vibrational bands and the intensity decreases with increasing order of overtone or combination, i.e. at shorter wavelengths (Miller, 2004).
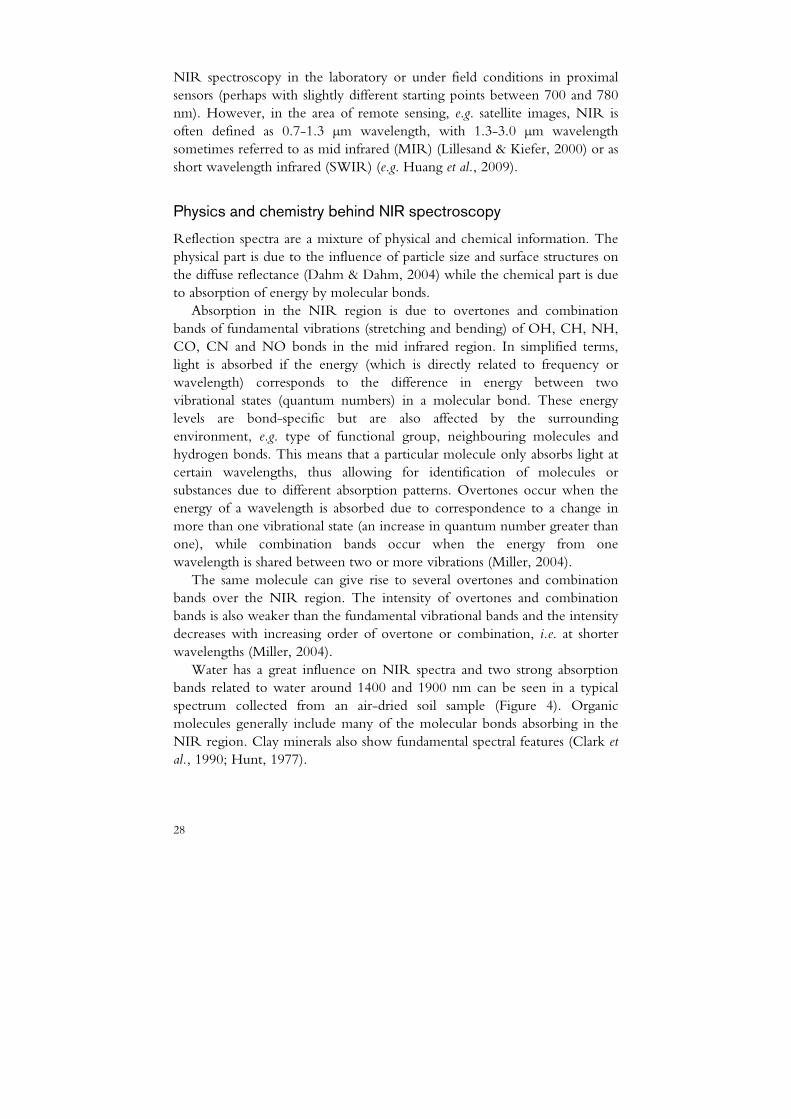
Water has a great influence on NIR spectra and two strong absorption bands related to water around 1400 and 1900 nm can be seen in a typical spectrum collected from an air-dried soil sample (Figure 4). Organic molecules generally include many of the molecular bonds absorbing in the NIR region. Clay minerals also show fundamental spectral features (Clark et al., 1990; Hunt, 1977).

29
wavelength (nm)1000 1500 2000 2500
log
(1/R
)
Figure 4. Near infrared spectrum of air-dried soil. Absorption expressed as log (1/reflection).

30
31
Materials and methods
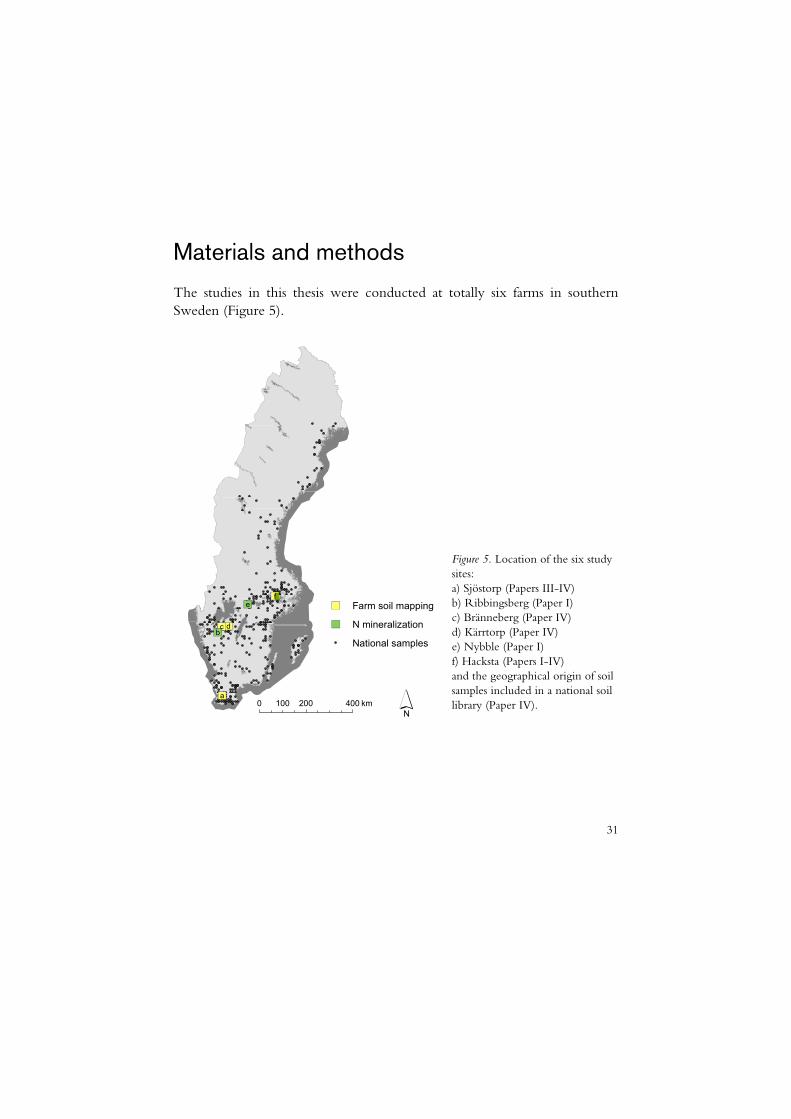
The studies in this thesis were conducted at totally six farms in southern Sweden (Figure 5).
b
e
c
f
d
a0 200 400100 km
Farm soil mapping
N mineralization
National samples
Figure 5. Location of the six study sites: a) Sjöstorp (Papers III-IV) b) Ribbingsberg (Paper I) c) Bränneberg (Paper IV) d) Kärrtorp (Paper IV) e) Nybble (Paper I) f) Hacksta (Papers I-IV) and the geographical origin of soil samples included in a national soil library (Paper IV).

32
N mineralisation study (Paper I)
The N mineralisation study was conducted in one field of about 20 ha at each of the farms Ribbingsberg, Nybble and Hacksta during the growing seasons 2003-2005 (Figure 6). Ribbingsberg and Nybble were selected because they have a rather high variation in SOM content compared with the majority of Swedish farms (3.2-19% and 1.7-20% in the 0-30 cm layer respectively), whereas Hacksta has a more representative SOM content for typical Swedish agricultural soils (2.0-5.6%).
Nitrogen in aboveground plant parts of cereal crops (Plant N uptake) from plots not receiving any N fertiliser (zero-N plots) was used as an estimate of net N mineralisation, using a similar approach to that described by e.g. Stenberg et al. (2005). Between 12 and 21 zero-N plots of approximately 24 m2 each were distributed over the fields each year (Figure 6).
Near infrared reflectance spectra, clay plus SOM content and a combination of NIR spectra plus clay and SOM content were used as predictors for plant N uptake. Calibration models were made: i) within fields and years; ii) within fields between years; and iii) between fields and years. A more detailed description of the sites and analyses is found in Paper I.
0 200 400100 m
Year200320042005
a)
c)b)
Figure 6. Location of zero-N plots during the years 2003 to 2005 at a) Ribbingsberg, b) Hacksta and c) Nybble.

33
Farm soil mapping strategies (Papers II-IV)
The farm soil mapping strategy study was conducted on adjacent fields with a total area of between 62 and 97 ha on four farms representing three of the main agricultural areas in Sweden (Figure 5).
The concept for the sampling strategy (Figure 7) was to use a higher sampling density than the conventional 1 or 0.5 samples per ha. By using farm-scale NIR calibrations with only a limited number of samples (25) analysed by conventional laboratory measurements for the calibrations, the vast majority of the soil samples only needed to be measured for their NIR spectra, thereby allowing for more soil samples without increasing the cost. Three main questions were asked: 1. Is it possible to build reliable NIR calibration models with only 25
calibration samples? 2. Where should the soil samples be taken? 3. How should the calibration samples be selected?
1. Soil sampling
2. Select calibration samples
3. Build calibration models
4. Predict the remaining samples and interpolate
Figure 7. The concept of the soil sample strategy including 1) location of soil samples, 2) selection of NIR calibration samples, 3) building of NIR calibration model and 4) prediction of the remaining samples followed by interpolation.

34
The difficulty associated with few samples is to cover the variations in the soil within a field or farm in an adequate way. However, ancillary data collected at higher density, e.g. apparent soil electrical conductivity (ECa), digital elevation models or satellite images, can be used to optimise sample locations (Dunn & Beecher, 2007; Minasny et al., 2007; Lesch, 2005).
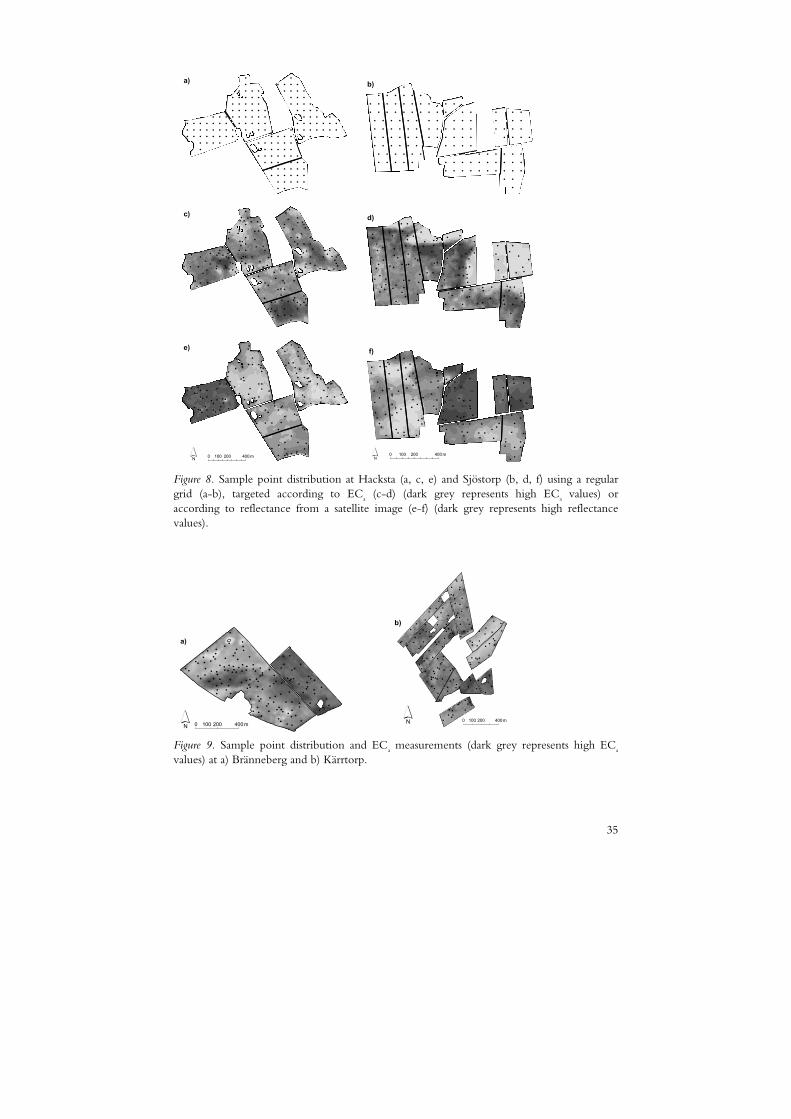
In the farm soil mapping strategy studies presented in this thesis, ECa measured with EM38 (Geonics Ltd., Mississauga, Ontario, Canada) and reflection measurements from satellite images were compared as ancillary data for directed soil sampling (Papers II and III) and with a regular grid (Paper III) (Figure 8).
The strategy for targeted sampling adopted here (proposed by Olsson & Söderström, 2003) is described in more detail in Paper II and comprises stratified, directed sampling, with the selection of sampling sites based on the degree of variation in interpolated ECa or satellite reflection maps. The ECa and reflectance measurements were used as estimations of the soil variation, rather than as direct correlations with particular soil properties, even though such correlations possibly existed for some of the soil parameters, such as clay content (see Sudduth et al., 2005).
Four different ways of selecting calibration samples were tested: i) according to ECa measurements; ii) according to reflectance from a satellite image applying the same strategy as for the sample location; iii) according to a regular grid; and iv) according to the variation between the NIR spectra. The calibration selection strategies were applied to the three soil sampling strategies as shown in Table 1 (see also Paper III for more details).
Table 1. Different strategies used for sample location and selection of calibration samples
Sample location Calibration sample selection
Regular grid Regular grid
NIR spectra
ECa measurements ECa measurements
NIR spectra
Reflectance from a satellite image Reflectance from a satellite image
NIR spectra
35
a) b)
c) d)
0 200 400100 m
e)
0 200 400100 m
f)
Figure 8. Sample point distribution at Hacksta (a, c, e) and Sjöstorp (b, d, f) using a regular grid (a-b), targeted according to ECa (c-d) (dark grey represents high ECa values) or according to reflectance from a satellite image (e-f) (dark grey represents high reflectance values).
0 200 400100 m
a)
0 200 400100 m
b)
Figure 9. Sample point distribution and ECa measurements (dark grey represents high ECa values) at a) Bränneberg and b) Kärrtorp.

36
Using few calibration samples can lead to unsatisfactory and unreliable calibrations (Shepherd & Walsh, 2002). However, Brown (2007) proposed a way to reduce the number of local samples while obtaining reliable predictions by augmenting a large global soil library with local samples.
In Paper IV, a strategy for augmenting, or spiking, a national soil library (Figure 5) with 25 local calibration samples was studied on the four farms (Figures 8 and 9). The 25 samples were selected based on ECa values according to the targeted sampling strategy described above. In addition to using the complete national dataset, four subsets of 50 samples selected to be as similar to each of the local libraries as possible were also tested (Figure 10) (Paper IV).
a)
PC 1
-0.02 -0.01 0.00 0.01 0.02
PC
2
-0.015
-0.010
-0.005
0.000
0.005
0.010
0.015
NationalReduced national Local b)
PC 1
-0.02 -0.01 0.00 0.01 0.02
PC
2
-0.015
-0.010
-0.005
0.000
0.005
0.010
0.015
c)
PC 1
-0.02 -0.01 0.00 0.01 0.02
PC
2
-0.015
-0.010
-0.005
0.000
0.005
0.010
0.015
d)
PC 1
-0.02 -0.01 0.00 0.01 0.02
PC
2
-0.015
-0.010
-0.005
0.000
0.005
0.010
0.015
Figure 10. Score plots for the two first principal components in a principal component analysis (PCA) for the national dataset, reduced national dataset and 25 projected local samples at a) Bränneberg, b) Hacksta, c) Kärrtorp and d) Sjöstorp.
The soil parameters studied in Papers II-IV are presented with a short
description of analytical methods in Table 2. More details are presented in Papers I-IV.
37
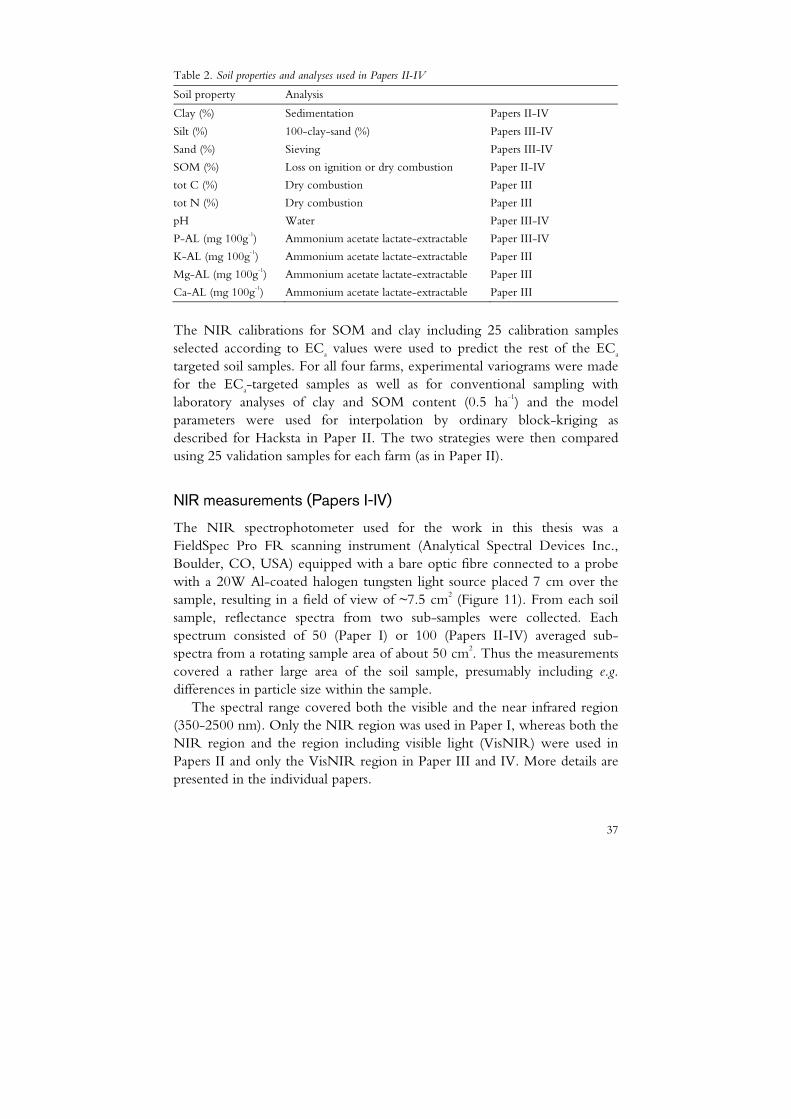
Table 2. Soil properties and analyses used in Papers II-IV
Soil property Analysis
Clay (%) Sedimentation Papers II-IV
Silt (%) 100-clay-sand (%) Papers III-IV
Sand (%) Sieving Papers III-IV
SOM (%) Loss on ignition or dry combustion Paper II-IV
tot C (%) Dry combustion Paper III
tot N (%) Dry combustion Paper III
pH Water Paper III-IV
P-AL (mg 100g-1) Ammonium acetate lactate-extractable Paper III-IV
K-AL (mg 100g-1) Ammonium acetate lactate-extractable Paper III
Mg-AL (mg 100g-1) Ammonium acetate lactate-extractable Paper III
Ca-AL (mg 100g-1) Ammonium acetate lactate-extractable Paper III
The NIR calibrations for SOM and clay including 25 calibration samples selected according to ECa values were used to predict the rest of the ECa targeted soil samples. For all four farms, experimental variograms were made for the ECa-targeted samples as well as for conventional sampling with laboratory analyses of clay and SOM content (0.5 ha-1) and the model parameters were used for interpolation by ordinary block-kriging as described for Hacksta in Paper II. The two strategies were then compared using 25 validation samples for each farm (as in Paper II).
NIR measurements (Papers I-IV)
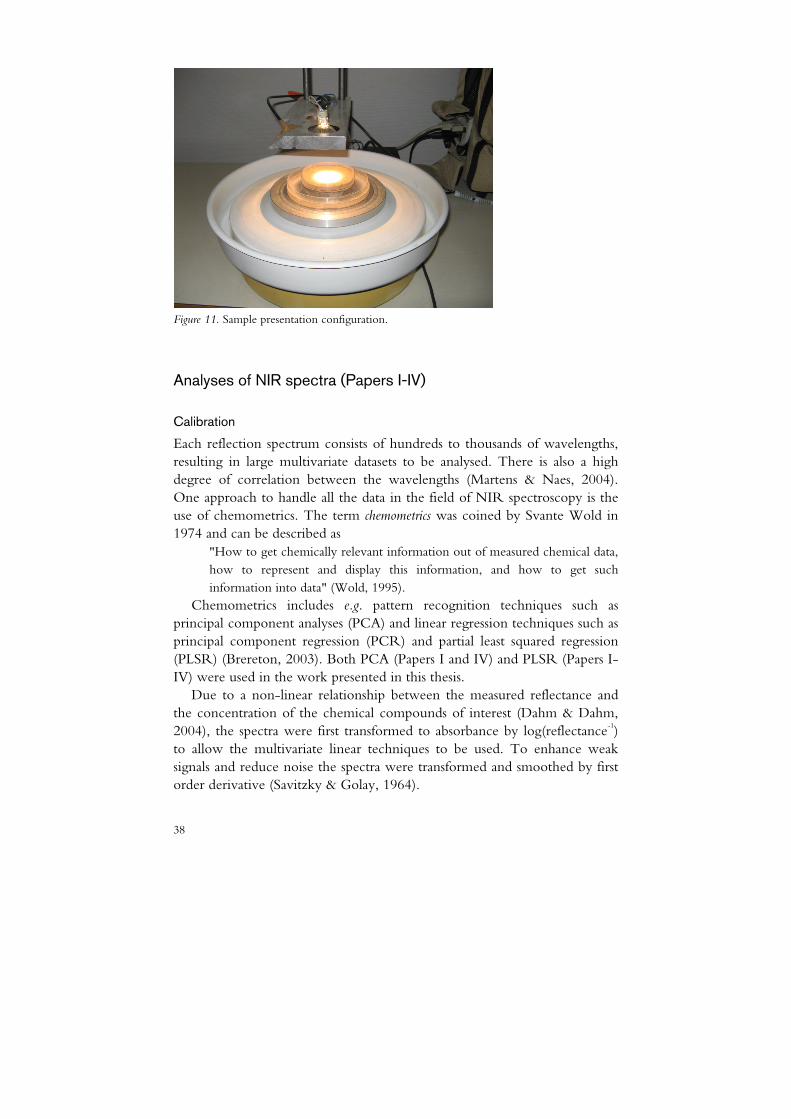
The NIR spectrophotometer used for the work in this thesis was a FieldSpec Pro FR scanning instrument (Analytical Spectral Devices Inc., Boulder, CO, USA) equipped with a bare optic fibre connected to a probe with a 20W Al-coated halogen tungsten light source placed 7 cm over the sample, resulting in a field of view of ~7.5 cm2 (Figure 11). From each soil sample, reflectance spectra from two sub-samples were collected. Each spectrum consisted of 50 (Paper I) or 100 (Papers II-IV) averaged sub-spectra from a rotating sample area of about 50 cm2. Thus the measurements covered a rather large area of the soil sample, presumably including e.g. differences in particle size within the sample.
The spectral range covered both the visible and the near infrared region (350-2500 nm). Only the NIR region was used in Paper I, whereas both the NIR region and the region including visible light (VisNIR) were used in Papers II and only the VisNIR region in Paper III and IV. More details are presented in the individual papers.
38
Figure 11. Sample presentation configuration.
Analyses of NIR spectra (Papers I-IV)
Calibration
Each reflection spectrum consists of hundreds to thousands of wavelengths, resulting in large multivariate datasets to be analysed. There is also a high degree of correlation between the wavelengths (Martens & Naes, 2004). One approach to handle all the data in the field of NIR spectroscopy is the use of chemometrics. The term chemometrics was coined by Svante Wold in 1974 and can be described as
"How to get chemically relevant information out of measured chemical data, how to represent and display this information, and how to get such information into data" (Wold, 1995).
Chemometrics includes e.g. pattern recognition techniques such as principal component analyses (PCA) and linear regression techniques such as principal component regression (PCR) and partial least squared regression (PLSR) (Brereton, 2003). Both PCA (Papers I and IV) and PLSR (Papers I-IV) were used in the work presented in this thesis.
Due to a non-linear relationship between the measured reflectance and the concentration of the chemical compounds of interest (Dahm & Dahm, 2004), the spectra were first transformed to absorbance by log(reflectance-1) to allow the multivariate linear techniques to be used. To enhance weak signals and reduce noise the spectra were transformed and smoothed by first order derivative (Savitzky & Golay, 1964).

39
The calibration technique applied in this thesis was PLSR. In a PLSR, the spectral information is transformed to PLS components similarly to the principal components (PC) in a PCA or PCR, compressing the data and at the same time dealing with the correlations within the NIR spectra. The difference is that whereas the PCs in a PCA or PCR describe the most dominant variation in the NIR spectra, the PLS factors describe the variations in the NIR spectra that are most relevant for prediction of the chemical data (Martens & Naes, 2004).
A potential drawback with using PLSR and all linear regression techniques is the possible nonlinearity of correlations between NIR spectra and the property of interest (Borggaard, 2004). There are other non-chemometric calibration techniques used in the analysis of NIR spectra that can handle nonlinearity, e.g. boosted regression trees (Brown et al., 2006), multivariate adaptive splines (Shepherd & Walsh, 2002) and neural networks (Daniel et al., 2003). However, PLSR has been proposed as a suitable method for small datasets (Martens & Naes, 2004), as was the case in the work presented here.
Validation A
In order to say anything about the usefulness of a calibration to predict unknown samples, proper validation is crucial, preferably using an independent set of validation samples. Without taking appropriate care, randomly withholding a percentage of the samples for validation might not be sufficient if the samples are not independent, as with a few multisampled locations and profiles, and might lead to over-optimistic results (Brown et al., 2005).
In this thesis, validation was performed using independent validation samples in Papers II-IV. However, the plant N uptake study (I) included too few samples to allow for anything other than cross-validation.
Evaluation
A number of different statistical measurements can be used in evaluation of calibration performance, with r2 between predicted and measured values being by far the most common one. Different calculated prediction errors are often presented too, including e.g. standard error of calibration (SEC) or prediction (SEP), root mean squared deviation (RMSD) and root mean squared error (RMSE) of calibration (RMSECV) or of prediction (RMSEP) (e.g. Brown, 2007; Sørensen & Dalsgaard, 2005; Islam et al., 2003).
In this thesis, r2 between predicted and measured values, RMSEP, RMSECV, bias and bias-corrected SEP were used and calculated as:
40
n
yyRMSECVRMSEP
n
iii∑
=
−= 1
2)ˆ(/ (1)
n
yyBias
n
iii∑
=
−= 1
)ˆ( (2)
1
)ˆ(1
2
−
−−=∑=
n
BiasyySEP
n
iii
(3)
where ŷ is the predicted value and y is the measured value for sample i, with n number of samples.
The ratio of performance to deviation (RPD) (standard deviation (s.d.) divided by SEP) (Williams, 1987) is commonly used for placing the prediction error in relation to the variation in the data and is also used in the thesis calculated as s.d. divided by RMSECV or RMSEP.
A handful of attempts have been made to define a good prediction of soil parameters. Malley et al. (2004) proposed a guideline for evaluation defining RPD>4 as excellent, between 3 and 4 as successful, between 2.25 and 3 as moderately successful and between 1.75 and 2.25 as moderately useful. The approach referred to most often in soil systems is that proposed by Chang et al. (2001), which divides prediction results into three classes with i) good predictions as RPD>2.0 and r2>0.8; ii) predictions with potential as RPD ~1.4-2.0 and r2 of 0.50-0.80; and iii) unreliable predictions as RPD<1.4 and r2<0.5. Dunn et al. (2002) defined RPD>2 as excellent, 1.6-2.0 as acceptable and <1.6 as poor.
However useful it may be, it is always important not to look too exclusively at a single measurement. Whether the predictions are sufficient for practical use has to be determined in each situation.
All NIR data analyses and statistics were calculated using Unscrambler v. 9.0-9.7 (CAMO PROCESS AS, Oslo, Norway).
41
NIR for measuring spectrally active soil properties
Soil texture
Since NIR spectra are directly influenced by particle size and surface properties, soil texture can be considered a primary property in relation to NIR (Chang et al., 2001; Ben-Dor & Banin, 1995b). Several regional or national studies have reported prediction results for clay with r2 values between 0.72 and 0.95 and RMSE values between 2 and 9% clay (Waiser et al., 2007; Chang et al., 2005; Sørensen & Dalsgaard, 2005; Islam et al., 2003; Moron & Cozzolino, 2003; Shepherd & Walsh, 2002; Stenberg et al., 2002; Malley et al., 2000). Prediction errors of about 2% seem to be close to the lower limit of what could be expected even for field-scale predictions (McCarty & Reeves, 2006; van Vuuren et al., 2006; Viscarra Rossel et al., 2006; Paper III). Regardless of scale, the vast majority of earlier studies have been made using at least 100 samples in the calibrations. Compared with these results, clay content was satisfactorily predicted using only 25 calibration samples at two of the farms studied in this thesis, Hacksta and Sjöstorp (Table 3) (Papers II-VI). Although low RMSEP values (about 3.5% clay) were also obtained at Bränneberg and Kärrtorp, r2 and RPD values were not as good. The low variation in clay content on these farms compared with Hacksta and Sjöstorp (Paper IV) could be part of the explanation.
In studies including NIR calibrations for all three textural classes, clay content is usually best predicted, followed by sand and with silt being hardest to predict (McCarty & Reeves, 2006; Viscarra Rossel et al., 2006; Sørensen & Dalsgaard, 2005; Islam et al., 2003; Shepherd & Walsh, 2002; Malley et al., 2000).
42
In the results presented in this thesis using only 25 calibration samples, the predictions for clay and sand were almost equally well predicted on three of the four farms studied, i.e. satisfactorily predicted at Hacksta and Sjöstorp, whereas silt was poorly predicted (Table 3). Part of the explanation for the often superior predictions of clay content reported in the literature could be that in addition to the physical influence of particle size on NIR spectra, clay minerals show intrinsic spectral features caused by overtones and combination vibrations of mainly hydroxyl groups and water close to 1400, 1900 and 2100-2400 nm (Hunt et al., 1973; Hunt & Salisbury, 1970), whereas the dominant minerals in the sand fraction, quartz and feldspars, are nearly spectrally featureless (Hunt et al., 1973). At Sjöstorp there was a strong negative correlation between sand and clay (r2 = 0.90) so it could be assumed that more or less the same features were used in the NIR calibrations for sand and clay. This was further supported by the equally good predictions using clay as the only predictor for sand compared with NIR calibrations (Paper III). However, this could not be the main explanation for the prediction results at Hacksta and Kärrtorp. The poor results for silt presented in Table 3 could partly be due to the fact that silt was not measured directly but rather as a difference, as errors in the reference methods are cumulative. It could also to some extent be explained by differences in the variation (Papers III-IV).
SOM and total N
Soil organic matter influences most soil biological, chemical and physical properties, e.g. nutrient availability, water-holding capacity and aggregation stability. It can be directly related to absorption in NIR spectra through a number of functional groups, e.g. carboxyl, hydroxyl and amine groups (Ben-Dor & Banin, 1995b). Organic carbon or SOM are two of the soil properties most frequently analysed with NIR spectroscopy (e.g. Christy, 2008; Gomez et al., 2008; Islam et al., 2003; Shepherd & Walsh, 2002; Chang et al., 2001; Reeves et al., 1999; Ben-Dor & Banin, 1995b; Sudduth & Hummel, 1991).
Several authors have pointed out a need for areas with homogeneous soil types for satisfactory predictions of SOM content (Sørensen & Dalsgaard, 2005; Udelhoven et al., 2003; Reeves et al., 1999; Ben-Dor & Banin, 1995b). Another factor that has been suggested is a change in quality due to decomposition stages with increasing amounts of SOM content (Ben-Dor & Banin, 1995b).

43
In this study using 25 calibration samples, SOM content was the best predicted soil property for three of the four farms studied (Table 3), with Sjöstorp as the exception. Considerable improvements in prediction results at Sjöstorp using 94 calibration samples indicated that 25 samples might have been too few to predict SOM in the two-part farm (Paper III). Another complicating factor could have been that the Sjöstorp fields had parts with quite low clay content (Paper III). Stenberg et al. (2002) and Sørensen & Dalsgaard (2005) found that the calibrations for SOM gave better predictions for soils with a high clay content. The Kärrtorp fields also had parts with a lower clay content but no particularly sandy parts.
Because of the often high correlation between soil C and N, it is difficult to state whether total N is independently predicted using NIR or predicted due to the correlation with C. In a study using artificially mixed contents of organic and inorganic C and total N contents in soils, Chang & Laird (2002) reported that even though it was difficult to assign specific absorption bands for organic functional groups containing N, their results indicated that organic C, inorganic C and total N could be independently predicted. Fystro (2002) reported improved predictive capacity for total N using VisNIR compared with organic C as the predictor, but no improvement at all using loss on ignition as the sole predictor.
In this thesis, NIR calibrations for total N were only made at Hacksta and Sjöstorp (Paper III) and the predictions were slightly less successful than for SOM (Table 3). Total N was highly correlated to SOM (r2 about 0.80) at both farms and there was no improvement when using NIR calibrations compared with simply using SOM as the sole predictor (Paper III). This indicates that at least in these NIR calibrations, similar information was used to predict both SOM and total N. Similar to the predictions for SOM, using more calibration samples improved prediction results, especially at Sjöstorp, whereas using only 25 calibration samples resulted in fairly good predictions at Hacksta (Paper III).
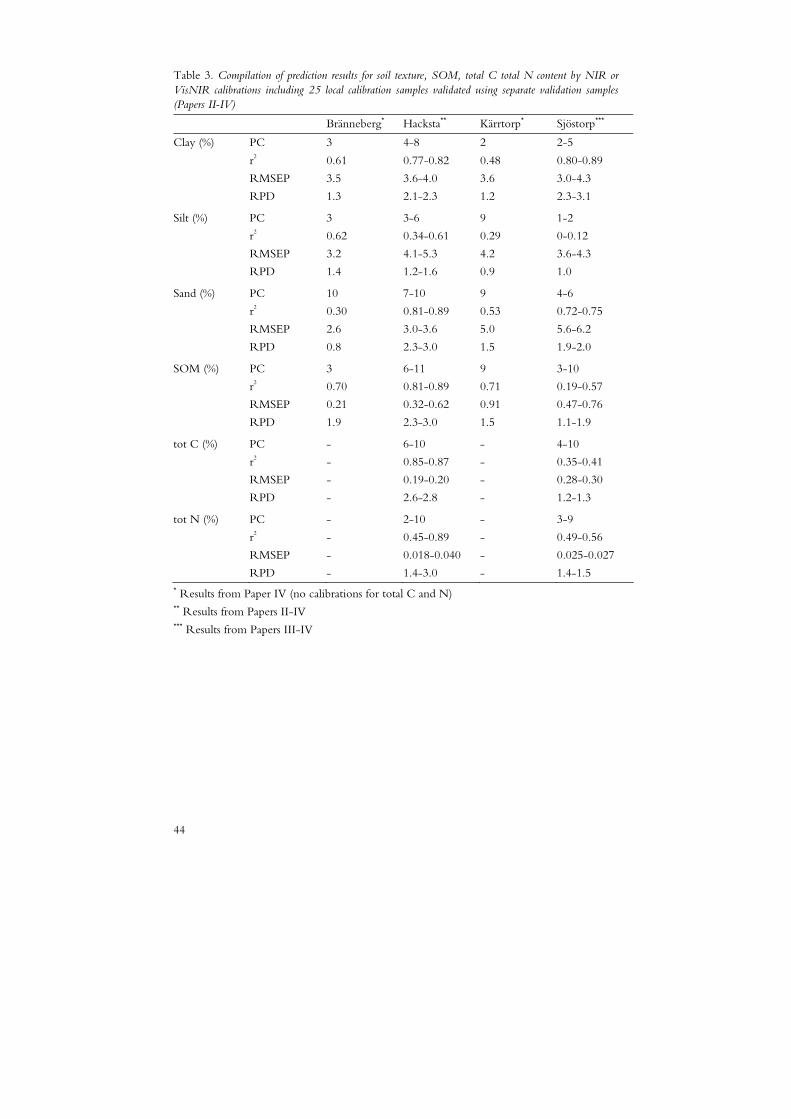
44
Table 3. Compilation of prediction results for soil texture, SOM, total C total N content by NIR or VisNIR calibrations including 25 local calibration samples validated using separate validation samples (Papers II-IV)
Bränneberg* Hacksta** Kärrtorp* Sjöstorp***
Clay (%) PC 3 4-8 2 2-5
r2 0.61 0.77-0.82 0.48 0.80-0.89
RMSEP 3.5 3.6-4.0 3.6 3.0-4.3
RPD 1.3 2.1-2.3 1.2 2.3-3.1
Silt (%) PC 3 3-6 9 1-2
r2 0.62 0.34-0.61 0.29 0-0.12
RMSEP 3.2 4.1-5.3 4.2 3.6-4.3
RPD 1.4 1.2-1.6 0.9 1.0
Sand (%) PC 10 7-10 9 4-6
r2 0.30 0.81-0.89 0.53 0.72-0.75
RMSEP 2.6 3.0-3.6 5.0 5.6-6.2
RPD 0.8 2.3-3.0 1.5 1.9-2.0
SOM (%) PC 3 6-11 9 3-10
r2 0.70 0.81-0.89 0.71 0.19-0.57
RMSEP 0.21 0.32-0.62 0.91 0.47-0.76
RPD 1.9 2.3-3.0 1.5 1.1-1.9
tot C (%) PC - 6-10 - 4-10
r2 - 0.85-0.87 - 0.35-0.41
RMSEP - 0.19-0.20 - 0.28-0.30
RPD - 2.6-2.8 - 1.2-1.3
tot N (%) PC - 2-10 - 3-9
r2 - 0.45-0.89 - 0.49-0.56
RMSEP - 0.018-0.040 - 0.025-0.027
RPD - 1.4-3.0 - 1.4-1.5 * Results from Paper IV (no calibrations for total C and N) ** Results from Papers II-IV *** Results from Papers III-IV
45
NIR for measuring spectrally inactive soil properties
As opposed to soil texture and soil organic matter, pH and ionic chemical species such as plant-available nutrients are not considered spectrally active and therefore they can only be predicted by NIR calibrations due to correlations with other soil properties (Chang et al., 2001). Due to the often local nature of these correlations, calibrations over larger areas with varying soil types or transferring calibrations made at one site to another might be difficult (e.g. Chang et al., 2005; Udelhoven et al., 2003; Reeves et al., 1999).
pH A
Calibrations based on 25 samples could not predict pH satisfactorily at any of the four farms except to some extent at Sjöstorp (Table 4). Although a number of studies have reported r2 values between 0.7 and 0.9 with RMSE values of 0.09-0.61 pH units (Zornoza et al., 2008; van Vuuren et al., 2006; Islam et al., 2003; Lee et al., 2003; Moron & Cozzolino, 2002; Shepherd & Walsh, 2002) there are also a number of studies with results similar to those presented here (r2 values of 0.5-0.6, with corresponding RMSE values of 0.18-0.57 pH units) (Christy, 2008; McCarty & Reeves, 2006; Viscarra Rossel et al., 2006; Chang et al., 2001; Malley et al., 2000; Malley et al., 1999). Prediction results presented for Hacksta and Sjöstorp, using 81 and 94 calibration samples respectively, indicate a possibility of farm-scale NIR calibrations for predictions of pH with a sufficient number of samples (Paper III).

46
Table 4. Compilation of prediction results for pH and plant nutrients by NIR or VisNIR calibrations including 25 local calibration samples validated using separate validation samples (Papers III-IV)
Bränneberg* Hacksta** Kärrtorp* Sjöstorp***
pH PC4 3 4-9 7 1-7
R2 0.49 0.28-0.50 0.50 0.48-0.64
RMSEP 0.10 0.19-0.23 0.22 0.28-0.31
RPD 1.3 1.1-1.4 1.4 1.4-1.7
P-AL (mg 100g-1) PC4 8 2-10 7 2-7
R2 0.05 0.36-0.66 0.31 0.31-0.70
RMSEP 1.8 4.1-5.4 3.0 1.3-3.4
RPD 1.0 1.2-1.7 1.2 1.5-4.0
K-AL (mg 100g-1) PC4 - 4-8 - 2-11
R2 - 0.50-0.74 - 0.16-0.49
RMSEP - 2.3-3.2 - 3.8-4.9
RPD - 1.4-2.0 - 1.1-1.4
Mg-AL (mg 100g-1) PC4 - 2-5 - 6-9
R2 - 0.61-0.75 - 0.56-0.72
RMSEP - 6.1-7.3 - 2.7-3.400
RPD - 1.8-2.1 - 1.5-1.9 * Results from Paper IV (no calibrations for K-AL and Mg-AL) ** Results from Papers II-IV *** Results from Papers III-IV
Plant mineral nutrients
Near infrared spectroscopy has been related to different plant nutrients, e.g. P, K and Mg included in this thesis, in a number of studies (see review by Viscarra Rossel et al., 2006). However, due to a variety of different analytical methods resulting in different proportions of the nutrients, it is difficult to compare the results in terms of RMSE values and the results vary. RPD values of around 2 have been reported for all three nutrients included here (Zornoza et al., 2008; van Vuuren et al., 2006; Islam et al., 2003; van Groenigen et al., 2003; Dunn et al., 2002; Chang et al., 2001; Malley et al., 1999) but also less successful predictions with r2 values no better than 0.3 (He et al., 2007; McCarty & Reeves, 2006; Viscarra Rossel et al., 2006; Pirie et al., 2005; van Groenigen et al., 2003).
Prediction results presented in Paper III indicate that farm-scale calibration models for predictions of P-AL, K-AL and Mg-AL could also be feasible with a sufficient number of calibration samples. However the varying results using 25 calibration samples suggest that this might be too
47
few (Table 4). Because of the indirect measurements, differences in management at the different fields e.g. in terms of fertilisation and liming will interfere, making NIR calibrations more difficult.
Soil N mineralisation
Potential N mineralisation
A number of studies on NIR predictions for mineralisable N measured as accumulated mineral N after aerobic or anaerobic incubations have been reported to be promising, with r2 values between 0.7 and 0.8 and RPD values about 2 (Russell, 2003; Fystro, 2002; Ludwig et al., 2002; Chang et al., 2001), although others report poorer results (r2<0.5) (Terhoeven-Urselmans et al., 2008; van Groenigen et al., 2003; Shepherd & Walsh, 2002; Reeves et al., 1999). Chang et al. (2005) presented intermediate results for 400 cross-validated samples (r2 = 0.6, RPD = 1.6) with less accurate results when a small subset of the samples from a different location was used for validation. The same problem was found when predicting biomass C and N in soils from two long-term field experiments in Maryland, USA, using one experimental site to predict the other (Reeves et al., 1999). Terhoeven-Urselmans (2006) reported an r2 of 0.7 but an RPD value of 0.9 (for cross-validation) when predicting mineralisable N in a very diverse sample set including both soil and litter samples and emphasised the need for large sample sets with sufficient diversity when predicting biological characteristics.
At least for soils with low C content (i.e. most arable soils compared with the organic layers in forest soils), correlations between the predicted biological constituents and total or organic C and N content are likely to explain a large part of the variation in the NIR predictions (Reeves et al., 2006; Russell, 2003; Fystro, 2002; Chang et al., 2001; Reeves et al., 1999). Nevertheless, the inability of total or organic C and N content to explain all variation in the NIR predictions of different soil biological constituents (Reeves et al., 2006; Fystro, 2002; Reeves et al., 1999) suggests that NIR can be used for predictions of SOM quality as well as quantity.
Actual N mineralisation
For practical applications, the possibility to estimate actual rather than potential N mineralisation is favourable. However, the number of unpredictable factors influencing the mineralisation, other than the soil and its constituents, such as weather, make this very difficult (Delin & Lindén,
48
2002). Nitrogen uptake by a crop is an indirect measurement of the N mineralisation that can be interpreted relatively directly for practical management. Near infrared spectroscopy has been used to predict N uptake in glasshouse pot experiments with good results (cross-validated r2 of about 0.8) (Russell et al., 2002; Wagner et al., 2001).
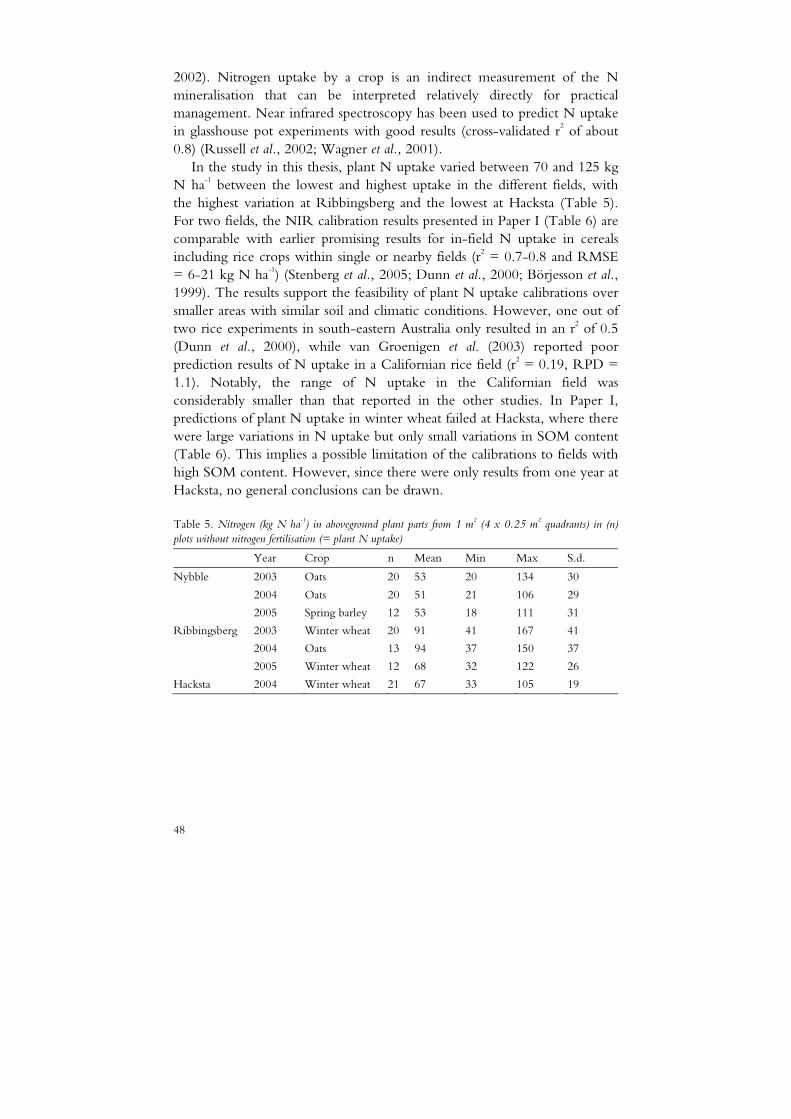
In the study in this thesis, plant N uptake varied between 70 and 125 kg N ha-1 between the lowest and highest uptake in the different fields, with the highest variation at Ribbingsberg and the lowest at Hacksta (Table 5). For two fields, the NIR calibration results presented in Paper I (Table 6) are comparable with earlier promising results for in-field N uptake in cereals including rice crops within single or nearby fields (r2 = 0.7-0.8 and RMSE = 6-21 kg N ha-1) (Stenberg et al., 2005; Dunn et al., 2000; Börjesson et al., 1999). The results support the feasibility of plant N uptake calibrations over smaller areas with similar soil and climatic conditions. However, one out of two rice experiments in south-eastern Australia only resulted in an r2 of 0.5 (Dunn et al., 2000), while van Groenigen et al. (2003) reported poor prediction results of N uptake in a Californian rice field (r2 = 0.19, RPD = 1.1). Notably, the range of N uptake in the Californian field was considerably smaller than that reported in the other studies. In Paper I, predictions of plant N uptake in winter wheat failed at Hacksta, where there were large variations in N uptake but only small variations in SOM content (Table 6). This implies a possible limitation of the calibrations to fields with high SOM content. However, since there were only results from one year at Hacksta, no general conclusions can be drawn.
Table 5. Nitrogen (kg N ha-1) in aboveground plant parts from 1 m2 (4 x 0.25 m2 quadrants) in (n) plots without nitrogen fertilisation (= plant N uptake)
Year Crop n Mean Min Max S.d.
Nybble 2003 Oats 20 53 20 134 30
2004 Oats 20 51 21 106 29
2005 Spring barley 12 53 18 111 31
Ribbingsberg 2003 Winter wheat 20 91 41 167 41
2004 Oats 13 94 37 150 37
2005 Winter wheat 12 68 32 122 26
Hacksta 2004 Winter wheat 21 67 33 105 19

49
Table 6. Correlation between measured and estimated plant N uptake through cross-validated calibration models using i) NIR-spectra, ii) SOM and clay content or iii) NIR-spectra, SOM and clay content. Calibrations for separate years and calibrations including all three years together are shown
NIR SOM and clay NIR + SOM and clay
n PC r2 RMSECV RPD r2 RMSECV RPD PC r2 RMSECV RPD
Nybble 2003 20 3 0.85 11 2.6 0.69 16 1.8 2 0.87 11 2.9
2004 20 3 0.75 14 2.1 0.81 12 2.3 1 0.81 12 2.3
2005 12 2 0.83 12 2.4 0.79 14 2.3 1 0.64 18 1.7
2003-2005 52 1 0.79 13 2.2 0.77 14 2.1 1 0.81 13 2.3
Ribbingsberg
2003 20 2 0.26 36 1.1 0.36 33 1.3 1 0.35 33 1.3
2004 13 2 0.81 16 2.4 0.77 17 2.2 2 0.81 16 2.3
2005 12 6 0.79 12 2.3 0.54 18 1.5 2 0.72 13 1.9
2004-2005 25 7 0.81 15 2.3 0.64 20 1.7 1 0.63 20 1.7
Hacksta 2004* 20 6 0.16 17 1.1 0 - - - 0 - -
n = number of plots without nitrogen fertilisation included in the model PC = number of PLS components used in the calibration models. * The calibration models using SOM and clay and NIR+ SOM and clay resulted in r2 values of 0, which is why no values are presented for RMSECV, RPD and PC.
Although Stenberg et al. (2005) predicted N uptake in one field with a calibration model created from a nearby field with an r2 of 0.6 and an RPD of 2.5, building reliable prediction models for N uptake over larger areas has hitherto proven to be more difficult (paper I; Russell et al., 2002; Paper I). However, in the study by Fox et al. (1993), 50 of the 95 sites had received farmyard manure in the previous year and 25 were first year after legumes. Application of pig slurry in the autumn 2002 at Ribbingsberg is the most likely explanation for the poor results in 2003, possibly masking the variation in soil mineralisation (Table 6).
Similar to the studies on other biological characteristics, NIR predictions were able to explain more of the variation in N uptake compared with using organic C content as predictor (Stenberg et al., 2005; Börjesson et al., 1999). The results in Paper I indicate that the additional predictive capacity of NIR could be related to soil texture. This was shown by the equally good results using NIR spectra or SOM and clay content as predictors and by the lack of improvement when the two methods were combined. This was further supported by the poor results at Hacksta, where the variation in SOM and clay content failed to explain plant N uptake and the same poor results were found for the NIR-based calibrations.

50

51
Calibrations at different scales
The advantage of using near infrared spectroscopy to increase sample point density in farm soil mapping relies on the number of conventional laboratory analyses for the calibrations being kept to a minimum. Large national, regional or global calibrations would be favourable in that respect, but for assessing within-field variation, smaller or more similar areas have resulted in better predictions for a number of soil properties (Sankey et al., 2008; Paper IV). However, the majority of the field-scale NIR calibrations include too many calibration samples to be applicable in practice (e.g. He et al., 2007; McCarty & Reeves, 2006; Viscarra Rossel et al., 2006).
The results presented in Papers I-III show the potential for building reliable NIR calibration models using very few calibration samples, particularly for clay and SOM content. Nevertheless, including more calibration samples improved the prediction results (Paper III).
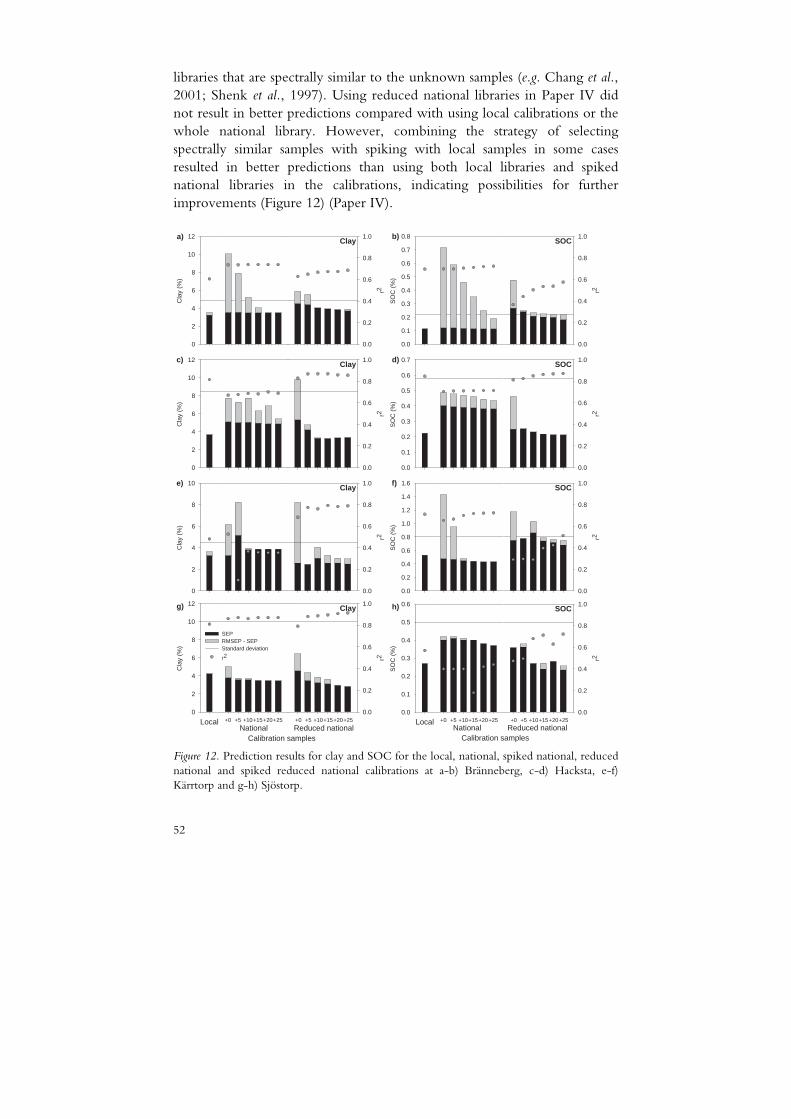
Improved prediction results compared with using a national or global soil library can be achieved by spiking the large library with local samples (Sankey et al., 2008; Brown, 2007; Paper IV). As demonstrated in Paper IV and Figure 12, the improvement is often to a large extent a reduction in bias (see also Brown, 2007; Reeves et al., 1999). Brown (2007) and Sankey et al. (2008) presented better predictions using a spiked global library compared with using local libraries at the majority of their study sites, whereas using the local library (25 samples) often resulted in the lowest RMSEP values in the study presented in Paper IV. These differences may partly be explained by the different scales in the three studies, where the local samples may have been too few to capture the potential variation in the larger and thereby possibly more heterogeneous areas in the studies by Sankey et al. (2008) and Brown (2007).
Another approach to improve calibrations using large soil libraries is using tailor-made calibrations, by selecting calibration samples from these large soil
52
libraries that are spectrally similar to the unknown samples (e.g. Chang et al., 2001; Shenk et al., 1997). Using reduced national libraries in Paper IV did not result in better predictions compared with using local calibrations or the whole national library. However, combining the strategy of selecting spectrally similar samples with spiking with local samples in some cases resulted in better predictions than using both local libraries and spiked national libraries in the calibrations, indicating possibilities for further improvements (Figure 12) (Paper IV).
Cla
y (%
)
0
2
4
6
8
10
12Clay
r2
0.0
0.2
0.4
0.6
0.8
1.0a)
SO
C (
%)
0.0
0.1
0.2
0.3
0.4
0.5
0.6
0.7
0.8SOC
r2
0.0
0.2
0.4
0.6
0.8
1.0b)
Cla
y (%
)
0
2
4
6
8
10
12Clay
r2
0.0
0.2
0.4
0.6
0.8
1.0c)
SO
C (
%)
0.0
0.1
0.2
0.3
0.4
0.5
0.6
0.7SOC
r2
0.0
0.2
0.4
0.6
0.8
1.0d)
Cla
y (%
)
0
2
4
6
8
10Clay
r2
0.0
0.2
0.4
0.6
0.8
1.0e)
SO
C (
%)
0.0
0.2
0.4
0.6
0.8
1.0
1.2
1.4
1.6SOC
r20.0
0.2
0.4
0.6
0.8
1.0f)
Local
Cla
y (%
)
0
2
4
6
8
10
12
+0 +5 +10+15+20+25
SEPRMSEP - SEPStandard deviation
r2
Clay
+0 +5 +10 +15 +20 +25
r2
0.0
0.2
0.4
0.6
0.8
1.0
National Reduced nationalCalibration samples
g)
Local
SO
C (
%)
0.0
0.1
0.2
0.3
0.4
0.5
0.6
+0 +5 +10+15+20+25
SOC
+0 +5 +10 +15 +20 +25
r2
0.0
0.2
0.4
0.6
0.8
1.0
National Reduced nationalCalibration samples
h)
Figure 12. Prediction results for clay and SOC for the local, national, spiked national, reduced national and spiked reduced national calibrations at a-b) Bränneberg, c-d) Hacksta, e-f) Kärrtorp and g-h) Sjöstorp.
53
Strategies for dense farm soil mapping
There were only small differences between the sampling strategies and calibration selection methods in Table 1 (Papers II and III). The approach using ECa measurements performed slightly better in Paper II, which is why that method was compared with conventional sampling at all four farms. The approach also has practical advantages, since the calibration samples can be determined before sampling and since ECa measurements already exist as a commercial product.
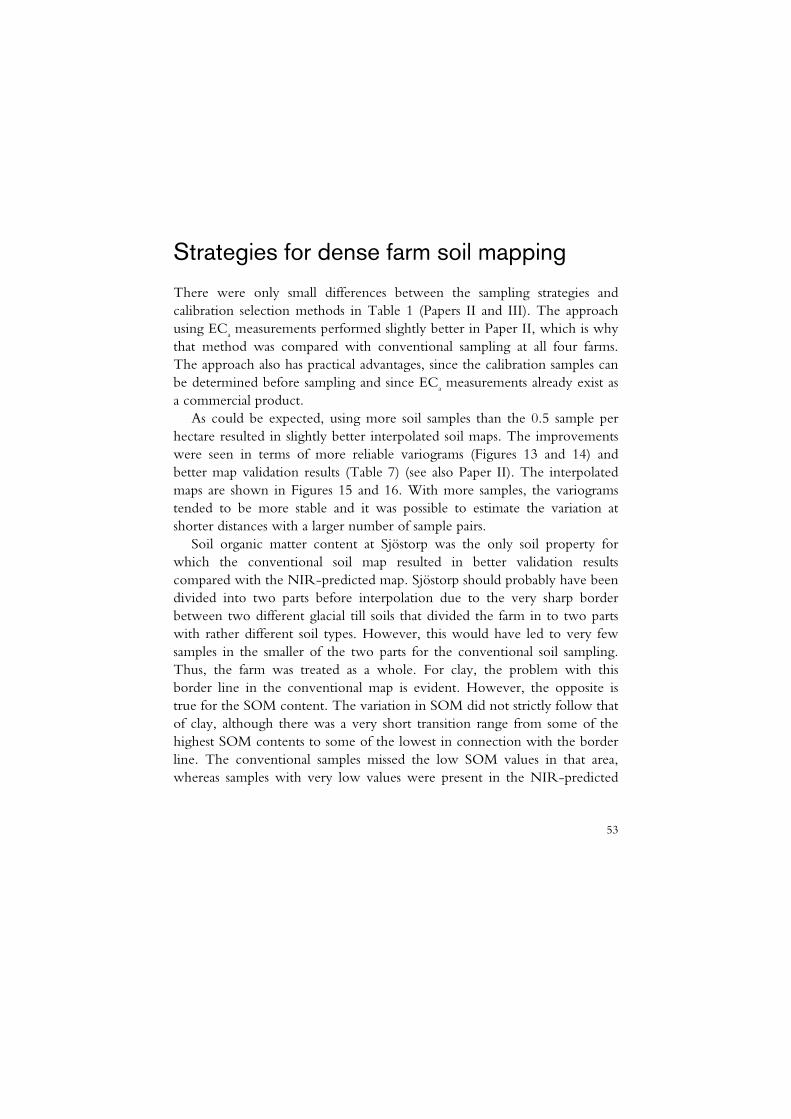
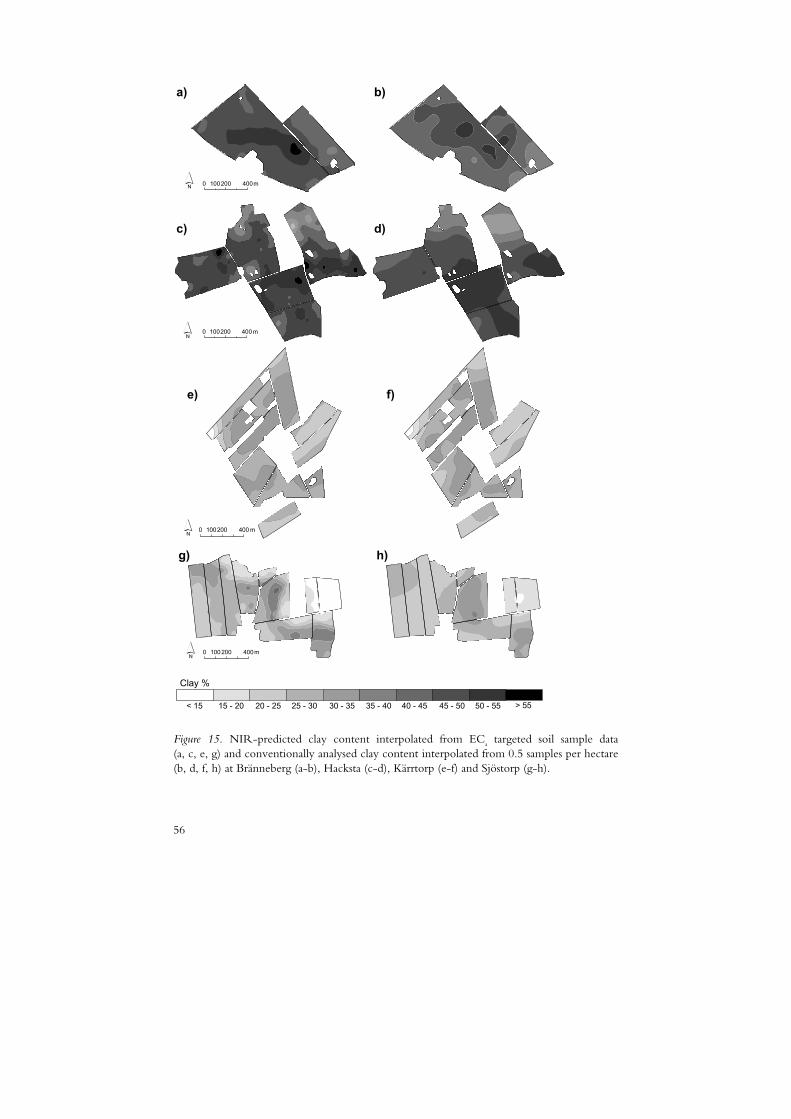
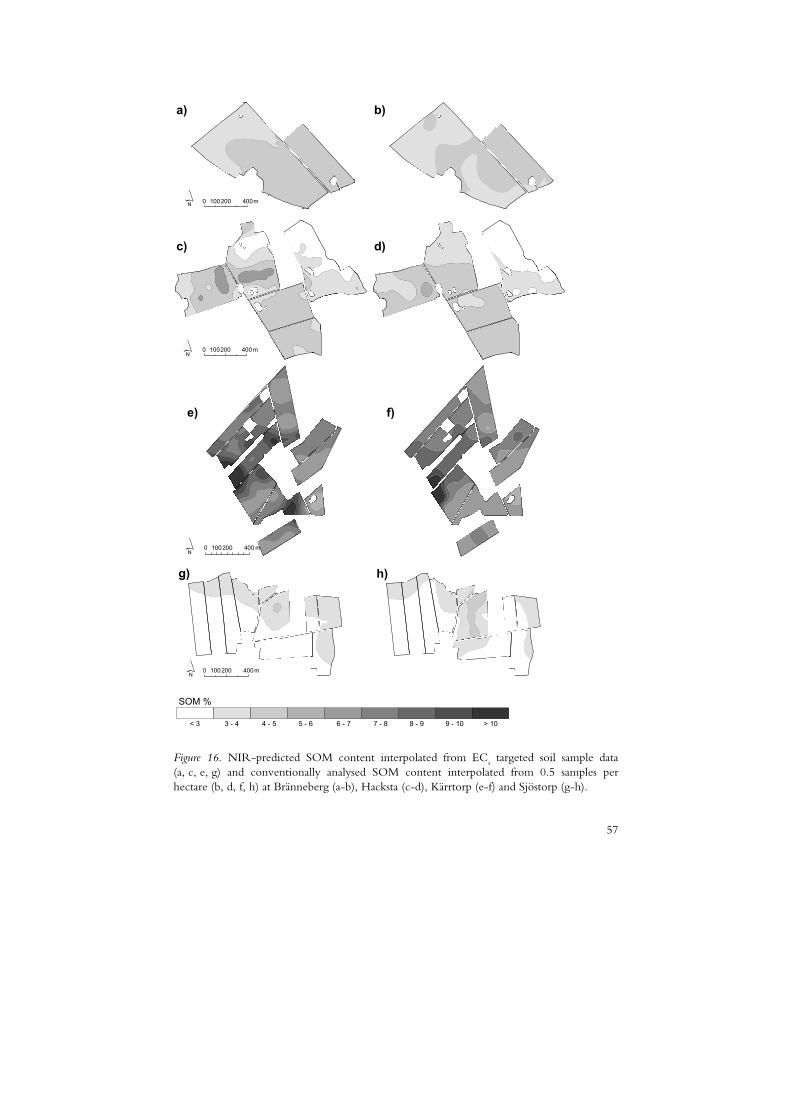
As could be expected, using more soil samples than the 0.5 sample per hectare resulted in slightly better interpolated soil maps. The improvements were seen in terms of more reliable variograms (Figures 13 and 14) and better map validation results (Table 7) (see also Paper II). The interpolated maps are shown in Figures 15 and 16. With more samples, the variograms tended to be more stable and it was possible to estimate the variation at shorter distances with a larger number of sample pairs.
Soil organic matter content at Sjöstorp was the only soil property for which the conventional soil map resulted in better validation results compared with the NIR-predicted map. Sjöstorp should probably have been divided into two parts before interpolation due to the very sharp border between two different glacial till soils that divided the farm in to two parts with rather different soil types. However, this would have led to very few samples in the smaller of the two parts for the conventional soil sampling. Thus, the farm was treated as a whole. For clay, the problem with this border line in the conventional map is evident. However, the opposite is true for the SOM content. The variation in SOM did not strictly follow that of clay, although there was a very short transition range from some of the highest SOM contents to some of the lowest in connection with the border line. The conventional samples missed the low SOM values in that area, whereas samples with very low values were present in the NIR-predicted
54
samples. These low value SOM samples seem to have overshadowed some of the higher SOM values in the interpolation.
At Bränneberg, there were only small differences in validation results between the conventional and the NIR-predicted maps, especially for clay content and in terms of RMSEP values for SOM content. However, no validation r2 values were particularly good at Bränneberg.
At Kärrtorp, neither the NIR-predicted nor the conventional soil samples managed to correctly present the variation in SOM content. This may be explained by small areas with high SOM content that might have been too patchy for the interpolation to deal with.
The results demonstrate the need for denser sampling and the ability to use NIR predictions to produce reliable farm soil maps for clay and SOM content.
The strategy of using ECa measurements for targeting soil samples also makes it possible to identify farms like Sjöstorp, where more than 25 samples might be needed to cover the very different soil types within its boundaries.
0 5
10 15 20 25
0 130 260 390 520 650
Sem
ivar
ianc
e
(a) 0
15
30
0 130 260 390 520 650
Sem
ivar
ianc
e
(b)
0 10 20 30 40 50
0 50 100 150 200 250
Sem
ivar
ianc
e
(c) 0
30
60
90
0 200 400 600 800
Sem
ivar
ianc
e
(d)
0
13
26
0 200 400 600 800
Sem
ivar
ianc
e
(e) 0
9
18
27
0 200 400 600 800
Sem
ivar
ianc
e
(f)
0 20 40 60 80
0 70 140 210 280 350
Sem
ivar
ianc
e
Separation Distance (m) (g)
0 40 80 120 160
0 150 300 450 600
Sem
ivar
ianc
e
Separation Distance (m) (h) Figure 13. Variograms and fitted models for clay content for the NIR-predicted strategy (a, c, e and g) and the conventional sampling strategy (b, d, f and h) at Bränneberg (a-b), Hacksta (c-d), Kärrtorp (e-f) and Sjöstorp (g-h).

55
0.00 0.03 0.05 0.08 0.10
0 130 260 390 520 650
Sem
ivar
ianc
e
(a) 0.00
0.08
0.15
0 130 260 390 520 650
Sem
ivar
ianc
e
(b)
0.00 0.20 0.40 0.60 0.80
0 50 100 150 200 250
Sem
ivar
ianc
e
(c) 0.00
0.15 0.30 0.45 0.60
0 100 200 300 400
Sem
ivar
ianc
e
(d)
0.00
1.70
3.40
5.10
0 110 220 330 440 550
Sem
ivar
ianc
e
(e) 0.00
0.75 1.50 2.25 3.00
0 300 600 900 1200
Sem
ivar
ianc
e
(f)
0.00
0.15
0.30
0.45
0 175 350 525 700
Sem
ivar
ianc
e
Separation Distance (m) (g)
0.00 0.15 0.30 0.45 0.60
0 170 340 510 680 850
Sem
ivar
ianc
e
Separation Distance (m) (h) Figure 14. Variograms and fitted models for SOM content for the NIR-predicted strategy (a, c, e and g) and the conventional sampling strategy (b, d, f and h) at Bränneberg (a-b), Hacksta (c-d), Kärrtorp (e-f) and Sjöstorp (g-h).
Table 7. Validation of soil maps for SOM and clay content derived from NIR predictions using the ECa targeted samples compared with maps derived from conventionally analysed SOM and clay content in a 0.5 sample per hectare grid (conventional sampling density)
Clay SOM
n r2 RMSED r2 RMSED
Bränneberg NIR-predicted 138 0.37 3.7 0.40 1.1
Conventional 34 0.31 3.9 0.26 1.1
Hacksta NIR-predicted 152 0.60 5.6 0.72 0.6
Conventional 50 0.51 5.7 0.36 0.9
Kärrtorp NIR-predicted 155 0.78 2.0 0.29 1.3
Conventional 40 0.56 3.0 0 1.8
Sjöstorp NIR-predicted 128 0.74 5.8 0.59 0.7
Conventional 38 0.51 8.0 0.68 0.6
56
a)
0 200 400100 m
b)
0 200 400100 m
c) d)
0 200 400100 m
e) f)
0 200 400100 m
g) h)
< 15 15 - 20 20 - 25 25 - 30 30 - 35 35 - 40 40 - 45 45 - 50 50 - 55
Clay %
> 55 Figure 15. NIR-predicted clay content interpolated from ECa targeted soil sample data (a, c, e, g) and conventionally analysed clay content interpolated from 0.5 samples per hectare (b, d, f, h) at Bränneberg (a-b), Hacksta (c-d), Kärrtorp (e-f) and Sjöstorp (g-h).
57
a)
0 200 400100 m
b)
0 200 400100 m
c) d)
e)
0 200 400100 m
f)
0 200 400100 m
g) h)
< 3 3 - 4 4 - 5 5 - 6 6 - 7 7 - 8 8 - 9 9 - 10 > 10
SOM %
Figure 16. NIR-predicted SOM content interpolated from ECa targeted soil sample data (a, c, e, g) and conventionally analysed SOM content interpolated from 0.5 samples per hectare (b, d, f, h) at Bränneberg (a-b), Hacksta (c-d), Kärrtorp (e-f) and Sjöstorp (g-h).

58
59
Conclusions and future work
Information about soil texture, SOM content, nutrient status and pH is fundamental for good crop production and for minimising negative effects on the environment. Farmers attain this information through farm soil mapping, on which decisions on fertiliser and lime requirements are based. Although there is a general awareness that there are large variations within fields and farms that might not be captured with conventional sample point density, it is not economically viable to simply increase the number of conventional samples, as this would increase the cost of soil mapping to unacceptable levels. Furthermore, some soil properties such as N mineralisation, which has a great impact on crop N fertiliser requirements, are difficult to estimate and are currently not included in conventional farm soil mapping.
The results presented in this thesis show that NIR spectroscopy can be used in estimating the within-field variation in N mineralisation potential and that farm soil mapping strategies involving NIR measurements can be used to increase sample point density without substantially increasing the cost.
N mineralisation (Paper I)
The results demonstrate the possibility of estimating plant N uptake using NIR measured in the topsoil of fields with a large range in SOM content, from 2-3% up to 19-20%. However, this should not be taken as the minimum SOM content at which the NIR method can be used, since more study sites, including fields with intermediate variations compared with the fields in this study, would be needed to establish such a minimum level.
In earlier studies, NIR spectroscopy has displayed an additional predictive capacity for plant N uptake compared with conventionally analysed SOM

60
content. The results presented in this thesis show that this additional predictive capacity is related to soil texture. The results also indicate possible limitations to fields with a pronounced correlation between plant N uptake and variation in SOM and clay content, but again, more study sites would be needed to confirm such relationships.
Future work
There will still be a need for field- or farm-specific predictions, at least initially. However, with a large variation in SOM content, the pattern in plant N uptake (as observed at Ribbingsberg and Nybble) seems to be fairly stable between years, making N mineralisation zones an interesting approach to pursue.
Investigations with a larger number of study sites, including several intermediate variations in SOM content, could help determine the critical levels of SOM variations for the NIR spectroscopy method. Furthermore, they would provide the scope for building larger calibration models, something which was not possible with the small number of study sites included in this thesis.
A limitation for acceptance of field-specific calibrations in practice is the need for at least one year of zero-N plots for the calibrations, which is labour-intensive. Resolution of this problem needs further investigation.
Farm soil mapping strategies (Papers II-IV)
To fully take advantage of the NIR technique, the number of samples analysed conventionally for the calibrations should be kept to a minimum. However, few calibration samples might lead to unreliable or unsatisfactory calibration results. In these studies, local farm-scale calibrations with very few calibration samples (often considered too few) were studied for dense sampling at low cost.
The results show that satisfactory predictions could be obtained using only 25 calibration samples, representing an area of between 62 and 97 ha, for SOM and clay content and in some cases also for sand. However, for farms with very different soil types, as at Sjöstorp, 25 samples were shown to be too few.
For pH, P-AL, K-AL and Mg-AL within-field calibrations proved possible, but more than 25 samples were needed to produce reliable calibrations, whereas predictions for silt failed regardless of the number of calibration samples.

61
The results also demonstrated that a sampling strategy with about 1.5 samples ha-1, with the majority of the samples predicted by NIR calibrations with 25 calibration samples, resulted in more reliable clay and SOM maps than interpolation from conventionally laboratory-analysed samples taken at 0.5 samples ha-1.
Using a farm-scale calibration including only 25 calibration samples always produced better results than using a national calibration or a spectrally similar subset of the national library to predict within-farm variation. However, spiking both the whole national library and the reduced national subset with 25 local samples improved predictions and decreased RMSEP values, often to the same level as obtained using the local calibrations.
The results also show a possible approach for better predictions using few calibration samples by combining tailor-made soil libraries with a spiking strategy.
Future work
The number of calibration samples needed for different soil variations was not within the scope of these studies but needs further investigation. If 25 samples are too few, as at Sjöstorp, the question is how many more samples are needed. Another question is how many calibration samples are needed to get reliable prediction results for pH or P-AL. A starting point could be to expand the analyses on the data presented here, including calibrations with varying numbers of calibration samples. However, more study sites would have to be included if general recommendations are to be made.
An interesting approach to investigate further is the combination of tailor-made calibration sets from larger soil libraries spiked with local samples, e.g. using different methods for the selection of calibration samples from the large soil library.
Although the focus in this thesis was on farm soil mapping, the results can be used in any situation where dense sampling of e.g. soil texture or SOM content is desirable but where economic considerations impose limitations, for example in monitoring changes in soil carbon content for environmental or soil quality purposes.
Current limits and applications of the method
At this point, the method can be recommended for SOM and clay content. However, the exact number of calibration samples needed could be slightly more than 25.

62
Measurements of ECa before sampling could identify the need for more calibration samples, e.g. if the farm has two or more very different soil types.
The larger the farm, the greater the reduction in conventionally analysed samples. Depending on the costs for NIR analyses and soil sampling, the area needed to benefit economically from the NIR spectroscopy strategy will differ.
The development of calibration models for neighbouring farms with similar soil types using the suggested strategy could increase the overall number of calibration samples and/or making the method more cost-effective.
63
References
Adamchuk, V.I., Ingram, T.J., Sudduth, K.A. & Chung, S.O. (2008). On-the-go mapping of soil mechanical resistance using a linear depth effect model. Transactions of the ASABE 51(6), 1885-1894.
Adamchuk, V.I., Morgan, M.T. & Brouder, S.M. (2006). Development of an on-the-go soil pH mapping method: Analysis of measurement variability. Applied Engineering in Agriculture 22(3), 335-344.
Batten, G.D. (1998). Plant analysis using near infrared reflectance spectroscopy: the potential and the limitations. pp. 697-706.
Ben-Dor, E. & Banin, A. (1995a). Near-Infrared Analysis (NIRA) as a method to simultaneously evaluate spectral featureless constituents in soils. Soil Science 159(4), 259-270.
Ben-Dor, E. & Banin, A. (1995b). Near-Infrared Analysis as a rapid method to simultaneously evaluate several soil properties. Soil Science Society of America Journal 59(2), 364-372.
Borggaard, C. (2004). Neural networks in near-infrared spectroscopy. In: Williams, P., et al. (Eds.) Near-Infrared Technology in the Agricultural and Food Industries. Minnesota: American Association of Cereal Chemists, Inc. pp. 101-107.
Bouma, J. (1999). Precision agriculture: a unique tool to unify production and environmental requirements in agriculture. In: Proceedings of the Fourth International Conference on Precision Agriculture, St. Paul, Minnesota, USA, 19-22 July 1998. Part A and Part B. pp. 595-601.
Brereton, R. (2003). Chemometrics - Data Analysis for the Laboratory and Chemical Plant. Chichester: John Wiley & Sons.
Brown, D.J. (2007). Using a global VNIR soil-spectral library for local soil characterization and landscape modeling in a 2nd-order Uganda watershed. Geoderma 140(4), 444-453.
Brown, D.J., Bricklemyer, R.S. & Miller, P.R. (2005). Validation requirements for diffuse reflectance soil characterization models with a case study of VNIR soil C prediction in Montana. Geoderma 129(3-4), 251-267.
Brown, D.J., Shepherd, K.D., Walsh, M.G., Mays, M.D. & Reinsch, T.G. (2006). Global soil characterization with VNIR diffuse reflectance spectroscopy. Geoderma 132(3-4), 273-290.
64
Burrough, P.A. & McDonnell, R.A. (1998). Principles of Geographical Information Systems. Spatial Information Systems and Geostatistics. New York: Oxford University Press.
Börjesson, T., Stenberg, B., Linden, B. & Jonsson, A. (1999). NIR spectroscopy, mineral nitrogen analysis and soil incubations for the prediction of crop uptake of nitrogen during the growing season. Plant and Soil 214(1-2), 75-83.
Carpenter, S.R., Caraco, N.F., Correll, D.L., Howarth, R.W., Sharpley, A.N. & Smith, V.H. (1998). Nonpoint pollution of surface waters with phosphorus and nitrogen. Ecological Applications 8(3), 559-568.
Chang, C.W. & Laird, D.A. (2002). Near-infrared reflectance spectroscopic analysis of soil C and N. Soil Science 167(2), 110-116.
Chang, C.W., Laird, D.A., Mausbach, M.J. & Hurburgh, C.R. (2001). Near-infrared reflectance spectroscopy-principal components regression analyses of soil properties. Soil Science Society of America Journal 65(2), 480-490.
Chang, G.W., Laird, D.A. & Hurburgh, G.R. (2005). Influence of soil moisture on near-infrared reflectance spectroscopic measurement of soil properties. Soil Science 170(4), 244-255.
Christy, C.D. (2008). Real-time measurement of soil attributes using on-the-go near infrared reflectance spectroscopy. Computers and Electronics in Agriculture 61(1), 10-19.
Clark, R.N., King, T.V.V., Klejwa, M., Swayze, G.A. & Vergo, N. (1990). High spectral resolution reflectance spectroscopy of minerals. Journal of Geophysical Research-Solid Earth and Planets 95(B8), 12653-12680.
Dahm, D.J. & Dahm, K.D. (2004). The physics of near-infrared scattering. In: Williams, P., et al. (Eds.) Near-Infrared Technology in the Agricultural and Food Industries. Minnesota: American Association of Cereal Chemists, Inc. pp. 1-17.
Daniel, K.W., Tripathi, X.K. & Honda, K. (2003). Artificial neural network analysis of laboratory and in situ spectra for the estimation of macronutrients in soils of Lop Buri (Thailand). Australian Journal of Soil Research 41(1), 47-59.
Davies, A.M.C. (2005). An introduction to near infrared spectroscopy. NIR news. Delin, S. & Berglund, K. (2005). Management zones classified with respect to drought and
waterlogging. Precision Agriculture 6(4), 321-340. Delin, S. & Lindén, B. (2002). Relations between net nitrogen mineralization and soil
characteristics within an arable field. Acta Agriculturae Scandinavica Section B-Soil and Plant Science 52(2-3), 78-85.
Delin, S., Linden, B. & Berglund, K. (2005). Yield and protein response to fertilizer nitrogen in different parts of a cereal field: potential of site-specific fertilization. European Journal of Agronomy 22(3), 325-336.
Dunn, B., Beecher, G., Batten, G. & Blakeney, A. (2000). Estimating the uptake of nitrogen by rice crops using near infrared reflectance analysis of soil. In: Davies, A.M.C., et al. (Eds.) Proceedings of Near Infrared Spectroscopy: Proceedings of the 9th International Conference, Verona, Italy pp. 565-568.
Dunn, B.W. & Beecher, H.G. (2007). Using electro-magnetic induction technology to identify sampling sites for soil acidity assessment and to determine spatial variability of soil acidity in rice fields. Australian Journal of Experimental Agriculture 47(2), 208-214.
65
Dunn, B.W., Beecher, H.G., Batten, G.D. & Ciavarella, S. (2002). The potential of near-infrared reflectance spectroscopy for soil analysis - a case study from the Riverine Plain of south-eastern Australia. Australian Journal of Experimental Agriculture 42(5), 607-614.
Egnér, H., Riehm, H. & Domingo, W.R. (1960). Untersuchungen über die chemische Bodenanalyse als Grundlage für die Beurteilung des Nährstoffzustandes der Böden. II. Chemische Extraktionsmethoden zur Phosphor- und Kaliumbestimmung (Investigations on soil chemical analysis as a basis of the evaluation of plant nutrient status of soils II. Chemical extraction methods for phosphorous and potassium determination). The Annals of Royal Agricultural College of Sweden(26), 199-215 (in German).
The European Soil Information System (1999). Proceedings of a Technical Consultation in Rom, Italy 2-3 September 1999 sponsored by FAO and the European Commission. European Soil Bureau and FAO
Fox, R.H., Shenk, J.S., Piekielek, W.P., Westerhaus, M.O., Toth, J.D. & Macneal, K.E. (1993). Comparison of near-infrared spectroscopy and other soil nitrogen availability quick tests for corn. Agronomy Journal 85(5), 1049-1053.
Franck, O. (1943). Vårens gödslingsproblem. Skaraborgs läns hushållnigssällskaps tidning februari-mars, 181-194.
Fredriksson, L. (1961). Die Bodenuntersuchung i Schweden und ihre Auswetung. Landwirtschaftliche Forschung 15 Sonderheft, 74-82.
Fystro, G. (2002). The prediction of C and N content and their potential mineralisation in heterogeneous soil samples using Vis-NIR spectroscopy and comparative methods. Plant and Soil 246(2), 139-149.
Gomez, C., Rossel, R.A.V. & McBratney, A.B. (2008). Soil organic carbon prediction by hyperspectral remote sensing and field vis-NIR spectroscopy: An Australian case study. Geoderma 146(3-4), 403-411.
Gooding, M.J., Davies, W.P. (1997). Wheat Production and Utilization: Systems, Quality and the Environment. New York: CAB International.
Grift, T.E., Tekeste, M.Z. & Raper, R.L. (2005). Acoustic compaction layer detection. Transactions of the ASAE 48(5), 1723-1730.
Hansson, G., Olofsson, S. & Albertsson, B. (2002). Markkartering -jordprovtagning -analyser (in Swedish). The Swedish Board of Agriculture. JO02:6
Havlin, J.L., Beaton, J.D., Tisdale, S.L. & Nelson, W.L. (1999). Soil Fertility and Fertilizers, An Introduction to Nutrient Management. sixth edition. New Jersey: Prentice-Hall, Inc.
He, Y., Huang, M., Garcia, A., Hernandez, A. & Song, H. (2007). Prediction of soil macronutrients content using near-infrared spectroscopy. Computers and Electronics in Agriculture 58(2), 144-153.
Hindle, P.H. (1997). Towards 2000 - The past, present and future of on-line NIR sensing. Process Control and Quality 9(4), 105-115.
Hopkins, W.G. (1995). Introduction to Plant Physiology. New York: John Wiley & sons, inc. Huang, J.F., Chen, D. & Cosh, M.H. (2009). Sub-pixel reflectance unmixing in estimating
vegetation water content and dry biomass of corn and soybeans cropland using normalized difference water index (NDWI) from satellites. International Journal of Remote Sensing 30(8), 2075-2104.
66
Hunt, G.R. (1977). Spectral signatures of particulate minerals in the visible and near infrared. Geophysics 42(3), 501-513.
Hunt, G.R. & Salisbury, J.W. (1970). Visible and near-infrared spectra of minerals and rocks: I Silicate minerals. Modern Geology 1, 283-300.
Hunt, G.R., Salisbury, J.W. & Lenhoff, C.J. (1973). Visible and near infrared spectra of minerals and rocks: VI. Additional silicates. Modern Geology 4, 85-106.
Islam, K., Singh, B. & McBratney, A. (2003). Simultaneous estimation of several soil properties by ultra-violet, visible, and near-infrared reflectance spectroscopy. Australian Journal of Soil Research 41(6), 1101-1114.
Jenny, H. (1946). Arrangement of soil series and types according to functions of soil-forming factors. Soil Science 61(5), 375-391.
Jordbruksverket (2009). Vilkor för miljöersättningen för miljöskyddsåtgärder. (In Swedish) [online] Available from: http://www.sjv.se/amnesomraden/stodtilllandsbygden/allastodformer/miljoersattningarochmiljoinvesteringar/ersattningsformerna/miljoskyddsatgarder/villkorforersattningen.4.b7f2d010faa641c898000984.html [2009-07-31].
Lagacherie, P. (2008). Digital Soil Mapping: A State of the Art. Springer. (Digital Soil Mapping with Limited Data
LandbrugsInfo (2003). Vejledning i udtagning af jordprøver på landbrugsjord. (In Danish) [online]. Available from: http://www.lr.dk/planteavl/diverse/Goed_jordproever.htm [2009-07-31].
Lee, W.S., Sanchez, J.F., Mylavarapu, R.S. & Choe, J.S. (2003). Estimating chemical properties of Florida soils using spectral reflectance. Transactions of the ASAE 46(5), 1443-1453.
Lesch, S.M. (2005). Sensor-directed response surface sampling designs for characterizing spatial variation in soil properties. Computers and Electronics in Agriculture 46(1-3), 153-179.
Lillesand, T.M. & Kiefer, R.W. (2000). Remote Sensing and Image Interpretation. 4th edition. New York: John Wiley & Sons, Inc.
Ludwig, B., Khanna, P.K., Bauhus, J. & Hopmans, P. (2002). Near infrared spectroscopy of forest soils to determine chemical and biological properties related to soil sustainability. Forest Ecology and Management 171(1-2), 121-132.
Lunt, I.A., Hubbard, S.S. & Rubin, Y. (2005). Soil moisture content estimation using ground-penetrating radar reflection data. Journal of Hydrology 307(1-4), 254-269.
Maleki, M.R., Mouazen, A.M., De Ketelaere, B., Ramon, H. & De Baerdemaeker, J. (2008). On-the-go variable-rate phosphorus fertilisation based on a visible and near-infrared soil sensor. Biosystems Engineering 99(1), 35-46.
Malley, D.F., Martin, P.D. & Ben-Dor, E. (2004). Applications in analysis of soils. In: Roberts, C.A., et al. (Eds.) Near-Infrared Spectroscopy in Agriculture. Madison, Wisconsin, USA: ASA, CSSA, SSSA. (the series Agronomy 44). pp. 729-784.
Malley, D.F., Martin, P.D., McClintock, L.M., Yesmin, L., Eilers, R.G. & Haluschak, P. (2000). Feasibility of analysing archived Canadian prairie agricultural soils by near infrared reflectance spectroscopy. In: Davies, A.M.C., et al. (Eds.) Near Infrared Spectroscopy: Proceedings of the 9th International Conference. NIR Publications, Chichester, UK. pp. 579-585.
67
Malley, D.F., Yesmin, L., Wray, D. & Edwards, S. (1999). Application of near-infrared spectroscopy in analysis of soil mineral nutrients. Communications in Soil Science and Plant Analysis 30(7-8), 999-1012.
Markkarteringstjänst (2009). Markkarteringsprovtagning: Utrustning och anvisningar. (In Swedish) [online]. Available from: http//www.markkarteringstjanst.fi. [2009-07-31].
Martens, H. & Naes, T. (2004). Multivariate calibration by data compression. In: Williams, P., et al. (Eds.) Near-Infrared Technology in the Agricultural and Food Industries. Minnesota: American Association of Cereal Chemists, Inc. pp. 59-100.
McBratney, A.B., Odeh, I.O.A., Bishop, T.F.A., Dunbar, M.S. & Shatar, T.M. (2000). An overview of pedometric techniques for use in soil survey. Geoderma 97(3-4), 293-327.
McBratney, A.B. & Pringle, M.J. (1997). Spatial variability in soil - implications for precision agriculture. Precision agriculture '97. Volume I. Spatial variability in soil and crop. Papers presented at the First European Conference on Precision Agriculture, Warwick University, UK, 7-10 September 1997., 3-31.
McBratney, A.B., Santos, M.L.M. & Minasny, B. (2003). On digital soil mapping. Geoderma 117(1-2), 3-52.
McCarty, G.W. & Reeves, J.B. (2006). Comparison of near infrared and mid infrared diffuse reflectance spectroscopy for field-scale measurement of soil fertility parameters. Soil Science 171(2), 94-102.
Miller, C.E. (2004). Chemical principles of near-infrared technology. In: Williams, P., et al. (Eds.) Near-Infrared Technology in the Agricultural and Food Industries. Minnesota: American Association of Cereal Chemists, Inc. pp. 19-37.
Minasny, B. & McBratney, A.B. (2008). Regression rules as a tool for predicting soil properties from infrared reflectance spectroscopy. Chemometrics and Intelligent Laboratory Systems 94(1), 72-79.
Minasny, B., McBratney, A.B. & Walvoort, D.J.J. (2007). The variance quadtree algorithm: Use for spatial sampling design. Computers & Geosciences 33(3), 383-392.
Moron, A. & Cozzolino, D. (2002). Application of near infrared reflectance spectroscopy for the analysis of organic C, total N and pH in soils of Uruguay. Journal of Near Infrared Spectroscopy 10(3), 215-221.
Moron, A. & Cozzolino, D. (2003). Exploring the use of near infrared reflectance spectroscopy to study physical properties and microelements in soils. Journal of Near Infrared Spectroscopy 11(2), 145-154.
Olfs, H.W., Blankenau, K., Brentrup, F., Jasper, J., Link, A. & Lammel, J. (2005). Soil- and plant-based nitrogen-fertilizer recommendations in arable farming. Journal of Plant Nutrition and Soil Science-Zeitschrift für Pflanzenernährung und Bodenkunde 168(4), 414-+.
Oliver, M.A., Frogbrook, Z., Webster, R. & Dawson, C.J. (1997). A rational strategy for determining the number of cores for bulked sampling of soil. In: Precision agriculture '97. Volume I. Spatial variability in soil and crop. Papers presented at the First European Conference on Precision Agriculture, Warwick University, UK, 7-10 September 1997. Oxford UK: Bios Scientific Publishers Ltd. pp. 155-162.
Olsson, D. & Söderström, M. (2003). An automated method to locate optimal soil sampling sites using ancillary data. In: Werner, A., et al. (Eds.) Proceedings of Poster at the 4th
68
European Conference on Precision Agriculture, in the program book of the joint conference of ECPA - ECPLF, Berlin pp. 649.
Pedometric Commission, I. (2009). Website [online] Available from: http://www.pedometrics.org/pm/?page_id=26 [2009-07-31]
Pirie, A., Singh, B. & Islam, K. (2005). Ultra-violet, visible, near-infrared, and mid-infrared diffuse reflectance spectroscopic techniques to predict several soil properties. Australian Journal of Soil Research 43(6), 713-721.
Preface (1994). Geoderma 62 Reeves, J.B., Follett, R.F., McCarty, G.W. & Kimble, J.M. (2006). Can near or mid-
infrared diffuse reflectance spectroscopy be used to determine soil carbon pools? Communications in Soil Science and Plant Analysis 37(15-20), 2307-2325.
Reeves, J.B., McCarty, G.W. & Meisinger, J.J. (1999). Near infrared reflectance spectroscopy for the analysis of agricultural soils. Journal of Near Infrared Spectroscopy 7(3), 179-193.
Russell, C.A. (2003). Sample preparation and prediction of soil organic matter properties by near infra-red reflectance spectroscopy. Communications in Soil Science and Plant Analysis 34(11-12), 1557-1572.
Russell, C.A., Angus, J.F., Batten, G.D., Dunn, B.W. & Williams, R.L. (2002). The potential of NIR spectroscopy to predict nitrogen mineralization in rice soils. Plant and Soil 247(2), 243-252.
Sankey, J.B., Brown, D.J., Bernard, M.L. & Lawrence, R.L. (2008). Comparing local vs. global visible and near-infrared (VisNIR) diffuse reflectance spectroscopy (DRS) calibrations for the prediction of soil clay, organic C and inorganic C. Geoderma 148(2), 149-158.
Savitzky, A. & Golay, M. (1964). Smoothing and differentiation of data by simplified least squares procedures. Analytical Chemistry 36, 1627-1639.
Shenk, J.S., Berzaghi, P. & Westerhaus, M.O. (1997). Investigation of a LOCAL calibration procedure for near infrared instruments. Journal of Near Infrared Spectroscopy 5(4), 223-232.
Shepherd, K.D. & Walsh, M.G. (2002). Development of reflectance spectral libraries for characterization of soil properties. Soil Sci Soc Amer J 66, 988-998.
Sheppard, N., Willis, H.A. & Rigg, J.C. (1985). Names, symbols, definitions and units of quantities in optical spectroscopy. Pure and Applied Chemistry 57(1), 105-120.
Sørensen, L.K. & Dalsgaard, S. (2005). Determination of clay and other soil properties by near infrared spectroscopy. Soil Science Society of America Journal 69(1), 159-167.
Stenberg, B., Jonsson, A. & Borjesson, T. (2005). Use of near infrared reflectance spectroscopy to predict nitrogen uptake by winter wheat within fields with high variability in organic matter. Plant and Soil 269(1-2), 251-258.
Stenberg, B., Jonsson, A. & Börjesson, T. (2002). Near infrared technology for soil analysis with implications for precision agriculture. In: Davies, A., et al. (Eds.) Proceedings of Near Infrared Spectroscopy: Proceedings of the 10th International Conference, Kyongju S. Korea pp. 279-284.
Strahler, A.N. & Strahler, A.H. (1978). Modern Physical Geography. New York: John Wiley and sons.
69
Sudduth, K.A. & Hummel, J.W. (1991). Evaluation of reflectance methods for soil organic-matter sensing. Transactions of the ASAE 34(4), 1900-1909.
Sudduth, K.A., Kitchen, N.R., Wiebold, W.J., Batchelor, W.D., Bollero, G.A., Bullock, D.G., Clay, D.E., Palm, H.L., Pierce, F.J., Schuler, R.T. & Thelen, K.D. (2005). Relating apparent electrical conductivity to soil properties across the north-central USA. Computers and Electronics in Agriculture 46(1-3), 263-283.
Sylvia, D.M., Fuhrmann, J.J., Hartel, P.G. & Zuberer, D.A. (Eds.) (1998). Principles and Applications of Soil Microbiology. New Jersey: Prentice Hall.
Terhoeven-Urselmans, T., Michel, K., Helfrich, M., Flessa, H. & Ludwig, B. (2006). Near-infrared spectroscopy can predict the composition of organic matter in soil and litter. Journal of Plant Nutrition and Soil Science-Zeitschrift für Pflanzenernährung und Bodenkunde 169(2), 168-174.
Terhoeven-Urselmans, T., Schmidt, H., Joergensen, R.G. & Ludwig, B. (2008). Usefulness of near-infrared spectroscopy to determine biological and chemical soil properties: Importance of sample pre-treatment. Soil Biology & Biochemistry 40(5), 1178-1188.
Udelhoven, T., Emmerling, C. & Jarmer, T. (2003). Quantitative analysis of soil chemical properties with diffuse reflectance spectrometry and partial least-square regression: A feasibility study. Plant and Soil 251(2), 319-329.
van Groenigen, J.W., Mutters, C.S., Horwath, W.R. & van Kessel, C. (2003). NIR and DRIFT-MIR spectrometry of soils for predicting soil and crop parameters in a flooded field. Plant and Soil 250(1), 155-165.
van Vuuren, J.A.J., Meyer, J.H. & Claassens, A.S. (2006). Potential use of near infrared reflectance monitoring in precision agriculture. Communications in Soil Science and Plant Analysis 37(15-20), 2171-2184.
Viscarra Rossel, R.A., Cattle, S.R., Ortega, A. & Fouad, Y. (2009). In situ measurements of soil colour, mineral composition and clay content by vis-NIR spectroscopy. Geoderma 150(3/4), 253-266.
Viscarra Rossel, R.A., Walvoort, D.J.J., McBratney, A.B., Janik, L.J. & Skjemstad, J.O. (2006). Visible, near infrared, mid infrared or combined diffuse reflectance spectroscopy for simultaneous assessment of various soil properties. Geoderma 131(1-2), 59-75.
Wagner, B., Gutser, R. & Schmidhalter, U. (2001). NIR-spectroscopy to estimate soil nitrogen supply. In: Horst, W.J. (Ed.) Plant Nutrition - Food Security and Sustainability of Agro-Ecosystems. the Netherlands: Kluwer Academic Publishers. pp. 752-753.
Waiser, T.H., Morgan, C.L.S., Brown, D.J. & Hallmark, C.T. (2007). In situ characterization of soil clay content with visible near-infrared diffuse reflectance spectroscopy. Soil Science Society of America Journal 71(2), 389-396.Webster, R. & Oliver, M.A. (1992). Sample adequately to estimate variograms of soil properties. Journal of Soil Science 43(1), 177-192.
Williams, P.C. (1987). Variables affecting near-infrared reflectance spectroscopic analysis. In: Williams, P., et al. (Eds.) Near-Infrared Technology in the Agricultural and Food Industries. St. Paul, MN: Am. Assoc. Cereal Chem. pp. 143-167.
Wold, S. (1995). Chemometrics; What do we mean with it, and what do we want from it? Chemometrics and Intelligent Laboratory Systems 30(1), 109-115.

70
Working Group on Digital Soil Mapping, I. (2009). Web site. [online] Available from: http://www. digitalsoilmapping.org [2009-07-31].
Zornoza, R., Guerrero, C., Mataix-Solera, J., Scow, K.M., Arcenegui, V. & Mataix-Beneyto, J. (2008). Near infrared spectroscopy for determination of various physical, chemical and biochemical properties in Mediterranean soils. Soil Biology & Biochemistry 40(7), 1923-1930.
71
Acknowledgements
Ett stort tack till alla på SLU i Skara som gjort doktorandtiden till en rolig och positiv erfarenhet! Det är kul att träffa kollegor som jobbar inom så olika ämnesområden bara man går till fikarummet. Ett extra tack till doktoranderna på Hmh för att jag har fått ingå i en lite större doktorandgrupp trots att majoriteten av doktoranderna i markvetenskap sitter i Uppsala. Tack också till alla doktorander och övriga kollegor i Uppsala som gjort att jag har känt mig hemma även på Ultuna.
Tack Börje, Maria, Bosse och Johan för att ni trodde på mig och såg till att det blev ett doktorand projekt!
Tack också till SLF, Jordbruksverket och Sparbanksstiftelsen i Skaraborg och Lidköping för finansiering. Jag har haft förmånen att ha flera handledare som alla varit engagerade i det jag gjort, och det måste väl vara för att kunna jobba närmare mig som de alla numera jobbar i samma forskargrupp…?
Bo Stenberg, tack för att du har varit så positiv och engagerad i det jag jobbat med. Jag har alltid kunna få hjälp och när det varit snålt med tid har du ändå lyckats prioritera mina artiklar. Tack också för möjligheten att vara med på så många konferenser och möten under min doktorandtid. Det har varit ett sant nöje att ha haft dig som huvudhandledare.
Maria Stenberg, tack för att du alltid är så positiv och lyckas se lösningar snarare än problem. Tack för värdefulla kommentarer på avhandlingen och för att du tog dig tid även om "dina" projekt byttes ut mot andra. Dessutom är du en fena på att köra bil i lera!
Anders Jonsson, tack för att jag fick ta över mineraliseringsprojektet. Tack också för viktiga, om än lite jobbiga, kommentarer på avhandlingen, och kan man inte själv hjälpa till att ta jordprov går det ju bra att låna ut frun.

72
Mats Söderström, tack för all hjälp med ArcGIS och geostatestik. Det blev några artiklar till slut, trots många formuleringsrundor. Det har varit nyttigt, ibland lite frustrerande, men mest roligt, att skriva med någon som inte har NIR som sitt huvudintresse.
Börje Lindén, tack för att du introducerade SLU i Skara för mig och såg till att jag hade ett jobb efter agronomstudierna. Tack också för att du invigde mig i den ädla konsten att ta jordprover. Göran Bergkvist, det var väldigt trevligt att ha med dig i handledargruppen även om det nu bara blev under de första åren. Ett jättestort tack alla ni andra i forskargruppen. Johan, Sofia, Christina, Anna, Lena, Lina, Kristin och Bibbi, ni har alla bidragit till att det varit så roligt att gå till jobbet! Tack för alla intressanta, roliga och galna lunch- och fikasamtal och för alla roliga aktiviteter under åren, inte minst matlagning. Tack Sofia för mycket trevligt ressällskap i London och för att jag har fått möjlighet att delta i undervisningen. Tack alla ni som har hjälpt mig med fältarbetet oavsett om det gäller bärande av presenningar, grödklippningar eller diverse jordprovtagningar. Även om några av fältförsöken ingått i projekt som senare byts ut mot andra i själva avhandlingen. Jag har nästan utnyttjat alla i forskargruppen åtminstone en gång: Anna, Christina, Bosse, Börje, Lena, Mats och Sofia. Ett extra stort tack till Cecilia Koch, Tomas Olausson, David Olausson, Ulrika Williamsson och Simon Wetterlind som ryckte in när ingen på jobbet kunde.
Thord Karlsson, tack för hjälpen och för sällskapet med planering och provtagning framförallt på Hacksta och Nybble.
Vlad, tack för all hjälp med provtagningen på Ribbingsberg och Nybble, inte minst all bärhjälp.
Tack, Rolf Tunared, Lisbeth Norberg, Johan Fredriksson och säsongsanställda på Lanna för att ni tagit så väl hand om mina försök.
Tack också till försökspatrullen på HS i Örebro för hjälpen med försöken på Nybble.
Tack alla ni som hjälpte till med jordprovtagningen i markkarteringsprojektet: Ingemar Henningsson, Anita Dellsén, Lisbet Norberg, Jan-Olov Gustavsson, Kristina Gustavsson, Emma Eriksson, Mats och Bosse.

73
Rosa och Allan på växtnäringslabbet, tack för all hjälp med mina jordprover. Det känns tryckt att skicka prov till er och det har alltid varit roligt att titta förbi när jag varit i Uppsala.
Thomas Olsson, tack för att visat intresse och hjälp med våra bökiga analysbeställningar.
Tack alla i POS, Thomas Börjesson, Knud Nissen, Kjell Gustafsson, Bertil Albertsson, CG Pettersson och många fler, för intressanta projekt och diskussioner. Tack vare er har jag fått ett kontaktnät även utanför universitet. Sören Nyman, Mikael Franzén och Jarl Ryberg, tack för att jag fick ockupera era fält it tre år, med allt det extra arbete det inneburit för er. Jag hoppas att ni också har fått någon nytta av all data som samlats in.
Göran Olsson, Lars Ingemarsson och Gösta Karlsson, tack för att jag fick samla in så mycket jordprover från era fält. Så tät markkartering kan inte många skryta med.
Tack Mary McAfee för otroligt snabb hjälp med språkgranskning.
Sist men inte minst, tack min underbara familj och svärfamilj för all uppmuntran och hjälp!
Mamma, pappa och Elisabeth, tack för alla gånger ni har varit barnvakt eller hjälpt till med städning när det varit mycket på jobbet.
Simon, min älskade man, tack för pannkakorna när jag kommit hem sent efter en lång dag i fält och för att du har tagit hand om allting när det varit som mest skrivande på slutet. Tack för allt tålmodigt lyssnande när NIR-kalibreringar tycktes vara det enda som upptog mina tankar och jag behövde prata av mig på kvällarna. Du har varit ett fantastiskt stöd!
Disa and Arvid, mina underbara barn, ert välkomnade när man kommer hem efter en dag på jobbet får alla problem att krympa. Tack för att ni gett mig perspektiv på vad som är viktigt i livet. Ni är mitt allt!