improved amino acid methods using agilent zorbax … for a variety of agilent lc instrumentation and...
TRANSCRIPT
Improved Amino Acid Methods usingAgilent ZORBAX Eclipse Plus C18Columns for a Variety of Agilent LCInstrumentation and Separation Goals
Introduction
The continuous improvement in HPLC columns and instrumentation presents anopportunity to improve HPLC methods. A proven ortho-phthalaldehyde/9-fluorenyl-methyl chloroformate (OPA/FMOC) derivatized amino acid analysis method devel-oped on the HP 1090 Series HPLC Systems, and later updated for the Agilent 1100Series HPLC Systems, has now evolved further taking advantage of the Agilent 1200Series SL and Agilent ZORBAX Eclipse Plus C18 stationary phase columns. [1-5]
Benefits of this protocol over previous iterations include:
• Better retention of the first two eluting amino acids, aspartic and glutamic acid.
• Higher resolution of several closely eluting amino acid pairs depending on the column configuration used.
• Ten column configurations, including three particle sizes and several columnlengths and diameters, allowing the analyst to customize the separation to hisspecifications and constraints (for example, available Agilent HPLC model, desired throughput, or desired resolution).
• A quaternary pump option.
Of course, the previous protocols' benefits are still retained, especially the automatic online OPA/FMOC derivatization.
Authors
John W Henderson Jr and
Anne Brooks
Agilent Technologies, Inc.
2850 Centerville Rd
Wilmington, DE 19808
USA
Application NoteFoods, Pharmaceuticals
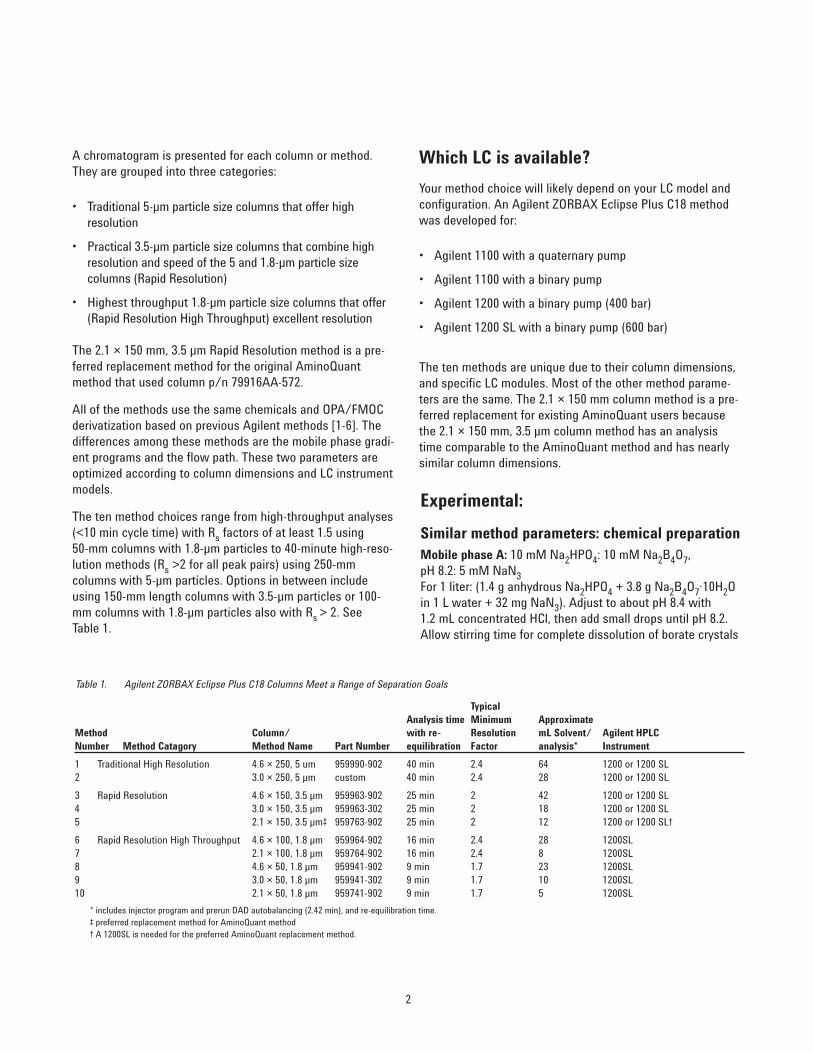
A chromatogram is presented for each column or method.They are grouped into three categories:
• Traditional 5-µm particle size columns that offer high resolution
• Practical 3.5-µm particle size columns that combine highresolution and speed of the 5 and 1.8-µm particle sizecolumns (Rapid Resolution)
• Highest throughput 1.8-µm particle size columns that offer(Rapid Resolution High Throughput) excellent resolution
The 2.1 × 150 mm, 3.5 µm Rapid Resolution method is a pre-ferred replacement method for the original AminoQuantmethod that used column p/n 79916AA-572.
All of the methods use the same chemicals and OPA/FMOCderivatization based on previous Agilent methods [1-6]. Thedifferences among these methods are the mobile phase gradi-ent programs and the flow path. These two parameters areoptimized according to column dimensions and LC instrumentmodels.
The ten method choices range from high-throughput analyses(<10 min cycle time) with Rs factors of at least 1.5 using 50-mm columns with 1.8-µm particles to 40-minute high-reso-lution methods (Rs >2 for all peak pairs) using 250-mmcolumns with 5-µm particles. Options in between includeusing 150-mm length columns with 3.5-µm particles or 100-mm columns with 1.8-µm particles also with Rs > 2. See Table 1.
Which LC is available?
Your method choice will likely depend on your LC model andconfiguration. An Agilent ZORBAX Eclipse Plus C18 methodwas developed for:
• Agilent 1100 with a quaternary pump
• Agilent 1100 with a binary pump
• Agilent 1200 with a binary pump (400 bar)
• Agilent 1200 SL with a binary pump (600 bar)
The ten methods are unique due to their column dimensions,and specific LC modules. Most of the other method parame-ters are the same. The 2.1 × 150 mm column method is a pre-ferred replacement for existing AminoQuant users becausethe 2.1 × 150 mm, 3.5 µm column method has an analysistime comparable to the AminoQuant method and has nearlysimilar column dimensions.
TypicalAnalysis time Minimum Approximate
Method Column/ with re- Resolution mL Solvent/ Agilent HPLCNumber Method Catagory Method Name Part Number equilibration Factor analysis* Instrument
1 Traditional High Resolution 4.6 × 250, 5 um 959990-902 40 min 2.4 64 1200 or 1200 SL2 3.0 × 250, 5 µm custom 40 min 2.4 28 1200 or 1200 SL
3 Rapid Resolution 4.6 × 150, 3.5 µm 959963-902 25 min 2 42 1200 or 1200 SL4 3.0 × 150, 3.5 µm 959963-302 25 min 2 18 1200 or 1200 SL5 2.1 × 150, 3.5 µm‡ 959763-902 25 min 2 12 1200 or 1200 SL†
6 Rapid Resolution High Throughput 4.6 × 100, 1.8 µm 959964-902 16 min 2.4 28 1200SL 7 2.1 × 100, 1.8 µm 959764-902 16 min 2.4 8 1200SL8 4.6 × 50, 1.8 µm 959941-902 9 min 1.7 23 1200SL 9 3.0 × 50, 1.8 µm 959941-302 9 min 1.7 10 1200SL 10 2.1 × 50, 1.8 µm 959741-902 9 min 1.7 5 1200SL
* includes injector program and prerun DAD autobalancing (2.42 min), and re-equilibration time. ‡ preferred replacement method for AminoQuant method † A 1200SL is needed for the preferred AminoQuant replacement method.
Table 1. Agilent ZORBAX Eclipse Plus C18 Columns Meet a Range of Separation Goals
Experimental:
Similar method parameters: chemical preparationMobile phase A: 10 mM Na2HPO4: 10 mM Na2B4O7, pH 8.2: 5 mM NaN3For 1 liter: (1.4 g anhydrous Na2HPO4 + 3.8 g Na2B4O7·10H2Oin 1 L water + 32 mg NaN3). Adjust to about pH 8.4 with 1.2 mL concentrated HCl, then add small drops until pH 8.2.Allow stirring time for complete dissolution of borate crystals
2
3
Extended amino acid (EAA) stock solution
Weigh 59.45 mg asparagine, 59.00 mg hydroxyproline, 65.77 mg glutamine, and 91.95 mg tryptophan into a 25-mLvolumetric flask. Fill halfway with 0.1 N HCL and shake orsonicate until dissolved. Fill to mark with water for a totalconcentration of 18 nmol/µL of each amino acid.
For high-sensitivity EAA stock solution, take 5 mL of thisstandard-sensitivity solution and dilute with 45 mL water (1.8 nmol/µL).
Solutions containing extended standards are unstable atroom temperature. Keep them frozen and discard at first signsof reduced intensity.
Internal standards (ISTD) stock solution
For primary amino acids, weigh 58.58 mg norvaline into a 50-mL volumetric flask. For secondary amino acids, weigh44.54 mg sarcosine into same 50-mL flask. Fill halfway with0.1 N HCl and shake or sonicate until dissolved, then fill tomark with water for a final concentration of 10 nmol eachamino acid/µL (standard sensitivity).
For high-sensitivity ISTD stock solution, take 5 mL of standardsensitivity solution and dilute with 45 mL of water. Store at4°C.
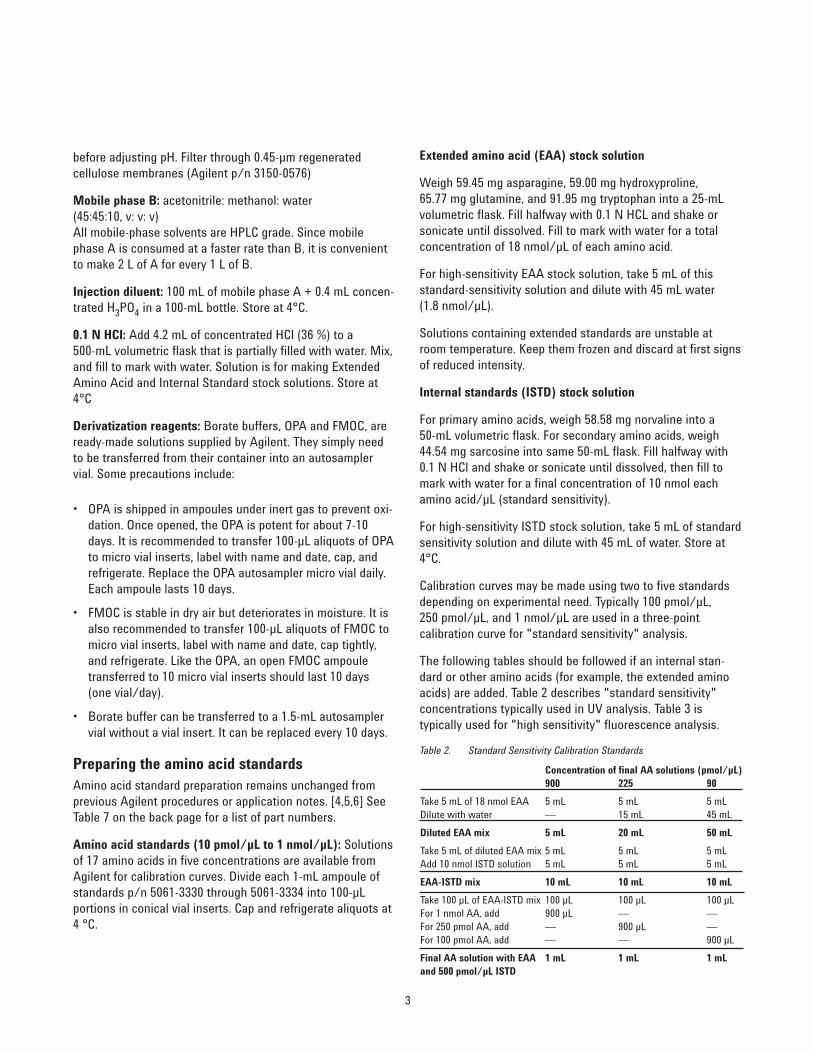
Calibration curves may be made using two to five standardsdepending on experimental need. Typically 100 pmol/µL, 250 pmol/µL, and 1 nmol/µL are used in a three-point calibration curve for "standard sensitivity" analysis.
The following tables should be followed if an internal stan-dard or other amino acids (for example, the extended aminoacids) are added. Table 2 describes "standard sensitivity"concentrations typically used in UV analysis. Table 3 is typically used for "high sensitivity" fluorescence analysis.
Table 2. Standard Sensitivity Calibration Standards
Concentration of final AA solutions (pmol/µL)900 225 90
Take 5 mL of 18 nmol EAA 5 mL 5 mL 5 mLDilute with water — 15 mL 45 mL
Diluted EAA mix 5 mL 20 mL 50 mL
Take 5 mL of diluted EAA mix 5 mL 5 mL 5 mLAdd 10 nmol ISTD solution 5 mL 5 mL 5 mL
EAA-ISTD mix 10 mL 10 mL 10 mL
Take 100 µL of EAA-ISTD mix 100 µL 100 µL 100 µLFor 1 nmol AA, add 900 µL — —For 250 pmol AA, add — 900 µL —For 100 pmol AA, add — — 900 µL
Final AA solution with EAA 1 mL 1 mL 1 mLand 500 pmol/µL ISTD
before adjusting pH. Filter through 0.45-µm regenerated cellulose membranes (Agilent p/n 3150-0576)
Mobile phase B: acetonitrile: methanol: water (45:45:10, v: v: v)All mobile-phase solvents are HPLC grade. Since mobilephase A is consumed at a faster rate than B, it is convenientto make 2 L of A for every 1 L of B.
Injection diluent: 100 mL of mobile phase A + 0.4 mL concen-trated H3PO4 in a 100-mL bottle. Store at 4°C.
0.1 N HCl: Add 4.2 mL of concentrated HCl (36 %) to a 500-mL volumetric flask that is partially filled with water. Mix,and fill to mark with water. Solution is for making ExtendedAmino Acid and Internal Standard stock solutions. Store at4°C
Derivatization reagents: Borate buffers, OPA and FMOC, areready-made solutions supplied by Agilent. They simply needto be transferred from their container into an autosamplervial. Some precautions include:
• OPA is shipped in ampoules under inert gas to prevent oxi-dation. Once opened, the OPA is potent for about 7-10days. It is recommended to transfer 100-µL aliquots of OPAto micro vial inserts, label with name and date, cap, andrefrigerate. Replace the OPA autosampler micro vial daily.Each ampoule lasts 10 days.
• FMOC is stable in dry air but deteriorates in moisture. It isalso recommended to transfer 100-µL aliquots of FMOC tomicro vial inserts, label with name and date, cap tightly,and refrigerate. Like the OPA, an open FMOC ampouletransferred to 10 micro vial inserts should last 10 days(one vial/day).
• Borate buffer can be transferred to a 1.5-mL autosamplervial without a vial insert. It can be replaced every 10 days.
Preparing the amino acid standardsAmino acid standard preparation remains unchanged fromprevious Agilent procedures or application notes. [4,5,6] SeeTable 7 on the back page for a list of part numbers.
Amino acid standards (10 pmol/µL to 1 nmol/µL): Solutionsof 17 amino acids in five concentrations are available fromAgilent for calibration curves. Divide each 1-mL ampoule ofstandards p/n 5061-3330 through 5061-3334 into 100-µL portions in conical vial inserts. Cap and refrigerate aliquots at4 °C.
4
Traditional high resolution method gradients, 5 µm4.6 × 250 mm 3.0 × 250 mmp/n 959990-902 p/n custom
time(min.) %B %B
0 2 20.84 2 2
33.4 57 5733.5 100 10039.3 100 10039.4 2 240 end endflow 1.5 0.64(mL/min.)
Rapid Resulution method gradients, 3.5 µm4.6 × 150 mm 3.0 × 150 mm 2.1 × 150 mmp/n 959963-902 p/n 959963-302 p/n 959763-902
time(min.) %B %B %B
0 2 2 20.5 2 2 2
20 57 57 5720.1 100 100 10023.5 100 100 10023.6 2 2 225 end end endflow 1.5 0.64 0.42(mL/min.)
Rapid Resolution High Throughput method gradients 1.8 µm, 100 mm4.6 × 100 mm 2.1 × 100 mmp/n 959963-902 p/n 959763-902
time (min.) %B %B
0 2 20.35 2 2
13.4 57 5713.5 100 10015.7 100 10015.8 2 216 end endflow 1.5 0.42(mL/min.)
Rapid Resolution High Throughput method gradients 1.8 µm, 50 mm4.6 × 50 mm 3.0 × 50 mm 2.1 × 50 mmp/n 959941-902 p/n 959941-302 p/n 959741-902
time(min.) %B %B %B
0 2 2 20.2 2 2 27.67 57 57 577.77 100 100 1008.3 100 100 1008.4 2 2 29 end end end
flow 2.0 0.85 0.42(mL/min.)
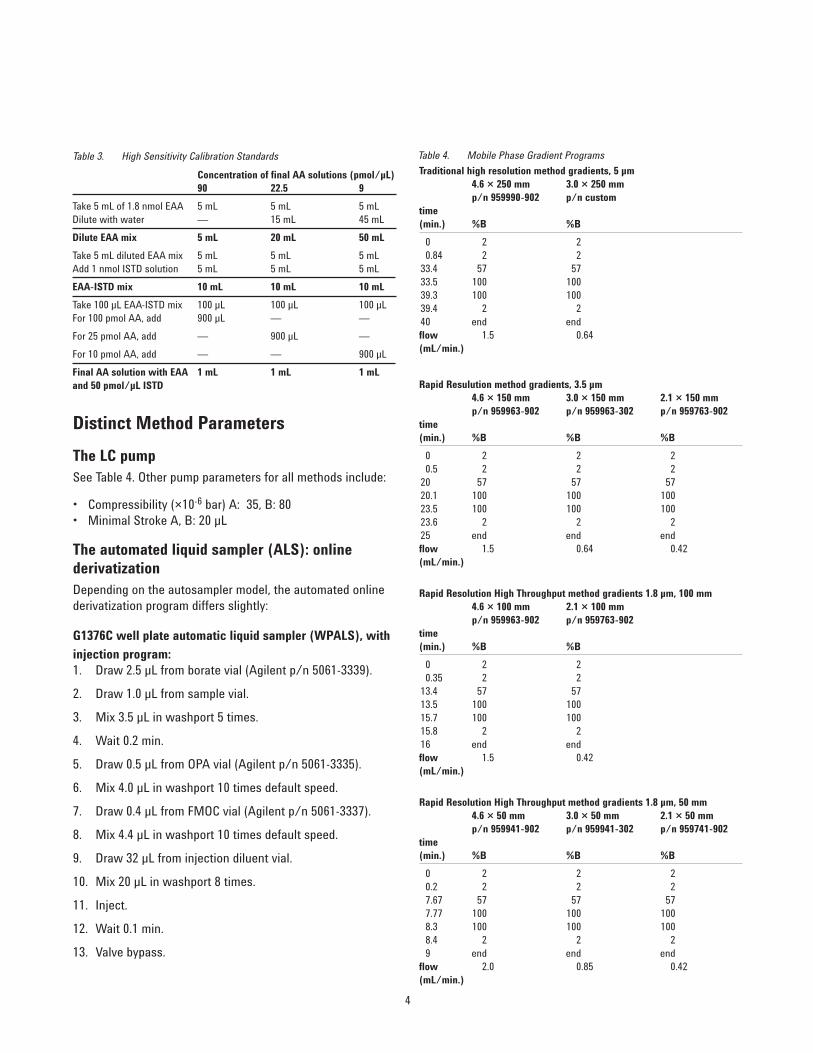
Table 4. Mobile Phase Gradient Programs
Distinct Method Parameters
The LC pumpSee Table 4. Other pump parameters for all methods include:
• Compressibility (×10-6 bar) A: 35, B: 80• Minimal Stroke A, B: 20 µL
The automated liquid sampler (ALS): onlinederivatizationDepending on the autosampler model, the automated onlinederivatization program differs slightly:
G1376C well plate automatic liquid sampler (WPALS), with
injection program:1. Draw 2.5 µL from borate vial (Agilent p/n 5061-3339).
2. Draw 1.0 µL from sample vial.
3. Mix 3.5 µL in washport 5 times.
4. Wait 0.2 min.
5. Draw 0.5 µL from OPA vial (Agilent p/n 5061-3335).
6. Mix 4.0 µL in washport 10 times default speed.
7. Draw 0.4 µL from FMOC vial (Agilent p/n 5061-3337).
8. Mix 4.4 µL in washport 10 times default speed.
9. Draw 32 µL from injection diluent vial.
10. Mix 20 µL in washport 8 times.
11. Inject.
12. Wait 0.1 min.
13. Valve bypass.
Table 3. High Sensitivity Calibration Standards
Concentration of final AA solutions (pmol/µL)90 22.5 9
Take 5 mL of 1.8 nmol EAA 5 mL 5 mL 5 mLDilute with water — 15 mL 45 mL
Dilute EAA mix 5 mL 20 mL 50 mL
Take 5 mL diluted EAA mix 5 mL 5 mL 5 mLAdd 1 nmol ISTD solution 5 mL 5 mL 5 mL
EAA-ISTD mix 10 mL 10 mL 10 mL
Take 100 µL EAA-ISTD mix 100 µL 100 µL 100 µLFor 100 pmol AA, add 900 µL — —
For 25 pmol AA, add — 900 µL —
For 10 pmol AA, add — — 900 µL
Final AA solution with EAA 1 mL 1 mL 1 mLand 50 pmol/µL ISTD
5
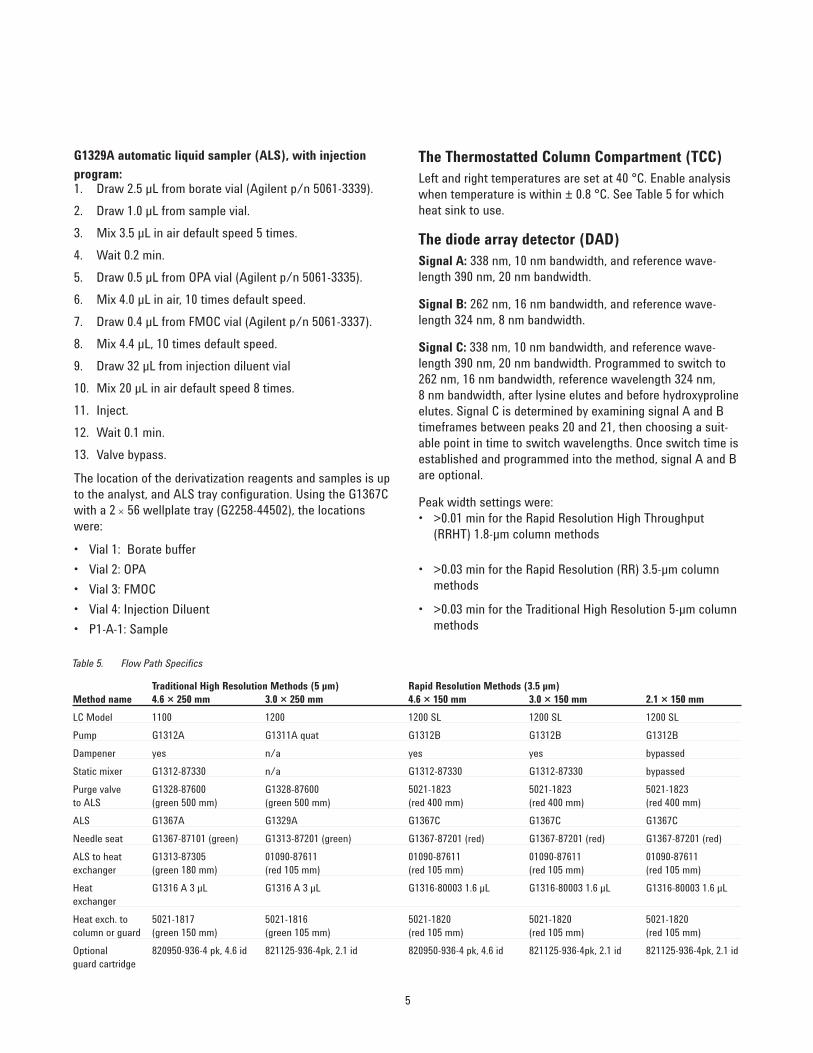
The Thermostatted Column Compartment (TCC)Left and right temperatures are set at 40 °C. Enable analysiswhen temperature is within ± 0.8 °C. See Table 5 for whichheat sink to use.
The diode array detector (DAD) Signal A: 338 nm, 10 nm bandwidth, and reference wave-length 390 nm, 20 nm bandwidth.
Signal B: 262 nm, 16 nm bandwidth, and reference wave-length 324 nm, 8 nm bandwidth.
Signal C: 338 nm, 10 nm bandwidth, and reference wave-length 390 nm, 20 nm bandwidth. Programmed to switch to262 nm, 16 nm bandwidth, reference wavelength 324 nm, 8 nm bandwidth, after lysine elutes and before hydroxyprolineelutes. Signal C is determined by examining signal A and Btimeframes between peaks 20 and 21, then choosing a suit-able point in time to switch wavelengths. Once switch time isestablished and programmed into the method, signal A and Bare optional.
Peak width settings were:• >0.01 min for the Rapid Resolution High Throughput
(RRHT) 1.8-µm column methods
• >0.03 min for the Rapid Resolution (RR) 3.5-µm columnmethods
• >0.03 min for the Traditional High Resolution 5-µm columnmethods
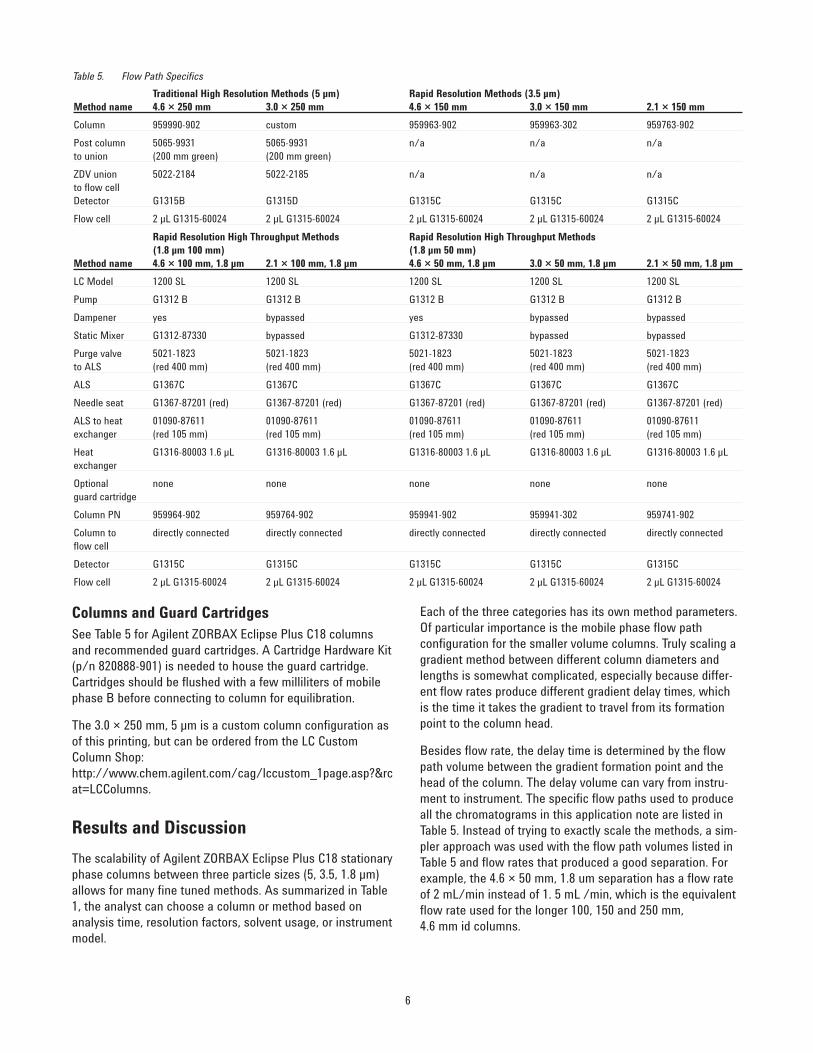
Table 5. Flow Path Specifics
Traditional High Resolution Methods (5 µm) Rapid Resolution Methods (3.5 µm)Method name 4.6 × 250 mm 3.0 × 250 mm 4.6 × 150 mm 3.0 × 150 mm 2.1 × 150 mm
LC Model 1100 1200 1200 SL 1200 SL 1200 SL
Pump G1312A G1311A quat G1312B G1312B G1312B
Dampener yes n/a yes yes bypassed
Static mixer G1312-87330 n/a G1312-87330 G1312-87330 bypassed
Purge valve G1328-87600 G1328-87600 5021-1823 5021-1823 5021-1823to ALS (green 500 mm) (green 500 mm) (red 400 mm) (red 400 mm) (red 400 mm)
ALS G1367A G1329A G1367C G1367C G1367C
Needle seat G1367-87101 (green) G1313-87201 (green) G1367-87201 (red) G1367-87201 (red) G1367-87201 (red)
ALS to heat G1313-87305 01090-87611 01090-87611 01090-87611 01090-87611exchanger (green 180 mm) (red 105 mm) (red 105 mm) (red 105 mm) (red 105 mm)
Heat G1316 A 3 µL G1316 A 3 µL G1316-80003 1.6 µL G1316-80003 1.6 µL G1316-80003 1.6 µLexchanger
Heat exch. to 5021-1817 5021-1816 5021-1820 5021-1820 5021-1820 column or guard (green 150 mm) (green 105 mm) (red 105 mm) (red 105 mm) (red 105 mm)
Optional 820950-936-4 pk, 4.6 id 821125-936-4pk, 2.1 id 820950-936-4 pk, 4.6 id 821125-936-4pk, 2.1 id 821125-936-4pk, 2.1 idguard cartridge
G1329A automatic liquid sampler (ALS), with injection
program:1. Draw 2.5 µL from borate vial (Agilent p/n 5061-3339).
2. Draw 1.0 µL from sample vial.
3. Mix 3.5 µL in air default speed 5 times.
4. Wait 0.2 min.
5. Draw 0.5 µL from OPA vial (Agilent p/n 5061-3335).
6. Mix 4.0 µL in air, 10 times default speed.
7. Draw 0.4 µL from FMOC vial (Agilent p/n 5061-3337).
8. Mix 4.4 µL, 10 times default speed.
9. Draw 32 µL from injection diluent vial
10. Mix 20 µL in air default speed 8 times.
11. Inject.
12. Wait 0.1 min.
13. Valve bypass.
The location of the derivatization reagents and samples is upto the analyst, and ALS tray configuration. Using the G1367Cwith a 2 × 56 wellplate tray (G2258-44502), the locationswere:
• Vial 1: Borate buffer
• Vial 2: OPA
• Vial 3: FMOC
• Vial 4: Injection Diluent
• P1-A-1: Sample
6
Columns and Guard CartridgesSee Table 5 for Agilent ZORBAX Eclipse Plus C18 columnsand recommended guard cartridges. A Cartridge Hardware Kit(p/n 820888-901) is needed to house the guard cartridge.Cartridges should be flushed with a few milliliters of mobilephase B before connecting to column for equilibration.
The 3.0 × 250 mm, 5 µm is a custom column configuration asof this printing, but can be ordered from the LC CustomColumn Shop: http://www.chem.agilent.com/cag/lccustom_1page.asp?&rcat=LCColumns.
Results and Discussion
The scalability of Agilent ZORBAX Eclipse Plus C18 stationaryphase columns between three particle sizes (5, 3.5, 1.8 µm)allows for many fine tuned methods. As summarized in Table1, the analyst can choose a column or method based onanalysis time, resolution factors, solvent usage, or instrumentmodel.
Each of the three categories has its own method parameters.Of particular importance is the mobile phase flow path configuration for the smaller volume columns. Truly scaling agradient method between different column diameters andlengths is somewhat complicated, especially because differ-ent flow rates produce different gradient delay times, whichis the time it takes the gradient to travel from its formationpoint to the column head.
Besides flow rate, the delay time is determined by the flowpath volume between the gradient formation point and thehead of the column. The delay volume can vary from instru-ment to instrument. The specific flow paths used to produceall the chromatograms in this application note are listed inTable 5. Instead of trying to exactly scale the methods, a sim-pler approach was used with the flow path volumes listed inTable 5 and flow rates that produced a good separation. Forexample, the 4.6 × 50 mm, 1.8 um separation has a flow rateof 2 mL/min instead of 1. 5 mL /min, which is the equivalentflow rate used for the longer 100, 150 and 250 mm,4.6 mm id columns.
Table 5. Flow Path Specifics
Traditional High Resolution Methods (5 µm) Rapid Resolution Methods (3.5 µm)Method name 4.6 × 250 mm 3.0 × 250 mm 4.6 × 150 mm 3.0 × 150 mm 2.1 × 150 mm
Column 959990-902 custom 959963-902 959963-302 959763-902
Post column 5065-9931 5065-9931 n/a n/a n/ato union (200 mm green) (200 mm green)
ZDV union 5022-2184 5022-2185 n/a n/a n/ato flow cellDetector G1315B G1315D G1315C G1315C G1315C
Flow cell 2 µL G1315-60024 2 µL G1315-60024 2 µL G1315-60024 2 µL G1315-60024 2 µL G1315-60024
Rapid Resolution High Throughput Methods Rapid Resolution High Throughput Methods (1.8 µm 100 mm) (1.8 µm 50 mm)
Method name 4.6 × 100 mm, 1.8 µm 2.1 × 100 mm, 1.8 µm 4.6 × 50 mm, 1.8 µm 3.0 × 50 mm, 1.8 µm 2.1 × 50 mm, 1.8 µm
LC Model 1200 SL 1200 SL 1200 SL 1200 SL 1200 SL
Pump G1312 B G1312 B G1312 B G1312 B G1312 B
Dampener yes bypassed yes bypassed bypassed
Static Mixer G1312-87330 bypassed G1312-87330 bypassed bypassed
Purge valve 5021-1823 5021-1823 5021-1823 5021-1823 5021-1823to ALS (red 400 mm) (red 400 mm) (red 400 mm) (red 400 mm) (red 400 mm)
ALS G1367C G1367C G1367C G1367C G1367C
Needle seat G1367-87201 (red) G1367-87201 (red) G1367-87201 (red) G1367-87201 (red) G1367-87201 (red)
ALS to heat 01090-87611 01090-87611 01090-87611 01090-87611 01090-87611exchanger (red 105 mm) (red 105 mm) (red 105 mm) (red 105 mm) (red 105 mm)
Heat G1316-80003 1.6 µL G1316-80003 1.6 µL G1316-80003 1.6 µL G1316-80003 1.6 µL G1316-80003 1.6 µLexchanger
Optional none none none none noneguard cartridge
Column PN 959964-902 959764-902 959941-902 959941-302 959741-902
Column to directly connected directly connected directly connected directly connected directly connectedflow cell
Detector G1315C G1315C G1315C G1315C G1315C
Flow cell 2 µL G1315-60024 2 µL G1315-60024 2 µL G1315-60024 2 µL G1315-60024 2 µL G1315-60024
7
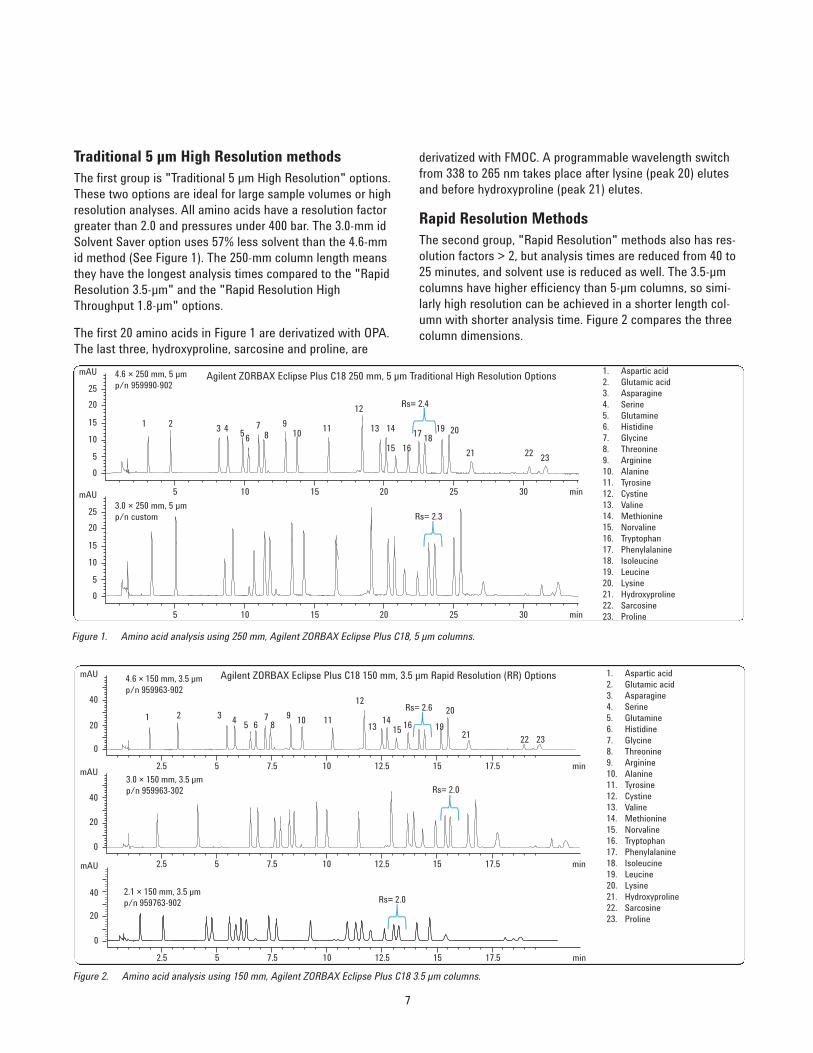
Traditional 5 µm High Resolution methodsThe first group is "Traditional 5 µm High Resolution" options.These two options are ideal for large sample volumes or highresolution analyses. All amino acids have a resolution factorgreater than 2.0 and pressures under 400 bar. The 3.0-mm idSolvent Saver option uses 57% less solvent than the 4.6-mmid method (See Figure 1). The 250-mm column length meansthey have the longest analysis times compared to the "RapidResolution 3.5-µm" and the "Rapid Resolution HighThroughput 1.8-µm" options.
The first 20 amino acids in Figure 1 are derivatized with OPA.The last three, hydroxyproline, sarcosine and proline, are
Figure 1. Amino acid analysis using 250 mm, Agilent ZORBAX Eclipse Plus C18, 5 µm columns.
Figure 2. Amino acid analysis using 150 mm, Agilent ZORBAX Eclipse Plus C18 3.5 µm columns.
derivatized with FMOC. A programmable wavelength switchfrom 338 to 265 nm takes place after lysine (peak 20) elutesand before hydroxyproline (peak 21) elutes.
Rapid Resolution MethodsThe second group, "Rapid Resolution" methods also has res-olution factors > 2, but analysis times are reduced from 40 to25 minutes, and solvent use is reduced as well. The 3.5-µmcolumns have higher efficiency than 5-µm columns, so simi-larly high resolution can be achieved in a shorter length col-umn with shorter analysis time. Figure 2 compares the threecolumn dimensions.
25
mAU
20
15
10
5
5 10 15 20 25 30 min
0
25
mAU
20
15
10
5
5 10 15 20 25 30 min
0
Rs= 2.4
4.6 × 250 mm, 5 µmp/n 959990-902
3.0 × 250 mm, 5 µm p/n custom Rs= 2.3
1 2 3 4 567
89
12
10 11 13 14
15 1617 19
1820
21 22 23
1. Aspartic acid2. Glutamic acid3. Asparagine4. Serine5. Glutamine6. Histidine7. Glycine8. Threonine9. Arginine10. Alanine11. Tyrosine12. Cystine13. Valine14. Methionine15. Norvaline16. Tryptophan17. Phenylalanine18. Isoleucine19. Leucine20. Lysine21. Hydroxyproline22. Sarcosine23. Proline
mAU
40
20
2.5 5 7.5 10 12.5 15 min
0
17.5mAU
40
20
2.5 5 7.5 10 12.5 15 min
0
17.5mAU
40
20
2.5 5 7.5 10 12.5 15 min
0
17.5
Rs= 2.6
4.6 × 150 mm, 3.5 µmp/n 959963-902
1 2 4 67
89
12
10 1113
1415 16 19
20
21 22 23
35
3.0 × 150 mm, 3.5 µmp/n 959963-302 Rs= 2.0
2.1 × 150 mm, 3.5 µmp/n 959763-902 Rs= 2.0
1. Aspartic acid2. Glutamic acid3. Asparagine4. Serine5. Glutamine6. Histidine7. Glycine8. Threonine9. Arginine10. Alanine11. Tyrosine12. Cystine13. Valine14. Methionine15. Norvaline16. Tryptophan17. Phenylalanine18. Isoleucine19. Leucine20. Lysine21. Hydroxyproline22. Sarcosine23. Proline
Agilent ZORBAX Eclipse Plus C18 250 mm, 5 µm Traditional High Resolution Options
Agilent ZORBAX Eclipse Plus C18 150 mm, 3.5 µm Rapid Resolution (RR) Options
8
Upgrading from the original AminoQuant methodto an Agilent ZORBAX Eclipse Plus C18 AAmethodThe Rapid Resolution methods include the 2.1 × 150 mm, 3.5 µm column which has the same inner diameter and simi-lar efficiency of the AminoQuant column (2.1 × 200 mm, 5 µm). Consequently, the column produces a chromatogramwith a similar analysis time and peak widths.
AminoQuant users that upgrade to an Eclipse Plus C18 aminoacid method and want a comparable chromatogram to theirAminoQuant results should use the 2.1 × 150 mm, 3.5 µmmethod with an Agilent 1200 SL Series HPLC as listed inTable 5.
Peak elution order of the standard amino acid mixture includ-ing the supplemental amino acids (gln, asn, trp, nva, hyp, sar)is the same for the two methods except for arginine. In theAminoQuant method, arginine elutes immediately after ala-nine. In the Eclipse Plus C18 method (and all previous ZORBAX amino acid methods), arginine elutes immediatelybefore alanine.
AminoQuant users that upgrade to an Eclipse Plus amino acidmethod can choose one of the other nine methods if they arenot constrained to a chromatogram similar in analysis time totheir original AminoQuant chromatogram. These users shouldchoose the method that best suits their needs regardinganalysis time, resolution, solvent consumption, or instrumentation.
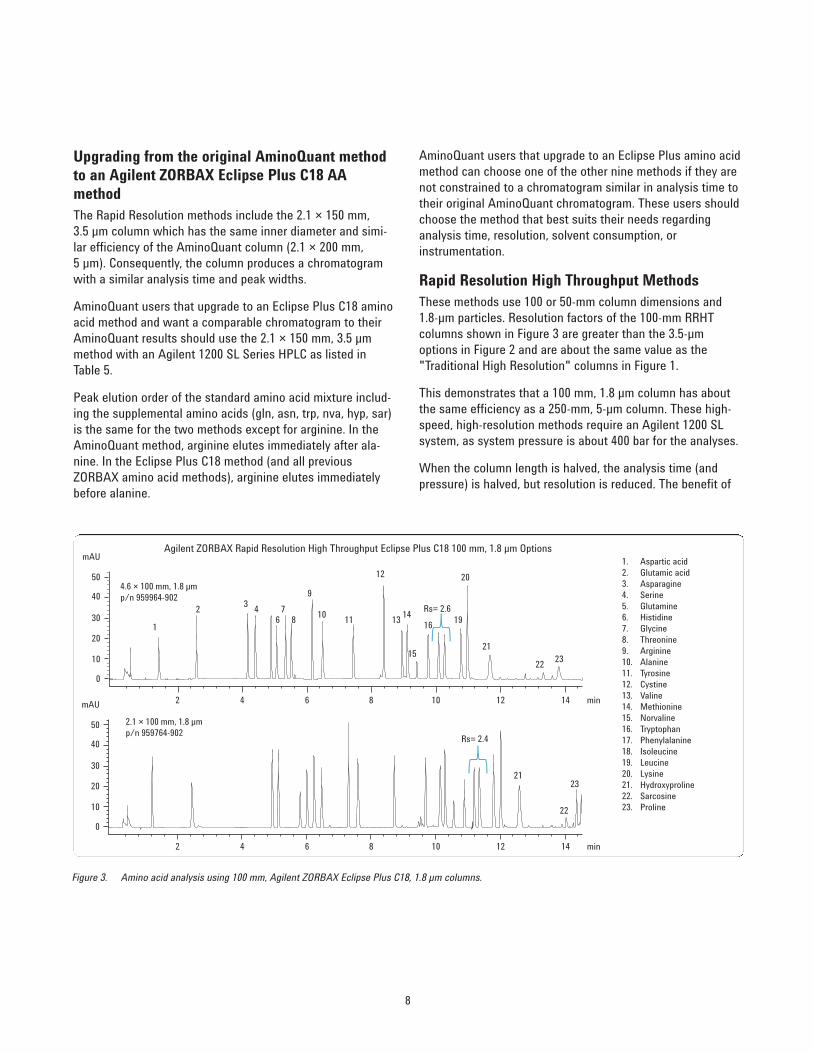
Rapid Resolution High Throughput MethodsThese methods use 100 or 50-mm column dimensions and1.8-µm particles. Resolution factors of the 100-mm RRHTcolumns shown in Figure 3 are greater than the 3.5-µmoptions in Figure 2 and are about the same value as the"Traditional High Resolution" columns in Figure 1.
This demonstrates that a 100 mm, 1.8 µm column has aboutthe same efficiency as a 250-mm, 5-µm column. These high-speed, high-resolution methods require an Agilent 1200 SLsystem, as system pressure is about 400 bar for the analyses.
When the column length is halved, the analysis time (andpressure) is halved, but resolution is reduced. The benefit of
Figure 3. Amino acid analysis using 100 mm, Agilent ZORBAX Eclipse Plus C18, 1.8 µm columns.
50
mAU
40
30
20
10
0
50
mAU
40
30
20
10
2 4 6 8 10 12 min
0
14
2 4 6 8 10 12 min14
Rs= 2.6
4.6 × 100 mm, 1.8 µmp/n 959964-902
1
23
46
78
9
12
1011 13
14
15
1619
20
21
2223
2.1 × 100 mm, 1.8 µmp/n 959764-902
Rs= 2.4
21
22
23
1. Aspartic acid2. Glutamic acid3. Asparagine4. Serine5. Glutamine6. Histidine7. Glycine8. Threonine9. Arginine10. Alanine11. Tyrosine12. Cystine13. Valine14. Methionine15. Norvaline16. Tryptophan17. Phenylalanine18. Isoleucine19. Leucine20. Lysine21. Hydroxyproline22. Sarcosine23. Proline
Agilent ZORBAX Rapid Resolution High Throughput Eclipse Plus C18 100 mm, 1.8 µm Options
9
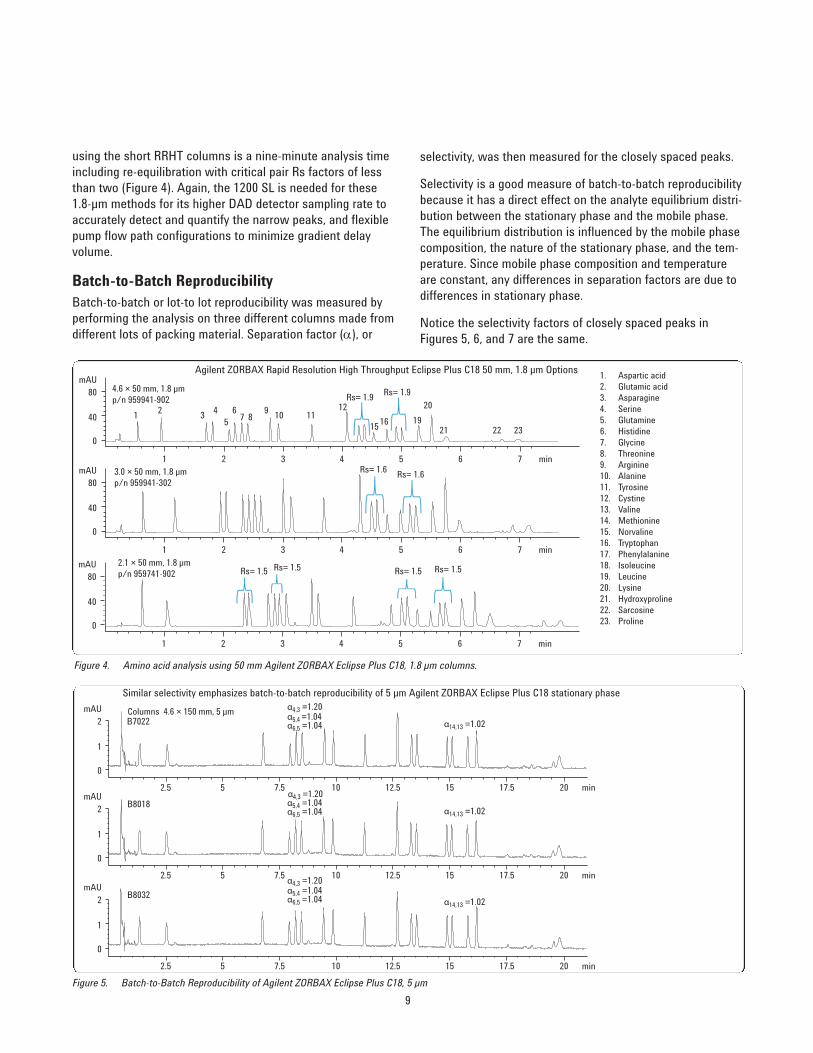
using the short RRHT columns is a nine-minute analysis timeincluding re-equilibration with critical pair Rs factors of lessthan two (Figure 4). Again, the 1200 SL is needed for these1.8-µm methods for its higher DAD detector sampling rate toaccurately detect and quantify the narrow peaks, and flexiblepump flow path configurations to minimize gradient delay volume.
Batch-to-Batch ReproducibilityBatch-to-batch or lot-to lot reproducibility was measured byperforming the analysis on three different columns made fromdifferent lots of packing material. Separation factor (α), or
selectivity, was then measured for the closely spaced peaks.
Selectivity is a good measure of batch-to-batch reproducibilitybecause it has a direct effect on the analyte equilibrium distri-bution between the stationary phase and the mobile phase.The equilibrium distribution is influenced by the mobile phasecomposition, the nature of the stationary phase, and the tem-perature. Since mobile phase composition and temperatureare constant, any differences in separation factors are due todifferences in stationary phase.
Notice the selectivity factors of closely spaced peaks inFigures 5, 6, and 7 are the same.
Figure 4. Amino acid analysis using 50 mm Agilent ZORBAX Eclipse Plus C18, 1.8 µm columns.
Figure 5. Batch-to-Batch Reproducibility of Agilent ZORBAX Eclipse Plus C18, 5 µm
mAU2
1
0
2.5 5 7.5 10 12.5 15 17.5 min20mAU
2
1
0
2.5 5 7.5 10 12.5 15 17.5 min20mAU
2
1
0
2.5 5 7.5 10 12.5 15 17.5 min20
B7022
α4,3 =1.20α5,4 =1.04α6,5 =1.04 α14,13 =1.02
α4,3 =1.20α5,4 =1.04α6,5 =1.04 α14,13 =1.02
Columns 4.6 × 150 mm, 5 µm
B8018
α4,3 =1.20α5,4 =1.04α6,5 =1.04 α14,13 =1.02
B8032
mAU80
40
0
1 2 3 4 5 6 min7mAU
80
40
0
1 2 3 4 5 6 min7
mAU80
40
0
1 2 3 4 5 6 min7
Rs= 1.9 Rs= 1.94.6 × 50 mm, 1.8 µmp/n 959941-902
1 2 3 4 67 8
9 1210 11
15 16 19
20
21 22 235
Rs= 1.6 Rs= 1.63.0 × 50 mm, 1.8 µmp/n 959941-302
2.1 × 50 mm, 1.8 µmp/n 959741-902 Rs= 1.5 Rs= 1.5 Rs= 1.5 Rs= 1.5
1. Aspartic acid2. Glutamic acid3. Asparagine4. Serine5. Glutamine6. Histidine7. Glycine8. Threonine9. Arginine10. Alanine11. Tyrosine12. Cystine13. Valine14. Methionine15. Norvaline16. Tryptophan17. Phenylalanine18. Isoleucine19. Leucine20. Lysine21. Hydroxyproline22. Sarcosine23. Proline
Agilent ZORBAX Rapid Resolution High Throughput Eclipse Plus C18 50 mm, 1.8 µm Options
Similar selectivity emphasizes batch-to-batch reproducibility of 5 µm Agilent ZORBAX Eclipse Plus C18 stationary phase
10
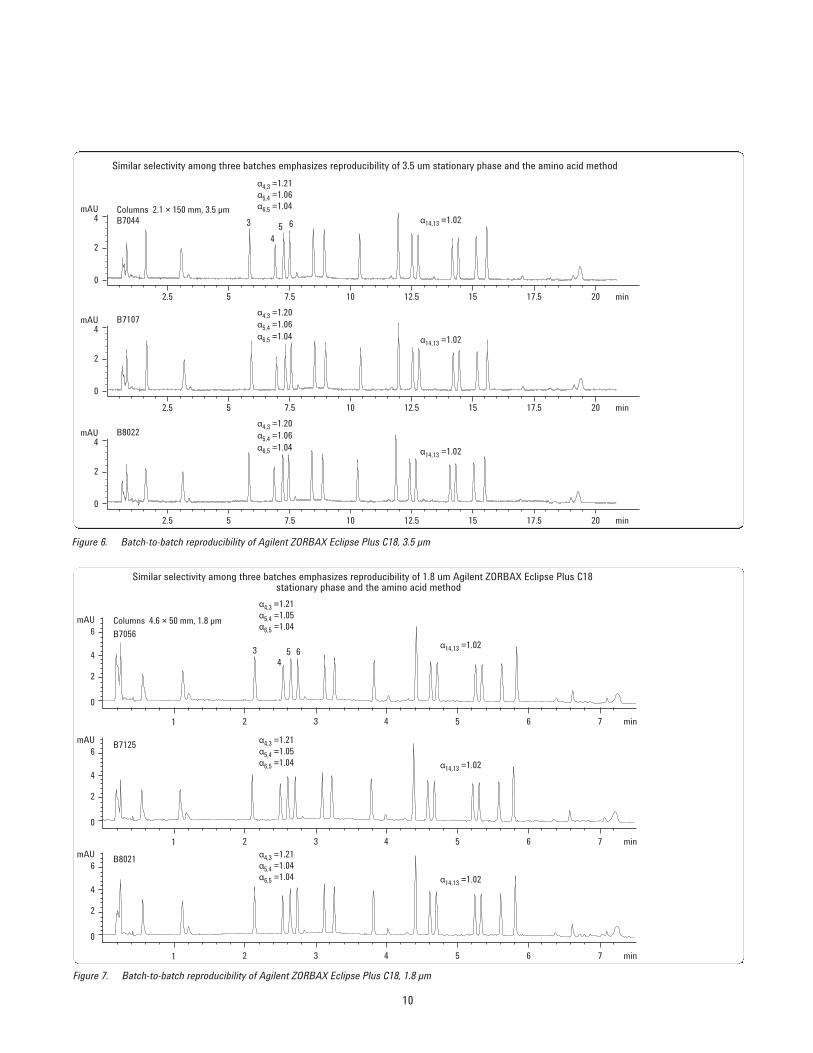
Figure 6. Batch-to-batch reproducibility of Agilent ZORBAX Eclipse Plus C18, 3.5 µm
Figure 7. Batch-to-batch reproducibility of Agilent ZORBAX Eclipse Plus C18, 1.8 µm
mAU4
2
0
2.5 5 7.5 10 12.5 15 17.5 min20
mAU4
2
0
2.5 5 7.5 10 12.5 15 17.5 min20
mAU4
2
0
2.5 5 7.5 10 12.5 15 17.5 min20
B7044
B7107
α4,3 =1.21α5,4 =1.06α6,5 =1.04
α4,3 =1.20α5,4 =1.06α6,5 =1.04
α14,13 =1.02
α14,13 =1.02
B8022α4,3 =1.20α5,4 =1.06α6,5 =1.04 α14,13 =1.02
Columns 2.1 × 150 mm, 3.5 µm
3
4
65
4
2
0
mAU6
1 2 3 4 5 6 7 min
4
2
0
mAU6
1 2 3 4 5 6 7 min
4
2
0
mAU6
1 2 3 4 5 6 7 min
α4,3 =1.21α5,4 =1.05α6,5 =1.04
α14,13 =1.02
Columns 4.6 × 50 mm, 1.8 µm
B7056
34
65
α4,3 =1.21α5,4 =1.05α6,5 =1.04 α14,13 =1.02
B7125
α4,3 =1.21α5,4 =1.04α6,5 =1.04 α14,13 =1.02
B8021
Similar selectivity among three batches emphasizes reproducibility of 3.5 um stationary phase and the amino acid method
Similar selectivity among three batches emphasizes reproducibility of 1.8 um Agilent ZORBAX Eclipse Plus C18 stationary phase and the amino acid method
11
In only one instance, the selectivity factor differs by 1%.Batch-to-batch reproducibility is consistent and reliable forthe three particle sizes.
Different column dimensions were used for batch-to-batchcomparisons:
• 4.6 × 50 mm for 1.8 µm particle comparisons• 2.1 × 150 mm for 3.5 µm particle comparisons• 4.6 × 150 mm for µm particle comparisons
Different sizes are suitable because selectivity is independentof column dimensions. Also, they further exemplify methodrobustness. In fact, the 4.6 × 150 mm dimension (See Figure5) showing batch-to-batch reproducibility is a configurationnot suggested in this application note. This is because
although the 5-µm column separates the amino acids withsimilar selectivity as a 3.5-µm column, the 4.6 × 150-mm, 3.5-µm column has higher efficiency, and therefore better resolu-tion. That makes it a better option than the 5-µm column.
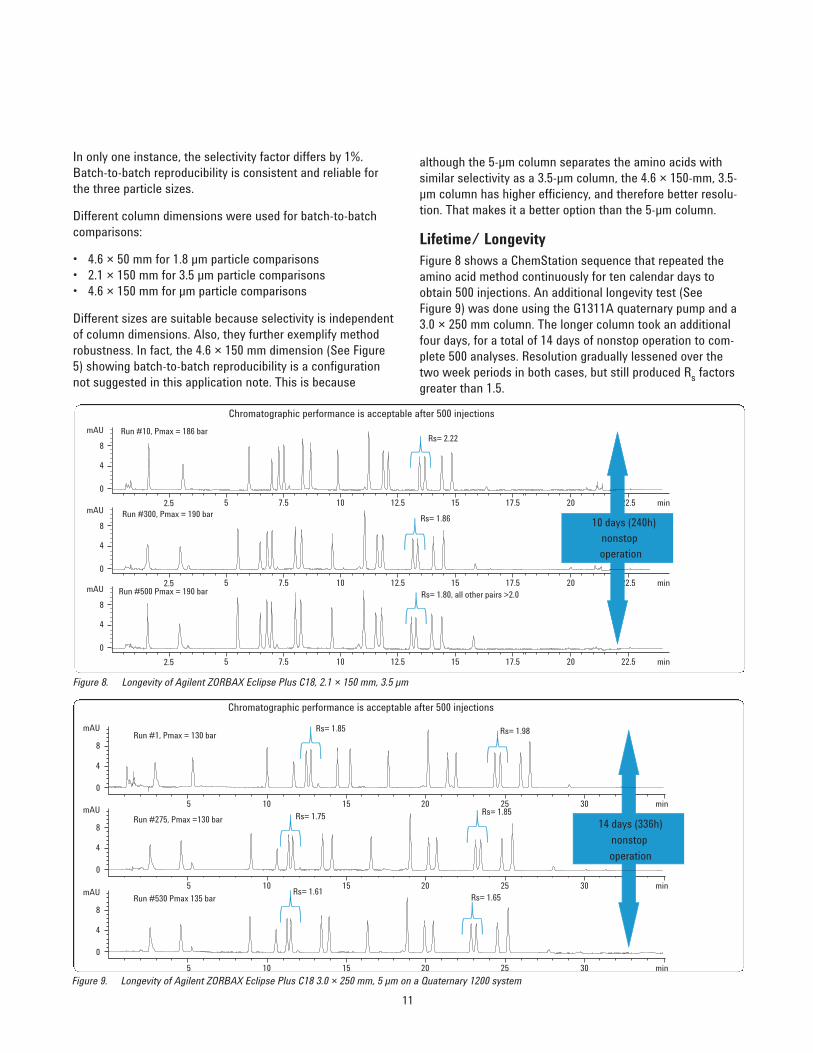
Lifetime/ LongevityFigure 8 shows a ChemStation sequence that repeated theamino acid method continuously for ten calendar days toobtain 500 injections. An additional longevity test (See Figure 9) was done using the G1311A quaternary pump and a3.0 × 250 mm column. The longer column took an additionalfour days, for a total of 14 days of nonstop operation to com-plete 500 analyses. Resolution gradually lessened over thetwo week periods in both cases, but still produced Rs factorsgreater than 1.5.
Figure 8. Longevity of Agilent ZORBAX Eclipse Plus C18, 2.1 × 150 mm, 3.5 µm
Figure 9. Longevity of Agilent ZORBAX Eclipse Plus C18 3.0 × 250 mm, 5 µm on a Quaternary 1200 system
8
4
0
mAU
105 15 20 25 30 min
8
4
0
mAU
105 15 20 25 30 min
8
4
0
mAU
105 15 20 25 30 min
Rs= 1.98
14 days (336h)
nonstop
operation
Rs= 1.61
Rs= 1.75
Run #1, Pmax = 130 bar
Run #275, Pmax =130 bar
Run #530 Pmax 135 bar Rs= 1.65
Rs= 1.85
Rs= 1.85
8
4
0
mAU
2.5 5 7.5 10 12.5 15 17.5 20 22.5 min
8
4
0
mAU
2.5 5 7.5 10 12.5 15 17.5 20 22.5 min
8
4
0
mAU
2.5 5 7.5 10 12.5 15 17.5 20 22.5 min
Run #10, Pmax = 186 bar
Run #300, Pmax = 190 bar
Run #500 Pmax = 190 bar
Rs= 2.22
Rs= 1.80, all other pairs >2.0
Rs= 1.86 10 days (240h)nonstop
operation
Chromatographic performance is acceptable after 500 injections
Chromatographic performance is acceptable after 500 injections
12
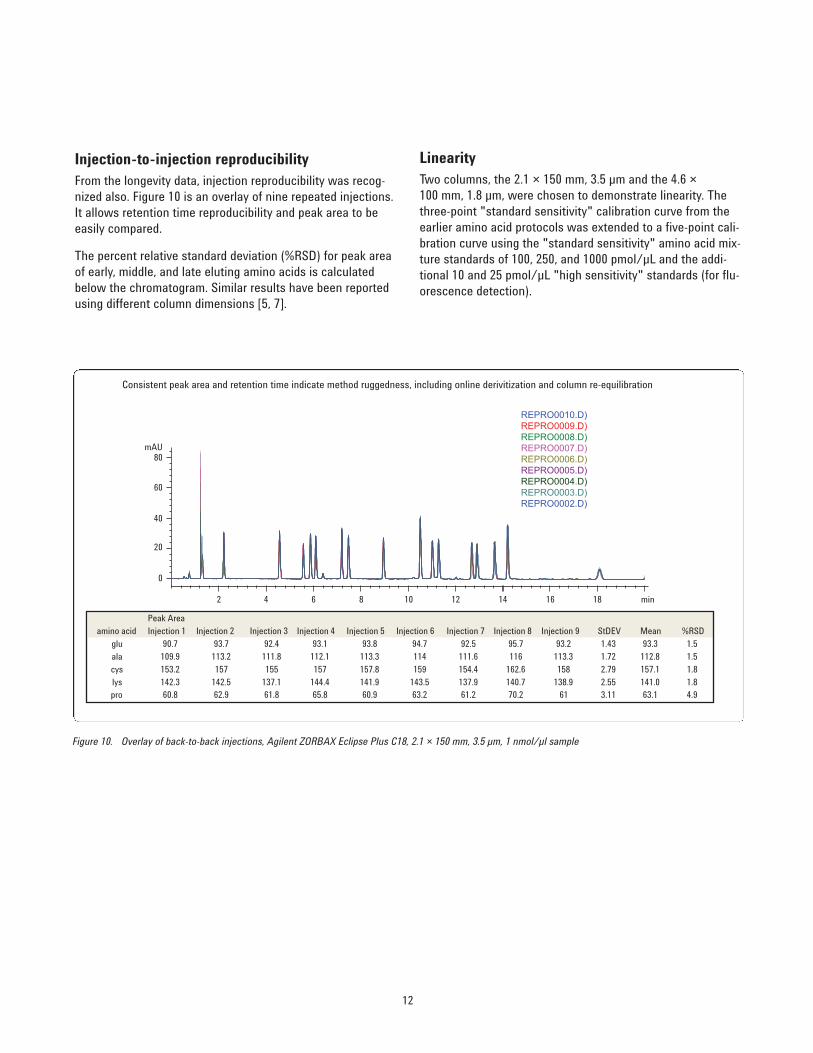
Injection-to-injection reproducibilityFrom the longevity data, injection reproducibility was recog-nized also. Figure 10 is an overlay of nine repeated injections.It allows retention time reproducibility and peak area to beeasily compared.
The percent relative standard deviation (%RSD) for peak areaof early, middle, and late eluting amino acids is calculatedbelow the chromatogram. Similar results have been reportedusing different column dimensions [5, 7].
LinearityTwo columns, the 2.1 × 150 mm, 3.5 µm and the 4.6 × 100 mm, 1.8 µm, were chosen to demonstrate linearity. Thethree-point "standard sensitivity" calibration curve from theearlier amino acid protocols was extended to a five-point cali-bration curve using the "standard sensitivity" amino acid mix-ture standards of 100, 250, and 1000 pmol/µL and the addi-tional 10 and 25 pmol/µL "high sensitivity" standards (for flu-orescence detection).
Figure 10. Overlay of back-to-back injections, Agilent ZORBAX Eclipse Plus C18, 2.1 × 150 mm, 3.5 µm, 1 nmol/µl sample
40
60
80
20
0
mAU
42 6 8 10 12 14 16 18 min
Peak Area
amino acid Injection 1 Injection 2 Injection 3 Injection 4 Injection 5 Injection 6 Injection 7 Injection 8 Injection 9 StDEV Mean %RSD
glu 90.7 93.7 92.4 93.1 93.8 94.7 92.5 95.7 93.2 1.43 93.3 1.5
ala 109.9 113.2 111.8 112.1 113.3 114 111.6 116 113.3 1.72 112.8 1.5
cys 153.2 157 155 157 157.8 159 154.4 162.6 158 2.79 157.1 1.8
lys 142.3 142.5 137.1 144.4 141.9 143.5 137.9 140.7 138.9 2.55 141.0 1.8pro 60.8 62.9 61.8 65.8 60.9 63.2 61.2 70.2 61 3.11 63.1 4.9
REPRO0010.D)REPRO0009.D)REPRO0008.D)REPRO0007.D)REPRO0006.D)REPRO0005.D)REPRO0004.D)REPRO0003.D)REPRO0002.D)
Consistent peak area and retention time indicate method ruggedness, including online derivitization and column re-equilibration
13
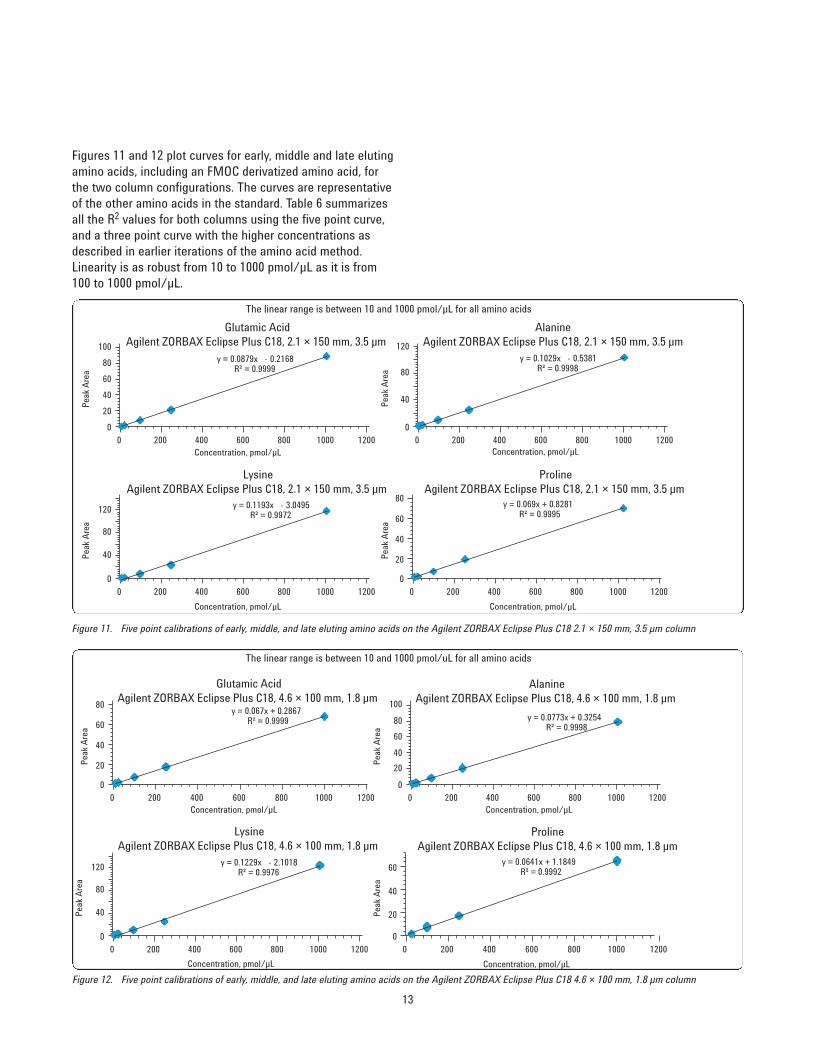
Figures 11 and 12 plot curves for early, middle and late elutingamino acids, including an FMOC derivatized amino acid, forthe two column configurations. The curves are representativeof the other amino acids in the standard. Table 6 summarizesall the R2 values for both columns using the five point curve,and a three point curve with the higher concentrations asdescribed in earlier iterations of the amino acid method.Linearity is as robust from 10 to 1000 pmol/µL as it is from100 to 1000 pmol/µL.
Figure 11. Five point calibrations of early, middle, and late eluting amino acids on the Agilent ZORBAX Eclipse Plus C18 2.1 × 150 mm, 3.5 µm column
Figure 12. Five point calibrations of early, middle, and late eluting amino acids on the Agilent ZORBAX Eclipse Plus C18 4.6 × 100 mm, 1.8 µm column
40
20
0
80
60
2000 600400 1200800 1000
40
20
0
60
2000 600400 1200800 1000
40
0
120
80
2000 600400 1200800 1000
40
20
0
60
80
100
2000 600400 1200800 1000
y = 0.067x + 0.2867R² = 0.9999
Peak
Are
a
Concentration, pmol/µL
Glutamic AcidAgilent ZORBAX Eclipse Plus C18, 4.6 × 100 mm, 1.8 µm
y = 0.0773x + 0.3254R² = 0.9998
Peak
Are
a
Concentration, pmol/µL
AlanineAgilent ZORBAX Eclipse Plus C18, 4.6 × 100 mm, 1.8 µm
y = 0.1229x - 2.1018R² = 0.9976
Peak
Are
a
Concentration, pmol/µL
LysineAgilent ZORBAX Eclipse Plus C18, 4.6 × 100 mm, 1.8 µm
y = 0.0641x + 1.1849R² = 0.9992
Peak
Are
a
Concentration, pmol/µL
ProlineAgilent ZORBAX Eclipse Plus C18, 4.6 × 100 mm, 1.8 µm
40
20
0
100
80
60
2000 600400 1200800 1000
40
20
0
80
60
2000 600400 1200800 1000
40
0
120
80
2000 600400 1200800 1000
40
0
120
80
2000 600400 1200800 1000
y = 0.0879x - 0.2168R² = 0.9999
Peak
Are
a
Concentration, pmol/µL
Glutamic AcidAgilent ZORBAX Eclipse Plus C18, 2.1 × 150 mm, 3.5 µm
y = 0.1029x - 0.5381R² = 0.9998
Peak
Are
a
Concentration, pmol/µL
AlanineAgilent ZORBAX Eclipse Plus C18, 2.1 × 150 mm, 3.5 µm
y = 0.069x + 0.8281R² = 0.9995
Peak
Are
a
Concentration, pmol/µL
ProlineAgilent ZORBAX Eclipse Plus C18, 2.1 × 150 mm, 3.5 µm
y = 0.1193x - 3.0495R² = 0.9972
Peak
Are
a
Concentration, pmol/µL
LysineAgilent ZORBAX Eclipse Plus C18, 2.1 × 150 mm, 3.5 µm
The linear range is between 10 and 1000 pmol/µL for all amino acids
The linear range is between 10 and 1000 pmol/uL for all amino acids
14
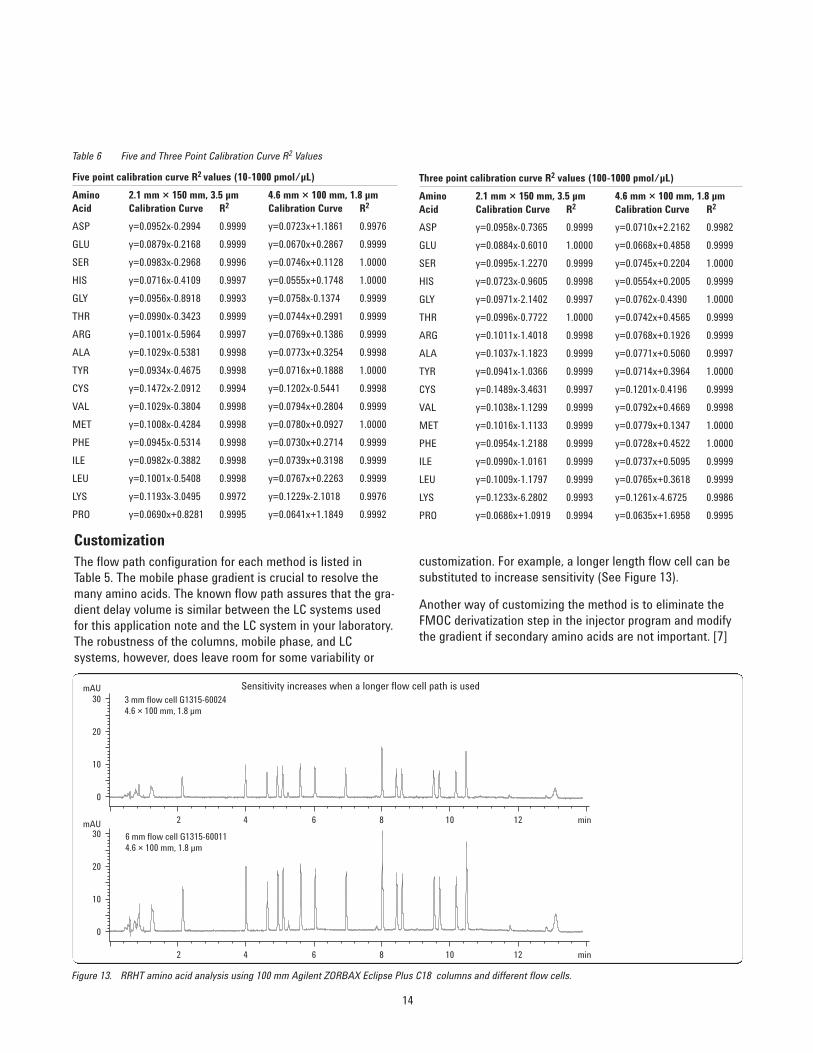
CustomizationThe flow path configuration for each method is listed in Table 5. The mobile phase gradient is crucial to resolve themany amino acids. The known flow path assures that the gra-dient delay volume is similar between the LC systems usedfor this application note and the LC system in your laboratory.The robustness of the columns, mobile phase, and LC systems, however, does leave room for some variability or
Five point calibration curve R2 values (10-1000 pmol/µL)
Amino 2.1 mm × 150 mm, 3.5 µm 4.6 mm × 100 mm, 1.8 µmAcid Calibration Curve R2 Calibration Curve R2
ASP y=0.0952x-0.2994 0.9999 y=0.0723x+1.1861 0.9976
GLU y=0.0879x-0.2168 0.9999 y=0.0670x+0.2867 0.9999
SER y=0.0983x-0.2968 0.9996 y=0.0746x+0.1128 1.0000
HIS y=0.0716x-0.4109 0.9997 y=0.0555x+0.1748 1.0000
GLY y=0.0956x-0.8918 0.9993 y=0.0758x-0.1374 0.9999
THR y=0.0990x-0.3423 0.9999 y=0.0744x+0.2991 0.9999
ARG y=0.1001x-0.5964 0.9997 y=0.0769x+0.1386 0.9999
ALA y=0.1029x-0.5381 0.9998 y=0.0773x+0.3254 0.9998
TYR y=0.0934x-0.4675 0.9998 y=0.0716x+0.1888 1.0000
CYS y=0.1472x-2.0912 0.9994 y=0.1202x-0.5441 0.9998
VAL y=0.1029x-0.3804 0.9998 y=0.0794x+0.2804 0.9999
MET y=0.1008x-0.4284 0.9998 y=0.0780x+0.0927 1.0000
PHE y=0.0945x-0.5314 0.9998 y=0.0730x+0.2714 0.9999
ILE y=0.0982x-0.3882 0.9998 y=0.0739x+0.3198 0.9999
LEU y=0.1001x-0.5408 0.9998 y=0.0767x+0.2263 0.9999
LYS y=0.1193x-3.0495 0.9972 y=0.1229x-2.1018 0.9976
PRO y=0.0690x+0.8281 0.9995 y=0.0641x+1.1849 0.9992
Table 6 Five and Three Point Calibration Curve R2 Values
Figure 13. RRHT amino acid analysis using 100 mm Agilent ZORBAX Eclipse Plus C18 columns and different flow cells.
10
0
30
20
mAU
42 6 8 10 12 min
10
0
30
20
mAU
42 6 8 10 12 min
3 mm flow cell G1315-600244.6 × 100 mm, 1.8 µm
6 mm flow cell G1315-600114.6 × 100 mm, 1.8 µm
Three point calibration curve R2 values (100-1000 pmol/µL)
Amino 2.1 mm × 150 mm, 3.5 µm 4.6 mm × 100 mm, 1.8 µmAcid Calibration Curve R2 Calibration Curve R2
ASP y=0.0958x-0.7365 0.9999 y=0.0710x+2.2162 0.9982
GLU y=0.0884x-0.6010 1.0000 y=0.0668x+0.4858 0.9999
SER y=0.0995x-1.2270 0.9999 y=0.0745x+0.2204 1.0000
HIS y=0.0723x-0.9605 0.9998 y=0.0554x+0.2005 0.9999
GLY y=0.0971x-2.1402 0.9997 y=0.0762x-0.4390 1.0000
THR y=0.0996x-0.7722 1.0000 y=0.0742x+0.4565 0.9999
ARG y=0.1011x-1.4018 0.9998 y=0.0768x+0.1926 0.9999
ALA y=0.1037x-1.1823 0.9999 y=0.0771x+0.5060 0.9997
TYR y=0.0941x-1.0366 0.9999 y=0.0714x+0.3964 1.0000
CYS y=0.1489x-3.4631 0.9997 y=0.1201x-0.4196 0.9999
VAL y=0.1038x-1.1299 0.9999 y=0.0792x+0.4669 0.9998
MET y=0.1016x-1.1133 0.9999 y=0.0779x+0.1347 1.0000
PHE y=0.0954x-1.2188 0.9999 y=0.0728x+0.4522 1.0000
ILE y=0.0990x-1.0161 0.9999 y=0.0737x+0.5095 0.9999
LEU y=0.1009x-1.1797 0.9999 y=0.0765x+0.3618 0.9999
LYS y=0.1233x-6.2802 0.9993 y=0.1261x-4.6725 0.9986
PRO y=0.0686x+1.0919 0.9994 y=0.0635x+1.6958 0.9995
customization. For example, a longer length flow cell can be substituted to increase sensitivity (See Figure 13).
Another way of customizing the method is to eliminate theFMOC derivatization step in the injector program and modifythe gradient if secondary amino acids are not important. [7]
Sensitivity increases when a longer flow cell path is used
15
Conclusion
An automated online derivatization method for amino acidswas enhanced using Agilent ZORBAX Eclipse Plus C18columns in ten column dimensions including length, columnid, and three particle sizes. The variety of column choicesoffers the analyst high resolution, high speed, reduced sol-vent consumption, or a combination that bests suits hisneeds.
The 2.1 × 150 mm, 3.5 µm column produces a chromatogrammost similar to the AminoQuant method. Another benefit ofthis protocol over previous iterations is the flexibility to trans-fer the method between one type of LC system to another,such as a quaternary pump LC to a binary pump LC, or a 400-bar LC (Agilent 1100) to a 600-bar LC (Agilent 1200 SL).This protocol also gives better retention of the first two elut-ing amino acids, aspartic and glutamic acid. Method rugged-ness was demonstrated by longevity, batch-to-batch and lin-earity testing, and ability for customization. The ZORBAXEclipse Plus C18 columns coupled with reliable Agilent LCinstrumentation and proven automated online derivatizationadvanced the analysis of free amino acids.
References
1. Rainer Schuster and Alex Apfel, Hewlett-Packard App.Note, Pub.# 5954-6257 (1986)
2. Rainer Schuster, J. Chromatogr., 431, 271-284 (1988)
3. Herbert Godel, Petra Seitz, and Martin Verhoef, LC-GCInternational, 5(2), 44-49 (1992)
4. John W. Henderson Jr, Robert D. Ricker, Brian A.Bidlingmeyer, and Cliff Woodward, "Rapid, Accurate,Sensitive and Reproducible HPLC Analysis of AminoAcids" Agilent Pub.# 5980-1193E (2000)
5. Cliff Woodward, John W Henderson Jr. and ToddWielgos, "High-Speed Amino Acid Analysis (AAA) onSub-Two Micron Reversed-phase (RP) Columns" AgilentPub.# 5989-6297EN (2007)
6. Angelika Gratzfeld-Huesgen, "Sensitive and ReliableAmino Acid Analysis in Protein Hydrolysates using theAgilent 1100 Series HPLC" Agilent Pub.# 5968-5658EN(1999)
7. Jason Greene, John W. Henderson Jr., John P. Wikswo,"Rapid and Precise Determination of Cellular Amino AcidFlux Rates Using HPLC with Automated Derivatizationwith Absorbance Detection" Agilent Pub.# 5990-3283EN(2009)
www.agilent.com/chem
Agilent shall not be liable for errors contained herein orfor incidental or consequential damages in connectionwith the furnishing, performance, or use of this material.
Information, descriptions, and specifications in this publication are subject to change without notice.
© Agilent Technologies, Inc., 2010Printed in the USAApril 6, 20105990-4547EN
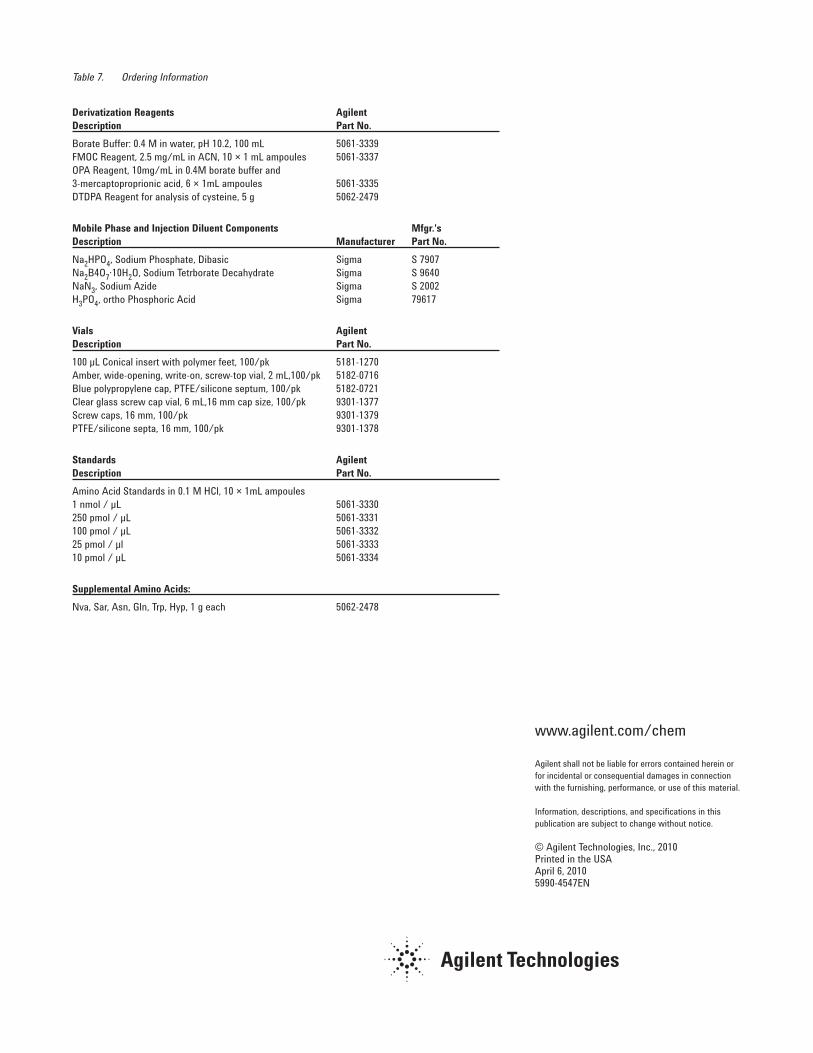
Derivatization Reagents AgilentDescription Part No.
Borate Buffer: 0.4 M in water, pH 10.2, 100 mL 5061-3339FMOC Reagent, 2.5 mg/mL in ACN, 10 × 1 mL ampoules 5061-3337OPA Reagent, 10mg/mL in 0.4M borate buffer and3-mercaptoproprionic acid, 6 × 1mL ampoules 5061-3335DTDPA Reagent for analysis of cysteine, 5 g 5062-2479
Mobile Phase and Injection Diluent Components Mfgr.'sDescription Manufacturer Part No.
Na2HPO4, Sodium Phosphate, Dibasic Sigma S 7907Na2B4O7·10H2O, Sodium Tetrborate Decahydrate Sigma S 9640NaN3, Sodium Azide Sigma S 2002H3PO4, ortho Phosphoric Acid Sigma 79617
Vials AgilentDescription Part No.
100 µL Conical insert with polymer feet, 100/pk 5181-1270Amber, wide-opening, write-on, screw-top vial, 2 mL,100/pk 5182-0716Blue polypropylene cap, PTFE/silicone septum, 100/pk 5182-0721Clear glass screw cap vial, 6 mL,16 mm cap size, 100/pk 9301-1377Screw caps, 16 mm, 100/pk 9301-1379PTFE/silicone septa, 16 mm, 100/pk 9301-1378
Standards AgilentDescription Part No.
Amino Acid Standards in 0.1 M HCl, 10 × 1mL ampoules1 nmol / µL 5061-3330250 pmol / µL 5061-3331100 pmol / µL 5061-333225 pmol / µl 5061-333310 pmol / µL 5061-3334
Supplemental Amino Acids:
Nva, Sar, Asn, Gln, Trp, Hyp, 1 g each 5062-2478
Table 7. Ordering Information