implications of population growth and urbanization on agricultural risks in china
TRANSCRIPT
ORI GIN AL PA PER
Implications of population growth and urbanizationon agricultural risks in China
G. Fischer • W. Winiwarter • G. Y. Cao •
T. Ermolieva • E. Hizsnyik • Z. Klimont • D. Wiberg •
X. Y. Zheng
Published online: 10 May 2011
� Springer Science+Business Media, LLC 2011
Abstract Growing population, rapid urbanization, rising incomes, and changing
consumption preferences stimulate intensification of livestock production and
excessive fertilization of crops in China. We present an innovative approach that
sheds light on options to prevent negative environmental consequences of food
production. Trends indicate that agricultural production expansion will take place in
‘‘profitable’’ locations around densely populated areas, where there are generally
insufficient natural resources to recycle production wastes. This will likely lead to
increased environmental impacts and risks to human health, with the largest impacts
in close proximity to population hotspots. We identify trends in Chinese agricultural
production and devise and compare feasible mitigation scenarios. We present a
spatial allocation procedure that facilitates management of agricultural production
expansion, accounting for environmental and health constraints. This procedure,
based on behavioral principles, uses a spatial risk preference structure induced by
local conditions, including environment, production, and demand, with important
research and policy implications.
Keywords Population growth � Urbanization � Agriculture � Intensification �Environment � Pollution � Health � Spatial planning of production expansion �China � Demography
G. Fischer � W. Winiwarter � G. Y. Cao � T. Ermolieva (&) � E. Hizsnyik �Z. Klimont � D. Wiberg
International Institute for Applied Systems Analysis (IIASA),
Schlossplatz 1, 2361 Laxenburg, Austria
e-mail: [email protected]
W. Winiwarter
Austrian Institute of Technology (AIT), Donau-City Str. 1, 1220 Vienna, Austria
X. Y. Zheng
Population Institute, Beijing University, Beijing, China
123
Popul Environ (2012) 33:243–258
DOI 10.1007/s11111-011-0134-4
Introduction
Economic–demographic growth, urbanization and, consequently, changing con-
sumption preferences have altered the structure of agricultural production systems
in China (Ma et al. 2004). These factors have furthermore promoted industrial
agriculture geared toward making use of economies of scale to produce the highest
output at the lowest cost. Although such intensification has brought about many
positive effects, it also carries significant disadvantages, risks, and costs. Environ-
mental impacts and health hazards have increased awareness and underlined the
need to identify steps to be taken to achieve sustainable agriculture.
One of the main contributors to agricultural pollution in China is intensive
livestock production. Traditional livestock farming was based on a natural farming
cycle. Lack of nitrogen for agriculture required minimization of wastage. Thus,
manure was used as the main fertilizer, preventing leakage of nitrogen compounds
and avoiding environmental degradation. However, the natural farming cycle has
been replaced by large-scale livestock production, in particular pig and poultry
production. Intensive livestock production enterprises are located in close proximity
to meat and feed markets near urban areas, and such livestock concentration often
exceeds the limits for adequate disposal of manure and waste on land to be recycled.
Combined with intensive crop cultivation, the excess nutrients problem is further
exacerbated by imbalanced fertilizer application.
Intensive agricultural land use and the management of crop and livestock
production cause significant emissions of methane (CH4) and nitrous oxide (N2O)
into the atmosphere, both of which are radiatively active and contribute to global
warming. Excess leaching of nitrogen into groundwater and rivers, as well as the
volatilization of ammonia (NH3) and nitrogen oxides (NOx), contributes to regional
and local air quality problems, causes the acidification and eutrophication of
ecosystems, and compromises human health. Pollution of the atmosphere, water,
and soil resources by residues of intensive crop and livestock production has already
become a serious environmental issue in China (Edwards and Daniel 1994;
Steinfeld et al. 1997; Wang 2005). Without appropriate measures, the trend will
become severe and may even become irreversible in some areas. As we show below,
even with efforts to control environmental impacts, China’s national-level
environmental deterioration may increase by roughly one-third to nearly half (see
also Ermolieva et al. 2009; Fischer et al. 2010).
In this paper, we compile the results of recent studies (Ermolieva et al. 2005,
2009; Fischer et al. 2007, 2008, 2009, 2010) to analyze how the dynamic and rapid
pace of China’s economic growth and demographic transition have affected the
agricultural sector, the extent and geographical heterogeneities of production, and
the spatial distribution of induced environmental impacts. The following section
highlights the main factors and trends underlying agricultural intensification in
China. We use these factors as indicators to guide production allocation within
acceptable health, air, and water pollution thresholds. The subsequent section
summarizes our numerical results, which are described in detail in the studies of
Fischer et al. (2007, 2008, 2009) based on different model settings, with the
objective of illustrating how the inclusion of risk indicators in the agricultural
244 Popul Environ (2012) 33:243–258
123
planning model can decrease environmental pollution and exposure to health risks.
We present our conclusions in the final section.
Urban transformations and agricultural developments in China
Agricultural intensification processes in China are largely attributable to the
country’s economic growth. Among the key factors for rapid economic develop-
ment are population growth and structural labor transformations, in particular the
migration of workers from agricultural inland regions to manufacturing jobs in
coastal China (Huang et al. 2003). Despite the large-scale reallocation of labor from
agricultural to non-agricultural sectors and the migration from rural to urban areas,
the productivity disparity between urban industry and the agricultural sector is still
substantial, continues to increase (Keyzer and van Veen 2005), and will likely result
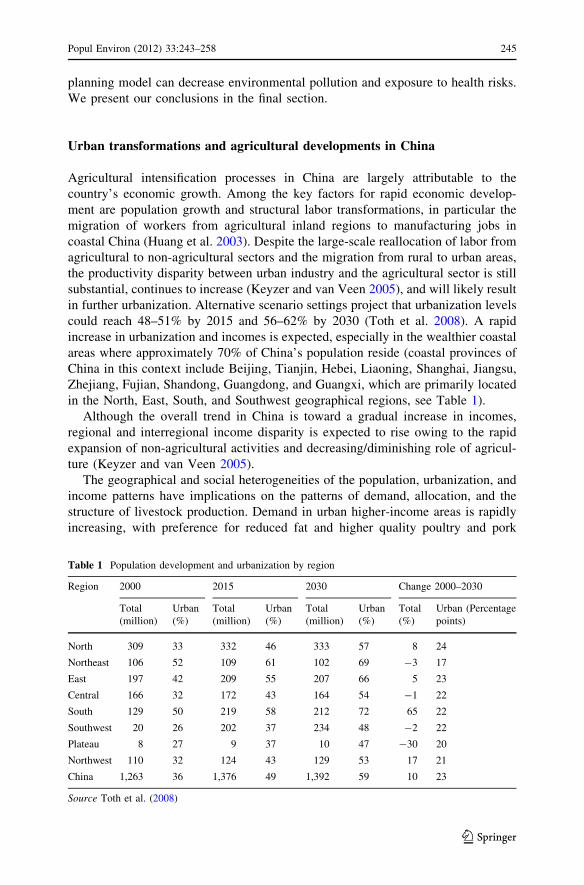
in further urbanization. Alternative scenario settings project that urbanization levels
could reach 48–51% by 2015 and 56–62% by 2030 (Toth et al. 2008). A rapid
increase in urbanization and incomes is expected, especially in the wealthier coastal
areas where approximately 70% of China’s population reside (coastal provinces of
China in this context include Beijing, Tianjin, Hebei, Liaoning, Shanghai, Jiangsu,
Zhejiang, Fujian, Shandong, Guangdong, and Guangxi, which are primarily located
in the North, East, South, and Southwest geographical regions, see Table 1).
Although the overall trend in China is toward a gradual increase in incomes,
regional and interregional income disparity is expected to rise owing to the rapid
expansion of non-agricultural activities and decreasing/diminishing role of agricul-
ture (Keyzer and van Veen 2005).
The geographical and social heterogeneities of the population, urbanization, and
income patterns have implications on the patterns of demand, allocation, and the
structure of livestock production. Demand in urban higher-income areas is rapidly
increasing, with preference for reduced fat and higher quality poultry and pork
Table 1 Population development and urbanization by region
Region 2000 2015 2030 Change 2000–2030
Total
(million)
Urban
(%)
Total
(million)
Urban
(%)
Total
(million)
Urban
(%)
Total
(%)
Urban (Percentage
points)
North 309 33 332 46 333 57 8 24
Northeast 106 52 109 61 102 69 -3 17
East 197 42 209 55 207 66 5 23
Central 166 32 172 43 164 54 -1 22
South 129 50 219 58 212 72 65 22
Southwest 20 26 202 37 234 48 -2 22
Plateau 8 27 9 37 10 47 -30 20
Northwest 110 32 124 43 129 53 17 21
China 1,263 36 1,376 49 1,392 59 10 23
Source Toth et al. (2008)
Popul Environ (2012) 33:243–258 245
123
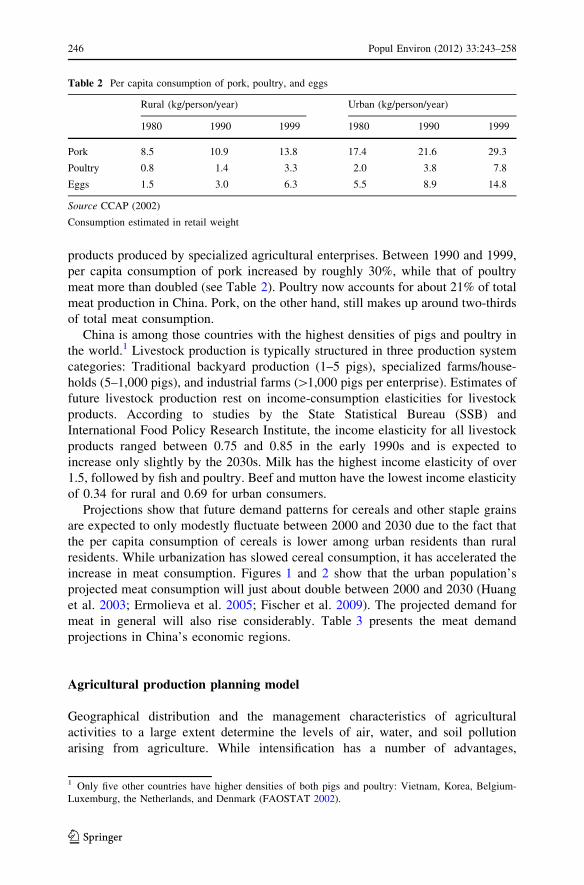
products produced by specialized agricultural enterprises. Between 1990 and 1999,
per capita consumption of pork increased by roughly 30%, while that of poultry
meat more than doubled (see Table 2). Poultry now accounts for about 21% of total
meat production in China. Pork, on the other hand, still makes up around two-thirds
of total meat consumption.
China is among those countries with the highest densities of pigs and poultry in
the world.1 Livestock production is typically structured in three production system
categories: Traditional backyard production (1–5 pigs), specialized farms/house-
holds (5–1,000 pigs), and industrial farms ([1,000 pigs per enterprise). Estimates of
future livestock production rest on income-consumption elasticities for livestock
products. According to studies by the State Statistical Bureau (SSB) and
International Food Policy Research Institute, the income elasticity for all livestock
products ranged between 0.75 and 0.85 in the early 1990s and is expected to
increase only slightly by the 2030s. Milk has the highest income elasticity of over
1.5, followed by fish and poultry. Beef and mutton have the lowest income elasticity
of 0.34 for rural and 0.69 for urban consumers.
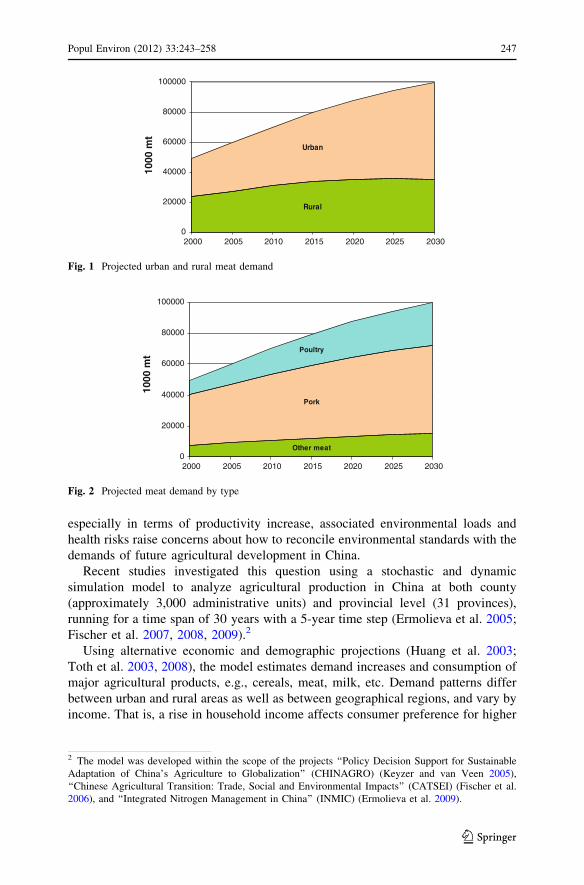
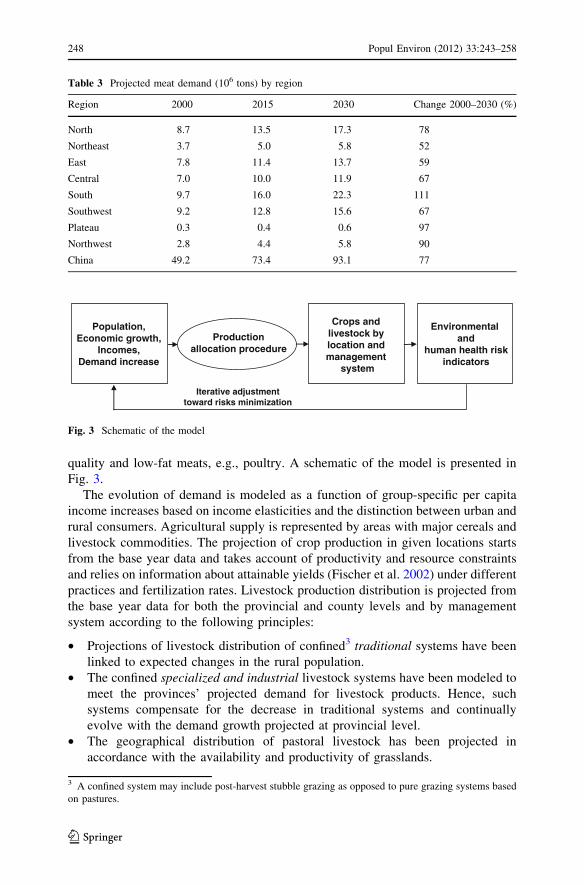
Projections show that future demand patterns for cereals and other staple grains
are expected to only modestly fluctuate between 2000 and 2030 due to the fact that
the per capita consumption of cereals is lower among urban residents than rural
residents. While urbanization has slowed cereal consumption, it has accelerated the
increase in meat consumption. Figures 1 and 2 show that the urban population’s
projected meat consumption will just about double between 2000 and 2030 (Huang
et al. 2003; Ermolieva et al. 2005; Fischer et al. 2009). The projected demand for
meat in general will also rise considerably. Table 3 presents the meat demand
projections in China’s economic regions.
Agricultural production planning model
Geographical distribution and the management characteristics of agricultural
activities to a large extent determine the levels of air, water, and soil pollution
arising from agriculture. While intensification has a number of advantages,
Table 2 Per capita consumption of pork, poultry, and eggs
Rural (kg/person/year) Urban (kg/person/year)
1980 1990 1999 1980 1990 1999
Pork 8.5 10.9 13.8 17.4 21.6 29.3
Poultry 0.8 1.4 3.3 2.0 3.8 7.8
Eggs 1.5 3.0 6.3 5.5 8.9 14.8
Source CCAP (2002)
Consumption estimated in retail weight
1 Only five other countries have higher densities of both pigs and poultry: Vietnam, Korea, Belgium-
Luxemburg, the Netherlands, and Denmark (FAOSTAT 2002).
246 Popul Environ (2012) 33:243–258
123
especially in terms of productivity increase, associated environmental loads and
health risks raise concerns about how to reconcile environmental standards with the
demands of future agricultural development in China.
Recent studies investigated this question using a stochastic and dynamic
simulation model to analyze agricultural production in China at both county
(approximately 3,000 administrative units) and provincial level (31 provinces),
running for a time span of 30 years with a 5-year time step (Ermolieva et al. 2005;
Fischer et al. 2007, 2008, 2009).2
Using alternative economic and demographic projections (Huang et al. 2003;
Toth et al. 2003, 2008), the model estimates demand increases and consumption of
major agricultural products, e.g., cereals, meat, milk, etc. Demand patterns differ
between urban and rural areas as well as between geographical regions, and vary by
income. That is, a rise in household income affects consumer preference for higher
Rural
Urban
0
20000
40000
60000
80000
100000
2000 2005 2010 2015 2020 2025 2030
1000
mt
Fig. 1 Projected urban and rural meat demand
Other meat
Pork
Poultry
0
20000
40000
60000
80000
100000
2000 2005 2010 2015 2020 2025 2030
1000
mt
Fig. 2 Projected meat demand by type
2 The model was developed within the scope of the projects ‘‘Policy Decision Support for Sustainable
Adaptation of China’s Agriculture to Globalization’’ (CHINAGRO) (Keyzer and van Veen 2005),
‘‘Chinese Agricultural Transition: Trade, Social and Environmental Impacts’’ (CATSEI) (Fischer et al.
2006), and ‘‘Integrated Nitrogen Management in China’’ (INMIC) (Ermolieva et al. 2009).
Popul Environ (2012) 33:243–258 247
123
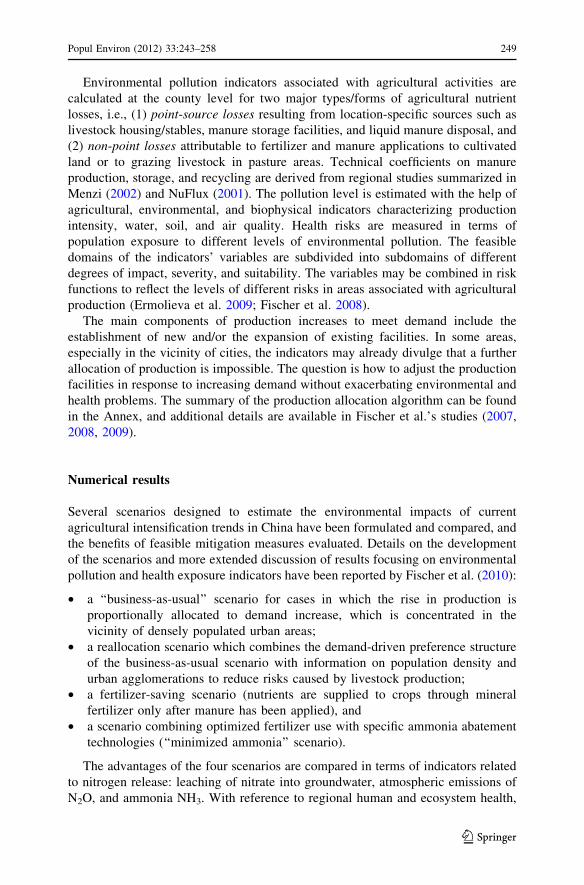
quality and low-fat meats, e.g., poultry. A schematic of the model is presented in
Fig. 3.
The evolution of demand is modeled as a function of group-specific per capita
income increases based on income elasticities and the distinction between urban and
rural consumers. Agricultural supply is represented by areas with major cereals and
livestock commodities. The projection of crop production in given locations starts
from the base year data and takes account of productivity and resource constraints
and relies on information about attainable yields (Fischer et al. 2002) under different
practices and fertilization rates. Livestock production distribution is projected from
the base year data for both the provincial and county levels and by management
system according to the following principles:
• Projections of livestock distribution of confined3 traditional systems have been
linked to expected changes in the rural population.
• The confined specialized and industrial livestock systems have been modeled to
meet the provinces’ projected demand for livestock products. Hence, such
systems compensate for the decrease in traditional systems and continually
evolve with the demand growth projected at provincial level.
• The geographical distribution of pastoral livestock has been projected in
accordance with the availability and productivity of grasslands.
Table 3 Projected meat demand (106 tons) by region
Region 2000 2015 2030 Change 2000–2030 (%)
North 8.7 13.5 17.3 78
Northeast 3.7 5.0 5.8 52
East 7.8 11.4 13.7 59
Central 7.0 10.0 11.9 67
South 9.7 16.0 22.3 111
Southwest 9.2 12.8 15.6 67
Plateau 0.3 0.4 0.6 97
Northwest 2.8 4.4 5.8 90
China 49.2 73.4 93.1 77
Productionallocation procedure
Population,Economic growth,
Incomes,Demand increase
Crops andlivestock bylocation andmanagement
system
Environmental and
human health riskindicators
Iterative adjustmenttoward risks minimization
Fig. 3 Schematic of the model
3 A confined system may include post-harvest stubble grazing as opposed to pure grazing systems based
on pastures.
248 Popul Environ (2012) 33:243–258
123
Environmental pollution indicators associated with agricultural activities are
calculated at the county level for two major types/forms of agricultural nutrient
losses, i.e., (1) point-source losses resulting from location-specific sources such as
livestock housing/stables, manure storage facilities, and liquid manure disposal, and
(2) non-point losses attributable to fertilizer and manure applications to cultivated
land or to grazing livestock in pasture areas. Technical coefficients on manure
production, storage, and recycling are derived from regional studies summarized in
Menzi (2002) and NuFlux (2001). The pollution level is estimated with the help of
agricultural, environmental, and biophysical indicators characterizing production
intensity, water, soil, and air quality. Health risks are measured in terms of
population exposure to different levels of environmental pollution. The feasible
domains of the indicators’ variables are subdivided into subdomains of different
degrees of impact, severity, and suitability. The variables may be combined in risk
functions to reflect the levels of different risks in areas associated with agricultural
production (Ermolieva et al. 2009; Fischer et al. 2008).
The main components of production increases to meet demand include the
establishment of new and/or the expansion of existing facilities. In some areas,
especially in the vicinity of cities, the indicators may already divulge that a further
allocation of production is impossible. The question is how to adjust the production
facilities in response to increasing demand without exacerbating environmental and
health problems. The summary of the production allocation algorithm can be found
in the Annex, and additional details are available in Fischer et al.’s studies (2007,
2008, 2009).
Numerical results
Several scenarios designed to estimate the environmental impacts of current
agricultural intensification trends in China have been formulated and compared, and
the benefits of feasible mitigation measures evaluated. Details on the development
of the scenarios and more extended discussion of results focusing on environmental
pollution and health exposure indicators have been reported by Fischer et al. (2010):
• a ‘‘business-as-usual’’ scenario for cases in which the rise in production is
proportionally allocated to demand increase, which is concentrated in the
vicinity of densely populated urban areas;
• a reallocation scenario which combines the demand-driven preference structure
of the business-as-usual scenario with information on population density and
urban agglomerations to reduce risks caused by livestock production;
• a fertilizer-saving scenario (nutrients are supplied to crops through mineral
fertilizer only after manure has been applied), and
• a scenario combining optimized fertilizer use with specific ammonia abatement
technologies (‘‘minimized ammonia’’ scenario).
The advantages of the four scenarios are compared in terms of indicators related
to nitrogen release: leaching of nitrate into groundwater, atmospheric emissions of
N2O, and ammonia NH3. With reference to regional human and ecosystem health,
Popul Environ (2012) 33:243–258 249
123
excess leaching of nitrogen into groundwater and rivers, as well as the volatilization
of ammonia (NH3) and nitrogen oxides (NOx), contributes to regional and local air
quality problems, acidification, and eutrophication of ecosystems and damages
human health. With regard to the global environment and climate change, nitrogen
attributable to agriculture produces significant emissions of nitrous oxide (N2O) gas
into the atmosphere. Our aim is not to identify a scenario allowing for a complete
nitrogen balance, but rather to derive a set of robust nitrogen-related indicators that
enable measurement of environmental impacts from agricultural activities and to
estimate pollution mitigation options without compromising food security targets.
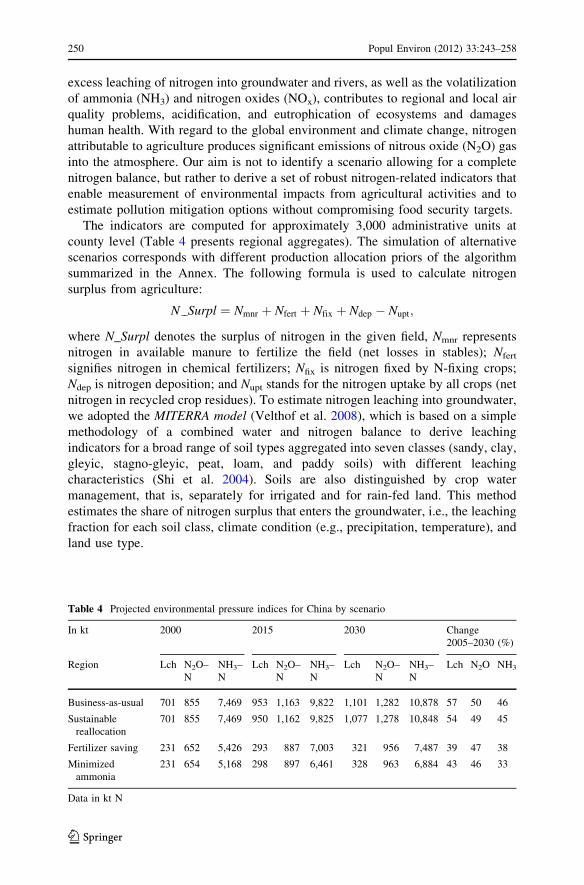
The indicators are computed for approximately 3,000 administrative units at
county level (Table 4 presents regional aggregates). The simulation of alternative
scenarios corresponds with different production allocation priors of the algorithm
summarized in the Annex. The following formula is used to calculate nitrogen
surplus from agriculture:
N Surpl ¼ Nmnr þ Nfert þ Nfix þ Ndep � Nupt;
where N_Surpl denotes the surplus of nitrogen in the given field, Nmnr represents
nitrogen in available manure to fertilize the field (net losses in stables); Nfert
signifies nitrogen in chemical fertilizers; Nfix is nitrogen fixed by N-fixing crops;
Ndep is nitrogen deposition; and Nupt stands for the nitrogen uptake by all crops (net
nitrogen in recycled crop residues). To estimate nitrogen leaching into groundwater,
we adopted the MITERRA model (Velthof et al. 2008), which is based on a simple
methodology of a combined water and nitrogen balance to derive leaching
indicators for a broad range of soil types aggregated into seven classes (sandy, clay,
gleyic, stagno-gleyic, peat, loam, and paddy soils) with different leaching
characteristics (Shi et al. 2004). Soils are also distinguished by crop water
management, that is, separately for irrigated and for rain-fed land. This method
estimates the share of nitrogen surplus that enters the groundwater, i.e., the leaching
fraction for each soil class, climate condition (e.g., precipitation, temperature), and
land use type.
Table 4 Projected environmental pressure indices for China by scenario
In kt 2000 2015 2030 Change
2005–2030 (%)
Region Lch N2O–
N
NH3–
N
Lch N2O–
N
NH3–
N
Lch N2O–
N
NH3–
N
Lch N2O NH3
Business-as-usual 701 855 7,469 953 1,163 9,822 1,101 1,282 10,878 57 50 46
Sustainable
reallocation
701 855 7,469 950 1,162 9,825 1,077 1,278 10,848 54 49 45
Fertilizer saving 231 652 5,426 293 887 7,003 321 956 7,487 39 47 38
Minimized
ammonia
231 654 5,168 298 897 6,461 328 963 6,884 43 46 33
Data in kt N
250 Popul Environ (2012) 33:243–258
123
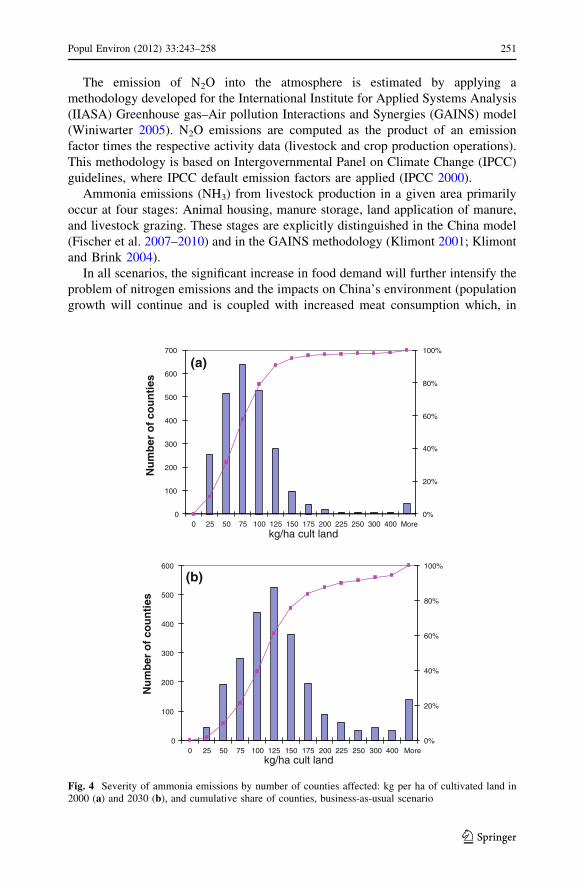
The emission of N2O into the atmosphere is estimated by applying a
methodology developed for the International Institute for Applied Systems Analysis
(IIASA) Greenhouse gas–Air pollution Interactions and Synergies (GAINS) model
(Winiwarter 2005). N2O emissions are computed as the product of an emission
factor times the respective activity data (livestock and crop production operations).
This methodology is based on Intergovernmental Panel on Climate Change (IPCC)
guidelines, where IPCC default emission factors are applied (IPCC 2000).
Ammonia emissions (NH3) from livestock production in a given area primarily
occur at four stages: Animal housing, manure storage, land application of manure,
and livestock grazing. These stages are explicitly distinguished in the China model
(Fischer et al. 2007–2010) and in the GAINS methodology (Klimont 2001; Klimont
and Brink 2004).
In all scenarios, the significant increase in food demand will further intensify the
problem of nitrogen emissions and the impacts on China’s environment (population
growth will continue and is coupled with increased meat consumption which, in
0
100
200
300
400
500
600
700
kg/ha cult land
Nu
mb
er o
f co
un
ties
0%
20%
40%
60%
80%
100%
0
100
200
300
400
500
600
0 25 50 75 100 125 150 175 200 225 250 300 400 More
0 25 50 75 100 125 150 175 200 225 250 300 400 More
Nu
mb
er o
f co
un
ties
0%
20%
40%
60%
80%
100%
kg/ha cult land
(a)
(b)
Fig. 4 Severity of ammonia emissions by number of counties affected: kg per ha of cultivated land in2000 (a) and 2030 (b), and cumulative share of counties, business-as-usual scenario
Popul Environ (2012) 33:243–258 251
123
turn, increases the amount of nitrogen fertilizer required). A qualitative comparison
across the scenarios reveals that the absolute values of the environmental indicators
do not change much in the sustainable reallocation scenario in comparison with the
business-as-usual scenario. Exposure to environmental and health impacts,
measured in terms of population and severity (i.e., of ammonia emissions),
decreases considerably in the second scenario due to a production shift away from
population centers to areas with a better production resource balance. Fischer et al.
(2007) found that the reallocation scenario offers a solution that corresponds to the
0
50
100
150
200
250
300
350
> 300
250 - 300
200 - 250
150 - 200
100 - 150
50 - 100
< 50
N NE E C S SW NW 0.0 0.2 0.4 0.6 0.8 1.0
N
NE
E
C
S
SW
NW
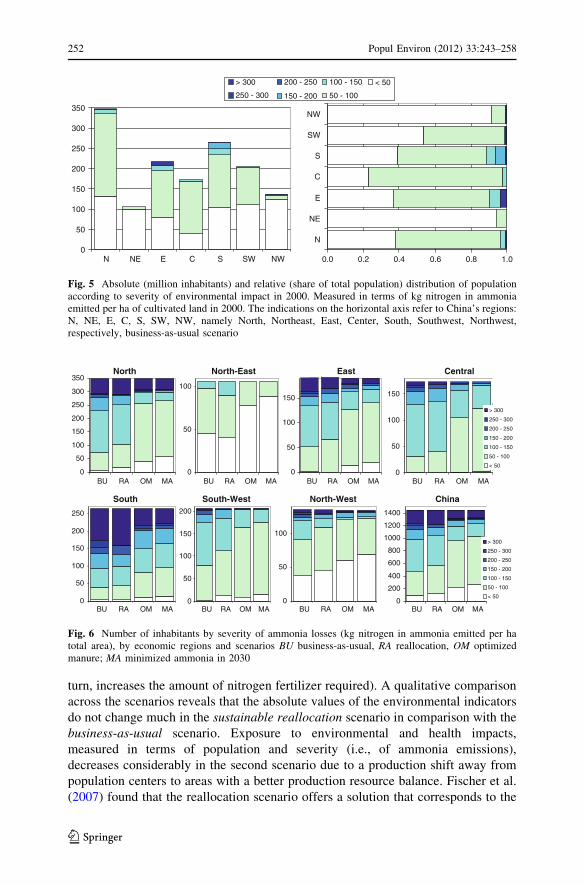
Fig. 5 Absolute (million inhabitants) and relative (share of total population) distribution of populationaccording to severity of environmental impact in 2000. Measured in terms of kg nitrogen in ammoniaemitted per ha of cultivated land in 2000. The indications on the horizontal axis refer to China’s regions:N, NE, E, C, S, SW, NW, namely North, Northeast, East, Center, South, Southwest, Northwest,respectively, business-as-usual scenario
North North-East East Central
0
50
100
150
200
250
300
350
0
50
100
0
50
100
150
0
50
100
150
> 300
250 - 300
200 - 250
150 - 200
100 - 150
50 - 100
< 50
South South-West North-West China
0
50
100
150
200
250
0
50
100
150
200
0
50
100
BU RA OM MA BU RA OM MA BU RA OM MA BU RA OM MA
BU RA OM MA BU RA OM MA BU RA OM MA0
200
400
600
800
1000
1200
1400
BU RA OM MA
> 300
250 - 300
200 - 250
150 - 200
100 - 150
50 - 100
< 50
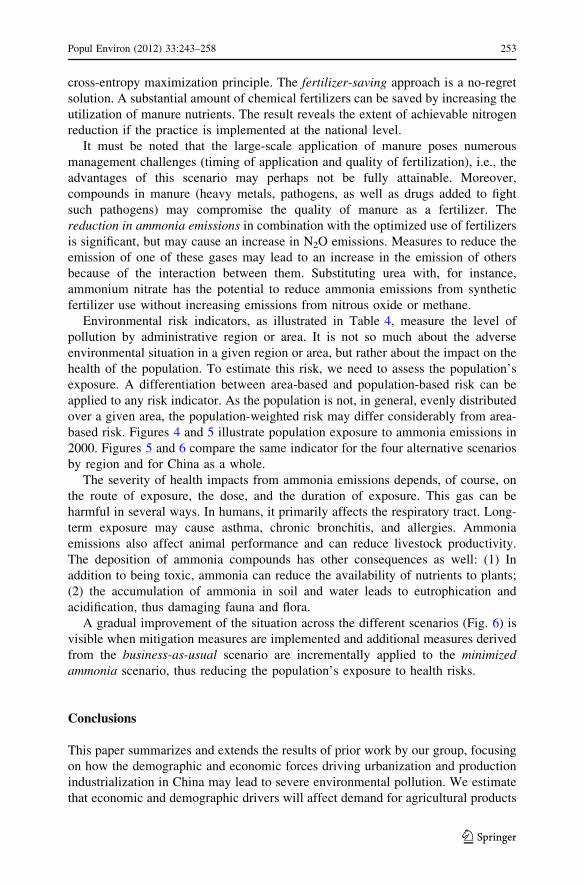
Fig. 6 Number of inhabitants by severity of ammonia losses (kg nitrogen in ammonia emitted per hatotal area), by economic regions and scenarios BU business-as-usual, RA reallocation, OM optimizedmanure; MA minimized ammonia in 2030
252 Popul Environ (2012) 33:243–258
123
cross-entropy maximization principle. The fertilizer-saving approach is a no-regret
solution. A substantial amount of chemical fertilizers can be saved by increasing the
utilization of manure nutrients. The result reveals the extent of achievable nitrogen
reduction if the practice is implemented at the national level.
It must be noted that the large-scale application of manure poses numerous
management challenges (timing of application and quality of fertilization), i.e., the
advantages of this scenario may perhaps not be fully attainable. Moreover,
compounds in manure (heavy metals, pathogens, as well as drugs added to fight
such pathogens) may compromise the quality of manure as a fertilizer. The
reduction in ammonia emissions in combination with the optimized use of fertilizers
is significant, but may cause an increase in N2O emissions. Measures to reduce the
emission of one of these gases may lead to an increase in the emission of others
because of the interaction between them. Substituting urea with, for instance,
ammonium nitrate has the potential to reduce ammonia emissions from synthetic
fertilizer use without increasing emissions from nitrous oxide or methane.
Environmental risk indicators, as illustrated in Table 4, measure the level of
pollution by administrative region or area. It is not so much about the adverse
environmental situation in a given region or area, but rather about the impact on the
health of the population. To estimate this risk, we need to assess the population’s
exposure. A differentiation between area-based and population-based risk can be
applied to any risk indicator. As the population is not, in general, evenly distributed
over a given area, the population-weighted risk may differ considerably from area-
based risk. Figures 4 and 5 illustrate population exposure to ammonia emissions in
2000. Figures 5 and 6 compare the same indicator for the four alternative scenarios
by region and for China as a whole.
The severity of health impacts from ammonia emissions depends, of course, on
the route of exposure, the dose, and the duration of exposure. This gas can be
harmful in several ways. In humans, it primarily affects the respiratory tract. Long-
term exposure may cause asthma, chronic bronchitis, and allergies. Ammonia
emissions also affect animal performance and can reduce livestock productivity.
The deposition of ammonia compounds has other consequences as well: (1) In
addition to being toxic, ammonia can reduce the availability of nutrients to plants;
(2) the accumulation of ammonia in soil and water leads to eutrophication and
acidification, thus damaging fauna and flora.
A gradual improvement of the situation across the different scenarios (Fig. 6) is
visible when mitigation measures are implemented and additional measures derived
from the business-as-usual scenario are incrementally applied to the minimizedammonia scenario, thus reducing the population’s exposure to health risks.
Conclusions
This paper summarizes and extends the results of prior work by our group, focusing
on how the demographic and economic forces driving urbanization and production
industrialization in China may lead to severe environmental pollution. We estimate
that economic and demographic drivers will affect demand for agricultural products
Popul Environ (2012) 33:243–258 253
123
in China. While rapid economic growth and urbanization are likely to slow cereal
consumption, the increase in meat consumption will accelerate. Urban diets include
higher consumption of meat, and per capita meat consumption is strongly linked to
income growth. We project that the consumption of livestock will have roughly
doubled by 2030. We contend that both income growth and the rising number of
consumers who adopt an urban lifestyle will reinforce an increase in meat
consumption. At the projected levels of per capita meat consumption, China would
approach the current per capita meat consumption in industrialized countries.
According to current trends, production expansion to meet this increased demand
will take place in ‘‘profitable’’ locations around densely populated areas, which are
generally characterized by an insufficiency of natural resources to recycle
production waste. Consequently, an increase in environmental impacts is expected.
Four scenarios were used to estimate future environmental impacts, on the one hand,
and to determine the level of remediation that is feasible, on the other. The scenarios
describe an economic and ecological condition without providing details on the
process of implementation. Hence, drivers and consequences of agricultural
intensification were used to compile indicators of environmental pollution and
health risks. Health risks were measured as a coincidence of several factors
including population density, urbanization, production intensification level, and
available livestock facilities.
To measure environmental pollution, nitrate leaching into groundwater and
nitrous oxide and ammonia emissions into the atmosphere were used. Although the
results of the four scenarios clearly differ for the individual economic regions, the
level of pollution is likely to increase in all cases. Even in scenarios (3) and (4)
which carry considerable improvements, China’s environmental deterioration
increases by roughly one-third to nearly half. Nitrogen losses in the form of
ammonia pose the biggest problem by far in all four scenarios. Losses in the form of
N2O follow, while nitrate leaching is of less importance. This is attributable to the
huge losses in the gas phase, while the leaching fractions (which are relatively
small) only apply to excess soil nitrogen not already lost or used elsewhere. Also,
leaching does not include nitrate runoff to surface water. Under such inherent
uncertainties, the estimates of nitrogen fluxes serve as indicators of environmental
risks in China’s environment. Therefore, changes which are attributable to the
implemented measures are considered robust. Combining the indicators allows for
an assessment of the population’s exposure to environmental loads from agriculture
under alternative demographic or socioeconomic scenarios and to make policy
recommendations. Relying on the estimates of these indicators, it is also possible to
supervise future production expansion based on the mitigation and minimization of
environmental and health risks.
The procedure to geographically allocate livestock production according to
different criteria is based on behavioral principles and a spatial risk preference
structure. The proposed algorithm converges to the solutions maximizing a cross-
entropy function, which provides results that reflect the maximum likelihood
solutions (Fischer et al. 2007, 2008). When applying a top-down model to China,
numerous details are obviously overlooked. The resulting indicators provide for a
better understanding of potential loads and assign the preference structure to areas
254 Popul Environ (2012) 33:243–258
123
where further studies are necessary or where mitigation measures have to urgently
be geared toward specific goals. The general preference structure for the efficiency
of specific measures (combined in different scenarios) can also be deduced based on
our approach.
Annex: Production allocation algorithm
Let us briefly summarize the production allocation algorithm (for more details, see
Fischer et al. 2007–2009). The objective is to allocate new supply facilities in the
best way possible to meet the projected increases in national demand di for livestock
products i among the production activities/locations k, k ¼ 1;K while considering
various risk indicators. In the following model, the risks are treated as constraints on
production expansion (similar to ambient targets in pollution control models).
Therefore, the problem is formulated to determine suitable activity levels yik given
the constraints:X
k
yik ¼ di; ð1Þ
yik� 0; ð2ÞX
i
yik � bk; i ¼ 1;m; k ¼ 1;K; ð3Þ
where bk denotes thresholds for environmental and health risks and imposes
limitations to an increase in production of system or location k, k ¼ 1;K. Apart
from bk, there may be additional limits on yik, yik B rik which may be associated
with legislation, for example, to restrict production i to a production ‘‘belt’’ or to
exclude production i from urban or protected areas, etc. Thresholds bk and rik may
indicate that production exceeding these values is strictly prohibited. The procedure
may also allow for the thresholds to be exceeded while imposing taxes or requiring a
premium to be paid for the mitigation of certain risks. Equations 1–3 are well
established in the literature on type of transportation problems (Kantorovich 1942;
Koopman 1947). There may be more general constraints of typeP
i aikxik� di,
which require the proposed rebalancing approach to be expanded (see discussion in
Fischer et al. 2007).
In general, there may be infinite solutions to the Eqs. 1–3. The aim is to derive a
solution that provides for an appropriate balance between efficiency and risks. Here,
we can distinguish between two types of uncertainties that generate potential risks:
Behavioral or endogenous uncertainties which are addressed in the procedure and
associated with the allocation of new production capacities, and exogenous
uncertainties which are related to data and the model’s parameters are not addressed
in the current framework (see Fischer et al. 2007).
The available information on the current production facilities, the projected
demand increases, environmental thresholds, and costs are used to derive a prior
probability qik reflecting the assumption that a unit of demand di for product i should
be supplied by activity/location k. For instance, it is reasonable to allocate more
Popul Environ (2012) 33:243–258 255
123
livestock to areas with a higher demand increase, higher productivity, or better access
to animal feeds. This preference structure is expressed in prior qik,P
k qik ¼ 1 for all
i. The use of priors is consistent with spatial economic theory (see discussion, e.g., in
Fujita et al. 1999; Karlqvist et al. 1978). The likelihood qik can be modeled as
inversely proportional to production costs and inherent risks bk and rik. An initial
estimate of production i allocated to k can be derived as qikdi. This could, however,
result in a violation of applicable restrictions (3). Sequential rebalancing (Fischer
et al. 2006) proceeds as follows: We assume that—based on prior probability qik—
the expected initial allocation of di to k is y0ik ¼ qikdi i ¼ 1;m. As this allocation
may not comply with constraintP
i y0ik� bk j ¼ 1; n; the relative imbalances b0
k ¼bk=P
i y0ik are derived and updated z0
ik ¼ y0ikb
0k ; i ¼ 1;m. Now constraintP
i yik � bk is met, k = 1, 2,…, but the estimate z0ik may cause an imbalance for
relation (1), i.e.,P
k z0ik 6¼ di. Continue calculating a0
i ¼ di=P
k z0ik; i ¼ 1;m and
updating the imbalances y1ik ¼ z0
ika0i , etc. The estimate ys
ik can be represented as
ysik ¼ qk
ikdi, qsik ¼ qikb
s�1k
� �=P
j qikbs�1k
� �; i ¼ 1;m; k ¼ 1; 2; . . .. Assume ys ¼
ysik
� �has been calculated. Find bs
k ¼ bk=P
i ysik and qsþ1
ik ¼ qikbsj=P
i qikbsj
� �; i ¼
1;m; k ¼ 1; 2; . . .; etc.
In this form the procedure can be considered a redistribution of required supply di
among producers k = 1, 2,… by applying the sequential adjustment qsþ1ik , e.g., by
using a Bayesian-type rule to update the prior distribution: qsþ1ik ¼ qikb
sk=P
i qikbsk,
q0ik ¼ qik.
The iterative update of qik is based on an ‘observation’ of imbalances of the basic
constraints rather than calculated for observations of random variables. A
rebalancing procedure, similar to the one mentioned above for Hitchcock-
Koopmans’ transportation constraints (1)–(3), was proposed by G. V. Sheleikovskii
(for verification and references, see Bregman 1967) for the estimation of passenger
flows between regions. Verification of its convergence to the optimal solution
maximizing the cross-entropy functionX
i;kyik ln
yik
qikð4Þ
is provided in the study by Fischer et al. (2006) for general forms of constraints.
The alternative scenarios introduced in Sect. 4 correspond to different production
allocation priors qik, i ¼ 1;m; k ¼ 1;K, that guide the allocation procedure. The
priors’ aggregate variables include demand, environmental constraints, critical
health thresholds, and norms.
References
Bregman, L. M. (1967). Proof of the convergence of Sheleikhovskii’s method for a problem with
transportation constraints. Journal of Computational Mathematics and Mathematical Physics, 7(1),
191–204. Zhournal Vychislitel’noi Matematiki, Leningrad.
256 Popul Environ (2012) 33:243–258
123
Edwards, D. R., & Daniel, T. C. (1994). Quality of runoff from fescue grass plots treated with poultry
litter and inorganic fertilizer. Journal of Environmental Quality, 23, 579–584.
Ermolieva, T., Fischer, G., & van Velthuizen, H. (2005). Livestock production and environmental risks in
China: Scenarios to 2030. FAO/IIASA Research Report, International Institute for Applied Systems
Analysis.
Ermolieva, T., Winiwarter, W., Fischer, G., Cao, G.-Y., Klimont, Z., Schopp, W., Li, Y., & Asman, W.
A. H. (2009). Integrated nitrogen management in China. IIASA Interim Report IR-09-005,
International Institute for Applied Systems Analysis.
FAOSTAT. (2002). FAOSTAT data. Online access at http://faostat.fao.org, FAO, Rome.
Fischer, G., Cao, G. Y., Zheng, X. Y., Ermolieva, T., & Sun, L. (2008). Urbanization and livestock
production: Risk-adjusted approaches. Journal of Population and Developments, 14(6), 1668–1674.
Fischer, G., Ermolieva, T., Ermoliev, Y., & Sun, L. (2007). Integrated risk management approaches for
planning sustainable agriculture. In C. Huang, C. Frey, & J. Feng (Eds.), Advances in studies on riskanalysis and crisis response (pp. 24–30). Paris: Atlantis Press.
Fischer, G., Ermolieva, T., Ermoliev, Y., & Sun, L. (2009). Risk-adjusted approaches for planning
sustainable agricultural development. Stochastic Environmental Research and Risk Assessment,23(4), 441–450.
Fischer, G., Ermolieva, T., Ermoliev, Y., & van Velthuizen, H. T. (2006). Sequential downscaling
methods for estimation from aggregate data. In: K. Marti, Y. Ermoliev, M. Makowski, & G. Pflug
(Eds.), Coping with uncertainty, modeling and policy issues (pp. 155–169). Berlin, Germany:
Springer-Verlag.
Fischer, G., van Velthuizen, H. T., Shah, M. M., & Nachtergaele, F. O. (2002). Global agro-ecological
assessment for agriculture in the 21st century: Methodology and results. Research Report RR-02-02,
International Institute for Applied Systems Analysis.
Fischer, G., Winiwarter, W., Ermolieva, T., Cao, G.-Y., Qui, H., Klimont, Z., et al. (2010). Integrated
modeling framework for assessment and mitigation of nitrogen pollution from agriculture: Concept
and case study for China. Agriculture, Ecosystems & Environment, 136, 116–124.
Fujita, M., Krugman, P., & Venables, A. J. (1999). The spatial economy: Cities, regions, andinternational trade. Cambridge: The MIT Press.
Huang, J., Zhang, L., Li, Q., & Qiu, H. (2003). CHINAGRO project: National and regional economicdevelopment scenarios for China’s food economy projections in the early 21st century. Center for
Chinese Agricultural Policy, Beijing: Chinese Academy of Sciences.
IPCC. (2000). Good practice guidance and uncertainty management in national greenhouse gas
inventories. In J. Penman, D. Kruger, I. Galbally, T. Hiraishi, B. Nyenzi, S. Emmanuel, L. Buendia,
R. Hoppaus, T. Martinsen, J. Meijer, K. Miwa, & K. Tanabe (eds), IPCC National Greenhouse Gas
Inventories Programme, Institute for Global Environmental Strategies.
Kantorovich, L. V. (1942). On the translocation of masses. Compt. Rend. Acad. Sci. URSS, 37, 199–201.
Karlqvist, A., Lundqvist, L., Snickars, F., & Weibull, J. W. (1978). Studies in regional science and urbaneconomics: Spatial interaction theory and planning models (3rd ed.). Amsterdam: North-Holland
Publishing Company.
Keyzer, M. A., & van Veen, W. (2005). A summary description of the CHINAGRO-welfare model.CHINAGRO report, SOW-VU. Amsterdam: Free University.
Klimont, Z. (2001). Current and future emissions of ammonia in China. Paper presented at the 10th
annual emission inventory conference: one atmosphere, One inventory, many challenges. May 1–3,
Denver, USA.
Klimont, Z., & Brink, C. (2004). Modeling of emissions of air pollutants and greenhouse gases from
agricultural sources in Europe. IIASA interim REPORT IR-04-048, International Institute for
Applied Systems Analysis.
Koopman, T. C. (1947). Optimum utilization of the transportation system. Proceedings of theinternational statistical conferences Vol V. Washington, D.C.
Ma, H., Huang, J., Rozelle, S., & Rae, A. (2004). Chinese animal products consumption in the 1990s.
Australian Journal of Agricultural and Resource Economics, 48(4), 569–590.
Menzi, H. (2002). Estimation of excretions and average weight of different livestock categories in Asiaand Latin America: Methodology and results. Internal Working Paper prepared for FAO/LEAD.
Version February 13, 2000.
NuFlux. (2001). NuFlux-AWI, user manual for the NuFlux-AWI nutrient balance calculation program.
Main Manual, Zollikofen: Swiss College of Agriculture (SCA).
Popul Environ (2012) 33:243–258 257
123
Shi, X. Z., Yu, D. S., Warner, E. D., Pan, X. Z., Petersen, G. W., Gong, Z. G., et al. (2004). Soil database
of 1:1,000,000 digital soil survey and reference system of the Chinese genetic soil classification
system. Soil Survey Horizons, 45, 129–136.
Steinfeld, H., De Haan, C., & Blackburn, H. (1997). Livestock-environment interactions: Issues andoptions. General for Development: Report to European Commission Directorate.
Toth, F., Cao, G.-Y., & Hizsnyik, E. (2003). Regional population projections for China. IIASA Interim
Report IR-03-042, International Institute for Applied Systems Analysis.
Toth, F., Cao, G.-Y., & Hizsnyik, E. (2008). Regional population projections for China—Revision 2008.
International Institute for Applied Systems Analysis.
Velthof, G. L., Oudendag, D. A., Witzke, H. P., Asman, W. A. H., Klimont, Z., & Oenema, O. (2008).
Integrated assessment of nitrogen emissions from agriculture in EU-27 using MITERRA-EUROPE.
Journal of Environmental Quality, 38, 1–16.
Wang, X. (2005). Diffuse pollution from livestock production in China. Chinese Journal ofGeochemistry, 24/2, 189–193.
Winiwarter, W. (2005). The GAINS model for greenhouse gases—Version 1.0: Nitrous oxide. IIASA
Interim Report IR-05-55, International Institute for Applied Systems Analysis.
258 Popul Environ (2012) 33:243–258
123