implications of co2 global warming on great lakes ice cover
TRANSCRIPT

I M P L I C A T I O N S OF CO2 G L O B A L W A R M I N G O N
GREAT L A K E S ICE C O V E R
R A Y M O N D A. A S S E L
U.S. Department of Commerce, National Oceanic and Atmospheric Administration, Great Lakes Environmental Research Laboratory, 2205 Commonwealth Blvd., Ann Arbor, M148105, U.S.A.
Abstract. Statistical ice cover models were used to project daily mean basin ice cover and annual ice cover duration for Lakes Superior and Erie. Models were applied to a 1951-80 base period and to three 30-year steady double carbon dioxide (2 • CO2) scenarios produced by the Geophysical Fluid Dynamics Labo- ratory (GFDL), the Goddard Institute of Space Studies (GISS), and the Oregon State University (OSU) general circulation models. Ice cover estimates were made for the West, Central, and East Basins of Lake Erie and for the West, East, and Whitefish Bay Basins of Lake Superior. Average ice cover duration for the 1951- 80 base period ranged from 13 to 16 weeks for individual lake basins. Reductions in average ice cover duration under the three 2 x CO 2 scenarios for individual lake basins ranged from 5 to 12 weeks for the OSU scenario, 8 to 13 weeks for the GISS scenario, and 11 to 13 weeks for GFDL scenario. Winters without ice for- marion become common for Lake Superior under the GFDL scenario and under all three 2 • CO 2 scenarios for the Central and East Basins of Lake Erie. During an average 2 x CO 2 winter, ice cover would be limited to the shallow areas of Lakes Erie and Superior. Because of uncertainties in the ice cover models, the results given here represent only a first approximation and are likely to represent an upper limit of the extent and duration of ice cover under the climate change projected by the three 2 • CO2 scenarios. Notwithstanding these limitations, ice cover projected by the 2 x CO2 scenarios provides a preliminary assessment of the potential sensitivity of the Great Lakes ice cover to global warming. Potential environmental and socioeconomic impacts of a 2 • CO2 warming include year- round navigation, change in abundance of some fish species in the Great Lakes, discontinuation or reduction of winter recreational activities, and an increase in winter lake evaporation.
1. Introduction
Great Lakes ice cover is important because it affects the economy of the United States and Canada in terms of shipping (Niimi, 1982), hydropower generation (International Niagara Working Committee, 1983), recreational activity, and the design and construction of shore installations (Wortley, 1978). The annual ice cover also affects the ecology of the lakes in terms of physical processes such as lake evaporation (Derecki, 1976), shore erosion (Zumburge and Wilson, 1953), sediment transport, and biological processes such as microorganism activity under the ice cover (Bolsenga, 1988, personal communication), and survival of fish spawn over the winter (Smale, 1988).
The climate of the Great Lakes affects the extent and duration of ice cover each winter and thus the economy and ecology of the Great Lakes region. Assel et al.
Climatic Change 18: 377-395, 1991. �9 1991 KluwerAcademic Publishers. Printed in the Netherlands.
378 R.A. Assel
(1985) developed a model of annual maximum percent of the surface area of the five Great Lakes covered with ice, based on regional average winter temperature. The model implies that a 4 to 5 ~ increase in regional average winter temperature from a 30-year average (1951-80) results in regional annual maximum ice cover between 0 and 9 percent for the Great Lakes. More recently, Marchand et al.
(1988) developed empirical models of annual maximum ice cover for each Great Lake using monthly average air temperature. These models imply that, except for Lake Erie, the expected annual maximum ice cover under a 2 x CO 2 warming is negligible.
This paper presents the results of a study to evaluate the potential impact of climate warming on the seasonal progression and duration of ice cover on Lakes Erie and Superior (Assel in U.S. Environmental Protection Agency, 1989). The potential implications of climatic warming on the lake ecosystems and economy of the Great Lakes region are also briefly discussed.
2. Lakes Erie and Superior Ice Cycles and Ice Cover Models
Lake Erie is the shallowest Great Lake (mean depth 19 m), its total heat storage is the smallest, and its winter-average perimeter air temperature (-3.1 ~ is the highest for the Great Lakes (Great Lakes Basin Commission, 1976). Lake Superior is the deepest Great Lake (mean depth 149 m), its total heat storage is the largest, and its winter-average perimeter air temperature (-9.8 ~ is the lowest of the five Great Lakes. Ice cover formation on mid-lake areas of Lake Erie usually occurs first on the shallow West Basin (mean depth 9 In), then on the deeper Central Basin (mean depth 19 m) and last on the relatively deep East Basin (mean depth 27 m) Assel et aL (1983). In Lake Superior ice cover first forms on shallow and protected bays and harbors, such as Whitefish Bay (mean depth 41 In), next extensive mid-lake ice cover forms on the West Basin (mean depth 135 m), and last mid-lake ice cover forms on the East Basin (mean depth 152 m).
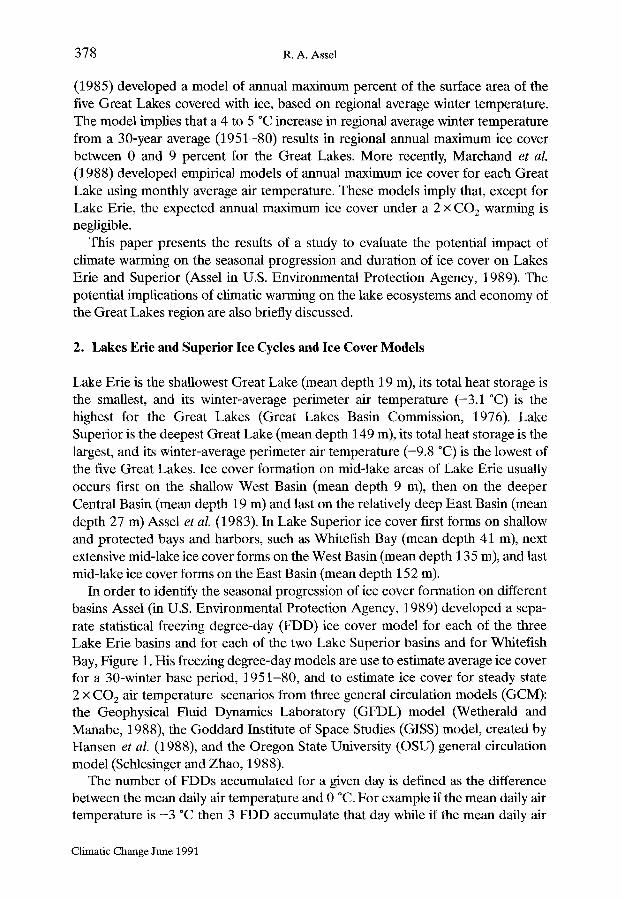
In order to identify the seasonal progression of ice cover formation on different basins Assel (in U.S. Environmental Protection Agency, 1989) developed a sepa- rate statistical freezing degree-day (FDD) ice cover model for each of the three Lake Erie basins and for each of the two Lake Superior basins and for Whitefish Bay, Figure 1. His freezing degree-day models are use to estimate average ice cover for a 30-winter base period, 1951-80, and to estimate ice cover for steady state 2 x CO2 air temperature scenarios from three general circulation models (GCM): the Geophysical Fluid Dynamics Laboratory (GFDL) model (Wetherald and Manabe, 1988), the Goddard Institute of Space Studies (GISS) model, created by Hansen et al. (1988), and the Oregon State University (OSU) general circulation model (Schlesinger and Zhao, 1988).
The number of FDDs accumulated for a given day is defined as the difference between the mean daily air temperature and 0 ~ For example if the mean daily air temperature is -3 ~ then 3 FDD accumulate that day while if the mean daily air
Climatic Change June 1991
Implications of CO 2 Global Warming on Great Lake Ice Cover 379
L A K E B A S I N S A N D T E M P E R A T U R E S T A T I O N S
~- / o :,o .... ~ H~176 ' ~;qO, q / . ~ _
' " . . . . . . . S U P E R I O R " " - - ~ = - - ~ - L A K E ~ ~ .~51atule mHe$ ~ ' , "r _ _ I i I _ _ I t _
I e 3 . ~Z" a l " eO" I ~ 4
Buffalo Port Dover I ~ ~
Detroi~_..~_/ ~ . . . . . . . ~ i , = ~ -
.~ . ~ / ~ ~ f f CENTER BASIN . ~ I Erie _
i 4 WEST BASIN
Cleveland
~ '" ....... E R I E " ~ -~-- -~ L A K E $1otule m , le ]_
Fig. 1. Lake basins and temperature stations. Superior West Basin (WB); Superior East Basin (EB); Whitefish Bay (WF); Erie West Basin (WB); Erie Central Basin (CB); and Erie East Basin (EB). FDD are calculated using: (1) Duluth, Thunder Bay, and Houghton for Superior WB; (2) Thunder Bay and Sault Ste. Marie for Superior EB and also for WE; (3) Detroit, Toledo, and Cleveland for Erie WB; (4) Cleveland, Port Dover, and Erie for Erie CB; and (5) Port Dover, Erie, and Buffalo for Erie EB.
Climatic Change June 1991
c~
FLOW
CH
AR
T FOR T
HE
IC
E C
YC
LE M
OD
EL1
=r
',,D
if =t+
1
no
~--y
es
I,
;t=t+l--
I(t) =
f[J
D,
FD
D(t
)-B
FD
D]
no
, i,c
o Fr
.J FDD (t) ~
mr
[
MELT, t-DMFDD]
] /
! --
....
t=t+
l--n
o~
t-D
MF
DD
=,M
EET
}-~y
e
BFD
D2
= th
resh
old
FD
D
for
the
en
d o
f th
e
fall
co
oli
ng
p
eri
od
. t
= 1
on
Nov
embe
r 1.
FD
D
incr
emen
ts
each
da
y.
I(t)
=
ba
sin
ic
e co
ver
on
day
t.
f[
] =
fun
ctio
n
of.
M
FDD
= m
axim
um F
DD
acc
um
ula
tio
n3
. JD
= d
ate
on
w
hich
FD
D:B
FDD
. Th
e ic
e
grow
th
pe
rio
d
sta
rts
w
hen
t =
JD.
DMFD
D =
date
o
f M
FDD
. M
ELT
= da
ys n
eede
d to m
elt
ic
e.
The
ice
lo
ss
pe
rio
d
sta
rts
w
hen
t =
DM
FDD
.
FALL COO
LINQ
PERIOD
ICE FO
RMAT
ION PERIOD
ICE LO
SS PER
IOD
.>
E
1A
li
sti
ng
of
th
e ic
e co
ver
mod
el e
qu
ati
on
s is
g
ive
n
as A
ppen
dix
I.
2 S
hore
ic
e
form
s b
efo
re
the
en
d o
f th
e
fall
co
oli
ng
p
eri
od
be
caus
e sh
allo
w
area
s co
ol
to
the
fr
ee
zin
g
po
int
at
an
ea
rlie
r da
te
than
de
ep
area
s o
f a
lake
b
asi
n.
In
Lake
S
up
eri
or
the
d
iffe
ren
ce
betw
een
the
ti
me
o
f ic
e fo
rma
tio
n
in
shor
e an
d m
id-l
ake
ar
eas
of
a b
asi
n
was
la
rge
en
ough
to
re
qu
ire
se
pa
rate
e
qu
ati
on
s to
ac
coun
t fo
r in
itia
l ic
e
form
ati
on
in
th
e
shor
e an
d m
id-l
ake
a
rea
s,
see
App
endi
x I.
3
A r
un
nin
g
sum
mat
ion
of
FDD
is
ke
pt
du
rin
g
the
w
inte
r,
the
m
axim
um F
DD
acc
umul
atio
n is
de
term
ined
by
co
mpa
ring
a
ll
of
the
da
ily
valu
es
for
a g
ive
n
win
ter.
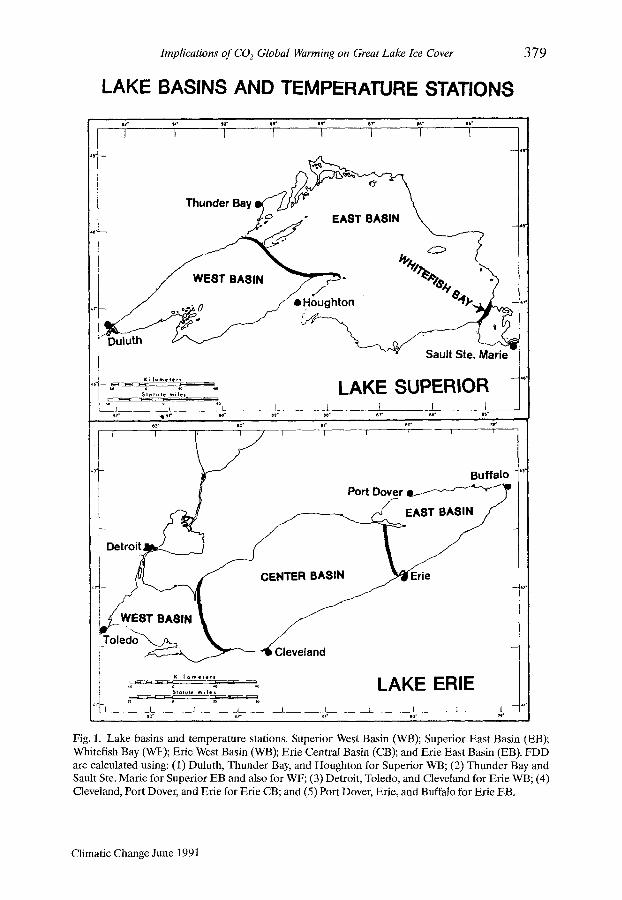
Fig.
2.
Flow
char
t for
the i
ce cy
cle m
odel
.

Implications of CO 2 Global Warming on Great Lake Ice Cover 381
temperature is +3 ~ then 3 FDD accumulate that day. A daily running sum of FDDs starting in November and ending in April provides an index of thermal severity of a winter season (Assel, 1980) and past studies have shown that FDD accumulations correlate well with Great Lakes ice cover extent (Richards, 1963; and Rogers, 1976).
2.1. The Annual Ice Cycle
The annual ice cycle consists of a fall cooling period, an ice growth period, and an ice decay period. During the first part of the fall cooling period the surface waters cool, become more dense and mix with less dense waters below. This density-in- duced mixing continues until the entire water column cools to the temperature of maximum density near 4 ~ This is known as the fall overturn. During the second part of fall cooling, the surface waters cool below the temperature of maximum density and thus density-induced vertical mixing ceases. The fall cooling period ends when the surface water cools to the freezing point. Fall cooling is completed first in the shallow shore areas of each lake basin, and these areas become ice covered before the cooling period is completed in the deeper offshore areas. Thus, in Lake Superior, shore ice forms three to six weeks before ice forms in mid-basin areas. The lag between shore ice and mid-basin ice formation is shorter (one to three weeks) in Lake Erie because of the smaller depth gradient between the shore zone and mid-basin. The period of generally increasing ice extent, the ice growth period, ends when the annual maximum ice cover occurs, usually some time in February or March. Ice cover decreases in extent in March and April and is usually completely melted by the end of April.
2.2. The lce Cover Models
The ice cover models predict the percent of the surface area of a lake basin covered by ice each day. The general conceptual form of the ice models is portrayed as Figure 2. Empirically derived threshold of the daily running summation of FDD accumulation are used to predict initial ice cover; there are separate threshold FDD accumulations for shore areas and mid-lake areas for Lake Superior Basins be- cause large difference in depth result in distinct shore and mid-lake thermal and ice cover regimes (Assel, 1986). The ice growth period starts on the date threshold FDD accumulations occur. Model predictors during the ice growth period are the date on which threshold FDD accumulations occur (for Lake Superior's East and West Basins only) and the difference between threshold FDD accumulations and subsequent FDD accumulations (for all lake basins). The date when the running dally summation of FDD is at its seasonal maximum defines the beginning of the ice decay period. That date marks the beginning of a trend of above freezing air temperatures that eventually results in loss of the ice cover. During the ice decay period, the daily basin ice cover is a function of FDD accumulations, the number of
Climatic Change June 1991
3 8 2 R . A . A s s d
days needed to melt the ice completely at an empirically derived average daily ice melt rate, the number of days past the date of maximum FDD accumulation, and the seasonal maximum FDD accumulation. The ice cover models equations are included in this paper (Appendix I) and they are more fully documented by Assel in U.S. Environmental Protection Agency (1989).
2.3. Model Calibration and Model Errors
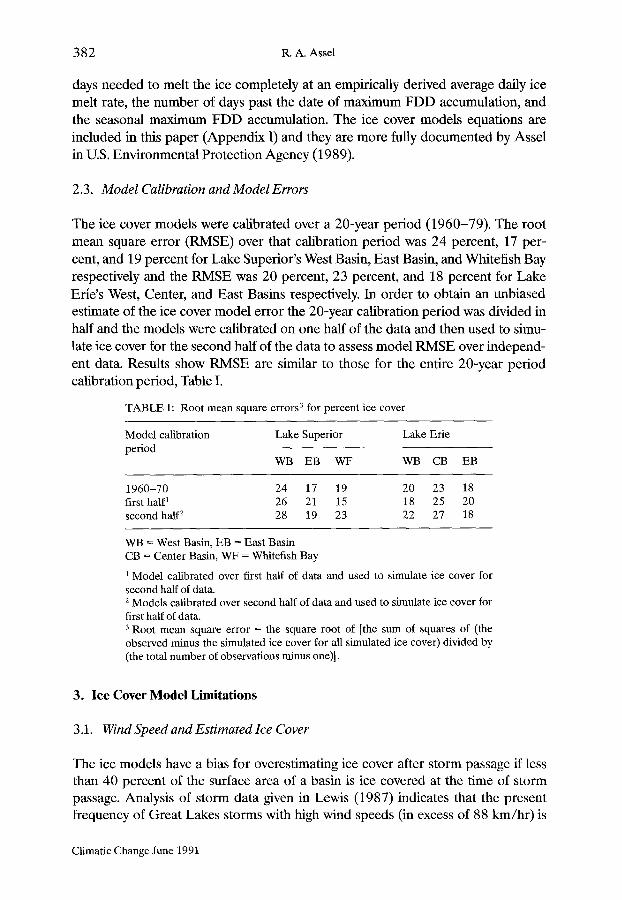
The ice cover models were calibrated over a 20-year period (1960-79). The root mean square error (RMSE) over that calibration period was 24 percent, 17 per- cent, and 19 percent for Lake Superior's West Basin, East Basin, and Whitefish Bay respectively and the RMSE was 20 percent, 23 percent, and 18 percent for Lake Erie's West, Center, and East Basins respectively. In order to obtain an unbiased estimate of the ice cover model error the 20-year calibration period was divided in half and the models were calibrated on one half of the data and then used to simu- late ice cover for the second half of the data to assess model RMSE over independ- ent data. Results show RMSE are similar to those for the entire 20-year period calibration period, Table I.
T A B L E I: Root m e a n square errors 3 for percent ice cover
Mode lca l ib ra t ion Lake Superior Lake Erie period
WB E B W F WB CB EB
1 9 6 0 - 7 0 24 17 19 20 23 18 first half 1 26 21 15 18 25 20 second half 2 28 19 23 22 27 18
WB = Wes t Basin, E B = Eas t Basin CB = Center Basin, W F = Whitef ish Bay
1 Model calibrated over first half of data and used to s imulate ice cover for second half of data. 2 Models calibrated over second half of data and used to simulate ice cover for first half of data. 3 Root mean square error = the square root of [the sum of squares of (the observed minus the simulated ice cover for all s imulated ice cover) divided by (the total n u m b e r of observat ions minus one)].
3. Ice Cover Model Limitations
3.1. Wind Speed and Estimated Ice Cover
The ice models have a bias for overestimating ice cover after storm passage if less than 40 percent of the surface area of a basin is ice covered at the time of storm passage. Analysis of storm data given in Lewis (1987) indicates that the present frequency of Great Lakes storms with high wind speeds (in excess of 88 km/hr) is
Climatic Change June 1991
Implications of C02 Global Warming on Great Lake Ice Cover 3 83
about one storm per winter. Thus if the frequency of Great Lakes winter storms with high wind speeds increases significantly during 2 x CO 2 winters ice cover models would overestimate average ice cover.
3.2. Lake Heat Storage
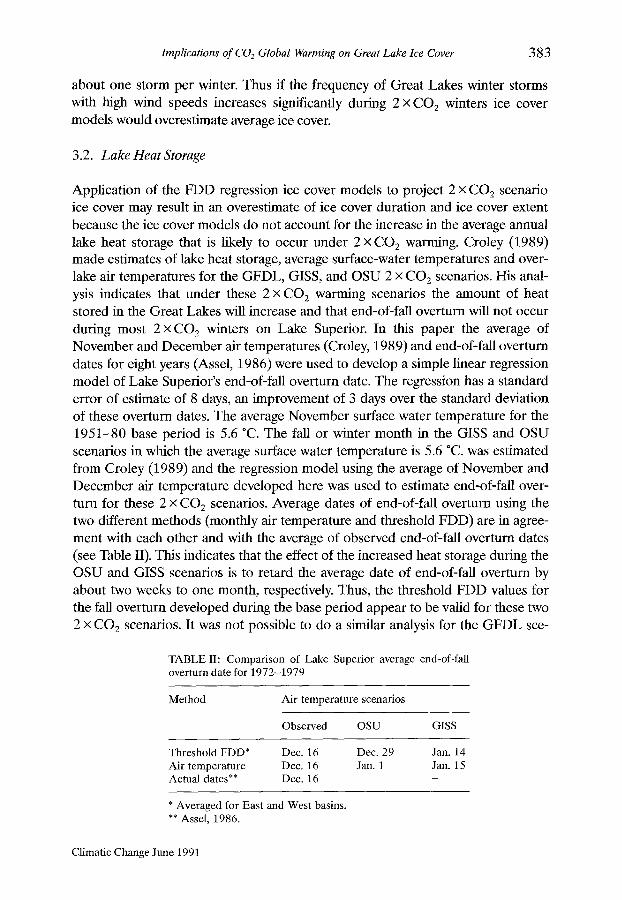
Application of the FDD regression ice cover models to project 2 x CO2 scenario ice cover may result in an overestimate of ice cover duration and ice cover extent because the ice cover models do not account for the increase in the average annual lake heat storage that is likely to occur trader 2 x CO 2 warming. Croley (1989) made estimates of lake heat storage, average surface-water temperatures and over- lake air temperatures for the GFDL, GISS, and OSU 2 x CO2 scenarios. His anal- ysis indicates that under these 2 x CO 2 warming scenarios the amount of heat stored in the Great Lakes will increase and that end-of-fall overturn will not occur during most 2 x CO2 winters on Lake Superior. In this paper the average of November and December air temperatures (Croley, 1989) and end-of-fall overturn dates for eight years (Assel, 1986) were used to develop a simple linear regression model of Lake Superior's end-of-fall overturn date. The regression has a standard error of estimate of 8 days, an improvement of 3 days over the standard deviation of these overturn dates. The average November surface water temperature for the 1951-80 base period is 5.6 ~ The fall or winter month in the GISS and OSU scenarios in which the average surface water temperature is 5.6 ~ was estimated from Croley (1989) and the regression model using the average of November and December air temperature developed here was used to estimate end-of-fall over- turn for these 2 x CO 2 scenarios. Average dates of end-of-fall overturn using the two different methods (monthly air temperature and threshold FDD) are in agree- ment with each other and with the average of observed end-of-fall overturn dates (see Table II). This indicates that the effect of the increased heat storage during the OSU and GISS scenarios is to retard the average date of end-of-fall overturn by about two weeks to one month, respectively. Thus, the threshold FDD values for the fall overturn developed during the base period appear to be valid for these two 2 x CO2 scenarios. It was not possible to do a similar analysis for the GFDL sce-
TABLE II: Comparison of Lake Superior average end-of-fall overturn date for 1972-1979
Method Air temperature scenarios
Observed OSU GISS
Threshold FDD* Dec. 16 Dec. 29 Jan. 14 Air temperature Dec. 16 Jan. 1 Jan. 15 Actual dates** Dec. 16 - -
* Averaged for East and West basins. ** Assel, 1986.
Climatic Change June 1991
384 R.A. Assel
nario because Croley's data indicate surface temperatures on Lake Superior are never as low as 5.6 *C in that scenario.
The effect of increased summer heat storage on ice cover under 2 x CO 2 sce- narios for Lake Erie may not be as important for the Central and East basins of that lake because threshold FDD accumulations for ice-free conditions on these basins were validated during the 1952-53 winter season.
4. Base Period and 2 • C O 2 FDD Scenarios
This study used the 1951-80 climatological period as a base to define the current average value for climatic elements. Great Lakes winter severity increased during this 30-year period, winters were relatively mild during the early to mid 1950s and relatively severe during the last half of the 1970s, Assel (1980).
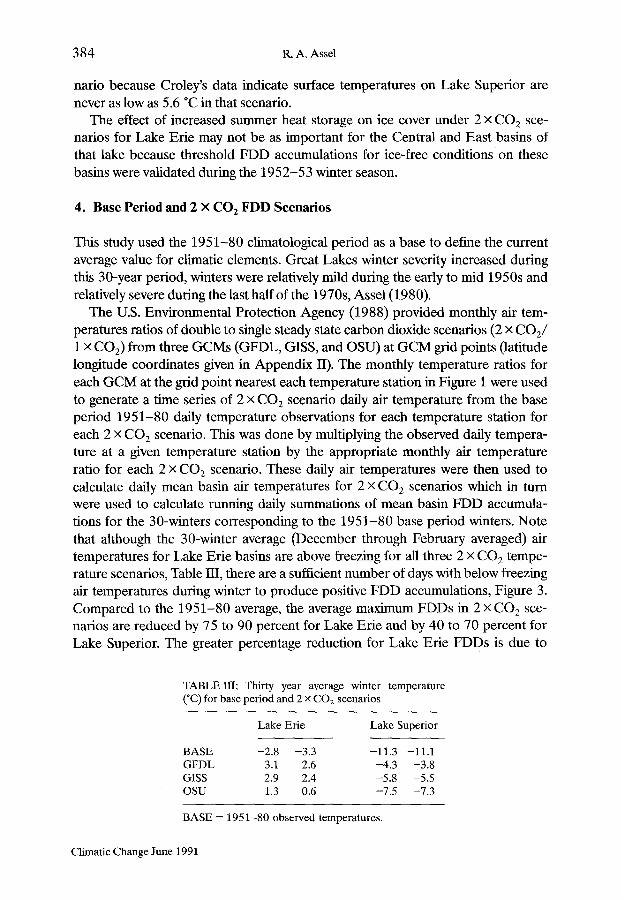
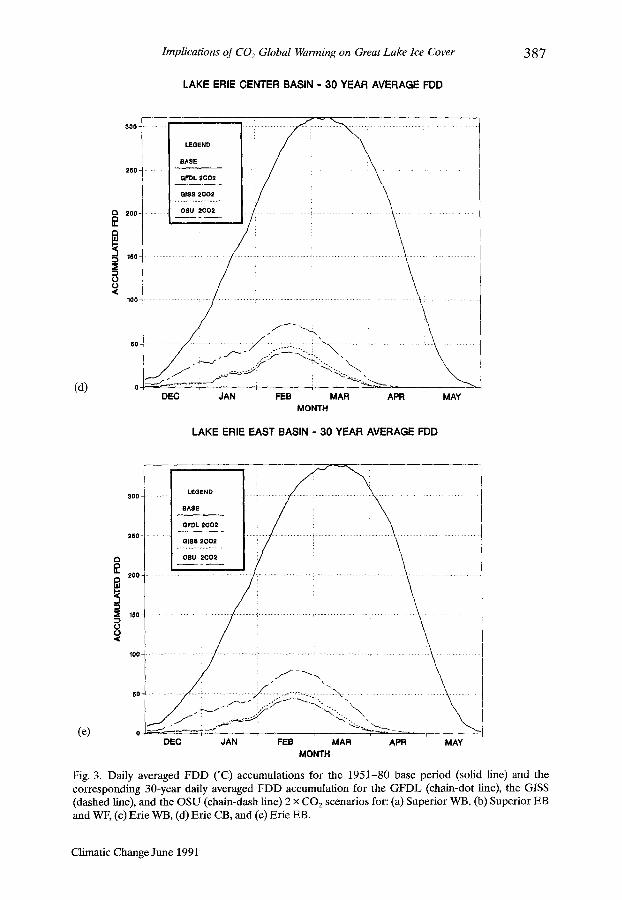
The U.S. Environmental Protection Agency (1988) provided monthly air tem- peratures ratios of double to single steady state carbon dioxide scenarios (2 x CO2/ 1 x CO2) from three GCMs (GFDL, GISS, and OSU) at GCM grid points (latitude longitude coordinates given in Appendix II). The monthly temperature ratios for each GCM at the grid point nearest each temperature station in Figure 1 were used to generate a time series of 2 x CO 2 scenario daily air temperature from the base period 1951-80 daily temperature observations for each temperature station for each 2 x CO 2 scenario. This was done by multiplying the observed daily tempera- ture at a given temperature station by the appropriate monthly air temperature ratio for each 2 x CO 2 scenario. These daily air temperatures were then used to calculate daily mean basin air temperatures for 2 x CO 2 scenarios which in turn were used to calculate running daily summations of mean basin FDD accumula- tions for the 30-winters corresponding to the 1951-80 base period winters. Note that although the 30-winter average (December through February averaged) air temperatures for Lake Erie basins are above freezing for all three 2 x CO 2 tempe- rature scenarios, Table III, there are a sufficient number of days with below freezing air temperatures during winter to produce positive FDD accumulations, Figure 3. Compared to the 1951-80 average, the average maximum FDDs in 2 x CO 2 sce- narios are reduced by 75 to 90 percent for Lake Erie and by 40 to 70 percent for Lake Superior. The greater percentage reduction for Lake Erie FDDs is due to
TABLE I I I: Thirty year average winter temperature (~ for base period and 2 x CO2 scenarios
Lake Erie Lake Superior
BASE -2.8 -3.3 -11.3 -11.1 GFDL 3.1 2.6 -4.3 -3.8 GISS 2.9 2.4 -5.8 -5.5 OSU 1.3 0.6 -7.5 -7.3
BASE = 1951-80 observed temperatures.
Climatic Change June 1991
Implications of CO e Global Warming on Great Lake Ice Cover
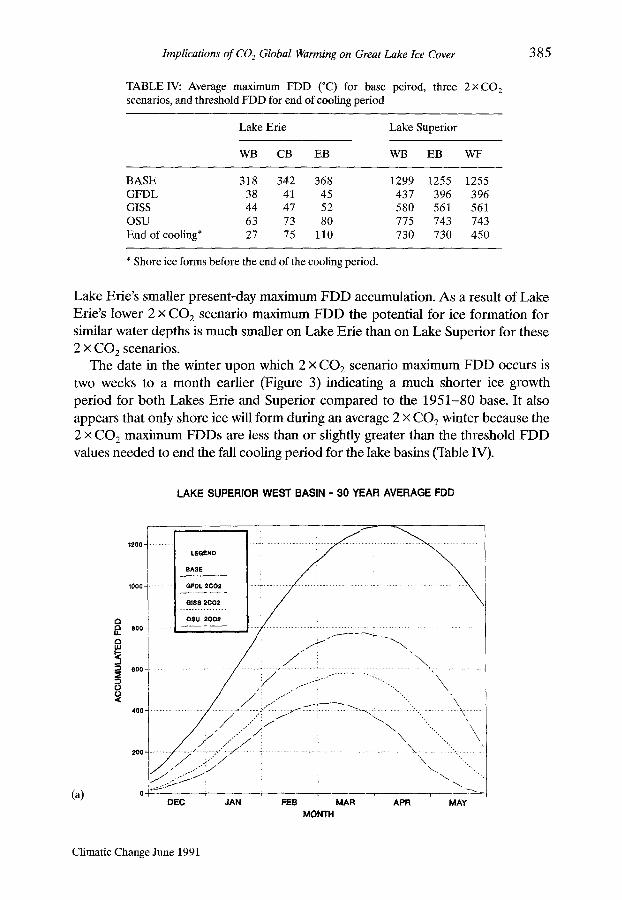
TABLE IV: Average maximum FDD (~ for base peirod, three scenarios, and threshold FDD for end of cooling period
2 • C O 2
385
Lake Erie Lake Superior
WB CB EB WB EB WF
BASE 318 342 368 1299 1255 1255 GFDL 38 41 45 437 396 396 GISS 44 47 52 580 561 561 OSU 63 73 80 775 743 743 End ofcoolmg* 27 75 110 730 730 450
* Shore ice forms before the end of the coofing period.
Lake Erie's smaller present-day maximum FDD accumulation. As a result of Lake Erie's lower 2 x CO 2 scenario maximum FDD the potential for ice formation for similar water depths is much smaller on Lake Erie than on Lake Superior for these 2 x CO2 scenarios.
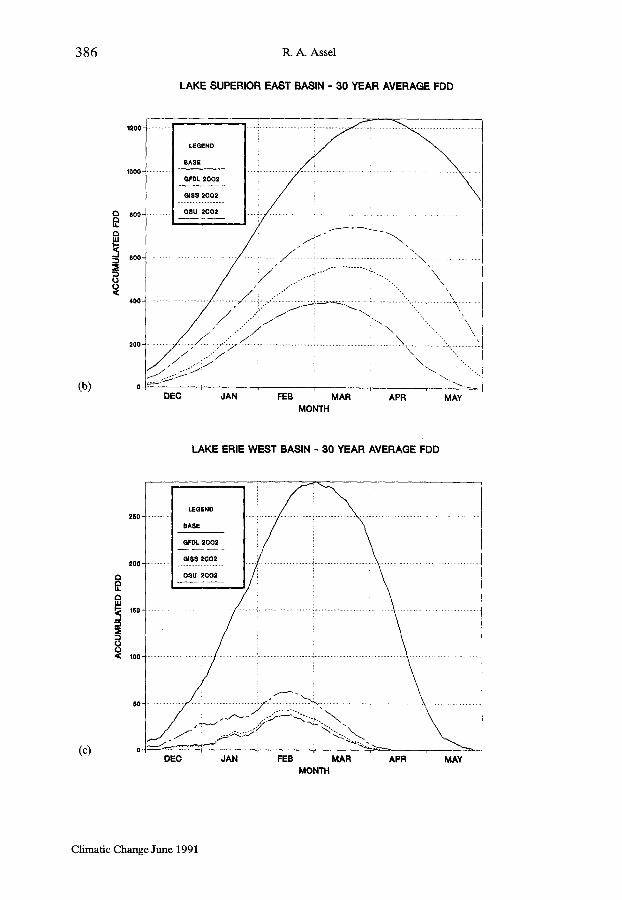
The date in the winter upon which 2 x CO2 scenario maximum FDD occurs is two weeks to a month earlier (Figure 3) indicating a much shorter ice growth period for both Lakes Erie and Superior compared to the 1951-80 base. It also appears that only shore ice will form during an average 2 x CO2 winter because the 2 x CO 2 maximum FDDs are less than or slightly greater than the threshold FDD values needed to end the fall cooling period for the lake basins (Table IV).
(a)
LAKE SUPERIOR WEST BASIN - 30 YEAR AVERAGE FDD
1 2 0 0 . . . . . . . . . . . . I ...... ~ ................................. i .............................. , . . . . . . . . . . . . . . . . . . . . . . . . . . . . . . . . . . . . . . . . . . . .
I BASE : :.
1 0 0 0 . . . . . . . G F D L 2 C 0 2 ..... ~ ......... : . . . . .
I ~ .ooi [ .ooo, ~ } f P
2 0 0 . . . . . . . . ~ . . . . . . . . . . . . . . . . . . . . . . . . . . . . . . . . . . . . . :'~ . . . . . . . . . . / / ,,i,"i./ \ ',.. / . , ,S j ~ ,,
o ~ '~ : " i i , ; ~ , " ~ ' - " D E C J A N F E B M A R A P R M A Y
MONTH
Climatic Change June 1991
3 8 6 R.A. Assel
LAKE SUPERIOR EAST BASIN - 30 YEAR AVERAGE FDD
(b)
1200-
1000-
200-
600-
400-
200-
. . . . . . . J i DEC *JAN FEB MAR APR MAY
M O N T H
LAKE ERIE WEST BASIN - 30 YEAR AVERAGE FDD
(c)
250-
200-
~ 150-
i 100-
60"
O.
; BASE
' GFDL 2002
OBU 2CO2 i i
. . . . . . . . . . . . . , / , ~ . ~ . j > ~ ~ -..~,.,....... ~'~.. .... - , \ ; ......................
DEC JAN FEB MAR APR MAY M O N T H
Climatic Change June 1991
Implications of C02 Global Warming on Great Lake Ice Cover
LAKE ERIE CENTER BASIN - 80 YEAR AVERAGE FDD
3 8 7
(d)
280 . . . . . . I GFOL 2002 J
[ GIS8 2GO2 I !,oo . . . . . . . . . . . ......................................................... . . . . . . . . . . . . . . . . . . . . .
~u
fi= ................................................................................. 1 ..........................................
100 . . . . . . . . . . . . . . . . . . . . . . . . . . . . . . . . . . . . . . . . . . . . . .
~o ..... ~ :::::: : . . . . . . . . . . . . . . . . . . . . . . . . . . . . . . : ~ ; ,-! ,.~-.m~;~.~. ~ i ............... ..................................
DEC JAN FEB MAR APR MAY MONTH
LAKE ERIE EAST BASIN - 30 YEAR AVERAGE FDD
300 -
250 -
i 200-
~: 16o-
100-
60-
(e) o
"EaE"O / \ '
. . . . . . . . . BASE ~ / . . . . . . . . . . . . . . . " ~
OFDL 2002 / \
GI88 2CO2 ; . . . . . . . . . . . . . . . . . . . . . . . . . . . . . . . . . . . . . . . . . . . . . \
O8U 2C02
........... :~:: : : : :~ ~ . . . . . .
DEC JAN FEB MAR APR MAY MONTH
Fig. 3. Daily averaged FDD (~ accumulations for the 1951-80 base period (solid line) and the corresponding 30-year daily averaged FDD accumulation for the GFDL (chain-dot fine), the GISS (dashed line), and the OSU (chain-dash line) 2 x CO 2 scenarios for: (a) Superior WB, (b) Superior EB and W-F, (c) Erie WB, (d) Erie CB, and (e) Erie EB.
Cfimatic Change June 19 91
388 R.A. Assel
5. Ice Cover Duration
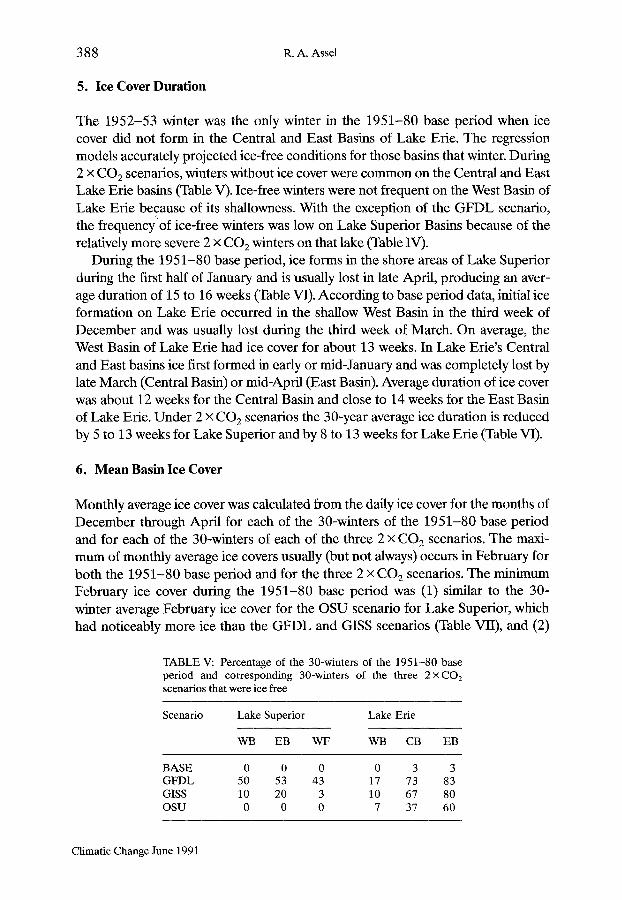
The 1952-53 winter was the only winter in the 1951-80 base period when ice cover did not form in the Central and East Basins of Lake Erie. The regression models accurately projected ice-flee conditions for those basins that winter. During 2 • CO 2 scenarios, winters without ice cover were common on the Central and East Lake Erie basins (Table V). Ice-free winters were not frequent on the West Basin of Lake Erie because of its shallowness. With the exception of the GFDL scenario, the frequency'of ice-free winters was low on Lake Superior Basins because of the relatively more severe 2 • CO 2 winters on that lake (Table IV).
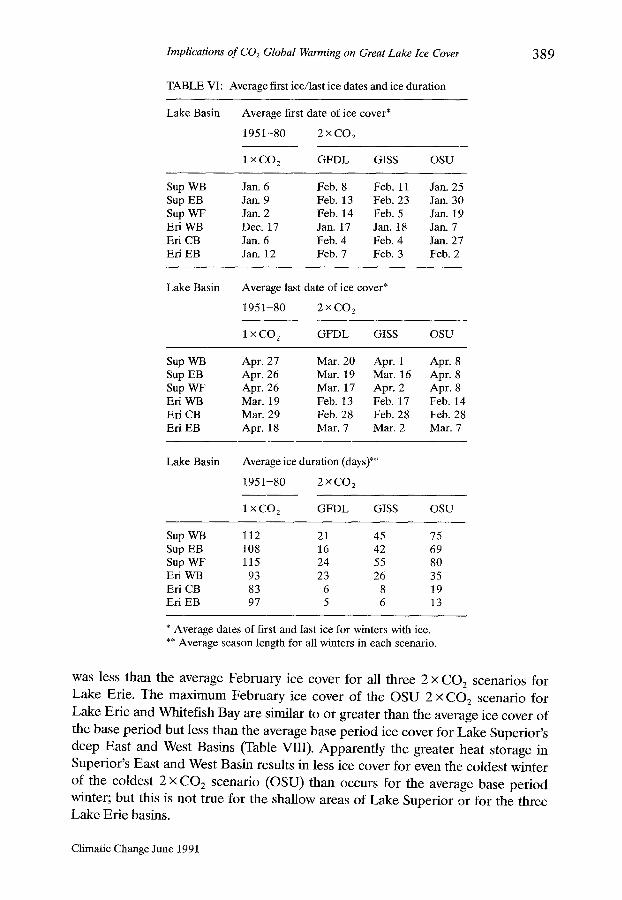
During the 1951-80 base period, ice forms in the shore areas of Lake Superior during the first half of January and is usually lost in late April, producing an aver- age duration of 15 to 16 weeks (Table VI). According to base period data, initial ice formation on Lake Erie occurred in the shallow West Basin in the third week of December and was usually lost during the third week of March. On average, the West Basin of Lake Erie had ice cover for about 13 weeks. In Lake Erie's Central and East basins ice first formed in early or mid-January and was completely lost by late March (Central Basin) or mid-April (East Basin). Average duration of ice cover was about 12 weeks for the Central Basin and close to 14 weeks for the East Basin of Lake Erie. Under 2 • CO2 scenarios the 30-year average ice duration is reduced by 5 to 13 weeks for Lake Superior and by 8 to 13 weeks for Lake Erie (Table VI).
6. Mean Basin Ice Cover
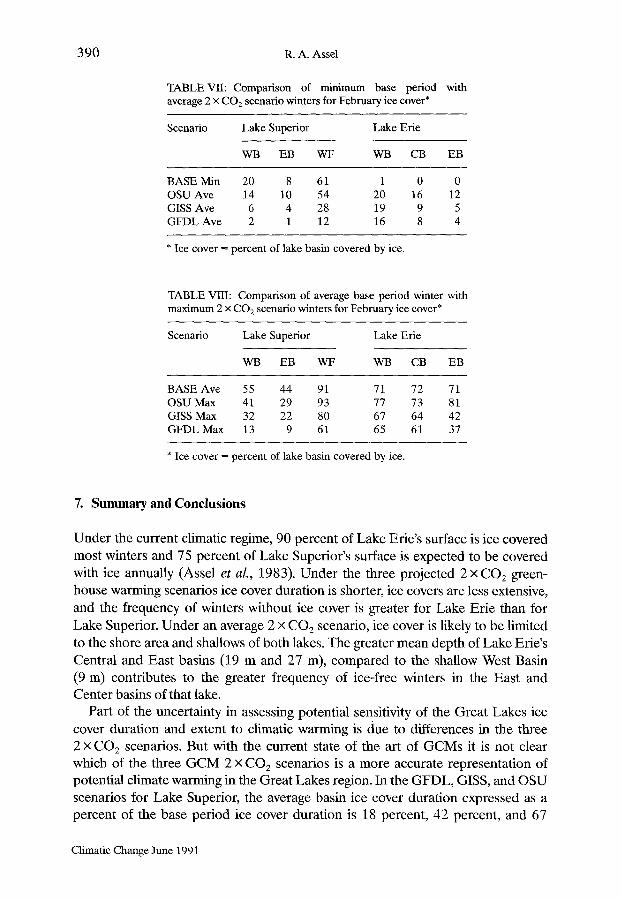
Monthly average ice cover was calculated from the daily ice cover for the months of December through April for each of the 30-winters of the 1951-80 base period and for each of the 30-winters of each of the three 2 x CO 2 scenarios. The maxi- mum of monthly average ice covers usually (but not always) occurs in February for both the 1951-80 base period and for the three 2 • CO 2 scenarios. The minimum February ice cover during the 1951-80 base period was (1) similar to the 30- winter average February ice cover for the OSU scenario for Lake Superior, which had noticeably more ice than the GFDL and GISS scenarios (Table VII), and (2)
TABLE V: Percentage of the 30-winters of the 1951-80 base period and corresponding 30-winters of the three 2• 2 scenarios that were ice free
Scenario Lake Superior Lake Erie
WB EB WF WB CB EB
BASE 0 0 0 0 3 3 GFDL 50 53 43 17 73 83 GISS 10 20 3 10 67 80 OSU 0 0 0 7 37 60
Climatic Change June 1991
Implications of C02 Global Warming on Great Lake Ice Cover 389
TABLE VI: Average first ice/last ice dates and ice duration
Lake Basin Average first date of ice cover*
1951-80 2xCO2
1 x C O 2 GFDL GISS
Sup WB Jan. 6 Feb. 8 Feb. 11 Sup EB Jan. 9 Feb. 13 Feb. 23 Sup WF Jan. 2 Feb. 14 Feb. 5 Eri WB Dec. 17 Jan. 17 Jan. 18 Eri CB Jan. 6 Feb. 4 Feb. 4 Eri EB Jan. 12 Feb. 7 Feb. 3
OSU
Jan. 25 Jan. 30 Jan. 19 Jan. 7 Jan. 27 Feb. 2
Lake Basin Average last date of ice cover*
1951-80 2xCO2
1 x CO 2 GFDL GISS
Sup WB Apr. 27 Mar. 20 Apr. 1 Sup EB Apr. 26 Mar. 19 Mar. 16 Sup WF Apr. 26 Mar. 17 Apr. 2 Eri WB Mar. 19 Feb. 13 Feb. 17 Eri CB Mar. 29 Feb. 28 Feb. 28 Eri EB Apr. 18 Mar. 7 Mar. 2
OSU
Apr. 8 Apr. 8 Apr. 8 Feb. 14 Feb. 28 Mar. 7
Lake Basin Average ice duration (days)**
1951-80 2xCO 2
1 x CO 2 GFDL GISS OSU
Sup WB 112 21 45 75 Sup EB 108 16 42 69 Sup WF 115 24 55 80 Eri WB 93 23 26 35 Eri CB 83 6 8 19 Eri EB 97 5 6 13
* Average dates of first and last ice for winters with ice. ** Average season length for all winters in each scenario.
was less than the average F e b r u a r y ice cover for all three 2 x C O 2 scenarios for
Lake Erie. The m a x i m u m F e b r u a r y ice cover of the O S U 2 x C O 2 scenar io for
Lake Er ie and Whitef ish Bay are s imilar to or greater than the average ice cover of
the base pe r iod bu t less than the average base per iod ice cover for Lake Super ior ' s
deep Eas t and West Basins (Table VIII). A p p a r e n t l y the greater heat storage in
Super ior ' s Eas t and West Bas in results in less ice cover for even the coldest winter
of the coldest 2 x C O 2 scenar io (OSU) than occurs for the average base per iod
winter ; bu t this is no t t rue for the shallow areas of Lake Super ior or for the three Lake Er ie basins.
Climatic Change June 1991
390 R.A. Assel
TABLE VII: Comparison of minimum base period with average 2 • C O 2 scenario winters for February ice cover*
Scenario Lake Superior Lake Erie
WB EB WF WB CB EB
BASE Min 20 8 61 1 0 0 OSU Ave 14 10 54 20 16 12 GISS Ave 6 4 28 19 9 5 GFDL Ave 2 1 12 16 8 4
* Ice cover = percent of lake basin covered by ice.
TABLE VIII: Comparison of average base period winter with maximum 2 x CO2 scenario winters for February ice cover*
Scenario Lake Superior Lake Erie
WB EB WF WB CB EB
BASE Ave 55 44 91 71 72 71 OSU Max 41 29 93 77 73 81 GISS Max 32 22 80 67 64 42 GFDL Max 13 9 61 65 61 37
* Ice cover = percent of lake basin covered by ice.
7. S u m m a r y and C o n c l u s i o n s
Under the current climatic regime, 90 percent of Lake Erie's surface is ice covered
most winters and 75 percent of Lake Superior's surface is expected to be covered
with ice annually (Assel et al., 1983). Under the three projected 2 • CO2 green- house warming scenarios ice cover duration is shorter, ice covers are less extensive,
and the frequency of winters without ice cover is greater for Lake Erie than for
Lake Superior. Under an average 2 • CO 2 scenario, ice cover is fikely to be limited
to the shore area and shallows of both lakes. The greater mean depth of Lake Erie's
Central and East basins (19 m and 27 m), compared to the shallow West Basin
(9 m) contributes to the greater frequency of ice-free winters in the East and Center basins of that lake.
Part of the uncertainty in assessing potential sensitivity of the Great Lakes ice
cover duration and extent to climatic warming is due to differences in the three
2 • CO2 scenarios. But with the current state of the art of GCMs it is not clear which of the three GCM 2 • CO 2 scenarios is a more accurate representation of potential climate warming in the Great Lakes region. In the GFDL, GISS, and OSU
scenarios for Lake Superior, the average basin ice cover duration expressed as a percent of the base period ice cover duration is 18 percent, 42 percent, and 67
Climatic Change June 1991

Implications of CO 2 Global Warming on Great Lake Ice Cover 391
percent. The corresponding average basin percentages of the base period ice cover duration for Lake Erie are 12 percent, 15 percent, and 24 percent for the GFDL, GISS, and OSU scenarios.
Large differences between FDD accumulations in the three 2 x CO2 scenarios for Lake Superior introduces uncertainty in projected 2 x CO 2 ice cover. This uncertainty is greatest for the shallow areas of Lake Superior such as Whitefish Bay because of the smaller heat storage capacity of shallow areas. The average February ice cover for Whitefish Bay is 54 percent under the OSU 2 x CO2 scenario; the average February ice cover for that bay is only 12 percent under the GFDL 2 x CO2 scenario. Differences in average February ice cover for the three 2 x CO 2 scenarios for the deep East and West Lake Superior basins are 12 percent or less. Differences in maximum FDD accumulations under the three 2 x CO2 scenarios in Lake Erie are much smaller than in Lake Superior as are differences in expected 2 x CO 2 February ice cover. The largest difference in expected 2 x CO 2 February ice cover is 8 percent, between the GFDL and OSU scenario for the East Basin of that lake.
7.1. Implications of lce Cover Model Limitations on lnterpretation of Results
The simulated 2 x CO2 ice cover projections given in this study represent a first- order approximation and probably represents the upper limit of potential ice cover under the three 2 x CO2 global warming scenarios because the increase in lake heat storage that will occur during 2 x CO 2 greenhouse warming summers is not accounted for in the ice cover models. The threshold FDD accumulations for ice formation for Lake Erie's East and Central basins were verified during the winter of 1952-53, a winter not used in the model calibration. Thus in the case of these two lake basins, increases in heat storage for 2 x CO~ warming scenarios may not be a critical factor in identifying winters during which there is no ice formation. But there are uncertainties associated with the thermal structure of Lakes Erie and Superior under 2 x CO2 warming that need to be resolved before a more definitive analysis of the ice cover can be made. For example, our analysis of end-of-fall over- turn date, parameterized by average November and December air temperature, indicates that the primary effect of increased heat storage in Lake Superior under the GISS and OSU 2 x CO2 scenarios is to retard the date of the end-of-fall over- turn by about two weeks to one month; while Croley (1989) indicates that fall overturn in the deep areas of Lake Superior may not occur most 2 x CO2 winters.
7.2. Environmental and Economic Implications of 2 x CO 2 Winter Ice Cover
The OSU scenario produces the least change from current ice conditions and the GFDL scenario projects the most. These differences can be important in shore zones where the extent and duration of ice cover appears to have a large impact on biological activity. Freeberg (1985) and Smale (1988) observed that year-class
Climatic Change June 1991
392 R.A. Assel
strength of lake whitefish is related to winter severity. Under the 2 x CO 2 scenarios, the Great Lakes may not have ice cover some winters. If the lakes are ice-free, the range of whitefish and perhaps other cold water fish species may be reduced (Meis- ner et al., 1987). The environment for biological activity may be more favorable under the protection of the ice cover than without it in the shore zones of the Great Lakes (Bolsenga, 1988, personal communication); therefore, the loss of the ice cover may result in a reduction in the annual abundance of some microorganisms and may significantly affect larger life forms that prey on them. The ice cover also protects some shore areas against the impact of high-energy waves that might otherwise erode the shore (Zumburge and Wilson, 1953).
Ice cover impedes and eventually stops most navigation in the Great Lakes during the winter months. Aids to navigation that would be damaged by ice are removed in late fall and reinstalled the following spring. Ice booms, which help prevent ice jams and aid in the formation of stable ice cover, are installed at the head of the St. Marys and Niagara Rivers (International Niagara Working Commit- tee, 1983). The U.S. and Canadian Coast Guard and hydropower authorities are in- volved in this activity, and the Coast Guard also assists ships beset in the ice.
The results of our study indicate that the navigation season could be extended to 10 or even 12 months under a 2 x CO2 climatic warming. Thus a considerable cost saving may be associated with reduced Coast Guard and hydropower authority activity and economic benefits may result from increased shipping activity in the winter months. However, the greatly reduced extent and duration of ice cover would likely result in higher evaporation from the Great Lakes and lower lake levels (United States Environmental Protection Agency, 1989). Crowe (1985) indi- cates that above-freezing air temperature in southern Ontario, Canada will produce less snow cover and a shorter snow cover season. There is a considerable amount of winter recreational activity on ice-covered bays and harbors of the Great Lakes - ice boating, ice fishing, snowmobile racing. Much if not all of this activity would be curtailed or discontinued completely with reduced ice and snow cover.
Acknowledgements
The research described in this article has been partially funded by the U.S. En- vironmental Protection Agency through Interagency Agreement Identification Number DW13932631-10-0. GLERL Contribution N. 653.
References
Assel, R. A.: 1986, 'Fall and Winter Thermal Structure of Lake Superior', J. Great Lakes Res. 12 (4), 251-262.
Assel, R. A.: 1980, 'Maximum Freezing Degree-days as a Winter Severity Index for the Great Lakes, 1897-1977" Mon. Wea. Rev. 108 (9), 1440-1445.
Assel, R. A., Quinn, E H., Leshkevich, G.A., and Bolsenga, S.J.: 1983, 'NOAA Great Lakes Ice Atlas', Great Lakes Environmental Research Laboratory, 2205 Commonwealth Blvd., Ann Arbor, Michigan, 120 pp. [NTIS PB84-160811].
Climatic Change June 1991
Implications of CO 2 Global Warming on Great Lake Ice Cover 393
Assel, R. A., Snider, C. R., and Lawrence, R.: 1985, 'Comparison of 1982-83 Winter Weather and Ice Conditions with Previous Years', Mon. Wea. Rev. 113 (3), 291-303.
Bolsenga, S.J.: 1988, Personal communication. Great Lakes Environmental Research Laboratory, 2205 Commonwealth Blvd., Ann Arbor, Michigan.
Croley, T. E., II.: 1989, 'Laurentian Great Lakes Double-CO; Climate Change Hydrological Impacts', Climatic Change 17, 27-47.
Crowe, R.B.: 1985, 'Effect of Carbon Dioxide Warming Scenarios on Total Winter Snowfall and Length of Winter Snow Season in Southern Ontario; Report No. 85-19, Canadian Climate Center, Atmospheric Environment Service, Downsview, Ontario, Canada.
Derecki, J.A.: 1976, 'Multiple Estimates of Lake Erie Evaporation', J. Great Lakes Res. 1 (2), 124- 149.
Freeberg, M.H.: 1985, 'Early Life History Factors Influencing Lake Whitefish (Coregonus cluper- formis) Year-class Strength in Grand Traverse Bay, Lake Michigan', M. S. Thesis, Dept. of Fisheries and Wildlife, Michigan State University, East Lansing, Michigan.
Great Lakes Basin Commission: 1976, 'Great Lakes Basin Framework Study Appendix 4 Limnology of Lakes and Embayments', Public Information Office, Great Lakes Basin Commission, Ann Arbor, Michigan.
Hansen, J., Fung, I., Lacis, A., Rind, D., Lebedeff, S., Ruedy R., Russel, G., and Stone, E: 1988, 'Global Climate Changes as Forecast by the GISS 3-D Model', J. of GeophysicalRes. 93 (8), 9341-9364.
International Niagara Working Committee: 1983, '1982-83 Operations of the Lake Erie-Niagara River Ice Boom', U.S. Army Corps of Engineers. Buffalo District, Buffalo, New York.
Lewis, R J.: 1987, 'Severe Storms Over the Great Lakes: A Catalogue Summary for the Period 1957- 1985'. Canadian Climate Center Report No. 87-13, Atmospheric Environment Service, Downs- view, Ontario, Canada.
Marchand, D., Sanderson, M., Howe, D., and Alpanch, C.: 1988, 'Climatic Change and Great Lakes Levels - the Impact on Shipping', Climatic Change 2 (2), 107-133.
Meisner, J.D., Goodier, J.L., and Regier, A.H.: 1987, ~ n Assessment of the Effects of Climate Warming on Great Lakes Basin Fishes; J. Great Lakes Res. 13 (3), 340-352.
Niimi, A.J.: 1982, 'Economic and Environmental Issues of the Proposed Extension of the Winter Navigation Season and Improvements on the Great Lakes - St. Lawrence Seaway System; J. Great Lakes Res. 8 (3), 532-549.
Richards, T. L.: 1963, 'Meteorological Factors Affecting Ice Cover on the Great Lakes', in Proc. of the Sixth Conf. on Great Lakes Research. International Association for Great Lakes Research, Ann Arbor, Michigan, pp. 204-215.
Rogers, J. C.: 1976, 'Long-range Forecasting of Maximum Ice Extent of the Great Lakes', NOAA Tech. Memo. ERL GLERL-7. National Technical Information Service, Springfield, Virginia, 15 pp.
Schlesinger, M. and Zhao, Z.: 1988, 'Seasonal Climate Changes Induced by Doubled CO2 or Simu- lated by the OSU Atmospheric GCM/Mixed-layer Ocean Model', Oregon State University Climate Research Institute Report, Corvallis, Oregon.
Smale, M. A.: 1988, 'The Influence of Parental Stock Size, Winter Severity and Spring Temperatures on Recruitment of Lake Whitefish in Northeastern Lake Michigan', M.S. Thesis, Dept. of Fisheries and Wildlife, Michigan State University, East Lansing, Michigan.
U.S. Environmental Protection Agency: 1989, 'Report to Congress on the Potential Effects of Global Climate on the United States; Appendix A, Water Resources, USEPA Report Number EPA-230- 05-89-051. J. B. Smith and D. A. Tirpak, Eds., EPA Office of Policy, Planning, and Evaluation, Washington, D.C.
Wetherald, R. T. and Manabe, S.: 1988, 'Cloud Feedback Process in a General Circulation Model', J. Atmos. Sci. 45 (8), 1397-1415.
Wortley, C. A.: 1978, 'Ice Engineering Guide for Design and Construction of Small Craft Harbors', Advisory Report WIS-SG-78-417, University of Wisconsin, Sea Grant Communications Office, 1800 University Avenue, Madison, Wisconsin.
Zumburge, J. H. and Wilson, J. T.: 1953, 'Effects of Ice on Shore Development: in J. W. Johnson (ed.), Proc. Fourth Conf. Coastal Engineering, Chicago, Council on Wave Research, the Engineering Foundation, University of California, Berkeley, California, pp. 201-205.
(Received 6 February, 1989; in revised form 24 January, 1990).
Climatic Change June 1991
3 9 4 R.A. Assel
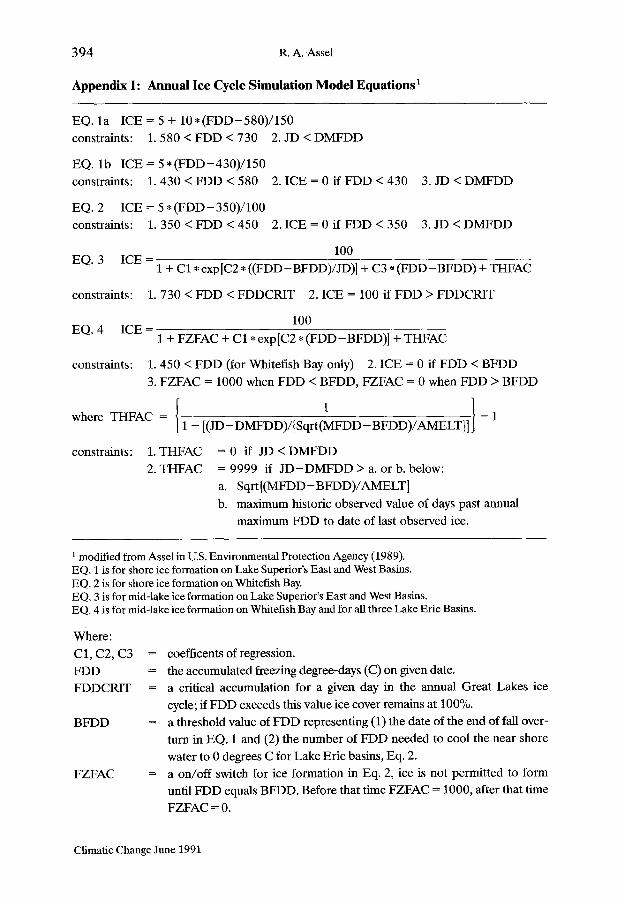
Appendix I: Annual Ice Cycle Simulation Model Equations 1
EQ. l a I C E = 5 + 1 0 * ( F D D - 5 8 0 ) / 1 5 0
constraints: 1. 580 < F D D < 730 2. JD < D M F D D
EQ. l b I C E = 5 * ( F D D - 4 3 0 ) / 1 5 0
constraints: 1. 430 < F D D < 580 2. I C E = 0 if F D D < 430 3. JD < D M F D D
EQ. 2 I C E = 5 * ( F D D - 350)/ '100
constraints: 1. 350 < F D D < 450 2. I C E = 0 if F D D < 350 3. JD < D M F D D
100 EQ. 3 ICE =
1 + C1 * exp [C2 * ( ( F D D - B F D D ) / J D ) ] + C3 * ( F D D - B F D D ) + T H F A C
constraints: 1. 730 < F D D < F D D C R I T 2. I C E = 100 if F D D > F D D C R I T
100 EQ. 4 I C E =
1 + F Z F A C + C 1 * exp [C 2 * ( F D D - BFDD)] + T H F A C
constraints: 1. 450 < F D D (for Whitefish Bay only) 2. I C E = 0 if F D D < B F D D
3. F Z F A C = 1000 when F D D < B F D D , F Z F A C = 0 when F D D > B F D D
I 1 1 1 where T H F A C = [ ( J D - D M F D D ) / { S q r t ( ~ I F D D - B F D D ) / A M E L T } ] - 1
constraints: 1. T H F A C = 0 if JD < D M F D D
2. T H F A C = 9999 if J D - D M F D D > a. or b. below:
a. Sqrt [ ( M F D D - B F D D ) / A M E L T ]
b. maximum historic observed value of days past annual
maximum F D D to date of last observed ice.
1 modified from Assel in U.S. Environmental Protection Agency (1989). EQ. 1 is for shore ice formation on Lake Superior's East and West Basins. EQ. 2 is for shore ice formation on Whitefish Bay. EQ. 3 is for mid-lake ice formation on Lake Superior's East and West Basins. EQ. 4 is for mid-lake ice formation on Whitefish Bay and for all three Lake Erie Basins.
Where: C1, C2, C3
F D D
F D D C R I T
B F D D
F Z F A C
= coefficents of regression.
= the accumulated freezing degree-days (C) on given date.
= a critical accumulat ion for a given day in the annual Grea t Lakes ice
cycle; if F D D exceeds this value ice cover remains at 100%.
= a threshold value of F D D representing (1) the date of the end of fall over-
turn in EQ. 1 and (2) the number of F D D needed to cool the near shore
water to 0 degrees C for Lake Er ie basins, Eq. 2.
= a on /o f f switch for ice format ion in Eq. 2, ice is not permi t ted to form
until F D D equals B F D D . Before that t ime F Z F A C = 1000, after that t ime
F Z F A C = 0.
Climatic Change June 1991

Implications o f CO 2 Global Warming on Great Lake Ice Cover 395
JD
MFDD
DMFDD
AMELT
= a day counter, the ice cycle starts (JD = 1) the first day FDD is greater
than or equal to BFDD.
= the annual maximum FDD accumulation.
= the date of the annual maximum FDD accumulation.
= the average daily ice melt rate (cm/day).
ARITHMETIC OPERATORS
* = multiplication / = division
< = less than sqrt = square root
+ = addition - = subtraction > = greater than
exp = exponential function (base e)
Appendix II: Global circulation model grid point coordinate in the vicinity of the Great Lakes
Geophys ica l F lu id Dynamics L a b o r a t o r y
Long i tude "W
97.5 90.0 82.5 75.0
La t i tude ~
51.11 + + + + +
46.66 + + + + +
42 .22 + + + + +
G o d d a r d Ins t i tu te of Space Studies
Long i tude ~
90.0 80.0 70.0
La t i tude ~
50.87 + + +
43 .04 + + +
Oregon State Univers i ty
Long i tude "W
95.0 90.0 85.0 80.0 75.0
La t i tude ~
50.00 + + + + +
46 .00 + + + + +
42.00 + + + + +
Climatic Change June 1991