implementing sb 555: validated water loss audits and … · implementing sb 555: validated water...
TRANSCRIPT
Implementing SB 555:Validated Water Loss Audits and Reporting
California Water Association2016 Annual Conference
Sue MosburgProgram Manager
Sweetwater Authority
California Water Loss Control Collaborative ChairAWWA California-Nevada Water Loss Control Committee Chair
November 3, 2016
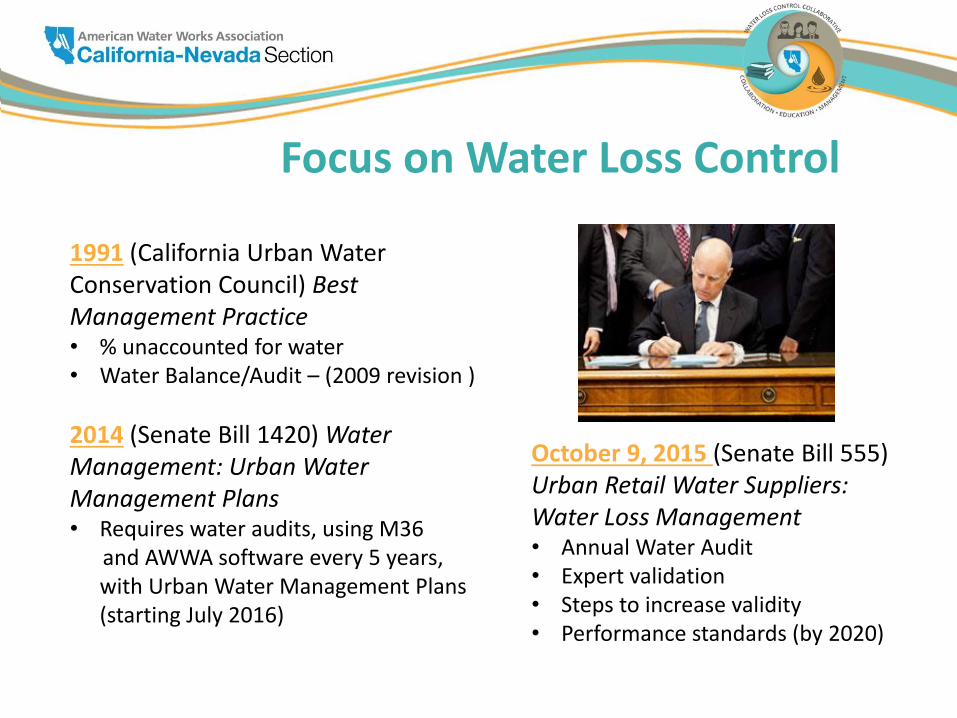
Focus on Water Loss Control
1991 (California Urban Water Conservation Council) Best Management Practice • % unaccounted for water• Water Balance/Audit – (2009 revision )
2014 (Senate Bill 1420) Water Management: Urban Water Management Plans• Requires water audits, using M36
and AWWA software every 5 years, with Urban Water Management Plans (starting July 2016)
October 9, 2015 (Senate Bill 555) Urban Retail Water Suppliers: Water Loss Management• Annual Water Audit• Expert validation • Steps to increase validity• Performance standards (by 2020)
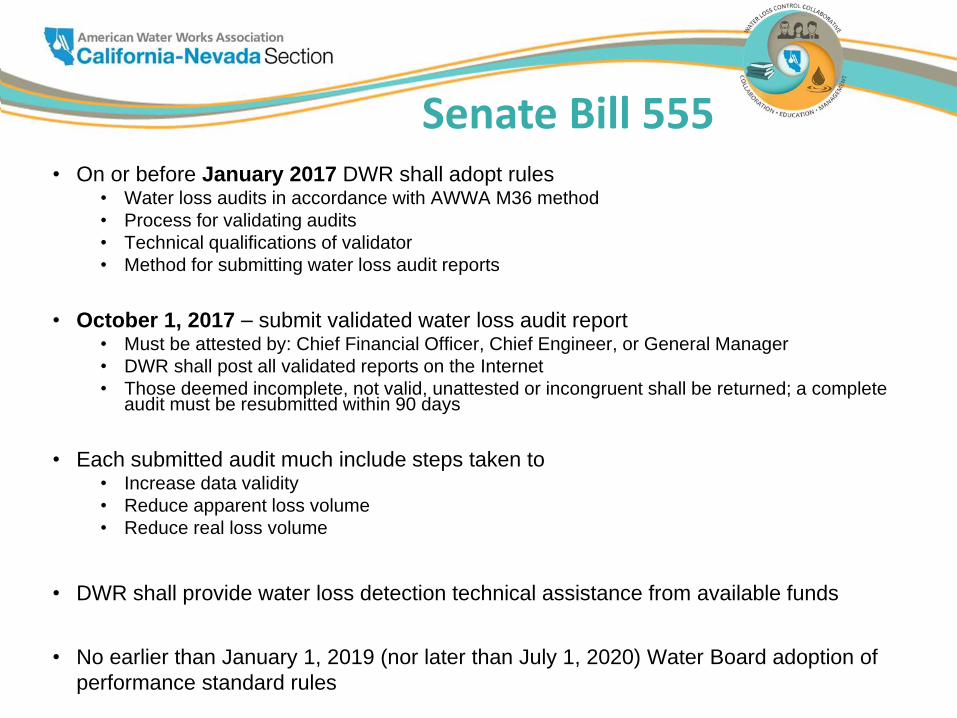
Senate Bill 555• On or before January 2017 DWR shall adopt rules
• Water loss audits in accordance with AWWA M36 method
• Process for validating audits
• Technical qualifications of validator
• Method for submitting water loss audit reports
• October 1, 2017 – submit validated water loss audit report• Must be attested by: Chief Financial Officer, Chief Engineer, or General Manager
• DWR shall post all validated reports on the Internet
• Those deemed incomplete, not valid, unattested or incongruent shall be returned; a complete audit must be resubmitted within 90 days
• Each submitted audit much include steps taken to • Increase data validity
• Reduce apparent loss volume
• Reduce real loss volume
• DWR shall provide water loss detection technical assistance from available funds
• No earlier than January 1, 2019 (nor later than July 1, 2020) Water Board adoption of
performance standard rules
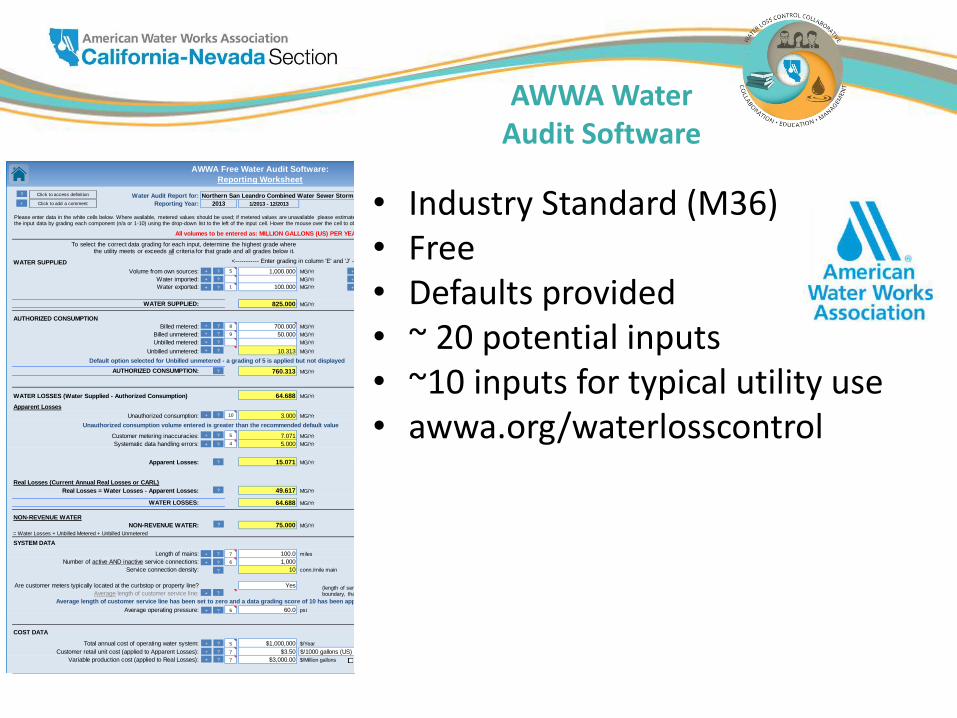
AWWA Water Audit Software
Water Audit Report for:
Reporting Year:
All volumes to be entered as: MILLION GALLONS (US) PER YEAR
Master Meter Error Adjustments
WATER SUPPLIED Pcnt: Value:
Volume from own sources: 5 1,000.000 MG/Yr 1 MG/Yr
Water imported: MG/Yr MG/Yr
Water exported: 1 100.000 MG/Yr 9 MG/Yr
Enter negative % or value for under-registration
WATER SUPPLIED: 825.000 MG/Yr Enter positive % or value for over-registration.
AUTHORIZED CONSUMPTION
Billed metered: 8 700.000 MG/Yr
Billed unmetered: 9 50.000 MG/Yr
Unbilled metered: MG/Yr Pcnt: Value:
Unbilled unmetered: 9 10.313 MG/Yr 1.25% MG/Yr24061
AUTHORIZED CONSUMPTION: 760.313 MG/Yr
WATER LOSSES (Water Supplied - Authorized Consumption) 64.688 MG/Yr
Apparent Losses Pcnt: Value:
Unauthorized consumption: 10 3.000 MG/Yr 0.25% MG/Yr
Customer metering inaccuracies: 5 7.071 MG/Yr 1.00% MG/Yr
Systematic data handling errors: 4 5.000 MG/Yr 0.25% MG/Yr
Apparent Losses: 15.071 MG/Yr
Real Losses (Current Annual Real Losses or CARL)
Real Losses = Water Losses - Apparent Losses: 49.617 MG/Yr
WATER LOSSES: 64.688 MG/Yr
NON-REVENUE WATER
NON-REVENUE WATER: 75.000 MG/Yr
= Water Losses + Unbilled Metered + Unbilled Unmetered
SYSTEM DATA
Length of mains: 7 100.0 miles
Number of active AND inactive service connections: 6 1,000
Service connection density: 10 conn./mile main
Yes
Average length of customer service line: ft
Average operating pressure: 6 60.0 psi
COST DATA
Total annual cost of operating water system: 5 $1,000,000 $/Year
Customer retail unit cost (applied to Apparent Losses): 7 $3.50
Variable production cost (applied to Real Losses): 7 $3,000.00 $/Million gallons
WATER AUDIT DATA VALIDITY SCORE:
PRIORITY AREAS FOR ATTENTION:
1: Volume from own sources
2: Customer metering inaccuracies
3: Total annual cost of operating water system
Based on the information provided, audit accuracy can be improved by addressing the following components:
$/1000 gallons (US)
100.000
<----------- Enter grading in column 'E' and 'J' ---------->
Unauthorized consumption volume entered is greater than the recommended default value
5.000
*** YOUR SCORE IS: 60 out of 100 ***
A weighted scale for the components of consumption and water loss is included in the calculation of the Water Audit Data Validity Score
100.000
3.000
25.000
Average length of customer service line has been set to zero and a data grading score of 10 has been applied
Are customer meters typically located at the curbstop or property line?
AWWA Free Water Audit Software:
Reporting Worksheet
Default option selected for Unbilled unmetered - a grading of 5 is applied but not displayed
1.000
2013 1/2013 - 12/2013
Northern San Leandro Combined Water Sewer Storm Utility District (0007900)
?
?
?
?
?
? Click to access definition
?
?
?
?
?
?
Please enter data in the white cells below. Where available, metered values should be used; if metered values are unavailable please estimate a value. Indicate your confidence in the accuracy of the input data by grading each component (n/a or 1-10) using the drop-down list to the left of the input cell. Hover the mouse over the cell to obtain a description of the grades
?
?
?
?
?
?
(length of service line, beyond the property boundary, that is the responsibility of the utility)
Use buttons to selectpercentage of water
suppliedOR
value
?Click here:
for help using option buttons below
?
?
?
?
+
+ Click to add a comment
WAS v5.0
+
+
+
+
+
+
American Water Works Association.Copyright © 2014, All Rights Reserved.
?
?
?
+
+
+
+
+
+
+
+
+
+
+
+
+ Use Customer Retail Unit Cost to value real losses
?
To select the correct data grading for each input, determine the highest grade where the utility meets or exceeds all criteria for that grade and all grades below it.
• Industry Standard (M36)• Free• Defaults provided• ~ 20 potential inputs• ~10 inputs for typical utility use• awwa.org/waterlosscontrol
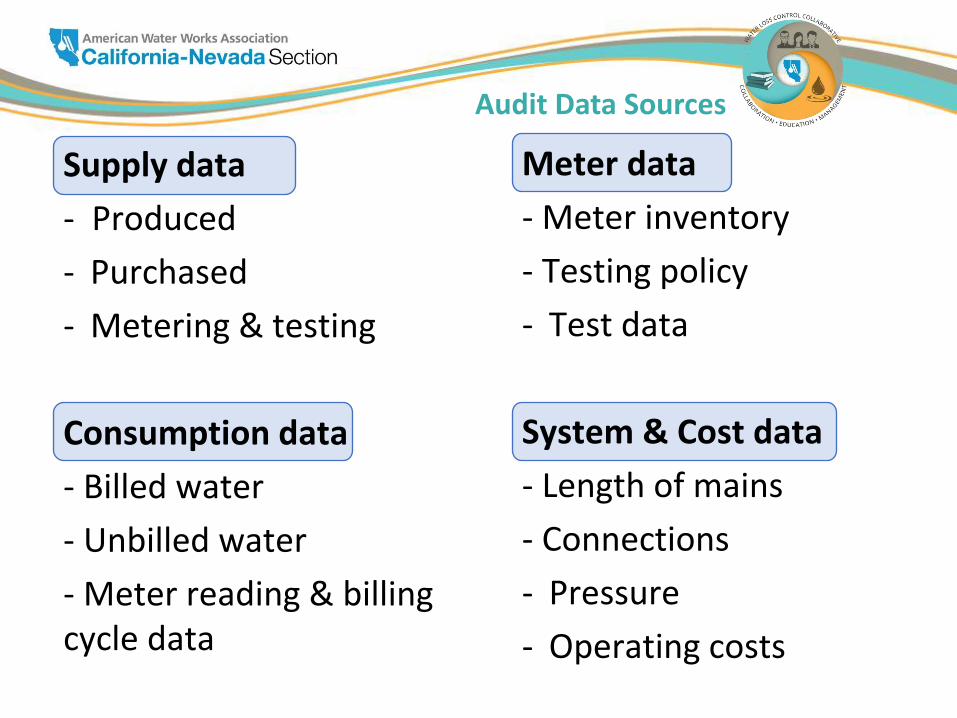
Audit Data Sources
Supply data
- Produced
- Purchased
- Metering & testing
Consumption data
- Billed water
- Unbilled water
- Meter reading & billing cycle data
Meter data
- Meter inventory
- Testing policy
- Test data
System & Cost data
- Length of mains
- Connections
- Pressure
- Operating costs
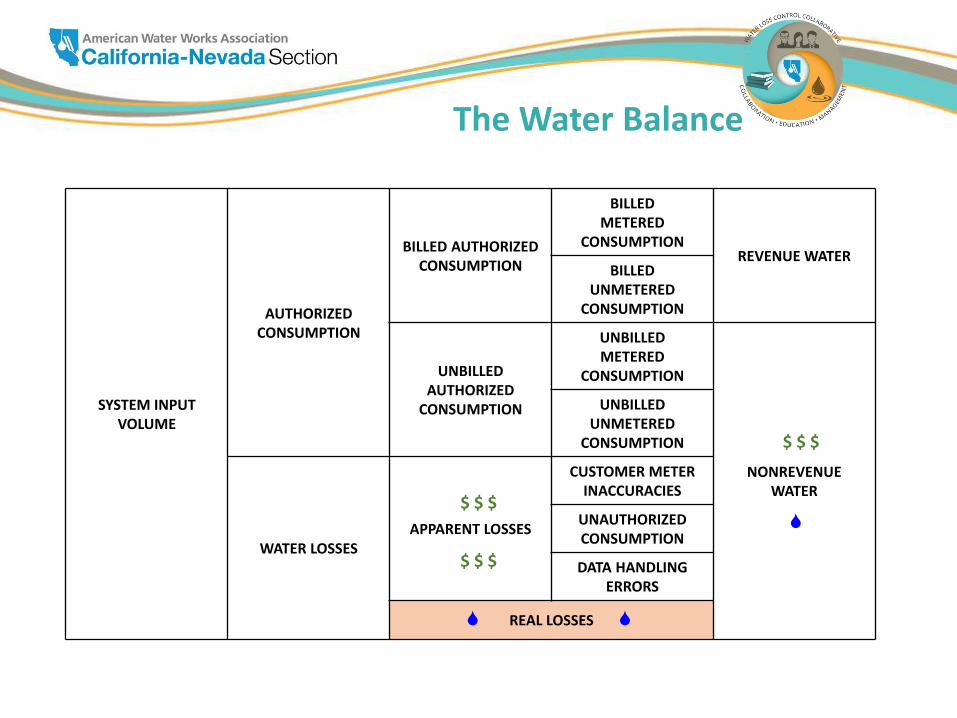
SYSTEM INPUT VOLUME
AUTHORIZEDCONSUMPTION
BILLED AUTHORIZED CONSUMPTION
BILLEDMETERED
CONSUMPTIONREVENUE WATER
BILLEDUNMETERED
CONSUMPTION
UNBILLED AUTHORIZED
CONSUMPTION
UNBILLEDMETERED
CONSUMPTION
NONREVENUE WATER
UNBILLEDUNMETERED
CONSUMPTION
WATER LOSSESAPPARENT LOSSES
CUSTOMER METER INACCURACIES
UNAUTHORIZED CONSUMPTION
DATA HANDLING ERRORS
REAL LOSSES
$ $ $
$ $ $
Own Sources: This is the volume of water input to a system from the water supplier’s own sources.
Own Sources: This is the volume of water input to a system from the water supplier’s own sources.
$ $ $
Own Sources: This is the volume of water input to a system from the water supplier’s own sources.
The Water Balance
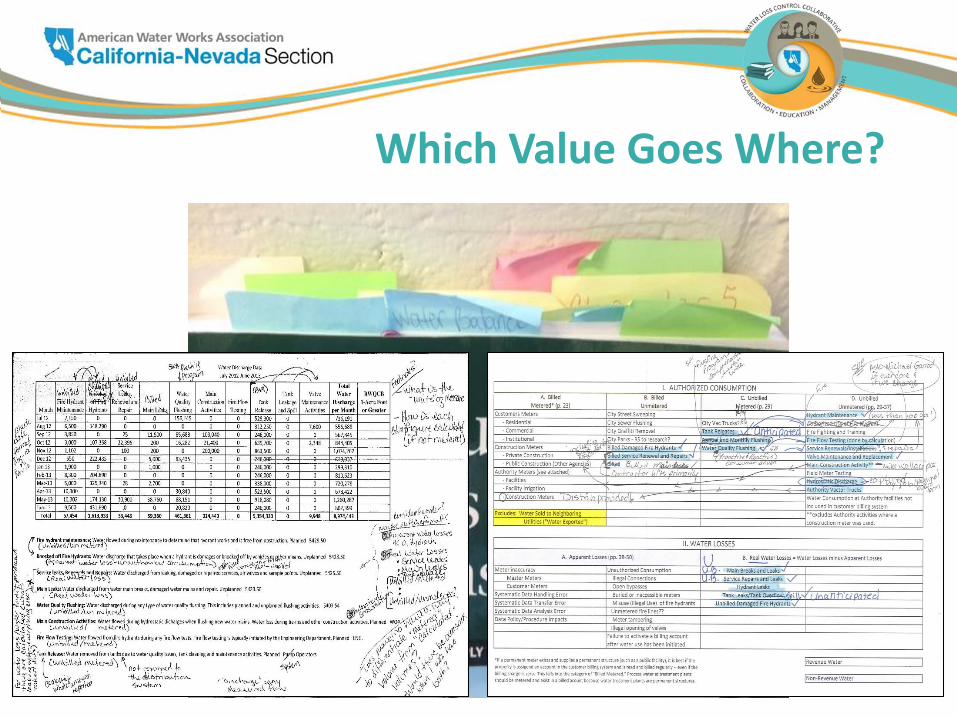
Which Value Goes Where?
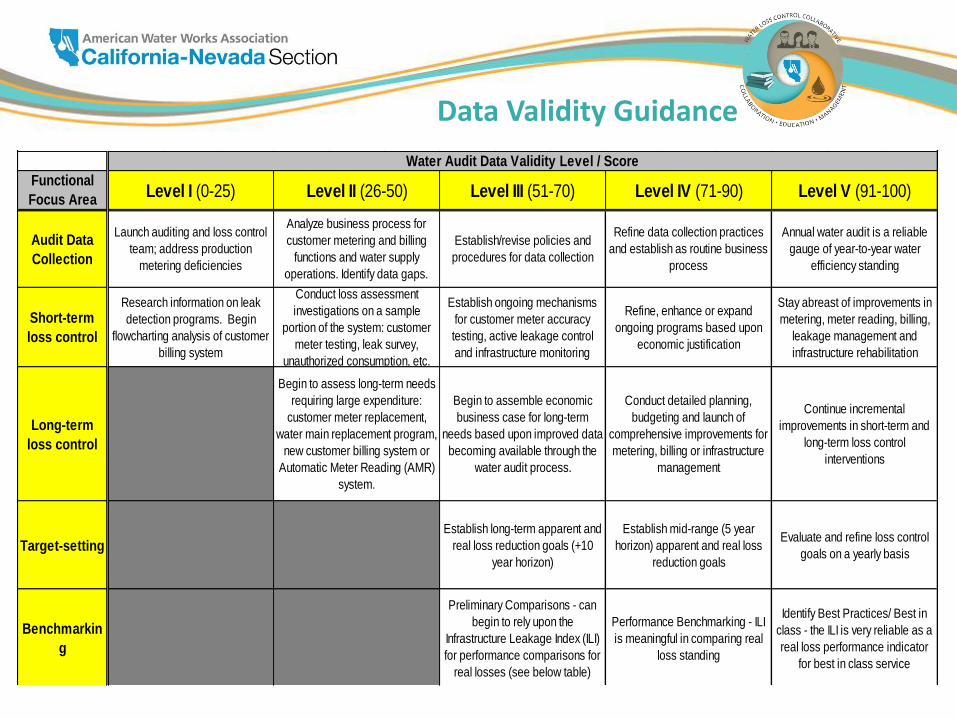
Functional
Focus Area
Audit Data
Collection
Short-term
loss control
Long-term
loss control
Target-setting
Benchmarkin
g
Identify Best Practices/ Best in
class - the ILI is very reliable as a
real loss performance indicator
for best in class service
For validity scores of 50 or below, the shaded blocks should not be focus areas until better data validity is achieved.
Preliminary Comparisons - can
begin to rely upon the
Infrastructure Leakage Index (ILI)
for performance comparisons for
real losses (see below table)
Performance Benchmarking - ILI
is meaningful in comparing real
loss standing
Continue incremental
improvements in short-term and
long-term loss control
interventions
Establish long-term apparent and
real loss reduction goals (+10
year horizon)
Establish mid-range (5 year
horizon) apparent and real loss
reduction goals
Evaluate and refine loss control
goals on a yearly basis
Begin to assess long-term needs
requiring large expenditure:
customer meter replacement,
water main replacement program,
new customer billing system or
Automatic Meter Reading (AMR)
system.
Begin to assemble economic
business case for long-term
needs based upon improved data
becoming available through the
water audit process.
Conduct detailed planning,
budgeting and launch of
comprehensive improvements for
metering, billing or infrastructure
management
Annual water audit is a reliable
gauge of year-to-year water
efficiency standing
Research information on leak
detection programs. Begin
flowcharting analysis of customer
billing system
Conduct loss assessment
investigations on a sample
portion of the system: customer
meter testing, leak survey,
unauthorized consumption, etc.
Establish ongoing mechanisms
for customer meter accuracy
testing, active leakage control
and infrastructure monitoring
Refine, enhance or expand
ongoing programs based upon
economic justification
Stay abreast of improvements in
metering, meter reading, billing,
leakage management and
infrastructure rehabilitation
Launch auditing and loss control
team; address production
metering deficiencies
Analyze business process for
customer metering and billing
functions and water supply
operations. Identify data gaps.
Establish/revise policies and
procedures for data collection
Refine data collection practices
and establish as routine business
process
Water Audit Data Validity Level / Score
Level I (0-25) Level II (26-50) Level III (51-70) Level IV (71-90) Level V (91-100)
Data Validity Guidance
California – CUWCC BMP1.2
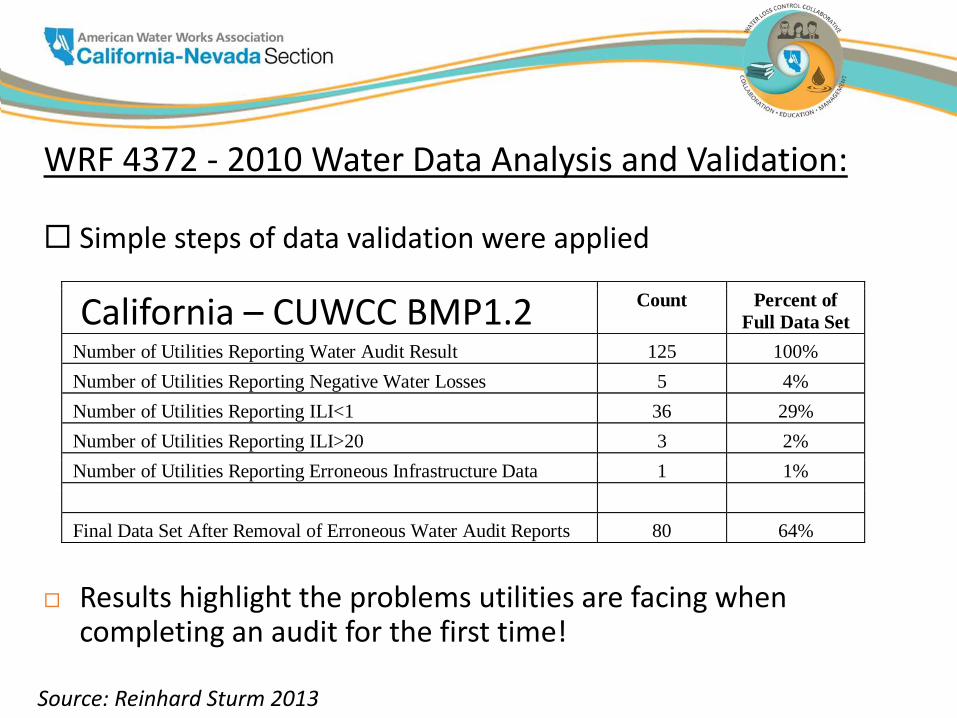
WRF 4372 - 2010 Water Data Analysis and Validation:
Simple steps of data validation were applied
Results highlight the problems utilities are facing when completing an audit for the first time!
Count Percent of
Full Data Set
Number of Utilities Reporting Water Audit Result 125 100%
Number of Utilities Reporting Negative Water Losses 5 4%
Number of Utilities Reporting ILI<1 36 29%
Number of Utilities Reporting ILI>20 3 2%
Number of Utilities Reporting Erroneous Infrastructure Data 1 1%
Final Data Set After Removal of Erroneous Water Audit Reports 80 64%
Source: Reinhard Sturm 2013
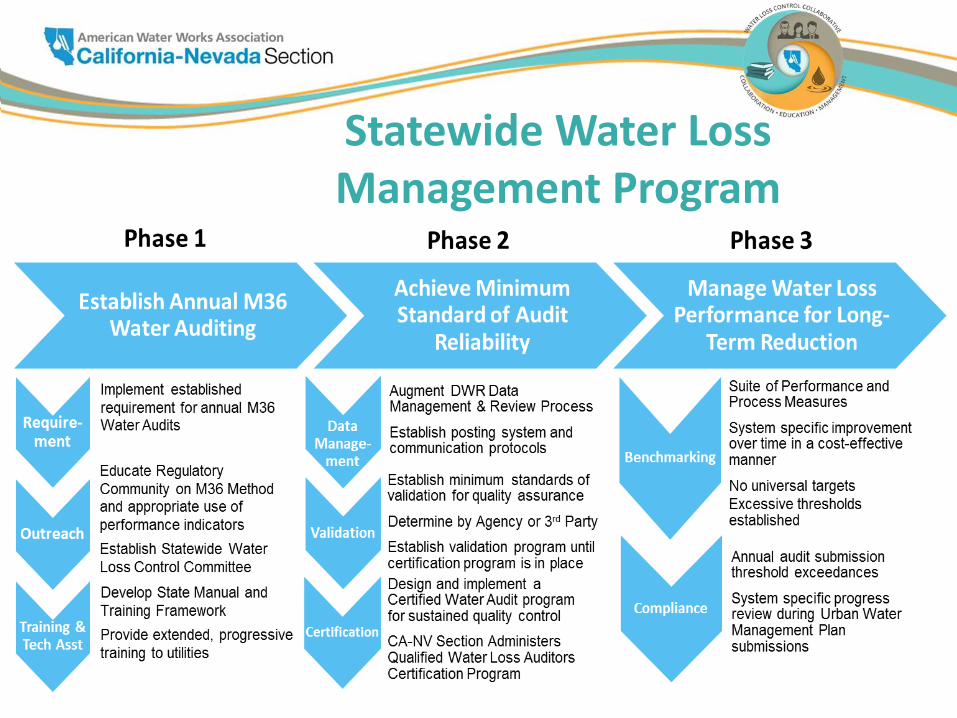
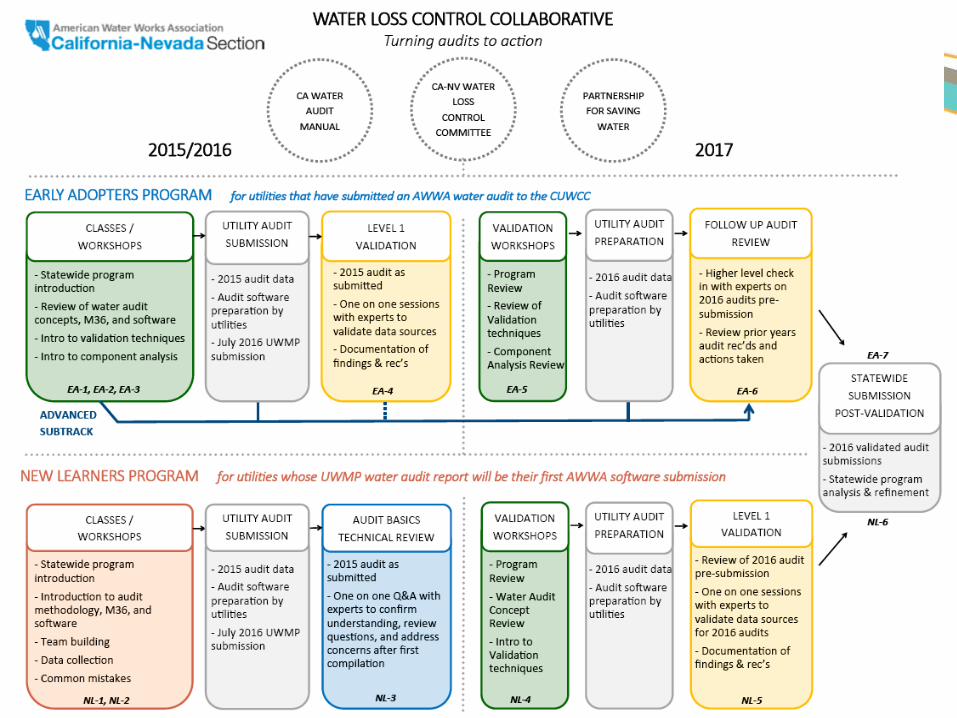
Statewide Water Loss Management Program
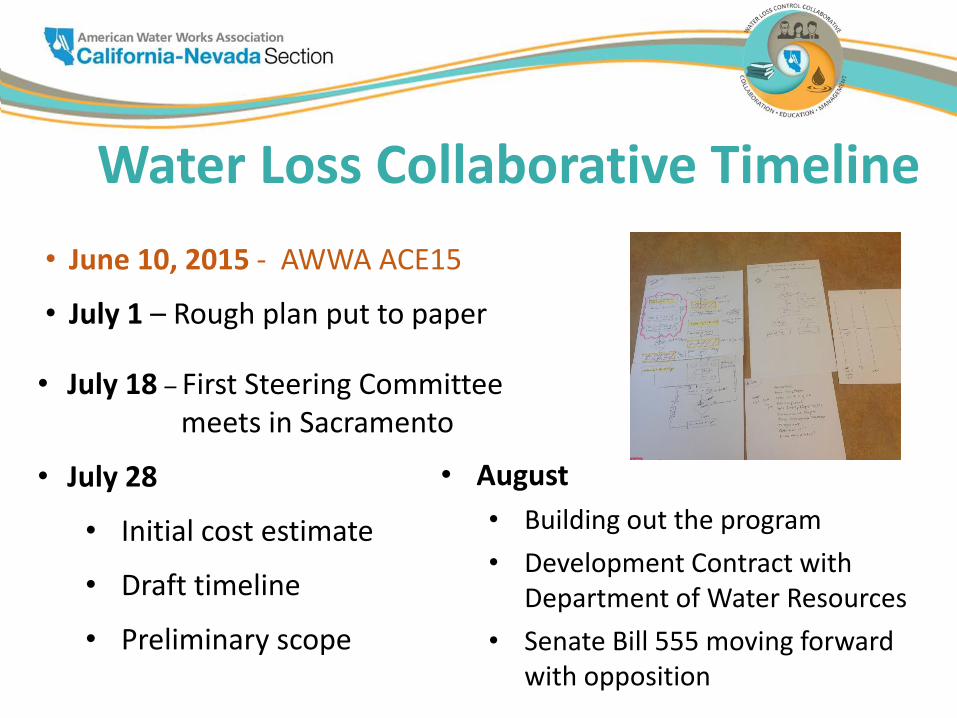
• June 10, 2015 - AWWA ACE15
• July 1 – Rough plan put to paper
Water Loss Collaborative Timeline
• August
• Building out the program
• Development Contract with Department of Water Resources
• Senate Bill 555 moving forward with opposition
• July 18 – First Steering Committee meets in Sacramento
• July 28
• Initial cost estimate
• Draft timeline
• Preliminary scope
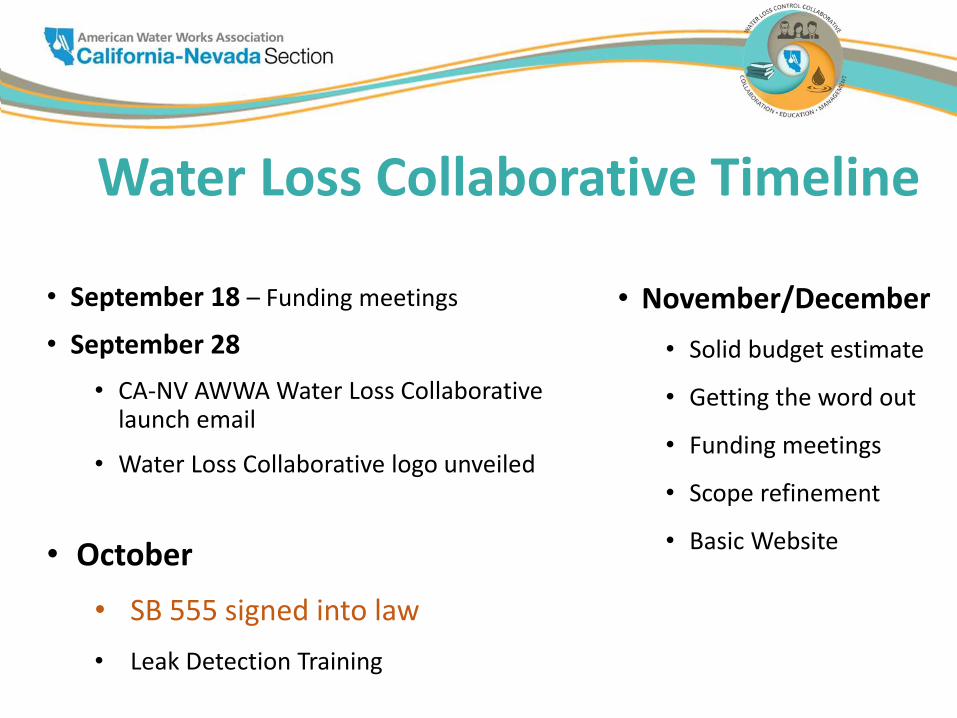
• September 18 – Funding meetings
• September 28
• CA-NV AWWA Water Loss Collaborative launch email
• Water Loss Collaborative logo unveiled
Water Loss Collaborative Timeline
• November/December
• Solid budget estimate
• Getting the word out
• Funding meetings
• Scope refinement
• Basic Website• October
• SB 555 signed into law
• Leak Detection Training
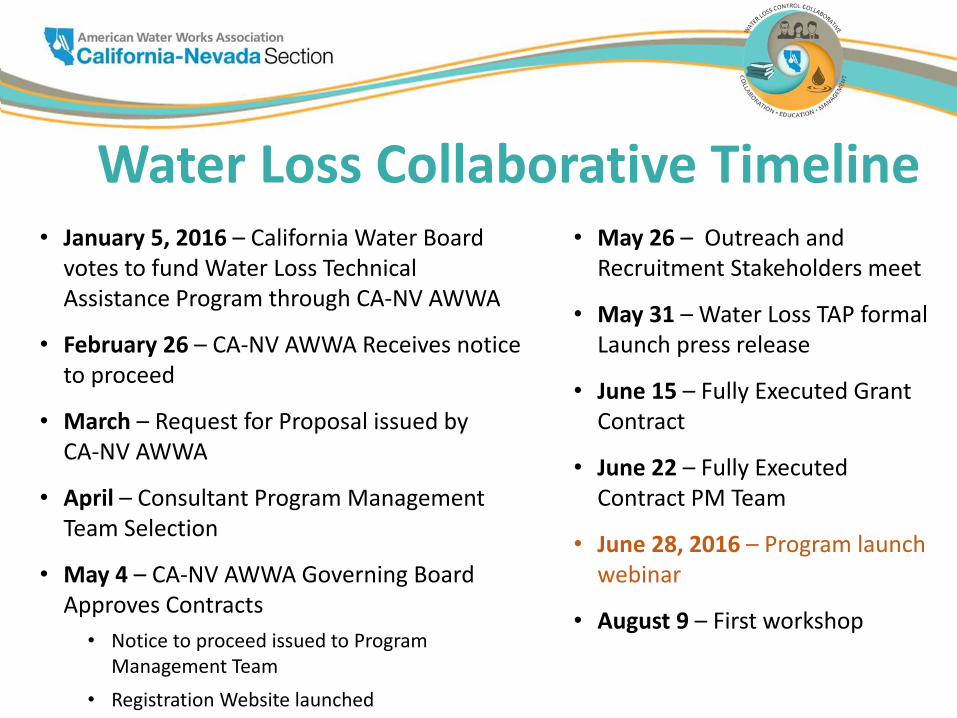
• January 5, 2016 – California Water Board votes to fund Water Loss Technical Assistance Program through CA-NV AWWA
• February 26 – CA-NV AWWA Receives notice to proceed
• March – Request for Proposal issued by CA-NV AWWA
• April – Consultant Program Management Team Selection
• May 4 – CA-NV AWWA Governing Board Approves Contracts
• Notice to proceed issued to Program Management Team
• Registration Website launched
Water Loss Collaborative Timeline• May 26 – Outreach and
Recruitment Stakeholders meet
• May 31 – Water Loss TAP formal Launch press release
• June 15 – Fully Executed Grant Contract
• June 22 – Fully Executed Contract PM Team
• June 28, 2016 – Program launch webinar
• August 9 – First workshop
15
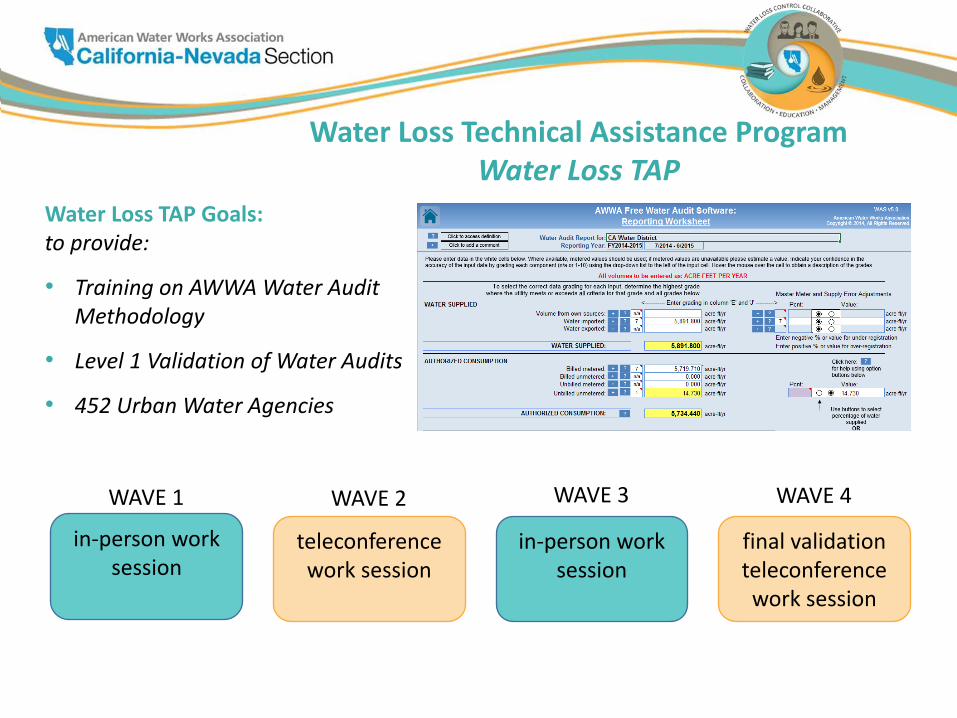
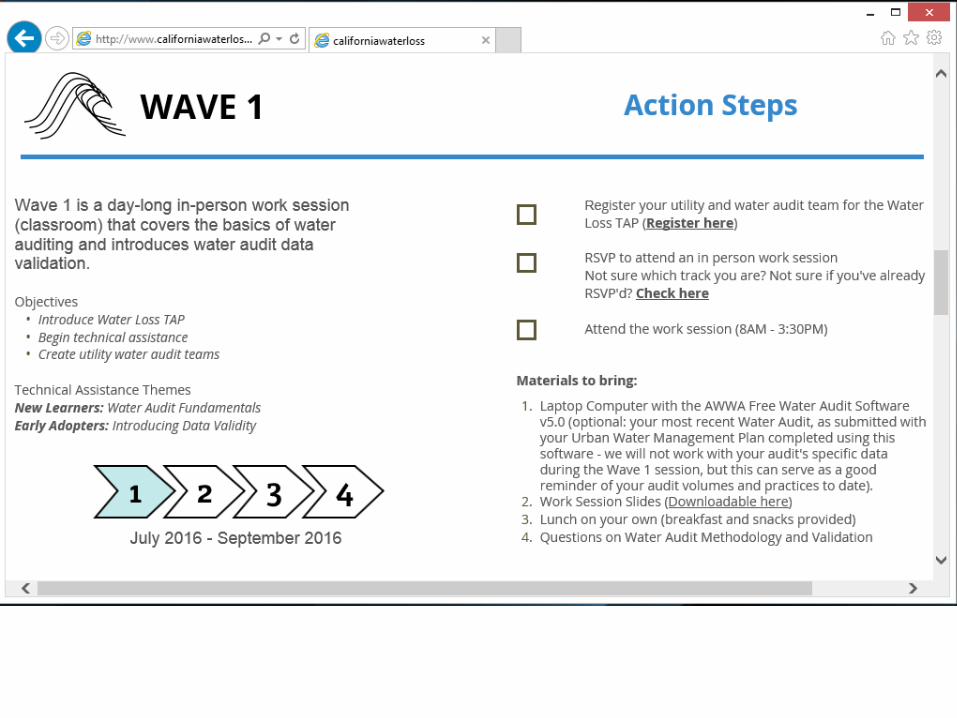
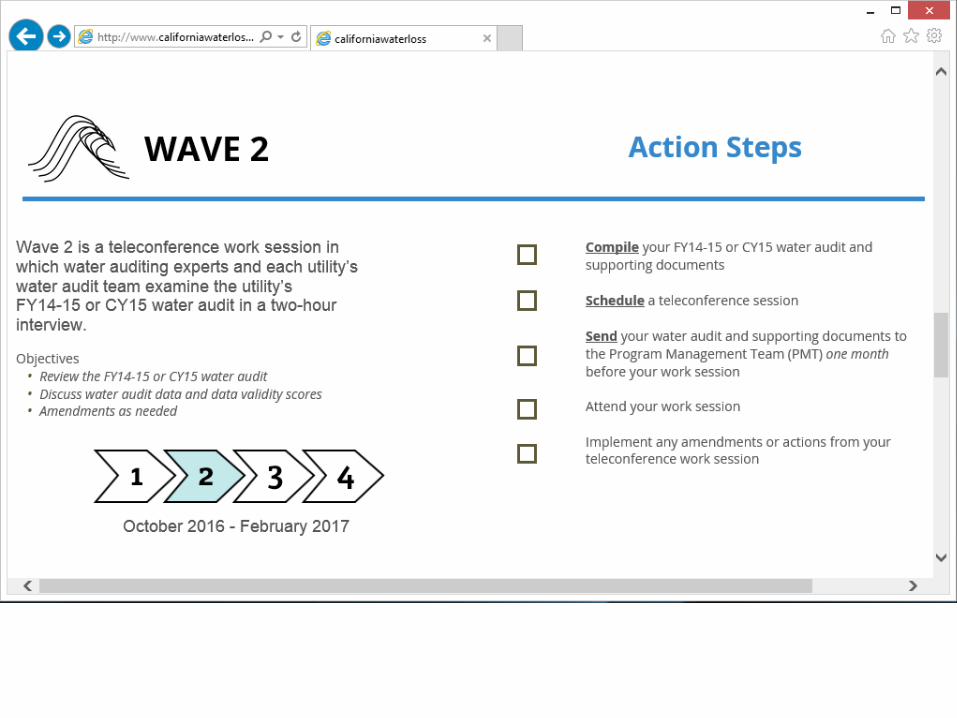
Water Loss Technical Assistance Program Water Loss TAP
Water Loss TAP Goals:to provide:
• Training on AWWA Water Audit Methodology
• Level 1 Validation of Water Audits
• 452 Urban Water Agencies
in-person work session
teleconference work session
in-person work session
final validationteleconference work session
WAVE 1 WAVE 2 WAVE 3 WAVE 4
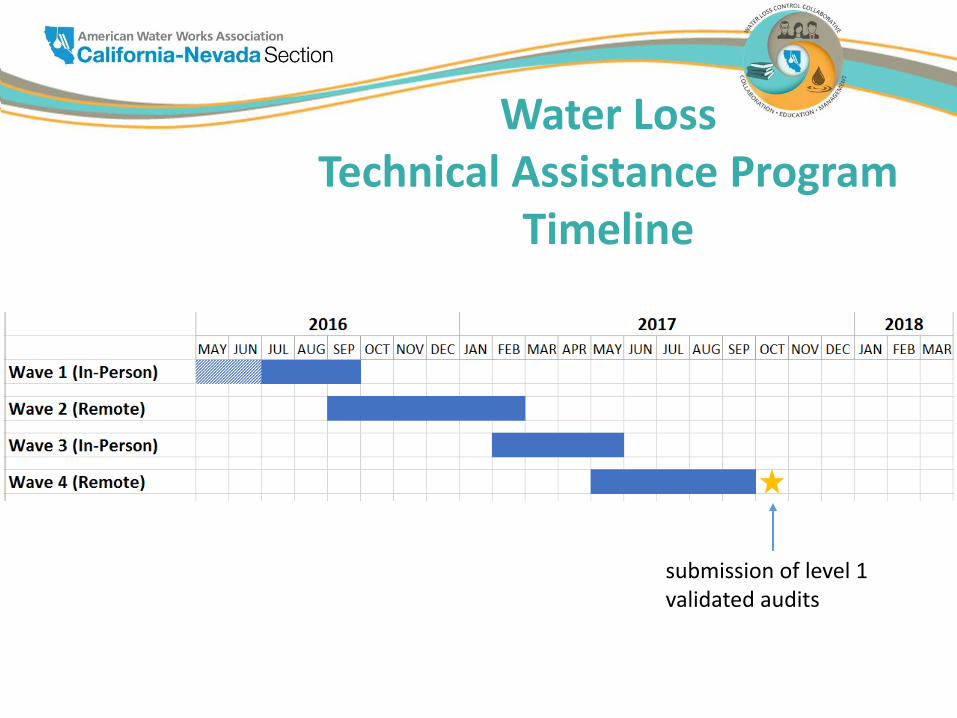
Water LossTechnical Assistance Program
Timeline
submission of level 1 validated audits
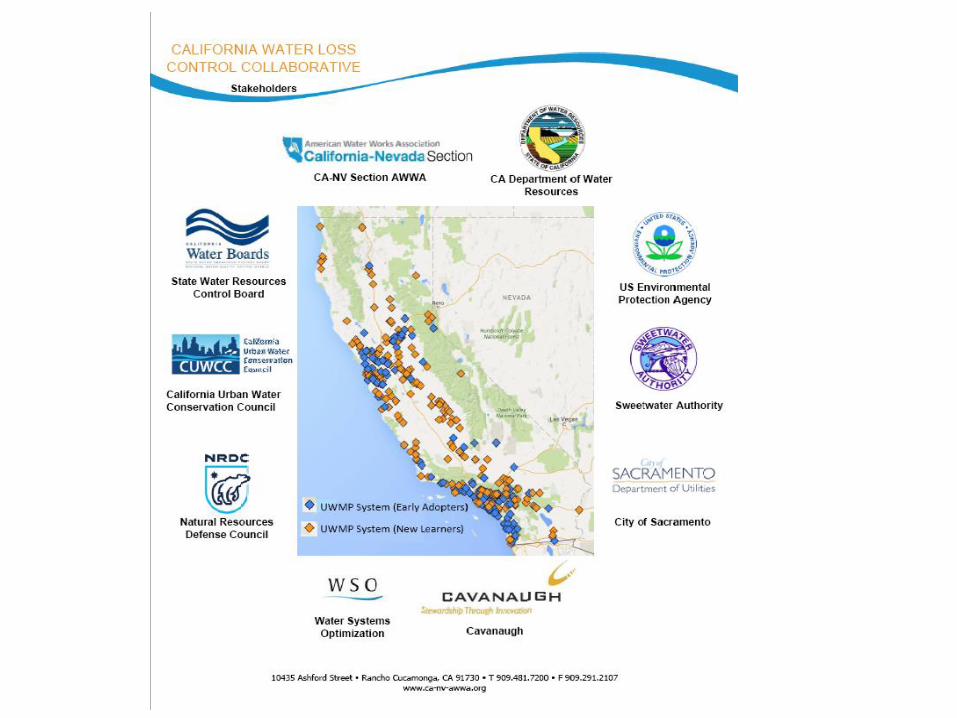
CALIFORNIA WATER LOSS CONTROL COLLABORATIVE
Water Loss Technical Assistance ProgramAKA: the Water Loss TAP
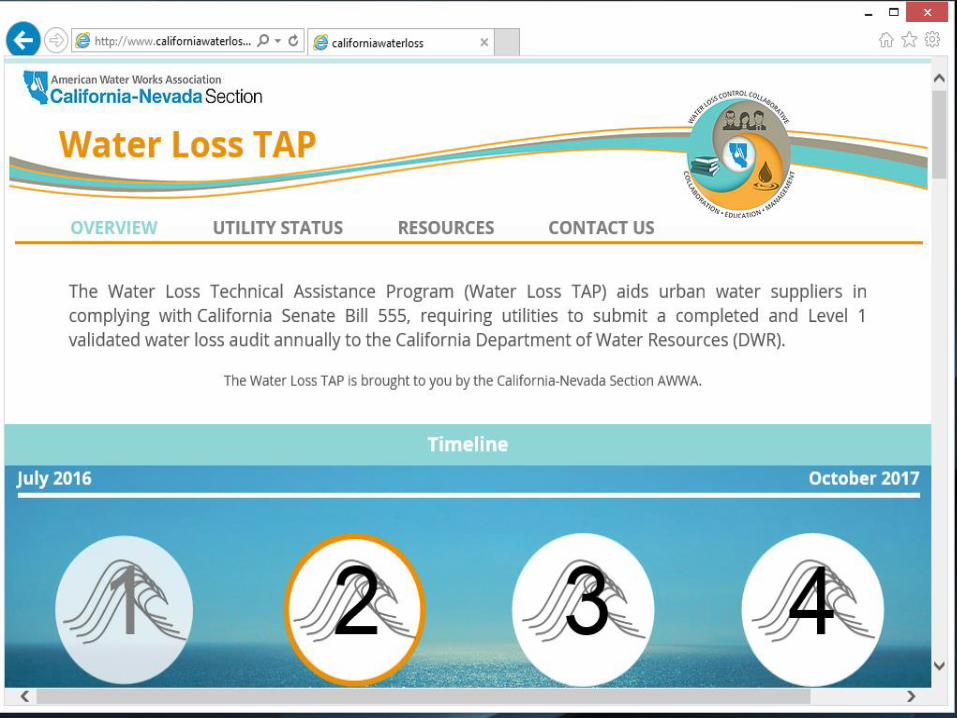
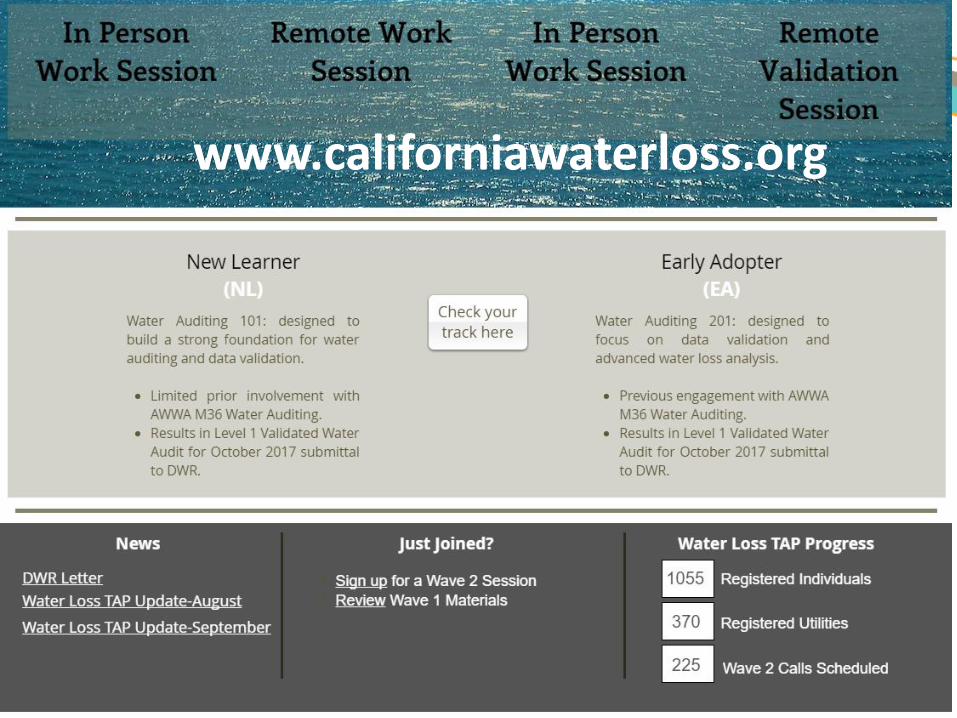
www.californiawaterloss.org
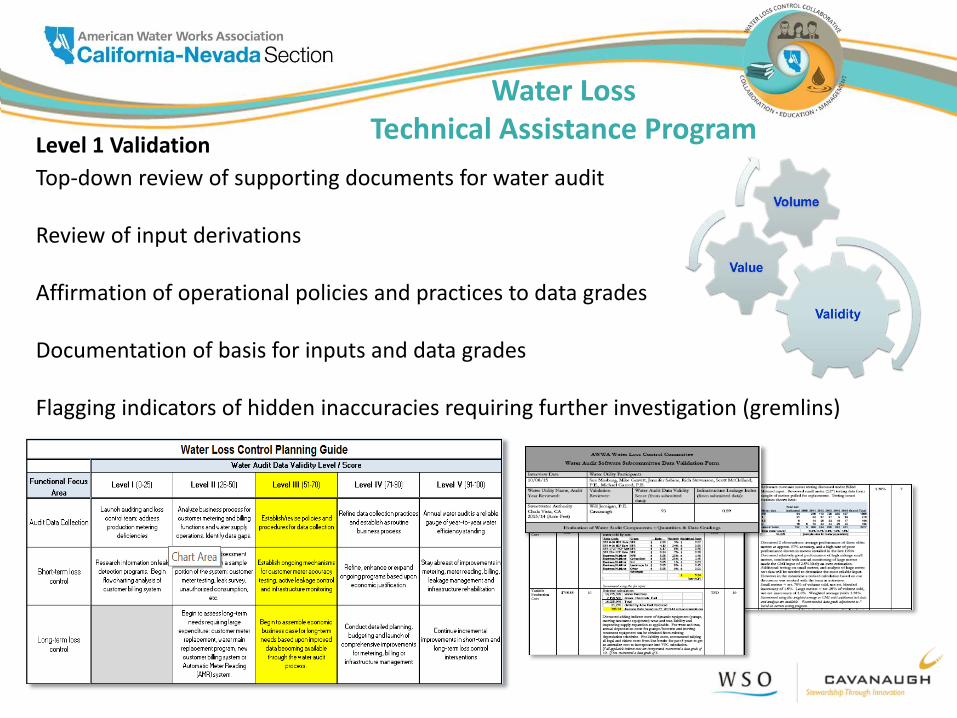
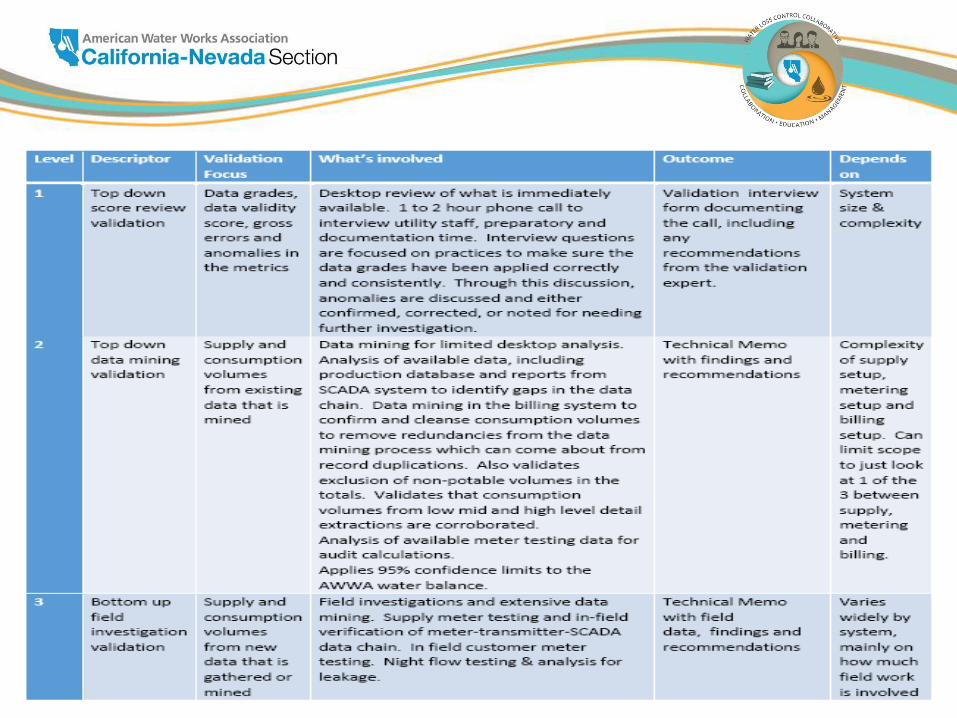
Water Loss Technical Assistance Program
Level 1 Validation
Top-down review of supporting documents for water audit
Review of input derivations
Affirmation of operational policies and practices to data grades
Documentation of basis for inputs and data grades
Flagging indicators of hidden inaccuracies requiring further investigation (gremlins)
24
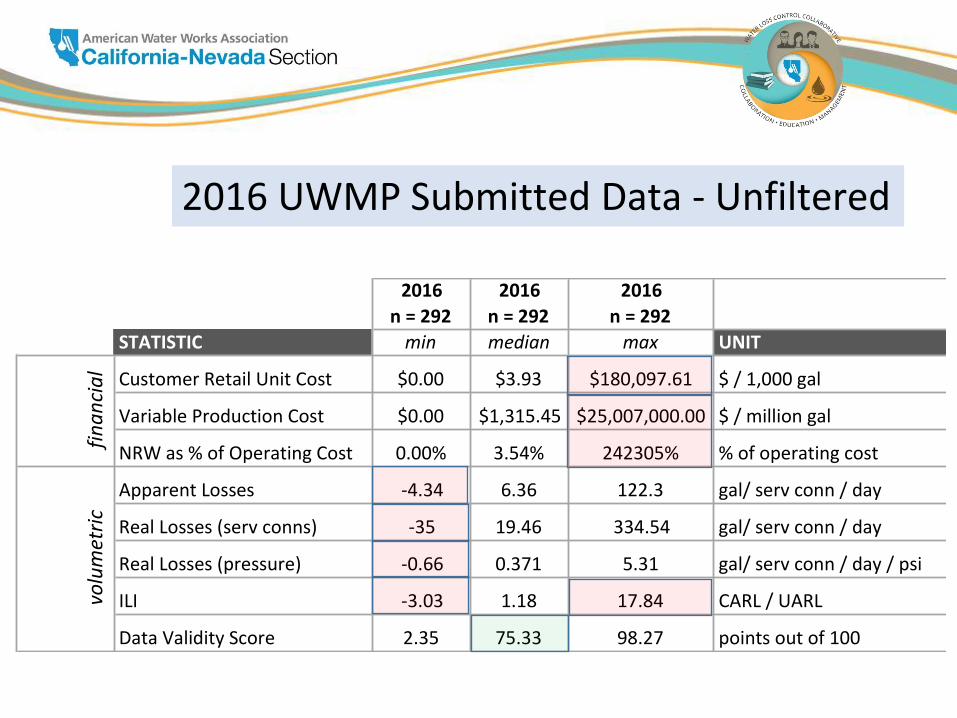
2016 UWMP Submitted Data - Unfiltered
2016
n=292
2016
n=292
2016
n=292
STATISTIC min median max UNIT
CustomerRetailUnitCost $0.00 $3.93 $180,097.61 $/1,000gal
VariableProductionCost $0.00 $1,315.45 $25,007,000.00 $/milliongal
NRWas%ofOperatingCost 0.00% 3.54% 242305% %ofoperatingcost
ApparentLosses -4.34 6.36 122.3 gal/servconn/day
RealLosses(servconns) -35 19.46 334.54 gal/servconn/day
RealLosses(pressure) -0.66 0.371 5.31 gal/servconn/day/psi
ILI -3.03 1.18 17.84 CARL/UARL
DataValidityScore 2.35 75.33 98.27 pointsoutof100
financial
volumetric
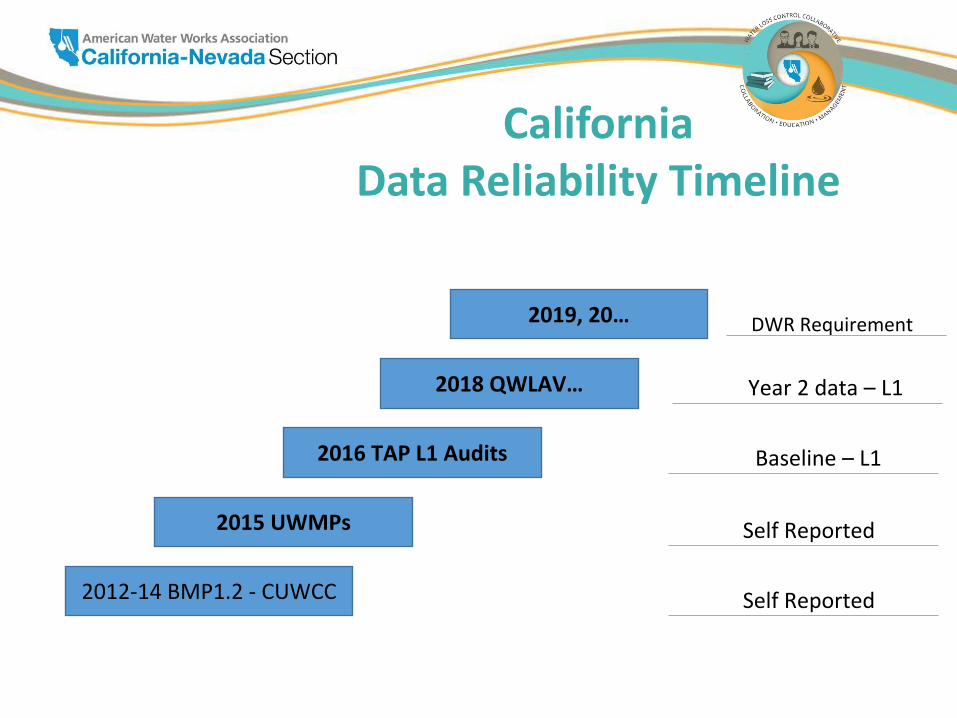
2012-14 BMP1.2 - CUWCC
2015 UWMPs
2016 TAP L1 Audits
2018 QWLAV…
DWR Requirement
Self Reported
2019, 20…
Baseline – L1
Self Reported
Year 2 data – L1
California Data Reliability Timeline
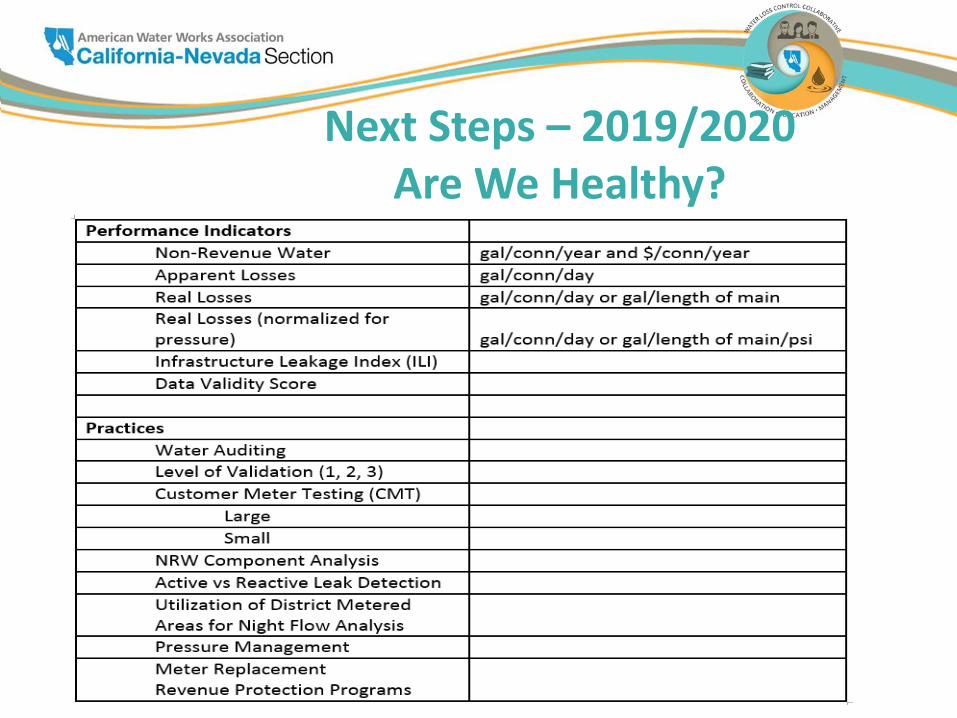
Next Steps – 2019/2020Are We Healthy?
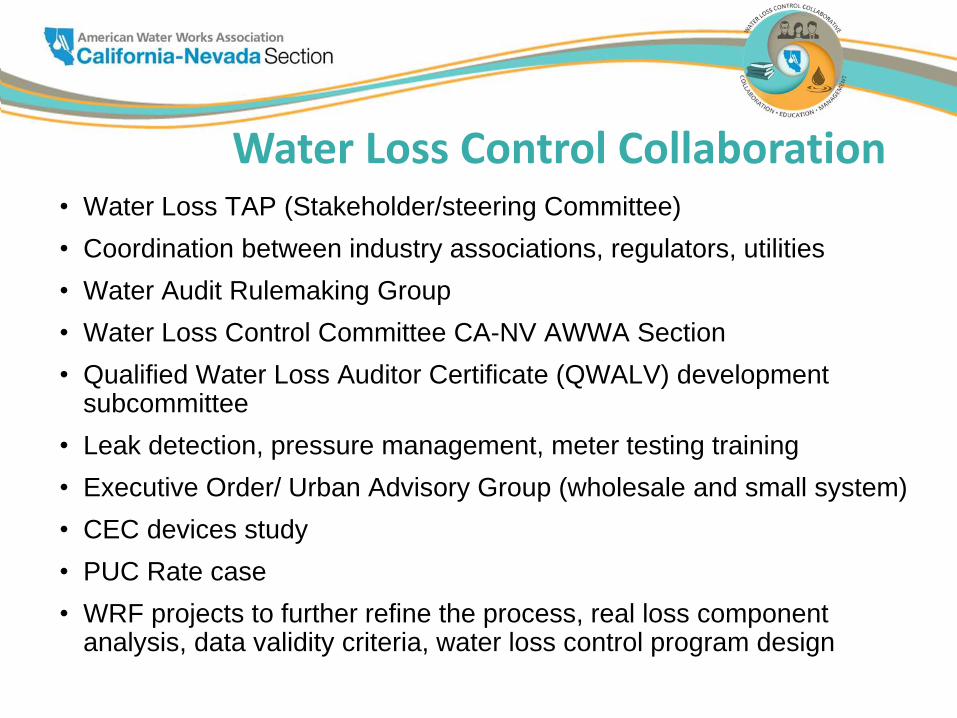
• Water Loss TAP (Stakeholder/steering Committee)
• Coordination between industry associations, regulators, utilities
• Water Audit Rulemaking Group
• Water Loss Control Committee CA-NV AWWA Section
• Qualified Water Loss Auditor Certificate (QWALV) development subcommittee
• Leak detection, pressure management, meter testing training
• Executive Order/ Urban Advisory Group (wholesale and small system)
• CEC devices study
• PUC Rate case
• WRF projects to further refine the process, real loss component analysis, data validity criteria, water loss control program design
Water Loss Control Collaboration