implementing goal-driven measurement - census.gov · implementing goal-driven measurement overview...
TRANSCRIPT
Sponsored by the U.S. Department of Defense© 2008 by Carnegie Mellon University
This material is approved for public release. Distribution is limited by the Software Engineering Institute to attendees.
Software Engineering InstituteCarnegie Mellon UniversityPittsburgh, PA 15213
Implementing Goal-Driven Measurement
Overview
© 2008 Carnegie Mellon University
Goal-Driven Measurement
2
SEI/SEMA, September 2008
Outline
Benefits of Measurement
Goal-Driven Measurement
Example –Enterprise Wide Metric Program

© 2008 Carnegie Mellon University
Goal-Driven Measurement
3
SEI/SEMA, September 2008
Measurements Are Used for Many Purposes
Aggregate Data• corporate/industry comparisons• business decisions
Manage Projects• plan• track
Describe Products• qualify• classify
Improve Processes• understand• control
Baseline Measurement Process• communicate clearly• use process consistently

© 2008 Carnegie Mellon University
Goal-Driven Measurement
4
SEI/SEMA, September 2008
Measurement & Process Improvement
Software measurement programs are best initiated as part of a process improvement program that• clarifies measurement’s purpose and role• clarifies which measures to collect• provides a mechanism for acting on findings• involves the technical staff at all levels
Process improvement must have a measurement component that• focuses on program objectives• evaluates process effectiveness• determines program benefits
© 2008 Carnegie Mellon University
Goal-Driven Measurement
5
SEI/SEMA, September 2008
Benefits
Measurement does not by itself improve the process; however, the visibility it gives provides insight into planning, controlling, managing, and improving. For example:
• historical data help us predict and plan
• actual versus plan data helps us communicate progress and support decision making
• analyzing trends helps us focus on problem areas
• monitoring process improvement activities helps us identify what works and what does not

© 2008 Carnegie Mellon University
Goal-Driven Measurement
6
SEI/SEMA, September 2008
Benefit of Measurement
FaultOrigin
FaultDetection
Cost perFault
Require-ments Design Coding Functional
TestSystem
TestFieldUse
10%40%
50%
50%
3% 5% 7% 25%10%
~1.KDM ~1.KDM ~1.KDM ~6.KDM
~12.KDM
~20.KDM
Data provided by Dr. Paulish of Siemens from “Engineering an Effective Software Measurement Program”
KDM=kilo-deutsch marks
© 2008 Carnegie Mellon University
Goal-Driven Measurement
7
SEI/SEMA, September 2008
Goal-Driven Measurement
When using goal-driven measurement, the primary question is not:
“What indicators or measures should I use?”
rather, it is:
“What do I want to know or learn?”
Goal-driven measurement is not based on a predefined set of measures and Indicators.

© 2008 Carnegie Mellon University
Goal-Driven Measurement
8
SEI/SEMA, September 2008
Goal-Driven Measurement
Goal(s)
Questions
Indicators
Measures
Goal(s)
Question 1 Question 2 … Question n
Reporting Periods
Total SLOC Planned
Actual
Weeks
Num
ber
Module
Trou
ble
Rep
orts
Size Effort … Defects Milestone Dates

© 2008 Carnegie Mellon University
Goal-Driven Measurement
9
SEI/SEMA, September 2008
What Are Indicators?
An indicator is usually a graph or table that you define for your program needs.
An indicator is a representation of a measure or group of measures that provides information about a project issue.
Indicators frequently make comparisons between two values, such as planned and actual values.
An indicator is a measure or combination of measures that provides insight into the software process, a project, or the product itself.
© 2008 Carnegie Mellon University
Goal-Driven Measurement
10
SEI/SEMA, September 2008
Using Indicators to Identify Measures
When you are trying to gain insight into an issue or question, it is sometimes easier to think of how data would be displayed to identify the measures you need.
• A graph is easy to “think about” and “talk to” when you are getting input from others.

© 2008 Carnegie Mellon University
Goal-Driven Measurement
11
SEI/SEMA, September 2008
GQ(I)M Puts Each Measure in the Context of Addressing Goal-Related Questions
MeasurementGoal 1
Question 1
Measure 1 Measure 2 Measure k
• • •
• • •
• • •
MeasurementGoal 2
MeasurementGoal n
Indicator 1 • • •
Measure 3
Question 2 Question 3 Question m
Indicator 2 Indicator j

© 2008 Carnegie Mellon University
Goal-Driven Measurement
12
SEI/SEMA, September 2008
Why Start with Goals? Why Not with Measures?
ScenarioOrganization “A” is collecting the following information
• Staff (full time equivalent)– total (actual, planned) per month
• Defects– severity, length of time open
• Requirements– total, TBDs, cumulative changes by month
• Test Cases– number passed, in analysis, not run
Is this the “right” stuff to collect?What questions are these measures trying to answer?

© 2008 Carnegie Mellon University
Goal-Driven Measurement
13
SEI/SEMA, September 2008
Are These the Right Charts to Answer Your Questions?
Test Case Completion by Function
05
1015202530354045
Jan-
98
Mar
-98
May
-98
Jul-9
8
Sep
-98
Nov
-98
Jan-
99
Mar
-99
May
-99
Jul-9
9
Sep
-99
Nov
-99
As of Jul 20
Build 1Build 2
Planned
Actual
Staffing Levels
Num
ber o
f FTE
Requirements
1 2 3 4 5 6 7 8 9 10
100
200
300
400
500
600
Months
Total
Cumulative Changes
TBD Now
Requirements
1 2 3 4 5 6 7 8 9 10
100
200
300
400
500
600
100
200
300
400
500
600
Months
Total
Cumulative Changes
TBD Now
Number of TBDs Over Time
6 7
69
221212
4
2
4
16
7 4
2
12
6
34
2
0
10
20
30
40
50
60
70
80
Funct1
Status as of: 2/24/00
Funct2
Funct3
Funct7
Funct8
Funct5
Funct6
Funct4
1456
PassIn AnalysisNot RunFail
Test
Cas
es C
ompl
ete
x < 30 30 ≥
x < 60 60 ≥
x < 90 x ≥
90
Severity 1Severity 2Severity 3Severity 4Severity 5
SeverityLevels Totals
Totals
2 13 13 24 3 3 28 6 3 3
11 1
20 3 8 6
357
122047
As of 31 Jan 00
Number of DefectsThat Have Been Open x Days
© 2008 Carnegie Mellon University
Goal-Driven Measurement
14
SEI/SEMA, September 2008
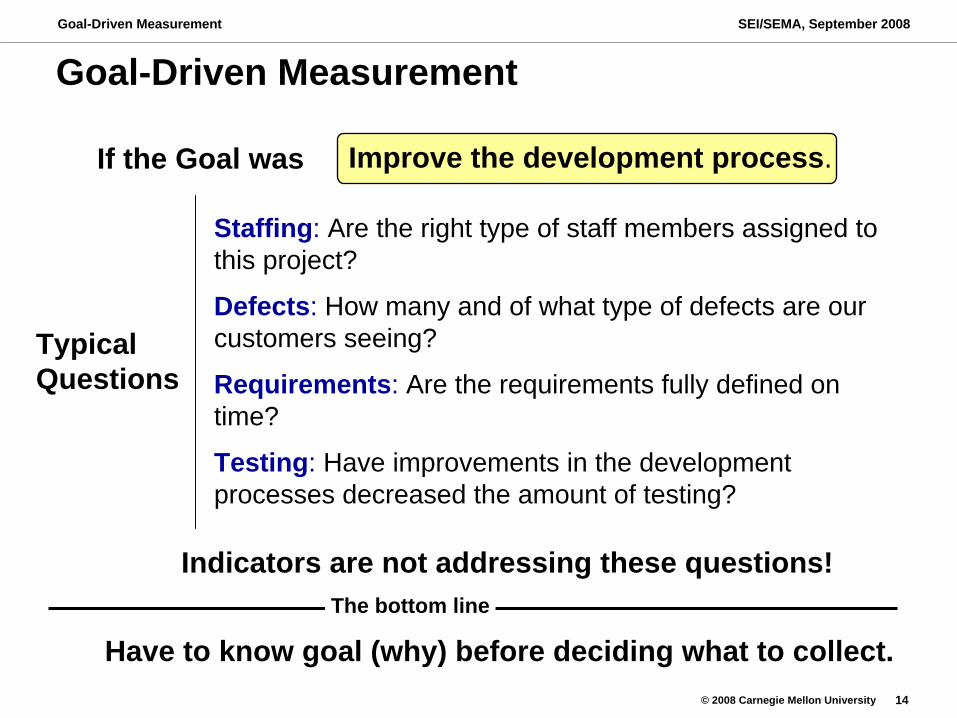
Goal-Driven Measurement
Staffing: Are the right type of staff members assigned to this project?
Defects: How many and of what type of defects are our customers seeing?
Requirements: Are the requirements fully defined on time?
Testing: Have improvements in the development processes decreased the amount of testing?
Indicators are not addressing these questions!
Improve the development process.
Typical Questions
If the Goal was
Have to know goal (why) before deciding what to collect.The bottom line

© 2008 Carnegie Mellon University
Goal-Driven Measurement
15
SEI/SEMA, September 2008
Measurement Clarifies and Focuses Understanding of Issues
…but it all starts with
GOALS
© 2008 Carnegie Mellon University
Goal-Driven Measurement
16
SEI/SEMA, September 2008
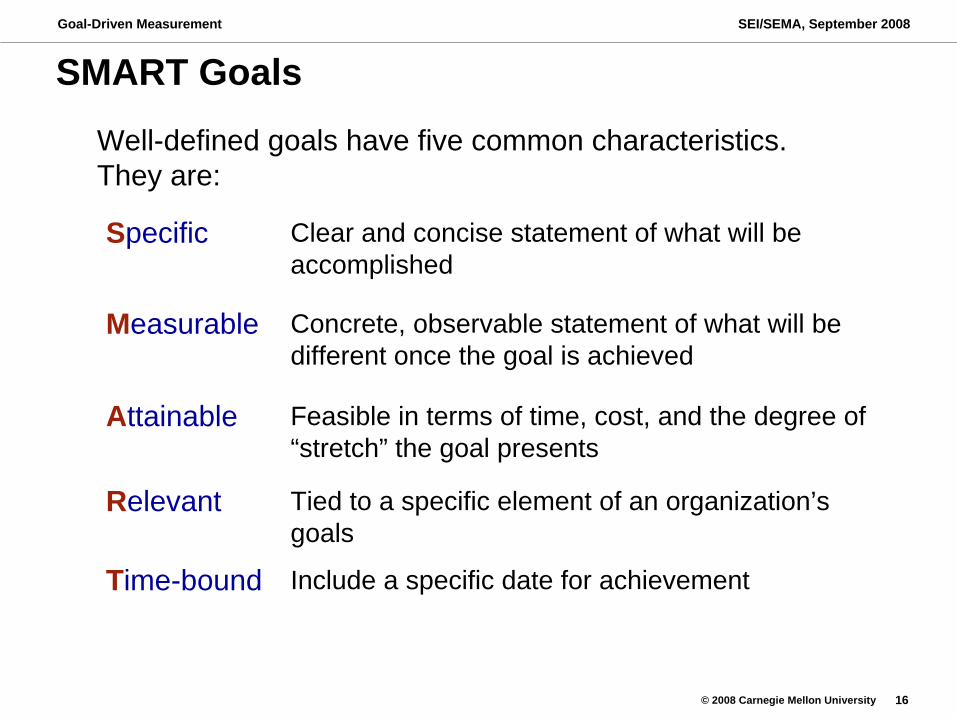
SMART Goals
Clear and concise statement of what will be accomplished
Specific
Concrete, observable statement of what will be different once the goal is achieved
Measurable
Feasible in terms of time, cost, and the degree of “stretch” the goal presents
Attainable
Tied to a specific element of an organization’s goals
Relevant
Include a specific date for achievementTime-bound
Well-defined goals have five common characteristics. They are:
© 2008 Carnegie Mellon University
Goal-Driven Measurement
17
SEI/SEMA, September 2008
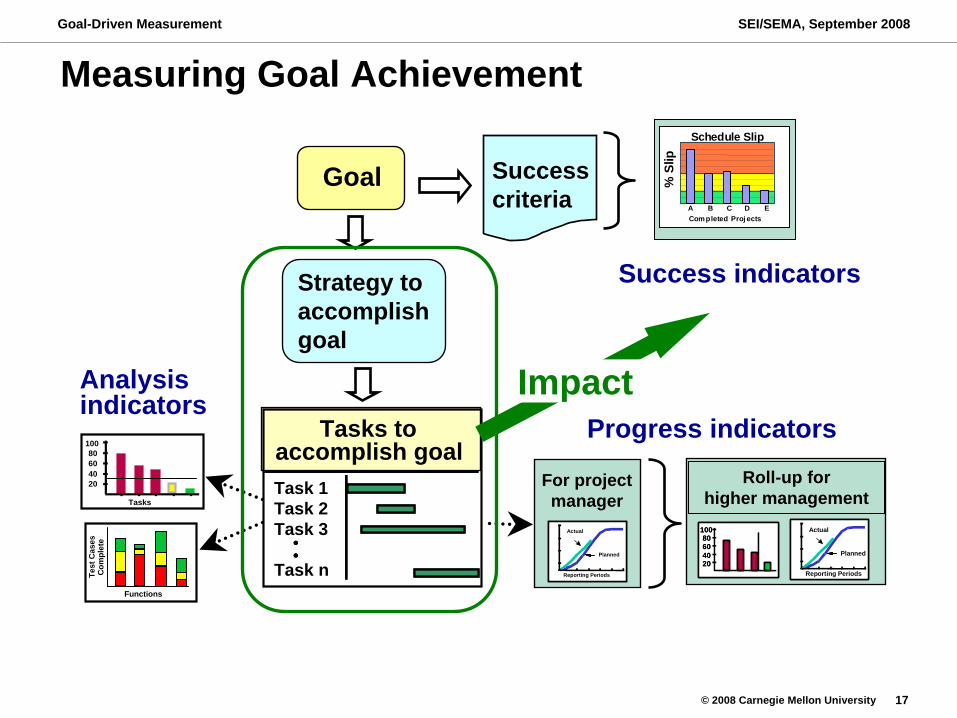
Measuring Goal Achievement
Success criteria
Success indicatorsStrategy to accomplish goal
Task 1Task 2Task 3
Task n••
Tasks to accomplish goal
••••
Progress indicators
Analysis indicators
80
204060
100
Tasks
Test
Cas
esC
ompl
ete
Functions
For project manager
Reporting Periods
Planned
Actual
Reporting Periods
Planned
Actual
Roll-up for higher management
Reporting Periods
Planned
Actual
Reporting Periods
Planned
Actual80
204060
10080
204060
10080
204060
100
GoalWeeks
After Deli ver y
Customer Detected DefectsPercent Towards Threshold
05
101520253035404550
Proj. A
Proj. B
Proj. C
ProjD
Proj. E
Compl eted Proj ects
% S
lip
Schedule Slip
A B C D ECompleted Proj ects
% S
lip
Schedule Slip
Weeks After Deli ver y
Customer Detected DefectsPercent Towards Threshold
05
101520253035404550
05
101520253035404550
Proj. A
Proj. B
Proj. C
ProjD
Proj. E
Compl eted Proj ects
% S
lip
Schedule Slip
A B C D ECompleted Proj ects
% S
lip
Schedule Slip
Impact
© 2008 Carnegie Mellon University
Goal-Driven Measurement
18
SEI/SEMA, September 2008
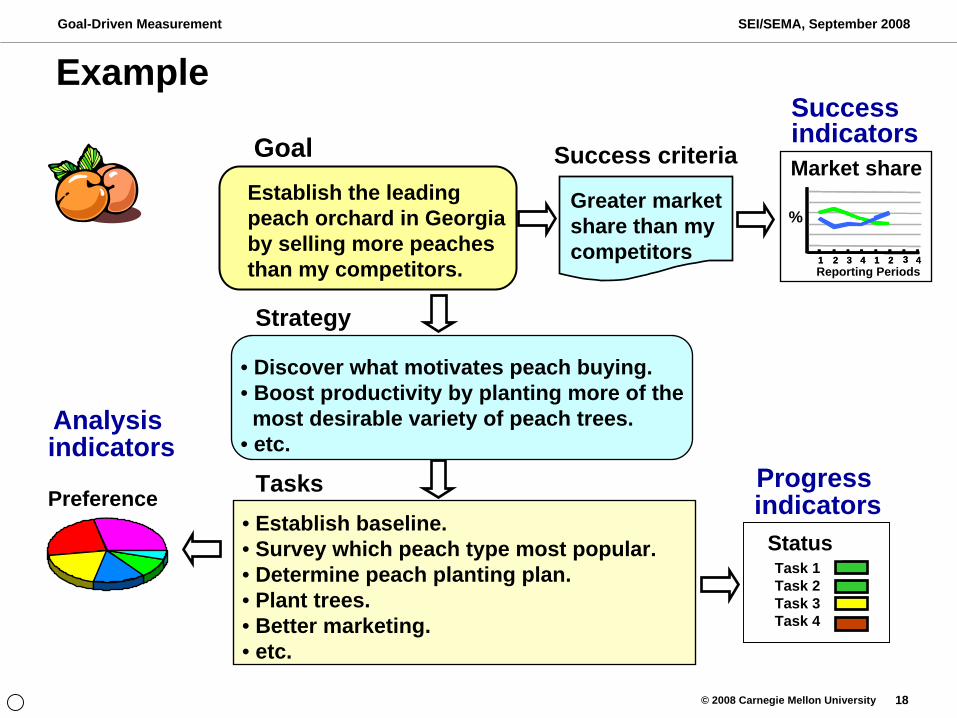
Example
Establish the leading peach orchard in Georgia by selling more peaches than my competitors.
Goal
1 2 3 4 1 2 3 4
%
Reporting Periods 1 2 3 4 1 2 3 4
Market share
Success indicators
Greater market share than my competitors
Success criteria
Strategy
• Discover what motivates peach buying.• Boost productivity by planting more of the
most desirable variety of peach trees.• etc.
Tasks• Establish baseline.• Survey which peach type most popular.• Determine peach planting plan.• Plant trees.• Better marketing. • etc.
Task 1Task 2Task 3Task 4
Status
Progress indicators
Analysis indicators
Preference
© 2008 Carnegie Mellon University
Goal-Driven Measurement
19
SEI/SEMA, September 2008
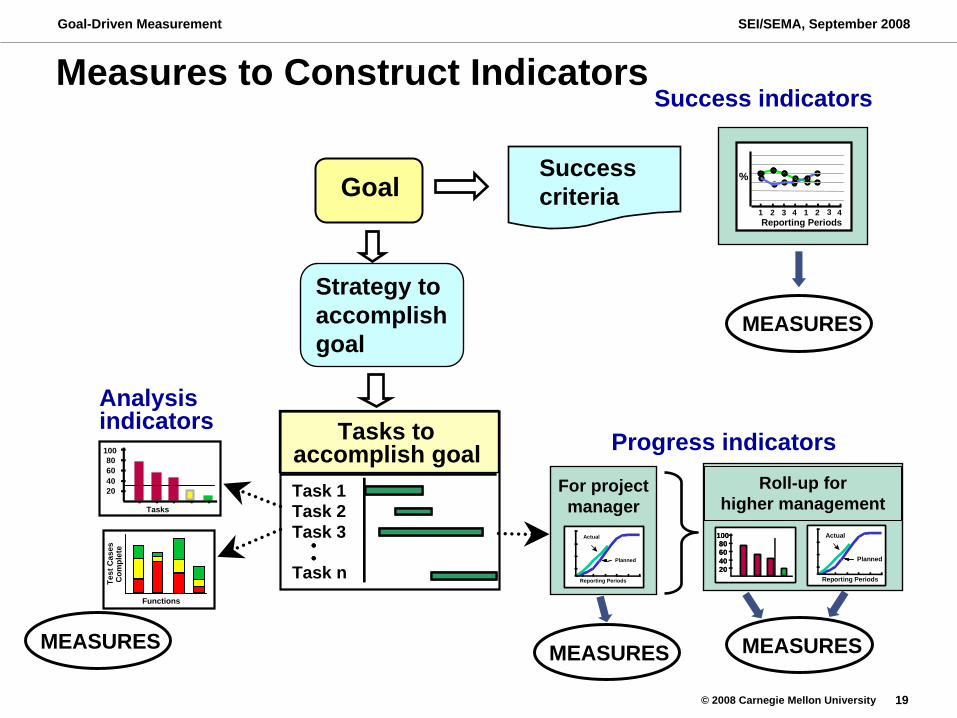
Measures to Construct Indicators
Goal
Strategy to accomplish goal
Success criteria
1 2 3 4 1 2 3 4
%
Reporting Periods
Success indicators
Task 1Task 2Task 3
Task n••
Tasks to accomplish goal
••••
Analysis indicators
80
204060
100
Tasks
Test
Cas
esC
ompl
ete
Functions
For project manager
Reporting Periods
Planned
Actual
Reporting Periods
Planned
Actual
Roll-up for higher management
Reporting Periods
Planned
Actual
Reporting Periods
Planned
Actual80
204060
10080
204060
10080
204060
100
Progress indicators
MEASURES
MEASURES
MEASURESMEASURES
© 2008 Carnegie Mellon University
Goal-Driven Measurement
20
SEI/SEMA, September 2008
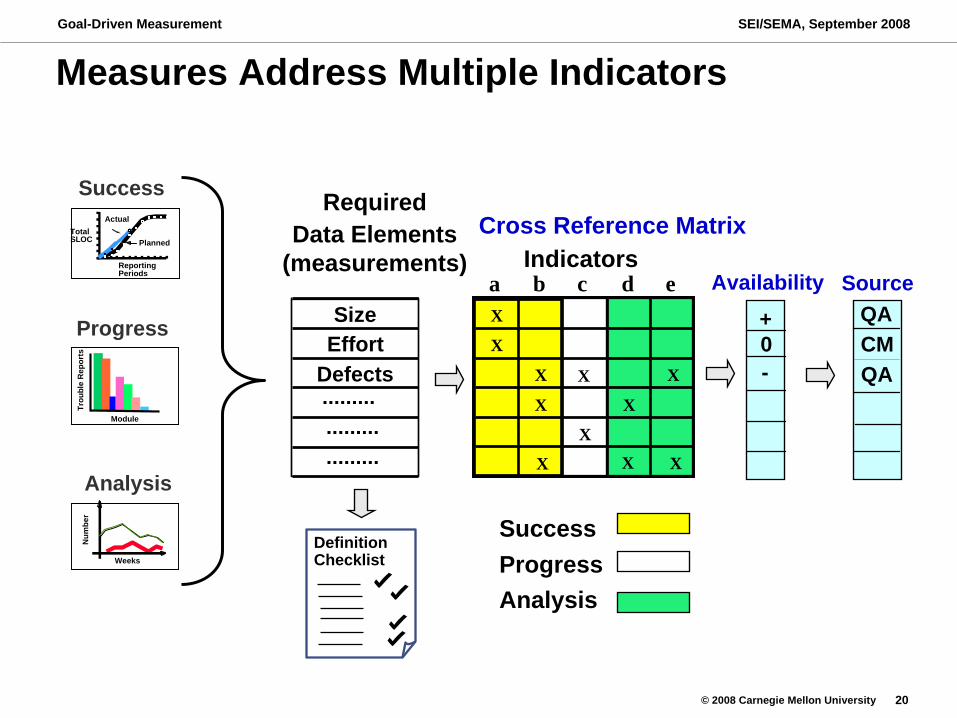
Measures Address Multiple Indicators
Reporting Periods
Total SLOC Planned
Actual
Weeks
Num
ber
Module
Trou
ble
Rep
orts
Analysis
Success
Progress SizeEffort
Defects
Data Elements(measurements)
RequiredCross Reference Matrix
a b c d eX
X
X
XX X
X X
X
X
Indicators
X
Success
AnalysisProgress
Availability+0-
SourceQACMQA
Definition Checklist
© 2008 Carnegie Mellon University
Goal-Driven Measurement
21
SEI/SEMA, September 2008
Precise Operational Definitions
Precise operational definitions take into account the following
• Communication - will others know precisely what was measured, how it was measured, and what was included or excluded?
• Reproducibility - could others, armed with the definition, repeat the measurements and get essentially the same results?
• Traceability - are the origins of the data identified in terms of time, source, sequence, activity, product, status, environment, tools used, and collector?

© 2008 Carnegie Mellon University
Goal-Driven Measurement
22
SEI/SEMA, September 2008
SEI Core Measures
Size Counts of physical source lines of code Counts of logical source statements
Effort Counts of staff-hours allocations
Schedule Calendar dates tied to milestones, reviews and audits, and deliverable products
Quality Counts of software problems and defects
Issues addressedUnit of measure
Provide checklists, guidelines, and examples for defining and reporting four kinds of measures that address fundamental management issues:

© 2008 Carnegie Mellon University
Goal-Driven Measurement
23
SEI/SEMA, September 2008
General Format of Checklist
Includes Excludes Optional
Identification Section
Attribute #1Value 1Value 2
Value N
Attribute #2
Attribute #M
•••
© 2008 Carnegie Mellon University
Goal-Driven Measurement
24
SEI/SEMA, September 2008
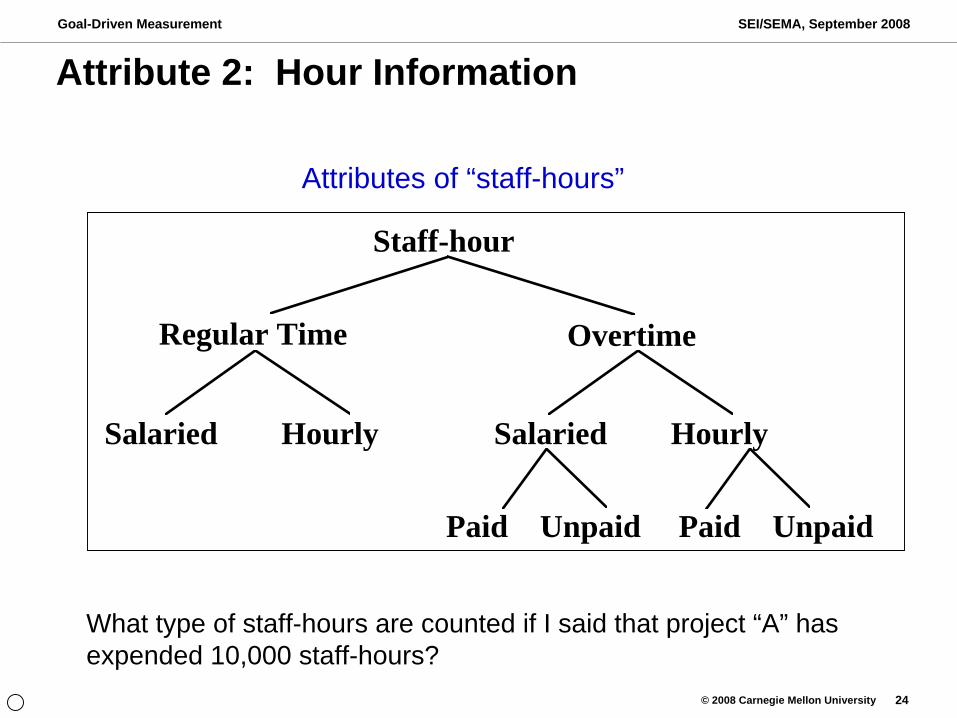
Attribute 2: Hour Information
Attributes of “staff-hours”
Staff-hour
Regular Time Overtime
Salaried Hourly
Paid Unpaid Paid Unpaid
Salaried Hourly
What type of staff-hours are counted if I said that project “A” has expended 10,000 staff-hours?

© 2008 Carnegie Mellon University
Goal-Driven Measurement
25
SEI/SEMA, September 2008
Example: Precise Definition Attribute 2 of Staff-Hour Definition Checklist
Totals Totals Reportinclude exclude totalsHour Information
Regular timeSalariedHourly
OvertimeSalaried
Compensated (paid)Uncompensated (unpaid)
HourlyCompensated (paid)Uncompensated (unpaid)
Software Effort & Schedule Measurement: A Framework for Counting Staff-hours and Reporting Schedule Informationhttp://www.sei.cmu.edu/publications/documents/92.reports/92.tr.021.html
Ref:

© 2008 Carnegie Mellon University
Goal-Driven Measurement
26
SEI/SEMA, September 2008
Goal-Driven Measurement Workshop
Goal(s)
Questions
Indicators
Measures
Business => Sub-Goals => MeasurementGoals
QuestionsWhat do I want to know or learn?
Indicators
SLOC Staff-hours Trouble Reports
Definition Checklist
Infrastructure Assessment
INDICATOR TEMPLATE
GoalQuestions
PerspectiveInput/MeasuresAlgorithmAssumptionsInterpretation
80
204060
100
© 2008 Carnegie Mellon University
Goal-Driven Measurement
27
SEI/SEMA, September 2008
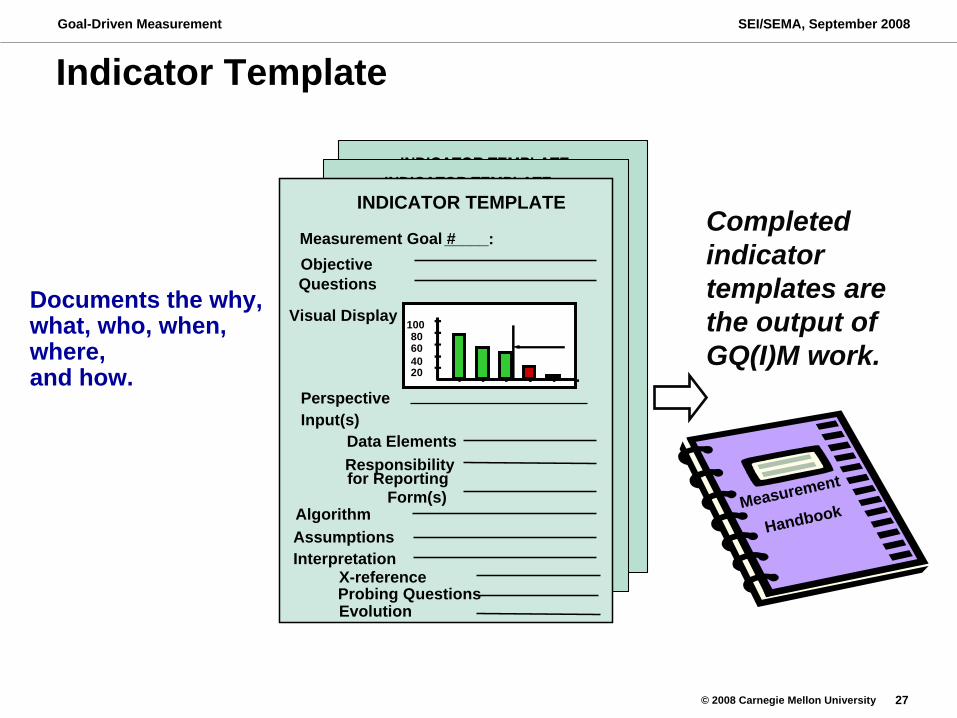
Indicator Template
Completed indicator templates are the output of GQ(I)M work.
INDICATOR TEMPLATE
ObjectiveQuestionsVisual Display
Interpretation
Evolution
Assumptions
X-referenceProbing Questions
Input(s)Data ElementsResponsibilityfor Reporting
Form(s)Algorithm
80
204060
100
Measurement Goal #_____:INDICATOR TEMPLATE
ObjectiveQuestionsVisual Display
Interpretation
Evolution
Assumptions
X-referenceProbing Questions
Input(s)Data ElementsResponsibilityfor Reporting
Form(s)Algorithm
80
204060
100
Measurement Goal #_____:INDICATOR TEMPLATE
ObjectiveQuestions
Visual Display
Interpretation
Evolution
Assumptions
X-referenceProbing Questions
Input(s)Data ElementsResponsibilityfor Reporting
Form(s)Algorithm
80
204060
100
Measurement Goal #_____:
Perspective
Documents the why, what, who, when, where, and how.
Measurement
Handbook

© 2008 Carnegie Mellon University
Goal-Driven Measurement
28
SEI/SEMA, September 2008
Mapping CMMI Measurement and Analysis to Indicator Template
Measurement & Analysis
X-reference
Interpretation
Evolution
Assumptions
Probing Questions
Algorithm
Analysis
Feedback Guidelines
Data StorageWhere HowSecurity
SP 2.2 Analyze
Data
SP 1.4 Specify Analysis
Procedures
SP 2.3 Store Data & Results
Responsibility for Reporting
Data Reporting
By/To WhomHow Often
SP 2.4 Communicate
ResultsObjectiveQuestionsVisual Display
Input(s)Data Elements
Form(s)
DefinitionsData Collection
HowWhen/How OftenBy Whom
Indicator Name/Title
80
204060
100
Perspective
SP 2.4 Communicate
Results
SP 2.1 Collect
Data
SP 1.1 Establish
Measurement Objectives
SP 1.2 Specify
Measures
DateIndicator Template
SP 1.3 Specify
Data Collection Procedures

© 2008 Carnegie Mellon University
Goal-Driven Measurement
29
SEI/SEMA, September 2008
Goal-Driven Measurement Workshops
Planning Tasks
Data Elements
Task 1Task 2Task 3Task n
1 2 3 4 5
Planning Task Matrix
Y
YY
NY
Management Team Improvement Team
SUCCESS CRITERIA
BUSINESS GOALS
SUCCESS INDICATORS
DataElements
SizeDefects
Avail Source+0-0+- -
QACM?
Etc.••
DataElements
DataElements
SizeDefects
Avail Source+0-0+- -
QACM?
Etc.••
Avail SourceAvail Source+0-0+- -
+0-0+- -
QACM?
Etc.••
QACM?
Etc.••
Develop Strategies,
Tasks - Progress Indicators- Analysis Indicators

© 2008 Carnegie Mellon University
Goal-Driven Measurement
30
SEI/SEMA, September 2008
GQ(I)M Summary
The goal-driven software measurement method provides a well-defined process for identifying, defining, and implementing measurements.
Each organization must define measurements based on their own unique business goals.
Goal-driven software measurement is not based on predefined metrics.
© 2008 Carnegie Mellon University
Goal-Driven Measurement
31
SEI/SEMA, September 2008
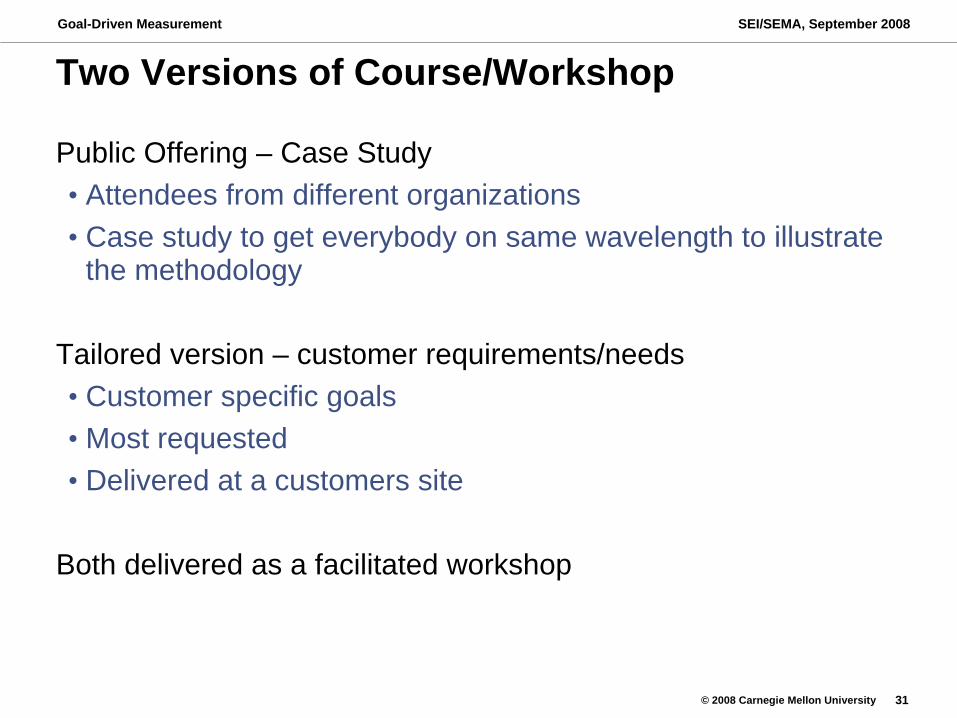
Two Versions of Course/Workshop
Public Offering – Case Study• Attendees from different organizations• Case study to get everybody on same wavelength to illustrate
the methodology
Tailored version – customer requirements/needs• Customer specific goals• Most requested• Delivered at a customers site
Both delivered as a facilitated workshop
© 2008 Carnegie Mellon University
Goal-Driven Measurement
32
SEI/SEMA, September 2008
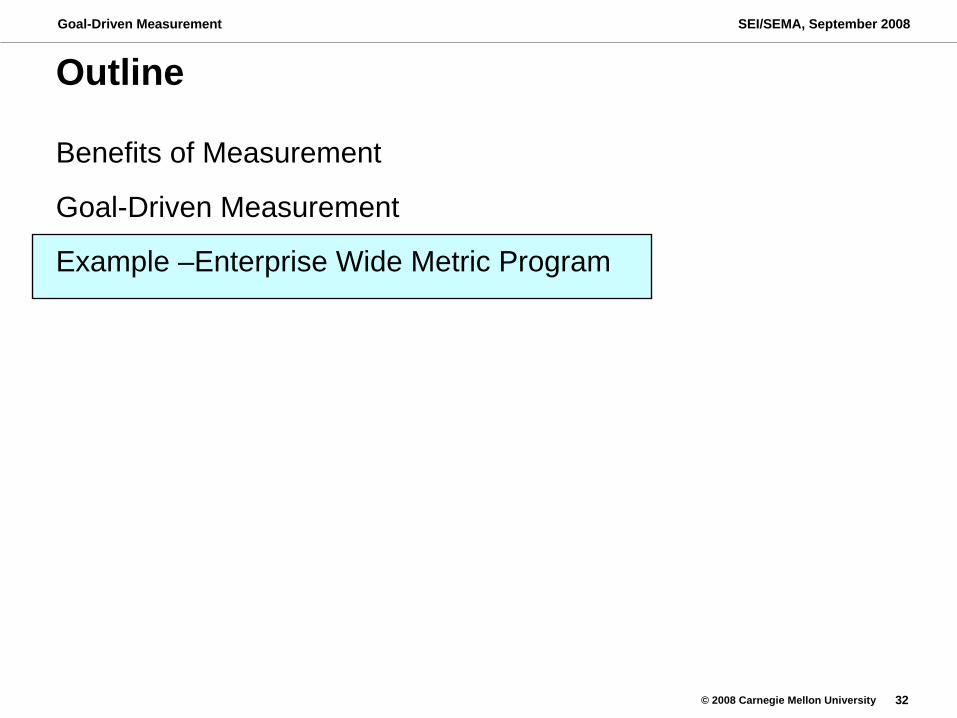
Outline
Benefits of Measurement
Goal-Driven Measurement
Example –Enterprise Wide Metric Program

© 2008 Carnegie Mellon University
Goal-Driven Measurement
33
SEI/SEMA, September 2008
Enterprise Wide Metrics Program

© 2008 Carnegie Mellon University
Goal-Driven Measurement
34
SEI/SEMA, September 2008
Objective
To establish an enterprise-wide metrics program that characterizes software progress and performance across a global enterprise.
To establish an initial, simple set of metrics that can be used across the enterprise to serve as the common “meter stick.”
To deploy this so that all organizations (maturity level 3 and higher) can use this program as part of their ongoing improvement efforts.
© 2008 Carnegie Mellon University
Goal-Driven Measurement
35
SEI/SEMA, September 2008
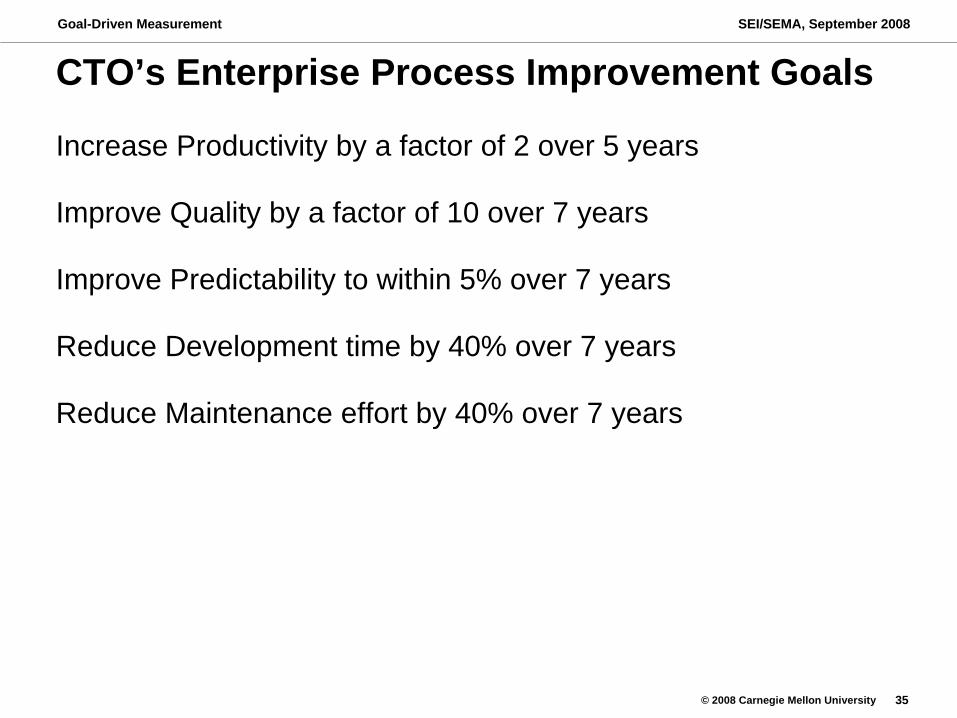
CTO’s Enterprise Process Improvement Goals
Increase Productivity by a factor of 2 over 5 years
Improve Quality by a factor of 10 over 7 years
Improve Predictability to within 5% over 7 years
Reduce Development time by 40% over 7 years
Reduce Maintenance effort by 40% over 7 years
© 2008 Carnegie Mellon University
Goal-Driven Measurement
36
SEI/SEMA, September 2008
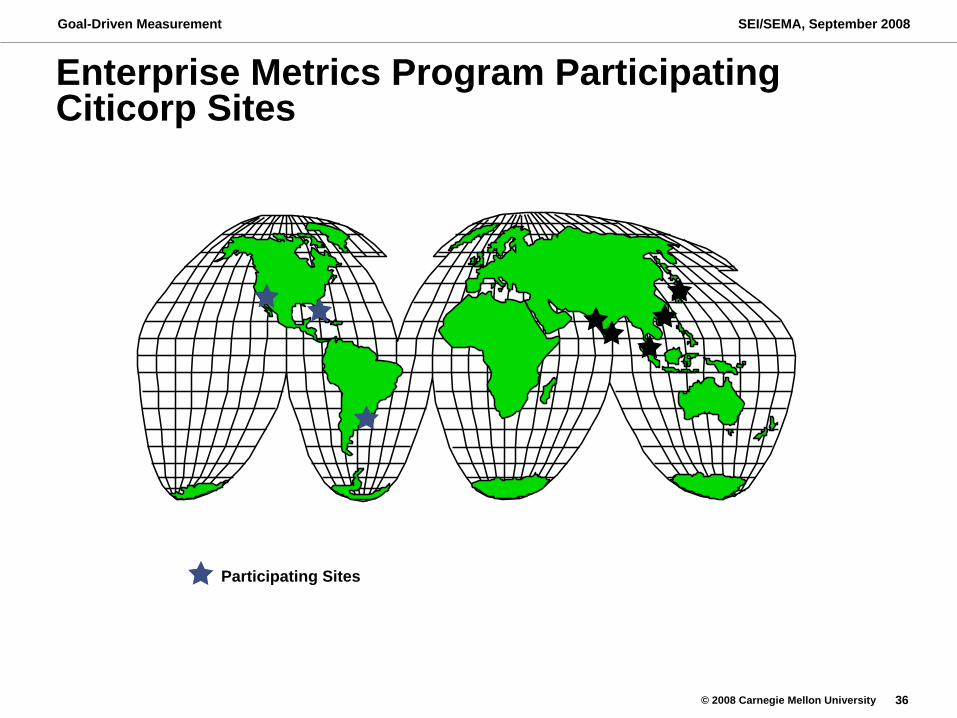
Enterprise Metrics Program Participating Citicorp Sites
Participating Sites

© 2008 Carnegie Mellon University
Goal-Driven Measurement
37
SEI/SEMA, September 2008
Selection of Indicators
Evaluation areas• can indicator be interpreted correctly?• does it provide an accurate and high-level view?• could you collect the data in your organization?• are there any major barriers?• do the definitions provide enough information?
Other considerations• number of indicators in each measurement area• total number of indicators

© 2008 Carnegie Mellon University
Goal-Driven Measurement
38
SEI/SEMA, September 2008
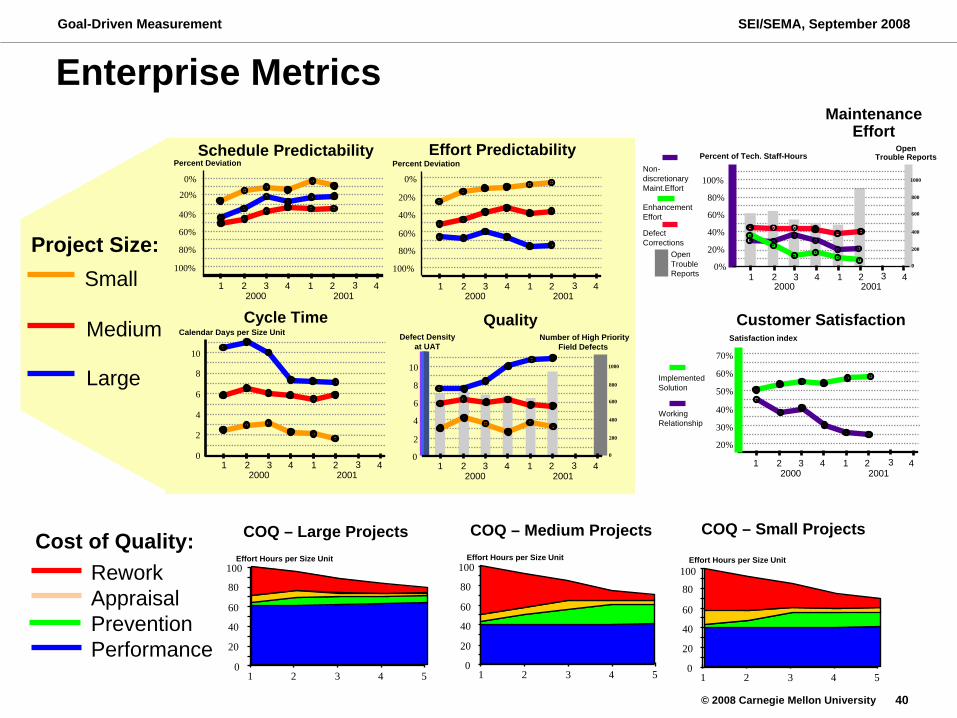
Schedule predictability: Indicator designed to answer questions about the enterprise’s ability to plan well and deliver the products on schedule.
Effort predictability: Indicator designed to improve cost estimation and the ability to bring projects in on budget.
Cycle time: Indicator used to track improvements in getting products to market as quickly as possible.
Quality: Indicator for the quality of the development and testing process as well as the quality of the software in the field.
Maintenance Effort: Indicator used to track non-discretionary maintenance, enhancements, and defect corrections, as well as the number of open trouble reports.
Enterprise Initial Core Measures—1
© 2008 Carnegie Mellon University
Goal-Driven Measurement
39
SEI/SEMA, September 2008
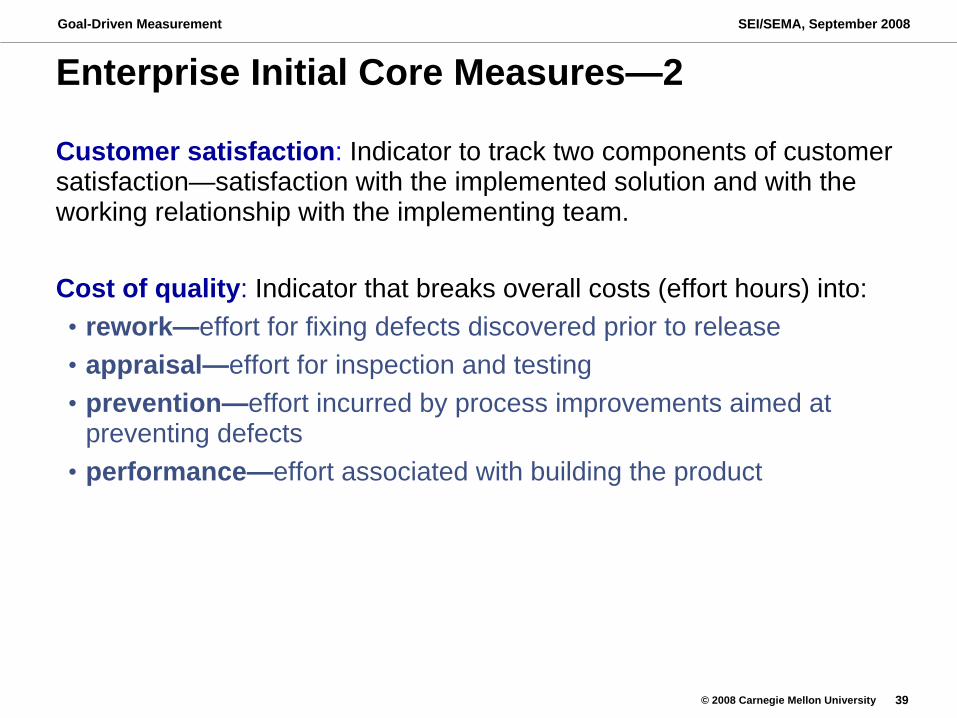
Enterprise Initial Core Measures—2
Customer satisfaction: Indicator to track two components of customer satisfaction—satisfaction with the implemented solution and with the working relationship with the implementing team.
Cost of quality: Indicator that breaks overall costs (effort hours) into:• rework—effort for fixing defects discovered prior to release• appraisal—effort for inspection and testing• prevention—effort incurred by process improvements aimed at
preventing defects• performance—effort associated with building the product
© 2008 Carnegie Mellon University
Goal-Driven Measurement
40
SEI/SEMA, September 2008
Enterprise Metrics
Project Size:
Large
Small
Medium
Schedule Predictability0%
20%
40%
60%
80%
100%
Percent Deviation
2000 20011 2 3 4 1 2 3 4
Effort Predictability0%
20%
40%
60%
80%
100%
Percent Deviation
2000 20011 2 3 4 1 2 3 4
Cycle Time
10
8
6
4
2
0
Calendar Days per Size Unit
2000 20011 2 3 4 1 2 3 4
QualityDefect Density
at UATNumber of High Priority
Field Defects
10
8
6
4
2
0
1000
800
600
400
200
0
2000 20011 2 3 4 1 2 3 4
Customer Satisfaction
Implemented Solution
Working Relationship
Satisfaction index
60%
50%
40%
30%
20%
70%
2000 20011 2 3 4 1 2 3 4
ReworkAppraisalPreventionPerformance
Cost of Quality: COQ – Medium Projects COQ – Small ProjectsCOQ – Large Projects
0
20
40
60
80
1 2 3 4 5
Effort Hours per Size Unit100
0
20
40
60
80
1 2 3 4 5
Effort Hours per Size Unit100
01 2 3 4 5
Effort Hours per Size Unit
20
40
60
80
100
Maintenance Effort
Non-discretionaryMaint.Effort
OpenTrouble Reports
EnhancementEffort
100%
80%
60%
40%
20%
0%
2000 20011 2 3 4 1 2 3 4
Trouble Reports Open
1000
800
600
400
200
0
Percent of Tech. Staff-Hours
Defect Corrections
© 2008 Carnegie Mellon University
Goal-Driven Measurement
41
SEI/SEMA, September 2008
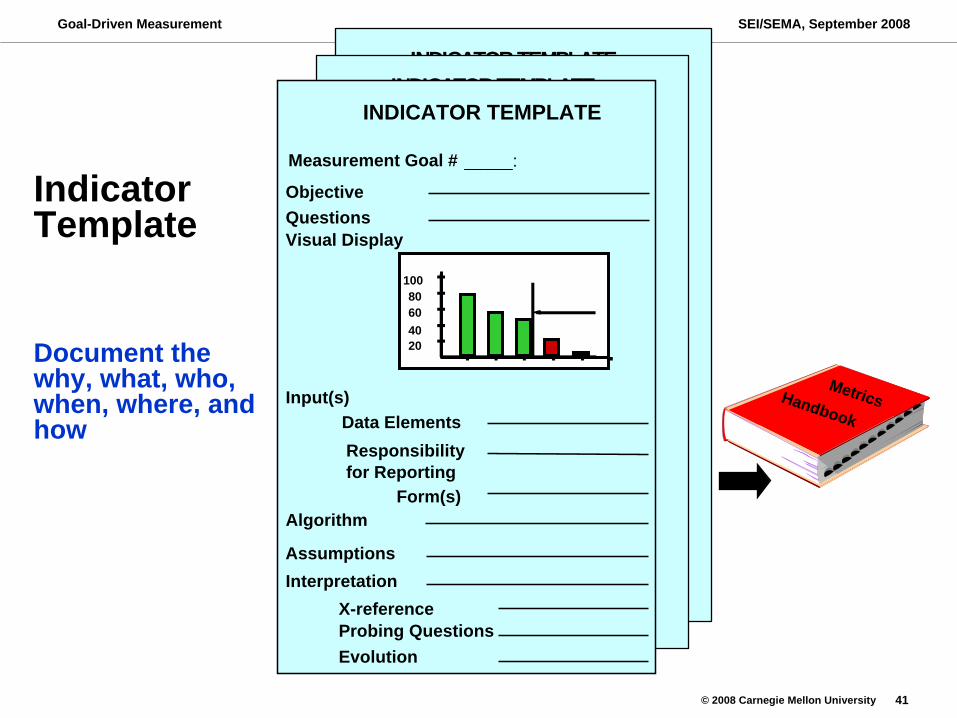
INDICATOR TEMPLATE
ObjectiveQuestionsVisual Display
Interpretation
Evolution
Assumptions
X-referenceProbing Questions
Input(s)Data ElementsResponsibilityfor Reporting
Form(s)Algorithm
80
204060
100
Measurement Goal #_____:
Indicator Template
Document the why, what, who, when, where, and how
INDICATOR TEMPLATE
ObjectiveQuestionsVisual Display
Interpretation
Evolution
Assumptions
X-referenceProbing Questions
Input(s)Data ElementsResponsibilityfor Reporting
Form(s)Algorithm
80
204060
100
Measurement Goal #_____:
MetricsHandbook
INDICATOR TEMPLATE
ObjectiveQuestionsVisual Display
Interpretation
Evolution
Assumptions
X-referenceProbing Questions
Input(s)Data ElementsResponsibilityfor Reporting
Form(s)Algorithm
80
204060
100
Measurement Goal # _____:

© 2008 Carnegie Mellon University
Goal-Driven Measurement
42
SEI/SEMA, September 2008
Example of Indicator Template (Page 1)
Cycle Time
Objective To monitor trends in development elapsed time asinput towards improvement at the technical unitlevel and across the Enterprise.
Questions • What is the cycle time trend for each of the projectsize categories?
• Are the trends the same for the different project sizecategories?
• What is the rate of change from year to year?• How does the rate of change compare between the
different project size categories?
Indicator/Display
SmallMediumLarge
Project
Time Frame (Quarter)
10
8
6
4
2
0
Calendar Days per Size Unit
2000 20011 2 3 4 1 2 3 4
© 2008 Carnegie Mellon University
Goal-Driven Measurement
43
SEI/SEMA, September 2008
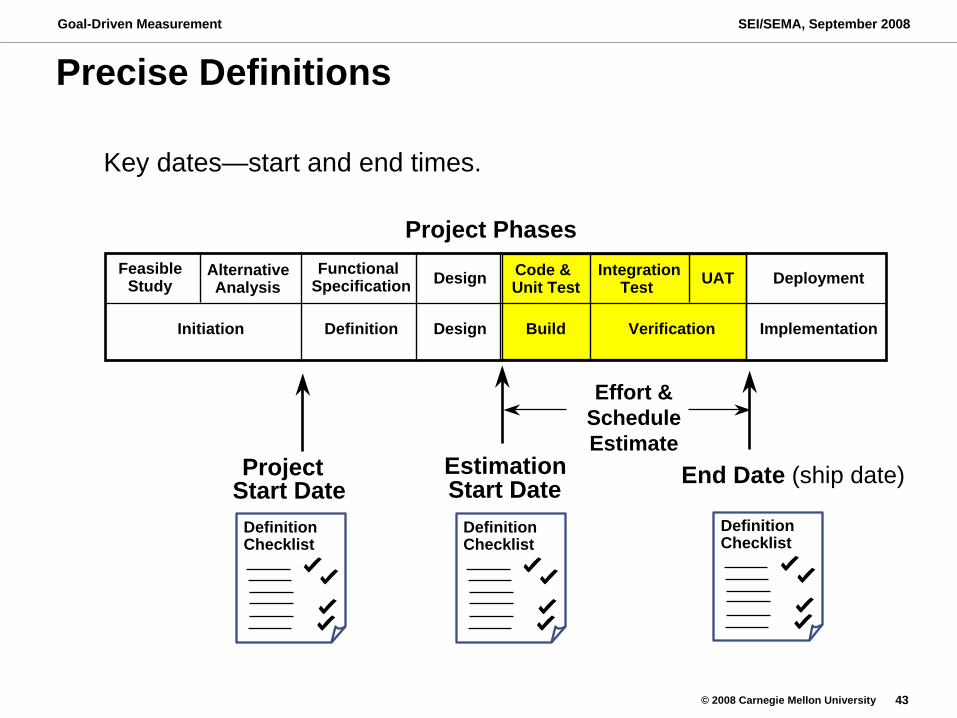
Project PhasesFeasible
StudyAlternative Analysis
Functional Specification Design
Initiation Definition Design Build Verification Implementation
Code & Unit Test
Integration Test UAT Deployment
Start Date Start Date End Date (ship date)Project Estimation
Effort & Schedule Estimate
Key dates—start and end times.
Precise Definitions
Definition Checklist
Definition Checklist
Definition Checklist
© 2008 Carnegie Mellon University
Goal-Driven Measurement
44
SEI/SEMA, September 2008
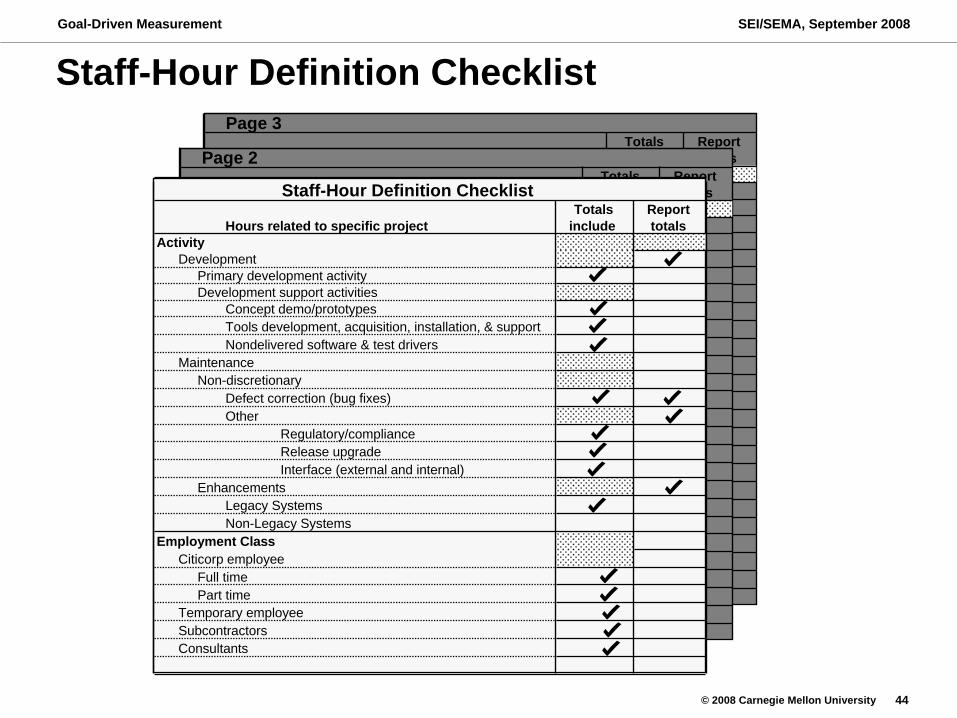
Staff-Hour Definition ChecklistTotals Report
Hours related to specific project include totalsActivity
DevelopmentPrimary development activityDevelopment support activities
Concept demo/prototypesTools development, acquisition, installation, & supportNondelivered software & test drivers
Maintenance Non-discretionary
Defect correction (bug fixes)Other
Regulatory/complianceRelease upgradeInterface (external and internal)
EnhancementsLegacy SystemsNon-Legacy Systems
Employment ClassCiticorp employee
Full timePart time
Temporary employeeSubcontractorsConsultants
Page 3
Totals ReportHours related to specific project include totals
ActivityDevelopment
Primary development activityDevelopment support activities
Concept demo/prototypesTools development, acquisition, installation, & supportNondelivered software & test drivers
Maintenance Non-discretionary
Defect correction (bug fixes)Other
Regulatory/complianceRelease upgradeInterface (external and internal)
EnhancementsLegacy SystemsNon-Legacy Systems
Employment ClassCiticorp employee
Full timePart time
Temporary employeeSubcontractorsConsultants
Page 2
Staff-Hour Definition ChecklistTotals Report
Hours related to specific project include totalsActivity
DevelopmentPrimary development activityDevelopment support activities
Concept demo/prototypesTools development, acquisition, installation, & supportNondelivered software & test drivers
Maintenance Non-discretionary
Defect correction (bug fixes)Other
Regulatory/complianceRelease upgradeInterface (external and internal)
EnhancementsLegacy SystemsNon-Legacy Systems
Employment ClassCiticorp employee
Full timePart time
Temporary employeeSubcontractorsConsultants
© 2008 Carnegie Mellon University
Goal-Driven Measurement
45
SEI/SEMA, September 2008
Any Questions or Clarification?

© 2008 Carnegie Mellon University
Goal-Driven Measurement
46
SEI/SEMA, September 2008
For Additional Information
Name Customer Relations
Telephone 1-888-201-4479
FAX 412 / 268-5758
Email [email protected]
World Wide Web http://www.sei.cmu.edu
U.S. Mail Software Engineering Institute Carnegie Mellon University Pittsburgh, PA 15213 USA

© 2008 Carnegie Mellon University
Goal-Driven Measurement
47
SEI/SEMA, September 2008