implementation of superpave mix design for airfield … · burns cooley dennis, inc. geotechnical,...
TRANSCRIPT
Burns Cooley Dennis, Inc.Geotechnical, Pavements and Materials Consultants
Burns Cooley Dennis, Inc.Geotechnical, Pavements and Materials Consultants
IMPLEMENTATION OF SUPERPAVE MIX DESIGN FORAIRFIELD PAVEMENTS
Volume I : Research Results
for
AAPTP PROJECT 04-03
Submitted to
Airfield Asphalt Pavement Technology Program
By
Burns Cooley Dennis, Inc.551 Sunnybrook Road
Ridgeland, Mississippi 39157
ACKNOWLEDGMENT OF SPONSORSHIP
This report has been prepared for Auburn University under the Airport Asphalt Pavement TechnologyProgram (AAPTP). Funding is provided by the Federal aviation Administration (FAA) underCooperative Agreement Number 04-G-038. Dr. David Brill is a Project Technical manager in the FAAAirport Technology R&D branch and the Technical Manager of the Cooperative Agreement. Mr. MonteSymons served as the Project Director for this project. The AAPTP and the FAA thank the ProjectTechnical Panel that willingly gave of their expertise and time for the development of this report. Theywere responsible for the oversight and the technical direction. The names of those individuals on theProject Technical Panel follow:
1. Jeffery L. Rapol2. H. D. Campbell3. Ray Rollings4. Jay Gabrielson5. Casimir Bognacki
DISCLAIMERThe contents of this report reflect the views of the authors, who are responsible for the facts and theaccuracy of the data presented within. The contents do not necessarily reflect the official views andpolices of the Federal Aviation Administration. The report does not constitute a standard, specification orregulation.
March 2009
i
IMPLEMENTATION OF SUPERPAVE MIX DESIGN FORAIRFIELD PAVEMENTS
Draft Final Report
for
AAPTP Project 04-03
Submitted to
Airfield Asphalt Pavement Technology Program
By
L. Allen Cooley, Jr., R. C. Ahlrich and Robert S. JamesBurns Cooley Dennis, Inc.
551 Sunnybrook RoadRidgeland, Mississippi 39157
Brian D. ProwellAdvanced Materials Services, LLC
1975 Mall Boulevard, Suite 202Auburn, Alabama 36830
E. R. BrownEngineer Research and Development Center
Corps of Engineers3909 Halls Ferry Road
Vicksburg, Mississippi 39180
Andrea KvasnakNational Center for Asphalt Technology
277 Technology ParkwayAuburn, Alabama 36830
March 2009
ii
TABLE OF CONTENTSLIST OF FIGURES .......................................................................................................... IVLIST OF TABLES...........................................................................................................VIIACKNOWLEDGEMENTS.............................................................................................. IXABSTRACT....................................................................................................................... XSUMMARY OF FINDINGS ............................................................................................ XICHAPTER 1 ....................................................................................................................... 1INTRODUCTION AND RESEARCH APPROACH ........................................................ 1
INTRODUCTION .......................................................................................................... 1Background ................................................................................................................. 1Airfield Hot Mix Asphalt Design Specifications ......................................................... 1A Brief History of the Marshall Mix Design System................................................... 2Performance of Airfield and Highway Flexible Pavements ....................................... 4The Evolution of the Superpave Mix Design System .................................................. 7
Problem Statement .......................................................................................................... 8Objective ......................................................................................................................... 9Scope............................................................................................................................... 9Report Format ............................................................................................................... 10
CHAPTER 2: .................................................................................................................... 12RESEARCH APPROACH ............................................................................................... 12
INTRODUCTION ........................................................................................................ 12Phase II – Conduct Investigations................................................................................. 20Phase III - Reports ........................................................................................................ 20
CHAPTER 3 ..................................................................................................................... 21REVIEW OF EXISTING AIRFIELD SPECIFICATIONS ............................................. 21
General .......................................................................................................................... 22Selection of Materials ................................................................................................... 22
Coarse Aggregates.................................................................................................... 22Fine Aggregates ........................................................................................................ 28Mineral Filler............................................................................................................ 30Asphalt Binder .......................................................................................................... 30
Blending the Selected Materials ................................................................................... 30Summary of Gradation Requirements....................................................................... 38
Select Appropriate Optimum Asphalt Binder Content ................................................. 39Marshall Mix Design Method ................................................................................... 40Superpave Mix Design Method ................................................................................. 43
Comparison of Moisture Susceptibility Requirements ................................................. 46Summary of Critical Comparison ................................................................................. 47
CHAPTER 4 ..................................................................................................................... 49FIELD VISITS.................................................................................................................. 49
Airfield Information...................................................................................................... 50Jacqueline Cochran Regional Airport ...................................................................... 50Mineral County Memorial Airport............................................................................ 52Oxford-Henderson Airport........................................................................................ 54Little Rock Air Force Base........................................................................................ 58Naval Air Station-Oceana......................................................................................... 62
iii
Volk Field.................................................................................................................. 65Jackson-Evers International Airport ........................................................................ 69Newark Liberty International Airport....................................................................... 71Palm Springs International Airport .......................................................................... 74Spokane International Airport .................................................................................. 76
CHAPTER 5 ..................................................................................................................... 80MATERIALS AND TEST METHODS ........................................................................... 80
Mix Design and In-Place Core Information.................................................................. 80Jacqueline Cochran Regional Airport ...................................................................... 83Mineral County Memorial Airport............................................................................ 85Oxford-Henderson Airport........................................................................................ 87
Military Airfields .......................................................................................................... 89Little Rock Air Force Base........................................................................................ 89Naval Air Station-Oceana......................................................................................... 91Volk Field.................................................................................................................. 93Jackson-Evers International Airport ........................................................................ 95Newark Liberty International Airport....................................................................... 97Palm Springs International Airport .......................................................................... 99Spokane International Airport ................................................................................ 102
Ancillary Mixtures ...................................................................................................... 104John Bell Williams Airport ..................................................................................... 104Mid-Delta Regional Airport.................................................................................... 104Portland International Airport ............................................................................... 104
CHAPTER 6 ................................................................................................................... 108TEST RESULTS AND ANALYSIS .............................................................................. 108
SELECTION OF DESIGN COMPACTIVE EFFORT .............................................. 108Discussion on Selection of Design Gyration Levels for Airfield Superpave Mix Designs..................................................................................................................................... 143EVALUATION OF GRADATION REQUIREMENTS............................................ 146MATERIAL REQUIREMENTS................................................................................ 163SELECTION OF OPTIMUM ASPHALT BINDER CONTENT .............................. 167PERFORMANCE TESTING ..................................................................................... 168
CHAPTER 7 ................................................................................................................... 181CONCLUSIONS, RECOMMENDATIONS AND IMPLEMENTATION ................... 181References....................................................................................................................... 187
iv
LIST OF FIGURES
Figure 1: Gradation Requirements for 2 in. Maximum Aggregate Size Gradations ........ 34Figure 2: Gradation Requirements for 1 ½ in. Maximum Aggregate Size Gradations .... 34Figure 3: Gradation Requirements for 1 in. Maximum Aggregate Size Gradations ........ 35Figure 4: Gradation Requirements for ¾ in. Maximum Aggregate Size Gradations ....... 35Figure 5: Gradation Requirements for ½ in. Maximum Aggregate Size Gradations ....... 36Figure 6: Gradation Requirements for ⅜ in. Maximum Aggregate Size Gradations ....... 36Figure 7: Selection of Optimum Asphalt Binder Content (13)........................................ 42Figure 8: Locations of Visited Airfields ........................................................................... 49Figure 9: Transverse Crack Initiated at Construction Joint .............................................. 51Figure 10: Close-up of Transverse Crack and Surface Texture........................................ 52Figure 11: Runway 07/25 Showing Longitudinal Joint Cracks........................................ 53Figure 12: Transverse Crack and Surface Texture on Runway 07/25 .............................. 54Figure 13: Asphalt Mixture and Core Locations .............................................................. 56Figure 14: Longitudinal Cracking Along Taxiway, 9.5mm A.......................................... 57Figure 15: Cracking in the Turnout to Taxiway, 9.5mm A. ............................................. 57Figure 16: Pavement Distress Caused by Vapor Pressure, 9.5mm A............................... 58Figure 17: Bleeding on Assault Strip................................................................................ 60Figure 18: Core Water Collecting in Rut.......................................................................... 60Figure 19: Rut Depth of One Inch .................................................................................... 61Figure 20: Cracking Near End of Runway ....................................................................... 61Figure 21: Water Ponding along Longitudinal Joint (Right) and Wheel Rut (Left)......... 64Figure 22: Rutting on Taxiway Alpha .............................................................................. 64Figure 23: Reflective Cracking......................................................................................... 65Figure 24: Aerial View of Airfield with Core Locations.................................................. 67Figure 25: Horizontal Crack on Runway.......................................................................... 67Figure 26: Partially Sealed Longitudinal Crack at Constructional Joint .......................... 68Figure 27: Example of Occasional Popout and Performance of Grooves ........................ 68Figure 28: Ravelling of Pavement ................................................................................... 70Figure 29: Bleeding and Blistering in Runway................................................................. 70Figure 30: Proper Evacuation of Core Water by the Pavement Grooving and Cross-Slope........................................................................................................................................... 71Figure 31: Sealed Construction Joint between Runway (Left) and Shoulder Pavement . 73Figure 32: Transverse Cracking in Ungrooved Section of Runway 11/29...................... 74Figure 33: Cores Taken from Palm Springs Runway 13R/31L........................................ 76Figure 34: Typical Texture of Palm Springs Runway 13R/31L....................................... 76Figure 35: Intersection of Longitudinal Crack and Transverse Crack............................. 78Figure 36: Typical Raveling ............................................................................................ 78Figure 37: Typical Crack Sealing .................................................................................... 79Figure 38: Ultimate Densities of Airfield Pavements Designed Using Marshall Hammer......................................................................................................................................... 111Figure 39: Ultimate Densities of Airfield Pavements Designed with the SuperpaveGyratory Compactor ....................................................................................................... 113Figure 40: Comparison of Marshall Hammer and Superpave Gyratory Compactor – TRM......................................................................................................................................... 116
v
Figure 41: Comparison of Marshall Hammer and Superpave Gyratory Compactor - C24......................................................................................................................................... 116Figure 42: Comparison of Marshall Hammer and Superpave Gyratory Compactor -(KHNZ)........................................................................................................................... 117Figure 43: Comparison of Marshall Hammer and Superpave Gyratory Compactor – LRF......................................................................................................................................... 117Figure 44: Comparison of Marshall Hammer and Superpave Gyratory Compactor – NTU......................................................................................................................................... 118Figure 45: Comparison of Marshall Hammer and Superpave Gyratory Compactor – VOK......................................................................................................................................... 118Figure 46: Comparison of Marshall Hammer and Superpave Gyratory Compactor – JAN......................................................................................................................................... 119Figure 47: Comparison of Marshall Hammer and Superpave Gyratory Compactor – EWR......................................................................................................................................... 119Figure 48: Comparison of Marshall Hammer and Superpave Gyratory Compactor – PSP......................................................................................................................................... 120Figure 49: Comparison of Marshall Hammer and Superpave Gyratory Compactor – GEG......................................................................................................................................... 120Figure 50: Histogram of Ndesign Equivalents to Marshall Compaction ........................... 123Figure 51: Flow Number Test Results for Jacqueline Cochran Regional Airport (TRM)......................................................................................................................................... 129Figure 52: Flow Number Test Results for Mineral County Memorial Airport (C24) .... 130Figure 53: Flow Number Test Results for Oxford-Henderson Airport (KHNZ)............ 131Figure 54: Flow Number Test Results for Little Rock Air Force Base (LRF) ............... 132Figure 55: Flow Number Test Results for Naval Air Station Oceana (NTV) ................ 133Figure 56: Flow Number Test Results for Volk Field (VOK)........................................ 134Figure 57: Flow Number Test Results for Jackson-Evers International Airport (JAN) . 135Figure 58: Flow Number Test Results from Newark-Liberty International Airport (EWR)......................................................................................................................................... 136Figure 59: Flow Number Test Results from Palm Springs International Airport (PSP) 138Figure 60: Operation and Temperature Characteristics for Palm Springs InternationalAirport (PSP) .................................................................................................................. 139Figure 61: Flow Number Results for Spokane (GEG).................................................... 140Figure 62: Gradations from NTV Used in Permeability Testing.................................... 148Figure 63: Gradations from KHNZ Used in Permeability Testing................................. 149Figure 64: Gradations from C24 Used in Permeability Testing ..................................... 149Figure 65: Gradations from VOK Used in Permeability Testing ................................... 150Figure 66: Gradations from JAN Used in Permeability Testing..................................... 150Figure 67: Relationship between Permeability and Air Voids - NTV............................ 152Figure 68: Relationship between Permeability and Air Voids - KHNZ......................... 152Figure 69: Relationship between Permeability and Air Voids – C24............................. 153Figure 70: Relationship between Permeability and Air Voids - VOK ........................... 153Figure 71: Relationship between Permeability and Air Voids - JAN............................. 154Figure 72: Relationship between Permeability and Percent Passing No. 8 Sieve - 9.5 mmNMAS............................................................................................................................. 157
vi
Figure 73: Relationship between Permeability and Percent Passing No. 8 Sieve - 12.5 mmNMAS............................................................................................................................. 157Figure 74: Relationship between Permeability and Percent Passing No. 8 Sieve - 19.0 mmNMAS............................................................................................................................. 158Figure 75: Revised Gradations for 1.5 in. Max. Aggregate Size Gradations ................. 161Figure 76: Revised Gradations for 1 in. Max. Aggregate Size Gradations .................... 161Figure 77: Revised Gradations for 3/4 in. Max. Aggregate Size Gradations ................. 162Figure 78: Revised Gradations for 1/2 in. Max. Aggregate Size Gradations ................. 162Figure 79: Bulk Specific Gravity Data for Companion Samples – Case Study No. 1 ... 171Figure 80: Control Chart for Air Voids – Case Study No. 1 .......................................... 172Figure 81: Control Chart for VMA – Case Study No. 1................................................. 173Figure 82: Control Chart for VEA – Case Study No. 1 .................................................. 174Figure 83: Control Chart for Bulk Specific Gravity (65 gyr/75 blows)- Case Study No. 2......................................................................................................................................... 175Figure 84: Control Chart for VTM (65 gyr/75 blows) – Case Study No. 2.................... 176Figure 85: Control Chart for VMA (65 gyr/75 blows) – Case Study No. 2 ................... 176Figure 86: Control Chart for VEA (65 gyr/75 blows) – Case Study No. 2 .................... 177Figure 87: Control Chart for VTM (100 gyr) – Case Study No. 2 ................................. 178Figure 88: Control Chart for VMA (100 gyr) – Case Study No. 2................................. 178Figure 89: Control Chart for VEA (100 gyr) – Case Study No. 2 .................................. 179
vii
LIST OF TABLES
Table 1: Total Aircraft Operations at Selected U.S. Carrier Airports in 2007 ................... 5Table 2: Experimental Matrix........................................................................................... 15Table 3: Repeated Load Creep Tests ................................................................................ 17Table 4: Superpave Aggregate Requirements................................................................... 24Table 5: Coarse Aggregate Requirements Summary........................................................ 27Table 6: Fine Aggregate Requirements Summary............................................................ 30Table 7: Item P-401 Gradation Requirements .................................................................. 31Table 8: UFGS-32 12 15 Gradation Requirements........................................................... 31Table 9: Superpave Aggregate Gradation Control Points................................................. 32Table 10: Standard Sieve Sizes......................................................................................... 33Table 11: Marshall Design Criteria - Item P-401 ............................................................. 42Table 12: Marshall Design Criteria - UFGS-32 12 15...................................................... 42Table 13: Minimum Percent Voids in Mineral Aggregate ............................................... 43Table 14: Superpave HMA Design Criteria...................................................................... 45Table 15: Airport Field Visit Traffic Level Designations ................................................ 50Table 16: Summary of Test and Test Methods................................................................. 82Table 17: Definitions of Commonly Used Acronyms ...................................................... 82Table 18: Mix Design and In-Place Data for Jacqueline Cochran Regional Airport –Thermal, CA ..................................................................................................................... 84Table 19: Mix Design and In-Place Data for Mineral County Memorial Airport – Creede,CO..................................................................................................................................... 86Table 20: Mix Design and In-Place Data for Oxford-Henderson Airport – Henderson, NC........................................................................................................................................... 88Table 21: Mix Design and In-Place Data for Little Rock Air Force Base – Jacksonville,AR..................................................................................................................................... 90Table 22: Mix Design and In-Place Data for Naval Air Station Oceana.......................... 92Table 23: Mix Design and In-Place Data for Volk Field – Camp Douglas, WI............... 94Table 24: Mix Design and In-Place Data for Jackson International Airport – Jackson, MS........................................................................................................................................... 96Table 25: Mix Design and In-Place Data for Newark Liberty International Airport –Newark, NJ ....................................................................................................................... 98Table 26: Mix Design and In-Place Data for Palm Springs International Airport – PalmSprings, CA..................................................................................................................... 101Table 27: Mix Design and In-Place Data for Spokane International Airport - Spokane,WA.................................................................................................................................. 103Table 28: Mix Design Data for John Bell Williams Airport – Bolton, MS.................... 105Table 29: Mix Design Data for Mid-Delta Regional Airport – Greenville, MS............. 106Table 30: Mix Design Data for Portland International Airport – Portland, OR ............. 107Table 31: Typical Aircraft Characteristics for Selected Airfields .................................. 127Table 32: Estimated Ndesign Values Based upon Performance Testing ........................... 141Table 33: Ndesign Values Based Upon Research .............................................................. 145Table 34: Recommended Ndesign Values for Designing Airfield Mixes.......................... 146Table 35: Gradation Control Points for Airfield Superpave Mixes................................ 160
viii
Table 36: Recommended Gradation Requirements for Superpave Designed AirfieldHMA ............................................................................................................................... 163Table 37: Summary of Aggregate Quality Characteristics ............................................. 164Table 38: Aggregate Requirements for Airfield Superpave Design HMA..................... 166Table 39: Volumetric Properties For Selecting Optimum Asphalt Binder..................... 168Table 40: Recommended Volumetric Properties For Selecting Optimum Asphalt Binder......................................................................................................................................... 185
ix
ACKNOWLEDGEMENTS
The research documented in this report was performed under Airfield AsphaltPavement Technology Program Project 04-03 by Burns Cooley Dennis, Inc. inRidgeland, Mississippi. L. Allen Cooley, Jr., Senior Pavements/Materials Engineer, ofBurns Cooley Dennis, Inc. was the Principal Investigator and was primarily responsiblefor the technical supervision of the research. Dr. Brian Prowell, Principal Engineer ofAdvanced Materials Services, LLC, was the Co-Principal Investigator and providedsignificant assistance and technical oversight. Persons serving in the role of ResearchEngineers included Dr. Randy Ahlrich and Mr. Robert James of Burns Cooley Dennis,Inc. and Dr. Ray Brown of ERDC. Dr. Andrea Kvasnak of the National Center ofAsphalt Technology provided significant assistance while overseeing the performancetesting conducted in this project.
The authors of this report would like to thank Mr. Monte Symons, ProjectDirector of the Airfield Asphalt Pavement Technology Program, for his input andguidance during the course of this project. The researchers would also like toacknowledge the Project Panel for comments and guidance provided during the course ofthe research project. Finally, the authors would like to acknowledge the many AirfieldPavement Engineers that provided valuable information during the course of this study.
x
ABSTRACT
Airfield Asphalt Pavement Technology Program Project 04-03, Implementationof Superpave Mix Design for Airfield Pavements, was conducted to develop andrecommend a method of designing hot mix asphalt (HMA) for airfield pavementsutilizing the Superpave gyratory compactor (SGC). The research approach entailed threephases of work. During the first phase, background information was obtained throughreviewing specifications, reports and literature and discussions with airfield pavementexperts. This information was then utilized to develop an approach for developing a mixdesign method for airfield HMA using the Superpave gyratory compactor. The secondphase of work entailed carrying out the research approach developed at the conclusion ofthe first phase or work. This second phase consisted of both field and laboratory work.Ten airfields from across the US were visited in order to evaluate performance. Materialsfrom the different airfield pavements were obtained and included during a laboratorystudy. The final phase of work involved analyzing all data and preparing the final report.
Based upon the first phase of research, there are a lot of similarities between theMarshall and Superpave methods of designing HMA. Both methods have similarrequirements for materials utilized within the mix and both methods rely heavily onselecting appropriate volumetric properties to define the optimum asphalt binder content.The biggest difference between the two methods is the design compactive effort. TheMarshall mix design method utilizes the impact loading of the Marshall hammer whilethe Superpave method utilizes the kneading action of the SGC. Therefore, the bulk of theresearch was conducted to develop the appropriate design compactive effort using theSGC.
At the conclusion of the study, a mix design method was recommended forairfield HMA that utilizes the SGC. The method entails primarily four steps. The firststep in the mix design method is to select appropriate materials. Materials needingselection include coarse aggregates, fine aggregates, asphalt binder, anti-strippingadditives and mineral fillers. Recommended values for a guide specification wereprovided. The next step in the mix design procedure is to develop a design gradationutilizing the selected aggregates. This process involves blending the selected stockpilesto meet the recommended gradation bands and selecting a blend that will meet allrequirements. The third step entails selecting optimum asphalt binder content. Optimumasphalt binder content is defined as the asphalt binder content that results in 4.0 percentair voids and meets all other volumetric properties. The design compactive effort isapplied utilizing the SGC. The final step in the mix design method is to evaluate thedesigned mixture for moisture susceptibility.
xi
SUMMARY OF FINDINGS
Airfield Asphalt Pavement Technology Program Project 04-03, Implementationof Superpave Mix Design for Airfield Pavements, was conducted to develop andrecommend a method of designing hot mix asphalt (HMA) for airfield pavementsutilizing the Superpave gyratory compactor (SGC). The research approach entailed threephases of work. During the first phase, background information was obtained throughreviewing specification, reports and literature, and discussions with airfield pavementexperts. This information was then used to develop an approach for developing a mixdesign method for airfield HMA using the SGC. The second phase of work entailedcarrying out the research approach developed at the conclusion of the first phase of work.This second phase consisted of both field and laboratory work. Ten airfields from acrossthe US were visited in order to evaluate performance. Materials from the differentairfield pavements were obtained and included during a laboratory study. The final phaseof work involved analyzing all data and preparing the final report.
During the first phase of research, the researchers contacted a number ofindividuals experienced in construction of flexible airfield pavements. Theseconversations were conducted to identify concerns about utilizing both the Marshall andSuperpave mix design methods for designing airfield HMA. Additionally, theresearchers wanted to identify the most common distress types encountered in airfieldflexible pavements. Also conducted during the first phase of work was a criticalcomparison between the Marshall and Superpave mix design method.
Based upon the critical comparison between the two mix design methods, the twohave many similarities. Both include four primary steps in the mix design process, whichinclude: selection of materials, selecting the design gradation, selecting optimum asphaltbinder content, and evaluation of moisture susceptibility. Both methods have criteria forthe selection of materials that are similar in that the desired quality characteristics aresimilar. The test methods are not always the same; however, the desired characteristicsare similar. There are more differences in how the aggregates are blended. TheSuperpave gradation requirements allow for the most gradation options (maximumaggregate sizes) and the most production shapes for a given maximum aggregate size.The Marshall gradation requirements tend to be more restrictive because of the use ofgradation bands. The biggest difference in the two mix design methods is the method ofapplying the laboratory design compactive effort. The Marshall method utilizes theimpact energy of the Marshall hammer and the Superpave method utilizes the kneadingaction of the SGC. The design compactive effort using the Marshall hammer is thenumber of impacts imparted onto the confined HMA sample, while the SGC kneads theconfined HMA sample using a specified number of gyrations. With respect to moisturesusceptibility, both methods utilize tensile strength ratios. Based upon the criticalcomparison, the primary issues that had to be addressed as part of this study were designlaboratory effort, appropriate volumetric criteria for selection of optimum asphalt bindercontent, appropriate gradation requirements for airfields, and appropriate test methodsand criteria for materials selection. Based upon the discussions with the airfield
xii
pavement experts, the major distress types that should be considered are related toenvironmental effects.
At the conclusion of the first phase of work, are experimental program wasdeveloped in order to address the issues described above. The experimental planinvolved identifying and visiting ten airfield pavements from across the US. Includedwithin the ten airfields were general aviation airfields, large commercial airfields, andmilitary airfields. At each airfield, a performance evaluation of the selected pavementwas conducted. Materials from the original sources that were used to fabricate the HMAwere also obtained and utilized in a laboratory study. These original materials were usedin two primary laboratory evaluations. The first evaluation was conducted to select anappropriate number of gyrations to design HMA. The second laboratory evaluation wasconducted to evaluate appropriate gradation requirements. Based upon the results of thefield and laboratory work, a mix design method was developed for airfield HMA thatutilize the SGC.
The basic structure of the mix design method that was developed was identical tothat described above as there are four primary steps which include: 1) selection ofmaterials; 2) selection of design gradation; 3) selection of optimum asphalt bindercontent; and 4) evaluation of moisture susceptibility. Of particular interest, threedifferent design compactive efforts were recommended with the SGC. The appropriatedesign compactive effort is selected based upon the tire pressures expected for the aircraftthat will utilize the airfield pavement. Recommended material requirements, specificallyaggregates, are also based upon the expected tire pressures. Gradation recommendationswithin the mix design method are a compromise between the two historical airfield mixdesign methods, Item P-401 and UFGS 32 12 15.
1
CHAPTER 1Introduction and Research Approach
INTRODUCTION
Approximately ninety percent of America’s paved runways are paved with hot
mix asphalt (HMA). However, only a small percentage of the total HMA placed in the
United States is used for airfields. Historically, HMA for airfield pavements has been
designed using the Marshall mix design method. Conversely, the vast majority of non-
airfield HMA pavements placed during the last 5 to 7 years have been designed using the
Superpave mix design system. The percentage of HMA that is being designed using the
Superpave mix design system is increasing every year. Therefore, mix design experience
is being gained by HMA contractors, commercial labs, and industry personnel in the area
of Superpave. Since the Marshall mix design procedure is becoming the exception to the
rule, industry personnel are becoming increasingly unfamiliar with the Marshall mix
design method. As such, the airfield industry needs to implement the Superpave mix
design system in airfield pavements in order to benefit from the industry’s experience
with Superpave.
Background
Airfield Hot Mix Asphalt Design Specifications
Three specifications are typically used to design airfield HMA pavements. These
include Item P-401 documented in the Federal Aviation Administration (FAA) Advisory
Circular (AC) 150/5370-10B; the Department of Defense (DoD) Unified Facilities Guide
Specification (UFGS)-32 12 15; and Engineering Brief (EB) 59A. Item P-401 and
2
UFGS-32 12 15 are Marshall mix design specifications. Item P-401 is utilized on most
civilian airfields. The UFGS-32 12 15 is utilized to design HMA for military airfields.
EB-59A is the current Superpave mix design system allowed for airfield
pavements. Using EB-59A requires approval at the FAA regional office level because it
is considered a modification of standards. EB-59A was released in May 2006 and its
predecessor EB-59 was released in December 2001. The relatively recent releases of the
specifications and the extra approvals required in using these specifications have resulted
in relatively few airfields utilizing either EB-59 or EB-59A specifications.
A Brief History of the Marshall Mix Design System
The basic concepts of the Marshall mix design method were initially developed
by Bruce Marshall with the Mississippi State Highway Department around 1939. The
Marshall mix design procedure evolved over the years from the period of World War II
to the late 1950s. The motivation for developing the mix design procedure was a need
for a method to proportion aggregates and asphalt binder that could sustain increasing
wheel loads and tire pressures produced by military aircraft.
In order to develop the design procedure, the Army Corp of Engineers Waterways
Experiment Station reviewed the Marshall mix design method along with several others
and ultimately investigated the Marshall mix design method versus the more commonly
used Hubbard-Field test method (1). The laboratory investigation of the two methods
revealed that the Marshall mix design method compared favorably with the results of the
Hubbard-Field method in measurement of stability, sensitivity to asphalt, and
reproduction of test results. The Hubbard-field apparatus was large, heavy, and not easily
3
portable. The Marshall method was eventually recommended for adoption by the Corps
of Engineers because: 1) it was designed to stress the entire HMA sample rather than just
a portion of it; 2) it facilitated rapid testing with minimal effort; 3) it was compact, light,
and portable; and 4) it produced densities reasonably close to field densities. The
Marshall stability test method could also be performed with minor adjustments to the
existing California Bearing Ratio (CBR) equipment that was being used during pavement
structural designs (1).
Sample preparation in the original Marshall mix design method was different than
it is today. The original Marshall compaction procedure was 25 blows of the standard
Proctor hammer followed by the application of a 5000-lb static load for two minutes.
This static load was used to level the sample. Initially, during the Marshall Stability test,
stability was the sole characteristic measured. The flow measurement was later added
because of the desire to add a measurement of strain to the Marshall Stability test, and
measured in units of 1/32 inches rather than the current 0.1 inches (2).
The Marshall Procedure continued to evolve during the mid 1940’s. Some initial
test sections indicated that the original Marshall mix design method selected an asphalt
content that was too high. After review, a new compactive effort was selected of 55
blows on each side of the specimen followed by the 5000-lb static load. Another study
concluded that the static load could be removed if the area of the hammer face were
increased from the 1.95 sq. in. of the modified AASHO hammer used for Proctors to
3.875 sq. in. and the hammer weight increased from 10-lb to 12.5-lb. The density
achieved by the 55 blow method (including static loading) was approximately equal to
the density achieved by 50 blows per face of a 12.5 lb hammer.
4
A conference was held in Vicksburg, MS regarding the Marshall procedure in
1947. The participants recommended that a 10 pound hammer be used instead of the
12.5 lb hammer. The research using the 10 pound hammer at 50 blows subsequently
returned a conclusion that stated the target field density was 98 percent of that determined
by the 50-blow compactive effort. Thus, the standard compaction procedure became 50
blows per face with a 10 lb hammer (2).
As aircraft loadings and tire pressures increased, the Army Corp of Engineers
developed a modification to the 50 blow compactive effort. For pavements expected to
receive tire pressures from 100 psi to 250 psi, the compactive effort was raised from 50 to
75 blows with a Marshall hammer (3).
Performance of Airfield and Highway Flexible Pavements
Airfield and highway flexible pavements have many similarities, but also have
many differences. Both airfield and highway flexible pavements are designed to transfer
loads to the underlying subgrade in a manner that does not overstress the subgrade or
create large tensile stresses at the bottom of the asphalt layer. Also, highways and
airfields typically utilize the highest quality materials near the pavement surface while
material quality generally decreases with depth. The primary differences between
highways and airfields, though, are the types of loads and number of loads that are
experienced during the design life.
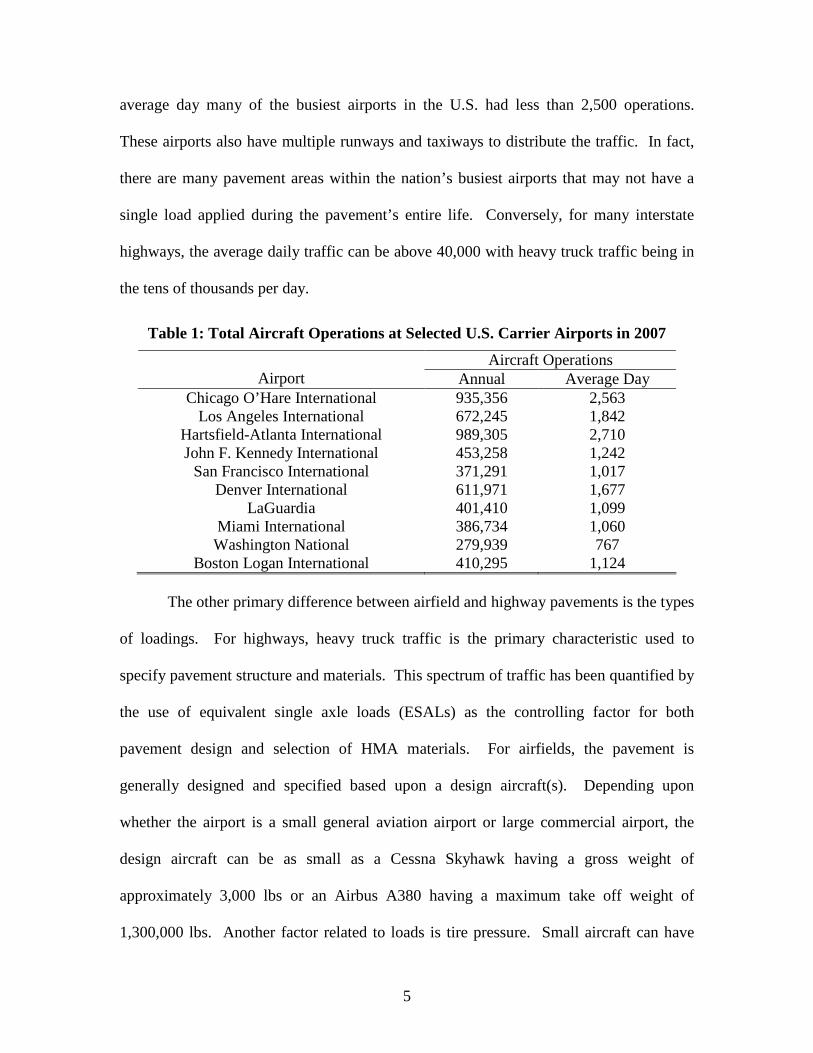
Airfield pavements tend to experience far fewer load repetitions over their design
lives than do highway pavements. Table 1 presents the total number of aircraft
operations at ten selected airports during 2007. This data illustrates that during an
5
average day many of the busiest airports in the U.S. had less than 2,500 operations.
These airports also have multiple runways and taxiways to distribute the traffic. In fact,
there are many pavement areas within the nation’s busiest airports that may not have a
single load applied during the pavement’s entire life. Conversely, for many interstate
highways, the average daily traffic can be above 40,000 with heavy truck traffic being in
the tens of thousands per day.
Table 1: Total Aircraft Operations at Selected U.S. Carrier Airports in 2007
Aircraft OperationsAirport Annual Average Day
Chicago O’Hare International 935,356 2,563Los Angeles International 672,245 1,842
Hartsfield-Atlanta International 989,305 2,710John F. Kennedy International 453,258 1,242
San Francisco International 371,291 1,017Denver International 611,971 1,677
LaGuardia 401,410 1,099Miami International 386,734 1,060Washington National 279,939 767
Boston Logan International 410,295 1,124
The other primary difference between airfield and highway pavements is the types
of loadings. For highways, heavy truck traffic is the primary characteristic used to
specify pavement structure and materials. This spectrum of traffic has been quantified by
the use of equivalent single axle loads (ESALs) as the controlling factor for both
pavement design and selection of HMA materials. For airfields, the pavement is
generally designed and specified based upon a design aircraft(s). Depending upon
whether the airport is a small general aviation airport or large commercial airport, the
design aircraft can be as small as a Cessna Skyhawk having a gross weight of
approximately 3,000 lbs or an Airbus A380 having a maximum take off weight of
1,300,000 lbs. Another factor related to loads is tire pressure. Small aircraft can have
6
tire pressures similar to automobiles, while some military fighter jets can have tire
pressures over 300 psi.
Another difference between airfield and highway pavements is the traffic patterns.
For highways, the traffic is generally channelized and falls within narrow wheelpaths
along the roadway. Traffic patterns on airfields can vary from channelized – moving
(taxiways) to channelized-stacked (runway-taxiway ends) to evenly distributed and
random (aprons) to occasional (runway edges) to almost never (shoulders and blast pads).
The loading types and repetitions on airfield pavements require some areas of the
pavement structure to be able to withstand the sudden impact of landing aircraft.
Generally, most airfield pavements do not have load associated distresses unless the
pavement structure was under-designed or there were construction related problems. As
a matter of fact, a survey of fifteen airfield asphalt industry professionals conducted
during this project indicated that the main distress experienced in airfield pavements is
not structural, like is typically seen in highway pavements (e.g., rutting, fatigue cracking),
but rather environmental. Runways, taxiways and aprons are more prone to raveling and
block cracking, which are caused by environmental conditions such as oxidation and
weathering. In colder climates, thermal cracking is also a serious problem with airfield
HMA pavements.
Highway pavements experience a rejuvenating effect of the vehicular traffic that
helps to mitigate cracking. Airfields do not experience much of the rejuvenating effect or
extra compaction that helps combat cracking and oxidation. Instead, airfield pavements
may see only a few loadings a day, especially when considering wheel wander and the
7
various gear configurations that are present on the different types of aircraft loading at an
airport.
The priority for maintenance in airfield pavements is even more critical for safety
concerns than it is for the highway. The tolerance for severity in pavement distresses for
aircraft is much smaller than the tolerance by highway vehicles. If a vehicle hits a
pothole in an asphalt pavement, it typically causes rider discomfort and, in extreme
conditions, minor vehicular damage. If a heavily loaded plane hits a pothole, it could
break a gear resulting in very expensive equipment damage and potentially cause injuries
or fatalities depending on the speed of the plane. Another concern for distresses in
airfield pavements is foreign object debris (FOD), which causes foreign object damage.
Loose aggregate on an airfield pavement can cause damage to propellers and jet engines.
This FOD damage can be very expensive to repair, but could also lead to passenger
casualty in a worst case scenario.
The Evolution of the Superpave Mix Design System
Beginning in October 1987, the Strategic Highway Research Program (SHRP)
began research on developing a new system for specifying asphalt materials (4). This
$150 million project ($50 million of which was spent on asphalt) funded by congress was
originally tasked with developing an asphalt binder specification, mixture design and
analysis system, and a computer software system with increasingly complex tests and
specifications as traffic levels increased. Currently, the asphalt binder specification and
mixture design system are used in common practice. The developed mix design system
was called Superpave which is an acronym for Superior Performing Asphalt Pavements.
8
The signature piece of equipment within the Superpave mix design system is the
Superpave gyratory compactor (SGC), but the mix design system is more than just the
compactor. The Superpave mix design system provides specifications for choosing
asphalt binder and aggregates as well as volumetric requirements for HMA compacted in
the SGC. It is a performance based design system that measures physical properties of
the binder and aggregate that are directly related to field performance. The performance
or “proof” test of the HMA mixture under the Superpave design system is still under
development. As of 2005, the Superpave mix design system was being used by forty six
of the states in the U.S.
Problem Statement
The Marshall mix design procedure was originally developed in the 1940’s for
airfield pavements. While this mix design procedure has performed well for airfield and
highway pavements for over 50 years there is a need to adopt the new Superpave mix
design procedure for airfield pavements.
An issue with the Marshall mix design method is that the compaction process
does not orient the aggregate in the laboratory compacted sample the same way that it is
oriented in the field. This results in a problem when attempting to conduct performance
tests since the particle orientation will affect the measured results. The gyratory
compactor produces aggregate orientation that is more similar to what is seen in the field.
Another issue with the Marshall method of mix design is the higher variability of
test results. The proficiency sample data from the AASHTO Materials and Reference
Laboratories (AMRL) over the past three years shows that the SGC provides sample air
9
void contents with lower overall variability (standard deviation = 0.995) than samples
compacted using the Marshall pedestal and hammer (standard deviation = 1.059). This
lower variability should result in a more consistent design and should allow QC testing to
better compare with QA testing (5).
A third, and likely most important, issue with the Marshall mix design process is
that most state DOTs have begun using the Superpave mix design procedures. Since
most asphalt work is done by the DOTs, it is becoming more difficult to find contractors
and commercial laboratories having the proper accreditations with the Marshall mix
design method. This problem will become much worse in the future.
Given the issues with the Marshall mix design procedure, it is desirable to adopt
the Superpave mix design system for airfield pavements. Superpave was developed for
highway pavements, not for airfield pavements, so some modifications to the process are
likely needed prior to adopting for airfields. The Superpave mix design process should
not be adopted without some research to identify the specific procedures to be used for
airfields. The compactive effort in the mix design procedure should be a function of
traffic level, traffic loads, speed of traffic, and/or tire pressures, etc.
Objective
The objective of this study was to adapt Superpave gyratory compactor
procedures to design airfield HMA mixes with properties comparable with P-401.
Scope
In order to accomplish the project objective, the researchers carried out a number
of tasks. Initially, the mix design specifications typically used to construct HMA layers
10
were critically reviewed. Comparisons between the Marshall and Superpave mix design
systems were made with emphasis on identifying similarities and differences between the
two systems. Next, the researchers contacted a number of experts in the area of HMA
construction on airfields to discuss concerns with both the Marshall and Superpave
systems. During these discussions, the researchers also identified ten airfields located
throughout the US for execution of a field and laboratory study. For each of the
identified airfields, the researchers visited and conducted a pavement performance
evaluation. Additionally, cores were obtained in order to establish the in-place properties
of the HMA. Materials as close to the original materials as possible were obtained and
included within the laboratory study. The in-place mixes were replicated using the
obtained materials. Specimens were compacted with both the Marshall hammer and
Superpave gyratory compactor using various compactive efforts. Specimens were also
prepared for performance testing. The performance test selected for this project was the
confined repeated load permanent deformation test (or commonly called the Flow
Number Test). At the conclusion of the study, the data was analyzed in order to adopt a
Superpave mix design system for airfield pavements.
Report Format
This report is comprised of three separate volumes. Volume I provides results of
all research along with conclusions and recommendations for implementing Superpave
for airfields. This volume also includes an implementation plan that outlines how the
results of the research may be quickly implemented by FAA and DoD. Volume II
provides a guide specification for designing HMA for airfields using the Superpave
11
concepts. Volume III is a stand-alone guidance document on the selection of appropriate
HMA mixtures for airfield applications when using the Superpave mix design
procedures. This guidance also provides the recommended Superpave mix design
method for airfields along with discussions on construction, performance, quality control
and quality assurance. The purpose of Volume III is to provide practical guidance for
engineers practicing airfield HMA pavement construction.
12
CHAPTER 2:Research Approach
INTRODUCTION
As stated previously, the objective of this project was to adapt the Superpave mix
design procedures for designing HMA to be placed on airfield pavements. In order to
accomplish this objective, three phases of work were required. During the first phase of
research, background information was obtained through reviewing specifications, reports
and literature and discussions with airfield pavement experts. This information was then
utilized to develop an approach for adapting Superpave for airfields.
The second phase of work entailed carrying out the research approach developed
at the conclusion of the first phase of work. This second phase consisted of both field
and laboratory tasks. Ten airfields from all over the US were visited in order to evaluate
performance. Materials from the different airfield pavements were also obtained and
used in the laboratory.
The final phase of research was to prepare the final reports. The following
sections provide details on the overall research approach.
Phase 1: Program Review
The objective of the first phase of research was to develop an approach for
adapting the Superpave mix design procedures for use on airfields. In order to develop
the approach, the researchers conducted a literature review, interviewed airfield pavement
experts, and reviewed various specifications.
13
The literature was reviewed in order to identify any evaluations between the
Marshall and Superpave mix design methods that had already been accomplished. Of
particular interest were studies that compared the compactive efforts within the two mix
design methods.
Background information on the current issues/concerns with HMA pavements
was obtained by interviewing various airfield pavement experts. The FAA is divided into
nine regions. Roughly, the regions represent different climatic zones. The researchers
contacted a number of FAA Pavement Engineers to discuss HMA pavement performance
in the various regions of the country. The US Corps of Engineers, Air Force Civil
Engineer Support Agency and Naval Facilities Engineering Command also have
engineers familiar with airfield pavement performance. Discussions with these various
engineers were conducted to identify:
1) Concerns about existing HMA mix design specifications.
2) Pavements constructed using EB-59 or EB-59A.
3) Problematic areas for localized problems, e.g. taxiways, aprons, shoulders,
blast pads, etc.
4) Candidate airfields to conduct field work during the second phase of research
5) Airports that have modified specifications to combat specific distresses.
The final task conducted to review the state-of-practice was to critically compare
the various specifications used to design HMA for airfield pavements. As stated
previously, there are three primary specifications used to design HMA for airfield
pavements. Item P-401, UFGS-32 12 15, and EB-59A. A critical review of these
14
specifications was conducted in order to identify similarities and differences between the
requirements within the specifications. Identifying the similarities and differences
assisted in allowing the researchers to adapt the Superpave method to airfield HMA.
At the conclusion of the Phase I work, the researchers developed field and
laboratory investigations plans. A three pronged approach was developed for the field
and laboratory studies:
Pavements were identified of varying maximum aggregate size, aggregate types,
gradations, environmental conditions and loading, a condition assessment was
performed and core samples were collected from the airfield pavements to
verify the as-constructed mixtures.
Materials that were as close as possible to the original materials were collected
and the mixtures were replicated in the first field phase. Comparisons were
performed with Superpave and Marshall compaction efforts. Performance tests
were also performed to determine the rutting susceptibility of the mixtures.
A draft specification was developed and on-going airport paving projects were
sampled to evaluate the specification and collect data for the development of
quality control and quality assurance specifications.
Pavements were identified for various types of loading. Two projects were
identified as having rutting problems. Mix designs and quality control and quality
assurance data for all pavements were obtained. The mix designs were used to select
airfield pavements representing a range of materials and gradations. Original materials
were identified and sampled for the candidate sites so that the mix could be replicated in
15
the laboratory. Candidate sites were visited to perform a condition assessment and to
obtain cores in order to verify the as-constructed mixture. Where possible, surface and
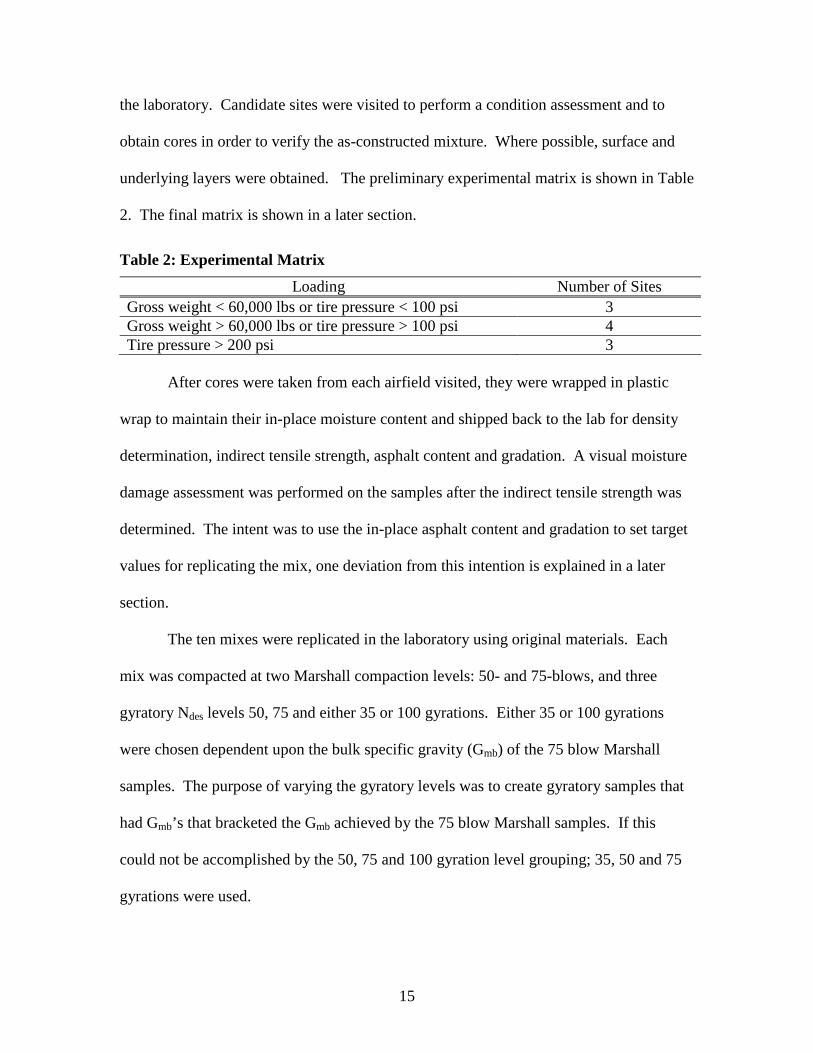
underlying layers were obtained. The preliminary experimental matrix is shown in Table
2. The final matrix is shown in a later section.
Table 2: Experimental Matrix
Loading Number of Sites
Gross weight < 60,000 lbs or tire pressure < 100 psi 3Gross weight > 60,000 lbs or tire pressure > 100 psi 4Tire pressure > 200 psi 3
After cores were taken from each airfield visited, they were wrapped in plastic
wrap to maintain their in-place moisture content and shipped back to the lab for density
determination, indirect tensile strength, asphalt content and gradation. A visual moisture
damage assessment was performed on the samples after the indirect tensile strength was
determined. The intent was to use the in-place asphalt content and gradation to set target
values for replicating the mix, one deviation from this intention is explained in a later
section.
The ten mixes were replicated in the laboratory using original materials. Each
mix was compacted at two Marshall compaction levels: 50- and 75-blows, and three
gyratory Ndes levels 50, 75 and either 35 or 100 gyrations. Either 35 or 100 gyrations
were chosen dependent upon the bulk specific gravity (Gmb) of the 75 blow Marshall
samples. The purpose of varying the gyratory levels was to create gyratory samples that
had Gmb’s that bracketed the Gmb achieved by the 75 blow Marshall samples. If this
could not be accomplished by the 50, 75 and 100 gyration level grouping; 35, 50 and 75
gyrations were used.
16
Based on this data developed by the variety of compaction levels and methods,
the gyratory compaction effort to match each of the Marshall compactive efforts could be
determined. In addition to the volumetric comparison of the three compactive efforts
described above, the research team determined optimum asphalt binder content for each
mix using Ndes values of 50, 75 and 35 or 100. Depending upon the compactive effort of
the original mix (50 or 75 blows), this provided a wide range of mix properties for each
given material. These four mixes (3 Ndes levels and original Marshall) were used for
performance testing described in the following paragraphs.
There are two distress types that are directly related to HMA materials:
permanent deformation and durability. Fatigue cracking is affected by HMA materials
but is more related to pavement structure than HMA materials. The distress type that is
easier to characterize in the laboratory is permanent deformation. Many tests have been
used to characterize durability. However, these tests require a sophisticated model to
relate results to field durability performance. If not calibrated for local conditions, these
models are generally not accurate. Because of the lack of an adequate laboratory
durability test, the research team adopted an experimental plan that utilized laboratory
permanent deformation testing. Because the primary distress on airfield pavements are
durability related, the researchers took the approach of increasing the binder content as
high as possible without developing the potential for rutting. With this approach,
sufficient binder would be added to the mixes without sacrificing rut resistance. The
higher binder content would also provide the best durability. Also, the appropriate 50-
and 75-blow properties were used to ensure that the recommendations are not excessively
different from what is presently being done.
17
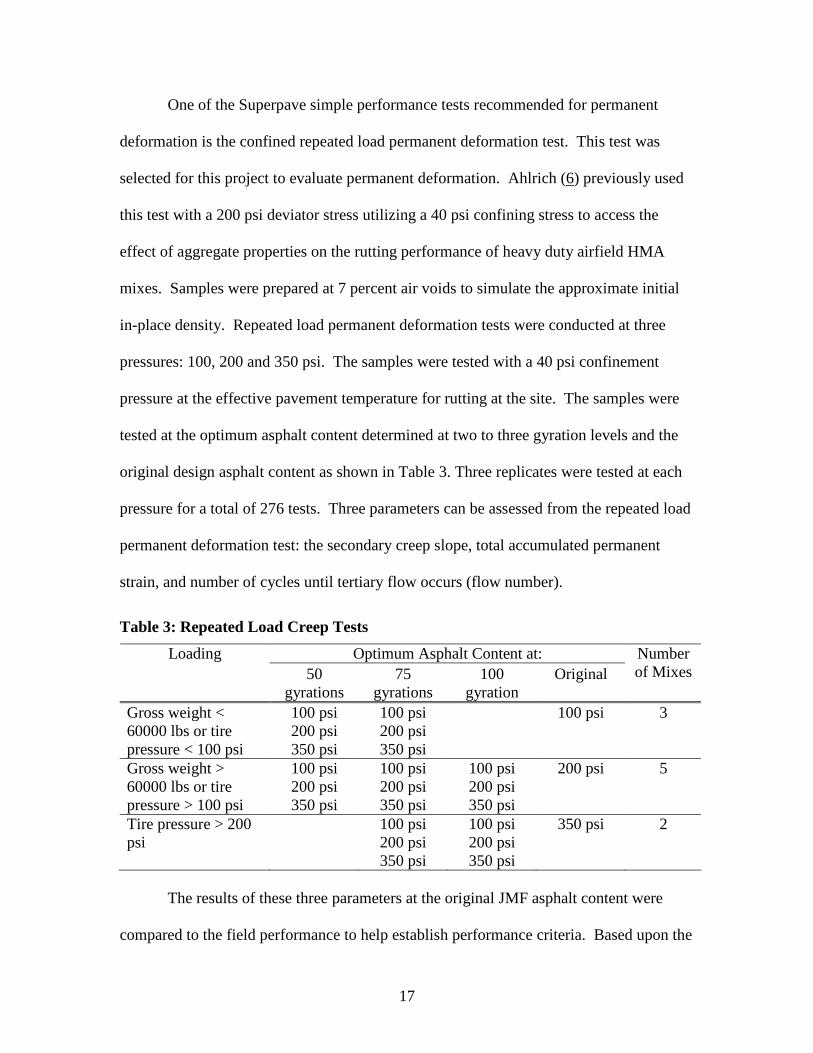
One of the Superpave simple performance tests recommended for permanent
deformation is the confined repeated load permanent deformation test. This test was
selected for this project to evaluate permanent deformation. Ahlrich (6) previously used
this test with a 200 psi deviator stress utilizing a 40 psi confining stress to access the
effect of aggregate properties on the rutting performance of heavy duty airfield HMA
mixes. Samples were prepared at 7 percent air voids to simulate the approximate initial
in-place density. Repeated load permanent deformation tests were conducted at three
pressures: 100, 200 and 350 psi. The samples were tested with a 40 psi confinement
pressure at the effective pavement temperature for rutting at the site. The samples were
tested at the optimum asphalt content determined at two to three gyration levels and the
original design asphalt content as shown in Table 3. Three replicates were tested at each
pressure for a total of 276 tests. Three parameters can be assessed from the repeated load
permanent deformation test: the secondary creep slope, total accumulated permanent
strain, and number of cycles until tertiary flow occurs (flow number).
Table 3: Repeated Load Creep Tests
Optimum Asphalt Content at:Loading
50gyrations
75gyrations
100gyration
Original
Numberof Mixes
Gross weight <60000 lbs or tirepressure < 100 psi
100 psi200 psi350 psi
100 psi200 psi350 psi
100 psi 3
Gross weight >60000 lbs or tirepressure > 100 psi
100 psi200 psi350 psi
100 psi200 psi350 psi
100 psi200 psi350 psi
200 psi 5
Tire pressure > 200psi
100 psi200 psi350 psi
100 psi200 psi350 psi
350 psi 2
The results of these three parameters at the original JMF asphalt content were
compared to the field performance to help establish performance criteria. Based upon the
18
research team’s experiences, the optimum asphalt content derived from 100 design
gyrations is too low for a general aviation field (< 60000 lbs, < 100 psi); therefore, 100
gyration samples were not tested for the mixtures used on general aviation fields.
Similarly, the 50 gyration mix would not provide acceptable performance where tire
pressures are in excess of 200 psi. Therefore, 50 gyration mixes were not tested for
pavements with tire pressures in excess of 200 psi. Thus, using the results from the
repeated load permanent deformation test, it was possible to determine the laboratory
compactive effort that provided adequate rut resistance to various tire pressures. By
selecting the maximum binder content that provides acceptable rutting performance,
durability performance would be maximized.
As stated previously, durability has been a difficult parameter to assess in the
laboratory. Although techniques such the fracture energy ratio tests developed by Roque
and Drakos (7) and Kim an Wen (8) could be used, it is expected that durability is highly
affected by the selected binder grade and field construction. Inadequate density or
segregation will likely lead to poor durability. These are not mix design problems. It is
felt that durability is best addressed by maximizing the binder content while maintaining
stability (rut resistance) and by binder grade selection. Comparisons with the 50- and
75-blow Marshall asphalt contents also provided a relative index of durability. Indirect
tensile tests on cores from the field sites indicated whether or not moisture damage is a
common problem on airfields. It is expected that the finer gradations and higher in-place
density requirements on airfields may help prevent moisture damage. Also, the lower
volume of traffic may reduce the possibility of moisture damage. Further, moisture
19
damage, though affected by design binder content (film-thickness) is generally mitigated
with liquid anti-stripping agents or the addition of lime, not mix design changes.
Even though the research team did not recommend any formalized durability
testing, the research team did have concerns with coarser gradations, specifically
gradations near the Superpave lower control point, for airfield pavements. Research has
shown that these coarser gradations tend to be more permeable than fine-graded mixes.
Therefore, for a number of mixes additional gradations were blended and designed. The
intent of these additional gradations was to cover the wide range of potential gradations
from the lower control point of Superpave to the fine side of UFGS- 32 12 15. For each
of these additional gradations, mixtures were prepared for permeability testing. Cooley et
al (9) presented a method for conducting permeability testing in the laboratory that
correlated well with in-place permeability measurements. Also, Cooley et al (10) have
recommended critical permeability values in which to compare results from this testing.
High levels of permeability will increase the potential for oxidative aging and moisture
damage. Kumar and Goetz (11) have shown a direct relationship between permeability
and asphalt age hardening. Results of this permeability testing assisted the researchers in
recommending gradation requirements for HMA to be used on airfields.
Once the laboratory data was compiled and the tentative framework developed,
additional field testing was conducted. Quality assurance testing was conducted using
the proposed specification as a shadow specification. Marshall samples were compacted
for comparison. In addition to verifying the proposed volumetric properties and
compaction levels, this data was used to adjust volumetric variability within the current
P401 quality control/quality assurance specifications.
20
Phase II – Conduct Investigations
The field investigation was conducted in two phases. The first phase, described
previously required the research team to visit ten airfields, visually assess performance
and collect design and production data. This required careful coordination with airfield
officials to obtain access to various airfield taxiways and runways. Cores were shipped
to Burns Cooley Dennis, Inc. (BCD) for testing.
The second part of the field study was to sample two demonstration projects.
This work provided a check of the mix design system, Quality control and quality
assurance data and served as a step towards implementation by demonstrating the
proposed design system to aviation officials.
The core testing was conducted by BCD. All aggregate processing, replication,
and testing of Marshall mixes and gyratory mix designs was conducted by BCD. NCAT
conducted all of the permanent deformation tests. This division of labor prevented
confounding variability issues caused by performing tests on different sets of equipment.
Phase III - Reports
The final phase of work entailed compiling the draft final report according to the
guidelines established by the AAPTP. Additionally, the researchers met with the project
panel to present the research results. Following the review of the draft final report and
the project panel meeting, the final report was submitted.
21
CHAPTER 3Review of Existing Airfield Specifications
The primary hot mix asphalt (HMA) mix design specifications utilized for airfield
pavements include Item P-401, documented in the FAA Advisory Circular (AC)
150/5370-10B, and the DoD’s UFGS-32 12 15. Item P-401 is utilized on most civilian
airfields. However, the HMA used on many general aviation airfields is designed using
local specifications because of the relatively light aircraft and the relatively few
operations. The UFGS-32 12 15 is utilized to design HMA for military airfields. EB59A
does include the Superpave gyratory compactor in designing HMA for airfield
pavements; however, it follows the general Superpave requirements for highways with
the material requirements similar to the existing P-401 requirements.
Hot mix asphalt for highway pavements is most commonly designed in
accordance with the Superpave mix design method as outlined in AASHTO M323,
“Standard Specification for Superpave Volumetric Mix Design.” Practically every State
Department of Transportation has adopted the Superpave mix design method for
designing HMA for highways. From a production standpoint, this means that most HMA
produced in the U.S. is designed using the Superpave mix design method.
The following sections critically review the historical methods of designing HMA
for airfields and the Superpave mix design method for highways. The review entailed
evaluating the similarities and differences between the methods. EB59A was
intentionally left out of this review because it is a hybrid containing parts of the historical
methods and of the Superpave for highways methods.
22
General
All three of the HMA mix design specifications mentioned above have a similar
goal: develop the right volumetric proportion of aggregates, asphalt binder, and air voids.
By designing an HMA with the right volumetric proportions, the pavement structure the
HMA is placed on should perform with respect to stability and durability. Each method
includes basically the same four steps: 1) select acceptable materials (aggregates and
asphalt binder); 2) blend the selected materials to meet specifications; 3) select an
appropriate optimum asphalt binder content; and 4) evaluate the designed mixture for
moisture susceptibility.
Selection of Materials
Materials used in the design of dense-graded HMA include coarse aggregates,
fine aggregate, asphalt binder, and other materials that may be required to meet the mix
design specifications. In some instances, mineral fillers are needed if local aggregates do
not contain a sufficient amount of material passing the 0.075mm (No. 200) sieve. When
local materials have a high potential for moisture susceptibility, anti-stripping additives
are also commonly used within the HMA. The following sections discuss the material
requirements for the different mix design methods.
Coarse Aggregates
All three mix design specifications provide recommendations for coarse aggregate
angularity and shape. For coarse aggregate angularity, all three methods specify a
minimum percentage of coarse aggregates with fractured faces; however, the
23
requirements are slightly different. Item P-401 does not reference a specific standard for
performing the fractured face count test; rather, it specifies that a fractured face “…shall
be equal to at least 75 percent of the smallest mid-sectional area of the piece.” This same
terminology is included within the Corps of Engineers (COE) test method CRD-C 171-
95, “Standard Test Method of Determining Percentage of Crushed Particles in
Aggregate,” which is referenced in UFGS-32 12 15. The primary difference between
Item P-401 and UFGS-32 12 15 is that Item P-401 has specification requirements for
both one and two or more fractured faces, while UFGS-32 12 15 only specifies a
minimum percentage of coarse aggregates with two or more fractured faces.
The standard specification for Superpave (AASHTO M323) references ASTM
D5821, “Standard Test Method for Determining the Percentage of Fractured Particles in
Coarse Aggregate,” as the method of measuring fractured faces. Within this standard, a
face is considered fractured “… only if it has a projected area at least as large as one
quarter of the maximum projected area (maximum cross-sectional area) of the particle
and the face has sharp or slightly blunt edges.” Similar to Item P-401, the Superpave
method has requirements for both one and two or more fractured faces.
Both Item P-401 and Superpave have varying fractured face requirements based
upon anticipated pavement loadings. Item P-401 differentiates based upon an aircraft
gross weight of 60,000 lbs. For pavements designed for aircraft larger than 60,000 lbs,
the minimum requirement for one fractured face is 85 percent with a minimum of 70
percent two or more fractured faces. For pavements designed for aircraft less than 60,000
lbs, the minimum requirements are 65 percent one fractured face and 50 percent two or
more. Similarly, the Superpave requirements for percent fractured faces are based upon
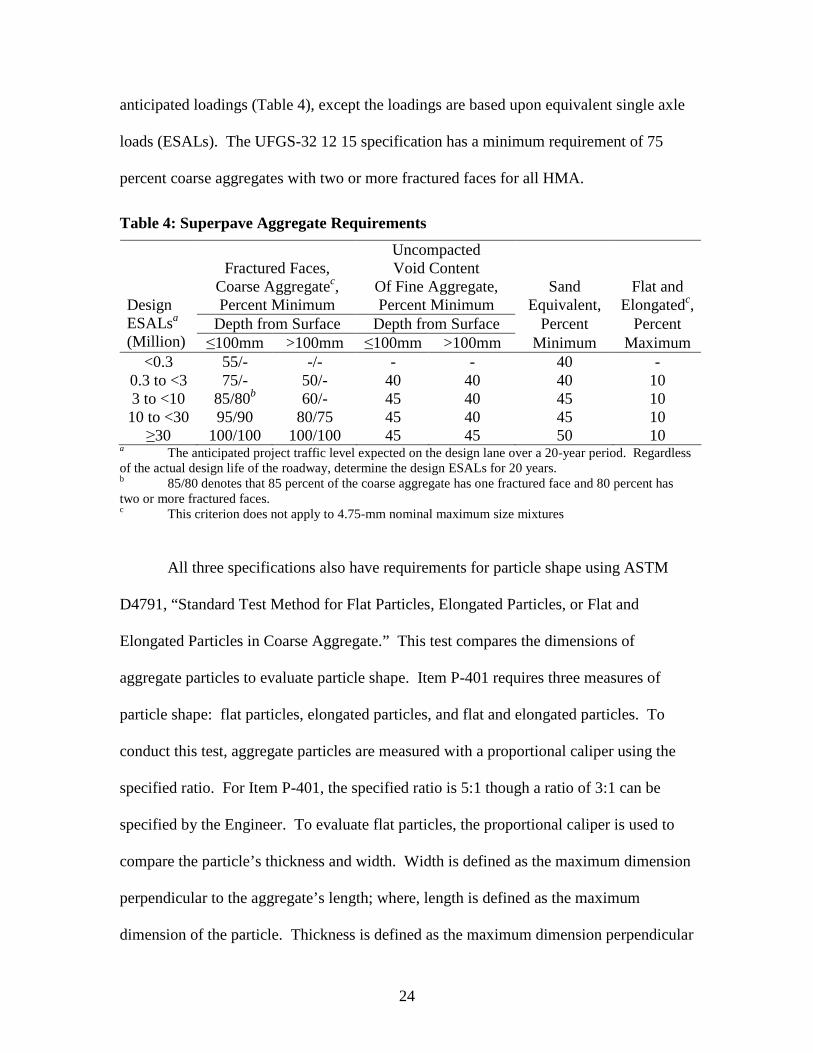
24
anticipated loadings (Table 4), except the loadings are based upon equivalent single axle
loads (ESALs). The UFGS-32 12 15 specification has a minimum requirement of 75
percent coarse aggregates with two or more fractured faces for all HMA.
Table 4: Superpave Aggregate Requirements
Fractured Faces,Coarse Aggregatec,Percent Minimum
UncompactedVoid Content
Of Fine Aggregate,Percent Minimum
SandEquivalent,
Flat andElongatedc,
Depth from Surface Depth from Surface Percent PercentDesignESALsa
(Million) ≤100mm >100mm ≤100mm >100mm Minimum Maximum<0.3 55/- -/- - - 40 -
0.3 to <3 75/- 50/- 40 40 40 103 to <10 85/80b 60/- 45 40 45 1010 to <30 95/90 80/75 45 40 45 10
≥30 100/100 100/100 45 45 50 10a The anticipated project traffic level expected on the design lane over a 20-year period. Regardlessof the actual design life of the roadway, determine the design ESALs for 20 years.b 85/80 denotes that 85 percent of the coarse aggregate has one fractured face and 80 percent hastwo or more fractured faces.c This criterion does not apply to 4.75-mm nominal maximum size mixtures
All three specifications also have requirements for particle shape using ASTM
D4791, “Standard Test Method for Flat Particles, Elongated Particles, or Flat and
Elongated Particles in Coarse Aggregate.” This test compares the dimensions of
aggregate particles to evaluate particle shape. Item P-401 requires three measures of
particle shape: flat particles, elongated particles, and flat and elongated particles. To
conduct this test, aggregate particles are measured with a proportional caliper using the
specified ratio. For Item P-401, the specified ratio is 5:1 though a ratio of 3:1 can be
specified by the Engineer. To evaluate flat particles, the proportional caliper is used to
compare the particle’s thickness and width. Width is defined as the maximum dimension
perpendicular to the aggregate’s length; where, length is defined as the maximum
dimension of the particle. Thickness is defined as the maximum dimension perpendicular
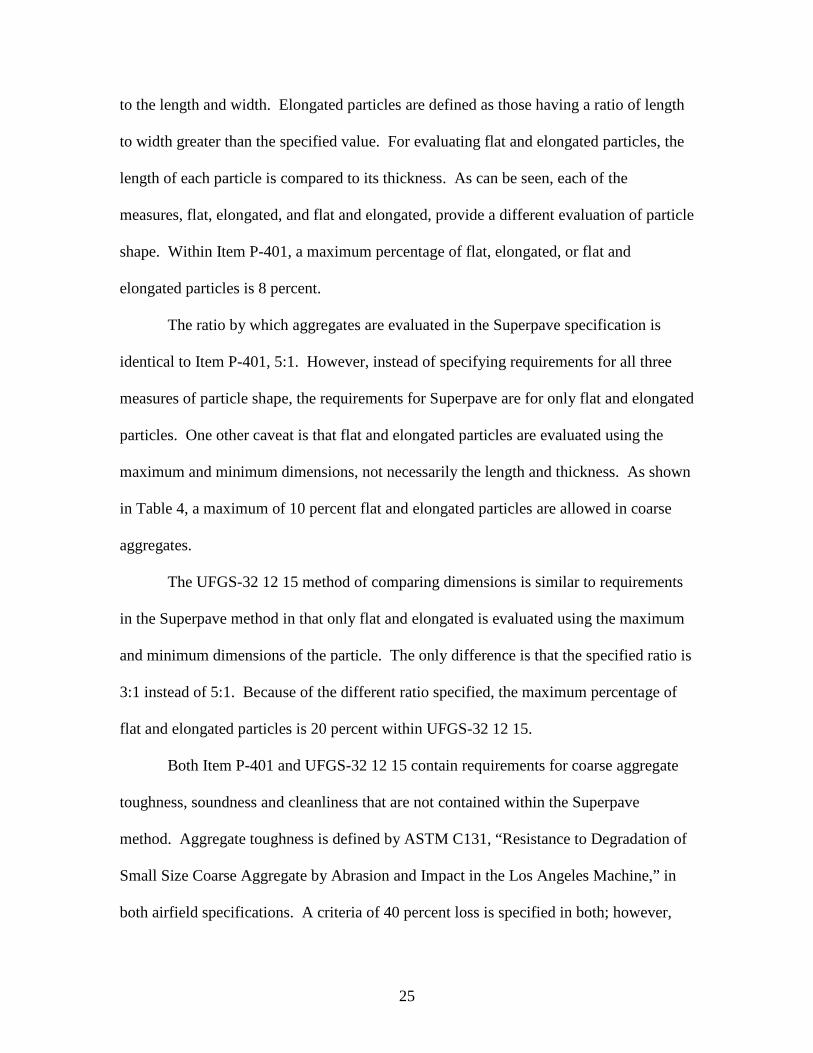
25
to the length and width. Elongated particles are defined as those having a ratio of length
to width greater than the specified value. For evaluating flat and elongated particles, the
length of each particle is compared to its thickness. As can be seen, each of the
measures, flat, elongated, and flat and elongated, provide a different evaluation of particle
shape. Within Item P-401, a maximum percentage of flat, elongated, or flat and
elongated particles is 8 percent.
The ratio by which aggregates are evaluated in the Superpave specification is
identical to Item P-401, 5:1. However, instead of specifying requirements for all three
measures of particle shape, the requirements for Superpave are for only flat and elongated
particles. One other caveat is that flat and elongated particles are evaluated using the
maximum and minimum dimensions, not necessarily the length and thickness. As shown
in Table 4, a maximum of 10 percent flat and elongated particles are allowed in coarse
aggregates.
The UFGS-32 12 15 method of comparing dimensions is similar to requirements
in the Superpave method in that only flat and elongated is evaluated using the maximum
and minimum dimensions of the particle. The only difference is that the specified ratio is
3:1 instead of 5:1. Because of the different ratio specified, the maximum percentage of
flat and elongated particles is 20 percent within UFGS-32 12 15.
Both Item P-401 and UFGS-32 12 15 contain requirements for coarse aggregate
toughness, soundness and cleanliness that are not contained within the Superpave
method. Aggregate toughness is defined by ASTM C131, “Resistance to Degradation of
Small Size Coarse Aggregate by Abrasion and Impact in the Los Angeles Machine,” in
both airfield specifications. A criteria of 40 percent loss is specified in both; however,
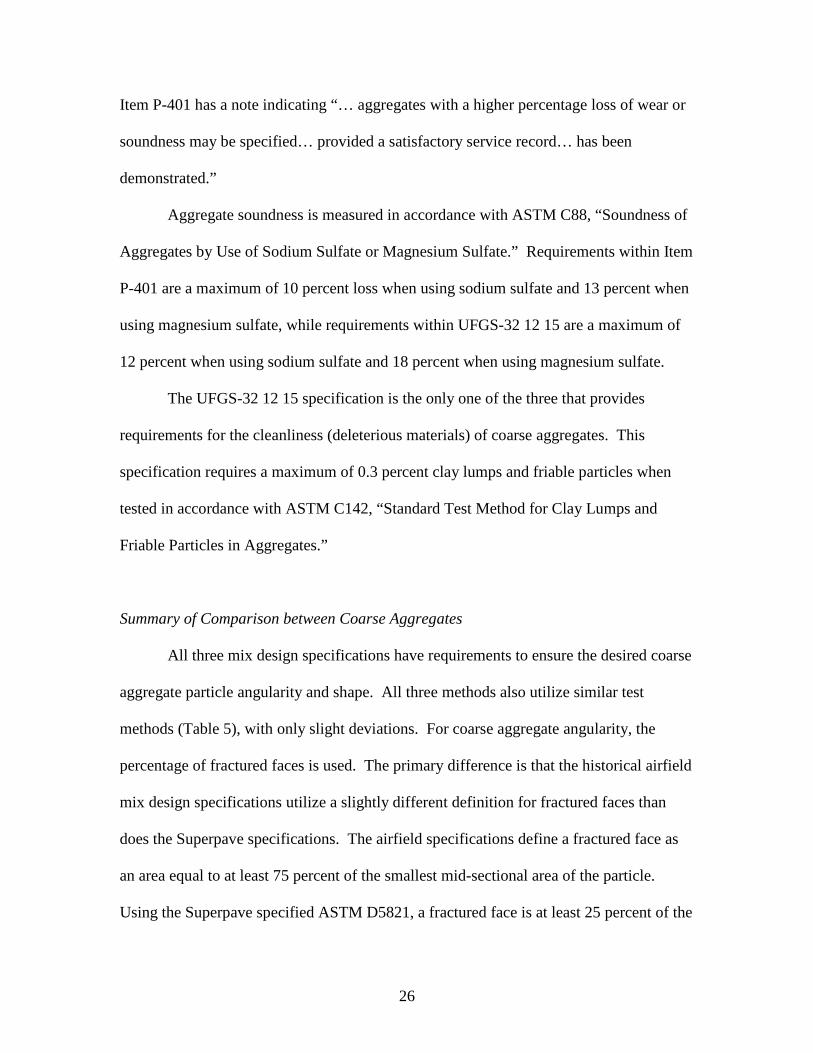
26
Item P-401 has a note indicating “… aggregates with a higher percentage loss of wear or
soundness may be specified… provided a satisfactory service record… has been
demonstrated.”
Aggregate soundness is measured in accordance with ASTM C88, “Soundness of
Aggregates by Use of Sodium Sulfate or Magnesium Sulfate.” Requirements within Item
P-401 are a maximum of 10 percent loss when using sodium sulfate and 13 percent when
using magnesium sulfate, while requirements within UFGS-32 12 15 are a maximum of
12 percent when using sodium sulfate and 18 percent when using magnesium sulfate.
The UFGS-32 12 15 specification is the only one of the three that provides
requirements for the cleanliness (deleterious materials) of coarse aggregates. This
specification requires a maximum of 0.3 percent clay lumps and friable particles when
tested in accordance with ASTM C142, “Standard Test Method for Clay Lumps and
Friable Particles in Aggregates.”
Summary of Comparison between Coarse Aggregates
All three mix design specifications have requirements to ensure the desired coarse
aggregate particle angularity and shape. All three methods also utilize similar test
methods (Table 5), with only slight deviations. For coarse aggregate angularity, the
percentage of fractured faces is used. The primary difference is that the historical airfield
mix design specifications utilize a slightly different definition for fractured faces than
does the Superpave specifications. The airfield specifications define a fractured face as
an area equal to at least 75 percent of the smallest mid-sectional area of the particle.
Using the Superpave specified ASTM D5821, a fractured face is at least 25 percent of the
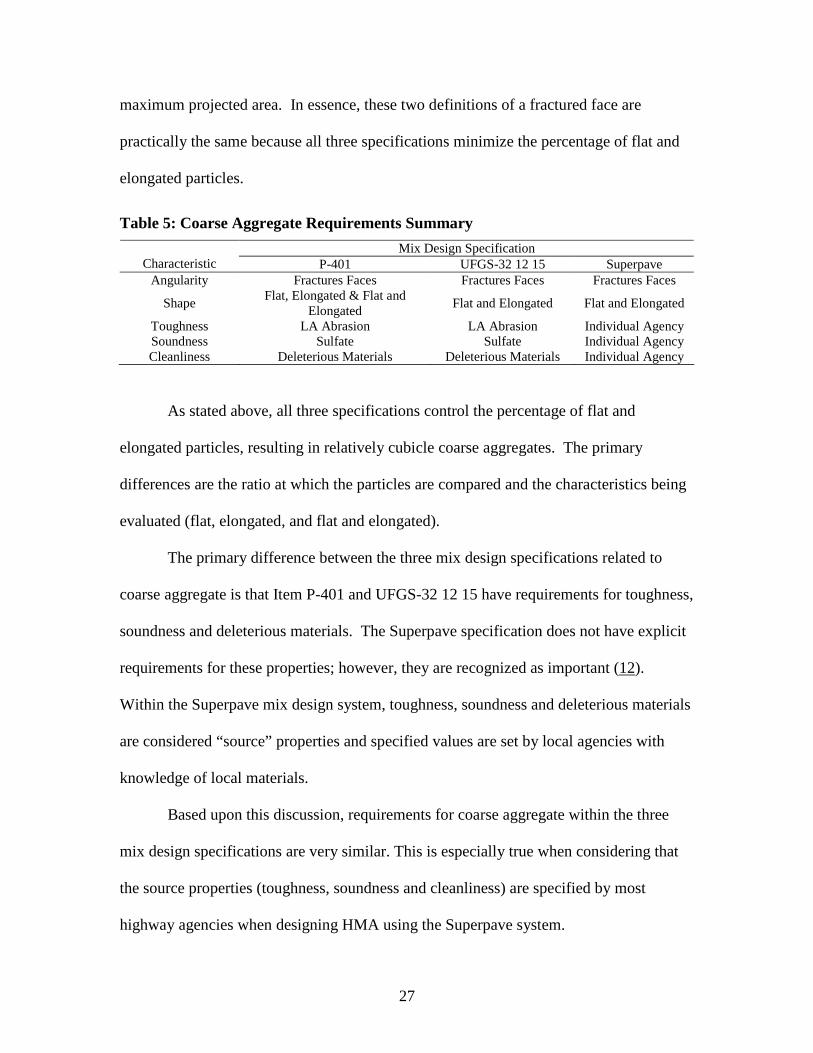
27
maximum projected area. In essence, these two definitions of a fractured face are
practically the same because all three specifications minimize the percentage of flat and
elongated particles.
Table 5: Coarse Aggregate Requirements Summary
Mix Design SpecificationCharacteristic P-401 UFGS-32 12 15 Superpave
Angularity Fractures Faces Fractures Faces Fractures Faces
ShapeFlat, Elongated & Flat and
ElongatedFlat and Elongated Flat and Elongated
Toughness LA Abrasion LA Abrasion Individual AgencySoundness Sulfate Sulfate Individual AgencyCleanliness Deleterious Materials Deleterious Materials Individual Agency
As stated above, all three specifications control the percentage of flat and
elongated particles, resulting in relatively cubicle coarse aggregates. The primary
differences are the ratio at which the particles are compared and the characteristics being
evaluated (flat, elongated, and flat and elongated).
The primary difference between the three mix design specifications related to
coarse aggregate is that Item P-401 and UFGS-32 12 15 have requirements for toughness,
soundness and deleterious materials. The Superpave specification does not have explicit
requirements for these properties; however, they are recognized as important (12).
Within the Superpave mix design system, toughness, soundness and deleterious materials
are considered “source” properties and specified values are set by local agencies with
knowledge of local materials.
Based upon this discussion, requirements for coarse aggregate within the three
mix design specifications are very similar. This is especially true when considering that
the source properties (toughness, soundness and cleanliness) are specified by most
highway agencies when designing HMA using the Superpave system.
28
Fine Aggregates
All three mix design specifications contain fine aggregate requirements for
angularity and cleanliness, though there are some differences in the methods of
specifying these characteristics. Within the two historical airfield specifications, there is
a maximum percentage of 15 percent natural sands (noncrushed material) to prevent an
excessive amount of rounded fine aggregate particles. In addition to a maximum
percentage of natural sands, UFGS-32 12 15 also has a requirement for uncompacted
voids determined in accordance with ASTM C 1252, Method A, “Standard Test Method
for Uncompacted Void Content of Fine Aggregate (as Influenced by Particle Shape,
Surface Texture, and Grading).” This test method has to be performed on the fine
aggregate fraction of the total aggregate blend. A single requirement of 45 percent voids
in the uncompacted aggregate is required. A note within UFGS-32 12 15 does, however,
allow a minimum uncompacted void content as low as 43 if local experience indicates
that a value lower than 45 can be used. The Superpave mix design specification also
utilizes the uncompacted voids tests to ensure angular fine aggregates; however,
AASHTO T304 Method A, “Uncompacted Void Content of Fine Aggregate,” is
specified. The primary difference between UFGS-32 12 15 and Superpave specifications
being that the Superpave mix design method has specification requirements based upon
traffic (ESALs) (Table 4) instead of a single requirement.
All three mix design specifications also utilize the sand equivalency test (ASTM
D2419 or AASHTO T176) to prevent fine aggregates with large percentages of clay-
sized particles. The two historical airfield specifications require a minimum sand
equivalent value of 45 while the Superpave specification has requirements based upon
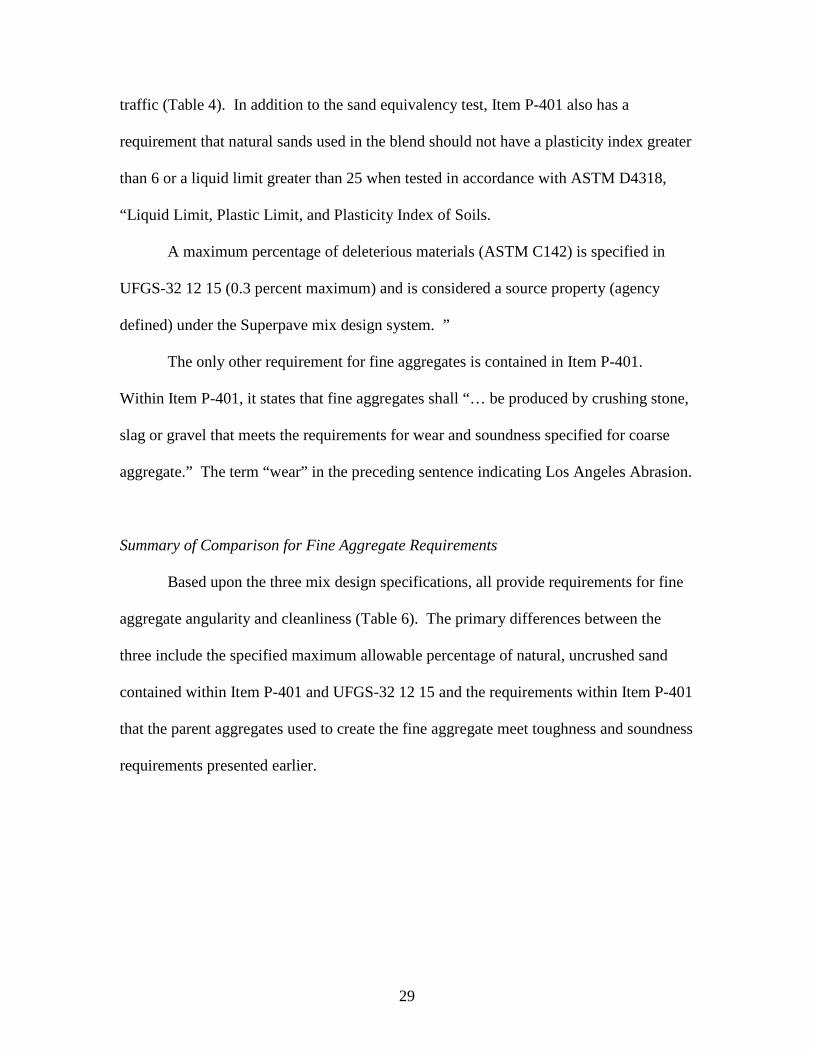
29
traffic (Table 4). In addition to the sand equivalency test, Item P-401 also has a
requirement that natural sands used in the blend should not have a plasticity index greater
than 6 or a liquid limit greater than 25 when tested in accordance with ASTM D4318,
“Liquid Limit, Plastic Limit, and Plasticity Index of Soils.
A maximum percentage of deleterious materials (ASTM C142) is specified in
UFGS-32 12 15 (0.3 percent maximum) and is considered a source property (agency
defined) under the Superpave mix design system. ”
The only other requirement for fine aggregates is contained in Item P-401.
Within Item P-401, it states that fine aggregates shall “… be produced by crushing stone,
slag or gravel that meets the requirements for wear and soundness specified for coarse
aggregate.” The term “wear” in the preceding sentence indicating Los Angeles Abrasion.
Summary of Comparison for Fine Aggregate Requirements
Based upon the three mix design specifications, all provide requirements for fine
aggregate angularity and cleanliness (Table 6). The primary differences between the
three include the specified maximum allowable percentage of natural, uncrushed sand
contained within Item P-401 and UFGS-32 12 15 and the requirements within Item P-401
that the parent aggregates used to create the fine aggregate meet toughness and soundness
requirements presented earlier.
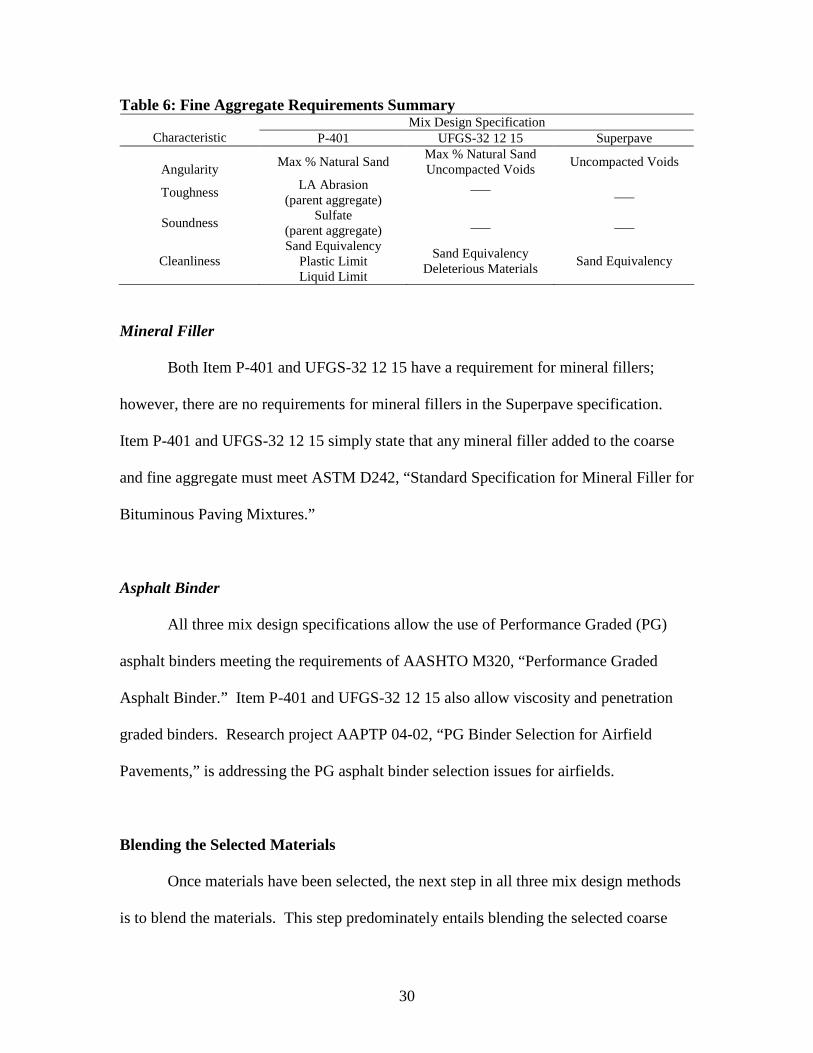
30
Table 6: Fine Aggregate Requirements SummaryMix Design Specification
Characteristic P-401 UFGS-32 12 15 Superpave
AngularityMax % Natural Sand
Max % Natural SandUncompacted Voids
Uncompacted Voids
ToughnessLA Abrasion
(parent aggregate)___
___
SoundnessSulfate
(parent aggregate)___ ___
CleanlinessSand Equivalency
Plastic LimitLiquid Limit
Sand EquivalencyDeleterious Materials
Sand Equivalency
Mineral Filler
Both Item P-401 and UFGS-32 12 15 have a requirement for mineral fillers;
however, there are no requirements for mineral fillers in the Superpave specification.
Item P-401 and UFGS-32 12 15 simply state that any mineral filler added to the coarse
and fine aggregate must meet ASTM D242, “Standard Specification for Mineral Filler for
Bituminous Paving Mixtures.”
Asphalt Binder
All three mix design specifications allow the use of Performance Graded (PG)
asphalt binders meeting the requirements of AASHTO M320, “Performance Graded
Asphalt Binder.” Item P-401 and UFGS-32 12 15 also allow viscosity and penetration
graded binders. Research project AAPTP 04-02, “PG Binder Selection for Airfield
Pavements,” is addressing the PG asphalt binder selection issues for airfields.
Blending the Selected Materials
Once materials have been selected, the next step in all three mix design methods
is to blend the materials. This step predominately entails blending the selected coarse
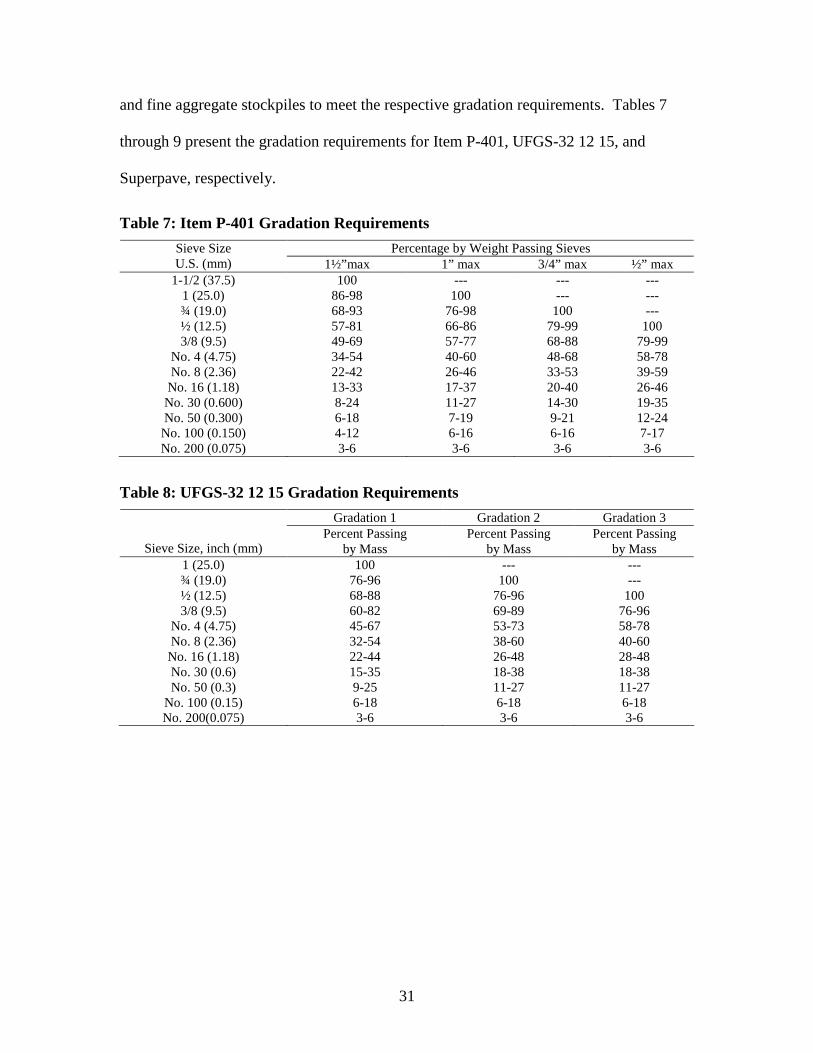
31
and fine aggregate stockpiles to meet the respective gradation requirements. Tables 7
through 9 present the gradation requirements for Item P-401, UFGS-32 12 15, and
Superpave, respectively.
Table 7: Item P-401 Gradation Requirements
Percentage by Weight Passing SievesSieve SizeU.S. (mm) 1½”max 1” max 3/4” max ½” max
1-1/2 (37.5) 100 --- --- ---1 (25.0) 86-98 100 --- ---¾ (19.0) 68-93 76-98 100 ---½ (12.5) 57-81 66-86 79-99 1003/8 (9.5) 49-69 57-77 68-88 79-99
No. 4 (4.75) 34-54 40-60 48-68 58-78No. 8 (2.36) 22-42 26-46 33-53 39-59
No. 16 (1.18) 13-33 17-37 20-40 26-46No. 30 (0.600) 8-24 11-27 14-30 19-35No. 50 (0.300) 6-18 7-19 9-21 12-24
No. 100 (0.150) 4-12 6-16 6-16 7-17No. 200 (0.075) 3-6 3-6 3-6 3-6
Table 8: UFGS-32 12 15 Gradation Requirements
Gradation 1 Gradation 2 Gradation 3
Sieve Size, inch (mm)Percent Passing
by MassPercent Passing
by MassPercent Passing
by Mass1 (25.0) 100 --- ---¾ (19.0) 76-96 100 ---½ (12.5) 68-88 76-96 1003/8 (9.5) 60-82 69-89 76-96
No. 4 (4.75) 45-67 53-73 58-78No. 8 (2.36) 32-54 38-60 40-60
No. 16 (1.18) 22-44 26-48 28-48No. 30 (0.6) 15-35 18-38 18-38No. 50 (0.3) 9-25 11-27 11-27
No. 100 (0.15) 6-18 6-18 6-18No. 200(0.075) 3-6 3-6 3-6
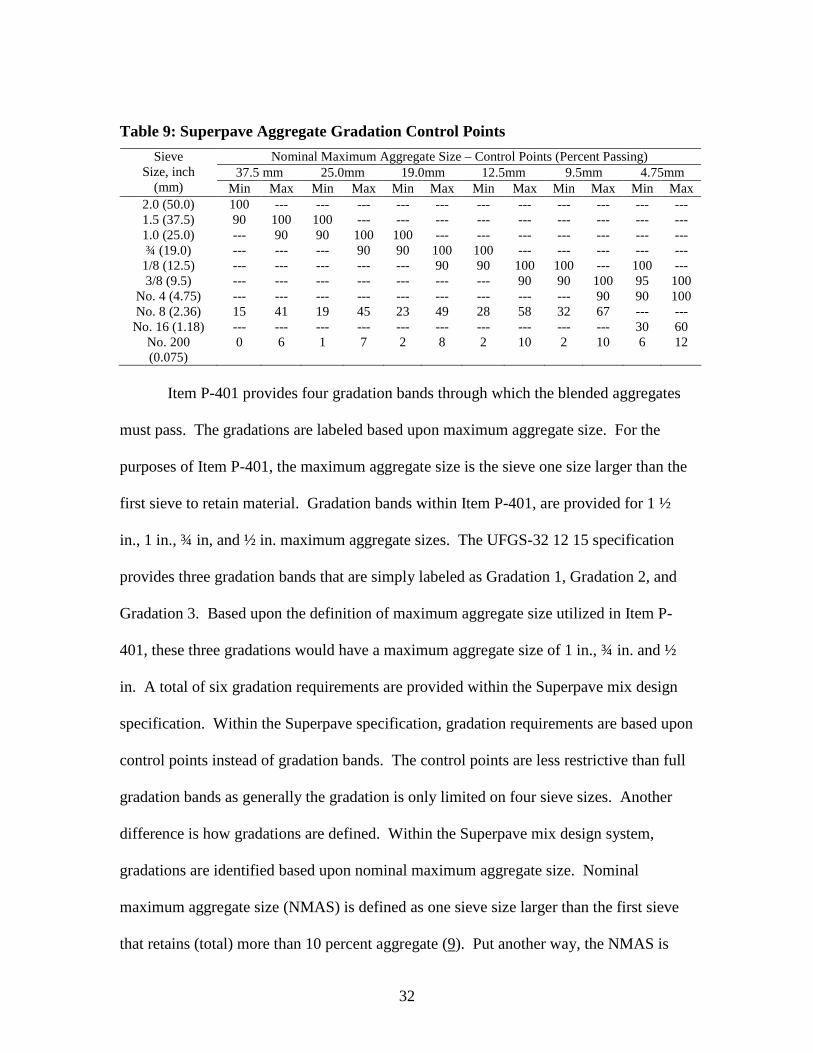
32
Table 9: Superpave Aggregate Gradation Control Points
Nominal Maximum Aggregate Size – Control Points (Percent Passing)37.5 mm 25.0mm 19.0mm 12.5mm 9.5mm 4.75mm
SieveSize, inch
(mm) Min Max Min Max Min Max Min Max Min Max Min Max2.0 (50.0) 100 --- --- --- --- --- --- --- --- --- --- ---1.5 (37.5) 90 100 100 --- --- --- --- --- --- --- --- ---1.0 (25.0) --- 90 90 100 100 --- --- --- --- --- --- ---¾ (19.0) --- --- --- 90 90 100 100 --- --- --- --- ---
1/8 (12.5) --- --- --- --- --- 90 90 100 100 --- 100 ---3/8 (9.5) --- --- --- --- --- --- --- 90 90 100 95 100
No. 4 (4.75) --- --- --- --- --- --- --- --- --- 90 90 100No. 8 (2.36) 15 41 19 45 23 49 28 58 32 67 --- ---
No. 16 (1.18) --- --- --- --- --- --- --- --- --- --- 30 60No. 200(0.075)
0 6 1 7 2 8 2 10 2 10 6 12
Item P-401 provides four gradation bands through which the blended aggregates
must pass. The gradations are labeled based upon maximum aggregate size. For the
purposes of Item P-401, the maximum aggregate size is the sieve one size larger than the
first sieve to retain material. Gradation bands within Item P-401, are provided for 1 ½
in., 1 in., ¾ in, and ½ in. maximum aggregate sizes. The UFGS-32 12 15 specification
provides three gradation bands that are simply labeled as Gradation 1, Gradation 2, and
Gradation 3. Based upon the definition of maximum aggregate size utilized in Item P-
401, these three gradations would have a maximum aggregate size of 1 in., ¾ in. and ½
in. A total of six gradation requirements are provided within the Superpave mix design
specification. Within the Superpave specification, gradation requirements are based upon
control points instead of gradation bands. The control points are less restrictive than full
gradation bands as generally the gradation is only limited on four sieve sizes. Another
difference is how gradations are defined. Within the Superpave mix design system,
gradations are identified based upon nominal maximum aggregate size. Nominal
maximum aggregate size (NMAS) is defined as one sieve size larger than the first sieve
that retains (total) more than 10 percent aggregate (9). Put another way, the NMAS is

33
one sieve size larger than the first sieve that has less than 90 percent of the blend passing.
The maximum aggregate size is simply one sieve size larger than the NMAS.
As shown in Tables 7 through 9, all three mix design specifications utilize the
same sieve sizes to characterize a gradation. Table 10 presents the standard sieve sizes
utilized in all three specifications.
Table 10: Standard Sieve SizesSieve Size, mm Sieve Size, US Standard
50.0 2 in.37.5 1 ½ in.25.0 1 in.19.0 ¾ in.12.5 ½ in.9.5 3/8 in.
4.75 No. 42.36 No. 81.18 No. 160.60 No. 300.30 No. 50
0.150 No. 1000.075 No. 200
Figures 1 through 6 compare the gradation requirements included within the three
mix design specifications. These figures present the gradations on a 0.45 power chart.
The Superpave specification is the only one to have gradation requirements for a 2 in. (50
mm) maximum aggregate size (37.5 mm NMAS) (Figure 1). Both Item P-401 and
Superpave have requirements for a 1 ½ in. (37.5 mm) maximum aggregate size gradation
(25.0mm NMAS) (Figure 2). As shown on Figure 2, the gradation requirements are very
similar on the No.8 (2.36 mm) sieve. However, because the Superpave requirements do
not have control points between the 1 in. (25.0 mm) and No. 8 (2.36 mm) sieves, the
Superpave gradation requirements are much less restrictive than Item P-401.
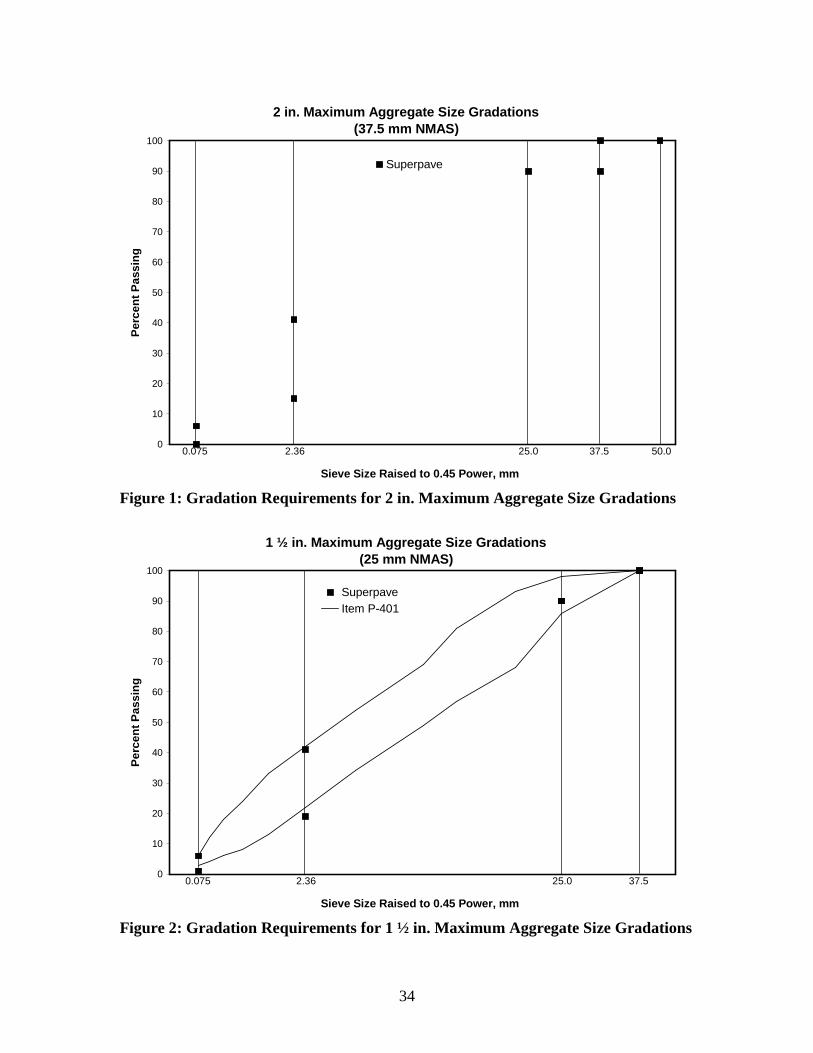
34
2 in. Maximum Aggregate Size Gradations(37.5 mm NMAS)
0
10
20
30
40
50
60
70
80
90
100
Sieve Size Raised to 0.45 Power, mm
Pe
rce
nt
Pa
ss
ing
Superpave
0.075 2.36 37.5 50.025.0
Figure 1: Gradation Requirements for 2 in. Maximum Aggregate Size Gradations
1 ½ in. Maximum Aggregate Size Gradations(25 mm NMAS)
0
10
20
30
40
50
60
70
80
90
100
Sieve Size Raised to 0.45 Power, mm
Pe
rce
nt
Pa
ss
ing
Superpave
Item P-401
0.075 2.36 37.525.0
Figure 2: Gradation Requirements for 1 ½ in. Maximum Aggregate Size Gradations
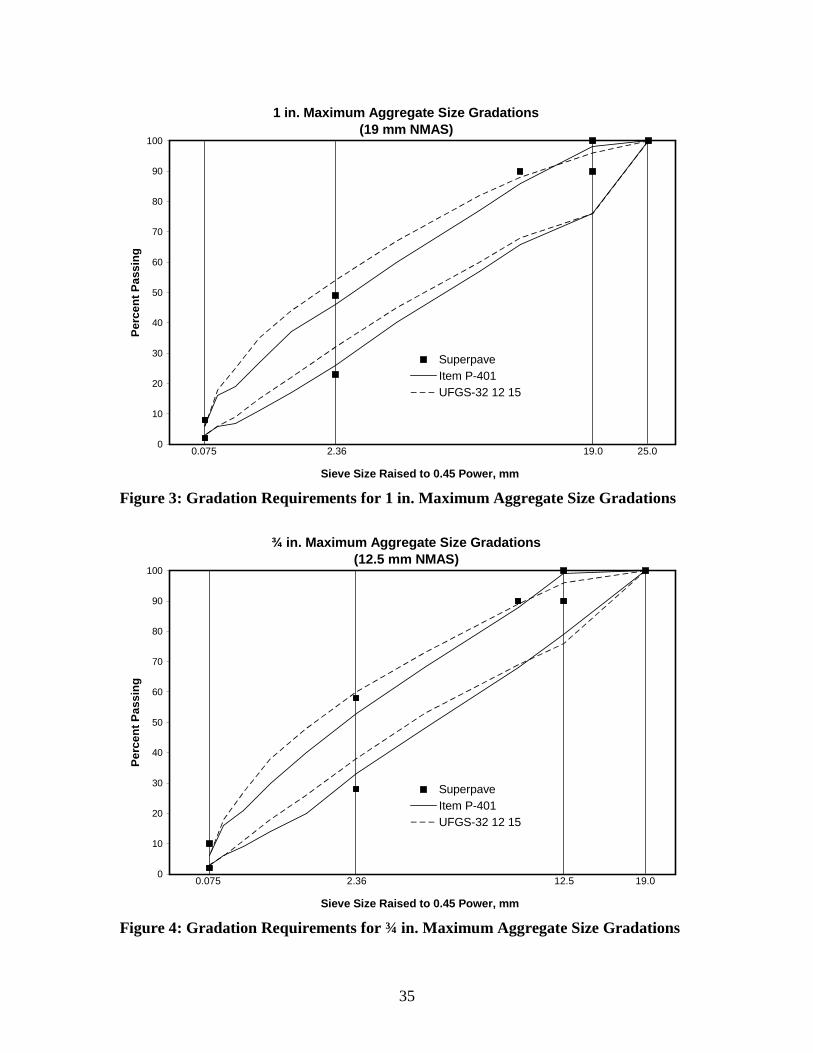
35
1 in. Maximum Aggregate Size Gradations(19 mm NMAS)
0
10
20
30
40
50
60
70
80
90
100
Sieve Size Raised to 0.45 Power, mm
Pe
rce
nt
Pa
ss
ing
Superpave
Item P-401
UFGS-32 12 15
0.075 2.36 25.019.0
Figure 3: Gradation Requirements for 1 in. Maximum Aggregate Size Gradations
¾ in. Maximum Aggregate Size Gradations(12.5 mm NMAS)
0
10
20
30
40
50
60
70
80
90
100
Sieve Size Raised to 0.45 Power, mm
Pe
rce
nt
Pa
ss
ing
Superpave
Item P-401
UFGS-32 12 15
0.075 2.36 19.012.5
Figure 4: Gradation Requirements for ¾ in. Maximum Aggregate Size Gradations
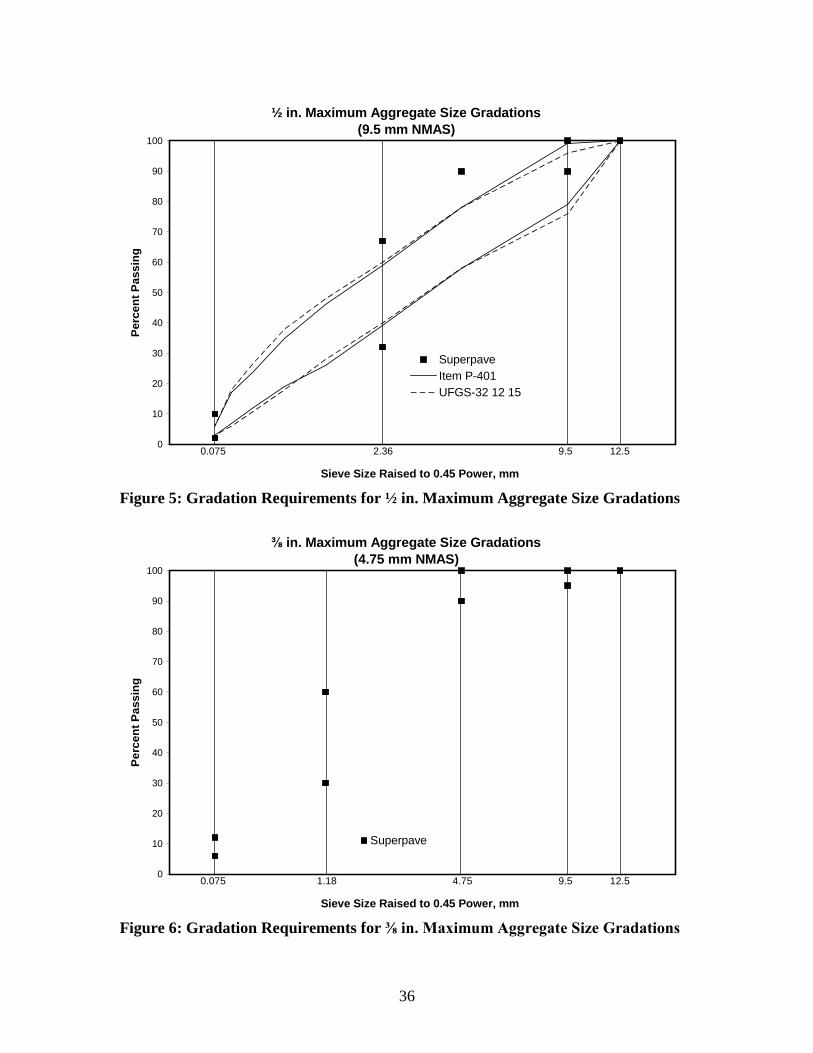
36
½ in. Maximum Aggregate Size Gradations(9.5 mm NMAS)
0
10
20
30
40
50
60
70
80
90
100
Sieve Size Raised to 0.45 Power, mm
Pe
rce
nt
Pa
ss
ing
Superpave
Item P-401
UFGS-32 12 15
0.075 2.36 12.59.5
Figure 5: Gradation Requirements for ½ in. Maximum Aggregate Size Gradations
⅜ in. Maximum Aggregate Size Gradations(4.75 mm NMAS)
0
10
20
30
40
50
60
70
80
90
100
Sieve Size Raised to 0.45 Power, mm
Pe
rce
nt
Pa
ss
ing
Superpave
0.075 1.18 12.59.54.75
Figure 6: Gradation Requirements for ⅜ in. Maximum Aggregate Size Gradations
37
Figure 3 presents a comparison of gradation requirements between all three mix
design specifications for a 1 in. maximum aggregate size gradation (19.0 mm NMAS).
Of the three specifications, the UFGS-32 12 15 specification allows the finest gradation,
while the Superpave specification allows the coarsest. The Item P-401 gradation band
resides totally within the Superpave control points on the No. 8 (2.36 mm) sieve. The
UFGS-32 12 15 gradation band is above the Superpave upper control point on the No. 8
(2.36 mm) sieve signifying the allowance of finer gradations. As for the lower Superpave
control point, the UFGS-32 12 15 gradation band is 9 percent finer than the Superpave
specification and 5 percent finer than the Item P-401 specification. Both the Item P-401
and UFGS-32 12 15 have a range of 3 to 6 percent passing the No. 200 (0.075 mm) sieve,
while the range within the Superpave specification is 2 to 8 percent.
Gradation requirements for ¾ in. maximum aggregate gradations (12.5 mm
NMAS) are illustrated in Figure 4. Similar to the 1 in. maximum aggregate size
gradation requirements, UFGS-32 12 15 allows the finest gradation and Superpave allows
the coarsest. The Item P-401 gradation band is totally included within the Superpave
control points on the No. 8 sieve. The UFGS-32 12 15 lower limit on the No. 8 sieve is
10 percent finer than the Superpave lower control point and Item P-401 is 5 percent finer
than the Superpave lower control point. Again, both Item P-401 and UFGS-32 12 15
have an allowable range of 3 to 6 percent passing on the No. 200 sieve while the
Superpave control points allow 2 to 10 percent.
Figure 5 presents the gradation requirements from the three mix design
specifications for ½ in. maximum aggregate size (9.5mm NMAS) gradations. Unlike the
two previous gradations, Item P-401 and UFGS-32 12 15 reside totally within the
38
Superpave control points on the No. 8 sieve. Therefore, HMA designed in accordance
with the Superpave specifications for a ½ in. maximum aggregate size can be either finer
or coarser than the two historical airfield specifications. Similar to other gradation sizes,
Item P-401 and UFGS-32 12 15 are more restrictive on the percentage of material passing
the No. 200 sieve with a range of 3 to 6 percent. The Superpave specification for ½ in.
maximum aggregate size gradation on the No. 200 sieve is a range of 2 to 10 percent.
The Superpave specification is the only one of the three that includes gradation
requirements for a 3/8 in. maximum aggregate size (4.75mm NMAS). Figure 6 illustrates
the control points for a 3/8 in. maximum aggregate size gradation.
Summary of Gradation Requirements
The Superpave mix design specification provides the most potential gradation
sizes with six. Item P-401 provides requirements for four gradation sizes, while UFGS-
32 12 15 provides three gradation bands. Where comparisons can be made, the UFGS-32
12 15 gradation requirements generally allow the finest gradations on the No. 8 sieve,
while the Superpave specifications always allow the coarsest gradations. The two
historical airfield specifications are much more restrictive in the potential gradations that
can be blended than Superpave. By using relatively few control points, the Superpave
gradation requirements are much less restrictive, especially for larger maximum
aggregate size gradations.
39
Select Appropriate Optimum Asphalt Binder Content
Once appropriate materials have been selected and the aggregates blended to meet
the desired gradation, all three mix design specifications involve adding asphalt binder to
the aggregates and performing laboratory compaction in order to evaluate the mixture’s
volumetric properties. The primary difference between the mix design specifications is
the method of laboratory compaction. Item P-401 and UFGS-32 12 15 both specify the
use of the Marshall hammer in accordance with Chapter 5 of the Asphalt Institute’s MS-
2, “Mix Design Methods For Asphalt Concrete and Other Hot Mix Types” (13). The
Superpave mix design specifications require the use of the Superpave gyratory compactor
(SGC) for the laboratory compaction of HMA during design.
The compactive effort utilized in all three mix design specifications is controlled
by the anticipated loadings on the pavement. Within Item P-401, the design compactive
effort is based upon the design aircraft gross weight and/or tire pressure. For design
aircraft over 60,000 lbs or landing gear tire pressures of more than 100 psi, a design
laboratory compactive effort of 75 blows per face of the Marshall hammer is used.
Pavements designed for aircraft less than 60,000 lbs or tire pressures less than 100 psi are
designed using 50 blows per face. Within UFGS-32 12 15, the design laboratory
compactive effort is based upon landing gear tire pressure and location on the airfield.
Similar to Item P-401, the HMA used on pavements designed for aircraft having tire
pressures greater than 100 psi are to be designed using 75 blows per face of the Marshall
hammer. Pavements designed for aircraft having tire pressures less than 100 psi are to be
designed using 50 blows per face. UFGS-32 12 15 provides a stipulation that HMA used
on shoulders should be designed using 50 blows per face.
40
The design compactive effort within the Superpave mix design specification is
also based upon expected loadings. Within Superpave, the design compactive effort is
defined as the design number of gyrations (Ndesign) in the SGC. Pavements designed for
heavier or more loadings are designed using more gyrations. Currently, there are four
design gyrations levels within Superpave 50, 75, 100 and 125 gyrations. The lowest, 50
gyrations, is generally specified for low volume pavements, while the highest, 125
gyrations, is generally specified for pavements with a very high volume of heavy
loadings.
As stated previously, all three specifications include volumetrics in the selection
of the optimum asphalt binder content. Volumetric properties, such as voids in total mix
(VTM, generally called air voids), voids in mineral aggregate (VMA), and voids filled
with asphalt (VFA) are all included within the three specifications. Samples of HMA are
compacted using the design compactive effort at varying asphalt binder contents. The
volumetric properties of each sample are then determined and compared to specification
limits. This is true for all three mix design specifications.
An added feature to the mix design process, when using the Marshall hammer, is
the measurement of Marshall stability and flow. These two tests are utilized as proof
tests on the designed mix. Both Item P-401 and UFGS-32 12 15 include a minimum
value of Marshall stability and a range of allowable flow values.
Marshall Mix Design Method
In order to select optimum asphalt binder content using the Marshall method of
mix design, the relationships between asphalt binder content and air voids, VMA, VFA
41
and stability are developed. The next step is to select an asphalt binder content that meets
all requirements, similar to Figure 7. Though Item P-401 and UFGS-32 12 15 both
utilize the Marshall mix design method, the specified criteria within these two
specifications are slightly different. Tables 11 and 12 present the mix design criteria for
Item P-401 and UFGS-32 12 15, respectively. The primary differences between these
two specifications are the design air void range and the allowable range in flow values.
Item P-401 allows optimum asphalt binder contents to be selected between 2.8 and 4.2
percent air voids, while the UFGS-32 12 15 specification has a range of 3 to 5 percent air
voids for selection of optimum asphalt binder content. Requirements for flow values
within Item P-401 range from 10 to 14 while within UFGS-32 12 15 the allowable range
is 8 to 16.
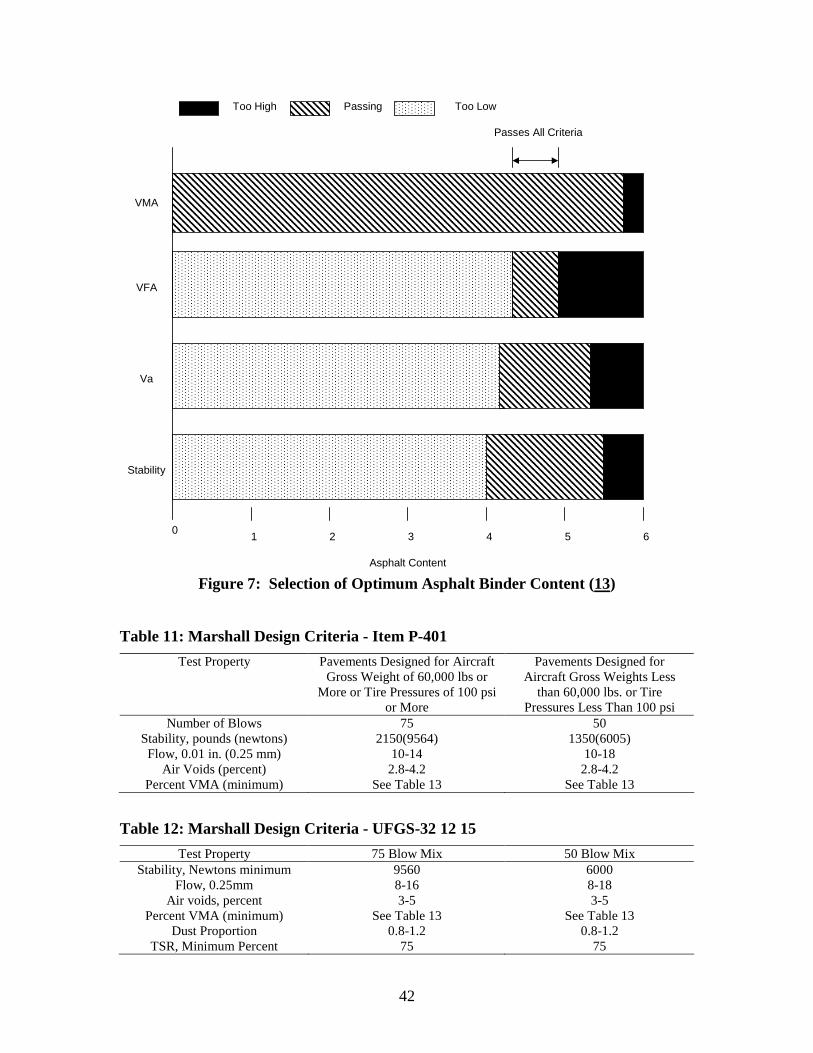
42
Too High Passing Too Low
0654321
Asphalt Content
Passes All Criteria
VMA
VFA
Va
Stability
Figure 7: Selection of Optimum Asphalt Binder Content (13)
Table 11: Marshall Design Criteria - Item P-401
Test Property Pavements Designed for AircraftGross Weight of 60,000 lbs or
More or Tire Pressures of 100 psior More
Pavements Designed forAircraft Gross Weights Less
than 60,000 lbs. or TirePressures Less Than 100 psi
Number of Blows 75 50Stability, pounds (newtons) 2150(9564) 1350(6005)Flow, 0.01 in. (0.25 mm) 10-14 10-18
Air Voids (percent) 2.8-4.2 2.8-4.2Percent VMA (minimum) See Table 13 See Table 13
Table 12: Marshall Design Criteria - UFGS-32 12 15
Test Property 75 Blow Mix 50 Blow MixStability, Newtons minimum 9560 6000
Flow, 0.25mm 8-16 8-18Air voids, percent 3-5 3-5
Percent VMA (minimum) See Table 13 See Table 13Dust Proportion 0.8-1.2 0.8-1.2
TSR, Minimum Percent 75 75
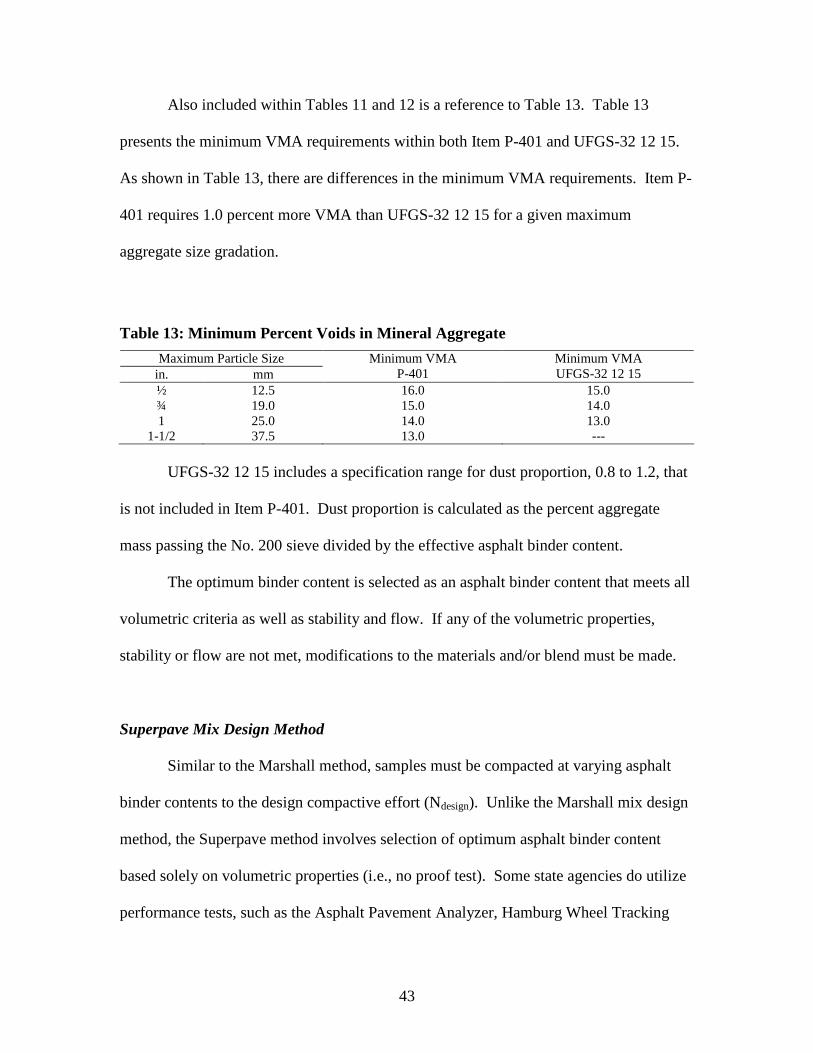
43
Also included within Tables 11 and 12 is a reference to Table 13. Table 13
presents the minimum VMA requirements within both Item P-401 and UFGS-32 12 15.
As shown in Table 13, there are differences in the minimum VMA requirements. Item P-
401 requires 1.0 percent more VMA than UFGS-32 12 15 for a given maximum
aggregate size gradation.
Table 13: Minimum Percent Voids in Mineral Aggregate
Maximum Particle Sizein. mm
Minimum VMAP-401
Minimum VMAUFGS-32 12 15
½ 12.5 16.0 15.0¾ 19.0 15.0 14.01 25.0 14.0 13.0
1-1/2 37.5 13.0 ---
UFGS-32 12 15 includes a specification range for dust proportion, 0.8 to 1.2, that
is not included in Item P-401. Dust proportion is calculated as the percent aggregate
mass passing the No. 200 sieve divided by the effective asphalt binder content.
The optimum binder content is selected as an asphalt binder content that meets all
volumetric criteria as well as stability and flow. If any of the volumetric properties,
stability or flow are not met, modifications to the materials and/or blend must be made.
Superpave Mix Design Method
Similar to the Marshall method, samples must be compacted at varying asphalt
binder contents to the design compactive effort (Ndesign). Unlike the Marshall mix design
method, the Superpave method involves selection of optimum asphalt binder content
based solely on volumetric properties (i.e., no proof test). Some state agencies do utilize
performance tests, such as the Asphalt Pavement Analyzer, Hamburg Wheel Tracking
44
Device, etc., as a proof test; however, there is currently no national standard method of
test utilized as a proof test.
Volumetric properties included within the evaluation include air voids, VMA and
VFA just as in the Marshall method (Table 14). Dust proportion is also included, similar
to UFGS-32 12 15. However, there are two volumetric properties included in the
Superpave mix design method that are not included in the Marshall method: percent
theoretical maximum density at the initial number of gyrations (%Gmm@Ninitial) and
percent theoretical maximum density at the maximum number of gyrations
(%Gmm@Nmaximum). Unlike the impact of the Marshall hammer, the SGC kneads the
HMA during compaction. During this kneading compaction, the SGC records the height
of HMA after every gyration. This allows for the evaluation of the HMA at various
gyration levels. Requirements for Ninitial are included within Superpave in an effort to
prevent tender HMA mixes during construction. High values of %Gmm@Ninitial indicate a
mixture that compacts readily. Requirements for Nmaximum are provided to identify HMA
mixes that may continue to compact over time resulting in a rut prone mixture.
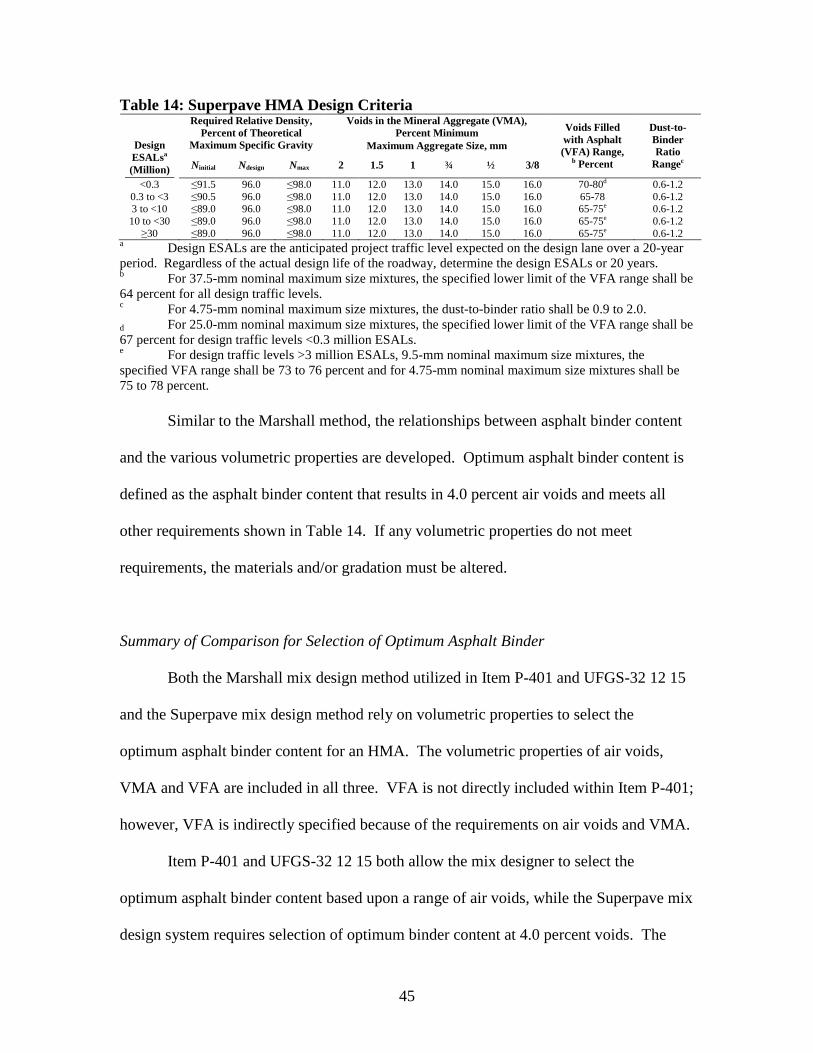
45
Table 14: Superpave HMA Design CriteriaVoids in the Mineral Aggregate (VMA),
Percent MinimumRequired Relative Density,
Percent of TheoreticalMaximum Specific Gravity Maximum Aggregate Size, mmDesign
ESALsa
(Million) Ninitial Ndesign Nmax 2 1.5 1 ¾ ½ 3/8
Voids Filledwith Asphalt(VFA) Range,
b Percent
Dust-to-BinderRatio
Rangec
<0.3 ≤91.5 96.0 ≤98.0 11.0 12.0 13.0 14.0 15.0 16.0 70-80d 0.6-1.20.3 to <3 ≤90.5 96.0 ≤98.0 11.0 12.0 13.0 14.0 15.0 16.0 65-78 0.6-1.23 to <10 ≤89.0 96.0 ≤98.0 11.0 12.0 13.0 14.0 15.0 16.0 65-75e 0.6-1.210 to <30 ≤89.0 96.0 ≤98.0 11.0 12.0 13.0 14.0 15.0 16.0 65-75e 0.6-1.2
≥30 ≤89.0 96.0 ≤98.0 11.0 12.0 13.0 14.0 15.0 16.0 65-75e 0.6-1.2a Design ESALs are the anticipated project traffic level expected on the design lane over a 20-yearperiod. Regardless of the actual design life of the roadway, determine the design ESALs or 20 years.b For 37.5-mm nominal maximum size mixtures, the specified lower limit of the VFA range shall be64 percent for all design traffic levels.c For 4.75-mm nominal maximum size mixtures, the dust-to-binder ratio shall be 0.9 to 2.0.
d For 25.0-mm nominal maximum size mixtures, the specified lower limit of the VFA range shall be67 percent for design traffic levels <0.3 million ESALs.e For design traffic levels >3 million ESALs, 9.5-mm nominal maximum size mixtures, thespecified VFA range shall be 73 to 76 percent and for 4.75-mm nominal maximum size mixtures shall be75 to 78 percent.
Similar to the Marshall method, the relationships between asphalt binder content
and the various volumetric properties are developed. Optimum asphalt binder content is
defined as the asphalt binder content that results in 4.0 percent air voids and meets all
other requirements shown in Table 14. If any volumetric properties do not meet
requirements, the materials and/or gradation must be altered.
Summary of Comparison for Selection of Optimum Asphalt Binder
Both the Marshall mix design method utilized in Item P-401 and UFGS-32 12 15
and the Superpave mix design method rely on volumetric properties to select the
optimum asphalt binder content for an HMA. The volumetric properties of air voids,
VMA and VFA are included in all three. VFA is not directly included within Item P-401;
however, VFA is indirectly specified because of the requirements on air voids and VMA.
Item P-401 and UFGS-32 12 15 both allow the mix designer to select the
optimum asphalt binder content based upon a range of air voids, while the Superpave mix
design system requires selection of optimum binder content at 4.0 percent voids. The
46
biggest difference in selecting optimum binder content probably is the method of
compaction. Item P-401 and UFGS-32 12 15 specify the Marshall hammer which
compacts the HMA through impact. The Superpave mix design system specifies a
Superpave gyratory compactor which compacts the HMA through kneading. An added
benefit of the SGC is that the compaction characteristics of the HMA can be evaluated.
This has resulted in two additional volumetric properties that are evaluated during
selection of optimum asphalt: %Gmm@Ninitial and %Gmm@Nmaximum. Another major
difference is that Item P-401 and UFGS-32 12 15 both utilize Marshall stability and flow
as a proof test. Currently, there is no proof test within Superpave.
Comparison of Moisture Susceptibility Requirements
The final step in all three mix design methods is to evaluate the designed mix for
moisture susceptibility. All three methods utilize tensile strength ratios to define
moisture susceptibility. Both Item P-401 and UFGS-32 12 15 specify ASTM D 4867,
“Effect of Moisture on Asphalt Concrete Paving Mixtures,” to indicate the potential for
moisture damage. Both also require a minimum tensile strength ratio of 75 percent. The
Superpave mix design specification requires the use of AASHTO T 283, “Resistance of
Compacted Asphalt Mixtures to Moisture-Induced Damage,” for measuring moisture
susceptibility. A minimum tensile strength ratio of 80 percent is required for Superpave
designs.
47
Summary of Critical Comparison
All three mix design specifications have many similarities. All include four
primary steps: selection of materials, blending of selected materials, selection of optimum
asphalt binder content and evaluation of moisture susceptibility. Each method has
aggregate property criteria to ensure angular and clean aggregates that are properly
shaped. All three specifications also ensure tough and durable aggregates; though, local
agencies specify appropriate toughness and durability criteria within Superpave source
properties. With respect to asphalt binders, all three allow the use of Performance
Graded asphalt binders.
There are minor differences in how the aggregates can be blended. The
Superpave gradation requirements allow for the most gradation options (maximum
aggregate sizes). For a given maximum aggregate size gradation, use of the Superpave
control points also allows for the most gradation shapes. The two historical airfield
specifications are more restrictive because of the use of gradation bands. The UFGS-32
12 15 specification generally allows the finest gradations, while the Superpave
specification allows the coarsest.
The biggest difference in designing HMA is that the two historical airfield
specifications require laboratory compaction with the Marshall hammer, while the
Superpave specification requires the Superpave gyratory compactor. These two methods
of laboratory compaction are very different. Another difference is that the two airfield
specifications utilize Marshall stability and flow as a proof test during mix design.
Superpave does not currently include a proof test. When selecting the optimum binder
content all three methods are similar in that volumetrics are used. Air voids, VMA and
48
VFA are all directly or indirectly specified. There are slight differences in the specified
volumetric requirements; the biggest of which is the use of a range in design air voids
within the Marshall methods.
With respect to moisture susceptibility, all three methods utilize tensile strength
ratios to provide a measure of moisture damage potential. The methods specified have
slight differences, but the underlying test method is the same. Specification values only
differ slightly.
In summary, the three mix design specifications have many similarities. Without
question, the goal of each mix design method is to produce an HMA that is stable and
durable for its intended purpose. The primary issues that must be addressed as part of
AAPTP 04-03 are the laboratory compactive effort, appropriate volumetric criteria for
selection of optimum binder content, appropriate gradation sizes and shapes for airfields,
method and criteria for evaluating moisture susceptibility and appropriate test method
and criteria for materials selection.
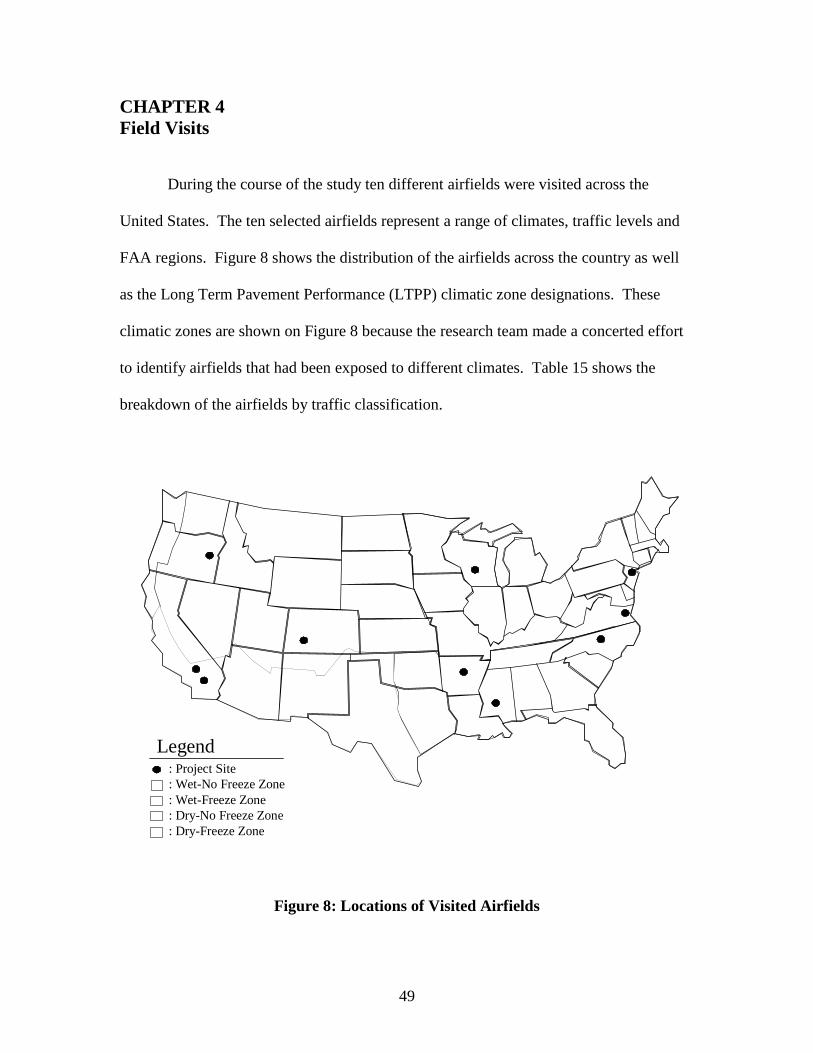
49
CHAPTER 4Field Visits
During the course of the study ten different airfields were visited across the
United States. The ten selected airfields represent a range of climates, traffic levels and
FAA regions. Figure 8 shows the distribution of the airfields across the country as well
as the Long Term Pavement Performance (LTPP) climatic zone designations. These
climatic zones are shown on Figure 8 because the research team made a concerted effort
to identify airfields that had been exposed to different climates. Table 15 shows the
breakdown of the airfields by traffic classification.
: Project Site: Wet-No Freeze Zone: Wet-Freeze Zone: Dry-No Freeze Zone: Dry-Freeze Zone
Legend
Figure 8: Locations of Visited Airfields
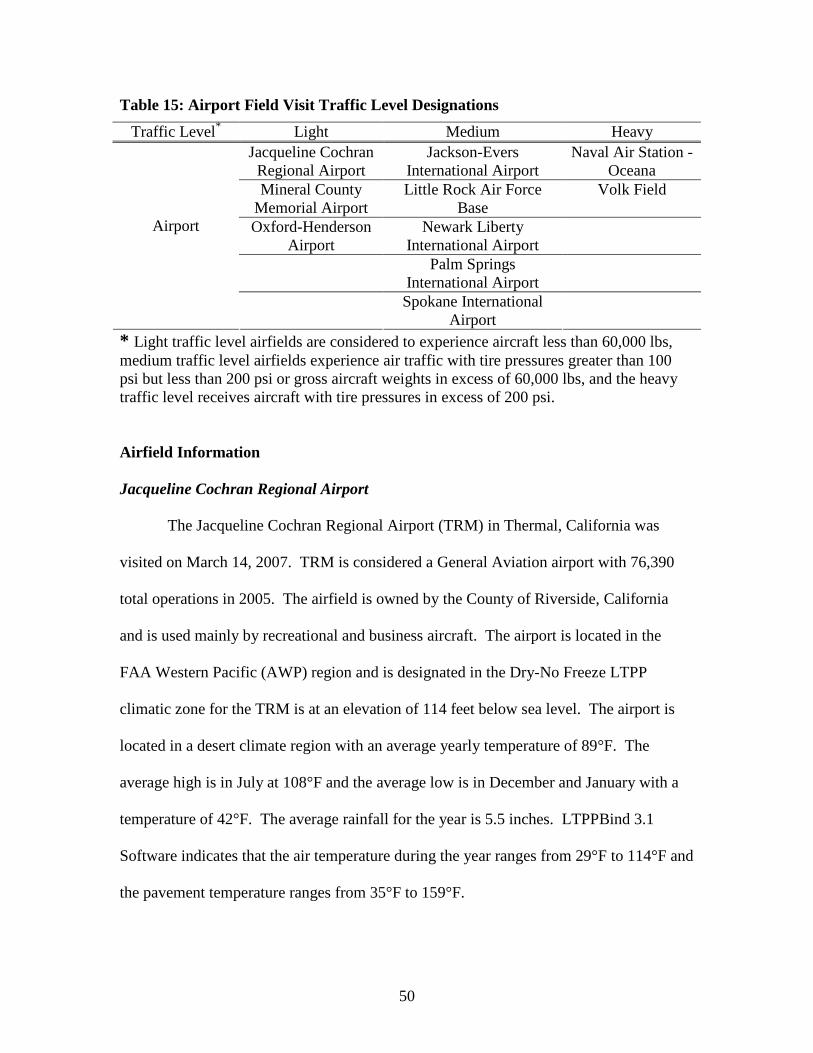
50
Table 15: Airport Field Visit Traffic Level Designations
Traffic Level* Light Medium Heavy
Jacqueline CochranRegional Airport
Jackson-EversInternational Airport
Naval Air Station -Oceana
Mineral CountyMemorial Airport
Little Rock Air ForceBase
Volk Field
Oxford-HendersonAirport
Newark LibertyInternational Airport
Palm SpringsInternational Airport
Airport
Spokane InternationalAirport
* Light traffic level airfields are considered to experience aircraft less than 60,000 lbs,medium traffic level airfields experience air traffic with tire pressures greater than 100psi but less than 200 psi or gross aircraft weights in excess of 60,000 lbs, and the heavytraffic level receives aircraft with tire pressures in excess of 200 psi.
Airfield Information
Jacqueline Cochran Regional Airport
The Jacqueline Cochran Regional Airport (TRM) in Thermal, California was
visited on March 14, 2007. TRM is considered a General Aviation airport with 76,390
total operations in 2005. The airfield is owned by the County of Riverside, California
and is used mainly by recreational and business aircraft. The airport is located in the
FAA Western Pacific (AWP) region and is designated in the Dry-No Freeze LTPP
climatic zone for the TRM is at an elevation of 114 feet below sea level. The airport is
located in a desert climate region with an average yearly temperature of 89°F. The
average high is in July at 108°F and the average low is in December and January with a
temperature of 42°F. The average rainfall for the year is 5.5 inches. LTPPBind 3.1
Software indicates that the air temperature during the year ranges from 29°F to 114°F and
the pavement temperature ranges from 35°F to 159°F.
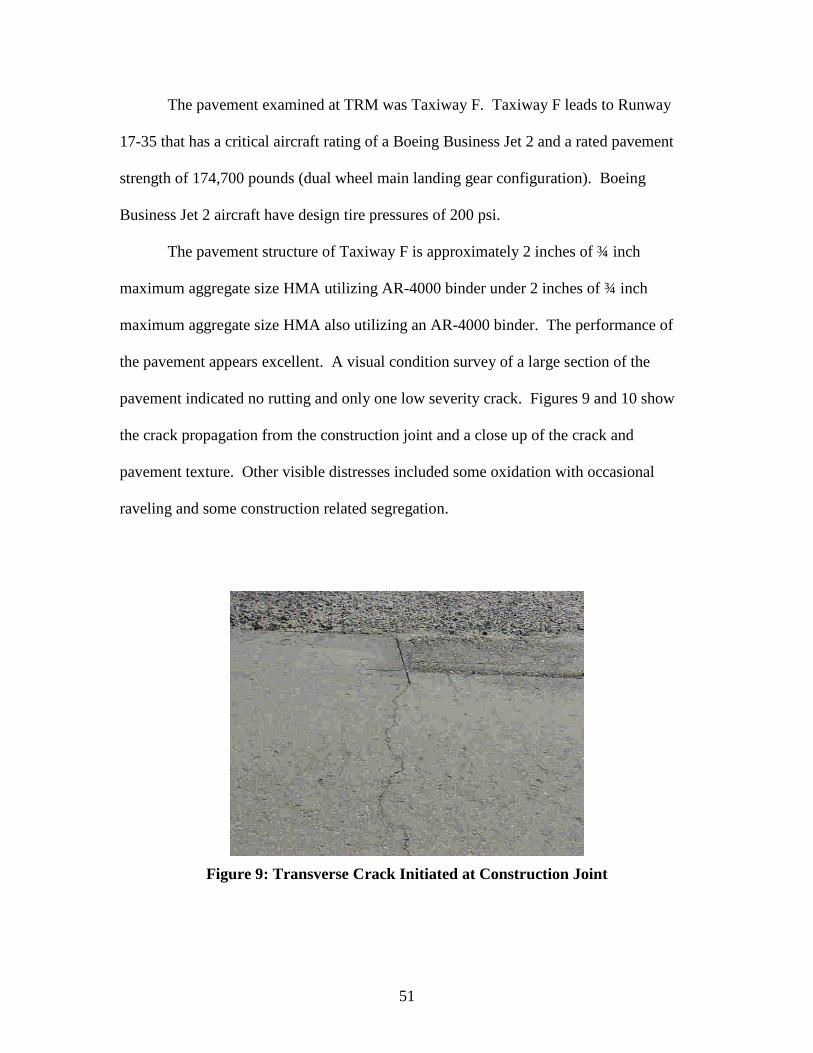
51
The pavement examined at TRM was Taxiway F. Taxiway F leads to Runway
17-35 that has a critical aircraft rating of a Boeing Business Jet 2 and a rated pavement
strength of 174,700 pounds (dual wheel main landing gear configuration). Boeing
Business Jet 2 aircraft have design tire pressures of 200 psi.
The pavement structure of Taxiway F is approximately 2 inches of ¾ inch
maximum aggregate size HMA utilizing AR-4000 binder under 2 inches of ¾ inch
maximum aggregate size HMA also utilizing an AR-4000 binder. The performance of
the pavement appears excellent. A visual condition survey of a large section of the
pavement indicated no rutting and only one low severity crack. Figures 9 and 10 show
the crack propagation from the construction joint and a close up of the crack and
pavement texture. Other visible distresses included some oxidation with occasional
raveling and some construction related segregation.
Figure 9: Transverse Crack Initiated at Construction Joint
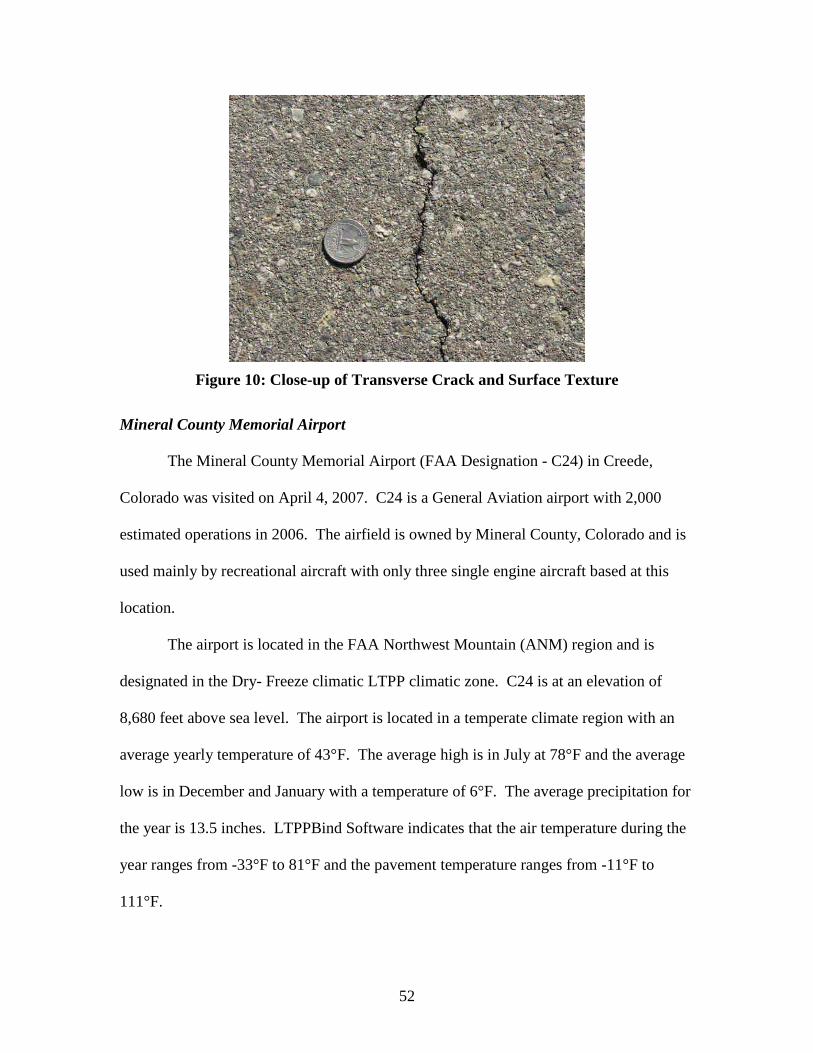
52
Figure 10: Close-up of Transverse Crack and Surface Texture
Mineral County Memorial Airport
The Mineral County Memorial Airport (FAA Designation - C24) in Creede,
Colorado was visited on April 4, 2007. C24 is a General Aviation airport with 2,000
estimated operations in 2006. The airfield is owned by Mineral County, Colorado and is
used mainly by recreational aircraft with only three single engine aircraft based at this
location.
The airport is located in the FAA Northwest Mountain (ANM) region and is
designated in the Dry- Freeze climatic LTPP climatic zone. C24 is at an elevation of
8,680 feet above sea level. The airport is located in a temperate climate region with an
average yearly temperature of 43°F. The average high is in July at 78°F and the average
low is in December and January with a temperature of 6°F. The average precipitation for
the year is 13.5 inches. LTPPBind Software indicates that the air temperature during the
year ranges from -33°F to 81°F and the pavement temperature ranges from -11°F to
111°F.
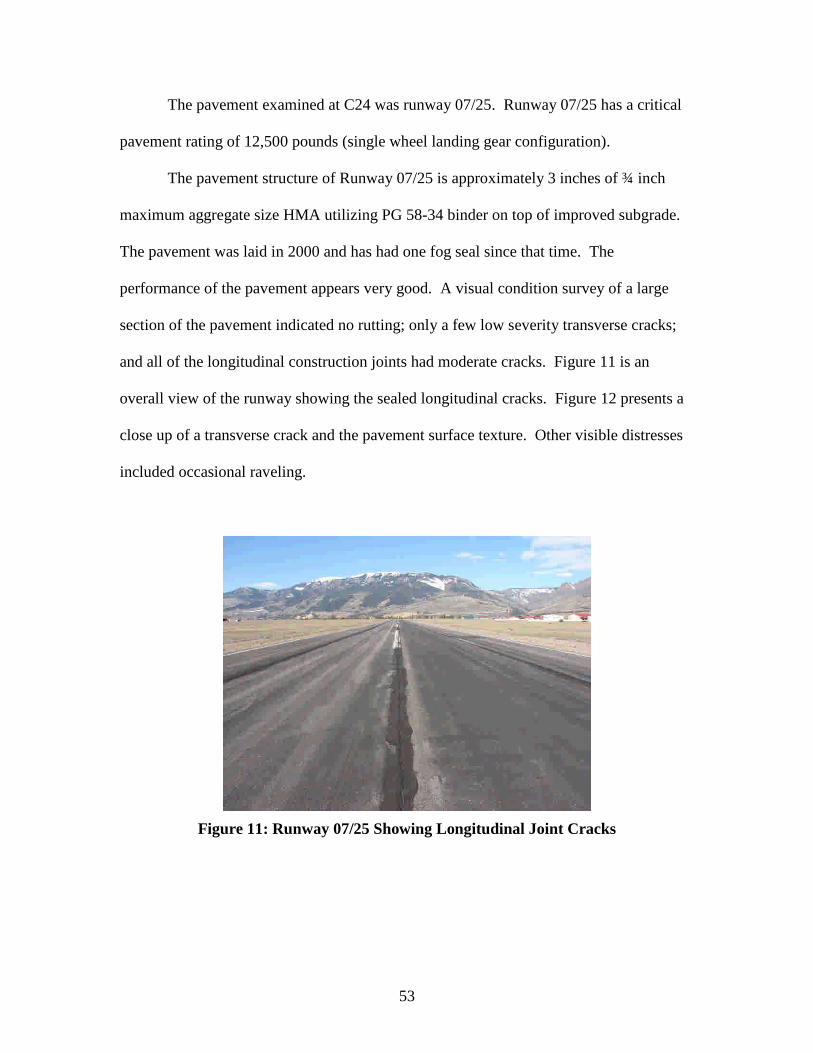
53
The pavement examined at C24 was runway 07/25. Runway 07/25 has a critical
pavement rating of 12,500 pounds (single wheel landing gear configuration).
The pavement structure of Runway 07/25 is approximately 3 inches of ¾ inch
maximum aggregate size HMA utilizing PG 58-34 binder on top of improved subgrade.
The pavement was laid in 2000 and has had one fog seal since that time. The
performance of the pavement appears very good. A visual condition survey of a large
section of the pavement indicated no rutting; only a few low severity transverse cracks;
and all of the longitudinal construction joints had moderate cracks. Figure 11 is an
overall view of the runway showing the sealed longitudinal cracks. Figure 12 presents a
close up of a transverse crack and the pavement surface texture. Other visible distresses
included occasional raveling.
Figure 11: Runway 07/25 Showing Longitudinal Joint Cracks
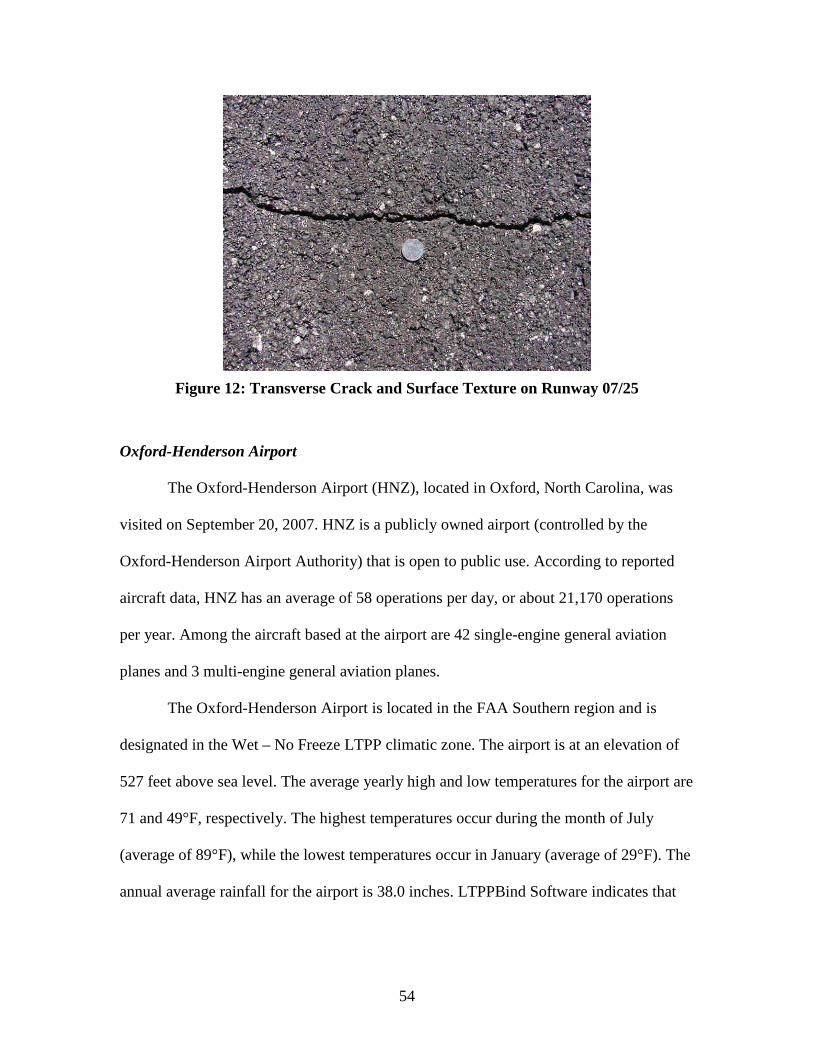
54
Figure 12: Transverse Crack and Surface Texture on Runway 07/25
Oxford-Henderson Airport
The Oxford-Henderson Airport (HNZ), located in Oxford, North Carolina, was
visited on September 20, 2007. HNZ is a publicly owned airport (controlled by the
Oxford-Henderson Airport Authority) that is open to public use. According to reported
aircraft data, HNZ has an average of 58 operations per day, or about 21,170 operations
per year. Among the aircraft based at the airport are 42 single-engine general aviation
planes and 3 multi-engine general aviation planes.
The Oxford-Henderson Airport is located in the FAA Southern region and is
designated in the Wet – No Freeze LTPP climatic zone. The airport is at an elevation of
527 feet above sea level. The average yearly high and low temperatures for the airport are
71 and 49°F, respectively. The highest temperatures occur during the month of July
(average of 89°F), while the lowest temperatures occur in January (average of 29°F). The
annual average rainfall for the airport is 38.0 inches. LTPPBind Software indicates that
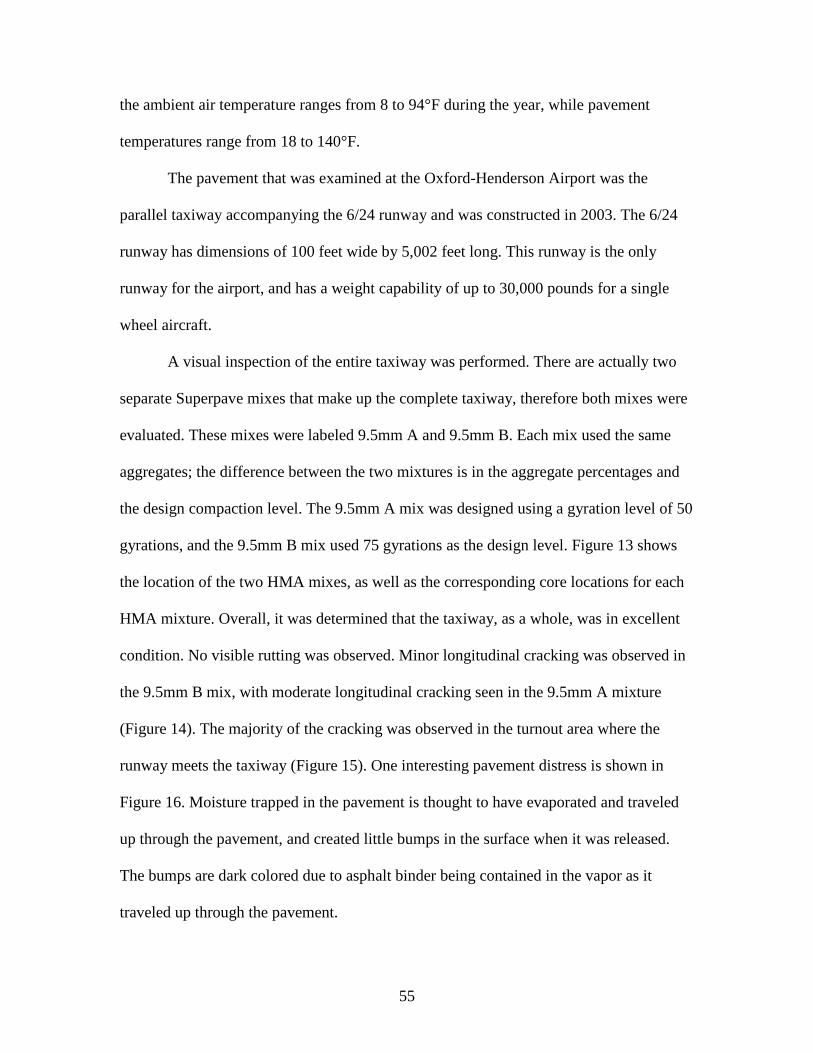
55
the ambient air temperature ranges from 8 to 94°F during the year, while pavement
temperatures range from 18 to 140°F.
The pavement that was examined at the Oxford-Henderson Airport was the
parallel taxiway accompanying the 6/24 runway and was constructed in 2003. The 6/24
runway has dimensions of 100 feet wide by 5,002 feet long. This runway is the only
runway for the airport, and has a weight capability of up to 30,000 pounds for a single
wheel aircraft.
A visual inspection of the entire taxiway was performed. There are actually two
separate Superpave mixes that make up the complete taxiway, therefore both mixes were
evaluated. These mixes were labeled 9.5mm A and 9.5mm B. Each mix used the same
aggregates; the difference between the two mixtures is in the aggregate percentages and
the design compaction level. The 9.5mm A mix was designed using a gyration level of 50
gyrations, and the 9.5mm B mix used 75 gyrations as the design level. Figure 13 shows
the location of the two HMA mixes, as well as the corresponding core locations for each
HMA mixture. Overall, it was determined that the taxiway, as a whole, was in excellent
condition. No visible rutting was observed. Minor longitudinal cracking was observed in
the 9.5mm B mix, with moderate longitudinal cracking seen in the 9.5mm A mixture
(Figure 14). The majority of the cracking was observed in the turnout area where the
runway meets the taxiway (Figure 15). One interesting pavement distress is shown in
Figure 16. Moisture trapped in the pavement is thought to have evaporated and traveled
up through the pavement, and created little bumps in the surface when it was released.
The bumps are dark colored due to asphalt binder being contained in the vapor as it
traveled up through the pavement.
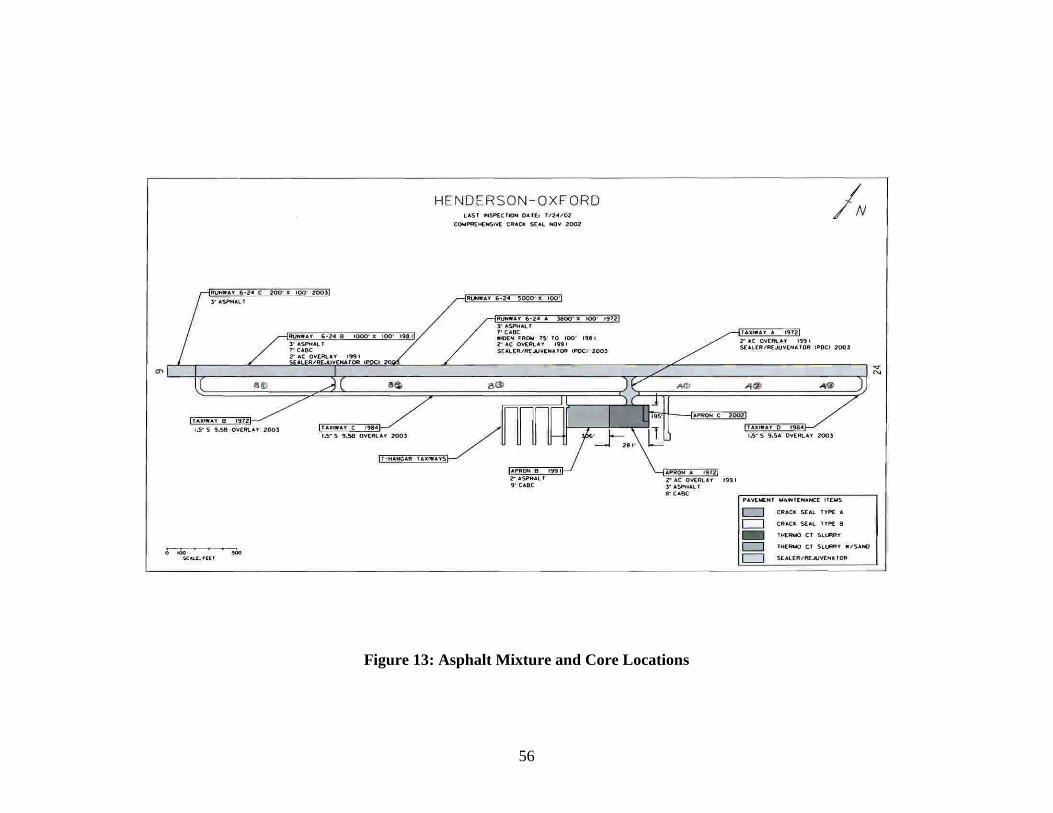
56
Figure 13: Asphalt Mixture and Core Locations
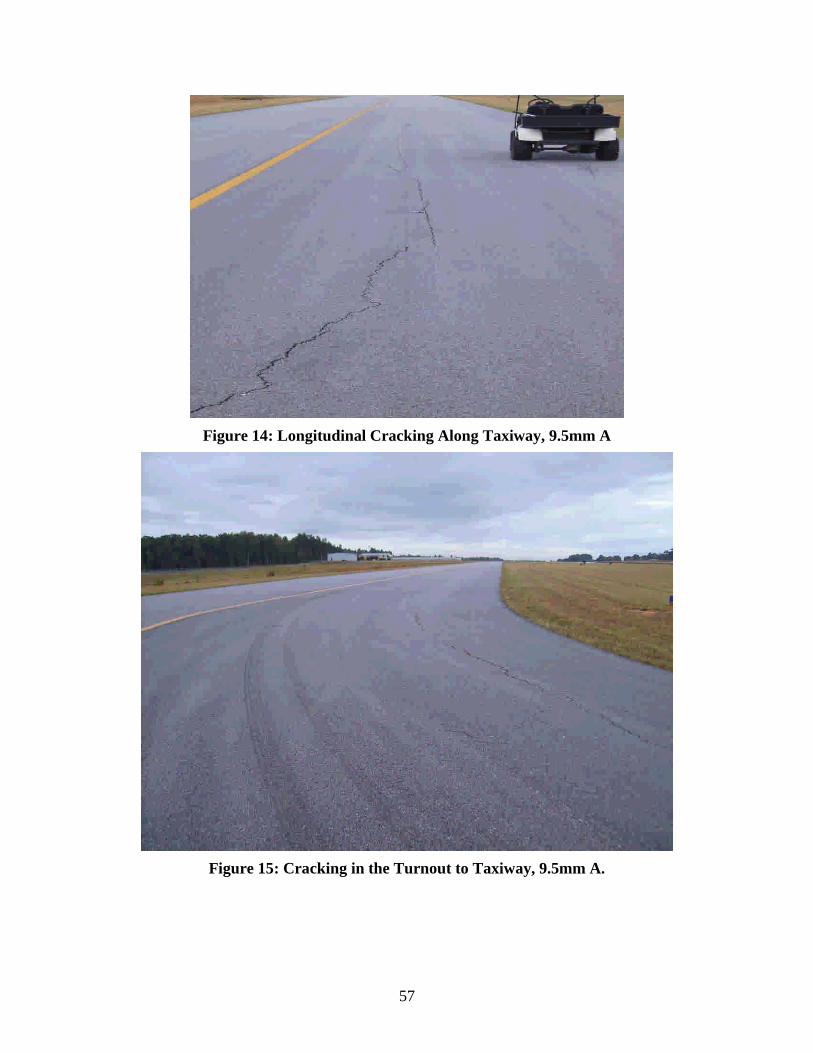
57
Figure 14: Longitudinal Cracking Along Taxiway, 9.5mm A
Figure 15: Cracking in the Turnout to Taxiway, 9.5mm A.
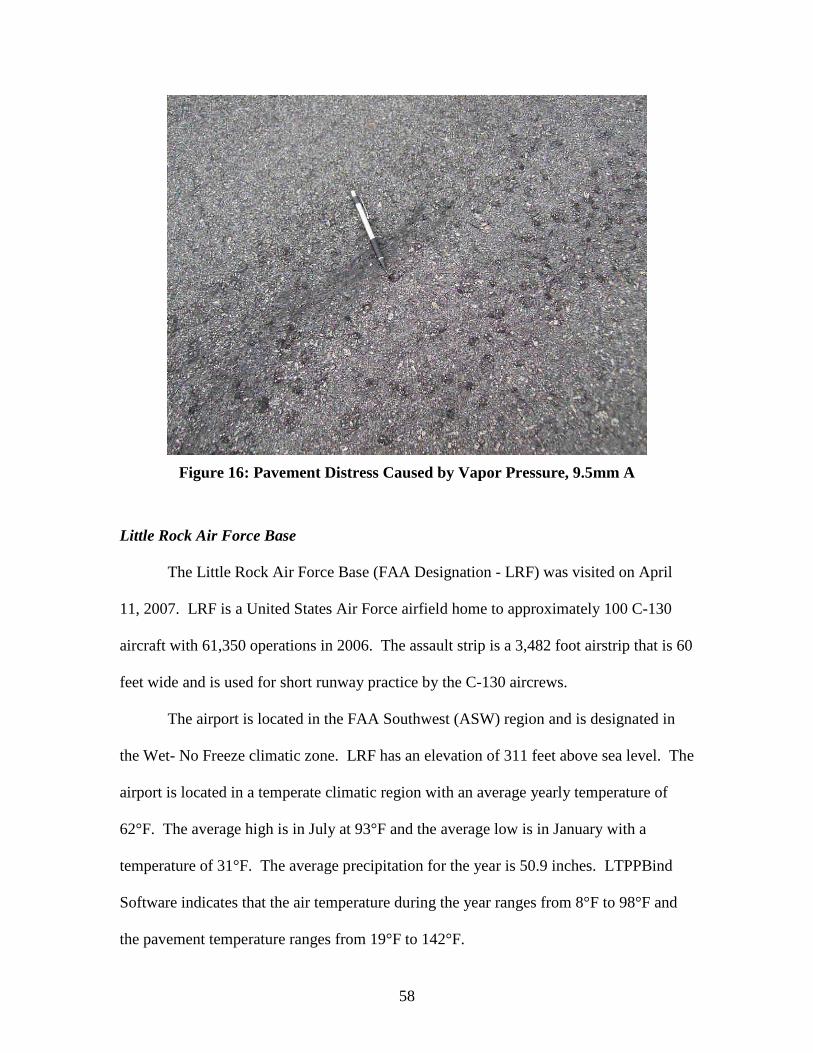
58
Figure 16: Pavement Distress Caused by Vapor Pressure, 9.5mm A
Little Rock Air Force Base
The Little Rock Air Force Base (FAA Designation - LRF) was visited on April
11, 2007. LRF is a United States Air Force airfield home to approximately 100 C-130
aircraft with 61,350 operations in 2006. The assault strip is a 3,482 foot airstrip that is 60
feet wide and is used for short runway practice by the C-130 aircrews.
The airport is located in the FAA Southwest (ASW) region and is designated in
the Wet- No Freeze climatic zone. LRF has an elevation of 311 feet above sea level. The
airport is located in a temperate climatic region with an average yearly temperature of
62°F. The average high is in July at 93°F and the average low is in January with a
temperature of 31°F. The average precipitation for the year is 50.9 inches. LTPPBind
Software indicates that the air temperature during the year ranges from 8°F to 98°F and
the pavement temperature ranges from 19°F to 142°F.
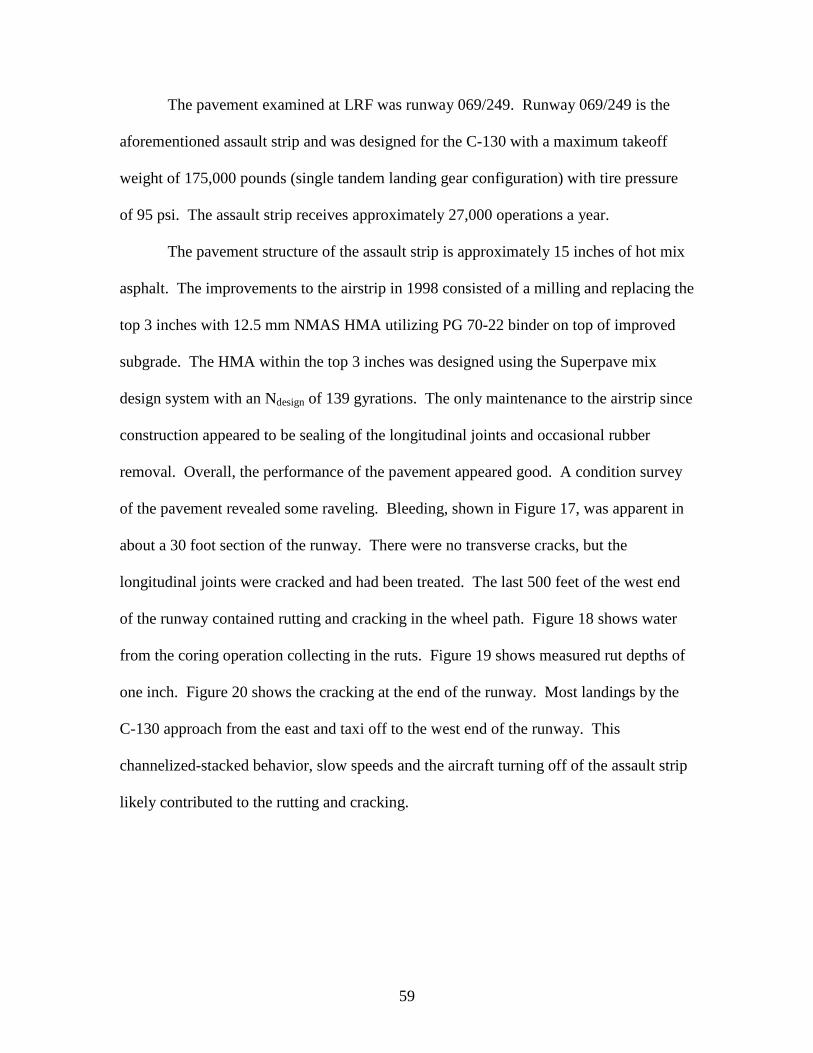
59
The pavement examined at LRF was runway 069/249. Runway 069/249 is the
aforementioned assault strip and was designed for the C-130 with a maximum takeoff
weight of 175,000 pounds (single tandem landing gear configuration) with tire pressure
of 95 psi. The assault strip receives approximately 27,000 operations a year.
The pavement structure of the assault strip is approximately 15 inches of hot mix
asphalt. The improvements to the airstrip in 1998 consisted of a milling and replacing the
top 3 inches with 12.5 mm NMAS HMA utilizing PG 70-22 binder on top of improved
subgrade. The HMA within the top 3 inches was designed using the Superpave mix
design system with an Ndesign of 139 gyrations. The only maintenance to the airstrip since
construction appeared to be sealing of the longitudinal joints and occasional rubber
removal. Overall, the performance of the pavement appeared good. A condition survey
of the pavement revealed some raveling. Bleeding, shown in Figure 17, was apparent in
about a 30 foot section of the runway. There were no transverse cracks, but the
longitudinal joints were cracked and had been treated. The last 500 feet of the west end
of the runway contained rutting and cracking in the wheel path. Figure 18 shows water
from the coring operation collecting in the ruts. Figure 19 shows measured rut depths of
one inch. Figure 20 shows the cracking at the end of the runway. Most landings by the
C-130 approach from the east and taxi off to the west end of the runway. This
channelized-stacked behavior, slow speeds and the aircraft turning off of the assault strip
likely contributed to the rutting and cracking.
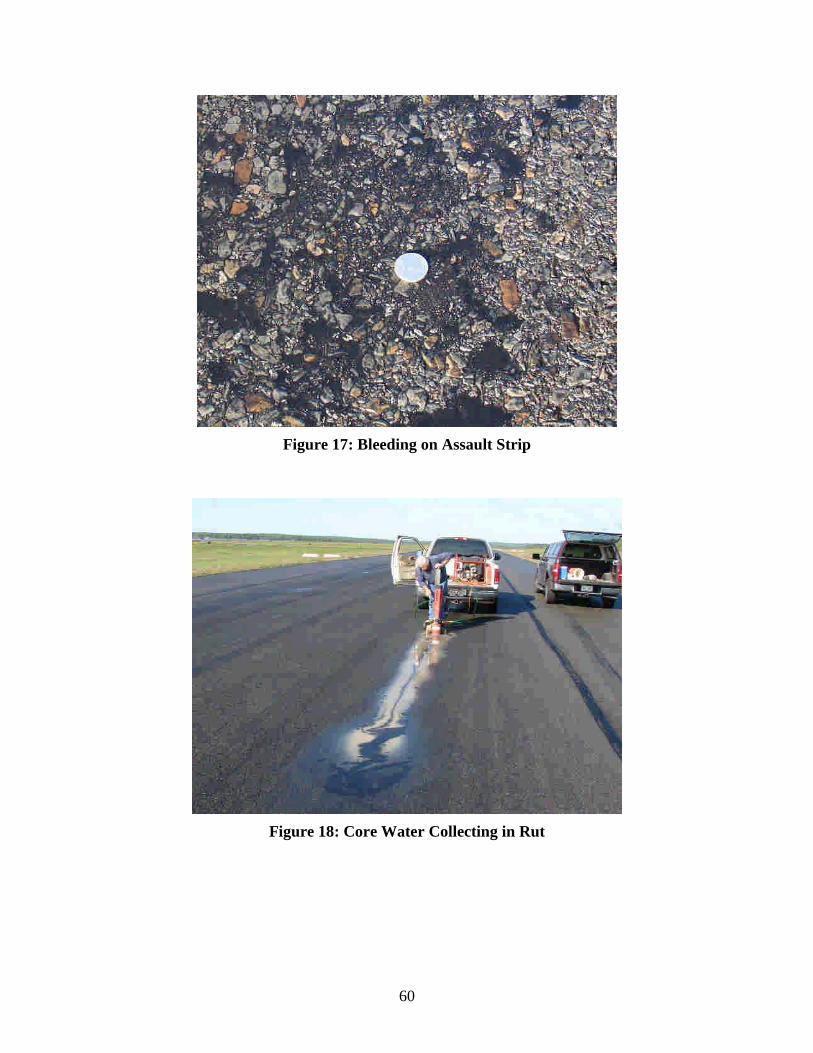
60
Figure 17: Bleeding on Assault Strip
Figure 18: Core Water Collecting in Rut
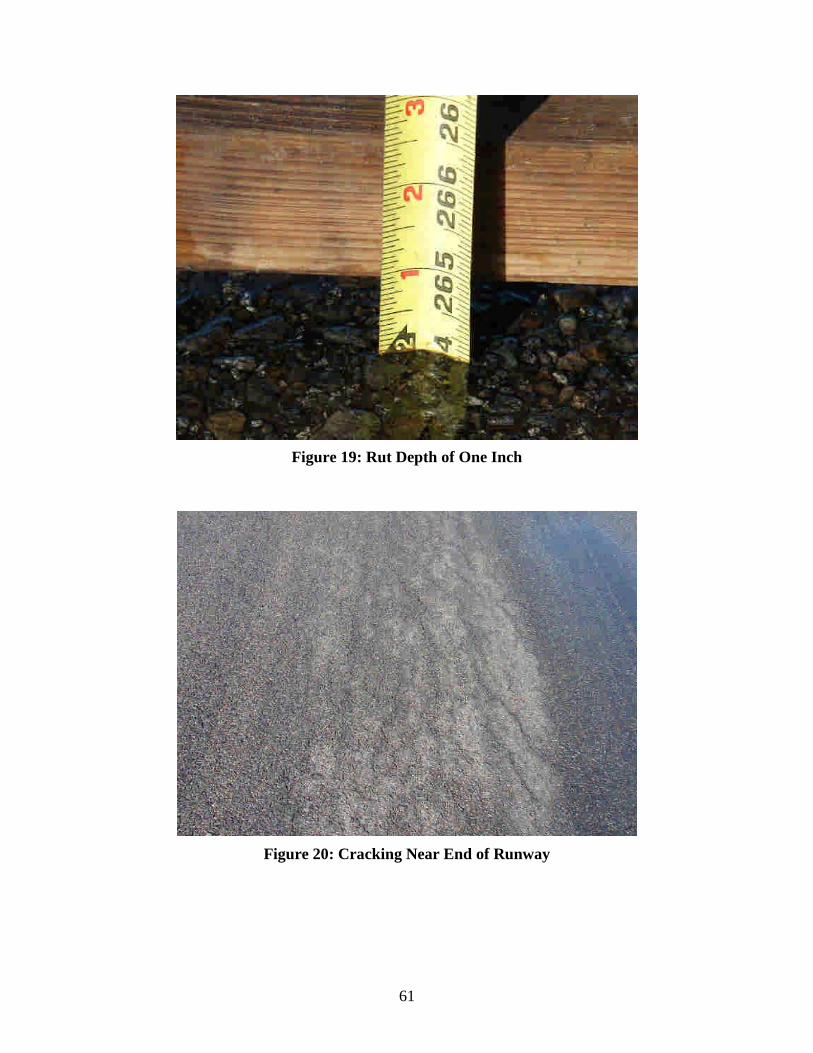
61
Figure 19: Rut Depth of One Inch
Figure 20: Cracking Near End of Runway

62
Naval Air Station-Oceana
Naval Air Station (NAS) Oceana (FAA Location Identifier NTU) was visited on
October 6, 2007. NAS Oceana is a United States Navy master jet base and home to
approximately 17 squadrons of F/A-18 Hornets and F/A-18 Super Hornets (more than
200 aircraft). Prior to their retirement in October 2006, the base also housed F-14
Tomcats. Heavier aircraft, such as C-17 and C-141 cargo planes also make routine
landings. Approximately 250,000 takeoffs and landings were reported in 2006 (NAS
Oceana Web Site Accessed 12/18/07). NAS Oceana is served by one 12,000 foot and
three 8,000 foot runways.
The airport is located in the FAA Eastern (AEA) region and is designated in the
Wet-Freeze LTPP climatic zone. NAS Oceana is at an elevation of approximately 23 feet
above sea level. The airport is located in a temperate climatic region with an average
yearly temperature of 70 °F. The average high air temperature of 87 °F occurs in July
and the average low air temperature of 32 °F occurs in January. The average rainfall is
45.2 inches. LTPPBind Software indicates that the historical air temperature extremes
during the year range from 13 to 93 °F and the pavement temperature ranges from 21°F
to 134°F.
Rutting measurements and cores were taken from Taxiway Alpha. Taxiway Alpha
is a 75 foot wide parallel taxiway to the primary runway. The taxiways and runways at
NAS Oceana are comprised of 6 to 7 inches of HMA over 10 inches of concrete. In some
areas, an asphalt treated paving fabric was used in an attempt to reduce reflective
cracking.
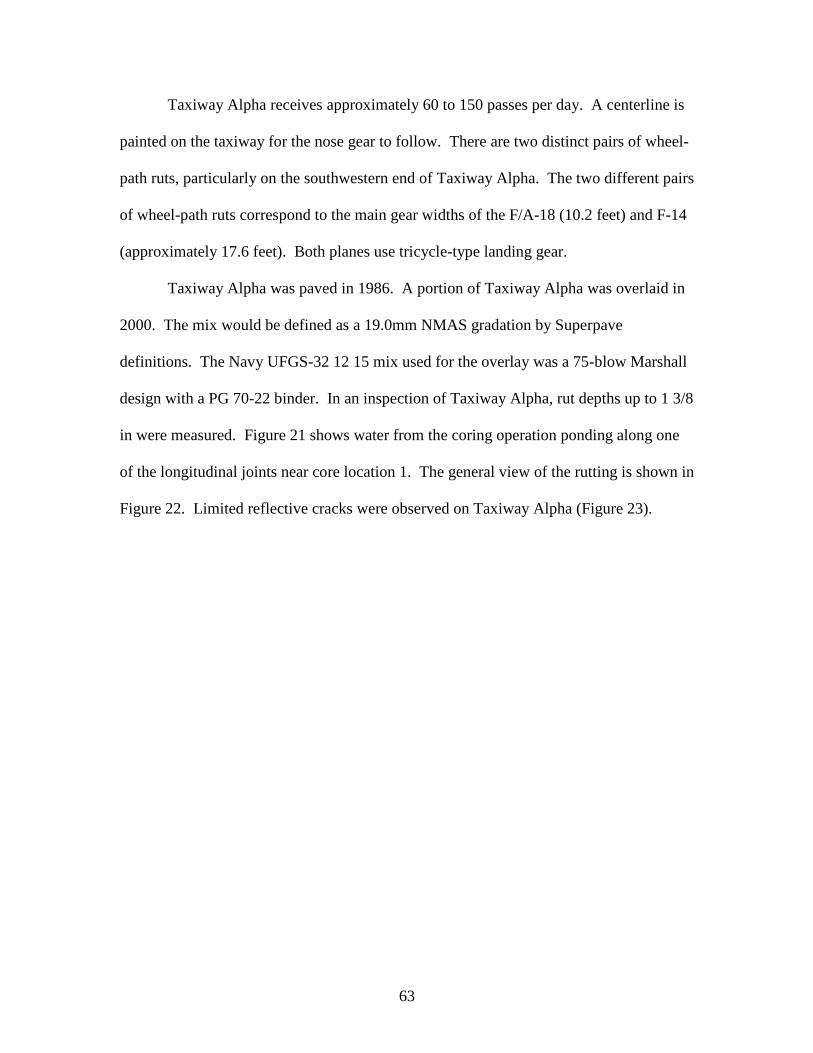
63
Taxiway Alpha receives approximately 60 to 150 passes per day. A centerline is
painted on the taxiway for the nose gear to follow. There are two distinct pairs of wheel-
path ruts, particularly on the southwestern end of Taxiway Alpha. The two different pairs
of wheel-path ruts correspond to the main gear widths of the F/A-18 (10.2 feet) and F-14
(approximately 17.6 feet). Both planes use tricycle-type landing gear.
Taxiway Alpha was paved in 1986. A portion of Taxiway Alpha was overlaid in
2000. The mix would be defined as a 19.0mm NMAS gradation by Superpave
definitions. The Navy UFGS-32 12 15 mix used for the overlay was a 75-blow Marshall
design with a PG 70-22 binder. In an inspection of Taxiway Alpha, rut depths up to 1 3/8
in were measured. Figure 21 shows water from the coring operation ponding along one
of the longitudinal joints near core location 1. The general view of the rutting is shown in
Figure 22. Limited reflective cracks were observed on Taxiway Alpha (Figure 23).
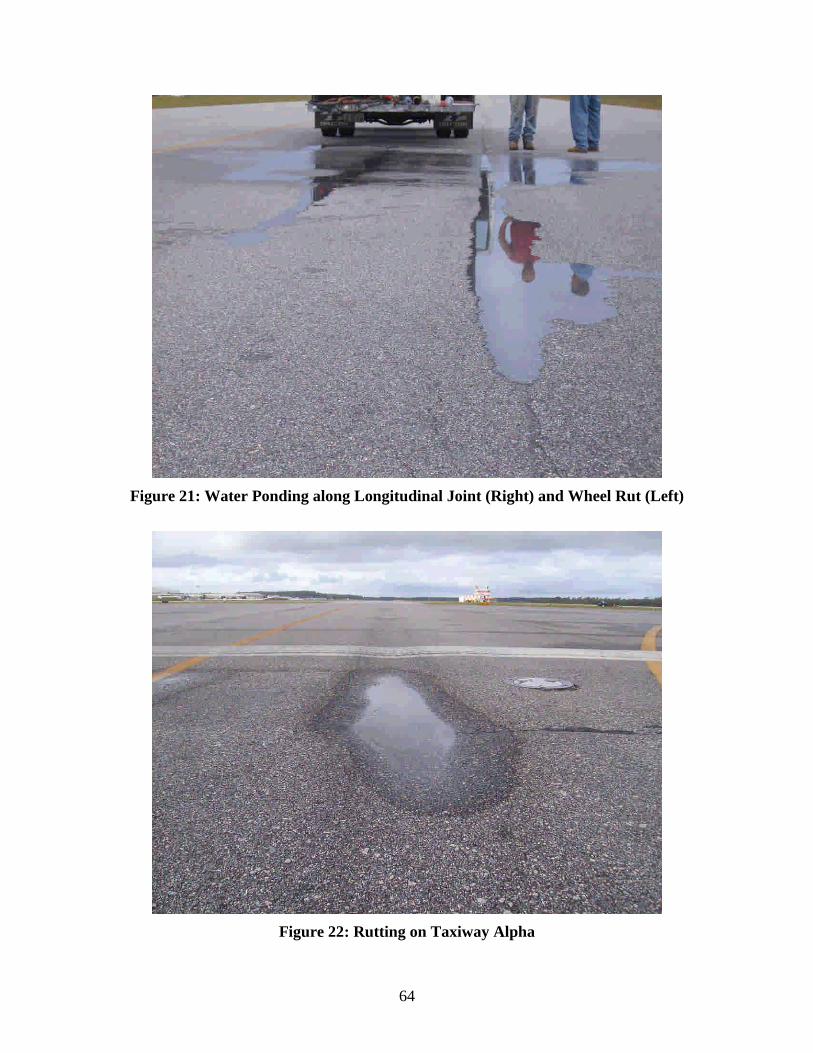
64
Figure 21: Water Ponding along Longitudinal Joint (Right) and Wheel Rut (Left)
Figure 22: Rutting on Taxiway Alpha
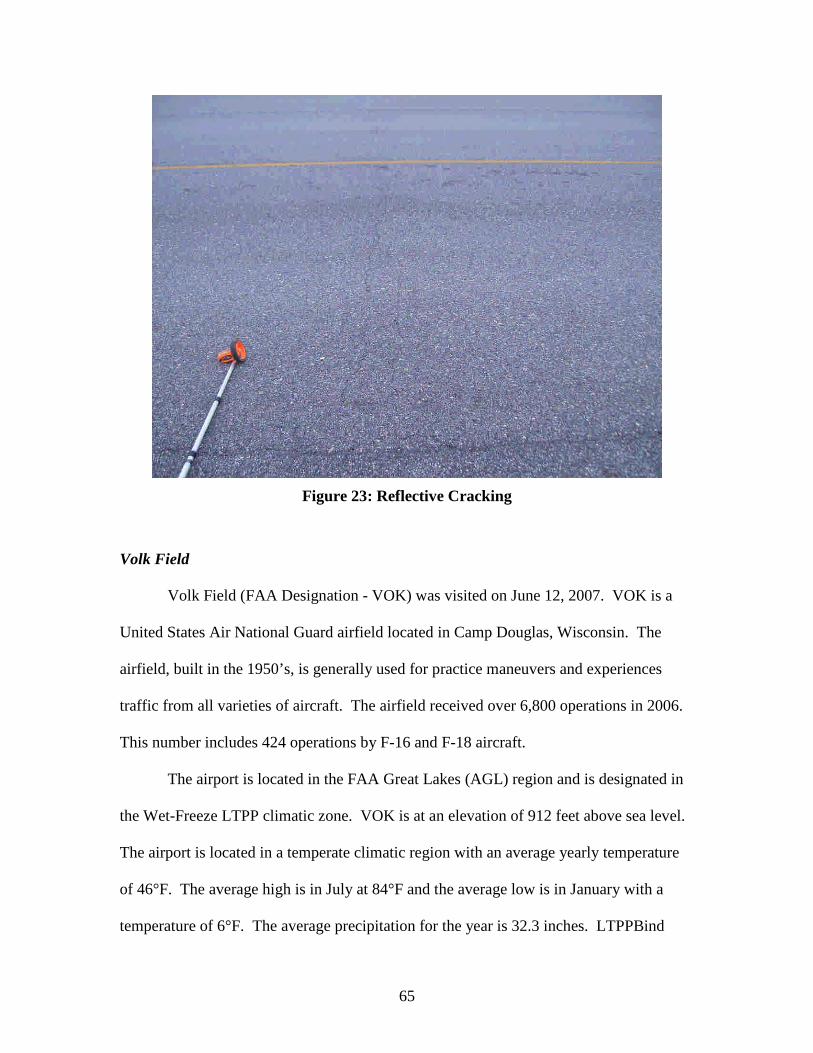
65
Figure 23: Reflective Cracking
Volk Field
Volk Field (FAA Designation - VOK) was visited on June 12, 2007. VOK is a
United States Air National Guard airfield located in Camp Douglas, Wisconsin. The
airfield, built in the 1950’s, is generally used for practice maneuvers and experiences
traffic from all varieties of aircraft. The airfield received over 6,800 operations in 2006.
This number includes 424 operations by F-16 and F-18 aircraft.
The airport is located in the FAA Great Lakes (AGL) region and is designated in
the Wet-Freeze LTPP climatic zone. VOK is at an elevation of 912 feet above sea level.
The airport is located in a temperate climatic region with an average yearly temperature
of 46°F. The average high is in July at 84°F and the average low is in January with a
temperature of 6°F. The average precipitation for the year is 32.3 inches. LTPPBind
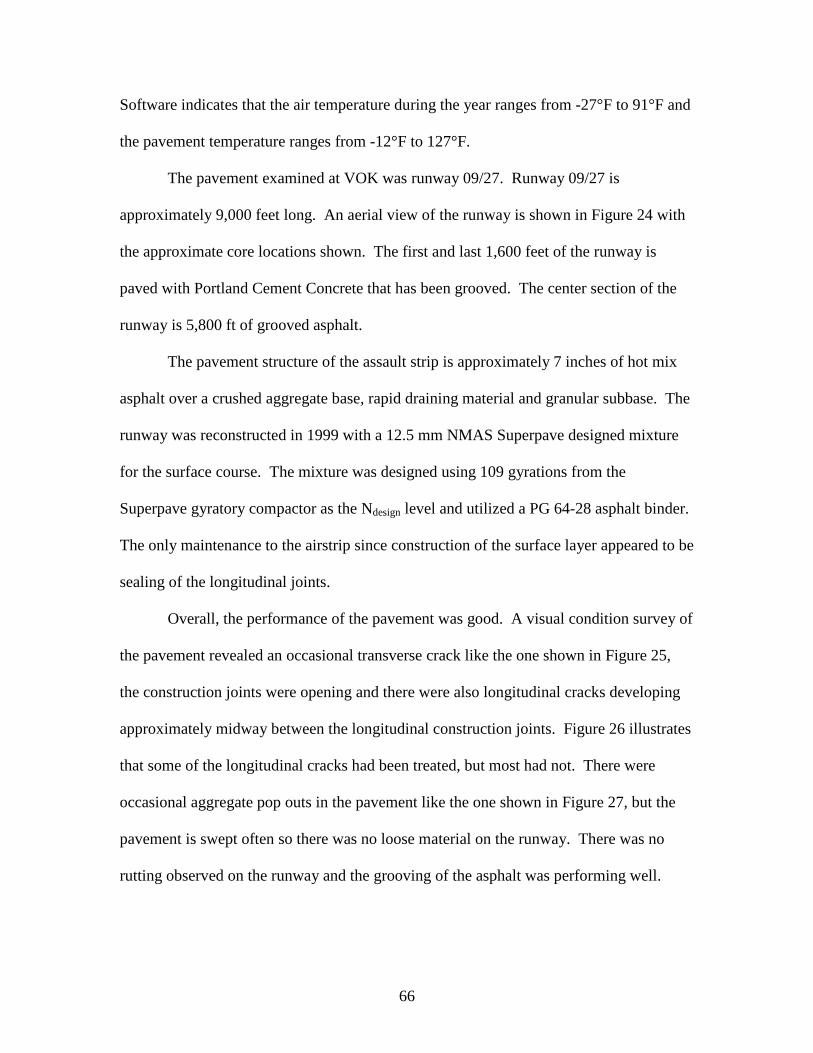
66
Software indicates that the air temperature during the year ranges from -27°F to 91°F and
the pavement temperature ranges from -12°F to 127°F.
The pavement examined at VOK was runway 09/27. Runway 09/27 is
approximately 9,000 feet long. An aerial view of the runway is shown in Figure 24 with
the approximate core locations shown. The first and last 1,600 feet of the runway is
paved with Portland Cement Concrete that has been grooved. The center section of the
runway is 5,800 ft of grooved asphalt.
The pavement structure of the assault strip is approximately 7 inches of hot mix
asphalt over a crushed aggregate base, rapid draining material and granular subbase. The
runway was reconstructed in 1999 with a 12.5 mm NMAS Superpave designed mixture
for the surface course. The mixture was designed using 109 gyrations from the
Superpave gyratory compactor as the Ndesign level and utilized a PG 64-28 asphalt binder.
The only maintenance to the airstrip since construction of the surface layer appeared to be
sealing of the longitudinal joints.
Overall, the performance of the pavement was good. A visual condition survey of
the pavement revealed an occasional transverse crack like the one shown in Figure 25,
the construction joints were opening and there were also longitudinal cracks developing
approximately midway between the longitudinal construction joints. Figure 26 illustrates
that some of the longitudinal cracks had been treated, but most had not. There were
occasional aggregate pop outs in the pavement like the one shown in Figure 27, but the
pavement is swept often so there was no loose material on the runway. There was no
rutting observed on the runway and the grooving of the asphalt was performing well.
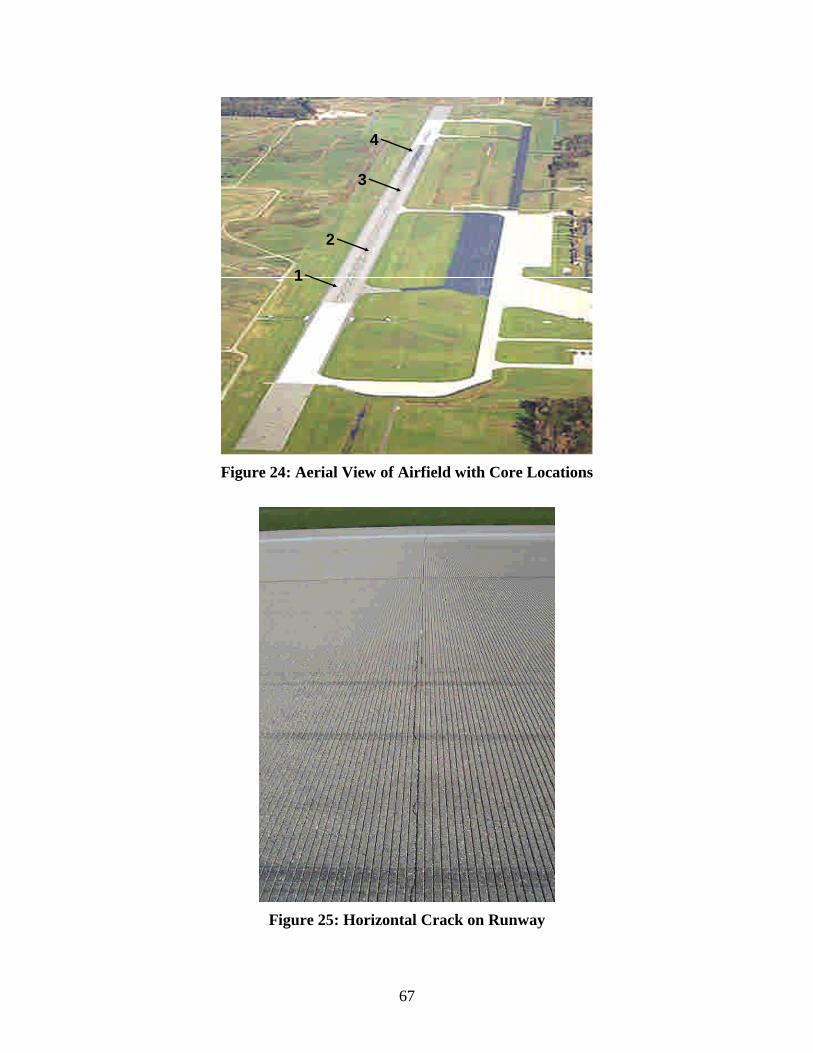
67
1
2
4
3
Figure 24: Aerial View of Airfield with Core Locations
Figure 25: Horizontal Crack on Runway
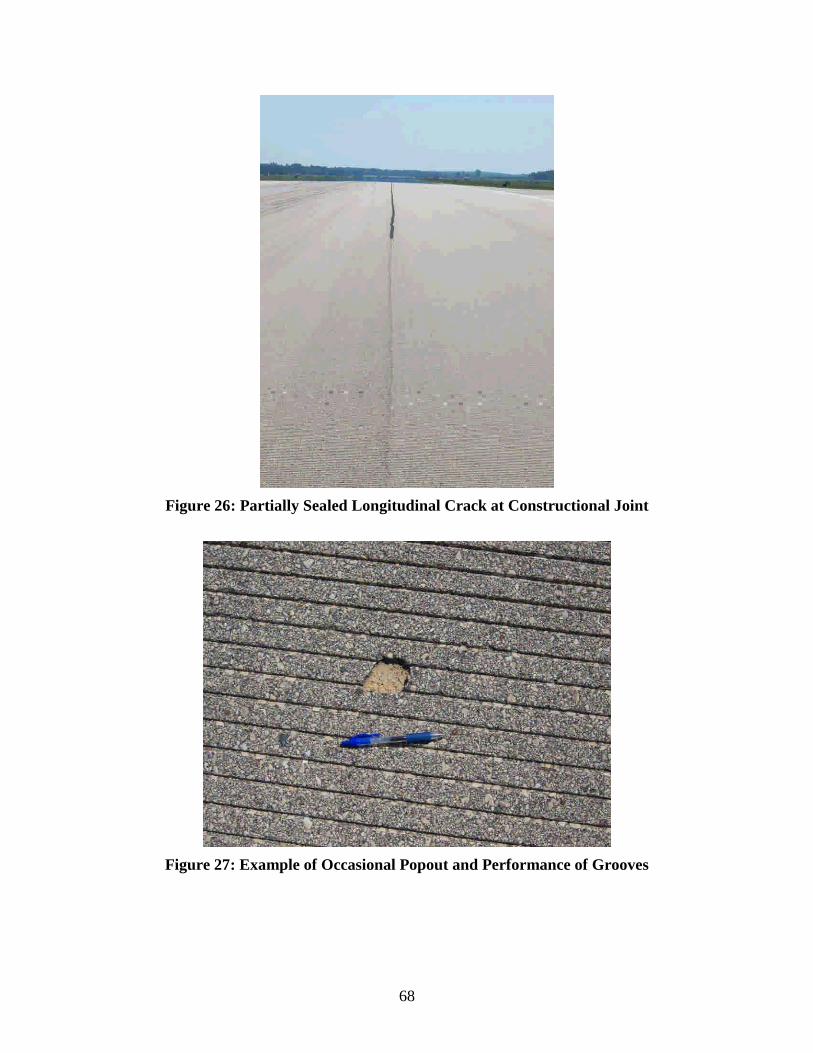
68
Figure 26: Partially Sealed Longitudinal Crack at Constructional Joint
Figure 27: Example of Occasional Popout and Performance of Grooves
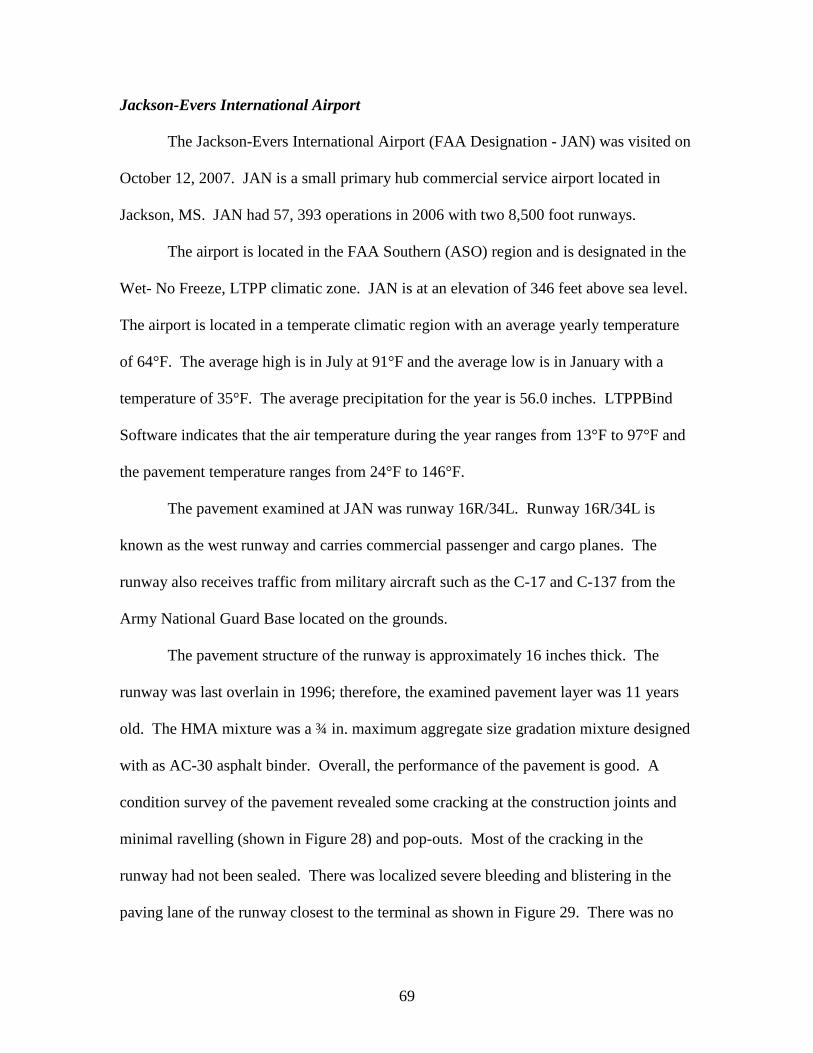
69
Jackson-Evers International Airport
The Jackson-Evers International Airport (FAA Designation - JAN) was visited on
October 12, 2007. JAN is a small primary hub commercial service airport located in
Jackson, MS. JAN had 57, 393 operations in 2006 with two 8,500 foot runways.
The airport is located in the FAA Southern (ASO) region and is designated in the
Wet- No Freeze, LTPP climatic zone. JAN is at an elevation of 346 feet above sea level.
The airport is located in a temperate climatic region with an average yearly temperature
of 64°F. The average high is in July at 91°F and the average low is in January with a
temperature of 35°F. The average precipitation for the year is 56.0 inches. LTPPBind
Software indicates that the air temperature during the year ranges from 13°F to 97°F and
the pavement temperature ranges from 24°F to 146°F.
The pavement examined at JAN was runway 16R/34L. Runway 16R/34L is
known as the west runway and carries commercial passenger and cargo planes. The
runway also receives traffic from military aircraft such as the C-17 and C-137 from the
Army National Guard Base located on the grounds.
The pavement structure of the runway is approximately 16 inches thick. The
runway was last overlain in 1996; therefore, the examined pavement layer was 11 years
old. The HMA mixture was a ¾ in. maximum aggregate size gradation mixture designed
with as AC-30 asphalt binder. Overall, the performance of the pavement is good. A
condition survey of the pavement revealed some cracking at the construction joints and
minimal ravelling (shown in Figure 28) and pop-outs. Most of the cracking in the
runway had not been sealed. There was localized severe bleeding and blistering in the
paving lane of the runway closest to the terminal as shown in Figure 29. There was no
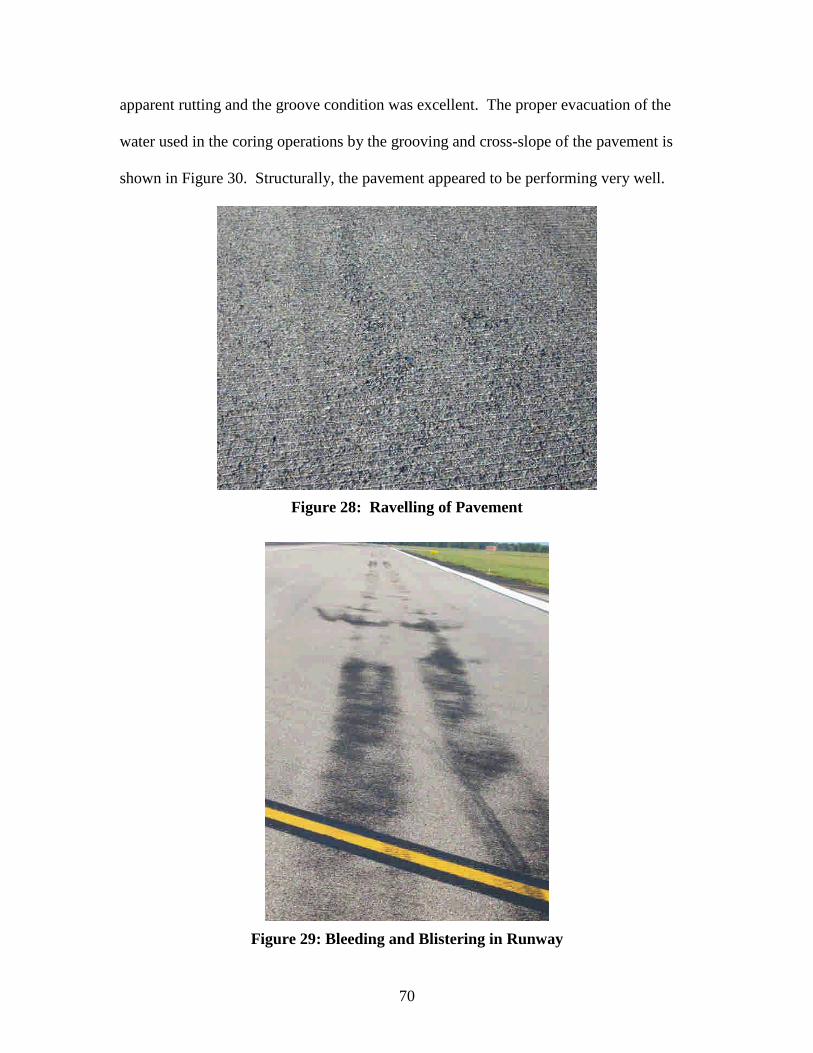
70
apparent rutting and the groove condition was excellent. The proper evacuation of the
water used in the coring operations by the grooving and cross-slope of the pavement is
shown in Figure 30. Structurally, the pavement appeared to be performing very well.
Figure 28: Ravelling of Pavement
Figure 29: Bleeding and Blistering in Runway
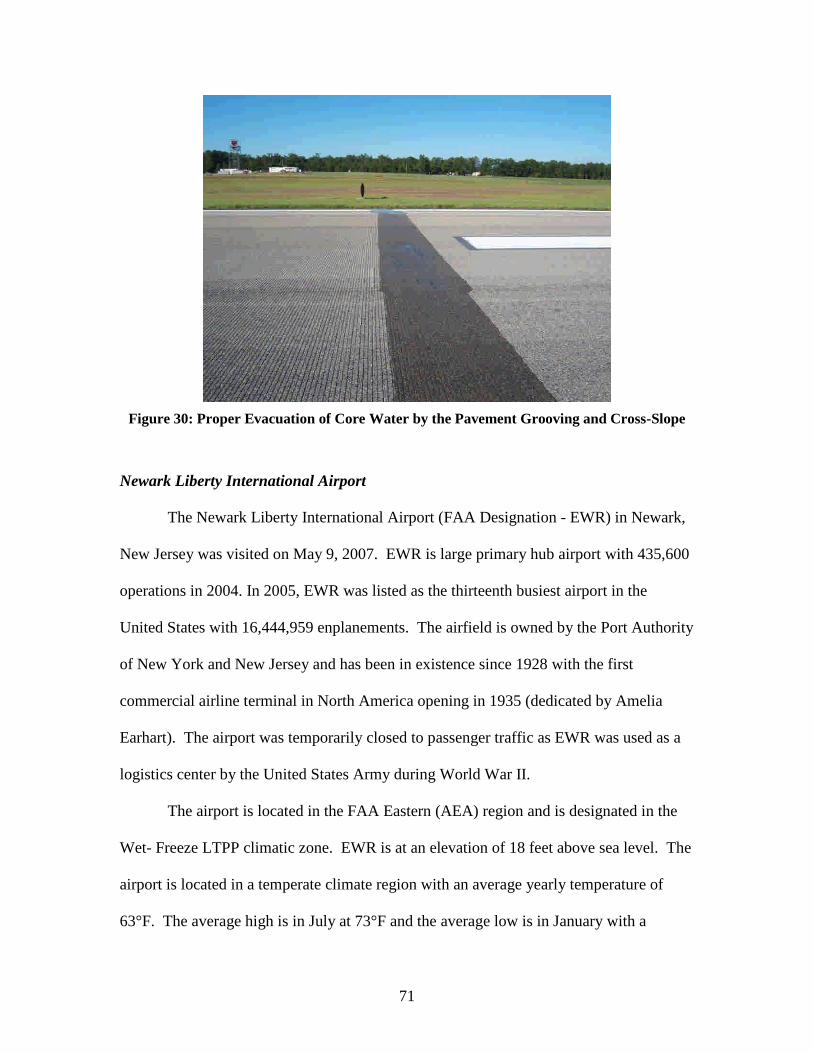
71
Figure 30: Proper Evacuation of Core Water by the Pavement Grooving and Cross-Slope
Newark Liberty International Airport
The Newark Liberty International Airport (FAA Designation - EWR) in Newark,
New Jersey was visited on May 9, 2007. EWR is large primary hub airport with 435,600
operations in 2004. In 2005, EWR was listed as the thirteenth busiest airport in the
United States with 16,444,959 enplanements. The airfield is owned by the Port Authority
of New York and New Jersey and has been in existence since 1928 with the first
commercial airline terminal in North America opening in 1935 (dedicated by Amelia
Earhart). The airport was temporarily closed to passenger traffic as EWR was used as a
logistics center by the United States Army during World War II.
The airport is located in the FAA Eastern (AEA) region and is designated in the
Wet- Freeze LTPP climatic zone. EWR is at an elevation of 18 feet above sea level. The
airport is located in a temperate climate region with an average yearly temperature of
63°F. The average high is in July at 73°F and the average low is in January with a
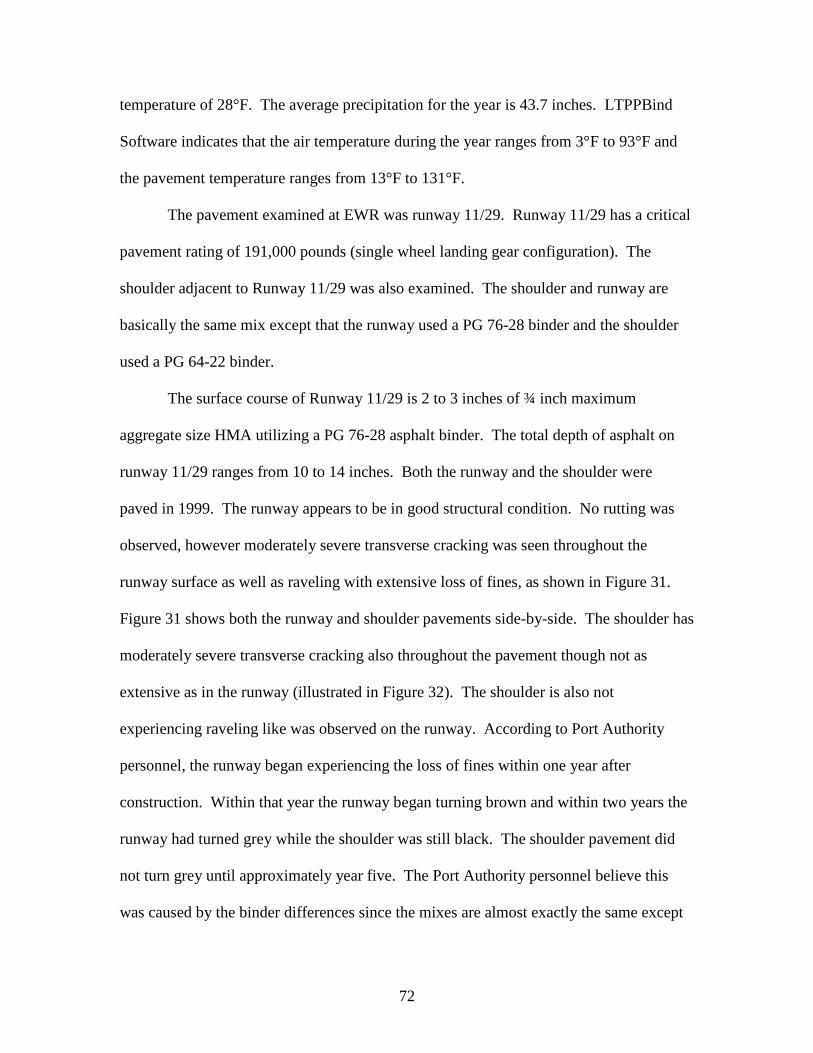
72
temperature of 28°F. The average precipitation for the year is 43.7 inches. LTPPBind
Software indicates that the air temperature during the year ranges from 3°F to 93°F and
the pavement temperature ranges from 13°F to 131°F.
The pavement examined at EWR was runway 11/29. Runway 11/29 has a critical
pavement rating of 191,000 pounds (single wheel landing gear configuration). The
shoulder adjacent to Runway 11/29 was also examined. The shoulder and runway are
basically the same mix except that the runway used a PG 76-28 binder and the shoulder
used a PG 64-22 binder.
The surface course of Runway 11/29 is 2 to 3 inches of ¾ inch maximum
aggregate size HMA utilizing a PG 76-28 asphalt binder. The total depth of asphalt on
runway 11/29 ranges from 10 to 14 inches. Both the runway and the shoulder were
paved in 1999. The runway appears to be in good structural condition. No rutting was
observed, however moderately severe transverse cracking was seen throughout the
runway surface as well as raveling with extensive loss of fines, as shown in Figure 31.
Figure 31 shows both the runway and shoulder pavements side-by-side. The shoulder has
moderately severe transverse cracking also throughout the pavement though not as
extensive as in the runway (illustrated in Figure 32). The shoulder is also not
experiencing raveling like was observed on the runway. According to Port Authority
personnel, the runway began experiencing the loss of fines within one year after
construction. Within that year the runway began turning brown and within two years the
runway had turned grey while the shoulder was still black. The shoulder pavement did
not turn grey until approximately year five. The Port Authority personnel believe this
was caused by the binder differences since the mixes are almost exactly the same except
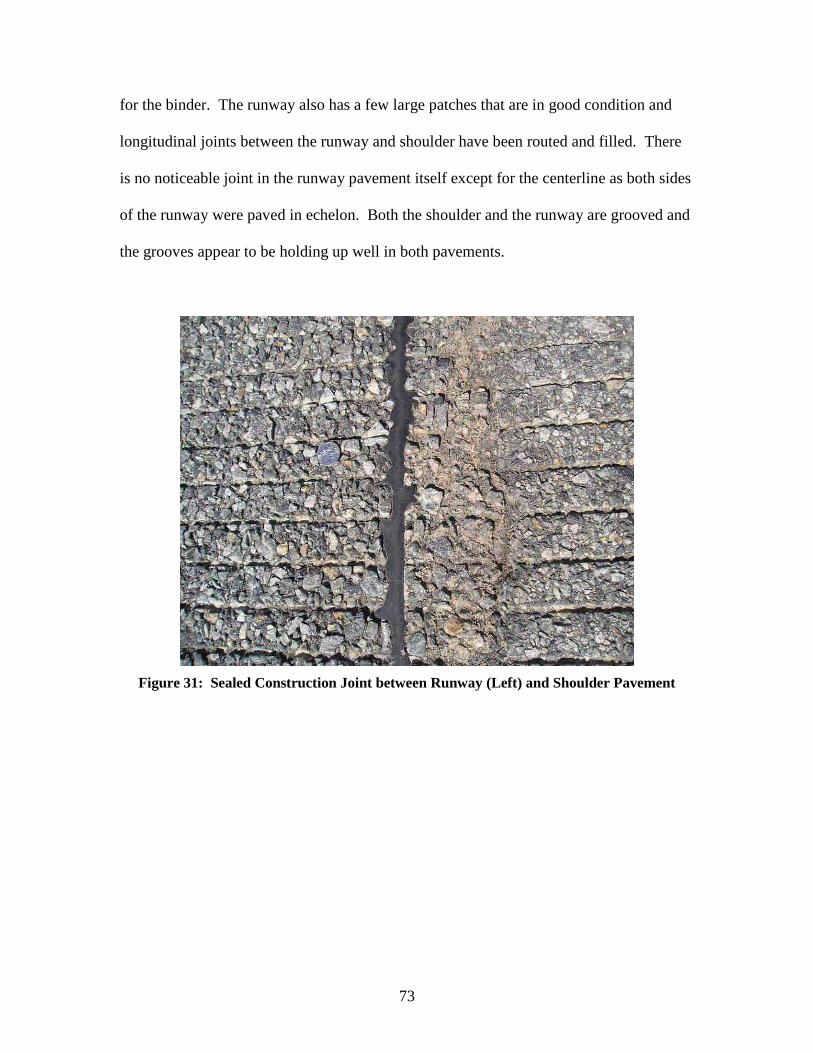
73
for the binder. The runway also has a few large patches that are in good condition and
longitudinal joints between the runway and shoulder have been routed and filled. There
is no noticeable joint in the runway pavement itself except for the centerline as both sides
of the runway were paved in echelon. Both the shoulder and the runway are grooved and
the grooves appear to be holding up well in both pavements.
Figure 31: Sealed Construction Joint between Runway (Left) and Shoulder Pavement
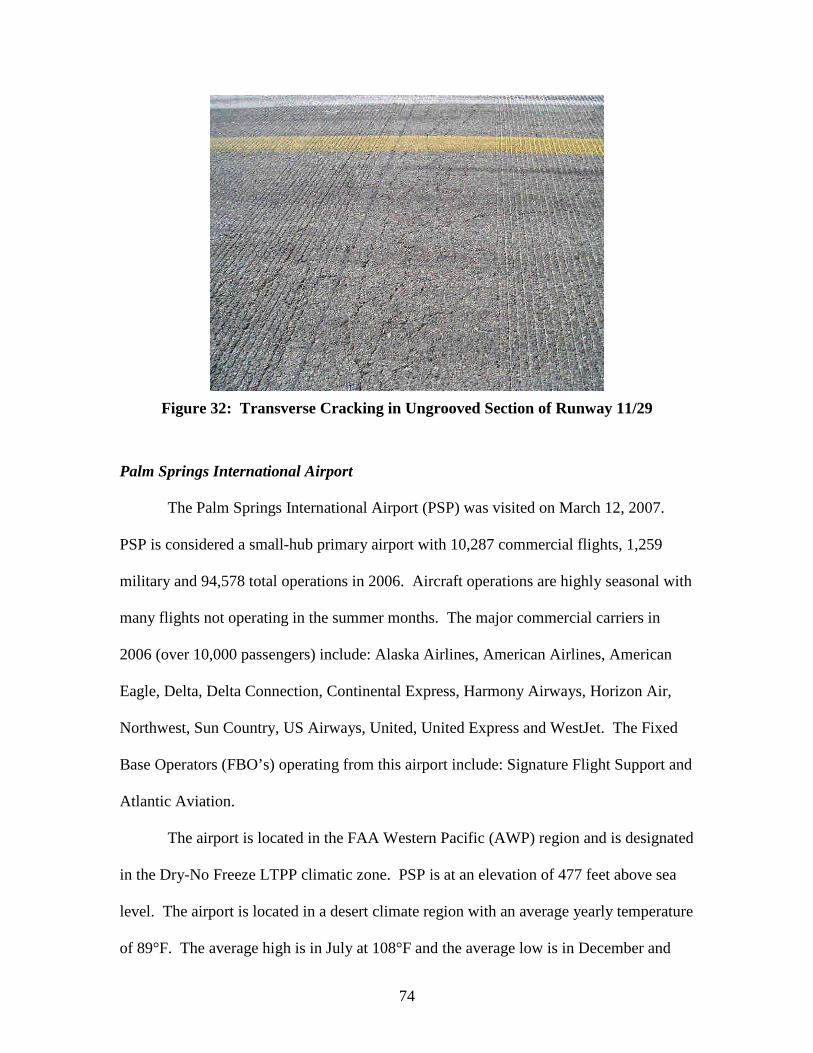
74
Figure 32: Transverse Cracking in Ungrooved Section of Runway 11/29
Palm Springs International Airport
The Palm Springs International Airport (PSP) was visited on March 12, 2007.
PSP is considered a small-hub primary airport with 10,287 commercial flights, 1,259
military and 94,578 total operations in 2006. Aircraft operations are highly seasonal with
many flights not operating in the summer months. The major commercial carriers in
2006 (over 10,000 passengers) include: Alaska Airlines, American Airlines, American
Eagle, Delta, Delta Connection, Continental Express, Harmony Airways, Horizon Air,
Northwest, Sun Country, US Airways, United, United Express and WestJet. The Fixed
Base Operators (FBO’s) operating from this airport include: Signature Flight Support and
Atlantic Aviation.
The airport is located in the FAA Western Pacific (AWP) region and is designated
in the Dry-No Freeze LTPP climatic zone. PSP is at an elevation of 477 feet above sea
level. The airport is located in a desert climate region with an average yearly temperature
of 89°F. The average high is in July at 108°F and the average low is in December and
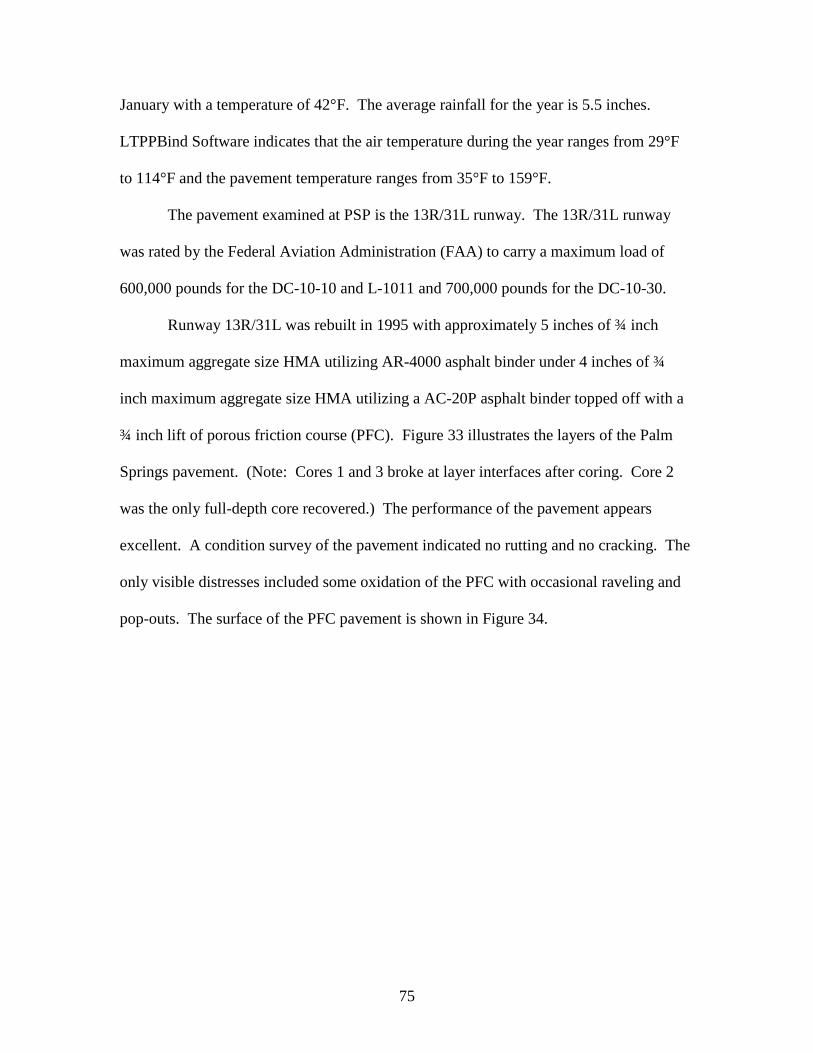
75
January with a temperature of 42°F. The average rainfall for the year is 5.5 inches.
LTPPBind Software indicates that the air temperature during the year ranges from 29°F
to 114°F and the pavement temperature ranges from 35°F to 159°F.
The pavement examined at PSP is the 13R/31L runway. The 13R/31L runway
was rated by the Federal Aviation Administration (FAA) to carry a maximum load of
600,000 pounds for the DC-10-10 and L-1011 and 700,000 pounds for the DC-10-30.
Runway 13R/31L was rebuilt in 1995 with approximately 5 inches of ¾ inch
maximum aggregate size HMA utilizing AR-4000 asphalt binder under 4 inches of ¾
inch maximum aggregate size HMA utilizing a AC-20P asphalt binder topped off with a
¾ inch lift of porous friction course (PFC). Figure 33 illustrates the layers of the Palm
Springs pavement. (Note: Cores 1 and 3 broke at layer interfaces after coring. Core 2
was the only full-depth core recovered.) The performance of the pavement appears
excellent. A condition survey of the pavement indicated no rutting and no cracking. The
only visible distresses included some oxidation of the PFC with occasional raveling and
pop-outs. The surface of the PFC pavement is shown in Figure 34.
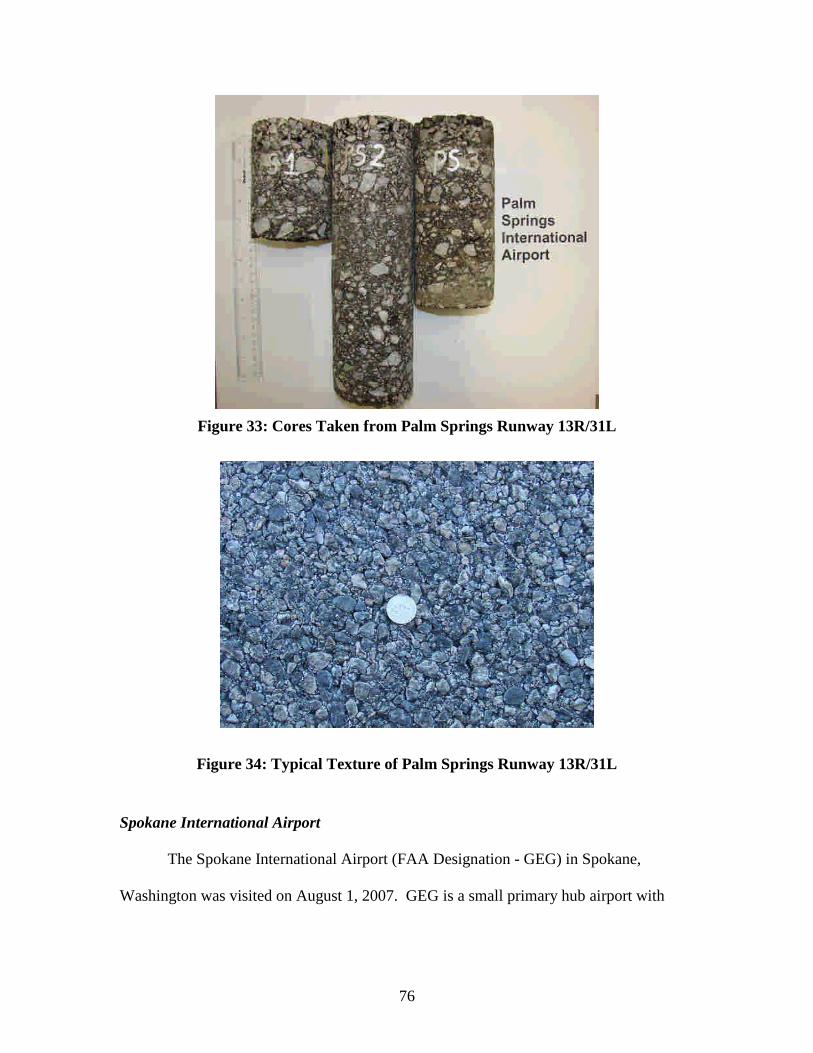
76
Figure 33: Cores Taken from Palm Springs Runway 13R/31L
Figure 34: Typical Texture of Palm Springs Runway 13R/31L
Spokane International Airport
The Spokane International Airport (FAA Designation - GEG) in Spokane,
Washington was visited on August 1, 2007. GEG is a small primary hub airport with
77
103,975 operations in 2006. In 2005, GEG was listed as the seventy-second busiest
airport in the United States with 1,583,737 enplanements.
The airport is located in the FAA Northwest Mountain (ANM) region and is
designated in the Dry - Freeze LTPP climatic zone. GEG is at an elevation of 2,376 feet
above sea level. The airport is located in a temperate climate region with an average
yearly temperature of 46°F. The average high is in July at 84°F and the average low is in
January with a temperature of 22°F. The average precipitation for the year is 16.1 inches.
LTPPBind Software indicates that the air temperature during the year ranges from -8°F to
94°F and the pavement temperature ranges from 0°F to 123°F.
The pavement examined at GEG was the main parallel Taxiway A. Taxiway A is
parallel to runway 03/21 which is designed for a loading of 400,000 lbs (DTW landing
gear configuration).
The surface course of Taxiway A is 2 to 3 inches of 1/2 inch NMAS HMA
utilizing 6.3 percent AR 4000W asphalt binder. The total depth of asphalt on Taxiway A
is approximately 14 inches. The taxiway appears to be in good structural condition. The
taxiway was last paved in 1991; therefore, the pavement age at the time of the site visit
was 16 years. No rutting was observed; however, severe transverse cracking,
longitudinal joint cracking, pop-outs and raveling with loss of fines were observed.
Figure 35 shows an intersection of a longitudinal and transverse crack. Figure 36
illustrates typical raveling of the surface. Some of the cracks have been sealed, but many
have not; some of the crack sealing in shown in Figure 37. This pavement is scheduled
for rehabilitation in 2008.
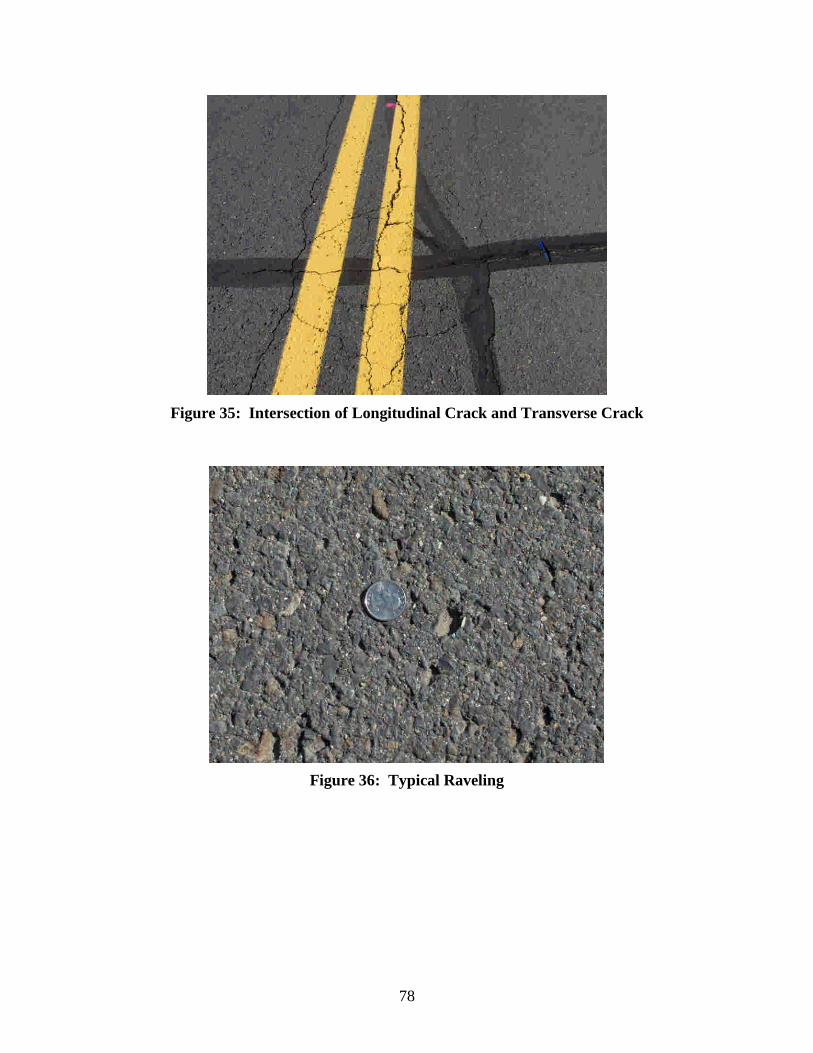
78
Figure 35: Intersection of Longitudinal Crack and Transverse Crack
Figure 36: Typical Raveling
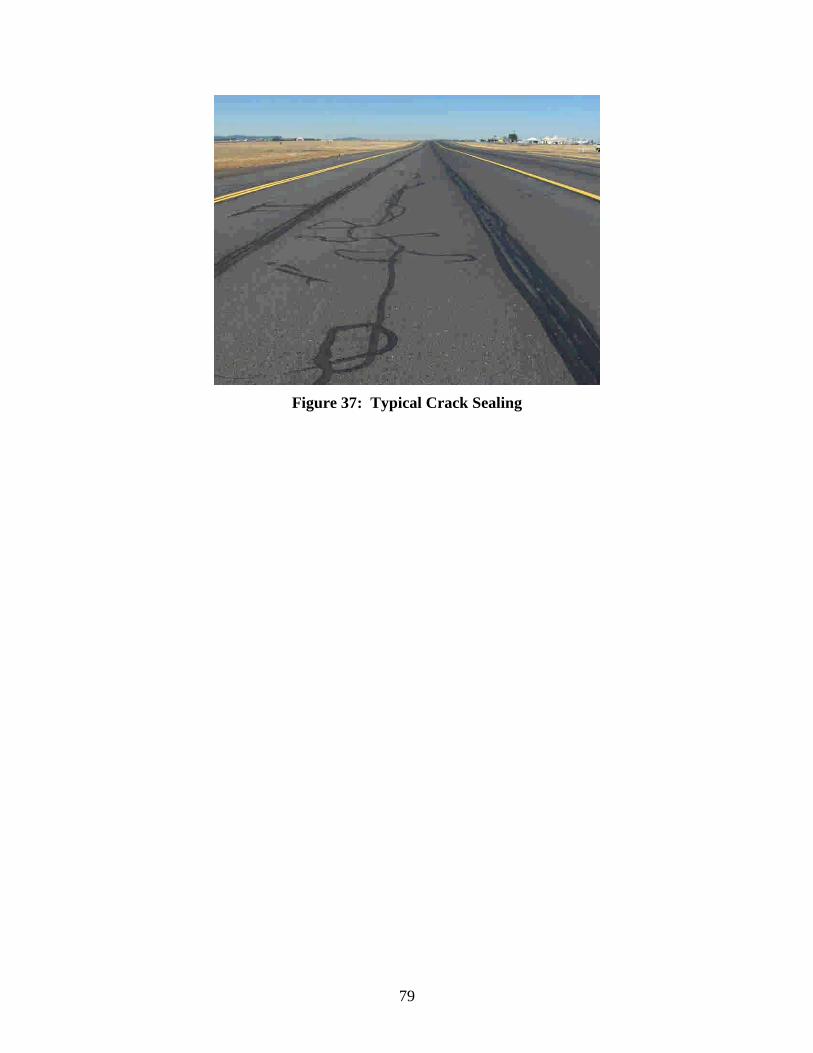
79
Figure 37: Typical Crack Sealing

80
Chapter 5Materials and Test Methods
Mix Design and In-Place Core Information
For each of the ten airfield mixes, the researchers obtained cores from the
pavements in order to determine in-place density, asphalt binder content and gradation.
Additionally, materials from the original source that were utilized to produce the various
HMA mixes were obtained.
The original mix design data and quality control information (if available) was
obtained from either an airfield representative or a Civil Engineer that worked on the
project. Cores obtained from the various airfield pavements were subjected to a series of
tests in order to obtain in-place properties. The top layer, or layer of interest, was cut
from each core. Initially, the bulk specific gravity of the core was determined utilizing
ASTM D2726 Bulk Specific Gravity & Density of Compacted Bituminous Mixtures Using
Saturated Surface-Dry Specimens as well as measuring the height and diameter of each
core. The core was then tested for its indirect tensile strength. Once the tensile strength
was determined the core was heated and the cut faces were carefully removed from the
cores. After the cut faces were removed, the sample was broken down and the theoretical
maximum specific gravity was determined using ASTM D2041 Standard Test Method
for Theoretical Maximum Specific Gravity and Density of Bituminous Paving Mixtures.
After the material was dried, the binder was extracted using ASTM D 2172
Standard Test Methods for Quantitative Extraction of Bitumen from Bituminous Paving
Mixtures and recovered using ASTM D 5404 Standard Practice for Recovery of Asphalt
from Solution Using the Rotary Evaporator. Due to the small sample of binder actually
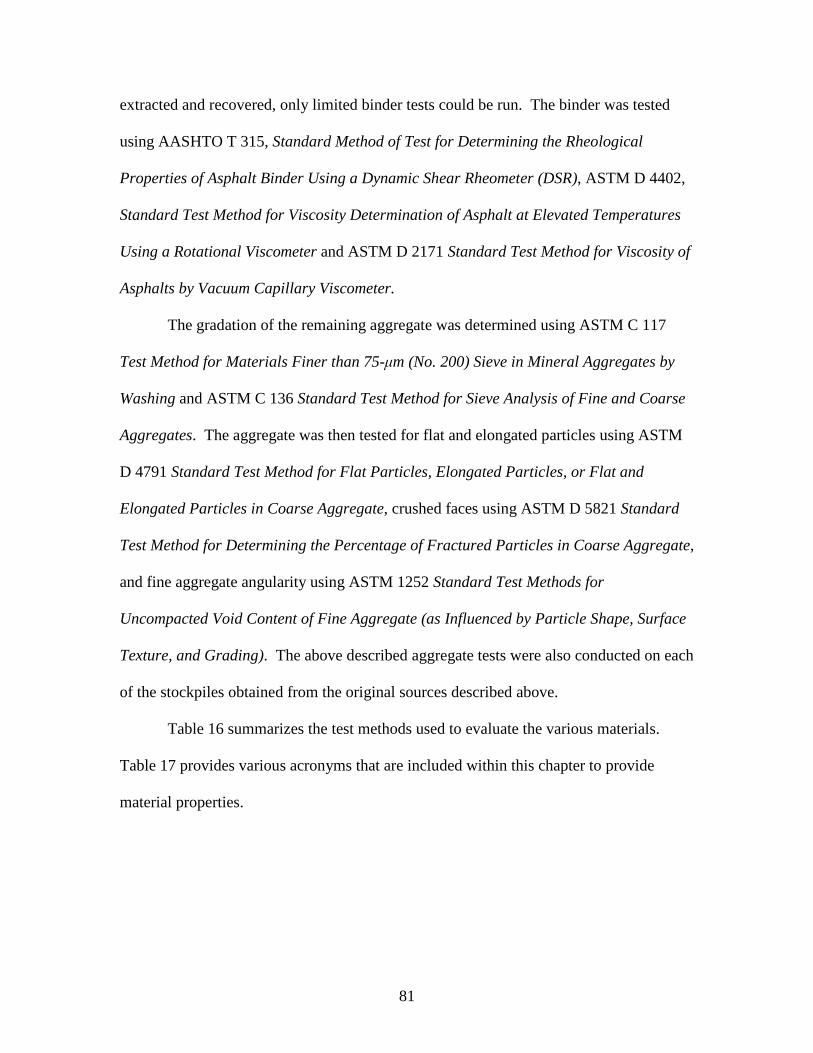
81
extracted and recovered, only limited binder tests could be run. The binder was tested
using AASHTO T 315, Standard Method of Test for Determining the Rheological
Properties of Asphalt Binder Using a Dynamic Shear Rheometer (DSR), ASTM D 4402,
Standard Test Method for Viscosity Determination of Asphalt at Elevated Temperatures
Using a Rotational Viscometer and ASTM D 2171 Standard Test Method for Viscosity of
Asphalts by Vacuum Capillary Viscometer.
The gradation of the remaining aggregate was determined using ASTM C 117
Test Method for Materials Finer than 75-μm (No. 200) Sieve in Mineral Aggregates by
Washing and ASTM C 136 Standard Test Method for Sieve Analysis of Fine and Coarse
Aggregates. The aggregate was then tested for flat and elongated particles using ASTM
D 4791 Standard Test Method for Flat Particles, Elongated Particles, or Flat and
Elongated Particles in Coarse Aggregate, crushed faces using ASTM D 5821 Standard
Test Method for Determining the Percentage of Fractured Particles in Coarse Aggregate,
and fine aggregate angularity using ASTM 1252 Standard Test Methods for
Uncompacted Void Content of Fine Aggregate (as Influenced by Particle Shape, Surface
Texture, and Grading). The above described aggregate tests were also conducted on each
of the stockpiles obtained from the original sources described above.
Table 16 summarizes the test methods used to evaluate the various materials.
Table 17 provides various acronyms that are included within this chapter to provide
material properties.
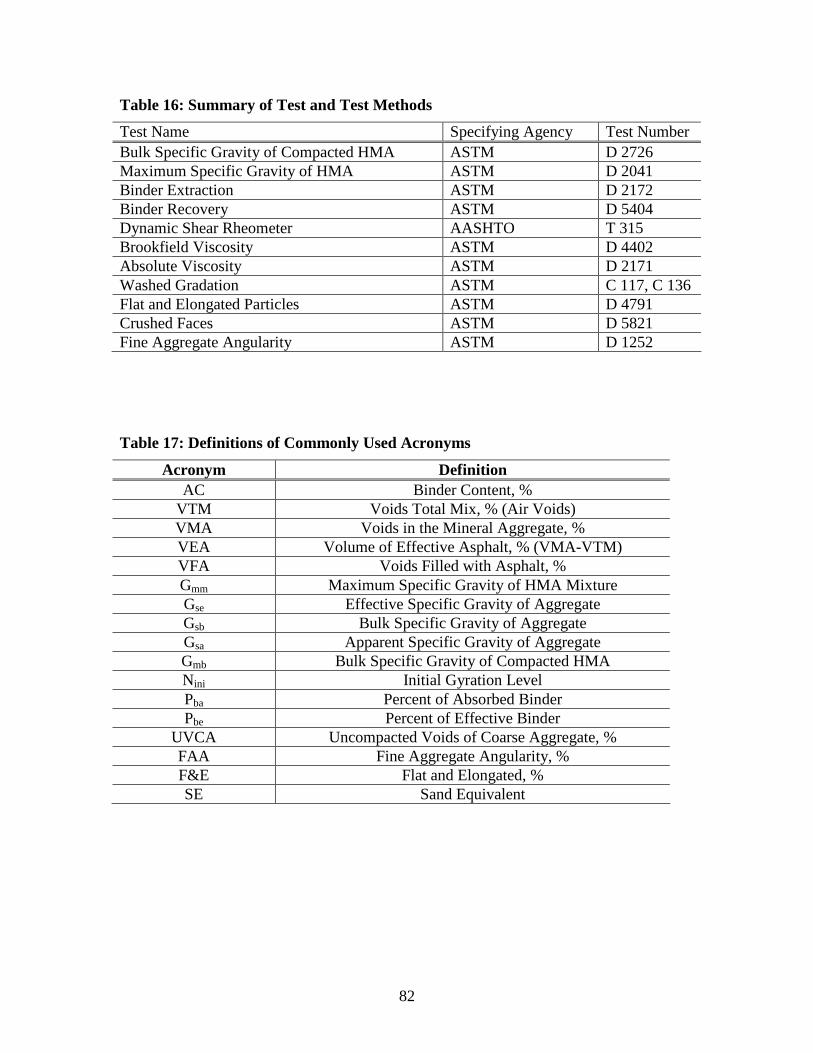
82
Table 16: Summary of Test and Test Methods
Test Name Specifying Agency Test Number
Bulk Specific Gravity of Compacted HMA ASTM D 2726Maximum Specific Gravity of HMA ASTM D 2041Binder Extraction ASTM D 2172Binder Recovery ASTM D 5404Dynamic Shear Rheometer AASHTO T 315Brookfield Viscosity ASTM D 4402Absolute Viscosity ASTM D 2171Washed Gradation ASTM C 117, C 136Flat and Elongated Particles ASTM D 4791Crushed Faces ASTM D 5821Fine Aggregate Angularity ASTM D 1252
Table 17: Definitions of Commonly Used Acronyms
Acronym Definition
AC Binder Content, %VTM Voids Total Mix, % (Air Voids)VMA Voids in the Mineral Aggregate, %VEA Volume of Effective Asphalt, % (VMA-VTM)VFA Voids Filled with Asphalt, %Gmm Maximum Specific Gravity of HMA MixtureGse Effective Specific Gravity of AggregateGsb Bulk Specific Gravity of AggregateGsa Apparent Specific Gravity of AggregateGmb Bulk Specific Gravity of Compacted HMANini Initial Gyration LevelPba Percent of Absorbed BinderPbe Percent of Effective Binder
UVCA Uncompacted Voids of Coarse Aggregate, %FAA Fine Aggregate Angularity, %F&E Flat and Elongated, %SE Sand Equivalent
83
Material Properties
Jacqueline Cochran Regional Airport
The pavement examined at the Jacqueline Cochran Regional Airport was
comprised of a ¾ in. maximum aggregate size Marshall designed HMA that was placed
in 1997. A granite aggregate was used for the mixture from Granite Construction’s Indio
Quarry in Indio, CA. The asphalt binder used was an AR-4000 and the mixture was
designed with 75 blows per face of the Marshall hammer. Under the Superpave system
the nominal maximum aggregate size (NMAS) would be considered 12.5 mm and the
AR-4000 would likely grade as a PG 64-10. More information regarding the Jacqueline
Cochran Regional Airport is given in Table 18.
The column labeled “JMF” is the data that was taken directly from the job mix
formula worksheet supplied by the Granite Construction Company. The column labeled
“In-Place” is the properties measured from the core samples taken from the examined
pavement at Jacqueline Cochran. The in-place gradation differs significantly from the
mix design gradation as does the effective specific gravity of the aggregates. This
difference could be caused by aggregate breakdown over the life of the pavement or a
mix that was out of specification when it was placed or a JMF that was not representative
of the selected HMA layer. The quality control data could not be located for this job, nor
could a representative from the contractor or engineer be located that actually worked on
this job. The in-place data was used for comparisons in this paper because it is the
mixture that has performed in the field.
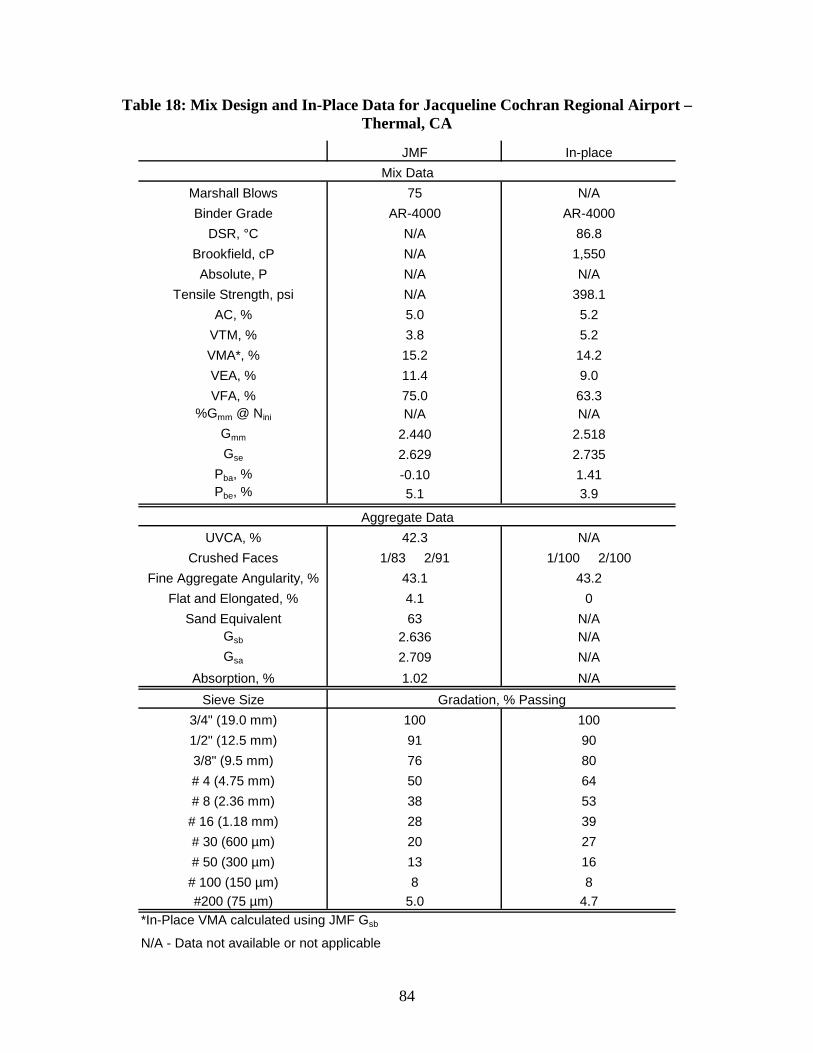
84
Table 18: Mix Design and In-Place Data for Jacqueline Cochran Regional Airport –Thermal, CA
JMF In-place
Marshall Blows 75 N/A
Binder Grade AR-4000 AR-4000
DSR, °C N/A 86.8
Brookfield, cP N/A 1,550
Absolute, P N/A N/A
Tensile Strength, psi N/A 398.1
AC, % 5.0 5.2
VTM, % 3.8 5.2
VMA*, % 15.2 14.2
VEA, % 11.4 9.0
VFA, % 75.0 63.3
%Gmm @ Nini N/A N/A
Gmm 2.440 2.518
Gse 2.629 2.735
Pba, % -0.10 1.41
Pbe, % 5.1 3.9
UVCA, % 42.3 N/A
Crushed Faces 1/83 2/91 1/100 2/100
Fine Aggregate Angularity, % 43.1 43.2
Flat and Elongated, % 4.1 0
Sand Equivalent 63 N/A
Gsb 2.636 N/A
Gsa 2.709 N/A
Absorption, % 1.02 N/A
Sieve Size
3/4" (19.0 mm) 100 100
1/2" (12.5 mm) 91 90
3/8" (9.5 mm) 76 80
# 4 (4.75 mm) 50 64
# 8 (2.36 mm) 38 53
# 16 (1.18 mm) 28 39
# 30 (600 µm) 20 27
# 50 (300 µm) 13 16
# 100 (150 µm) 8 8
#200 (75 µm) 5.0 4.7
*In-Place VMA calculated using JMF Gsb
N/A - Data not available or not applicable
Mix Data
Aggregate Data
Gradation, % Passing
85
Mineral County Memorial Airport
The pavement examined at the Mineral County Memorial Airport was a
Superpave designed 12.5 mm NMAS mixture that was paved in 2000. The airport was
paved at the same time with the same Superpave designed mix as Colorado State
Highway 149 that runs adjacent to the airport property. The binder used was a PG 58-34
because of the low temperatures experienced by the area. Additional mix design and in-
place information for the Mineral County Memorial Airport can be found in Table 19.
The aggregate was taken from the Spring Creek Pit. Due to the remote location of
Creede, Co, an aggregate with a very low bulk specific gravity (2.246) and a high water
absorption (5.05 percent) was used. The binder content is relatively high (7.3 percent) in
the mix design, but was measured much lower in-place (5.4 percent). While the binder
content may be slightly lower during production, the much more likely scenario is that
the extraction of the binder from the cores was not complete due to the extremely high
absorption level of the aggregate. Experience has shown that the higher the aggregate
absorption the more difficult it is to extract the binder from the HMA.
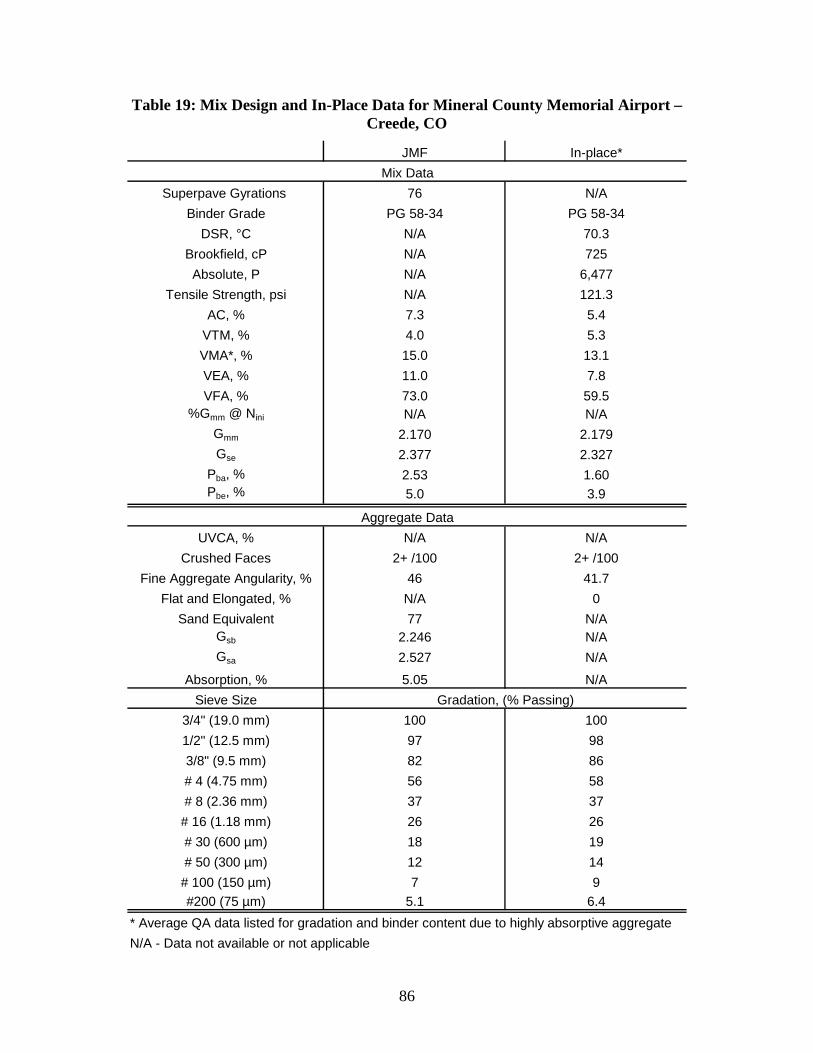
86
Table 19: Mix Design and In-Place Data for Mineral County Memorial Airport –Creede, CO
JMF In-place*
Superpave Gyrations 76 N/A
Binder Grade PG 58-34 PG 58-34
DSR, °C N/A 70.3
Brookfield, cP N/A 725
Absolute, P N/A 6,477
Tensile Strength, psi N/A 121.3
AC, % 7.3 5.4
VTM, % 4.0 5.3
VMA*, % 15.0 13.1
VEA, % 11.0 7.8
VFA, % 73.0 59.5
%Gmm @ Nini N/A N/A
Gmm 2.170 2.179
Gse 2.377 2.327
Pba, % 2.53 1.60
Pbe, % 5.0 3.9
UVCA, % N/A N/A
Crushed Faces 2+ /100 2+ /100
Fine Aggregate Angularity, % 46 41.7
Flat and Elongated, % N/A 0
Sand Equivalent 77 N/A
Gsb 2.246 N/A
Gsa 2.527 N/A
Absorption, % 5.05 N/A
Sieve Size
3/4" (19.0 mm) 100 100
1/2" (12.5 mm) 97 98
3/8" (9.5 mm) 82 86
# 4 (4.75 mm) 56 58
# 8 (2.36 mm) 37 37
# 16 (1.18 mm) 26 26
# 30 (600 µm) 18 19
# 50 (300 µm) 12 14
# 100 (150 µm) 7 9
#200 (75 µm) 5.1 6.4
* Average QA data listed for gradation and binder content due to highly absorptive aggregate
N/A - Data not available or not applicable
Mix Data
Aggregate Data
Gradation, (% Passing)
87
Oxford-Henderson Airport
The pavement examined at the Oxford-Henderson Airport actually contained two
different Superpave mixtures. The two mixtures were identified as 9.5mm A and 9.5mm
B. They were both 9.5 mm NMAS Superpave mixtures. The 9.5 mm A mixture was
designed at 50 gyrations and the 9.5 mm B HMA was designed at 75 gyrations. The
gradations for the two mixtures are very similar, but as expected, the optimum binder
content for the 75 gyration HMA is significantly less than the 50 gyration designed
HMA. After examination of the layout of the airport, it was determined that most of the
aircraft traveled over the 9.5 mm B HMA, so this was chosen as the mixture to be
studied.
The binder used in the HMA was a PG 64-22. This binder contained 0.75%
liquid anti-strip to combat moisture damage in the HMA. Fifteen percent reclaimed
asphalt pavement (RAP) was also used in the mixture. The aggregate was a granite
gneiss material from the Greystone Quarry in Henderson, NC owned by Vulcan Materials
Company. Table 20 reveals additional mix design and in-place data for the Oxford-
Henderson 9.5 mm B mix.

88
Table 20: Mix Design and In-Place Data for Oxford-Henderson Airport –Henderson, NC
JMF In-place
Superpave Gyrations 75 N/A
Binder Grade PG 64-22 PG 64-22
DSR, °C N/A 85.2
Brookfield, cP N/A 1,600
Absolute, P N/A 10,988
Tensile Strength, psi N/A 161.1
AC, % 5.8 5.9
VTM, % 4.0 7.4
VMA*, % 17.1 20.4
VEA, % 13.1 13.0
VFA, % 76.0 63.7
%Gmm @ Nini N/A N/A
Gmm 2.431 2.424
Gse 2.650 2.649
Pba, % -0.04 -0.06
Pbe, % 5.8 6.0
UVCA, % N/A N/A
Crushed Faces 1/100 2/100 1/100 2/100
Fine Aggregate Angularity, % 50.4 45.9
Flat and Elongated, % 1.4 1.3
Sand Equivalent 72.7 N/A
Gsb 2.653 N/A
Gsa 2.690 N/A
Absorption, % 0.52 N/A
Sieve Size
1/2" (12.5 mm) 99 100
3/8" (9.5 mm) 96 96
# 4 (4.75 mm) 74 71
# 8 (2.36 mm) 55 50
# 16 (1.18 mm) 43 38
# 30 (600 µm) 32 29
# 50 (300 µm) 21 21
# 100 (150 µm) 11 12
#200 (75 µm) 5.6 6.0
*In-Place VMA calculated using JMF Gsb
N/A - Data not available or not applicable
Mix Data
Aggregate Data
Gradation, % Passing
89
Military Airfields
Little Rock Air Force Base
The HMA on the assault strip at the Little Rock Air Force Base was designed
using 139 gyrations of the Superpave gyratory compactor. The pavement was placed in
1998 and the 139 gyrations matched a specification of 30 to 100 million equivalent single
axle loads (ESALs) at that time.
The HMA was a 12.5 mm NMAS mixture made of sandstone from the Cabot
Quarry in Cabot, AR currently owned by the Rogers Group and granite from the Granite
Mountain Quarries in Little Rock, AR. The binder used in this HMA was PG 70-22.
Additional mix design information is shown in Table 21. The data in Table 21 was taken
from the mix design information supplied by the 314th Civil Engineering Squadron based
at the Little Rock Air Force Base and from the in-place core testing.
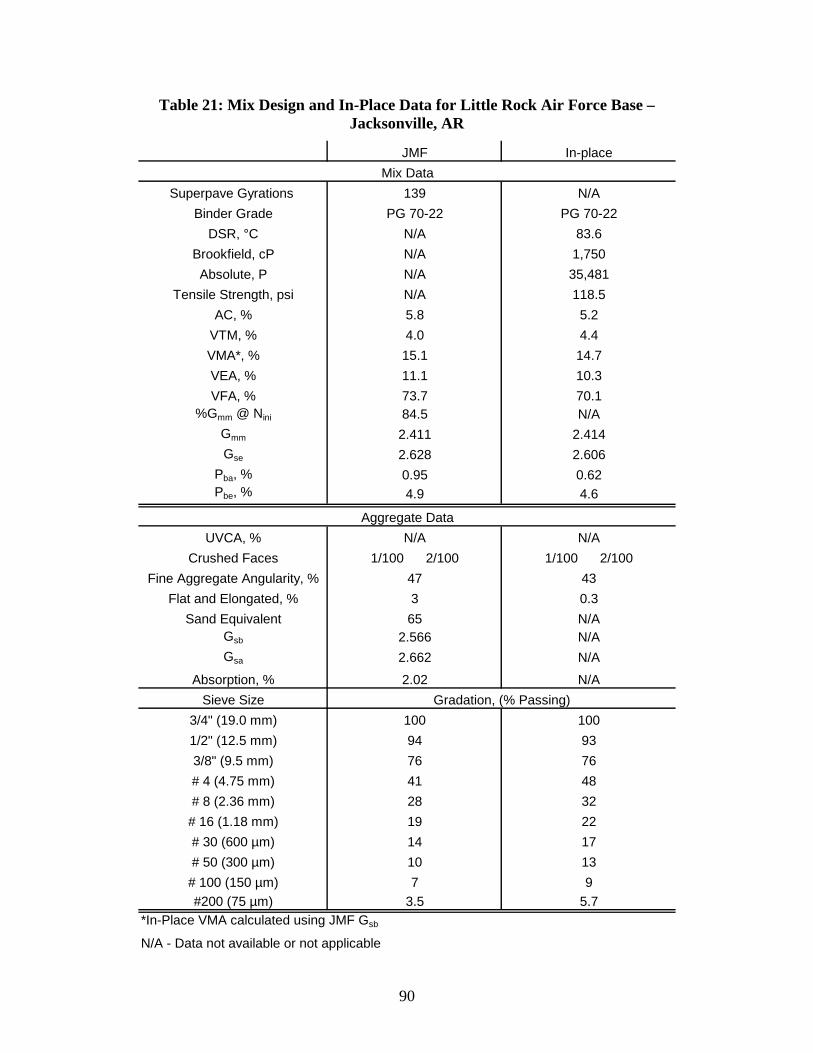
90
Table 21: Mix Design and In-Place Data for Little Rock Air Force Base –Jacksonville, AR
JMF In-place
Superpave Gyrations 139 N/A
Binder Grade PG 70-22 PG 70-22
DSR, °C N/A 83.6
Brookfield, cP N/A 1,750
Absolute, P N/A 35,481
Tensile Strength, psi N/A 118.5
AC, % 5.8 5.2
VTM, % 4.0 4.4
VMA*, % 15.1 14.7
VEA, % 11.1 10.3
VFA, % 73.7 70.1
%Gmm @ Nini 84.5 N/A
Gmm 2.411 2.414
Gse 2.628 2.606
Pba, % 0.95 0.62
Pbe, % 4.9 4.6
UVCA, % N/A N/A
Crushed Faces 1/100 2/100 1/100 2/100
Fine Aggregate Angularity, % 47 43
Flat and Elongated, % 3 0.3
Sand Equivalent 65 N/A
Gsb 2.566 N/A
Gsa 2.662 N/A
Absorption, % 2.02 N/A
Sieve Size
3/4" (19.0 mm) 100 100
1/2" (12.5 mm) 94 93
3/8" (9.5 mm) 76 76
# 4 (4.75 mm) 41 48
# 8 (2.36 mm) 28 32
# 16 (1.18 mm) 19 22
# 30 (600 µm) 14 17
# 50 (300 µm) 10 13
# 100 (150 µm) 7 9
#200 (75 µm) 3.5 5.7
*In-Place VMA calculated using JMF Gsb
N/A - Data not available or not applicable
Mix Data
Aggregate Data
Gradation, (% Passing)
91
Naval Air Station-Oceana
The HMA on the examined runway at Naval Air Station-Oceana was placed in
the year 2000. The HMA is a ¾ in. maximum aggregate size mixture. Under the
Superpave system the mixture would also be classified as a 19.0 mm NMAS. The
mixture was designed with 75 blows from a Marshall hammer and used a PG 70-22
binder. The granite aggregate used at NAS Oceana was supplied by the Vulcan Materials
Quarry in Skippers, VA. Twenty percent RAP and twenty percent natural sand were also
utilized in this mixture.
More information regarding the NAS-Oceana HMA can be found in Table 22.
The data in Table 22 was taken from the information supplied from the mix design by
Asphalt Roads and Material Co, Inc. and from the in-place core testing.
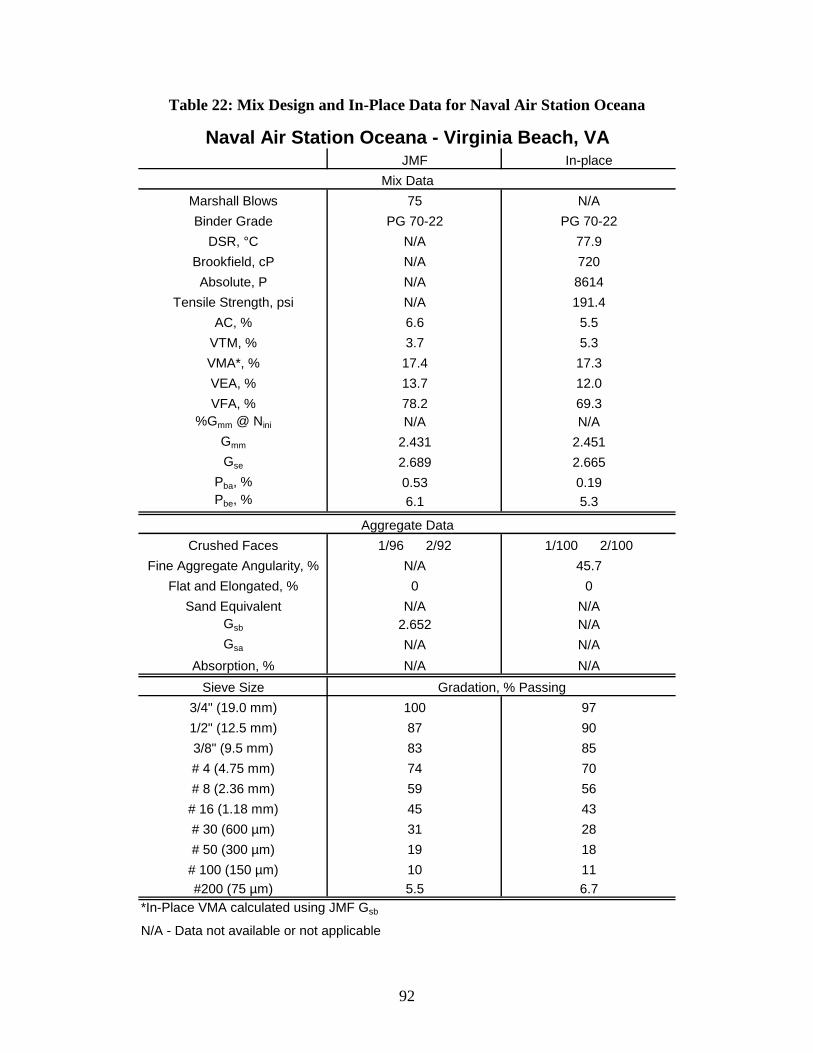
92
Table 22: Mix Design and In-Place Data for Naval Air Station Oceana
JMF In-place
Marshall Blows 75 N/A
Binder Grade PG 70-22 PG 70-22
DSR, °C N/A 77.9
Brookfield, cP N/A 720
Absolute, P N/A 8614
Tensile Strength, psi N/A 191.4
AC, % 6.6 5.5
VTM, % 3.7 5.3
VMA*, % 17.4 17.3
VEA, % 13.7 12.0
VFA, % 78.2 69.3
%Gmm @ Nini N/A N/A
Gmm 2.431 2.451
Gse 2.689 2.665
Pba, % 0.53 0.19
Pbe, % 6.1 5.3
Crushed Faces 1/96 2/92 1/100 2/100
Fine Aggregate Angularity, % N/A 45.7
Flat and Elongated, % 0 0
Sand Equivalent N/A N/A
Gsb 2.652 N/A
Gsa N/A N/A
Absorption, % N/A N/A
Sieve Size
3/4" (19.0 mm) 100 97
1/2" (12.5 mm) 87 90
3/8" (9.5 mm) 83 85
# 4 (4.75 mm) 74 70
# 8 (2.36 mm) 59 56
# 16 (1.18 mm) 45 43
# 30 (600 µm) 31 28
# 50 (300 µm) 19 18
# 100 (150 µm) 10 11
#200 (75 µm) 5.5 6.7
*In-Place VMA calculated using JMF Gsb
N/A - Data not available or not applicable
Naval Air Station Oceana - Virginia Beach, VA
Mix Data
Aggregate Data
Gradation, % Passing
93
Volk Field
The Volk Field mixture is a ¾ in. maximum aggregate size mixture or 12.5 mm
NMAS in the Superpave system. The HMA was designed to meet the specified criteria
of a 109 gyration Superpave mixture; however, a mirror 75 blow Marshall mixture was
also designed at the same binder content. The only difference in the two mixtures was
the compactive equipment, effort and the resulting lab volumetrics.
This was the first Superpave mixture placed on an airfield in the state of
Wisconsin. Performing both the Marshall and the Superpave designs gave a level of
confidence in the performance of the mixture. The acceptable range of VTM used for the
Marshall designed mixtures was 3 to 4 percent. For the Superpave mixtures the VTM
range was 2.5 to 3.5 percent.
The binder used for this mixture was a PG 64-28. Limestone aggregate from the
Moser quarry was used with fifteen percent blend sand from the Frozene Pit. More
information on the mixtures at Volk field can be found in Table 23. The data in Table 23
was taken from the mix design information supplied by Mathy Construction Company
and from the in-place core testing.
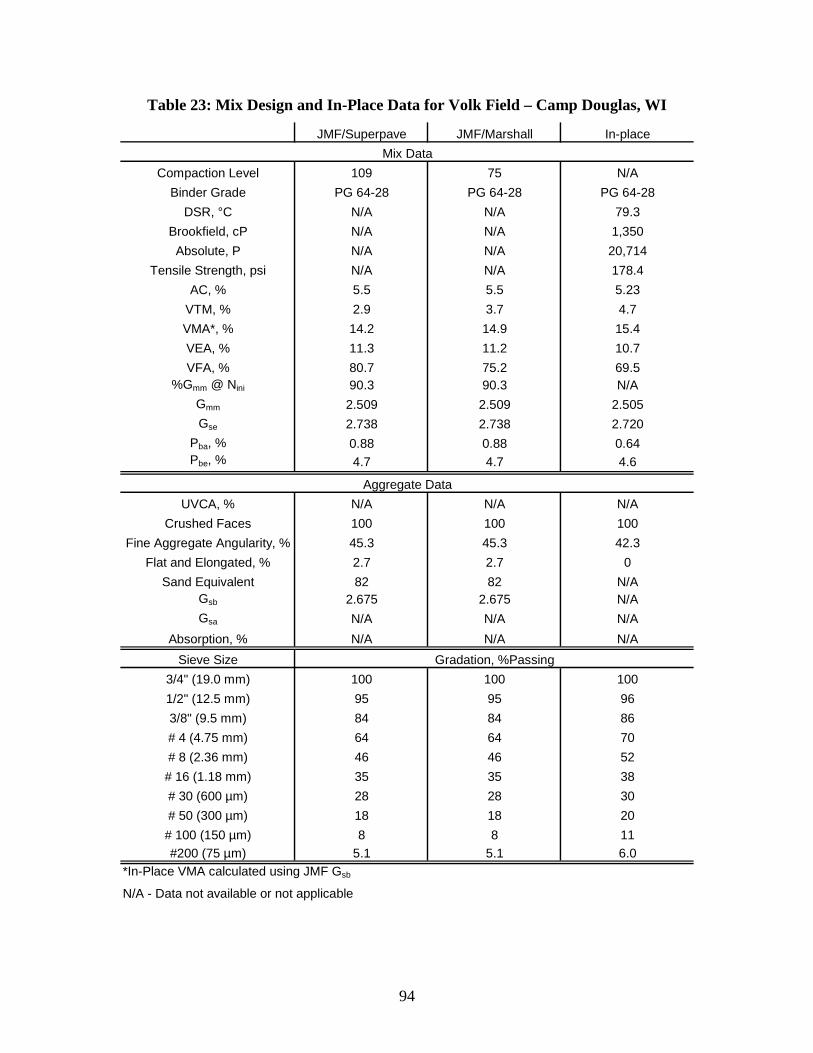
94
Table 23: Mix Design and In-Place Data for Volk Field – Camp Douglas, WI
JMF/Superpave JMF/Marshall In-place
Compaction Level 109 75 N/A
Binder Grade PG 64-28 PG 64-28 PG 64-28
DSR, °C N/A N/A 79.3
Brookfield, cP N/A N/A 1,350
Absolute, P N/A N/A 20,714
Tensile Strength, psi N/A N/A 178.4
AC, % 5.5 5.5 5.23
VTM, % 2.9 3.7 4.7
VMA*, % 14.2 14.9 15.4
VEA, % 11.3 11.2 10.7
VFA, % 80.7 75.2 69.5
%Gmm @ Nini 90.3 90.3 N/A
Gmm 2.509 2.509 2.505
Gse 2.738 2.738 2.720
Pba, % 0.88 0.88 0.64
Pbe, % 4.7 4.7 4.6
UVCA, % N/A N/A N/A
Crushed Faces 100 100 100
Fine Aggregate Angularity, % 45.3 45.3 42.3
Flat and Elongated, % 2.7 2.7 0
Sand Equivalent 82 82 N/A
Gsb 2.675 2.675 N/A
Gsa N/A N/A N/A
Absorption, % N/A N/A N/A
Sieve Size
3/4" (19.0 mm) 100 100 100
1/2" (12.5 mm) 95 95 96
3/8" (9.5 mm) 84 84 86
# 4 (4.75 mm) 64 64 70
# 8 (2.36 mm) 46 46 52
# 16 (1.18 mm) 35 35 38
# 30 (600 µm) 28 28 30
# 50 (300 µm) 18 18 20
# 100 (150 µm) 8 8 11
#200 (75 µm) 5.1 5.1 6.0
*In-Place VMA calculated using JMF Gsb
N/A - Data not available or not applicable
Mix Data
Aggregate Data
Gradation, %Passing
95
Jackson-Evers International Airport
The pavement examined at the Jackson International Airport was a 19.0 mm
maximum aggregate size mixture designed with 75 blows from the Marshall hammer.
The pavement was placed in 1996. The binder used was a viscosity graded AC-30. The
aggregate was eighty percent limestone and twenty percent natural sand.
Some difficulty was encountered when trying to match the in-place gradation to
the mix design gradation. To the best of the knowledge of everyone involved in the
paving project that could be located the correct mix design was obtained. The in-place
VMA and VTM are all a little low with the main difference being the bulk specific
gravity of the aggregate. Given these differences it was decided to utilize the gradation
of the in-place samples. This data and more can be found in Table 24. The data in Table
24 was taken from the mix design information supplied by Superior Asphalt Inc. and
from the in-place core testing.
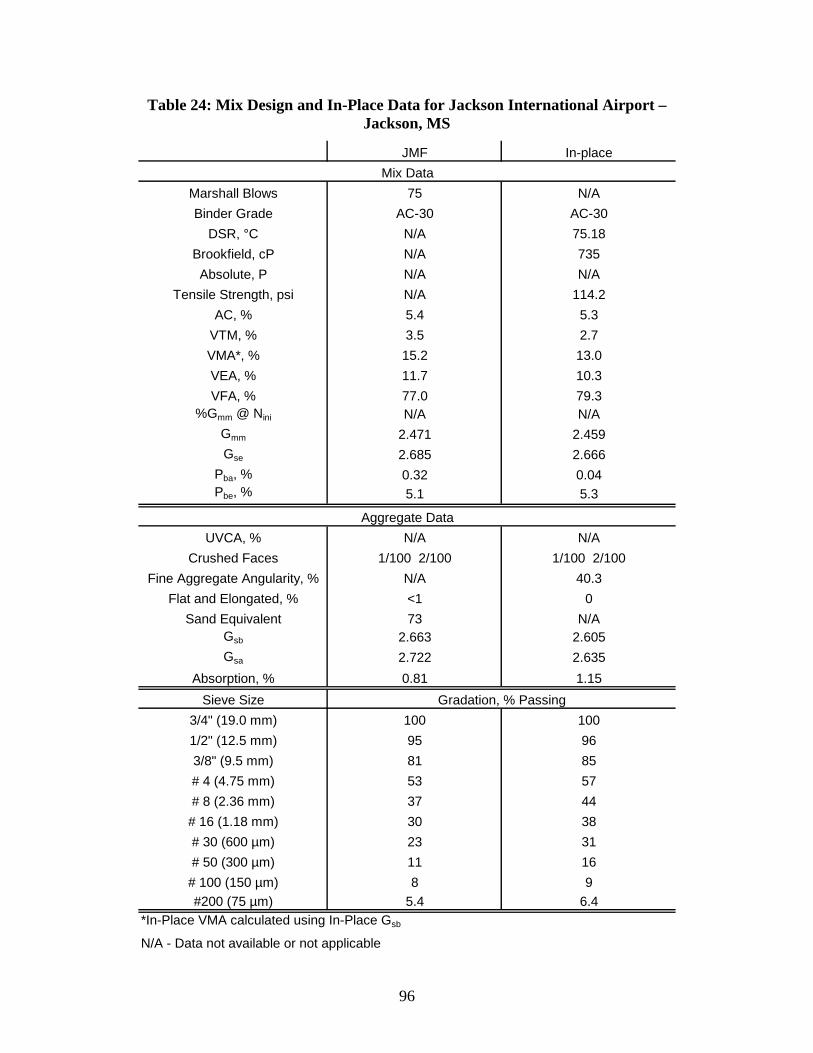
96
Table 24: Mix Design and In-Place Data for Jackson International Airport –Jackson, MS
JMF In-place
Marshall Blows 75 N/A
Binder Grade AC-30 AC-30
DSR, °C N/A 75.18
Brookfield, cP N/A 735
Absolute, P N/A N/A
Tensile Strength, psi N/A 114.2
AC, % 5.4 5.3
VTM, % 3.5 2.7
VMA*, % 15.2 13.0
VEA, % 11.7 10.3
VFA, % 77.0 79.3
%Gmm @ Nini N/A N/A
Gmm 2.471 2.459
Gse 2.685 2.666
Pba, % 0.32 0.04
Pbe, % 5.1 5.3
UVCA, % N/A N/A
Crushed Faces 1/100 2/100 1/100 2/100
Fine Aggregate Angularity, % N/A 40.3
Flat and Elongated, % <1 0
Sand Equivalent 73 N/A
Gsb 2.663 2.605
Gsa 2.722 2.635
Absorption, % 0.81 1.15
Sieve Size
3/4" (19.0 mm) 100 100
1/2" (12.5 mm) 95 96
3/8" (9.5 mm) 81 85
# 4 (4.75 mm) 53 57
# 8 (2.36 mm) 37 44
# 16 (1.18 mm) 30 38
# 30 (600 µm) 23 31
# 50 (300 µm) 11 16
# 100 (150 µm) 8 9
#200 (75 µm) 5.4 6.4
*In-Place VMA calculated using In-Place Gsb
N/A - Data not available or not applicable
Mix Data
Aggregate Data
Gradation, % Passing
97
Newark Liberty International Airport
The shoulder pavement examined at the Newark Liberty International Airport was
a ¾ in. maximum aggregate size mixture designed with 75 blows from the Marshall
hammer. Under the Superpave nomenclature, the mixture would be a 12.5 mm NMAS.
The runway and shoulder were paved in 1999. The mixture on the shoulder used a PG
64-22 binder and granite gneiss aggregate.
Additional mix design information can be found in Table 25. The data in Table
25 was taken from the mix design information supplied by The Port Authority of New
York and New Jersey and from the in-place core testing.
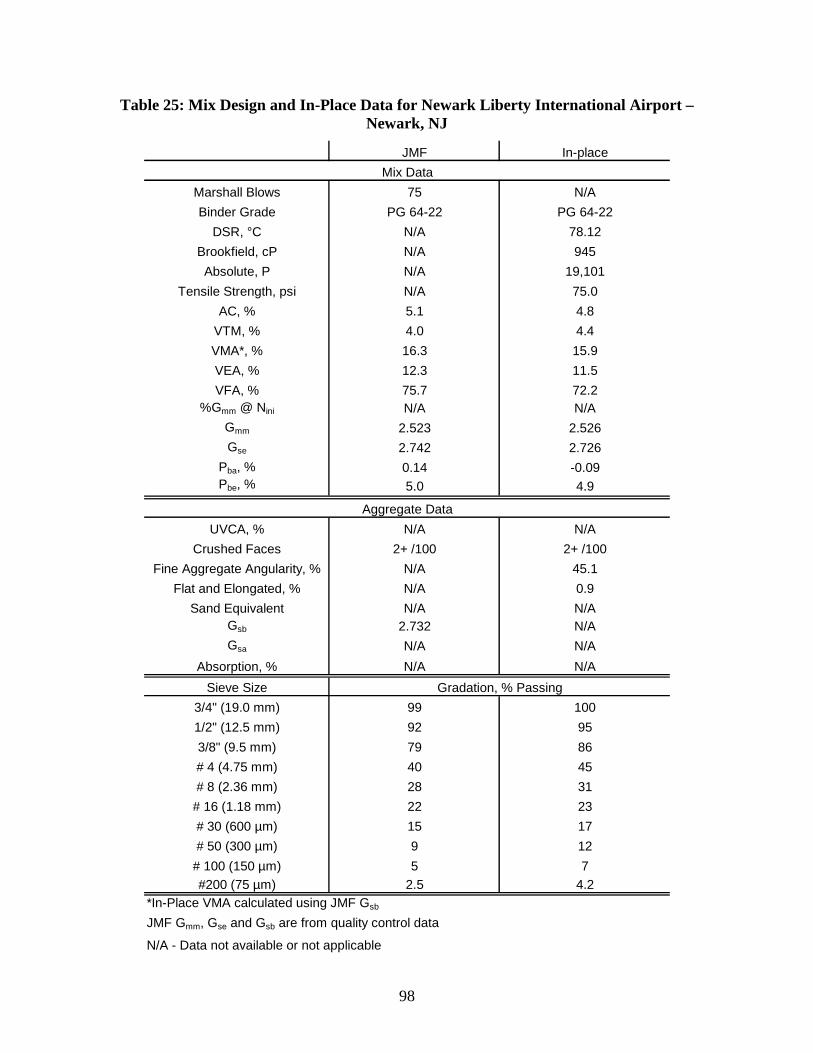
98
Table 25: Mix Design and In-Place Data for Newark Liberty International Airport –Newark, NJ
JMF In-place
Marshall Blows 75 N/A
Binder Grade PG 64-22 PG 64-22
DSR, °C N/A 78.12
Brookfield, cP N/A 945
Absolute, P N/A 19,101
Tensile Strength, psi N/A 75.0
AC, % 5.1 4.8
VTM, % 4.0 4.4
VMA*, % 16.3 15.9
VEA, % 12.3 11.5
VFA, % 75.7 72.2
%Gmm @ Nini N/A N/A
Gmm 2.523 2.526
Gse 2.742 2.726
Pba, % 0.14 -0.09
Pbe, % 5.0 4.9
UVCA, % N/A N/A
Crushed Faces 2+ /100 2+ /100
Fine Aggregate Angularity, % N/A 45.1
Flat and Elongated, % N/A 0.9
Sand Equivalent N/A N/A
Gsb 2.732 N/A
Gsa N/A N/A
Absorption, % N/A N/A
Sieve Size
3/4" (19.0 mm) 99 100
1/2" (12.5 mm) 92 95
3/8" (9.5 mm) 79 86
# 4 (4.75 mm) 40 45
# 8 (2.36 mm) 28 31
# 16 (1.18 mm) 22 23
# 30 (600 µm) 15 17
# 50 (300 µm) 9 12
# 100 (150 µm) 5 7
#200 (75 µm) 2.5 4.2
*In-Place VMA calculated using JMF Gsb
JMF Gmm, Gse and Gsb are from quality control data
N/A - Data not available or not applicable
Mix Data
Aggregate Data
Gradation, % Passing
99
Palm Springs International Airport
The HMA layer examined at the Palm Springs International Airport was a 25.0
mm maximum aggregate size mixture designed with 75 blows from the Marshall
hammer. This layer was topped with a ¾ inch layer of permeable friction course HMA.
A granite aggregate was used for the mixture from Granite Construction’s Indio Quarry
in Indio, CA. The asphalt binder used was an AC-20P which was used because of
previous experience with the binder. The AC-20P is comprised of an AC-7.5 that is
modified to meet the criteria of an AC-20. Under the Superpave system the NMAS
would be considered a 19.0 mm NMAS and the AC-20P would probably grade as a PG
58-XX. It is interesting that the binder would likely grade so low given the average
temperature at the airport is 89°F and LTPPBind would recommend a minimum PG
graded asphalt of 76-XX. Intuitively, one would think that the lower grade of binder
would cause significant rutting; however, this is not the case. The airport engineer at the
time of paving indicated that the binder was chosen because of previous good experience.
No rutting was noted during the visit to the airport. This AC-20P asphalt was chosen
because of past success on airfield using this binder. Most of the traffic at the Palm
Springs International Airport occurs during the winter and spring months at the height of
the tourist season for the area. More information regarding the Palm Springs
International Airport is given in Table 26.
The column labeled “JMF” in Tables 26 is data that was taken directly from the
job mix formula worksheet supplied by the Granite Construction Company. The column
labeled in-place is the properties measure from the core samples taken from the examined

100
pavement at Palm Springs. The in-place data was used for comparisons in this paper
because it is the mixture that has performed in the field.
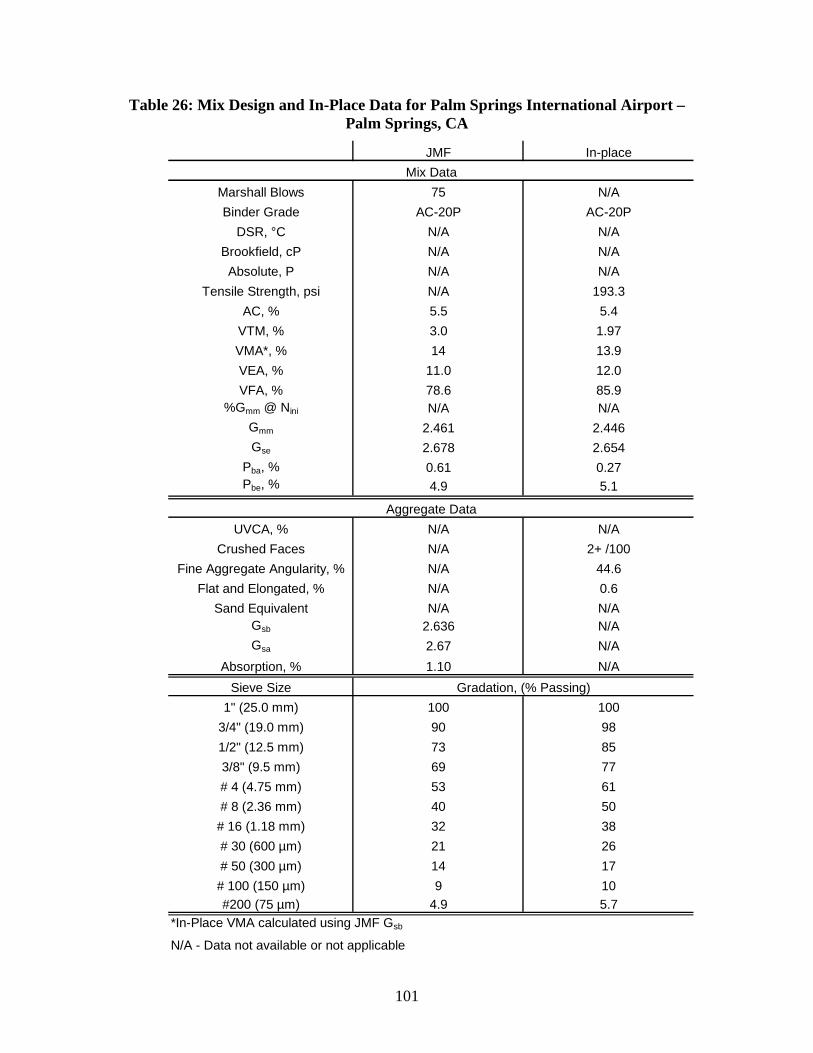
101
Table 26: Mix Design and In-Place Data for Palm Springs International Airport –Palm Springs, CA
JMF In-place
Marshall Blows 75 N/A
Binder Grade AC-20P AC-20P
DSR, °C N/A N/A
Brookfield, cP N/A N/A
Absolute, P N/A N/A
Tensile Strength, psi N/A 193.3
AC, % 5.5 5.4
VTM, % 3.0 1.97
VMA*, % 14 13.9
VEA, % 11.0 12.0
VFA, % 78.6 85.9
%Gmm @ Nini N/A N/A
Gmm 2.461 2.446
Gse 2.678 2.654
Pba, % 0.61 0.27
Pbe, % 4.9 5.1
UVCA, % N/A N/A
Crushed Faces N/A 2+ /100
Fine Aggregate Angularity, % N/A 44.6
Flat and Elongated, % N/A 0.6
Sand Equivalent N/A N/A
Gsb 2.636 N/A
Gsa 2.67 N/A
Absorption, % 1.10 N/A
Sieve Size
1" (25.0 mm) 100 100
3/4" (19.0 mm) 90 98
1/2" (12.5 mm) 73 85
3/8" (9.5 mm) 69 77
# 4 (4.75 mm) 53 61
# 8 (2.36 mm) 40 50
# 16 (1.18 mm) 32 38
# 30 (600 µm) 21 26
# 50 (300 µm) 14 17
# 100 (150 µm) 9 10
#200 (75 µm) 4.9 5.7
*In-Place VMA calculated using JMF Gsb
N/A - Data not available or not applicable
Mix Data
Aggregate Data
Gradation, (% Passing)
102
Spokane International Airport
The main parallel taxiway (Taxiway Alpha) was examined at the Spokane
International Airport. The mixture used was a ¾ in. maximum aggregate size or 12.5 mm
NMAS mixture. The HMA was designed with 75 blows from a Marshall hammer. The
aggregate was obtained from Pit C-318 and included 13 percent natural sand. The binder
used was an AR-4000W supplied by Koch Asphalt from the Spokane, Washington plant.
This would likely grade as a PG 64-22 binder under the Superpave system.
More information regarding the Spokane International Airport is given in Table
27. The column labeled “JMF” is the data that was taken directly from the job mix
formula worksheet supplied by Inland Asphalt Company. The column labeled in-place is
the properties measure from the core samples taken from the examined pavement at
Spokane.

103
Table 27: Mix Design and In-Place Data for Spokane International Airport -Spokane, WA
JMF In-place
Marshall Blows 75 N/A
Binder Grade AR-4000W AR-4000W
DSR, °C N/A 75.1
Brookfield, cP N/A 695
Absolute, P N/A 2,910
Tensile Strength, psi N/A 210.3
AC, % 6.3 5.3
VTM, % 4.0 1.9
VMA*, % 16.0 12.3
VEA, % 12.0 10.4
VFA, % 78 84.6
%Gmm @ Nini N/A N/A
Gmm** 2.524 2.526
Gse 2.797 2.749
Pba, % 1.65 1.01
Pbe, % 4.8 4.3
UVCA, % N/A N/A
Crushed Faces 1/96 2/92 1/100 2/100
Fine Aggregate Angularity, % N/A 45.5
Flat and Elongated, % 3 0
Sand Equivalent N/A N/A
Gsb 2.677 N/A
Gsa 2.870 N/A
Absorption, % 2.51 N/A
Sieve Size
3/4" (19.0 mm) 100.0 100
1/2" (12.5 mm) 95.2 97
3/8" (9.5 mm) 85.2 89
# 4 (4.75 mm) 57.1 62
# 8 (2.36 mm) 40.7 46
# 16 (1.18 mm) 27.6 31
# 30 (600 µm) 16.8 20
# 50 (300 µm) 12.2 16
# 100 (150 µm) 8.0 11
#200 (75 µm) 6.0 8.8
*In-Place VMA calculated using JMF Gsb
N/A - Data not available or not applicable
Mix Data
Aggregate Data
Gradation, % Passing
104
Ancillary Mixtures
Four other airfield mixtures were utilized for various purposes within the research
project. The following sections briefly describe these mixes.
John Bell Williams Airport
John Bell Williams was a 75 blow Marshall design HMA mixture that was used
as a shadow specification project. It was a 19.0 mm NMAS mixture utilizing 71 percent
crushed gravel, 11 percent natural sand and 18 percent limestone. Mix design
information for John Bell Williams is shown in Table 28.
Mid-Delta Regional Airport
The 75 blow Marshall designed HMA used at Mid-Delta Regional Airport in
Greenville, MS was used to examine permeability of HMA. This mixture was a 12.5 mm
NMAS that was comprised of 57 percent crushed gravel, 32 percent limestone, 10
percent natural sand and 1 percent hydrated lime. Mix design information for the Mid-
Delta Regional Airport is shown in Table 29.
Portland International Airport
The 100 gyration Superpave designed mixture placed at the Portland International
Airport was utilized as a shadow specification project. The mixture was a 19.0 mm
NMAS mixture. Mix design information for the Portland International Airport is shown
in Table 30.

105
Table 28: Mix Design Data for John Bell Williams Airport – Bolton, MS
JMF
Marshall Blows 75
Binder Grade PG 67-22
AC, % 5.4
VTM, % 3.6
VMA, % 15.2
VEA, % 11.6
VFA, % 76.3
Gmm 2.366
Gse 2.555
Pba, % 0.16
Pbe, % 5.2
Crushed Faces 2+ /100
Fine Aggregate Angularity, % 46.4
Flat and Elongated, % <1
Sand Equivalent 58
Gsb 2.545
Gsa 2.648
Absorption, % 1.53
Sieve Size Gradation, % Passing
3/4" (19.0 mm) 100
1/2" (12.5 mm) 87
3/8" (9.5 mm) 76
# 4 (4.75 mm) 52
# 8 (2.36 mm) 34
# 16 (1.18 mm) 23
# 30 (600 µm) 17
# 50 (300 µm) 10
# 100 (150 µm) 6
#200 (75 µm) 4.3
Mix Data
Aggregate Data
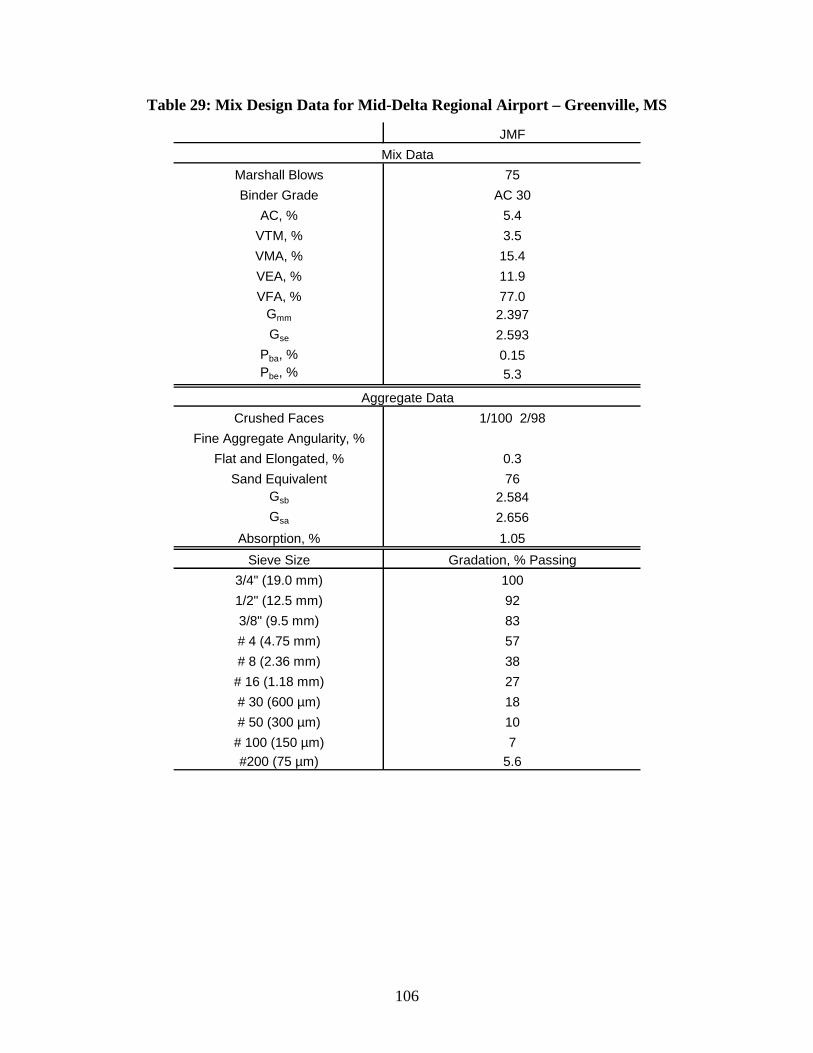
106
Table 29: Mix Design Data for Mid-Delta Regional Airport – Greenville, MS
JMF
Marshall Blows 75
Binder Grade AC 30
AC, % 5.4
VTM, % 3.5
VMA, % 15.4
VEA, % 11.9
VFA, % 77.0
Gmm 2.397
Gse 2.593
Pba, % 0.15
Pbe, % 5.3
Crushed Faces 1/100 2/98
Fine Aggregate Angularity, %
Flat and Elongated, % 0.3
Sand Equivalent 76
Gsb 2.584
Gsa 2.656
Absorption, % 1.05
Sieve Size Gradation, % Passing
3/4" (19.0 mm) 100
1/2" (12.5 mm) 92
3/8" (9.5 mm) 83
# 4 (4.75 mm) 57
# 8 (2.36 mm) 38
# 16 (1.18 mm) 27
# 30 (600 µm) 18
# 50 (300 µm) 10
# 100 (150 µm) 7
#200 (75 µm) 5.6
Mix Data
Aggregate Data
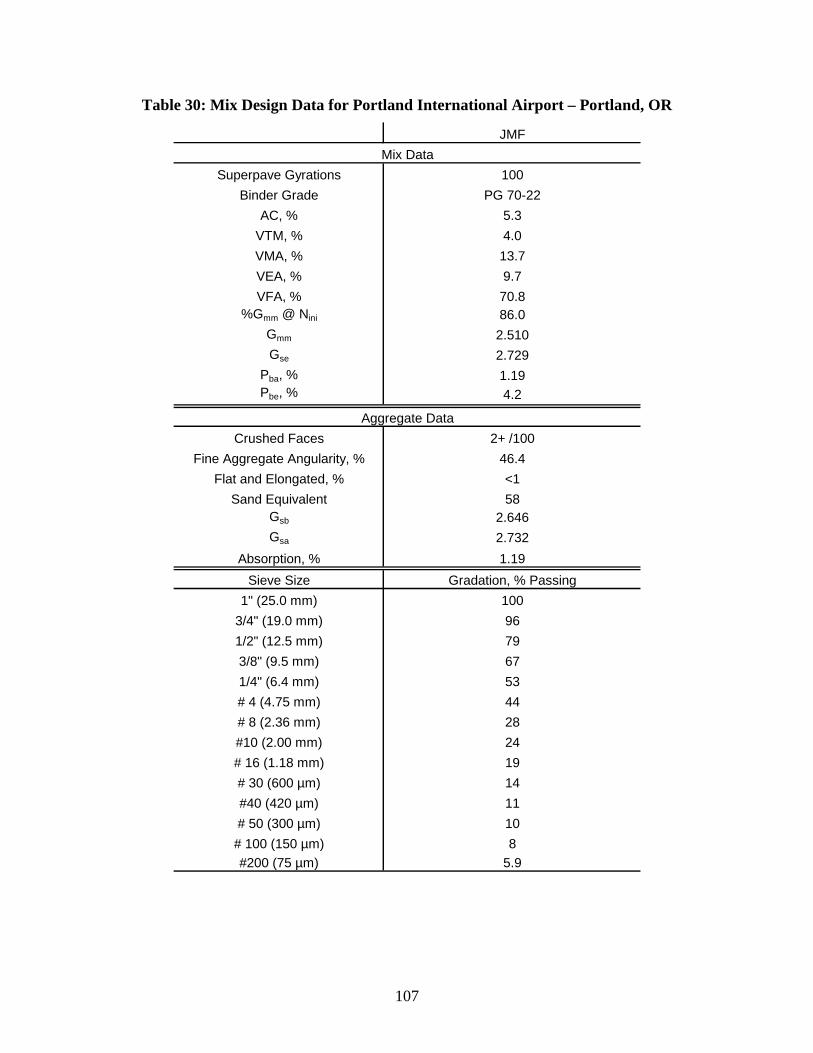
107
Table 30: Mix Design Data for Portland International Airport – Portland, OR
JMF
Superpave Gyrations 100
Binder Grade PG 70-22
AC, % 5.3
VTM, % 4.0
VMA, % 13.7
VEA, % 9.7
VFA, % 70.8
%Gmm @ Nini 86.0
Gmm 2.510
Gse 2.729
Pba, % 1.19
Pbe, % 4.2
Crushed Faces 2+ /100
Fine Aggregate Angularity, % 46.4
Flat and Elongated, % <1
Sand Equivalent 58
Gsb 2.646
Gsa 2.732
Absorption, % 1.19
Sieve Size Gradation, % Passing
1" (25.0 mm) 100
3/4" (19.0 mm) 96
1/2" (12.5 mm) 79
3/8" (9.5 mm) 67
1/4" (6.4 mm) 53
# 4 (4.75 mm) 44
# 8 (2.36 mm) 28
#10 (2.00 mm) 24
# 16 (1.18 mm) 19
# 30 (600 µm) 14
#40 (420 µm) 11
# 50 (300 µm) 10
# 100 (150 µm) 8
#200 (75 µm) 5.9
Mix Data
Aggregate Data
108
CHAPTER 6Test Results and Analysis
As stated in the objectives, the purpose of this research project was to adapt the
Superpave gyratory compactor procedures for use on airfields. This Chapter discusses
test results and analyses conducted in order to accomplish the project objectives.
As discussed in Chapter 3, the Superpave mix design system includes four
primary steps: 1) materials selection; 2) selection of design aggregate gradations; 3)
selection of optimum asphalt binder content; and 4) performance testing. Each of these
steps is equally important to the overall mix design system; however, likely the most
critical parameter needed to successfully implement a Superpave mix design system for
airfield HMA pavements is the design compactive effort. The design compactive effort,
or design number of gyrations, will have a direct impact on the volumetric properties of
the designed mix. The volumetric properties, combined with the design compactive
effort, will be related to the materials allowed within the mix (materials selection). All of
these factors will have an effect on selection of a mix with acceptable properties. The
following sections describe the test results and analyses conducted to develop a
Superpave mix design system for airfield HMA.
SELECTION OF DESIGN COMPACTIVE EFFORT
With the data collected during this project, the researchers investigated three
different methods for selecting the appropriate design compactive effort with the
Superpave gyratory compactor. The first method entailed evaluating in-place densities in
a manner utilized by researchers during the development of the Marshall mix design
procedure for airfields (1). The second method involved comparisons in the bulk specific
109
gravity values of HMA mixes compacted utilizing both the Marshall hammer and
Superpave gyratory compactor. The final method for determining the appropriate design
compactive effort when using the Superpave gyratory compactor entailed evaluating the
results of performance testing. The goal of the performance testing was to determine the
asphalt binder content at which the airfield mixes began to exhibit permanent
deformation tendencies.
During the original research that selected the Marshall method of mix design for
airfields, one criterion utilized in the selection of 50 blows per face as the design
compactive effort was the density of the pavement after traffic. The following describes
one of the philosophies for selecting the design laboratory compactive effort during the
original Marshall research conducted for airfield HMA design (1):
”The original procedure for compacting laboratory specimens for the Marshall
stability test … had produced densities that were comparable to those obtained in
the construction of pavements on the airfields investigated … However, during
tracking operations on the asphalt test section, it became apparent, from results
of tests on cored samples, that compaction of the pavement was taking place
under the traffic applied. The increased density of the pavement also reduced the
void space and allowed the asphalt to fill the available voids completely. In the
event the pavements contained sufficient asphalt to overfill the voids when the
density is increased by traffic, the pavements would flush and may become
unstable … it was decided to investigate the possibility of increasing the
(laboratory) compactive effort in the Marshall test to obtain densities
approximating those attained under a moderate amount of traffic, such that the
110
lower optimum asphalt content would provide a pavement which would not have
excess asphalt.”
A simple method of evaluating the various design compactive efforts utilized for
the HMA at the ten airfields would be to evaluate the ultimate densities at the time of the
field investigations, similar to that described above. The term “ultimate density”
indicates the in-place density of the pavement after years of trafficking. In-place
densities that remained low would indicate that the in-place asphalt binder content was
too low, while very high in-place densities would indicate that the in-place asphalt binder
content was too high.
In order to evaluate the data from the various airfields, the in-place density was
determined for each core that was obtained. In-place density was determined by first
determining the bulk specific gravity of each core. Next, the respective cores from each
airfield were combined and used to determine the theoretical maximum specific gravity.
Finally, the bulk specific gravity of each individual core and the combined theoretical
maximum specific gravity for the airfield were used to calculate a percent theoretical
maximum specific gravity (or percent density) of each core.
In order to present this data, the in-place densities were divided into two data sets:
one for airfields using HMA designed using the Marshall hammer and one for airfields
using HMA designed with the SGC. These two data sets are illustrated in Figures 38 and
39, respectively. Also included on these figures are the respective design compactive
efforts, age of HMA evaluated and performance at the time of our field evaluation.
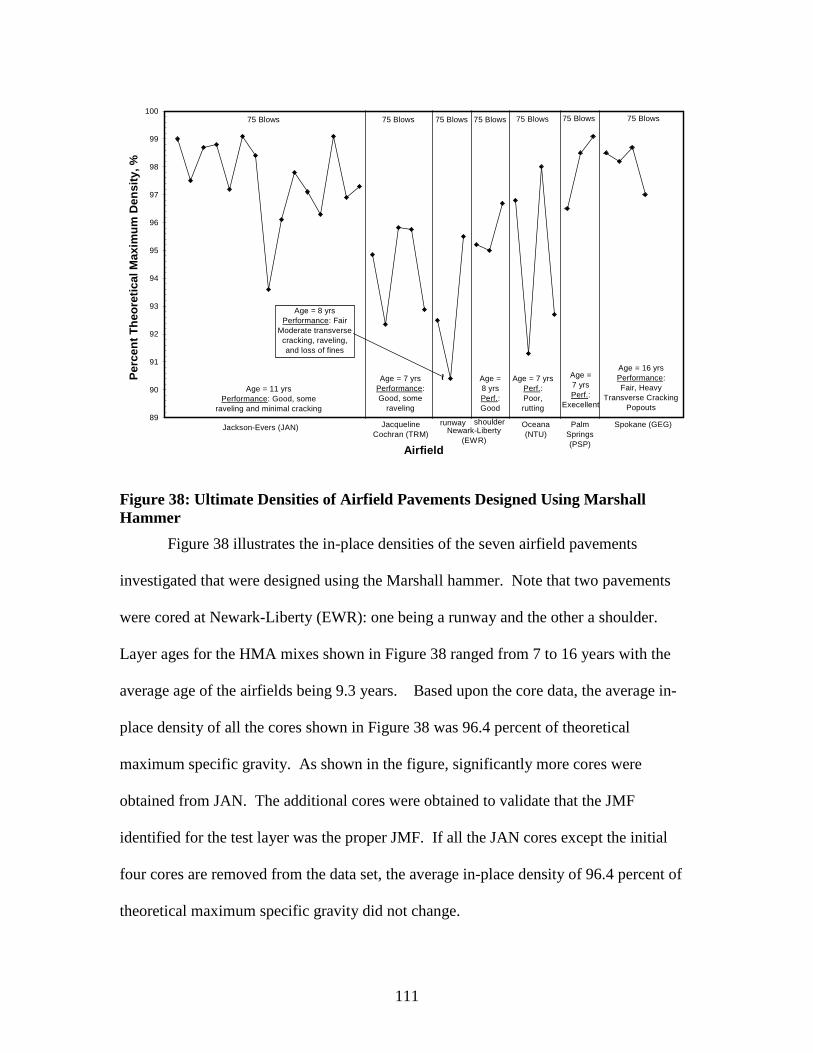
111
89
90
91
92
93
94
95
96
97
98
99
100
Airfield
Perc
en
tT
heo
reti
calM
axim
um
Den
sit
y,%
Jackson-Evers (JAN) Jacqueline
Cochran (TRM)
Oceana
(NTU)Newark-Liberty
(EWR)
Palm
Springs
(PSP)
runway shoulder Spokane (GEG)
75 Blows 75 Blows 75 Blows 75 Blows 75 Blows 75 Blows 75 Blows
Age = 7 yrs
Performance:
Good, some
raveling
Age = 11 yrs
Performance: Good, some
raveling and minimal cracking
Age = 8 yrs
Performance: Fair
Moderate transverse
cracking, raveling,
and loss of fines
Age =
8 yrs
Perf.:
Good
Age = 7 yrs
Perf.:
Poor,
rutting
Age =
7 yrs
Perf.:
Execellent
Age = 16 yrs
Performance:
Fair, Heavy
Transverse Cracking
Popouts
~
Figure 38: Ultimate Densities of Airfield Pavements Designed Using MarshallHammer
Figure 38 illustrates the in-place densities of the seven airfield pavements
investigated that were designed using the Marshall hammer. Note that two pavements
were cored at Newark-Liberty (EWR): one being a runway and the other a shoulder.
Layer ages for the HMA mixes shown in Figure 38 ranged from 7 to 16 years with the
average age of the airfields being 9.3 years. Based upon the core data, the average in-
place density of all the cores shown in Figure 38 was 96.4 percent of theoretical
maximum specific gravity. As shown in the figure, significantly more cores were
obtained from JAN. The additional cores were obtained to validate that the JMF
identified for the test layer was the proper JMF. If all the JAN cores except the initial
four cores are removed from the data set, the average in-place density of 96.4 percent of
theoretical maximum specific gravity did not change.
112
The performance of the different HMA layers ranged from poor to good. Of the
seven pavements, four were categorized as performing good or excellent. For these four
pavements, the average in-place density of the pavement was 96.8 percent of theoretical
maximum specific gravity. This in-place density corresponds to an average in-place air
void content of 3.2 percent which is representative of a typical design air void content
when conducting mix designs in accordance with the Marshall method for airfields. This
would indicate that the 75 blows per face were appropriate for these pavements.
Figure 38 also shows that three pavements were categorized as having poor or fair
performance. The average in-place density for these three pavements was 95.4 percent of
theoretical maximum specific gravity. However, of the three categorized as having poor
or fair performance, the HMA pavement at Spokane (GEG) was 16 years old. Being this
old it is obvious that the pavement had adequately performed its intended purpose. If this
pavement is removed from the poor/fair data set, the average in-place density of the
remaining two pavements would be 93.9 percent of theoretical maximum density. This
in-place density constitutes an average in-place air void content of 6.1 percent. Of the
two fair/poor airfield pavements (runway at Newark-Liberty and Oceana NAS), the
modes of distress were different. At Newark-Liberty (EWR), the primary mode of
distress was cracking and raveling while at Oceana NAS (NTU) the primary mode of
distress was rutting. It is not known whether the poor/fair performance of these two
pavements is related to materials selection, mix design, and/or construction; however, the
in-place density data does suggest a clear difference between the pavements that have
performed and those that have not. The average in-place density for those pavements that
are performing good was 96.8 percent while those that performed poor/fair was 93.8
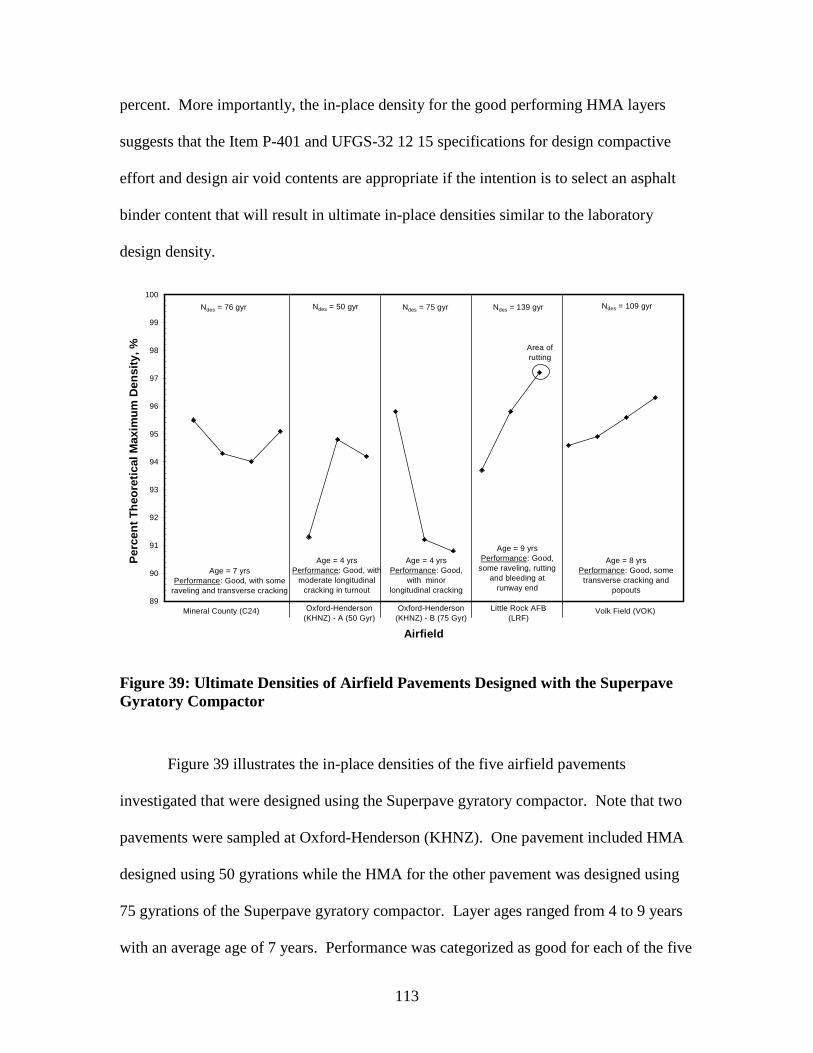
113
percent. More importantly, the in-place density for the good performing HMA layers
suggests that the Item P-401 and UFGS-32 12 15 specifications for design compactive
effort and design air void contents are appropriate if the intention is to select an asphalt
binder content that will result in ultimate in-place densities similar to the laboratory
design density.
89
90
91
92
93
94
95
96
97
98
99
100
Airfield
Perc
en
tT
heo
reti
calM
axim
um
Den
sit
y,%
Mineral County (C24) Oxford-Henderson
(KHNZ) - A (50 Gyr)
Oxford-Henderson
(KHNZ) - B (75 Gyr)
Little Rock AFB
(LRF)Volk Field (VOK)
Ndes = 76 gyr Ndes = 50 gyr Ndes = 75 gyr Ndes = 139 gyr Ndes = 109 gyr
Age = 7 yrs
Performance: Good, with some
raveling and transverse cracking
Age = 4 yrs
Performance: Good, with
moderate longitudinal
cracking in turnout
Age = 4 yrs
Performance: Good,
with minor
longitudinal cracking
Age = 9 yrs
Performance: Good,
some raveling, rutting
and bleeding at
runway end
Age = 8 yrs
Performance: Good, some
transverse cracking and
popouts
Area of
rutting
Figure 39: Ultimate Densities of Airfield Pavements Designed with the SuperpaveGyratory Compactor
Figure 39 illustrates the in-place densities of the five airfield pavements
investigated that were designed using the Superpave gyratory compactor. Note that two
pavements were sampled at Oxford-Henderson (KHNZ). One pavement included HMA
designed using 50 gyrations while the HMA for the other pavement was designed using
75 gyrations of the Superpave gyratory compactor. Layer ages ranged from 4 to 9 years
with an average age of 7 years. Performance was categorized as good for each of the five
114
pavement layers. The average in-place density for all of the cores obtained from the
layers was 94.4 percent of theoretical maximum specific gravity, or 5.6 percent air voids.
This average air void content is 2 percent higher than the overall average observed for the
Marshall hammer designed HMA layers. Only one of the seventeen cores depicted in
Figure 39 had an in-place density equal to or above the 96.4 percent of theoretical
maximum specific gravity average found in the cores obtained in pavements designed
using the Marshall hammer. Though different design gyration levels were utilized for the
different HMA mixes, the data suggests that the design compactive efforts utilized were
too high.
The above discussion on ultimate densities reflects a very small subset of data.
Because of the small subset of data, no specific conclusions will be made; however, a
couple of general observations are noted. Based upon the HMA layers designed with the
Marshall hammer, the 75 blows per face compactive effort combined with the current
design air void contents used in the Marshall mix design method, appears to accurately
reflect the ultimate design density of airfield pavements. However, the design gyration
levels and 4 percent design air voids used for the Superpave designed mixes did not
accurately reflect the ultimate densities within the airfield pavements. These general
observations suggest that the Superpave designed mixes were designed at too low of an
asphalt binder content.
The second method of evaluating the proper design compactive effort with the
SGC entailed comparing densities obtained from compacting samples with the Marshall
hammer and Superpave gyratory compactor. Materials from each of the airfields were
used to compact HMA utilizing both the Marshall hammer and Superpave gyratory
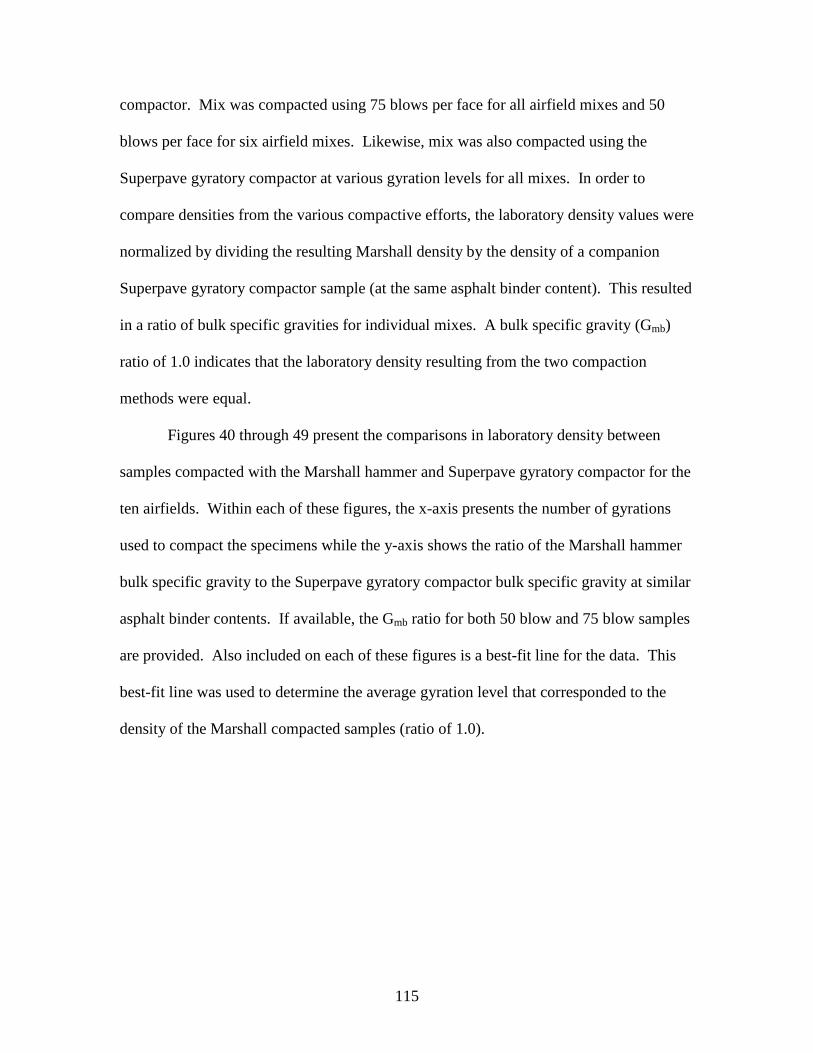
115
compactor. Mix was compacted using 75 blows per face for all airfield mixes and 50
blows per face for six airfield mixes. Likewise, mix was also compacted using the
Superpave gyratory compactor at various gyration levels for all mixes. In order to
compare densities from the various compactive efforts, the laboratory density values were
normalized by dividing the resulting Marshall density by the density of a companion
Superpave gyratory compactor sample (at the same asphalt binder content). This resulted
in a ratio of bulk specific gravities for individual mixes. A bulk specific gravity (Gmb)
ratio of 1.0 indicates that the laboratory density resulting from the two compaction
methods were equal.
Figures 40 through 49 present the comparisons in laboratory density between
samples compacted with the Marshall hammer and Superpave gyratory compactor for the
ten airfields. Within each of these figures, the x-axis presents the number of gyrations
used to compact the specimens while the y-axis shows the ratio of the Marshall hammer
bulk specific gravity to the Superpave gyratory compactor bulk specific gravity at similar
asphalt binder contents. If available, the Gmb ratio for both 50 blow and 75 blow samples
are provided. Also included on each of these figures is a best-fit line for the data. This
best-fit line was used to determine the average gyration level that corresponded to the
density of the Marshall compacted samples (ratio of 1.0).
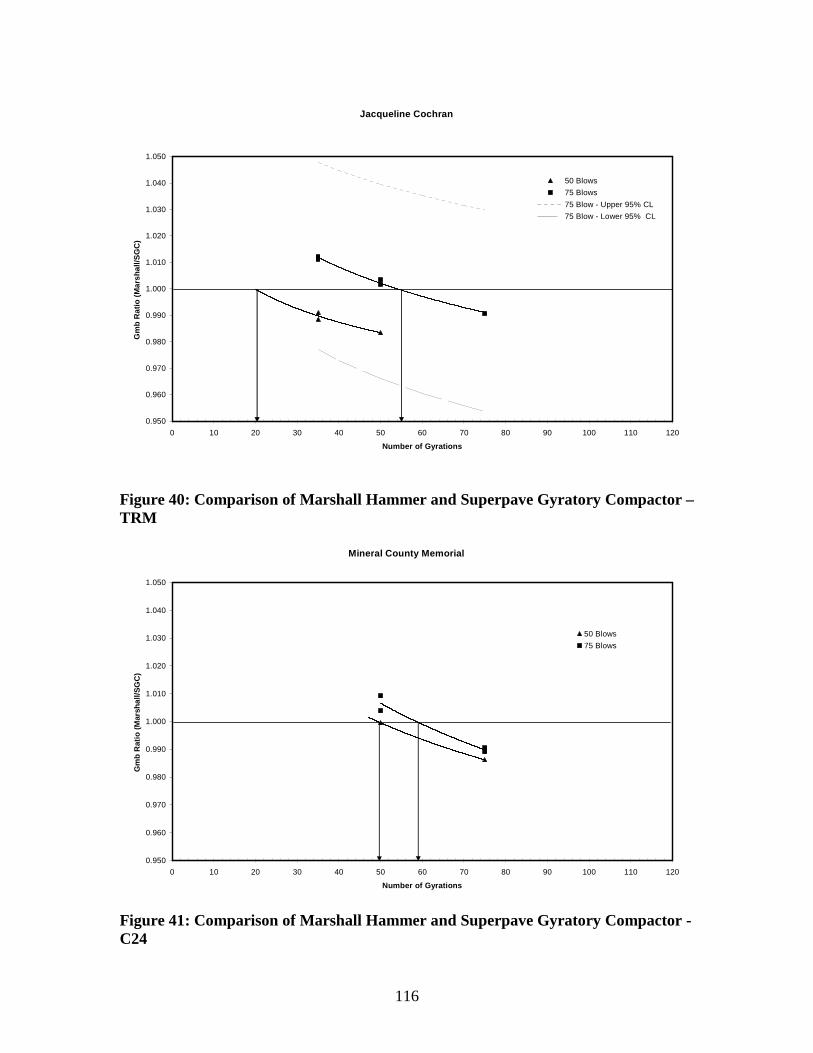
116
Jacqueline Cochran
0.950
0.960
0.970
0.980
0.990
1.000
1.010
1.020
1.030
1.040
1.050
0 10 20 30 40 50 60 70 80 90 100 110 120
Number of Gyrations
Gm
bR
ati
o(M
ars
ha
ll/S
GC
)
50 Blows
75 Blows
75 Blow - Upper 95% CL
75 Blow - Lower 95% CL
Figure 40: Comparison of Marshall Hammer and Superpave Gyratory Compactor –TRM
Mineral County Memorial
0.950
0.960
0.970
0.980
0.990
1.000
1.010
1.020
1.030
1.040
1.050
0 10 20 30 40 50 60 70 80 90 100 110 120
Number of Gyrations
Gm
bR
ati
o(M
ars
ha
ll/S
GC
)
50 Blows
75 Blows
Figure 41: Comparison of Marshall Hammer and Superpave Gyratory Compactor -C24
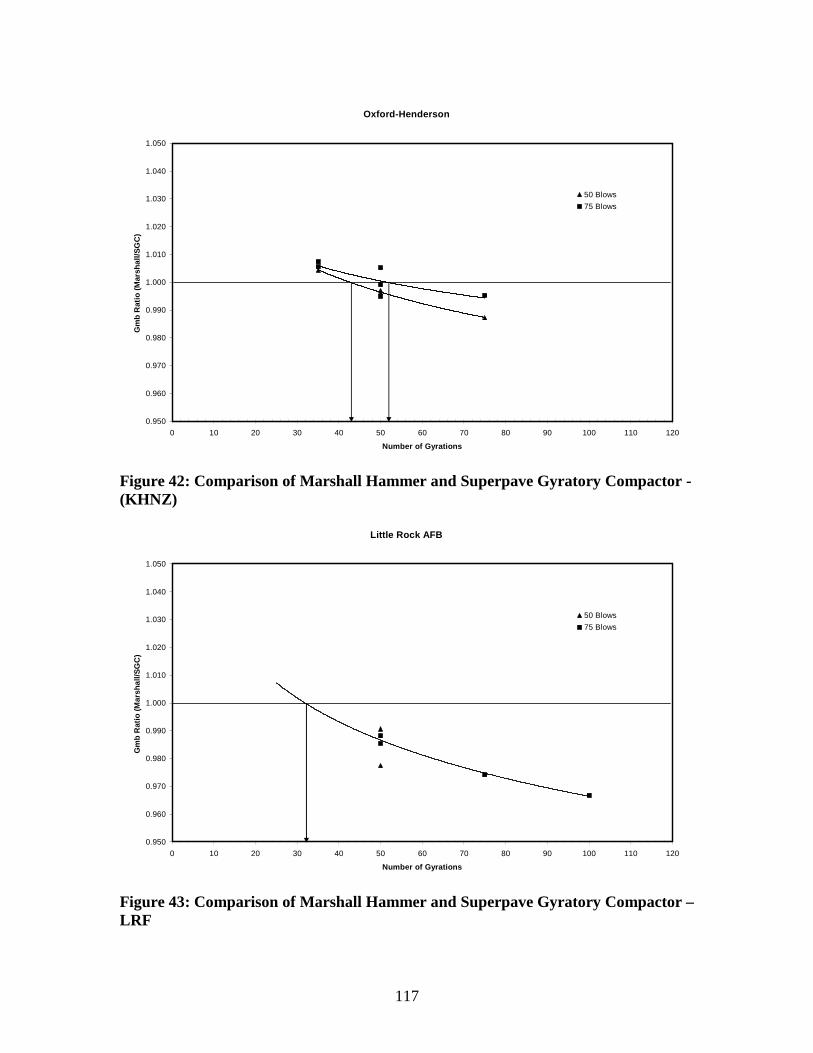
117
Oxford-Henderson
0.950
0.960
0.970
0.980
0.990
1.000
1.010
1.020
1.030
1.040
1.050
0 10 20 30 40 50 60 70 80 90 100 110 120
Number of Gyrations
Gm
bR
ati
o(M
ars
ha
ll/S
GC
)
50 Blows
75 Blows
Figure 42: Comparison of Marshall Hammer and Superpave Gyratory Compactor -(KHNZ)
Little Rock AFB
0.950
0.960
0.970
0.980
0.990
1.000
1.010
1.020
1.030
1.040
1.050
0 10 20 30 40 50 60 70 80 90 100 110 120
Number of Gyrations
Gm
bR
ati
o(M
ars
ha
ll/S
GC
)
50 Blows
75 Blows
Figure 43: Comparison of Marshall Hammer and Superpave Gyratory Compactor –LRF
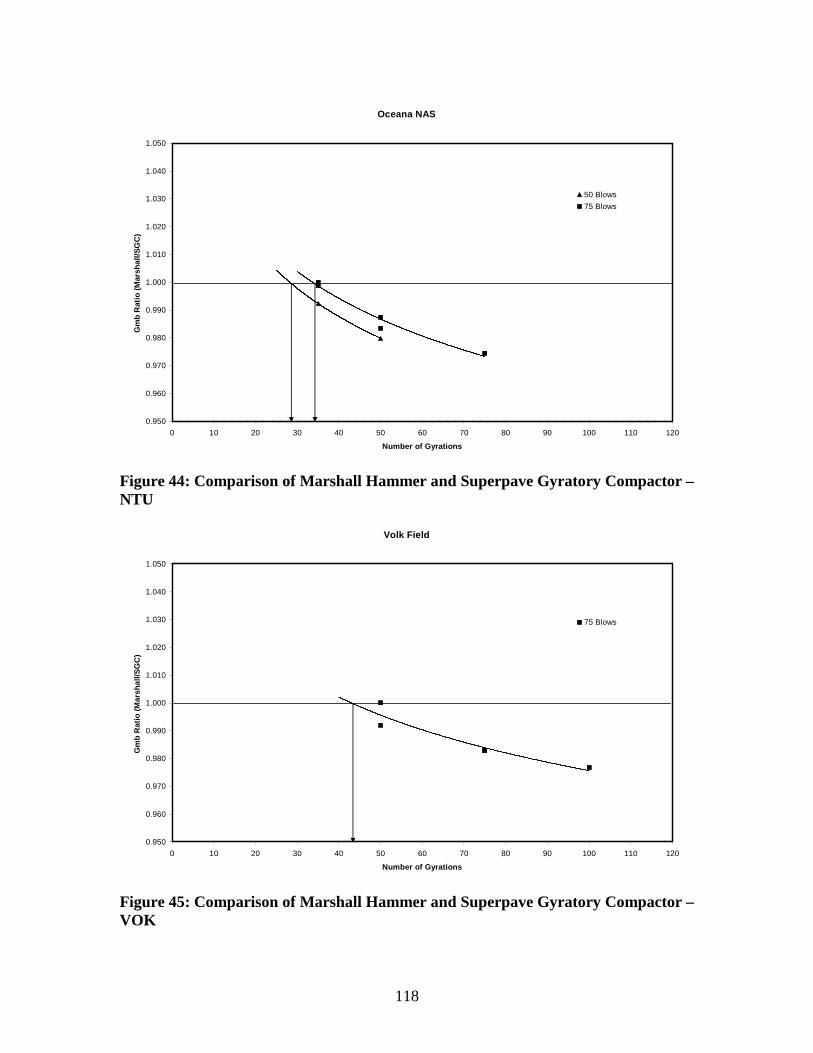
118
Oceana NAS
0.950
0.960
0.970
0.980
0.990
1.000
1.010
1.020
1.030
1.040
1.050
0 10 20 30 40 50 60 70 80 90 100 110 120
Number of Gyrations
Gm
bR
ati
o(M
ars
ha
ll/S
GC
)
50 Blows
75 Blows
Figure 44: Comparison of Marshall Hammer and Superpave Gyratory Compactor –NTU
Volk Field
0.950
0.960
0.970
0.980
0.990
1.000
1.010
1.020
1.030
1.040
1.050
0 10 20 30 40 50 60 70 80 90 100 110 120
Number of Gyrations
Gm
bR
ati
o(M
ars
ha
ll/S
GC
)
75 Blows
Figure 45: Comparison of Marshall Hammer and Superpave Gyratory Compactor –VOK
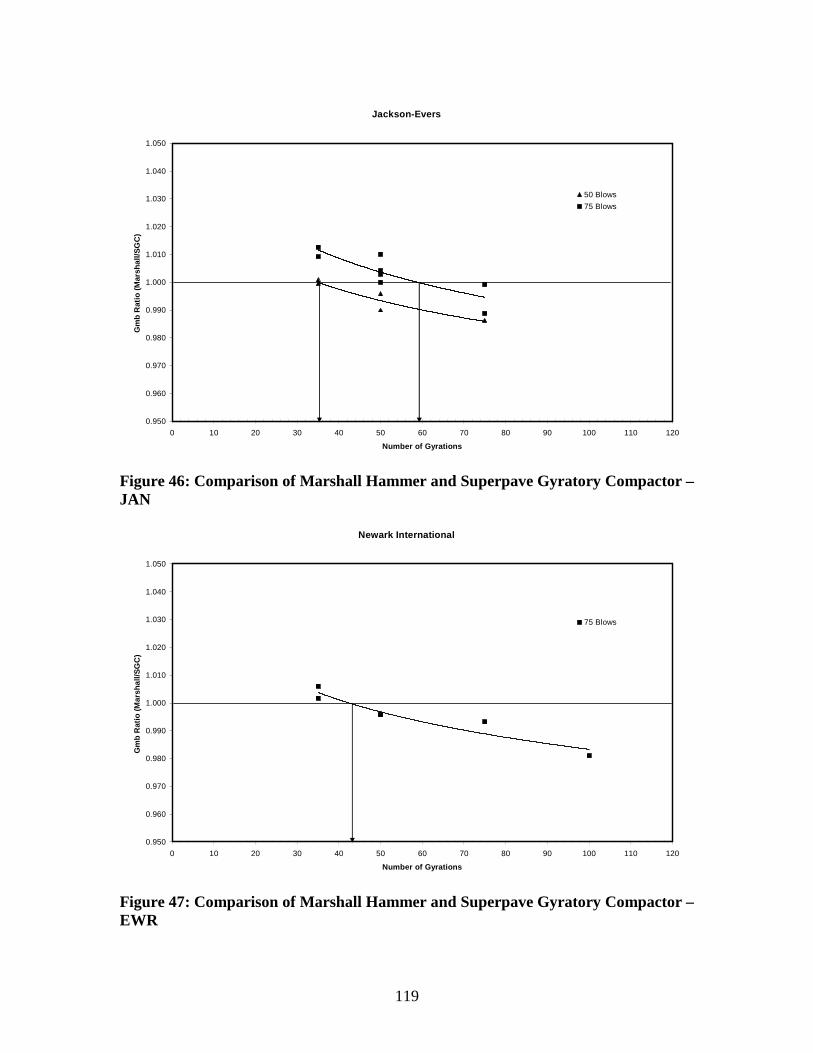
119
Jackson-Evers
0.950
0.960
0.970
0.980
0.990
1.000
1.010
1.020
1.030
1.040
1.050
0 10 20 30 40 50 60 70 80 90 100 110 120
Number of Gyrations
Gm
bR
ati
o(M
ars
ha
ll/S
GC
)
50 Blows
75 Blows
Figure 46: Comparison of Marshall Hammer and Superpave Gyratory Compactor –JAN
Newark International
0.950
0.960
0.970
0.980
0.990
1.000
1.010
1.020
1.030
1.040
1.050
0 10 20 30 40 50 60 70 80 90 100 110 120
Number of Gyrations
Gm
bR
ati
o(M
ars
ha
ll/S
GC
)
75 Blows
Figure 47: Comparison of Marshall Hammer and Superpave Gyratory Compactor –EWR
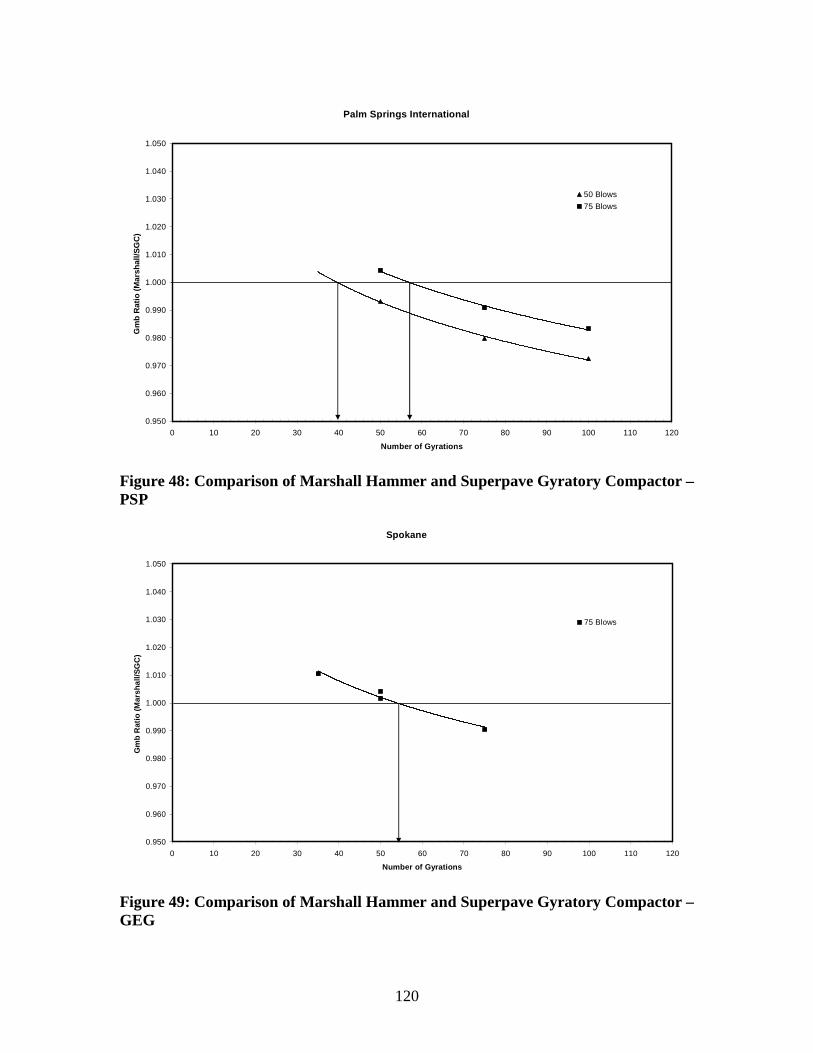
120
Palm Springs International
0.950
0.960
0.970
0.980
0.990
1.000
1.010
1.020
1.030
1.040
1.050
0 10 20 30 40 50 60 70 80 90 100 110 120
Number of Gyrations
Gm
bR
ati
o(M
ars
hall/S
GC
)
50 Blows
75 Blows
Figure 48: Comparison of Marshall Hammer and Superpave Gyratory Compactor –PSP
Spokane
0.950
0.960
0.970
0.980
0.990
1.000
1.010
1.020
1.030
1.040
1.050
0 10 20 30 40 50 60 70 80 90 100 110 120
Number of Gyrations
Gm
bR
ati
o(M
ars
ha
ll/S
GC
)
75 Blows
Figure 49: Comparison of Marshall Hammer and Superpave Gyratory Compactor –GEG
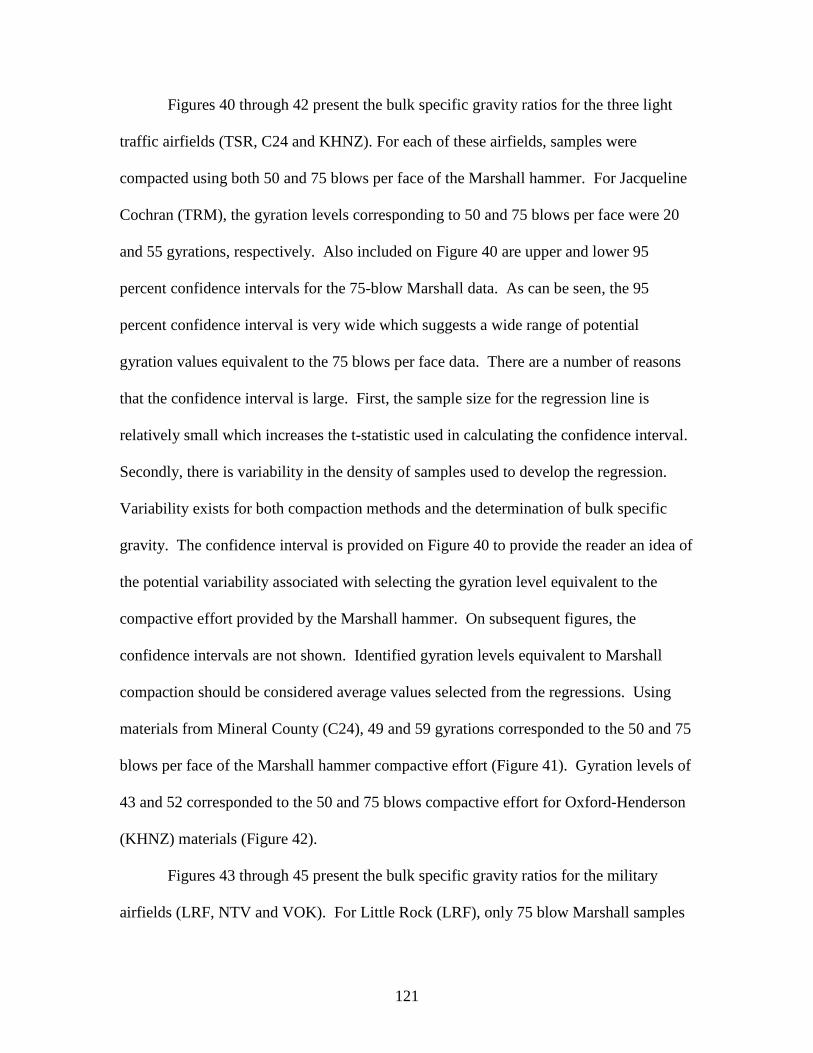
121
Figures 40 through 42 present the bulk specific gravity ratios for the three light
traffic airfields (TSR, C24 and KHNZ). For each of these airfields, samples were
compacted using both 50 and 75 blows per face of the Marshall hammer. For Jacqueline
Cochran (TRM), the gyration levels corresponding to 50 and 75 blows per face were 20
and 55 gyrations, respectively. Also included on Figure 40 are upper and lower 95
percent confidence intervals for the 75-blow Marshall data. As can be seen, the 95
percent confidence interval is very wide which suggests a wide range of potential
gyration values equivalent to the 75 blows per face data. There are a number of reasons
that the confidence interval is large. First, the sample size for the regression line is
relatively small which increases the t-statistic used in calculating the confidence interval.
Secondly, there is variability in the density of samples used to develop the regression.
Variability exists for both compaction methods and the determination of bulk specific
gravity. The confidence interval is provided on Figure 40 to provide the reader an idea of
the potential variability associated with selecting the gyration level equivalent to the
compactive effort provided by the Marshall hammer. On subsequent figures, the
confidence intervals are not shown. Identified gyration levels equivalent to Marshall
compaction should be considered average values selected from the regressions. Using
materials from Mineral County (C24), 49 and 59 gyrations corresponded to the 50 and 75
blows per face of the Marshall hammer compactive effort (Figure 41). Gyration levels of
43 and 52 corresponded to the 50 and 75 blows compactive effort for Oxford-Henderson
(KHNZ) materials (Figure 42).
Figures 43 through 45 present the bulk specific gravity ratios for the military
airfields (LRF, NTV and VOK). For Little Rock (LRF), only 75 blow Marshall samples

122
were compacted. The gyration level corresponding to the density resulting from 75
blows per face of the Marshall hammer was 32. For materials from Oceana NAS (NTU),
28 and 34 gyrations corresponded to the 50 and 75 blow compactive effort, respectively.
A gyration level of 43 corresponded to the 75 blow compactive effort using materials
from Volk Field (VOK).
Figures 46 though 49 present the Marshall hammer and SGC comparisons for the
commercial airfields (JAN, FWR, PSP, and GEG). For Jackson-Evers (JAN), 35 and 59
gyrations corresponded to the 50 and 75 blow compactive efforts, respectively. For
materials from Newark-Liberty (EWR), 43 gyrations corresponded to 75 blows per face
of the Marshall hammer. Gyration levels corresponding to 50 and 75 blows per face
utilizing materials from Palm Springs (PSP) were 40 and 57, respectively. Finally, 55
gyrations corresponded to 75 blows per face using materials from Spokane (GEG).
As described above, there were a wide range of gyration levels that corresponded
to 50 and 75 blows per face of the Marshall hammer. Figure 50 illustrates a histogram
that presents the distribution of gyration levels obtained from Figures 40 to 49. For the
data representing the 50 blows per face compactive effort, gyration levels ranged from a
low of 20 gyrations to a high of 49 gyrations. Based on Figure 50, roughly 67 percent of
the data suggests that the gyration level corresponding to a 50 blow compactive effort is
between 40 and 50 gyrations. For the 75 blow data, the gyration level ranged from a low
of 32 to a high of 59. Figure 50 shows that 60 percent of the gyration levels
corresponding to the density achieved by 75 blows are between 50 and 60 gyrations.
Also, 50 percent of the data is between 55 and 60 gyrations.
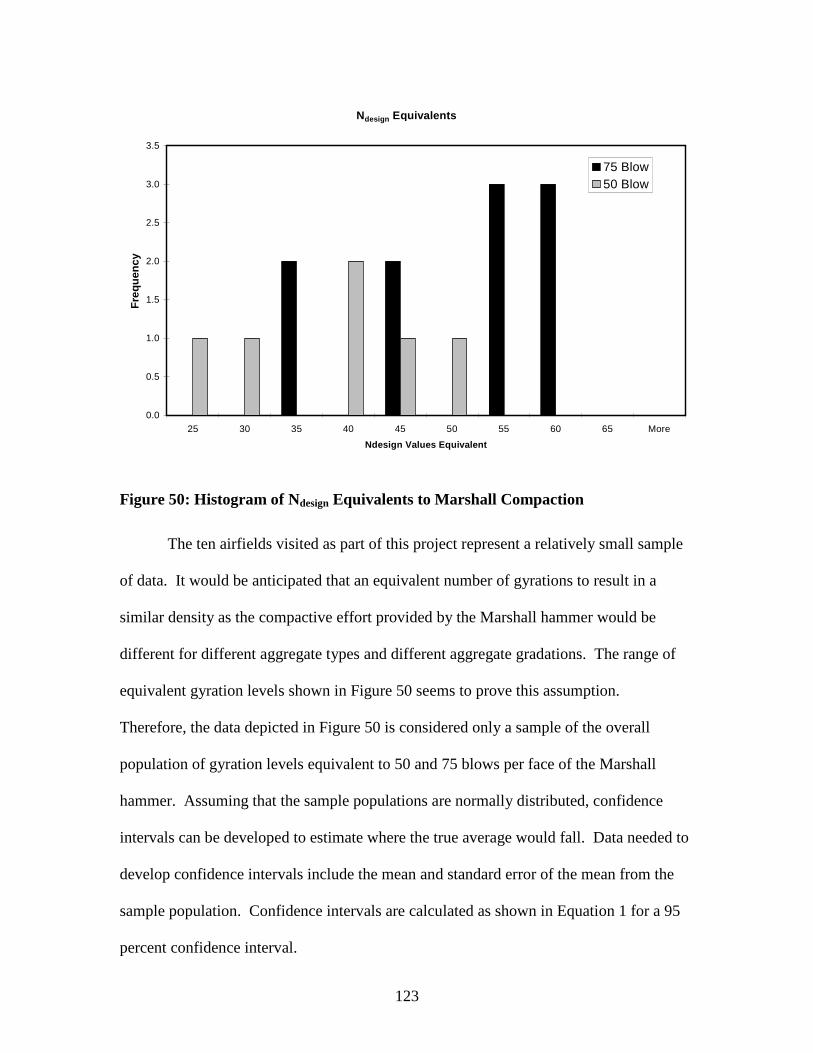
123
Ndesign Equivalents
0.0
0.5
1.0
1.5
2.0
2.5
3.0
3.5
25 30 35 40 45 50 55 60 65 More
Ndesign Values Equivalent
Fre
qu
en
cy
75 Blow
50 Blow
Figure 50: Histogram of Ndesign Equivalents to Marshall Compaction
The ten airfields visited as part of this project represent a relatively small sample
of data. It would be anticipated that an equivalent number of gyrations to result in a
similar density as the compactive effort provided by the Marshall hammer would be
different for different aggregate types and different aggregate gradations. The range of
equivalent gyration levels shown in Figure 50 seems to prove this assumption.
Therefore, the data depicted in Figure 50 is considered only a sample of the overall
population of gyration levels equivalent to 50 and 75 blows per face of the Marshall
hammer. Assuming that the sample populations are normally distributed, confidence
intervals can be developed to estimate where the true average would fall. Data needed to
develop confidence intervals include the mean and standard error of the mean from the
sample population. Confidence intervals are calculated as shown in Equation 1 for a 95
percent confidence interval.
124
percentatIntervalConfidencen
x 9596.1
Equation 1
where:
x = mean of sample population;
σ = standard deviation of sample population; and
n = number of observations
For the 75 blows per face data depicted in Figure 50, the mean equivalent number
of gyrations was 49 with a standard deviation of 10 gyrations for ten observations.
Therefore, the estimated gyration level that provides an equivalent density to 75 blows
per face falls between 43 and 55 gyrations at a 5 percent level of significance. This range
of equivalent gyration levels equal to the compactive effort of 75 blows is slightly lower
than anticipated; however, Brown and Mallick (14) did find an average of 1.4 percent
lower air voids in samples compacted to 68 gyrations in an SGC when compared to
samples compacted with 75 blows per face of the Marshall hammer. Prowell and
Haddock (15) found an average difference of 1.9 percent air voids when comparing 68
gyrations and 75 blows per face compactive efforts, with the SGC again providing more
compaction. Therefore, the upper part of the range (near the 55 gyrations) seems an
appropriate estimate for a gyration level that provides an average equivalent density as 75
blows per face of the Marshall hammer.
For the 50 blows per face data depicted in Figure 50, the mean equivalent number
of gyrations was 36 with a standard deviation of 11 gyrations for six observations.
Therefore, the estimated gyration level that provides an equivalent density to 50 blows
per face falls between 32 and 40 gyrations.
125
To summarize this second method of evaluating the proper design compactive
effort, a range of equivalent gyration levels were determined for both 75 blows per face
and 50 blows per face compactive efforts. The purpose for developing the ranges is that
the true gyration level equivalent to a specific number of blows of the Marshall hammer
will most likely change depending upon the aggregate characteristics, aggregate
gradation, aggregate maximum aggregate size, variability in compacting samples in the
Superpave gyratory compactor, variability in compaction of samples using the Marshall
hammer, variability in preparation of samples, etc. When making final recommendations
for the design compactive efforts, it will be important to understand how the selected
gyration levels relate to the compactive efforts of 75 blows per face and 50 blows per
face.
The final method of evaluating the proper design compactive effort using the
Superpave gyratory compactor entailed evaluating the results of the laboratory
performance testing, confined repeated load permanent deformation test (or commonly
called the Flow Number test). Results from the Flow Number test are the number of
loading cycles to failure. Samples were loaded to tertiary flow or 20,000 cycles,
whichever came first. As stated previously, samples from each airfield were tested at
varying deviator stresses. The deviator stresses were selected to represent various aircraft
tire pressures. In order to evaluate the Flow Number results for the various airfields,
information on the typical aircraft operating on the various airfield pavements was
needed. For the civilian airfields, the Airport Master Record was obtained. The Airport
Master Records contained data on the gross weights and gear configurations utilized on
each airfield. LEDFAA was then used to determine the typical gross taxi weights and tire
126
pressures for aircraft meeting the requirements depicted on the Airport Master Records.
For the military airfields, the design aircraft were obtained from representatives from
each respective airfield. Table 31 presents the typical aircraft along with specifics on the
types of gears, gross taxi weights and tire pressures.
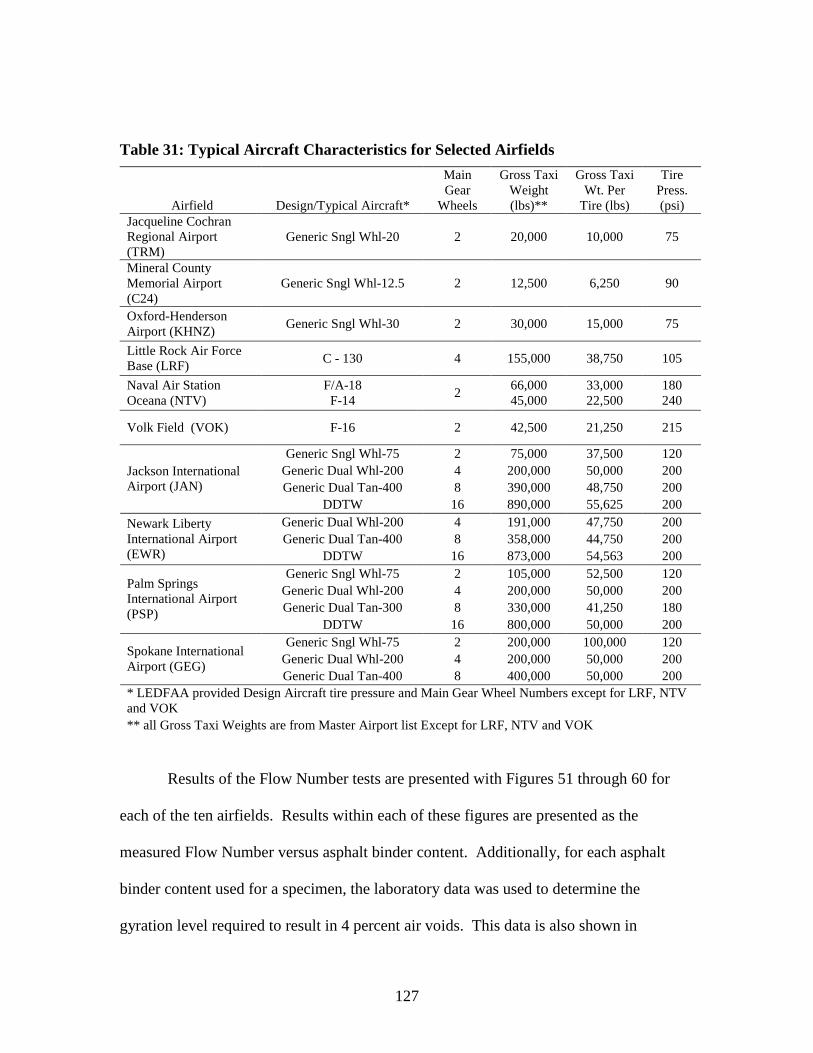
127
Table 31: Typical Aircraft Characteristics for Selected Airfields
Airfield Design/Typical Aircraft*
MainGear
Wheels
Gross TaxiWeight(lbs)**
Gross TaxiWt. Per
Tire (lbs)
TirePress.(psi)
Jacqueline CochranRegional Airport(TRM)
Generic Sngl Whl-20 2 20,000 10,000 75
Mineral CountyMemorial Airport(C24)
Generic Sngl Whl-12.5 2 12,500 6,250 90
Oxford-HendersonAirport (KHNZ)
Generic Sngl Whl-30 2 30,000 15,000 75
Little Rock Air ForceBase (LRF)
C - 130 4 155,000 38,750 105
Naval Air StationOceana (NTV)
F/A-18F-14
266,00045,000
33,00022,500
180240
Volk Field (VOK) F-16 2 42,500 21,250 215
Generic Sngl Whl-75 2 75,000 37,500 120
Generic Dual Whl-200 4 200,000 50,000 200
Generic Dual Tan-400 8 390,000 48,750 200Jackson InternationalAirport (JAN)
DDTW 16 890,000 55,625 200
Generic Dual Whl-200 4 191,000 47,750 200
Generic Dual Tan-400 8 358,000 44,750 200Newark LibertyInternational Airport(EWR) DDTW 16 873,000 54,563 200
Generic Sngl Whl-75 2 105,000 52,500 120
Generic Dual Whl-200 4 200,000 50,000 200
Generic Dual Tan-300 8 330,000 41,250 180
Palm SpringsInternational Airport(PSP)
DDTW 16 800,000 50,000 200
Generic Sngl Whl-75 2 200,000 100,000 120
Generic Dual Whl-200 4 200,000 50,000 200Spokane InternationalAirport (GEG)
Generic Dual Tan-400 8 400,000 50,000 200
* LEDFAA provided Design Aircraft tire pressure and Main Gear Wheel Numbers except for LRF, NTVand VOK
** all Gross Taxi Weights are from Master Airport list Except for LRF, NTV and VOK
Results of the Flow Number tests are presented with Figures 51 through 60 for
each of the ten airfields. Results within each of these figures are presented as the
measured Flow Number versus asphalt binder content. Additionally, for each asphalt
binder content used for a specimen, the laboratory data was used to determine the
gyration level required to result in 4 percent air voids. This data is also shown in
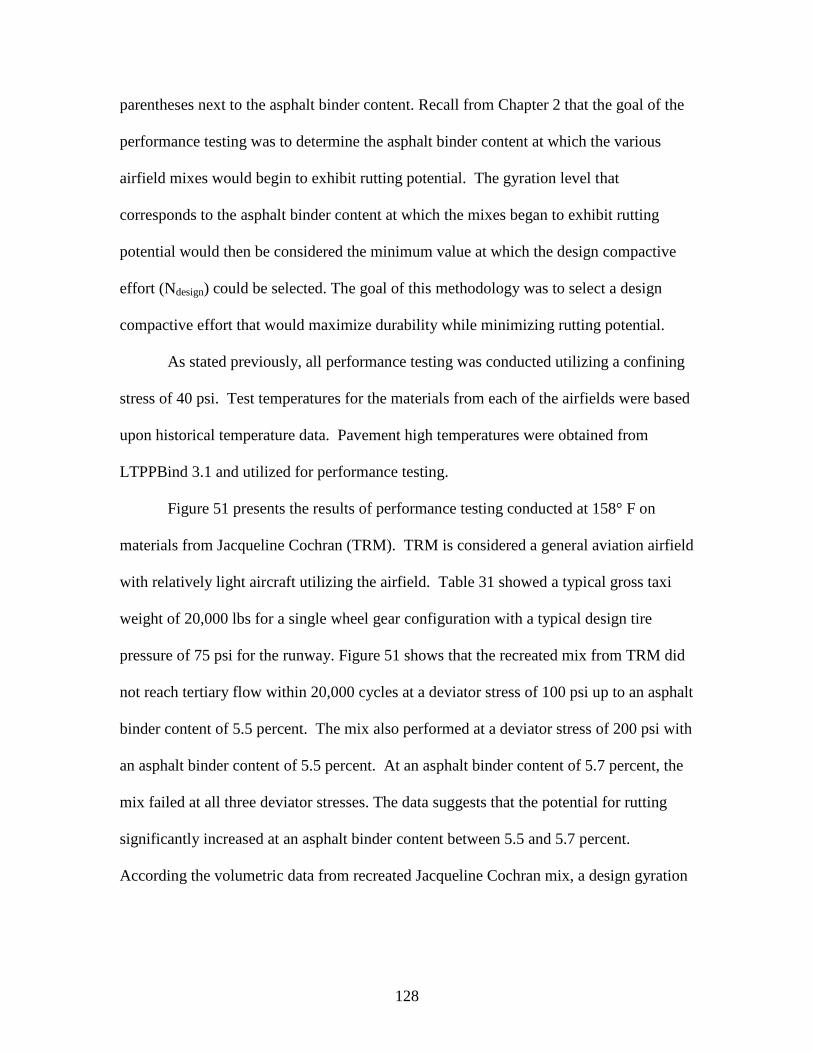
128
parentheses next to the asphalt binder content. Recall from Chapter 2 that the goal of the
performance testing was to determine the asphalt binder content at which the various
airfield mixes would begin to exhibit rutting potential. The gyration level that
corresponds to the asphalt binder content at which the mixes began to exhibit rutting
potential would then be considered the minimum value at which the design compactive
effort (Ndesign) could be selected. The goal of this methodology was to select a design
compactive effort that would maximize durability while minimizing rutting potential.
As stated previously, all performance testing was conducted utilizing a confining
stress of 40 psi. Test temperatures for the materials from each of the airfields were based
upon historical temperature data. Pavement high temperatures were obtained from
LTPPBind 3.1 and utilized for performance testing.
Figure 51 presents the results of performance testing conducted at 158° F on
materials from Jacqueline Cochran (TRM). TRM is considered a general aviation airfield
with relatively light aircraft utilizing the airfield. Table 31 showed a typical gross taxi
weight of 20,000 lbs for a single wheel gear configuration with a typical design tire
pressure of 75 psi for the runway. Figure 51 shows that the recreated mix from TRM did
not reach tertiary flow within 20,000 cycles at a deviator stress of 100 psi up to an asphalt
binder content of 5.5 percent. The mix also performed at a deviator stress of 200 psi with
an asphalt binder content of 5.5 percent. At an asphalt binder content of 5.7 percent, the
mix failed at all three deviator stresses. The data suggests that the potential for rutting
significantly increased at an asphalt binder content between 5.5 and 5.7 percent.
According the volumetric data from recreated Jacqueline Cochran mix, a design gyration
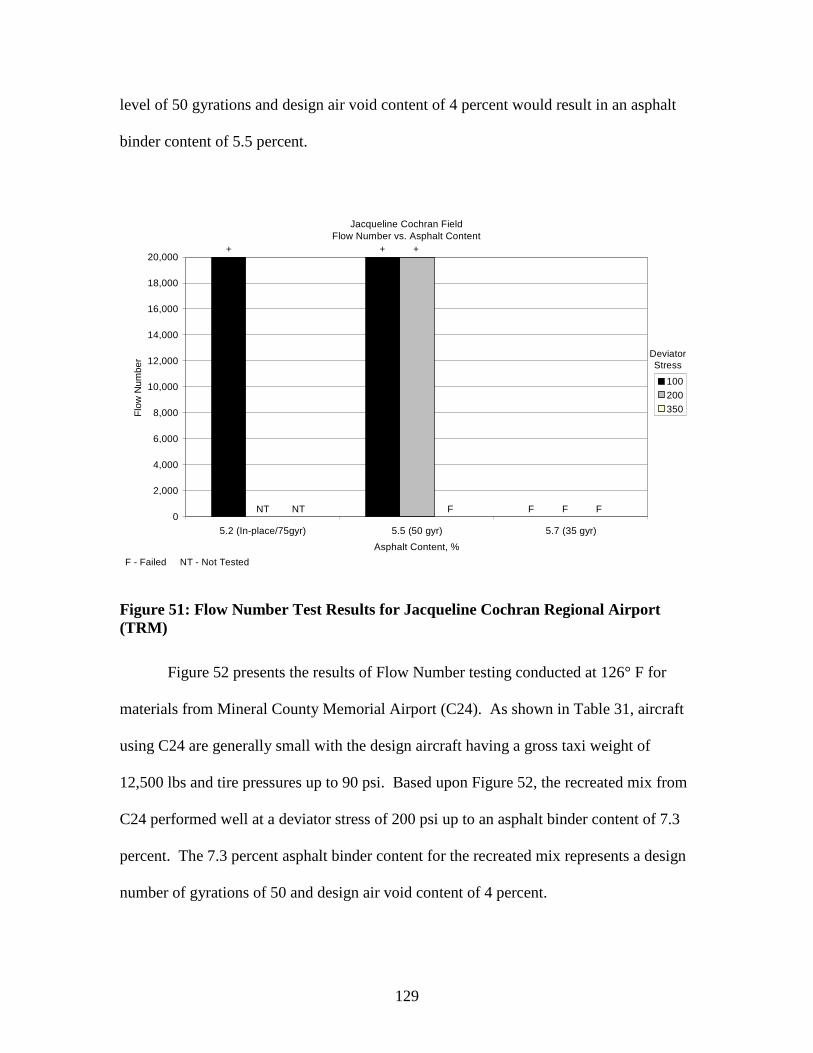
129
level of 50 gyrations and design air void content of 4 percent would result in an asphalt
binder content of 5.5 percent.
Jacqueline Cochran FieldFlow Number vs. Asphalt Content
0
2,000
4,000
6,000
8,000
10,000
12,000
14,000
16,000
18,000
20,000
5.2 (In-place/75gyr) 5.5 (50 gyr) 5.7 (35 gyr)
Asphalt Content, %
Flo
wN
um
be
r
100
200
350
DeviatorStress
++ +
F F FFNT NT
F - Failed NT - Not Tested
Figure 51: Flow Number Test Results for Jacqueline Cochran Regional Airport(TRM)
Figure 52 presents the results of Flow Number testing conducted at 126° F for
materials from Mineral County Memorial Airport (C24). As shown in Table 31, aircraft
using C24 are generally small with the design aircraft having a gross taxi weight of
12,500 lbs and tire pressures up to 90 psi. Based upon Figure 52, the recreated mix from
C24 performed well at a deviator stress of 200 psi up to an asphalt binder content of 7.3
percent. The 7.3 percent asphalt binder content for the recreated mix represents a design
number of gyrations of 50 and design air void content of 4 percent.
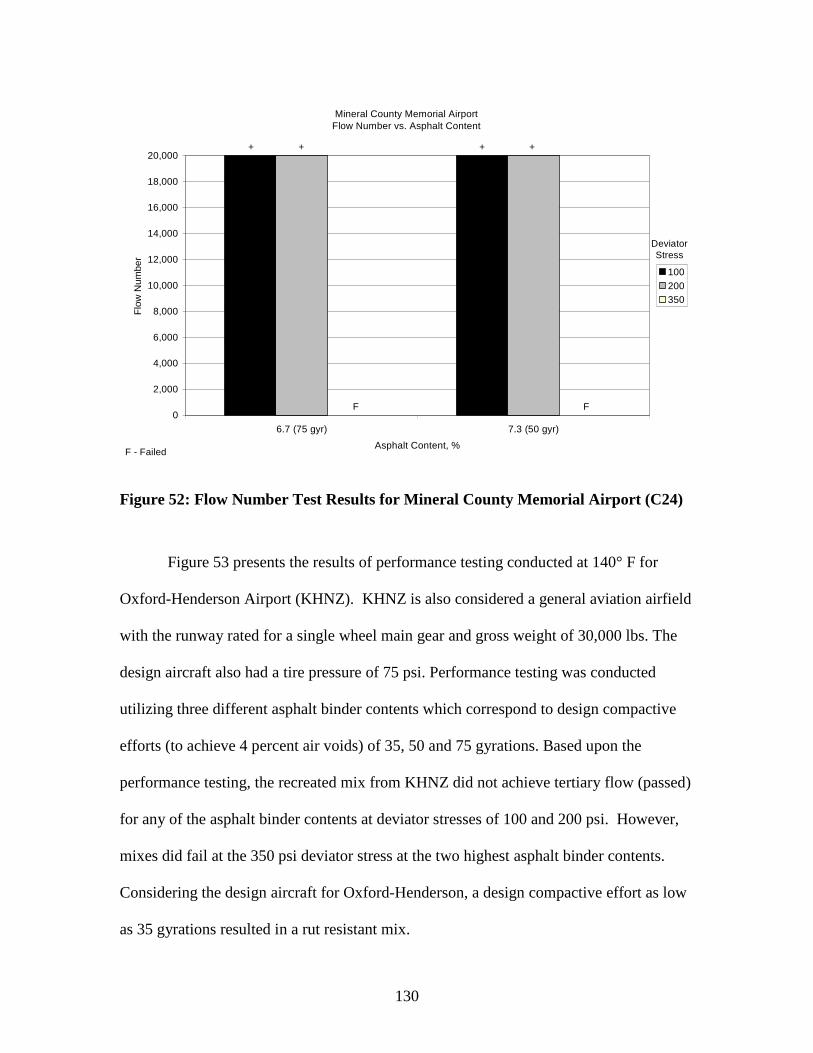
130
Mineral County Memorial AirportFlow Number vs. Asphalt Content
0
2,000
4,000
6,000
8,000
10,000
12,000
14,000
16,000
18,000
20,000
6.7 (75 gyr) 7.3 (50 gyr)
Asphalt Content, %
Flo
wN
um
be
r
100
200
350
+ + ++
DeviatorStress
F F
F - Failed
Figure 52: Flow Number Test Results for Mineral County Memorial Airport (C24)
Figure 53 presents the results of performance testing conducted at 140° F for
Oxford-Henderson Airport (KHNZ). KHNZ is also considered a general aviation airfield
with the runway rated for a single wheel main gear and gross weight of 30,000 lbs. The
design aircraft also had a tire pressure of 75 psi. Performance testing was conducted
utilizing three different asphalt binder contents which correspond to design compactive
efforts (to achieve 4 percent air voids) of 35, 50 and 75 gyrations. Based upon the
performance testing, the recreated mix from KHNZ did not achieve tertiary flow (passed)
for any of the asphalt binder contents at deviator stresses of 100 and 200 psi. However,
mixes did fail at the 350 psi deviator stress at the two highest asphalt binder contents.
Considering the design aircraft for Oxford-Henderson, a design compactive effort as low
as 35 gyrations resulted in a rut resistant mix.
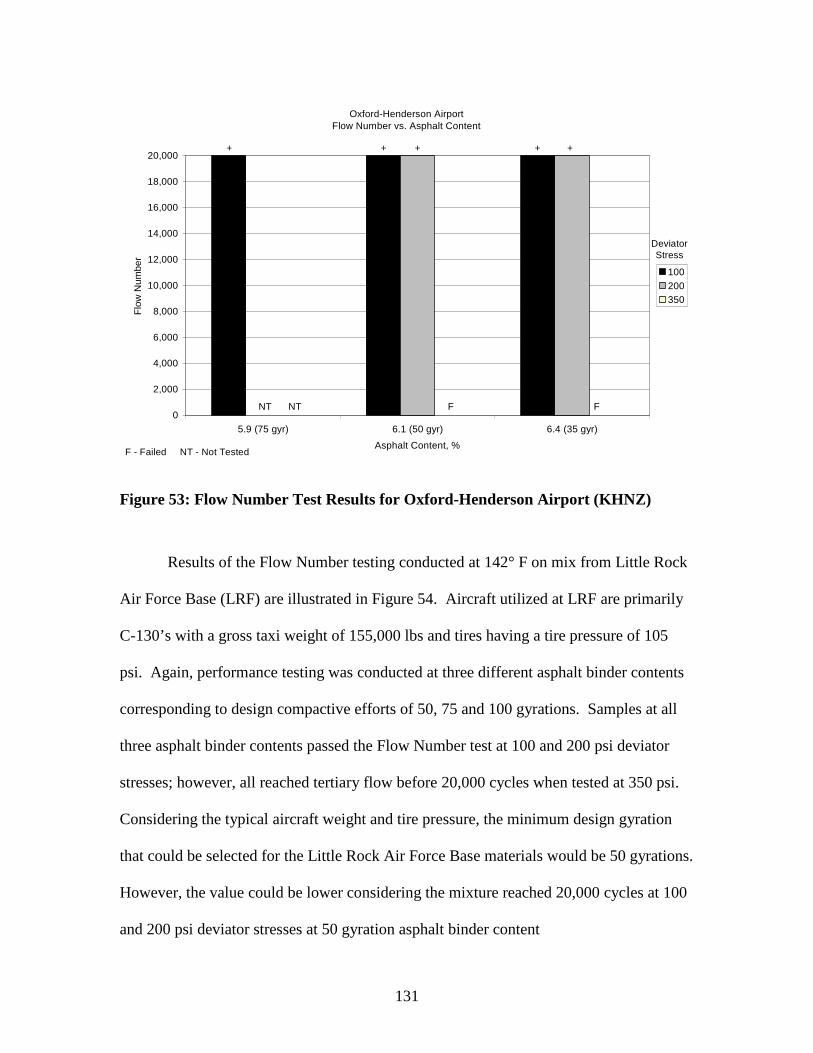
131
Oxford-Henderson AirportFlow Number vs. Asphalt Content
0
2,000
4,000
6,000
8,000
10,000
12,000
14,000
16,000
18,000
20,000
5.9 (75 gyr) 6.1 (50 gyr) 6.4 (35 gyr)
Asphalt Content, %
Flo
wN
um
be
r
100
200
350
DeviatorStress
FF
+ +++ +
NTNT
F - Failed NT - Not Tested
Figure 53: Flow Number Test Results for Oxford-Henderson Airport (KHNZ)
Results of the Flow Number testing conducted at 142° F on mix from Little Rock
Air Force Base (LRF) are illustrated in Figure 54. Aircraft utilized at LRF are primarily
C-130’s with a gross taxi weight of 155,000 lbs and tires having a tire pressure of 105
psi. Again, performance testing was conducted at three different asphalt binder contents
corresponding to design compactive efforts of 50, 75 and 100 gyrations. Samples at all
three asphalt binder contents passed the Flow Number test at 100 and 200 psi deviator
stresses; however, all reached tertiary flow before 20,000 cycles when tested at 350 psi.
Considering the typical aircraft weight and tire pressure, the minimum design gyration
that could be selected for the Little Rock Air Force Base materials would be 50 gyrations.
However, the value could be lower considering the mixture reached 20,000 cycles at 100
and 200 psi deviator stresses at 50 gyration asphalt binder content
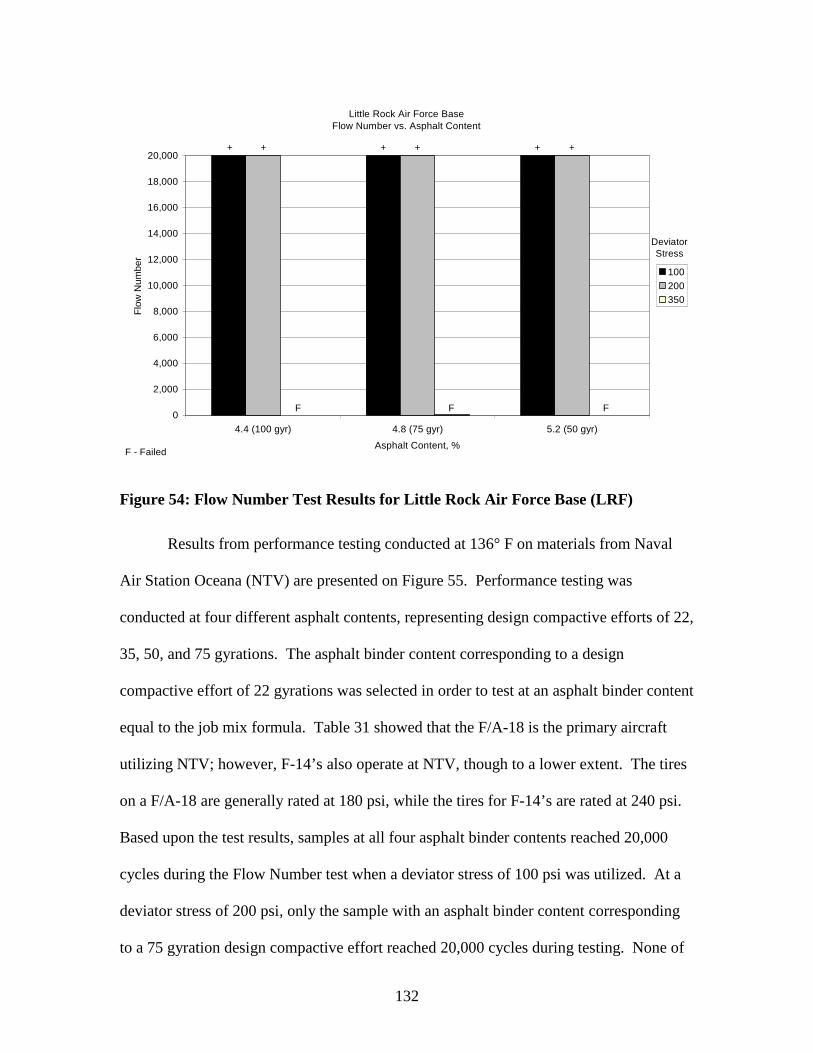
132
Little Rock Air Force BaseFlow Number vs. Asphalt Content
0
2,000
4,000
6,000
8,000
10,000
12,000
14,000
16,000
18,000
20,000
4.4 (100 gyr) 4.8 (75 gyr) 5.2 (50 gyr)
Asphalt Content, %
Flo
wN
um
be
r
100
200
350
+ +++++
F FF
DeviatorStress
F - Failed
Figure 54: Flow Number Test Results for Little Rock Air Force Base (LRF)
Results from performance testing conducted at 136° F on materials from Naval
Air Station Oceana (NTV) are presented on Figure 55. Performance testing was
conducted at four different asphalt contents, representing design compactive efforts of 22,
35, 50, and 75 gyrations. The asphalt binder content corresponding to a design
compactive effort of 22 gyrations was selected in order to test at an asphalt binder content
equal to the job mix formula. Table 31 showed that the F/A-18 is the primary aircraft
utilizing NTV; however, F-14’s also operate at NTV, though to a lower extent. The tires
on a F/A-18 are generally rated at 180 psi, while the tires for F-14’s are rated at 240 psi.
Based upon the test results, samples at all four asphalt binder contents reached 20,000
cycles during the Flow Number test when a deviator stress of 100 psi was utilized. At a
deviator stress of 200 psi, only the sample with an asphalt binder content corresponding
to a 75 gyration design compactive effort reached 20,000 cycles during testing. None of
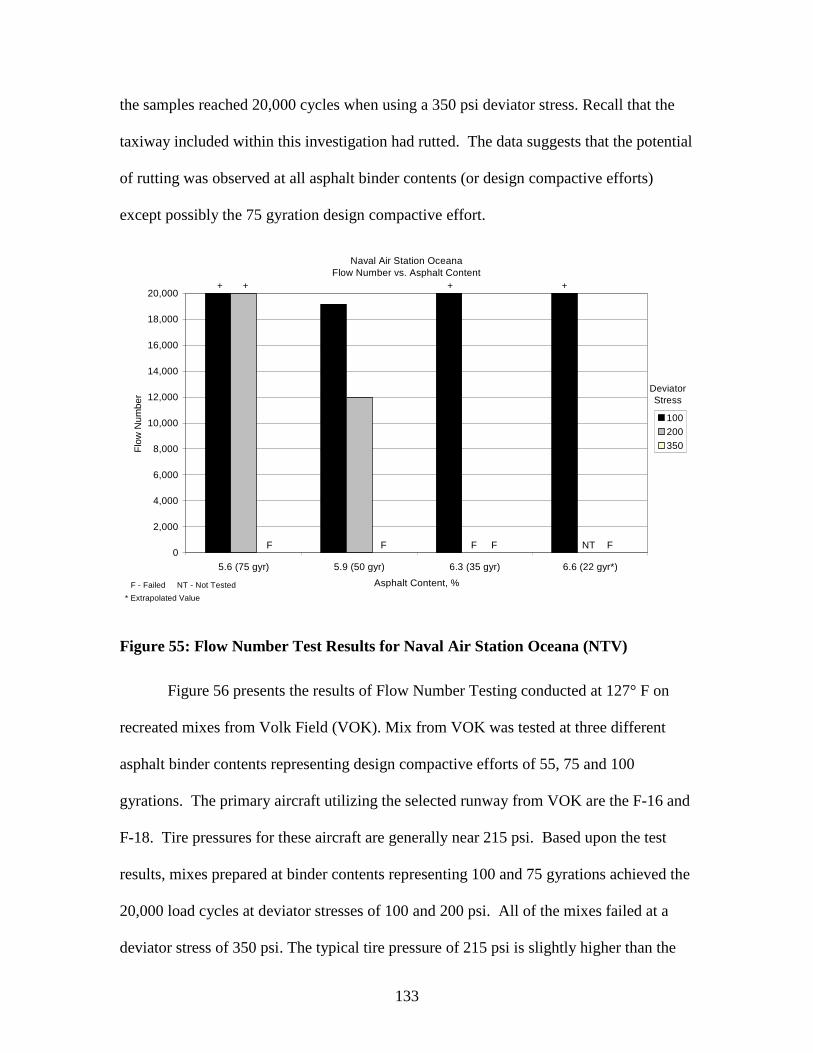
133
the samples reached 20,000 cycles when using a 350 psi deviator stress. Recall that the
taxiway included within this investigation had rutted. The data suggests that the potential
of rutting was observed at all asphalt binder contents (or design compactive efforts)
except possibly the 75 gyration design compactive effort.
Naval Air Station OceanaFlow Number vs. Asphalt Content
0
2,000
4,000
6,000
8,000
10,000
12,000
14,000
16,000
18,000
20,000
5.6 (75 gyr) 5.9 (50 gyr) 6.3 (35 gyr) 6.6 (22 gyr*)
Asphalt Content, %
Flo
wN
um
be
r
100
200
350
DeviatorStress
F - Failed NT - Not Tested
NTF FFF F
+ + ++
* Extrapolated Value
Figure 55: Flow Number Test Results for Naval Air Station Oceana (NTV)
Figure 56 presents the results of Flow Number Testing conducted at 127° F on
recreated mixes from Volk Field (VOK). Mix from VOK was tested at three different
asphalt binder contents representing design compactive efforts of 55, 75 and 100
gyrations. The primary aircraft utilizing the selected runway from VOK are the F-16 and
F-18. Tire pressures for these aircraft are generally near 215 psi. Based upon the test
results, mixes prepared at binder contents representing 100 and 75 gyrations achieved the
20,000 load cycles at deviator stresses of 100 and 200 psi. All of the mixes failed at a
deviator stress of 350 psi. The typical tire pressure of 215 psi is slightly higher than the
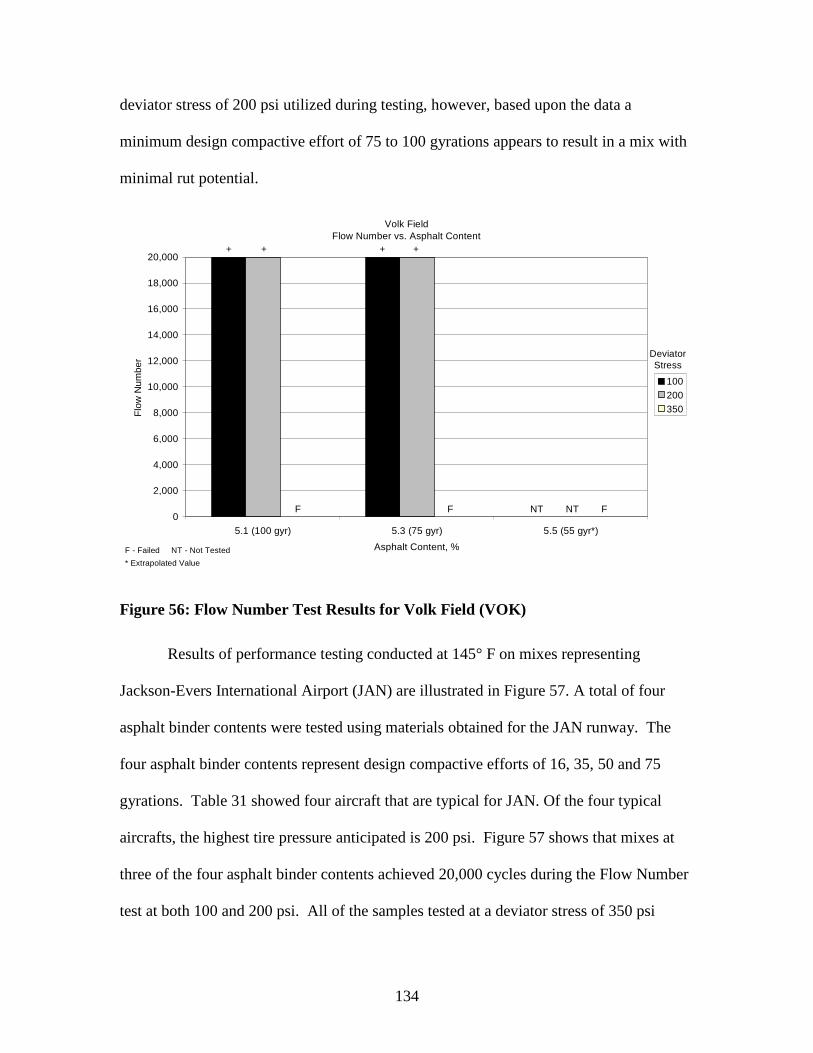
134
deviator stress of 200 psi utilized during testing, however, based upon the data a
minimum design compactive effort of 75 to 100 gyrations appears to result in a mix with
minimal rut potential.
Volk FieldFlow Number vs. Asphalt Content
0
2,000
4,000
6,000
8,000
10,000
12,000
14,000
16,000
18,000
20,000
5.1 (100 gyr) 5.3 (75 gyr) 5.5 (55 gyr*)
Asphalt Content, %
Flo
wN
um
be
r
100
200
350
DeviatorStress
+++ +
NT NT FFF
F - Failed NT - Not Tested
* Extrapolated Value
Figure 56: Flow Number Test Results for Volk Field (VOK)
Results of performance testing conducted at 145° F on mixes representing
Jackson-Evers International Airport (JAN) are illustrated in Figure 57. A total of four
asphalt binder contents were tested using materials obtained for the JAN runway. The
four asphalt binder contents represent design compactive efforts of 16, 35, 50 and 75
gyrations. Table 31 showed four aircraft that are typical for JAN. Of the four typical
aircrafts, the highest tire pressure anticipated is 200 psi. Figure 57 shows that mixes at
three of the four asphalt binder contents achieved 20,000 cycles during the Flow Number
test at both 100 and 200 psi. All of the samples tested at a deviator stress of 350 psi
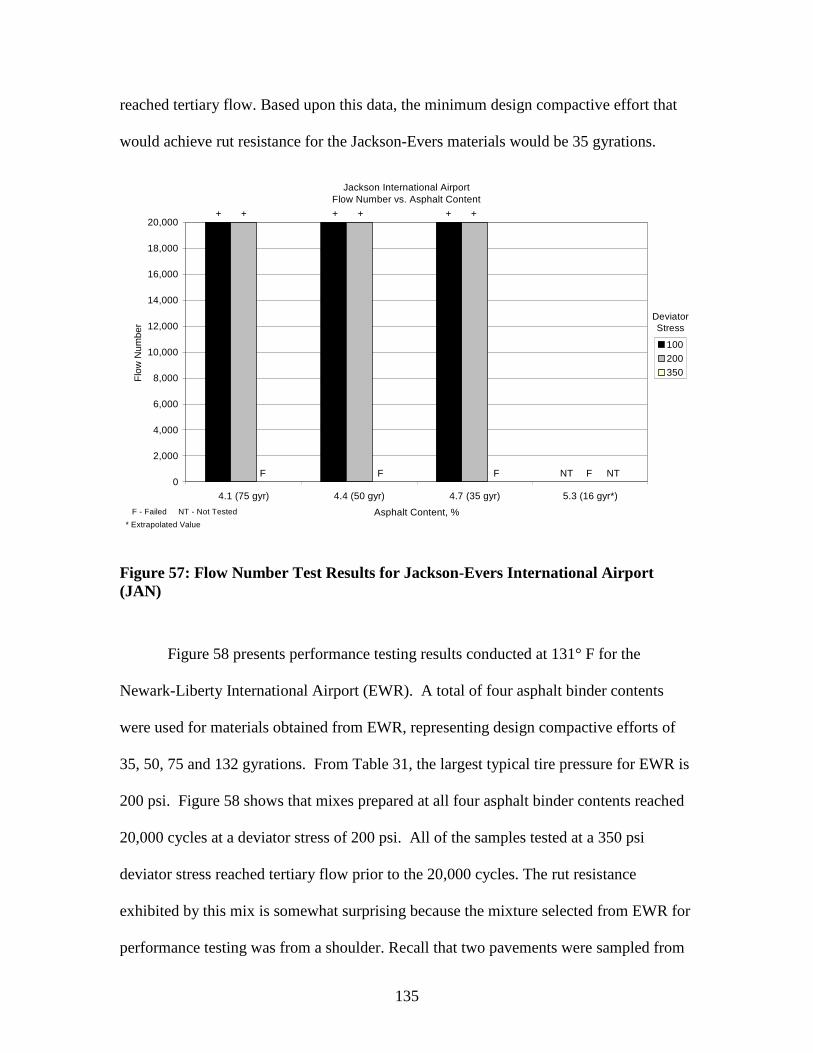
135
reached tertiary flow. Based upon this data, the minimum design compactive effort that
would achieve rut resistance for the Jackson-Evers materials would be 35 gyrations.
Jackson International AirportFlow Number vs. Asphalt Content
0
2,000
4,000
6,000
8,000
10,000
12,000
14,000
16,000
18,000
20,000
4.1 (75 gyr) 4.4 (50 gyr) 4.7 (35 gyr) 5.3 (16 gyr*)
Asphalt Content, %
Flo
wN
um
be
r
100
200
350
+ +++++
FF FF
DeviatorStress
NT NT
F - Failed NT - Not Tested
* Extrapolated Value
Figure 57: Flow Number Test Results for Jackson-Evers International Airport(JAN)
Figure 58 presents performance testing results conducted at 131° F for the
Newark-Liberty International Airport (EWR). A total of four asphalt binder contents
were used for materials obtained from EWR, representing design compactive efforts of
35, 50, 75 and 132 gyrations. From Table 31, the largest typical tire pressure for EWR is
200 psi. Figure 58 shows that mixes prepared at all four asphalt binder contents reached
20,000 cycles at a deviator stress of 200 psi. All of the samples tested at a 350 psi
deviator stress reached tertiary flow prior to the 20,000 cycles. The rut resistance
exhibited by this mix is somewhat surprising because the mixture selected from EWR for
performance testing was from a shoulder. Recall that two pavements were sampled from
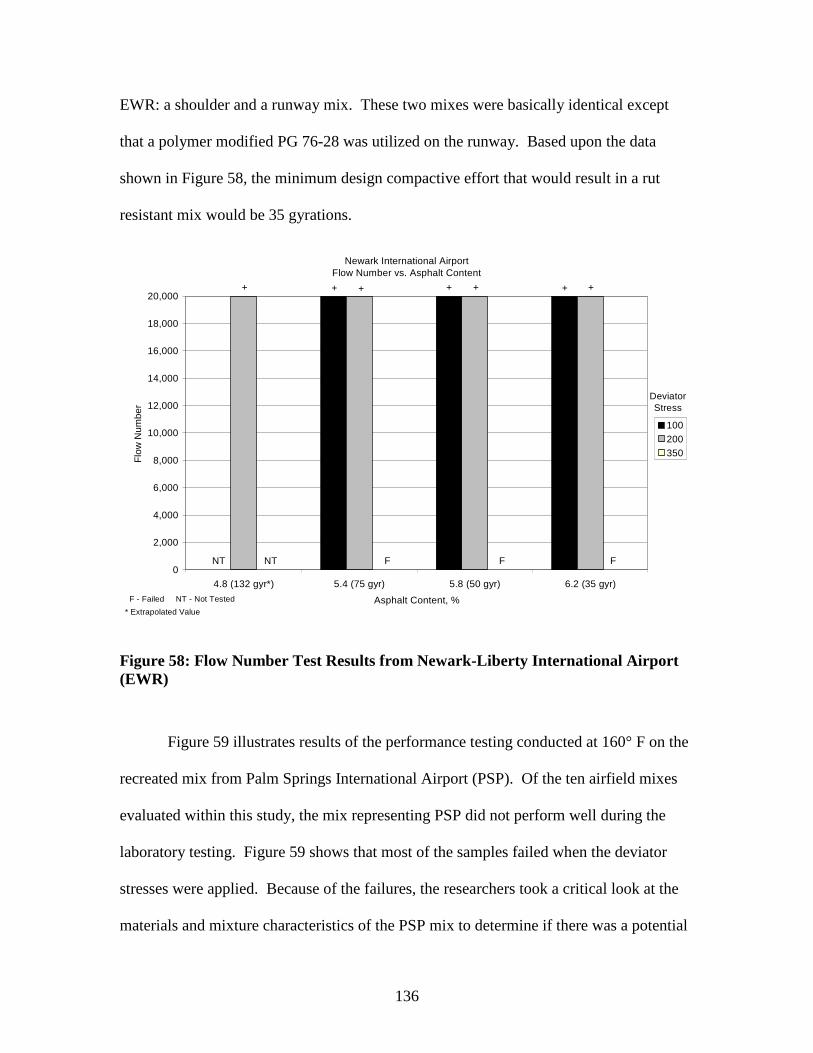
136
EWR: a shoulder and a runway mix. These two mixes were basically identical except
that a polymer modified PG 76-28 was utilized on the runway. Based upon the data
shown in Figure 58, the minimum design compactive effort that would result in a rut
resistant mix would be 35 gyrations.
Newark International AirportFlow Number vs. Asphalt Content
0
2,000
4,000
6,000
8,000
10,000
12,000
14,000
16,000
18,000
20,000
4.8 (132 gyr*) 5.4 (75 gyr) 5.8 (50 gyr) 6.2 (35 gyr)
Asphalt Content, %
Flo
wN
um
be
r
100
200
350
DeviatorStress
+ ++++++
FNT FFNT
F - Failed NT - Not Tested
* Extrapolated Value
Figure 58: Flow Number Test Results from Newark-Liberty International Airport(EWR)
Figure 59 illustrates results of the performance testing conducted at 160° F on the
recreated mix from Palm Springs International Airport (PSP). Of the ten airfield mixes
evaluated within this study, the mix representing PSP did not perform well during the
laboratory testing. Figure 59 shows that most of the samples failed when the deviator
stresses were applied. Because of the failures, the researchers took a critical look at the
materials and mixture characteristics of the PSP mix to determine if there was a potential
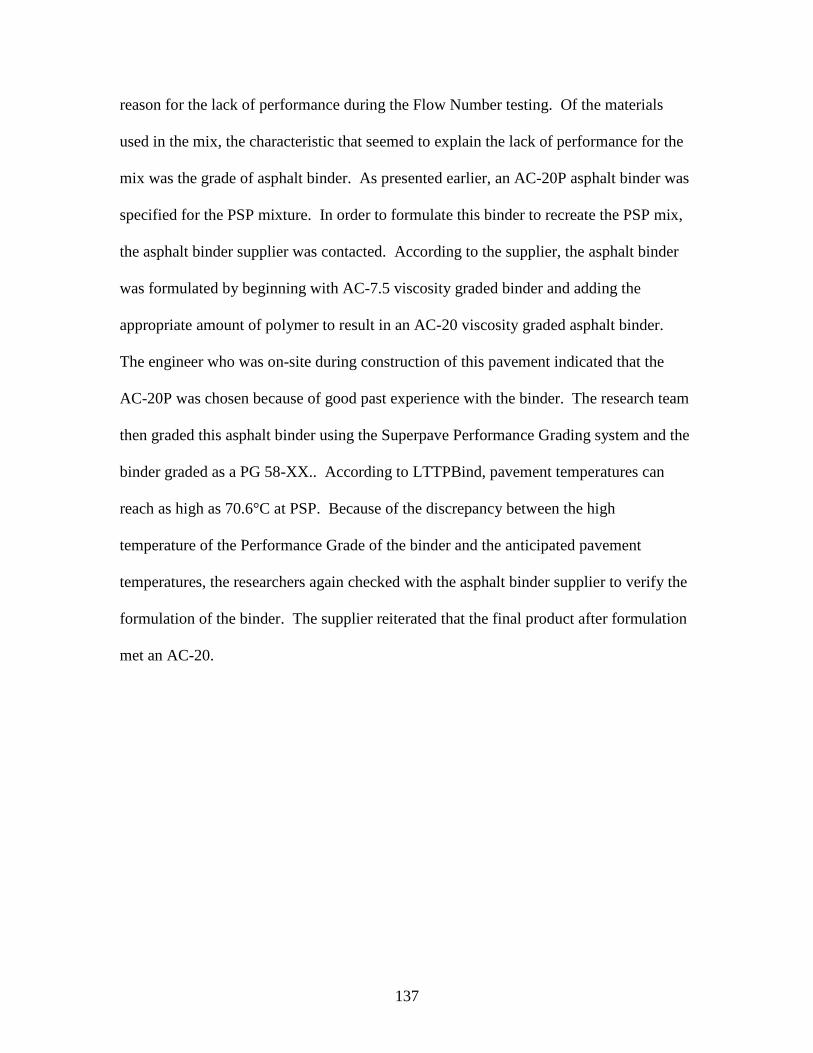
137
reason for the lack of performance during the Flow Number testing. Of the materials
used in the mix, the characteristic that seemed to explain the lack of performance for the
mix was the grade of asphalt binder. As presented earlier, an AC-20P asphalt binder was
specified for the PSP mixture. In order to formulate this binder to recreate the PSP mix,
the asphalt binder supplier was contacted. According to the supplier, the asphalt binder
was formulated by beginning with AC-7.5 viscosity graded binder and adding the
appropriate amount of polymer to result in an AC-20 viscosity graded asphalt binder.
The engineer who was on-site during construction of this pavement indicated that the
AC-20P was chosen because of good past experience with the binder. The research team
then graded this asphalt binder using the Superpave Performance Grading system and the
binder graded as a PG 58-XX.. According to LTTPBind, pavement temperatures can
reach as high as 70.6°C at PSP. Because of the discrepancy between the high
temperature of the Performance Grade of the binder and the anticipated pavement
temperatures, the researchers again checked with the asphalt binder supplier to verify the
formulation of the binder. The supplier reiterated that the final product after formulation
met an AC-20.

138
Palm Springs International AirportFlow Number vs. Asphalt Content
0
2,000
4,000
6,000
8,000
10,000
12,000
14,000
16,000
18,000
20,000
4.9 (100 gyr) 5.5 (In-place/50 gyr) 5.9 (27 gyr*)
Asphalt Content, %
Flo
wN
um
be
r
100
200
350
DeviatorStress
F F
F - Failed NT - Not Tested
* Extrapolated Value
F F FF F
Figure 59: Flow Number Test Results from Palm Springs International Airport(PSP)
A potential reason that the pavement has performed well is shown in Figure 60.
This figure shows the average number of aircraft operations and the average maximum
air temperatures for each month of the year 2006. Aircraft operations are much higher
during cooler months. During the hotter moths, operations are drastically reduced.
Because of the concerns with the asphalt binder and lack of laboratory performance, no
observations about the desirable design gyration level for PSP are made.
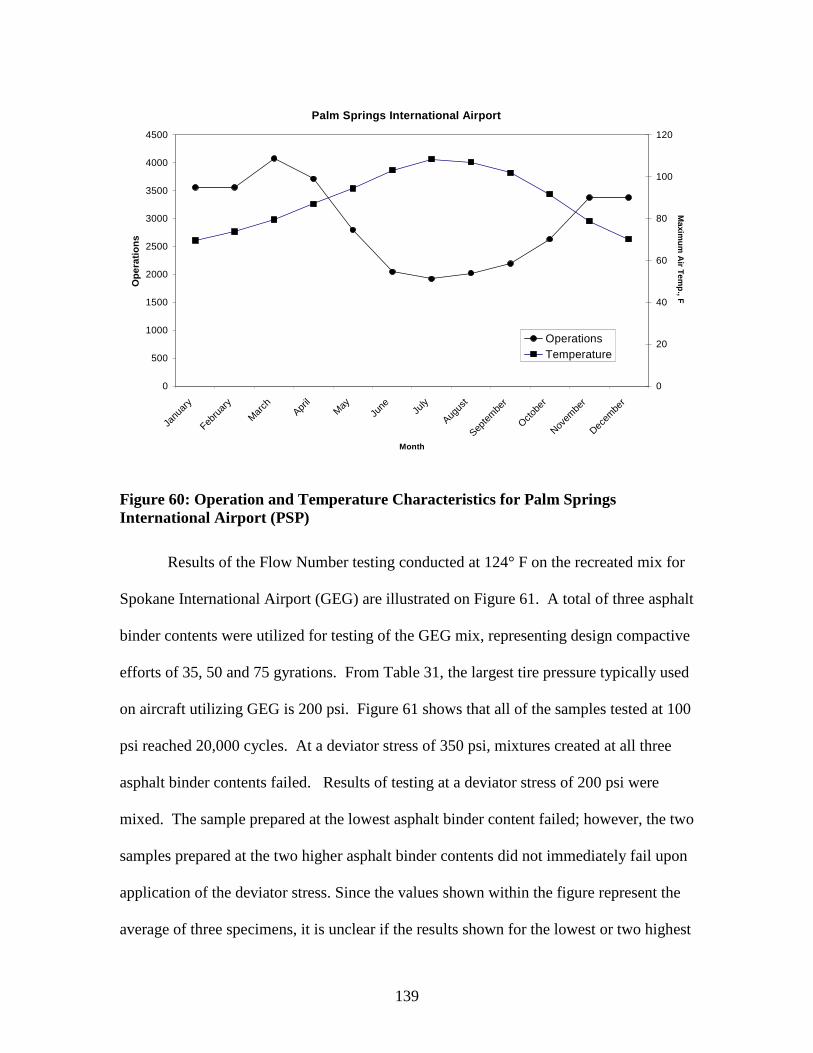
139
Palm Springs International Airport
0
500
1000
1500
2000
2500
3000
3500
4000
4500
Janu
ary
Febru
ary
Mar
chApr
ilM
ayJu
ne July
Augus
t
Septe
mbe
r
Oct
ober
Nov
embe
r
Dec
embe
r
Month
Op
era
tio
ns
0
20
40
60
80
100
120M
axim
um
Air
Te
mp
.,F
Operations
Temperature
Figure 60: Operation and Temperature Characteristics for Palm SpringsInternational Airport (PSP)
Results of the Flow Number testing conducted at 124° F on the recreated mix for
Spokane International Airport (GEG) are illustrated on Figure 61. A total of three asphalt
binder contents were utilized for testing of the GEG mix, representing design compactive
efforts of 35, 50 and 75 gyrations. From Table 31, the largest tire pressure typically used
on aircraft utilizing GEG is 200 psi. Figure 61 shows that all of the samples tested at 100
psi reached 20,000 cycles. At a deviator stress of 350 psi, mixtures created at all three
asphalt binder contents failed. Results of testing at a deviator stress of 200 psi were
mixed. The sample prepared at the lowest asphalt binder content failed; however, the two
samples prepared at the two higher asphalt binder contents did not immediately fail upon
application of the deviator stress. Since the values shown within the figure represent the
average of three specimens, it is unclear if the results shown for the lowest or two highest
140
asphalt binder contents are correct; therefore, no specific observations about the
appropriate design gyration level is made.
Spokane International AirportFlow Number vs. Asphalt Content
0
2,000
4,000
6,000
8,000
10,000
12,000
14,000
16,000
18,000
20,000
5.9 (75 gyr) 6.3 (50 gyr) 6.7 (35 gyr)
Asphalt Content, %
Flo
wN
um
be
r
100
200
350
F FF
+ ++
DeviatorStress
F - Failed
F
Figure 61: Flow Number Results for Spokane (GEG)
Table 32 summarizes the estimated gyration levels determined utilizing the results
of the performance testing. Design compactive efforts for Marshall designed mixes
currently contained within Item P-401 are based upon a combination of aircraft gross
weights or tire pressure. The design compactive efforts are differentiated based upon a
gross aircraft weight of 60,000 lbs or tire pressures of 100 psi. Within Table 32 are the
maximum gross taxi weights and tire pressures that were shown in Table 31.
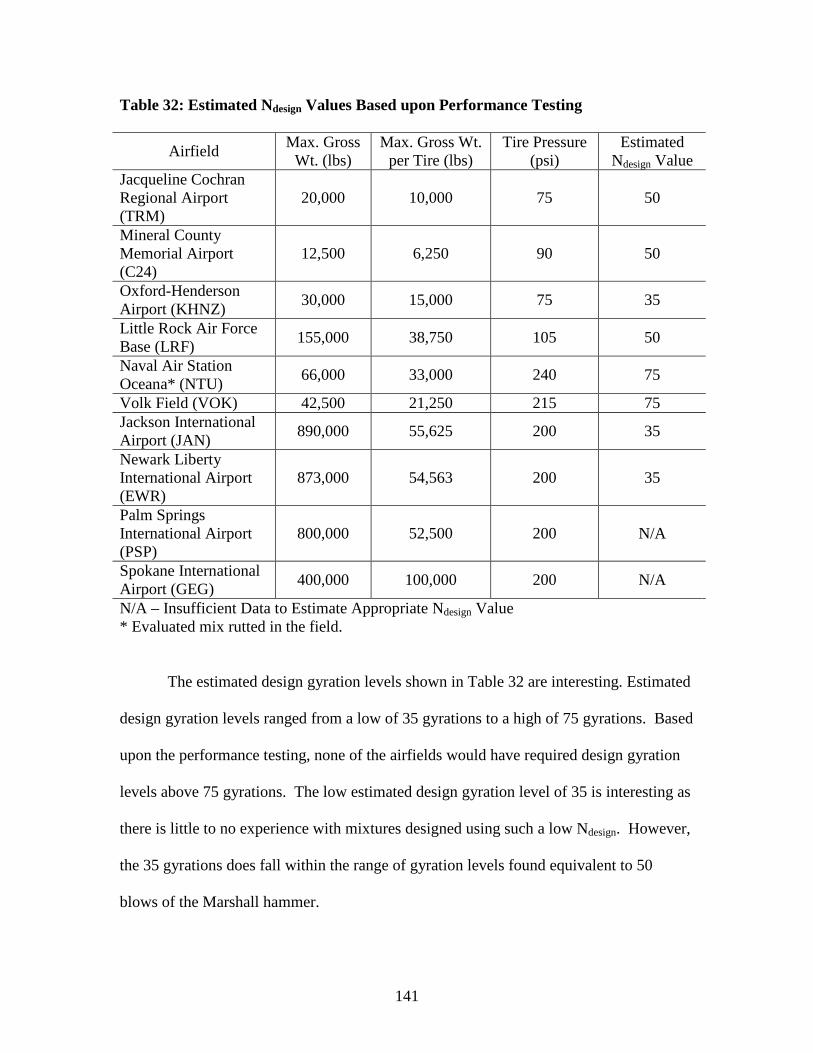
141
Table 32: Estimated Ndesign Values Based upon Performance Testing
AirfieldMax. Gross
Wt. (lbs)Max. Gross Wt.
per Tire (lbs)Tire Pressure
(psi)Estimated
Ndesign ValueJacqueline CochranRegional Airport(TRM)
20,000 10,000 75 50
Mineral CountyMemorial Airport(C24)
12,500 6,250 90 50
Oxford-HendersonAirport (KHNZ)
30,000 15,000 75 35
Little Rock Air ForceBase (LRF)
155,000 38,750 105 50
Naval Air StationOceana* (NTU)
66,000 33,000 240 75
Volk Field (VOK) 42,500 21,250 215 75Jackson InternationalAirport (JAN)
890,000 55,625 200 35
Newark LibertyInternational Airport(EWR)
873,000 54,563 200 35
Palm SpringsInternational Airport(PSP)
800,000 52,500 200 N/A
Spokane InternationalAirport (GEG)
400,000 100,000 200 N/A
N/A – Insufficient Data to Estimate Appropriate Ndesign Value* Evaluated mix rutted in the field.
The estimated design gyration levels shown in Table 32 are interesting. Estimated
design gyration levels ranged from a low of 35 gyrations to a high of 75 gyrations. Based
upon the performance testing, none of the airfields would have required design gyration
levels above 75 gyrations. The low estimated design gyration level of 35 is interesting as
there is little to no experience with mixtures designed using such a low Ndesign. However,
the 35 gyrations does fall within the range of gyration levels found equivalent to 50
blows of the Marshall hammer.
142
The three general aviation mixtures (TRM, C24, and KHNZ) had estimated
design compactive efforts ranging from 35 to 50. Two of the three had an estimated
design compactive effort of 50 (TRM and C24) while the third had an estimated design
compactive effort of 35 (KHNZ). The mix from C24 could potentially have an
appropriate design compactive effort of less than 50 as the mix was rut resistant even at a
200 psi deviator stress at the highest asphalt binder content tested (representing a design
compactive effort of 50 gyrations). The actual design compactive efforts for these mixes
during mix design were as follows: TRM, 75 blows per face of the Marshall hammer;
C24, 76 gyrations of the SGC; and KHNZ, 75 gyrations of the SGC. Figures 38 and 39
showed the ultimate densities for these three airfield pavements. None of the three mixes
reached an ultimate density equal to the design density. This would suggest that the three
mixes were designed using a compactive effort that was greater than what was needed.
All three of these airfields had aircraft utilizing the pavements with maximum gross taxi
weights of 30,000 lbs or less and tire pressures less than 90 psi. Based upon Item P-401,
the appropriate design compactive effort for these three mixes would have been 50 blows
per face of the Marshall hammer. Based upon the SGC gyration range equivalent to a 50
blow Marshall design, which was 32 to 40 gyrations, this data suggests that an Ndesign
value of 40 would be appropriate for general aviation airfields.
Another interesting observation from Table 32 is that the three military airfields,
LRF, NTU and VOK, had somewhat similar estimated design gyration levels ranging
from 50 to 75 gyrations. Two of these military airfields also had the highest tire
pressures anticipated to traffic the pavements with NTU having 240 psi tires and VOK
having 215 psi tires. The 75 gyration levels shown in Table 32 are higher than the
143
equivalent range of design gyrations (43 to 55) corresponding to 75 blows of the Marshall
hammer that was found in this project. This would indicate that the 75 blow per face
design compactive effort may not have been appropriate for these projects. Additionally,
airfields, especially military, in which aircraft having very high tire pressures will need to
be designed at higher design gyrations than at typical commercial airfields.
The final grouping of data was for commercial airfields, which included JAN,
EWR, PSP and GEG. Design tire pressures for all four of these airfields were 200 psi.
Unfortunately, the performance testing data from two of these airfields (PSP and GEG)
did not pass the test of reasonableness, as described previously. For the remaining two
airfields, the estimated design gyration level was 35 gyrations. As stated previously, this
level of design gyrations corresponds to a 50 blow Marshall design compactive effort
which experience suggests is unreasonable.
Discussion on Selection of Design Gyration Levels for Airfield Superpave Mix Designs
In order to develop Ndesign values for adapting the Superpave gyratory compactor
methods for airfield pavements, the researchers evaluated the data using three different
methods. The first method looked at the ultimate densities of the ten airfield pavements
included within this project. Results from this analysis suggested that airfield mixes that
had been designed using the Superpave gyratory compactor had been designed at Ndesign
values that were too high. The ultimate densities of these pavements were all below the
design densities, suggesting a lack of asphalt binder in the mixes.
The second method for evaluating the appropriate Ndesign levels involved
comparing the density that resulted from Marshall hammer and SGC compaction. As

144
expected, there was no single gyration level that was exactly equal to either 50 blows per
face or 75 blows per face of the Marshall hammer. Therefore, ranges of gyration levels
equivalent to each Marshall hammer compactive effort were developed using materials
from the ten airfields visited during this project. Based upon the data, the gyration level
equivalent to 50 blows per face of the Marshall hammer was somewhere between 32 and
40 gyrations. The gyration level equivalent to 75 blows per face of the Marshall hammer
was somewhere between 43 and 55 gyrations.
The final method of evaluating the data was to analyze the results of the
performance testing of mixes having different asphalt binder contents. The goal of this
testing was to maximize durability, while minimizing rutting potential. For general
aviation types of airfields which operate light aircraft with relatively low tire pressures,
the analysis of the performance data indicated that an appropriate Ndesign value would be
approximately 40. This value falls within the range of gyration levels equivalent to 50
blows per face of the Marshall hammer and seems reasonable. For the military type of
airfields which operate aircraft with relatively high tire pressures, the analysis of
performance data suggested that an appropriate Ndesign value of approximately 75 would
be appropriate. However, the data did also indicate that for military airfields in which
aircraft having relatively lower tire pressures, a lower Ndesign value would also be
appropriate. Unfortunately, the data for commercial type airfields was inconclusive.
As shown in Table 32, selection of design gyration levels appear to be more
related to tire pressures than aircraft gross weights. For instance, the maximum weight of
aircrafts at LRF is 155,000 lbs. The estimated Ndesign value for this airfield was 50
gyrations. However, at NTV, the maximum gross weight of aircraft was 33,000 lbs. The
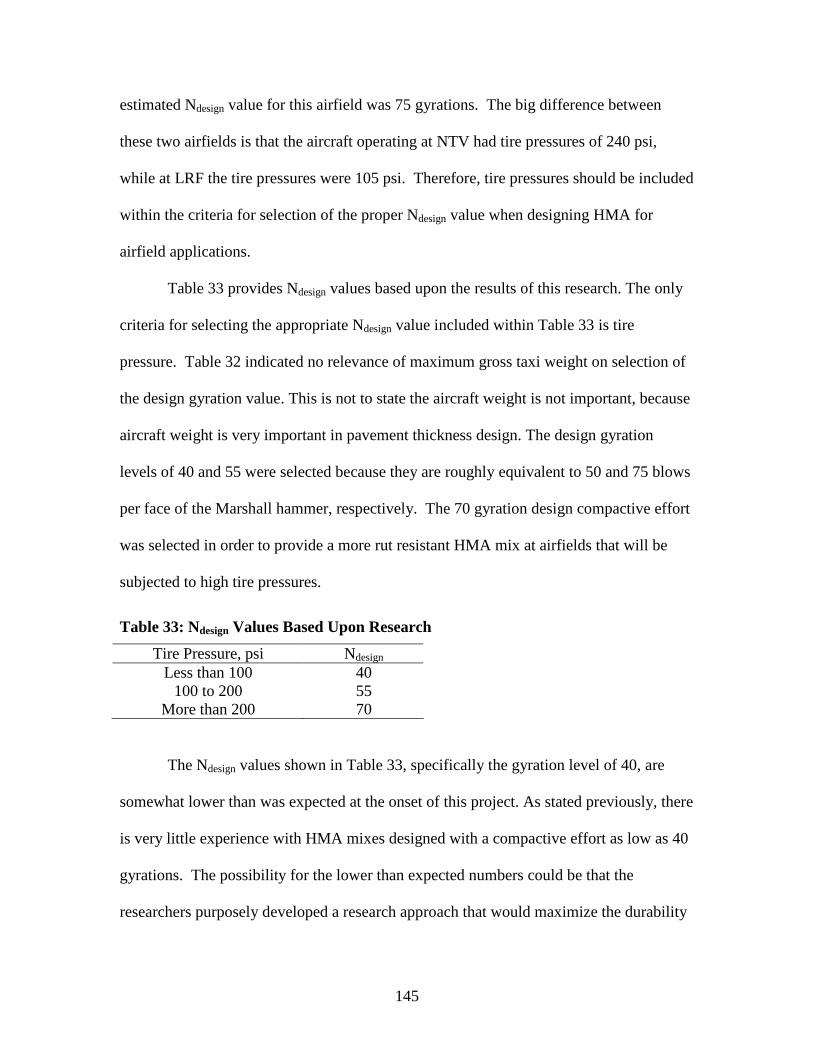
145
estimated Ndesign value for this airfield was 75 gyrations. The big difference between
these two airfields is that the aircraft operating at NTV had tire pressures of 240 psi,
while at LRF the tire pressures were 105 psi. Therefore, tire pressures should be included
within the criteria for selection of the proper Ndesign value when designing HMA for
airfield applications.
Table 33 provides Ndesign values based upon the results of this research. The only
criteria for selecting the appropriate Ndesign value included within Table 33 is tire
pressure. Table 32 indicated no relevance of maximum gross taxi weight on selection of
the design gyration value. This is not to state the aircraft weight is not important, because
aircraft weight is very important in pavement thickness design. The design gyration
levels of 40 and 55 were selected because they are roughly equivalent to 50 and 75 blows
per face of the Marshall hammer, respectively. The 70 gyration design compactive effort
was selected in order to provide a more rut resistant HMA mix at airfields that will be
subjected to high tire pressures.
Table 33: Ndesign Values Based Upon Research
Tire Pressure, psi Ndesign
Less than 100 40100 to 200 55
More than 200 70
The Ndesign values shown in Table 33, specifically the gyration level of 40, are
somewhat lower than was expected at the onset of this project. As stated previously, there
is very little experience with HMA mixes designed with a compactive effort as low as 40
gyrations. The possibility for the lower than expected numbers could be that the
researchers purposely developed a research approach that would maximize the durability
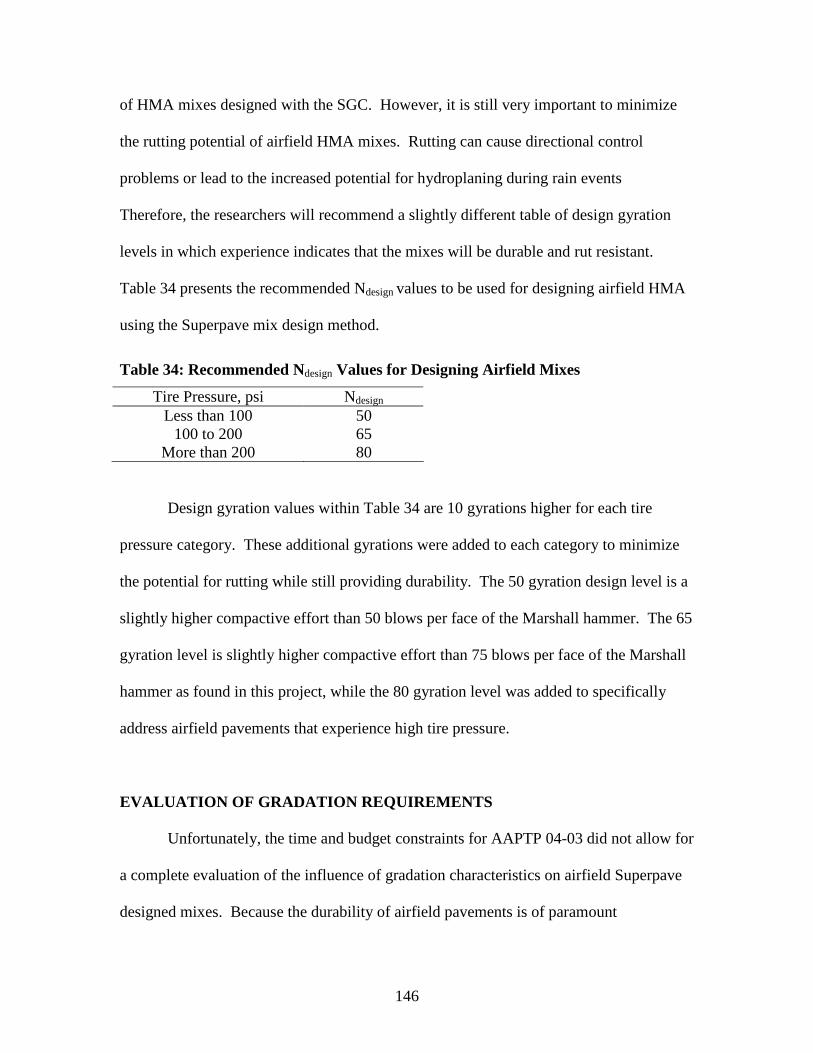
146
of HMA mixes designed with the SGC. However, it is still very important to minimize
the rutting potential of airfield HMA mixes. Rutting can cause directional control
problems or lead to the increased potential for hydroplaning during rain events
Therefore, the researchers will recommend a slightly different table of design gyration
levels in which experience indicates that the mixes will be durable and rut resistant.
Table 34 presents the recommended Ndesign values to be used for designing airfield HMA
using the Superpave mix design method.
Table 34: Recommended Ndesign Values for Designing Airfield Mixes
Tire Pressure, psi Ndesign
Less than 100 50100 to 200 65
More than 200 80
Design gyration values within Table 34 are 10 gyrations higher for each tire
pressure category. These additional gyrations were added to each category to minimize
the potential for rutting while still providing durability. The 50 gyration design level is a
slightly higher compactive effort than 50 blows per face of the Marshall hammer. The 65
gyration level is slightly higher compactive effort than 75 blows per face of the Marshall
hammer as found in this project, while the 80 gyration level was added to specifically
address airfield pavements that experience high tire pressure.
EVALUATION OF GRADATION REQUIREMENTS
Unfortunately, the time and budget constraints for AAPTP 04-03 did not allow for
a complete evaluation of the influence of gradation characteristics on airfield Superpave
designed mixes. Because the durability of airfield pavements is of paramount
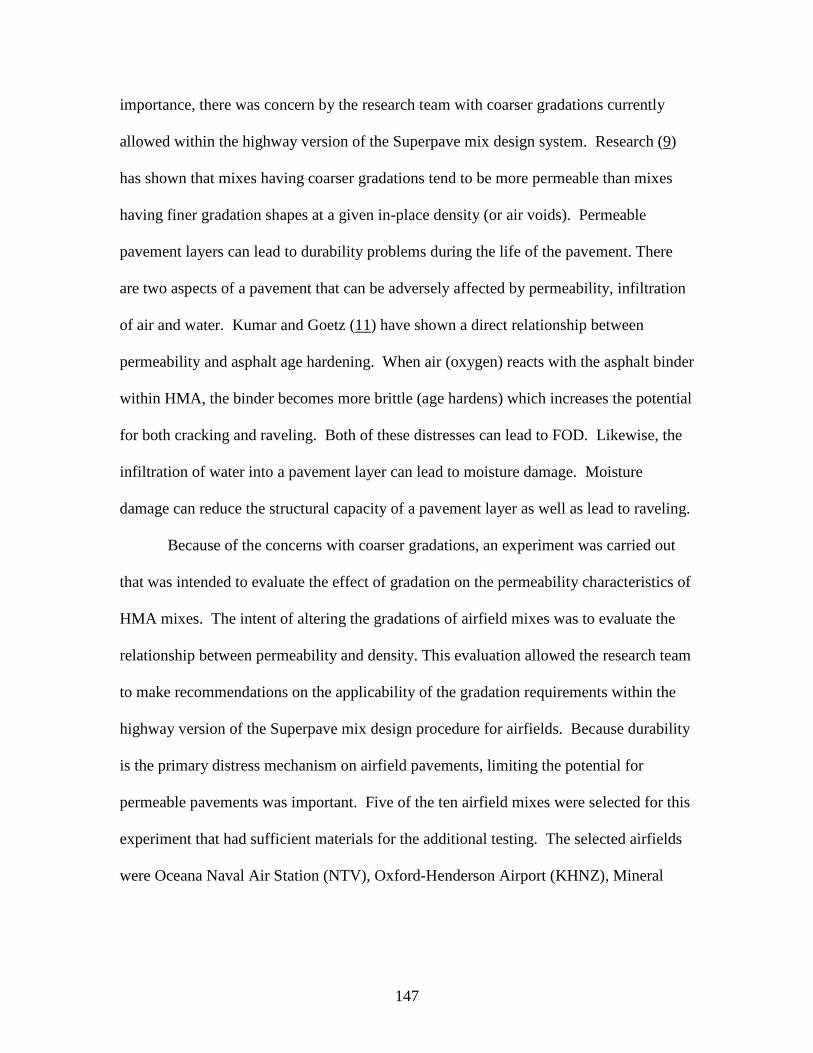
147
importance, there was concern by the research team with coarser gradations currently
allowed within the highway version of the Superpave mix design system. Research (9)
has shown that mixes having coarser gradations tend to be more permeable than mixes
having finer gradation shapes at a given in-place density (or air voids). Permeable
pavement layers can lead to durability problems during the life of the pavement. There
are two aspects of a pavement that can be adversely affected by permeability, infiltration
of air and water. Kumar and Goetz (11) have shown a direct relationship between
permeability and asphalt age hardening. When air (oxygen) reacts with the asphalt binder
within HMA, the binder becomes more brittle (age hardens) which increases the potential
for both cracking and raveling. Both of these distresses can lead to FOD. Likewise, the
infiltration of water into a pavement layer can lead to moisture damage. Moisture
damage can reduce the structural capacity of a pavement layer as well as lead to raveling.
Because of the concerns with coarser gradations, an experiment was carried out
that was intended to evaluate the effect of gradation on the permeability characteristics of
HMA mixes. The intent of altering the gradations of airfield mixes was to evaluate the
relationship between permeability and density. This evaluation allowed the research team
to make recommendations on the applicability of the gradation requirements within the
highway version of the Superpave mix design procedure for airfields. Because durability
is the primary distress mechanism on airfield pavements, limiting the potential for
permeable pavements was important. Five of the ten airfield mixes were selected for this
experiment that had sufficient materials for the additional testing. The selected airfields
were Oceana Naval Air Station (NTV), Oxford-Henderson Airport (KHNZ), Mineral
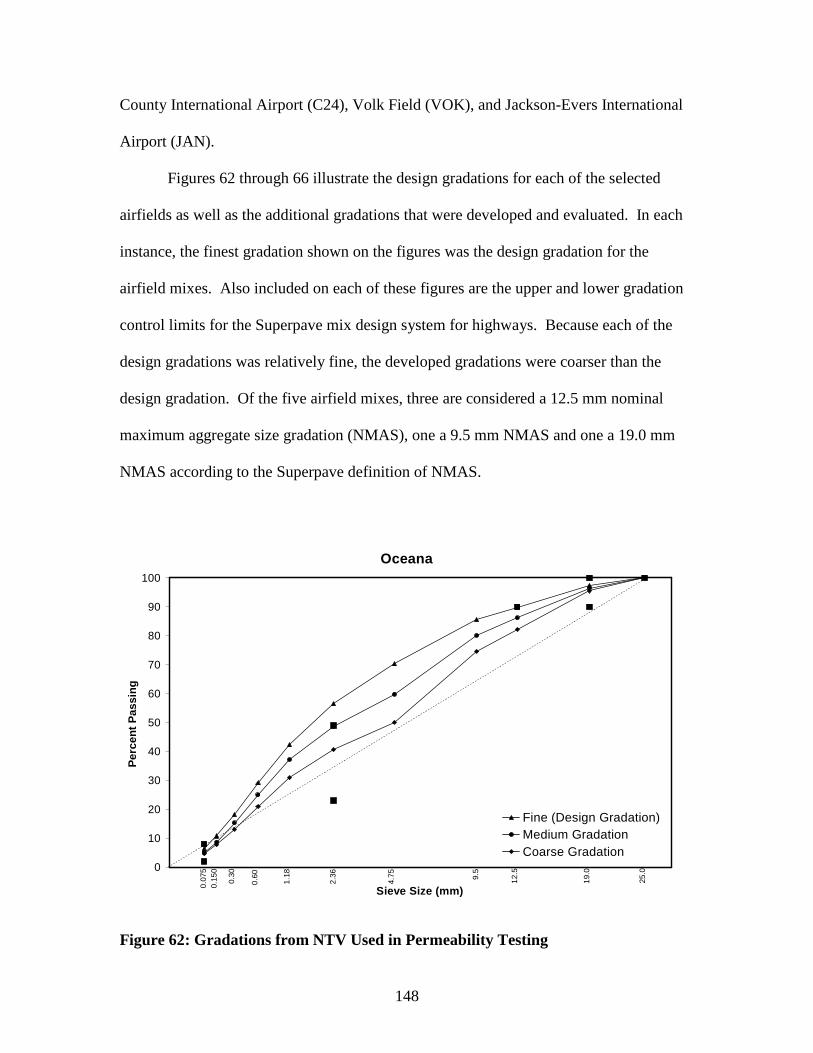
148
County International Airport (C24), Volk Field (VOK), and Jackson-Evers International
Airport (JAN).
Figures 62 through 66 illustrate the design gradations for each of the selected
airfields as well as the additional gradations that were developed and evaluated. In each
instance, the finest gradation shown on the figures was the design gradation for the
airfield mixes. Also included on each of these figures are the upper and lower gradation
control limits for the Superpave mix design system for highways. Because each of the
design gradations was relatively fine, the developed gradations were coarser than the
design gradation. Of the five airfield mixes, three are considered a 12.5 mm nominal
maximum aggregate size gradation (NMAS), one a 9.5 mm NMAS and one a 19.0 mm
NMAS according to the Superpave definition of NMAS.
Oceana
2.3
6
0.0
75
25.0
19.0
12.5
9.5
4.7
5
0.1
50
0.3
0
1.1
8
0.6
00
10
20
30
40
50
60
70
80
90
100
Sieve Size (mm)
Pe
rce
nt
Pa
ss
ing
Fine (Design Gradation)
Medium Gradation
Coarse Gradation
Figure 62: Gradations from NTV Used in Permeability Testing
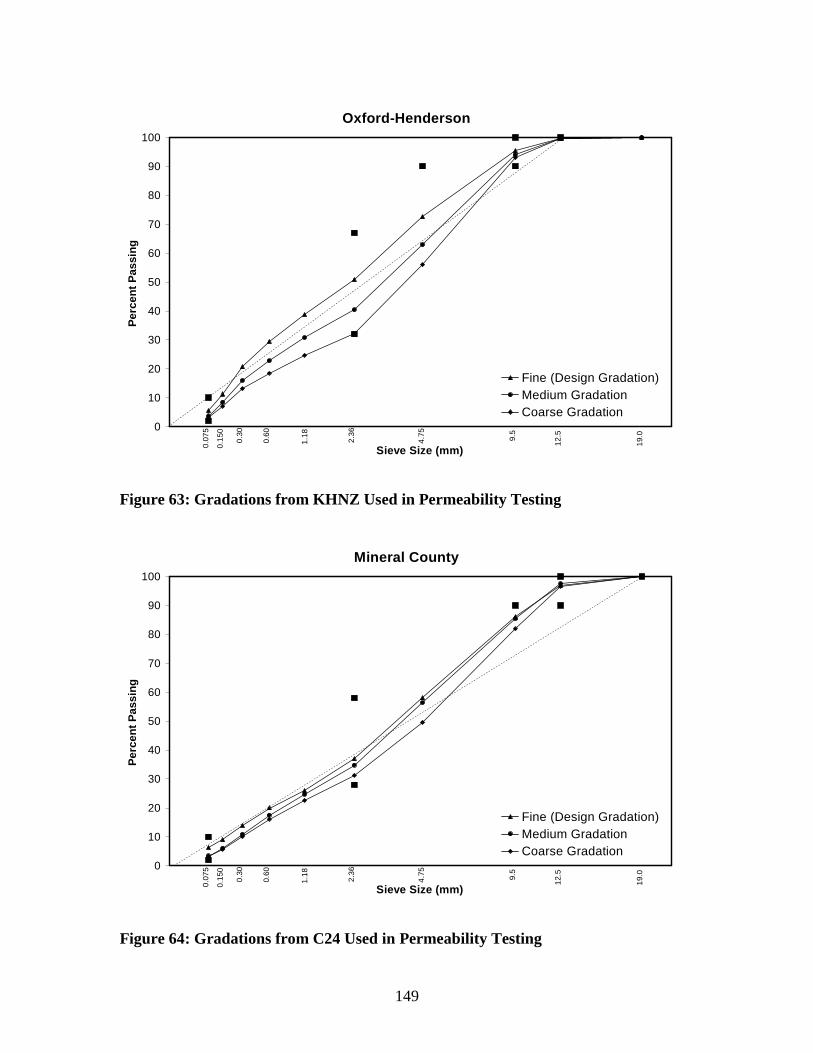
149
Oxford-Henderson
1.1
8
19.0
12.59.5
4.7
5
2.3
6
0.0
75
0.1
50
0.6
0
0.3
00
10
20
30
40
50
60
70
80
90
100
Sieve Size (mm)
Pe
rce
nt
Pa
ss
ing
Fine (Design Gradation)
Medium Gradation
Coarse Gradation
Figure 63: Gradations from KHNZ Used in Permeability Testing
Mineral County
1.1
8
19.0
12.59.5
4.7
5
2.3
6
0.0
75
0.1
50
0.6
0
0.3
00
10
20
30
40
50
60
70
80
90
100
Sieve Size (mm)
Pe
rce
nt
Pa
ss
ing
Fine (Design Gradation)
Medium Gradation
Coarse Gradation
Figure 64: Gradations from C24 Used in Permeability Testing
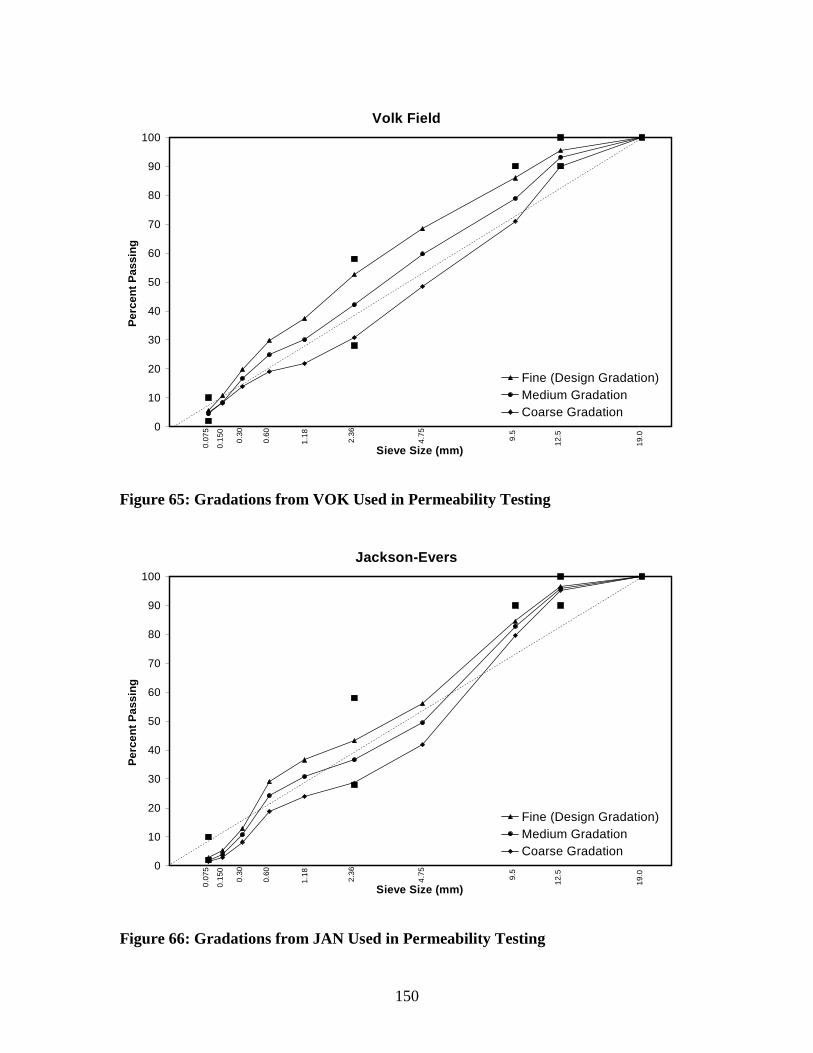
150
Volk Field
1.1
8
19.0
12.59.5
4.7
5
2.3
6
0.0
75
0.1
50
0.6
0
0.3
00
10
20
30
40
50
60
70
80
90
100
Sieve Size (mm)
Pe
rce
nt
Pa
ss
ing
Fine (Design Gradation)
Medium Gradation
Coarse Gradation
Figure 65: Gradations from VOK Used in Permeability Testing
Jackson-Evers
1.1
8
19.0
12.59.5
4.7
5
2.3
6
0.0
75
0.1
50
0.6
0
0.3
00
10
20
30
40
50
60
70
80
90
100
Sieve Size (mm)
Pe
rce
nt
Pa
ss
ing
Fine (Design Gradation)
Medium Gradation
Coarse Gradation
Figure 66: Gradations from JAN Used in Permeability Testing
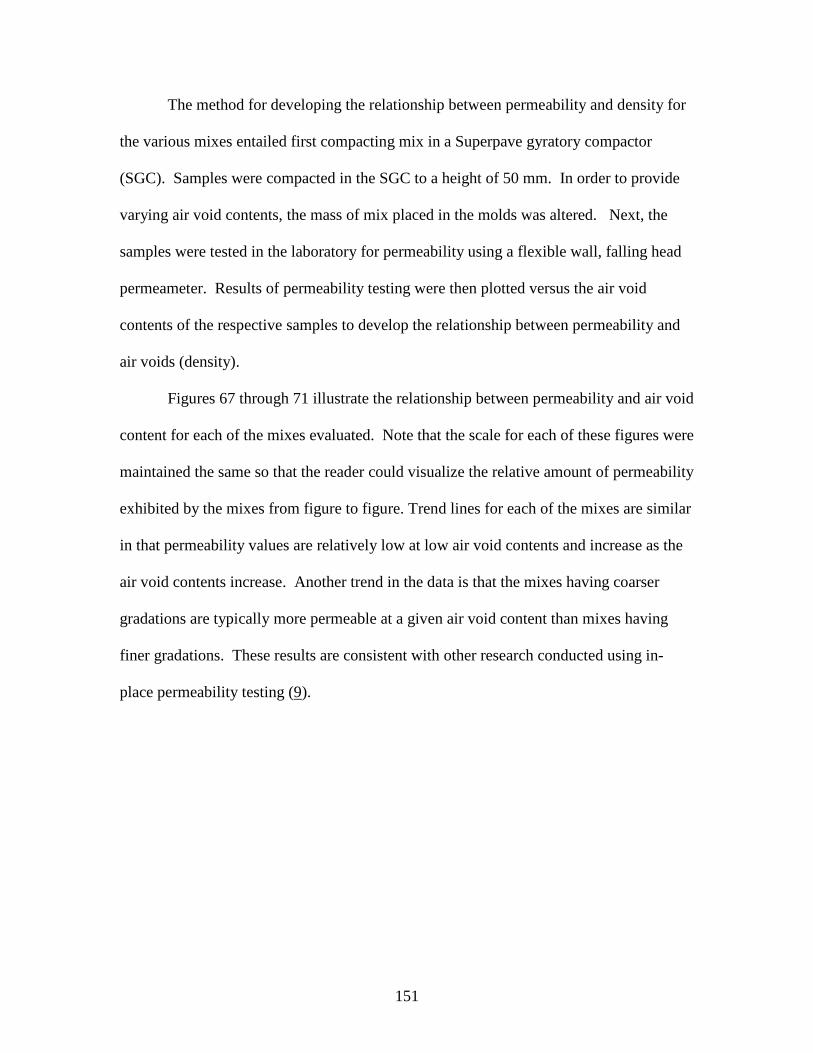
151
The method for developing the relationship between permeability and density for
the various mixes entailed first compacting mix in a Superpave gyratory compactor
(SGC). Samples were compacted in the SGC to a height of 50 mm. In order to provide
varying air void contents, the mass of mix placed in the molds was altered. Next, the
samples were tested in the laboratory for permeability using a flexible wall, falling head
permeameter. Results of permeability testing were then plotted versus the air void
contents of the respective samples to develop the relationship between permeability and
air voids (density).
Figures 67 through 71 illustrate the relationship between permeability and air void
content for each of the mixes evaluated. Note that the scale for each of these figures were
maintained the same so that the reader could visualize the relative amount of permeability
exhibited by the mixes from figure to figure. Trend lines for each of the mixes are similar
in that permeability values are relatively low at low air void contents and increase as the
air void contents increase. Another trend in the data is that the mixes having coarser
gradations are typically more permeable at a given air void content than mixes having
finer gradations. These results are consistent with other research conducted using in-
place permeability testing (9).
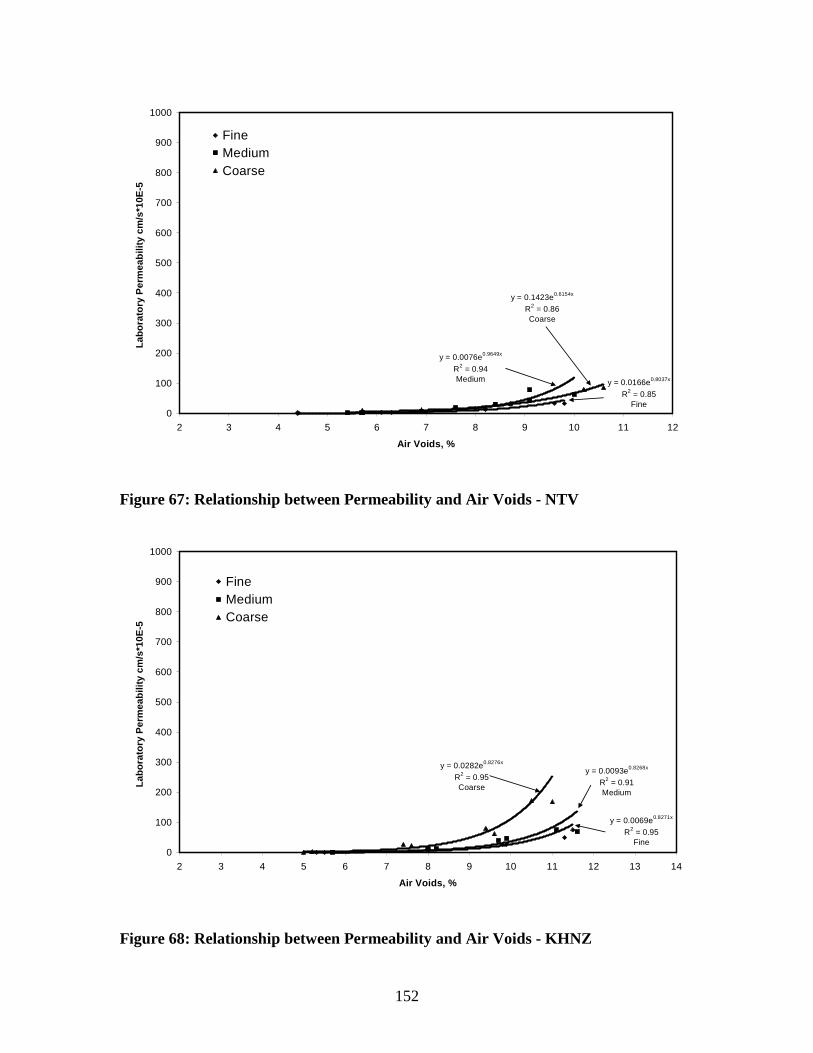
152
y = 0.0166e0.8037x
R2
= 0.85Fine
y = 0.0076e0.9649x
R2
= 0.94Medium
y = 0.1423e0.6154x
R2
= 0.86Coarse
0
100
200
300
400
500
600
700
800
900
1000
2 3 4 5 6 7 8 9 10 11 12
Air Voids, %
La
bo
rato
ryP
erm
ea
bil
ity
cm
/s*1
0E
-5Fine
Medium
Coarse
Figure 67: Relationship between Permeability and Air Voids - NTV
y = 0.0069e0.8271x
R2
= 0.95Fine
y = 0.0282e0.8276x
R2
= 0.95Coarse
y = 0.0093e0.8268x
R2
= 0.91Medium
0
100
200
300
400
500
600
700
800
900
1000
2 3 4 5 6 7 8 9 10 11 12 13 14
Air Voids, %
La
bo
rato
ryP
erm
ea
bil
ity
cm
/s*1
0E
-5
Fine
Medium
Coarse
Figure 68: Relationship between Permeability and Air Voids - KHNZ
153
y = 0.1973e0.6581x
R2 = 0.92Medium
y = 0.002e1.1971x
R2
= 0.69Coarse
y = 0.0001e1.5338x
R2
= 0.81Fine
0
100
200
300
400
500
600
700
800
900
1000
2 3 4 5 6 7 8 9 10 11 12 13 14
Air Voids, %
La
bo
rato
ryP
erm
ea
bil
ity
cm
/s*1
0E
-5
Fine
Medium
Coarse
Figure 69: Relationship between Permeability and Air Voids – C24
y = 0.0162e0.7449x
R2 = 0.91Fine
y = 0.0781e0.6283x
R2
= 0.90Medium
y = 0.2962e0.6414x
R2
= 0.94Coarse
0
100
200
300
400
500
600
700
800
900
1000
2 3 4 5 6 7 8 9 10 11 12 13 14
Air Voids, %
La
bo
rato
ryP
erm
ea
bil
ity
cm
/s*1
0E
-5
Fine
Medium
Coarse
Figure 70: Relationship between Permeability and Air Voids - VOK
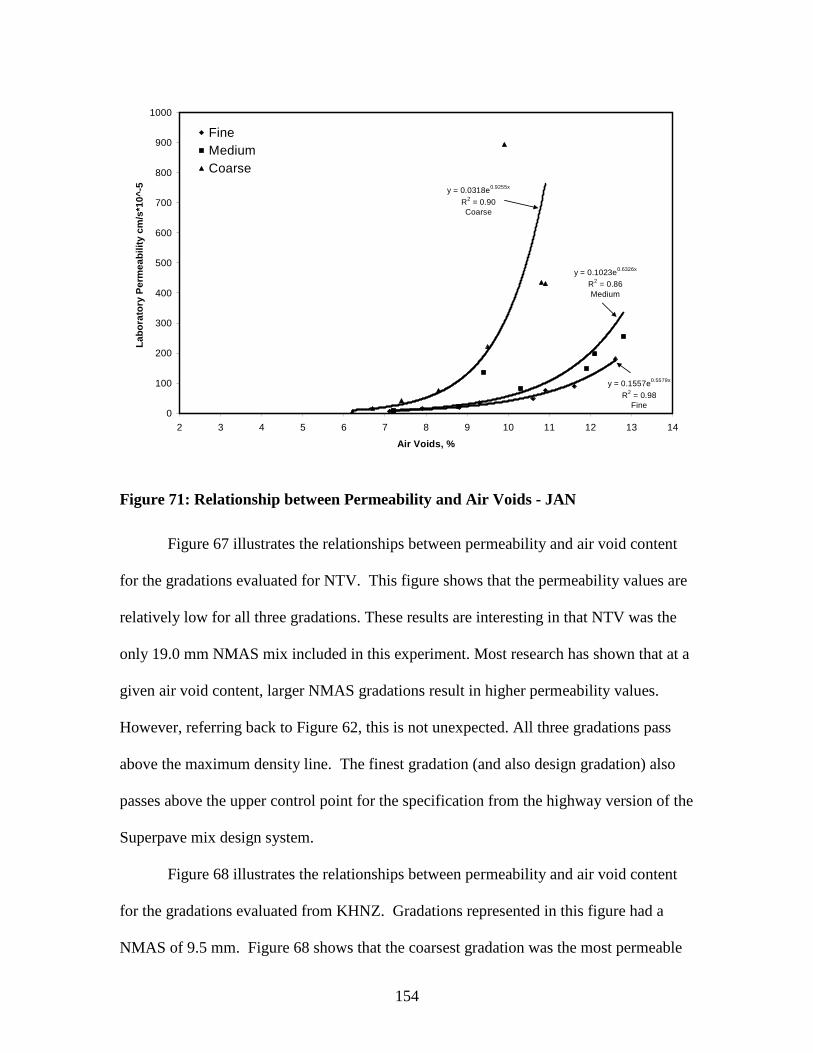
154
y = 0.1557e0.5579x
R2
= 0.98Fine
y = 0.1023e0.6326x
R2
= 0.86Medium
y = 0.0318e0.9255x
R2
= 0.90Coarse
0
100
200
300
400
500
600
700
800
900
1000
2 3 4 5 6 7 8 9 10 11 12 13 14
Air Voids, %
La
bo
rato
ryP
erm
ea
bil
ity
cm
/s*1
0^
-5Fine
Medium
Coarse
Figure 71: Relationship between Permeability and Air Voids - JAN
Figure 67 illustrates the relationships between permeability and air void content
for the gradations evaluated for NTV. This figure shows that the permeability values are
relatively low for all three gradations. These results are interesting in that NTV was the
only 19.0 mm NMAS mix included in this experiment. Most research has shown that at a
given air void content, larger NMAS gradations result in higher permeability values.
However, referring back to Figure 62, this is not unexpected. All three gradations pass
above the maximum density line. The finest gradation (and also design gradation) also
passes above the upper control point for the specification from the highway version of the
Superpave mix design system.
Figure 68 illustrates the relationships between permeability and air void content
for the gradations evaluated from KHNZ. Gradations represented in this figure had a
NMAS of 9.5 mm. Figure 68 shows that the coarsest gradation was the most permeable
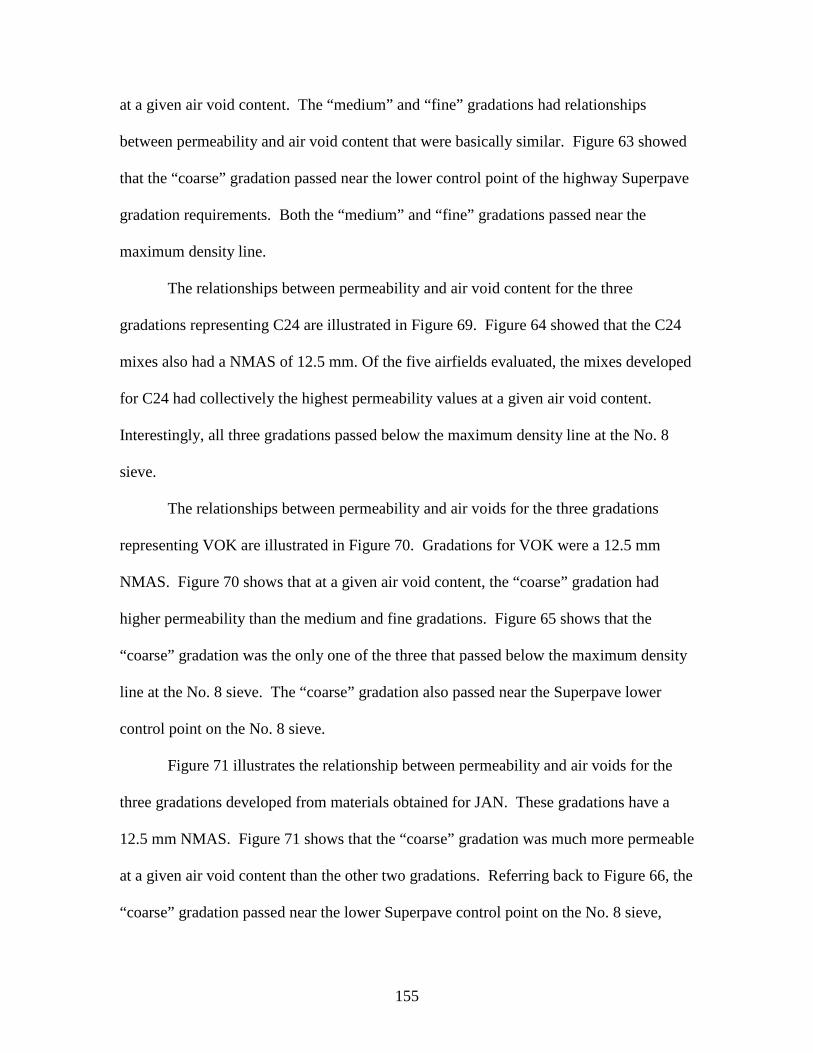
155
at a given air void content. The “medium” and “fine” gradations had relationships
between permeability and air void content that were basically similar. Figure 63 showed
that the “coarse” gradation passed near the lower control point of the highway Superpave
gradation requirements. Both the “medium” and “fine” gradations passed near the
maximum density line.
The relationships between permeability and air void content for the three
gradations representing C24 are illustrated in Figure 69. Figure 64 showed that the C24
mixes also had a NMAS of 12.5 mm. Of the five airfields evaluated, the mixes developed
for C24 had collectively the highest permeability values at a given air void content.
Interestingly, all three gradations passed below the maximum density line at the No. 8
sieve.
The relationships between permeability and air voids for the three gradations
representing VOK are illustrated in Figure 70. Gradations for VOK were a 12.5 mm
NMAS. Figure 70 shows that at a given air void content, the “coarse” gradation had
higher permeability than the medium and fine gradations. Figure 65 shows that the
“coarse” gradation was the only one of the three that passed below the maximum density
line at the No. 8 sieve. The “coarse” gradation also passed near the Superpave lower
control point on the No. 8 sieve.
Figure 71 illustrates the relationship between permeability and air voids for the
three gradations developed from materials obtained for JAN. These gradations have a
12.5 mm NMAS. Figure 71 shows that the “coarse” gradation was much more permeable
at a given air void content than the other two gradations. Referring back to Figure 66, the
“coarse” gradation passed near the lower Superpave control point on the No. 8 sieve,
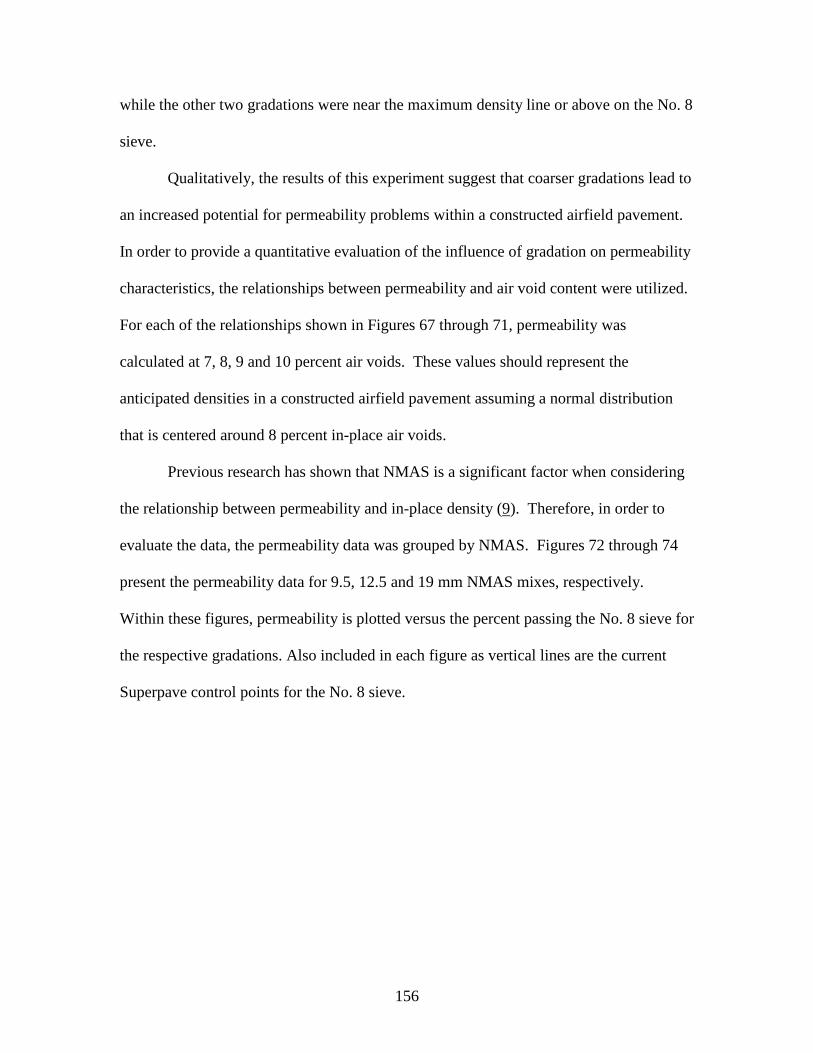
156
while the other two gradations were near the maximum density line or above on the No. 8
sieve.
Qualitatively, the results of this experiment suggest that coarser gradations lead to
an increased potential for permeability problems within a constructed airfield pavement.
In order to provide a quantitative evaluation of the influence of gradation on permeability
characteristics, the relationships between permeability and air void content were utilized.
For each of the relationships shown in Figures 67 through 71, permeability was
calculated at 7, 8, 9 and 10 percent air voids. These values should represent the
anticipated densities in a constructed airfield pavement assuming a normal distribution
that is centered around 8 percent in-place air voids.
Previous research has shown that NMAS is a significant factor when considering
the relationship between permeability and in-place density (9). Therefore, in order to
evaluate the data, the permeability data was grouped by NMAS. Figures 72 through 74
present the permeability data for 9.5, 12.5 and 19 mm NMAS mixes, respectively.
Within these figures, permeability is plotted versus the percent passing the No. 8 sieve for
the respective gradations. Also included in each figure as vertical lines are the current
Superpave control points for the No. 8 sieve.
157
9.5 mm NMAS Gradations
0
20
40
60
80
100
120
140
160
26 28 30 32 34 36 38 40 42 44 46 48 50 52 54 56 58 60 62 64 66 68 70 72 74
Percent Passing No. 8 (2.36 mm) Sieve
Pe
rmeab
ilit
y,1
0^
-5cm
/sec
7 % VTM
8% VTM
9% VTM
10% VTM
Current Superpave Control Point Limits
Figure 72: Relationship between Permeability and Percent Passing No. 8 Sieve - 9.5mm NMAS
12.5 mm NMAS Gradations
0
20
40
60
80
100
120
140
160
22 24 26 28 30 32 34 36 38 40 42 44 46 48 50 52 54 56 58 60 62
Percent Passing No. 8 (2.36 mm) Sieve
Pe
rmeab
ilit
y,1
0^
-5cm
/sec
7 % VTM
8% VTM
9% VTM
Current Superpave Control Point Limits
Figure 73: Relationship between Permeability and Percent Passing No. 8 Sieve - 12.5mm NMAS
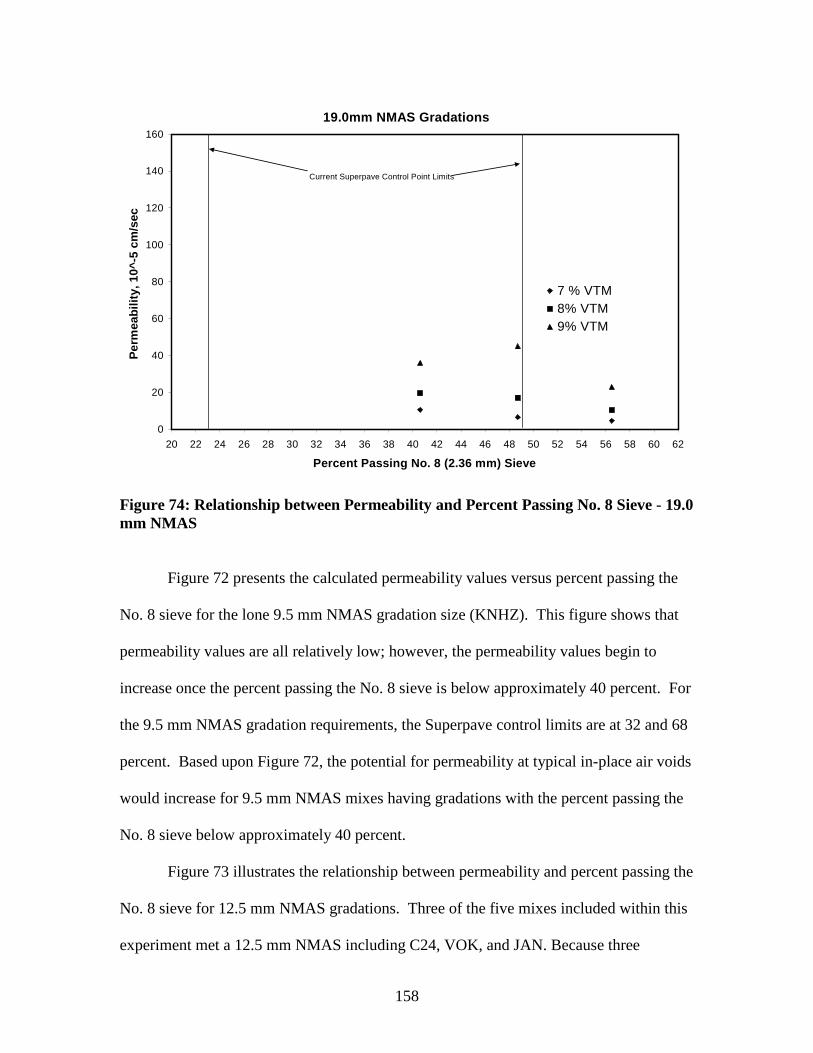
158
19.0mm NMAS Gradations
0
20
40
60
80
100
120
140
160
20 22 24 26 28 30 32 34 36 38 40 42 44 46 48 50 52 54 56 58 60 62
Percent Passing No. 8 (2.36 mm) Sieve
Pe
rmeab
ilit
y,1
0^
-5cm
/sec
7 % VTM
8% VTM
9% VTM
Current Superpave Control Point Limits
Figure 74: Relationship between Permeability and Percent Passing No. 8 Sieve - 19.0mm NMAS
Figure 72 presents the calculated permeability values versus percent passing the
No. 8 sieve for the lone 9.5 mm NMAS gradation size (KNHZ). This figure shows that
permeability values are all relatively low; however, the permeability values begin to
increase once the percent passing the No. 8 sieve is below approximately 40 percent. For
the 9.5 mm NMAS gradation requirements, the Superpave control limits are at 32 and 68
percent. Based upon Figure 72, the potential for permeability at typical in-place air voids
would increase for 9.5 mm NMAS mixes having gradations with the percent passing the
No. 8 sieve below approximately 40 percent.
Figure 73 illustrates the relationship between permeability and percent passing the
No. 8 sieve for 12.5 mm NMAS gradations. Three of the five mixes included within this
experiment met a 12.5 mm NMAS including C24, VOK, and JAN. Because three
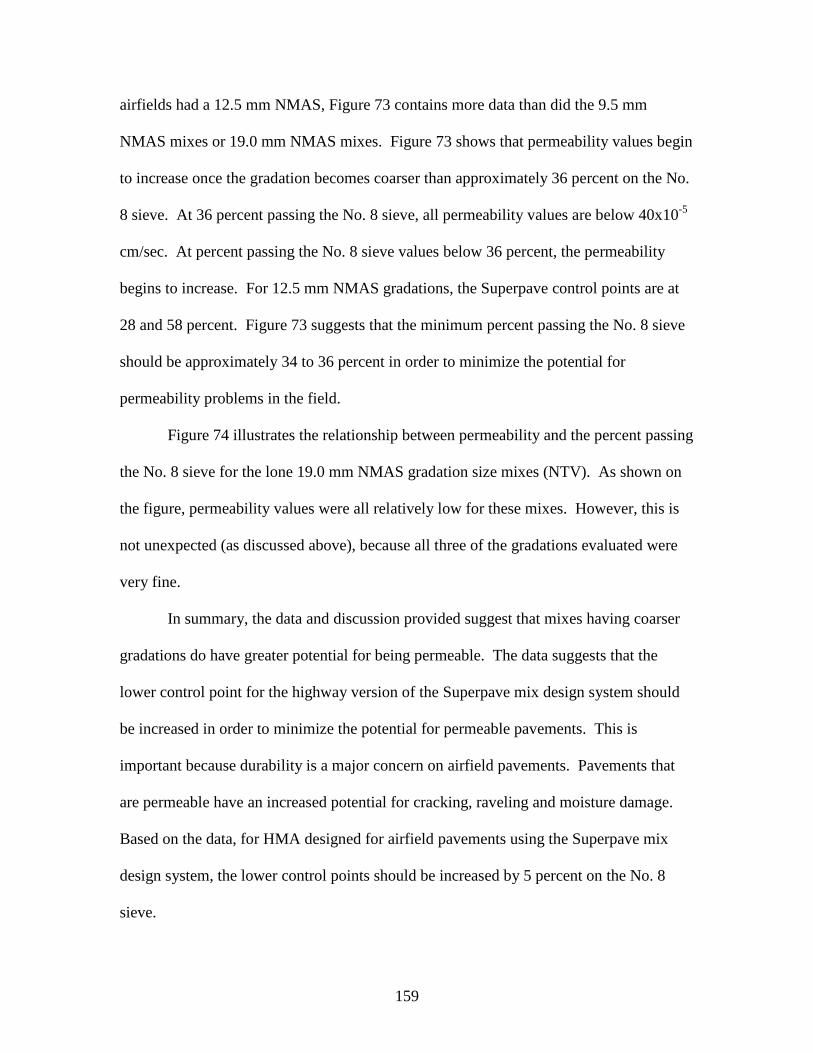
159
airfields had a 12.5 mm NMAS, Figure 73 contains more data than did the 9.5 mm
NMAS mixes or 19.0 mm NMAS mixes. Figure 73 shows that permeability values begin
to increase once the gradation becomes coarser than approximately 36 percent on the No.
8 sieve. At 36 percent passing the No. 8 sieve, all permeability values are below 40x10-5
cm/sec. At percent passing the No. 8 sieve values below 36 percent, the permeability
begins to increase. For 12.5 mm NMAS gradations, the Superpave control points are at
28 and 58 percent. Figure 73 suggests that the minimum percent passing the No. 8 sieve
should be approximately 34 to 36 percent in order to minimize the potential for
permeability problems in the field.
Figure 74 illustrates the relationship between permeability and the percent passing
the No. 8 sieve for the lone 19.0 mm NMAS gradation size mixes (NTV). As shown on
the figure, permeability values were all relatively low for these mixes. However, this is
not unexpected (as discussed above), because all three of the gradations evaluated were
very fine.
In summary, the data and discussion provided suggest that mixes having coarser
gradations do have greater potential for being permeable. The data suggests that the
lower control point for the highway version of the Superpave mix design system should
be increased in order to minimize the potential for permeable pavements. This is
important because durability is a major concern on airfield pavements. Pavements that
are permeable have an increased potential for cracking, raveling and moisture damage.
Based on the data, for HMA designed for airfield pavements using the Superpave mix
design system, the lower control points should be increased by 5 percent on the No. 8
sieve.

160
Table 35 presents Superpave gradation requirements if the lower control point on
the No. 8 sieve is increased by 5 percent. Figures 75 through 78 present these revised
Superpave gradation control points compared to the current P-401 and UFGS-32 12 15
gradation requirements. As shown in these figures, by increasing the lower control point
on the No. 8 sieve by 5 percent, the revised Superpave gradation requirements very
closely match the current P-401 and UFGS-32 12 15 gradation requirements on the No. 8
sieve. Therefore, there is no reason to change the current airfield HMA gradation
requirements when designing airfield HMA mixes using Superpave methods. However,
the researchers have consolidated the Item P-401 and UFGS-32 12 15 gradation
requirements in order to provide a single gradation band for each maximum aggregate
size gradation. The recommended gradation requirements are presented in Table 36.
Table 35: Gradation Control Points for Airfield Superpave Mixes
Nominal Maximum Aggregate Size – Control Points (Percent Passing)37.5 mm 25.0mm 19.0mm 12.5mm 9.5mm 4.75mm
SieveSize, inch
(mm) Min Max Min Max Min Max Min Max Min Max Min Max2.0 (50.0) 100 --- --- --- --- --- --- --- --- --- --- ---1.5 (37.5) 90 100 100 --- --- --- --- --- --- --- --- ---1.0 (25.0) --- 90 90 100 100 --- --- --- --- --- --- ---¾ (19.0) --- --- --- 90 90 100 100 --- --- --- --- ---
1/8 (12.5) --- --- --- --- --- 90 90 100 100 --- 100 ---3/8 (9.5) --- --- --- --- --- --- --- 90 90 100 95 100
No. 4 (4.75) --- --- --- --- --- --- --- --- --- 90 90 100No. 8 (2.36) 20 41 24 45 28 49 33 58 37 67 --- ---
No. 16 (1.18) --- --- --- --- --- --- --- --- --- --- 30 60No. 200(0.075) 0 6 1 7 2 8 2 10 2 10 6 12

161
1 ½ in. Maximum Aggregate Size Gradations
(25 mm NMAS)
0
10
20
30
40
50
60
70
80
90
100
Sieve Size Raised to 0.45 Power, mm
Perc
en
tP
assin
g
Superpave
Item P-401
0.075 2.36 37.525.0
Figure 75: Revised Gradations for 1.5 in. Max. Aggregate Size Gradations
1 in. Maximum Aggregate Size Gradations
(19 mm NMAS)
0
10
20
30
40
50
60
70
80
90
100
Sieve Size Raised to 0.45 Power, mm
Perc
en
tP
assin
g
Superpave
Item P-401
UFGS-32 12 15
0.075 2.36 25.019.0
Figure 76: Revised Gradations for 1 in. Max. Aggregate Size Gradations
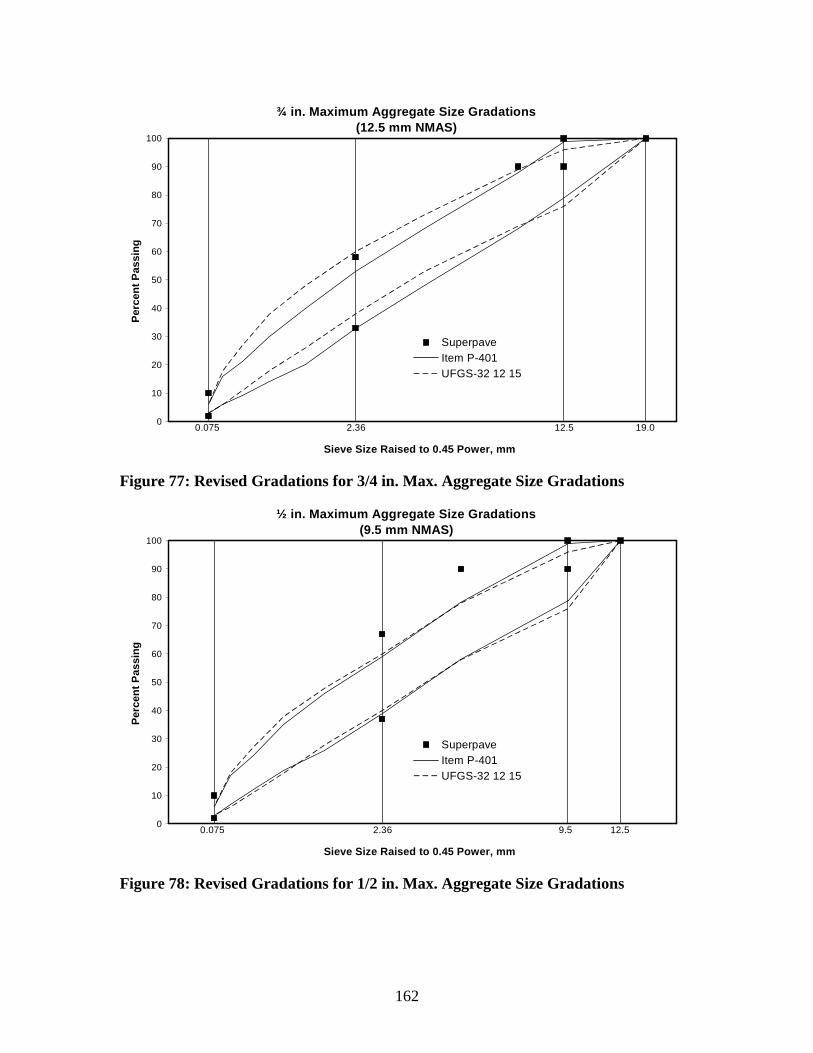
162
¾ in. Maximum Aggregate Size Gradations
(12.5 mm NMAS)
0
10
20
30
40
50
60
70
80
90
100
Sieve Size Raised to 0.45 Power, mm
Perc
en
tP
assin
g
Superpave
Item P-401
UFGS-32 12 15
0.075 2.36 19.012.5
Figure 77: Revised Gradations for 3/4 in. Max. Aggregate Size Gradations
½ in. Maximum Aggregate Size Gradations
(9.5 mm NMAS)
0
10
20
30
40
50
60
70
80
90
100
Sieve Size Raised to 0.45 Power, mm
Perc
en
tP
assin
g
Superpave
Item P-401
UFGS-32 12 15
0.075 2.36 12.59.5
Figure 78: Revised Gradations for 1/2 in. Max. Aggregate Size Gradations
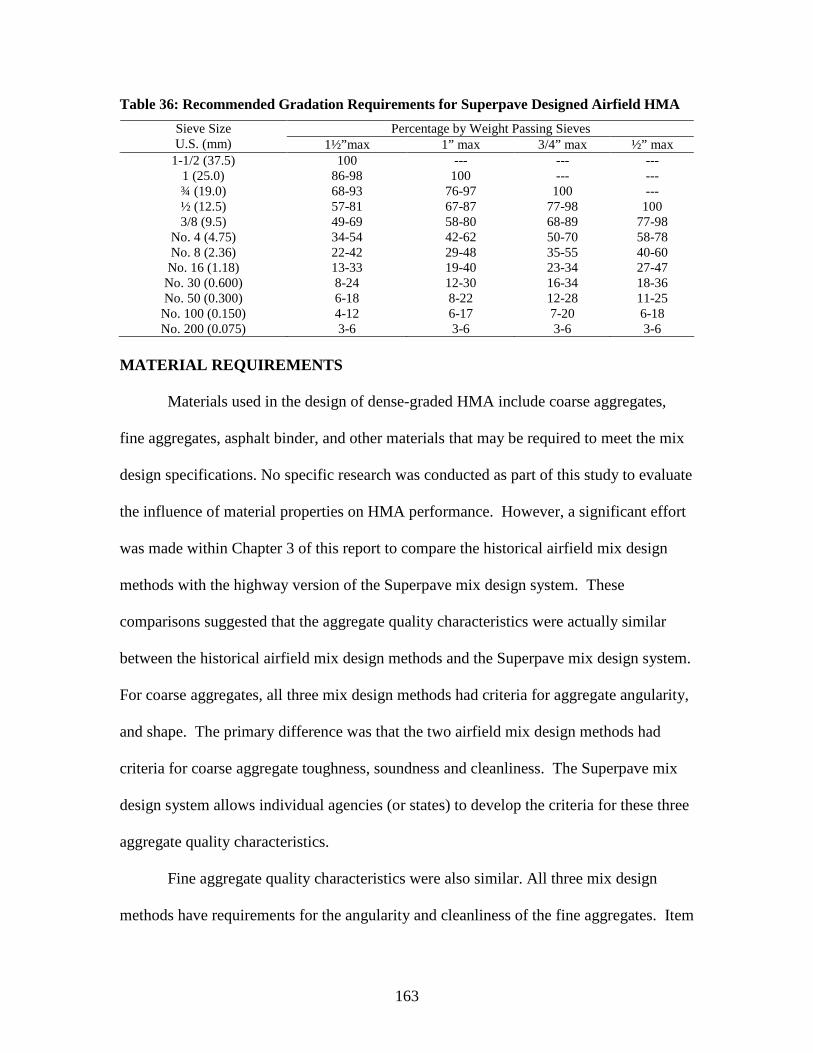
163
Table 36: Recommended Gradation Requirements for Superpave Designed Airfield HMA
Percentage by Weight Passing SievesSieve SizeU.S. (mm) 1½”max 1” max 3/4” max ½” max
1-1/2 (37.5) 100 --- --- ---1 (25.0) 86-98 100 --- ---¾ (19.0) 68-93 76-97 100 ---½ (12.5) 57-81 67-87 77-98 1003/8 (9.5) 49-69 58-80 68-89 77-98
No. 4 (4.75) 34-54 42-62 50-70 58-78No. 8 (2.36) 22-42 29-48 35-55 40-60
No. 16 (1.18) 13-33 19-40 23-34 27-47No. 30 (0.600) 8-24 12-30 16-34 18-36No. 50 (0.300) 6-18 8-22 12-28 11-25
No. 100 (0.150) 4-12 6-17 7-20 6-18No. 200 (0.075) 3-6 3-6 3-6 3-6
MATERIAL REQUIREMENTS
Materials used in the design of dense-graded HMA include coarse aggregates,
fine aggregates, asphalt binder, and other materials that may be required to meet the mix
design specifications. No specific research was conducted as part of this study to evaluate
the influence of material properties on HMA performance. However, a significant effort
was made within Chapter 3 of this report to compare the historical airfield mix design
methods with the highway version of the Superpave mix design system. These
comparisons suggested that the aggregate quality characteristics were actually similar
between the historical airfield mix design methods and the Superpave mix design system.
For coarse aggregates, all three mix design methods had criteria for aggregate angularity,
and shape. The primary difference was that the two airfield mix design methods had
criteria for coarse aggregate toughness, soundness and cleanliness. The Superpave mix
design system allows individual agencies (or states) to develop the criteria for these three
aggregate quality characteristics.
Fine aggregate quality characteristics were also similar. All three mix design
methods have requirements for the angularity and cleanliness of the fine aggregates. Item
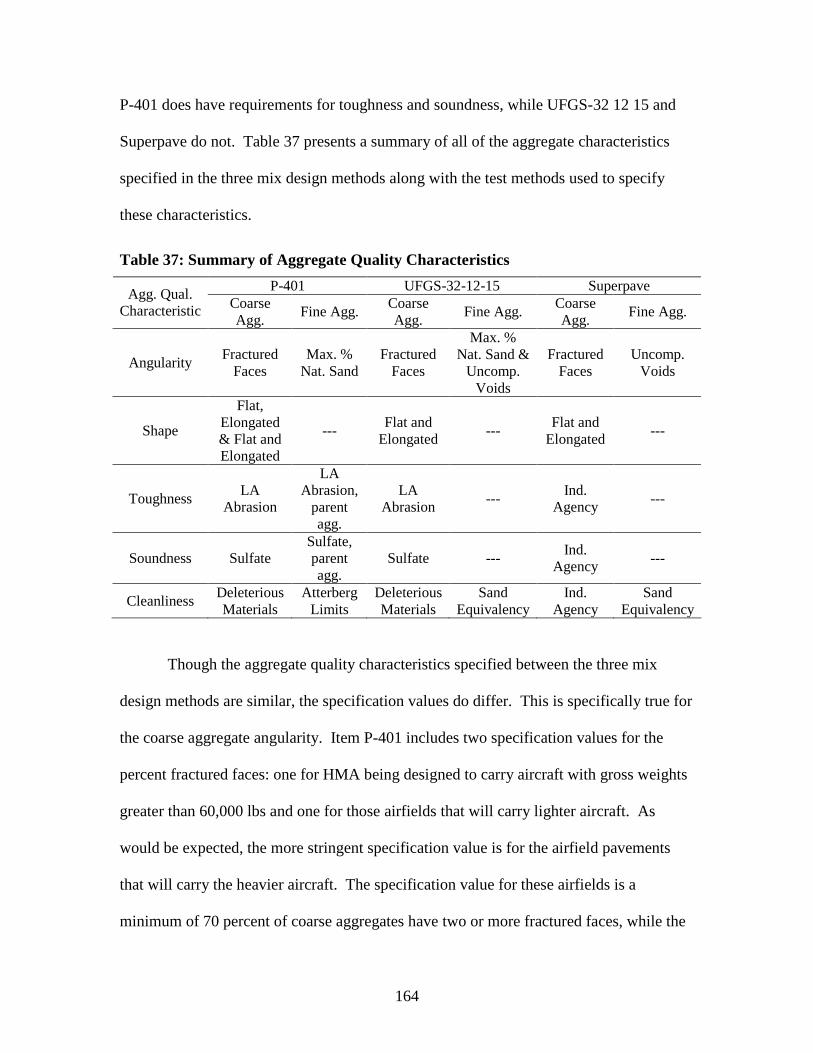
164
P-401 does have requirements for toughness and soundness, while UFGS-32 12 15 and
Superpave do not. Table 37 presents a summary of all of the aggregate characteristics
specified in the three mix design methods along with the test methods used to specify
these characteristics.
Table 37: Summary of Aggregate Quality Characteristics
P-401 UFGS-32-12-15 SuperpaveAgg. Qual.
CharacteristicCoarseAgg.
Fine Agg.CoarseAgg.
Fine Agg.CoarseAgg.
Fine Agg.
AngularityFractured
FacesMax. %
Nat. SandFractured
Faces
Max. %Nat. Sand &
Uncomp.Voids
FracturedFaces
Uncomp.Voids
Shape
Flat,Elongated& Flat andElongated
---Flat and
Elongated---
Flat andElongated
---
ToughnessLA
Abrasion
LAAbrasion,
parentagg.
LAAbrasion
---Ind.
Agency---
Soundness SulfateSulfate,parentagg.
Sulfate ---Ind.
Agency---
CleanlinessDeleteriousMaterials
AtterbergLimits
DeleteriousMaterials
SandEquivalency
Ind.Agency
SandEquivalency
Though the aggregate quality characteristics specified between the three mix
design methods are similar, the specification values do differ. This is specifically true for
the coarse aggregate angularity. Item P-401 includes two specification values for the
percent fractured faces: one for HMA being designed to carry aircraft with gross weights
greater than 60,000 lbs and one for those airfields that will carry lighter aircraft. As
would be expected, the more stringent specification value is for the airfield pavements
that will carry the heavier aircraft. The specification value for these airfields is a
minimum of 70 percent of coarse aggregates have two or more fractured faces, while the
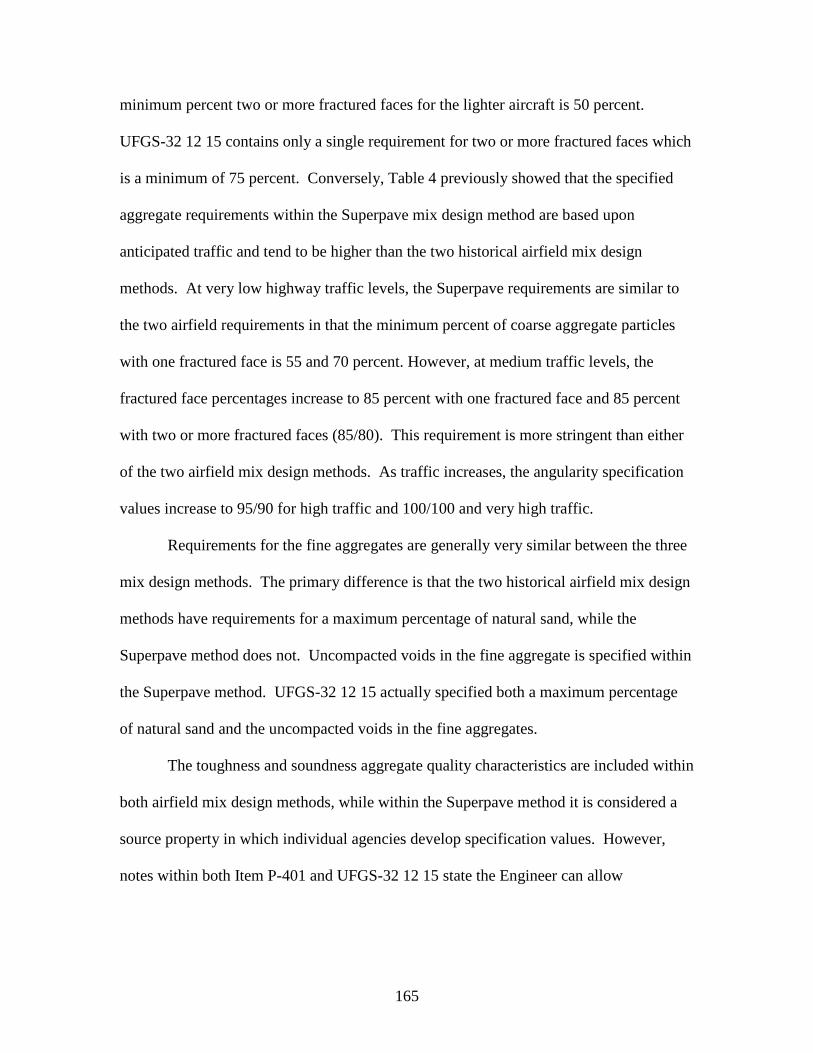
165
minimum percent two or more fractured faces for the lighter aircraft is 50 percent.
UFGS-32 12 15 contains only a single requirement for two or more fractured faces which
is a minimum of 75 percent. Conversely, Table 4 previously showed that the specified
aggregate requirements within the Superpave mix design method are based upon
anticipated traffic and tend to be higher than the two historical airfield mix design
methods. At very low highway traffic levels, the Superpave requirements are similar to
the two airfield requirements in that the minimum percent of coarse aggregate particles
with one fractured face is 55 and 70 percent. However, at medium traffic levels, the
fractured face percentages increase to 85 percent with one fractured face and 85 percent
with two or more fractured faces (85/80). This requirement is more stringent than either
of the two airfield mix design methods. As traffic increases, the angularity specification
values increase to 95/90 for high traffic and 100/100 and very high traffic.
Requirements for the fine aggregates are generally very similar between the three
mix design methods. The primary difference is that the two historical airfield mix design
methods have requirements for a maximum percentage of natural sand, while the
Superpave method does not. Uncompacted voids in the fine aggregate is specified within
the Superpave method. UFGS-32 12 15 actually specified both a maximum percentage
of natural sand and the uncompacted voids in the fine aggregates.
The toughness and soundness aggregate quality characteristics are included within
both airfield mix design methods, while within the Superpave method it is considered a
source property in which individual agencies develop specification values. However,
notes within both Item P-401 and UFGS-32 12 15 state the Engineer can allow
166
aggregates that don’t meet the toughness requirements if there is a history of the
aggregate source performing well within pavements.
The final aggregate quality characteristic included within three mix design
methods is cleanliness. Item P-401 utilizes Atterberg limits while UFGS-32 12 15 and
Superpave utilize sand equivalency.
As stated previously, no specific research was conducted to evaluate the aggregate
quality characteristics during this project. However, any mix design system needs
aggregate quality requirements in order to provide a quality HMA. Therefore,
recommendations were developed for aggregate quality. Table 38 presents the
recommended aggregate specification values for the design of airfield HMA using the
Superpave method. This table purposefully does not include requirements for toughness
and soundness as these will be maintained within the recommended guide specification in
the same method as currently specified.
Table 38: Aggregate Requirements for Airfield Superpave Design HMA
Ndesign
Min. %Fractured
Faces*
Uncomp.Voids of FineAgg., % Min.
Max. %Natural Sand
Max. % Flat andElongated
Particles (5:1)
Min. SandEquivalency
50 85/80 40 20 10 4065 95/90 45 15 10 4080 95/95 45 15 10 50
Commercial mineral fillers added to an HMA are addressed similarly within both
historical airfield mix design methods. Both state that any commercial mineral fillers
should meet the requirements of ASTM D242. This requirement will not be changed.
167
The final material that needs selection is the asphalt binder. AAPTP Project 04-
02 was specifically conducted to recommend asphalt binder properties for airfield
pavements.
SELECTION OF OPTIMUM ASPHALT BINDER CONTENT
All three mix design methods rely on volumetric properties to select the optimum
asphalt binder content during design. The volumetric properties of air voids, VMA, and
VFA are included within all three design methods. Item P-401 and UFGS-32 12 15 both
allow the designer to select the optimum asphalt binder content based upon a range of air
voids, while the current Superpave mix design system requires selection of optimum
asphalt content at 4.0 percent voids.
A volumetric property in which there are differences between the two airfield mix
design methods is VMA. Item P-401 requires 1 percent higher VMA for a given
maximum aggregate size gradation compared to UFGS-32 12 15. The VMA
requirements in the Superpave mix design method matches UFGS-32 12 15.
No specific research was conducted in order to select appropriate volumetric
properties; therefore, similar to the aggregate properties, the researchers are
recommending volumetric properties based upon experience. Table 39 presents the
recommended volumetric criteria for designing airfield HMA using the Superpave
gyratory compactor. Within this table, optimum asphalt content is selected based upon
the same volumetric properties as outlined in all three mix design methods: air voids,
VMA, and VFA. A single design air void content of 4 percent was selected. This air
void content is consistent with the current Superpave mix design system. The
168
recommended VMA values are consistent with the values currently specified within
UFGS-32 12 15 and the Superpave mix design methods. Voids filled with asphalt values
are based upon the VMA and air void criteria. Also contained within Table 39 is a
volumetric requirement for the percent theoretical maximum density at the initial number
of gyrations. The initial number of gyrations for the less than 100, 100 to 200 and greater
than 200 psi tire pressure categories are 6, 7 and 7, respectively. The final specification
values show within Table 39 are for dust-to-binder ratio. This is calculated by dividing
the percent minus No. 200 from the gradation (percent by mass) by the effective asphalt
binder content of the mix.
Table 39: Volumetric Properties For Selecting Optimum Asphalt BinderRequiredRelativeDensity,
Percent ofTheoreticalMaximum
SpecificGravity
Voids in the MineralAggregate (VMA), Percent
Minimum MaximumAggregate Size, mm
Voids Filledwith Asphalt(VFA) Range,
Percent
Dust-to-Binder Ratio
Range
TirePressure,
psiNdesign
Ninitial Ndesign 1 ½ 1 ¾ ½
<100 50 ≤90.5 96.0 12.0 13.0 14.0 15.0 70-80 0.6-1.2
100 to 200 65 ≤90.5 96.0 12.0 13.0 14.0 15.0 65-78 0.6-1.2
>200 80 ≤89.0 96.0 12.0 13.0 14.0 15.0 65-75 0.6-1.2
PERFORMANCE TESTING
Again, no specific research was conducted within this study to develop an
appropriate performance test for HMA mixes design in accordance with the airfield
Superpave mix design method. Moisture susceptibility testing should be conducted in
order to evaluate the potential for moisture damage in the designed mix. ASTM D4867
169
should be used for this testing. A minimum tensile strength ratio of 80 percent is
recommended for samples prepared with the Superpave gyratory compactor.
SHADOW SPECIFICATIONS
The final task conducted as part of this research was to utilize the Superpave mix
design method as a shadow specification at two airfield construction projects. For this
testing, plant mix HMA was used to compact specimens utilizing the Marshall hammer
and the Superpave gyratory compactor in order to compare the variability of plant
produced mixtures using the two compaction methods.
Two ongoing airfield construction projects were included in this phase of work.
The HMA from Case Study No 1 was designed using 75 blows per face of the Marshall
hammer while the mixture from Case Study No. 2 was designed using 100 gyrations of
the Superpave gyratory compactor.
For each of the airfields, the first step in evaluating the Superpave method within
the shadow specification was to develop equivalent compactive efforts. In other words,
the researchers determined the number of gyrations by the Superpave gyratory compactor
that were equal to the appropriate Marshall blows per face. In both instances, the
appropriate Marshall design compactive effort was 75 blows. Following the
identification of the equivalent compactive efforts, specimens were compacted for
numerous lots in order to evaluate the variability in mix properties using the two
compaction methods.
Shadow Specification at Case Study No. 1
The equivalent gyration level for the Case Study No. 1 mix was 50 gyrations. A
total of 28 sampling times were compared. For each of these plant produced samples,
170
companion materials were compacted using 75 blows per face and 50 gyrations. Two
specimens were compacted using the Superpave gyratory compactor and three specimens
were compacted using the Marshall hammer. For each specimen compacted, the bulk
specific gravity was determined and volumetric properties calculated.
Figure 79 presents the bulk specific gravity of the compacted specimens in the
form of a control chart. Both the Superpave gyratory compactor and Marshall hammer
data are depicted on this figure. This figure shows that the bulk specific gravity resulting
from the two compaction method values tracked each other well. Also included on this
figure are the pooled standard deviations for compaction of the samples. Recall that three
samples were compacted with the Marshall hammer and two samples were compacted
with the Superpave gyratory compactor. As shown by the pooled standard deviations, the
variability in test results were similar between the two compactive efforts even though an
extra sample was utilized when compacting with the Marshall hammer.
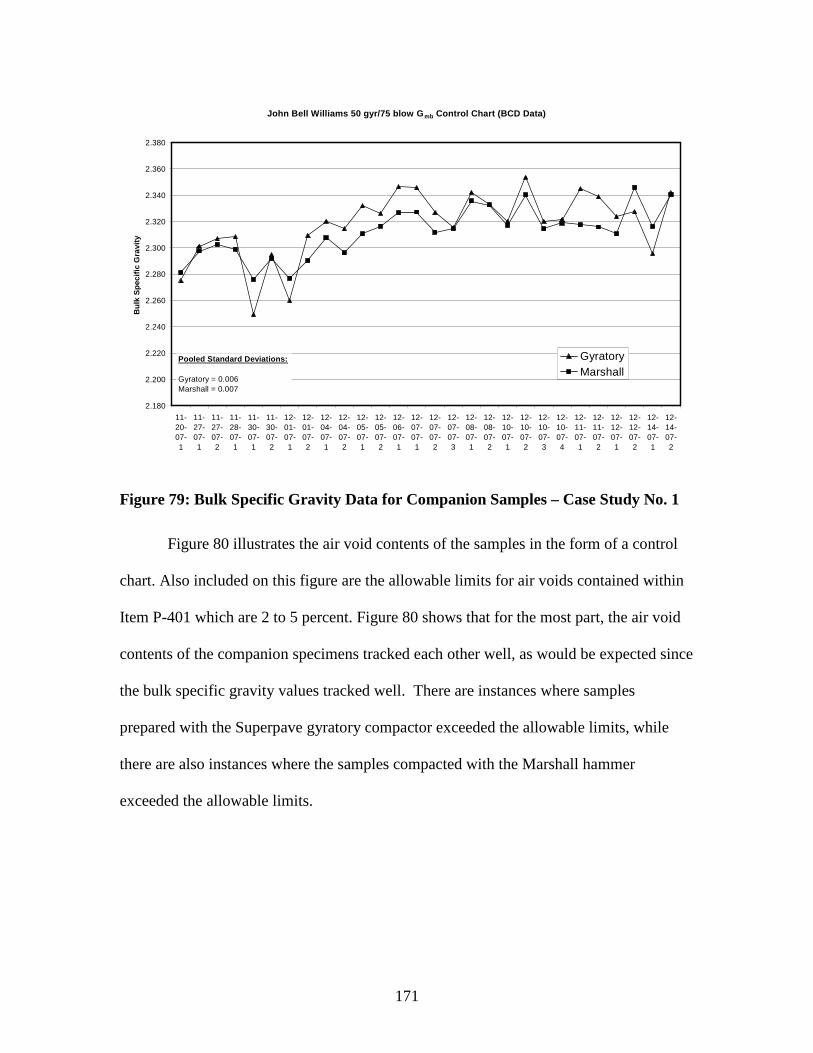
171
John Bell Williams 50 gyr/75 blow Gmb Control Chart (BCD Data)
2.180
2.200
2.220
2.240
2.260
2.280
2.300
2.320
2.340
2.360
2.380
11-
20-
07-
1
11-
27-
07-
1
11-
27-
07-
2
11-
28-
07-
1
11-
30-
07-
1
11-
30-
07-
2
12-
01-
07-
1
12-
01-
07-
2
12-
04-
07-
1
12-
04-
07-
2
12-
05-
07-
1
12-
05-
07-
2
12-
06-
07-
1
12-
07-
07-
1
12-
07-
07-
2
12-
07-
07-
3
12-
08-
07-
1
12-
08-
07-
2
12-
10-
07-
1
12-
10-
07-
2
12-
10-
07-
3
12-
10-
07-
4
12-
11-
07-
1
12-
11-
07-
2
12-
12-
07-
1
12-
12-
07-
2
12-
14-
07-
1
12-
14-
07-
2
Bu
lkS
pec
ific
Gra
vit
y
Gyratory
MarshallPooled Standard Deviations:
Gyratory = 0.006
Marshall = 0.007
Figure 79: Bulk Specific Gravity Data for Companion Samples – Case Study No. 1
Figure 80 illustrates the air void contents of the samples in the form of a control
chart. Also included on this figure are the allowable limits for air voids contained within
Item P-401 which are 2 to 5 percent. Figure 80 shows that for the most part, the air void
contents of the companion specimens tracked each other well, as would be expected since
the bulk specific gravity values tracked well. There are instances where samples
prepared with the Superpave gyratory compactor exceeded the allowable limits, while
there are also instances where the samples compacted with the Marshall hammer
exceeded the allowable limits.
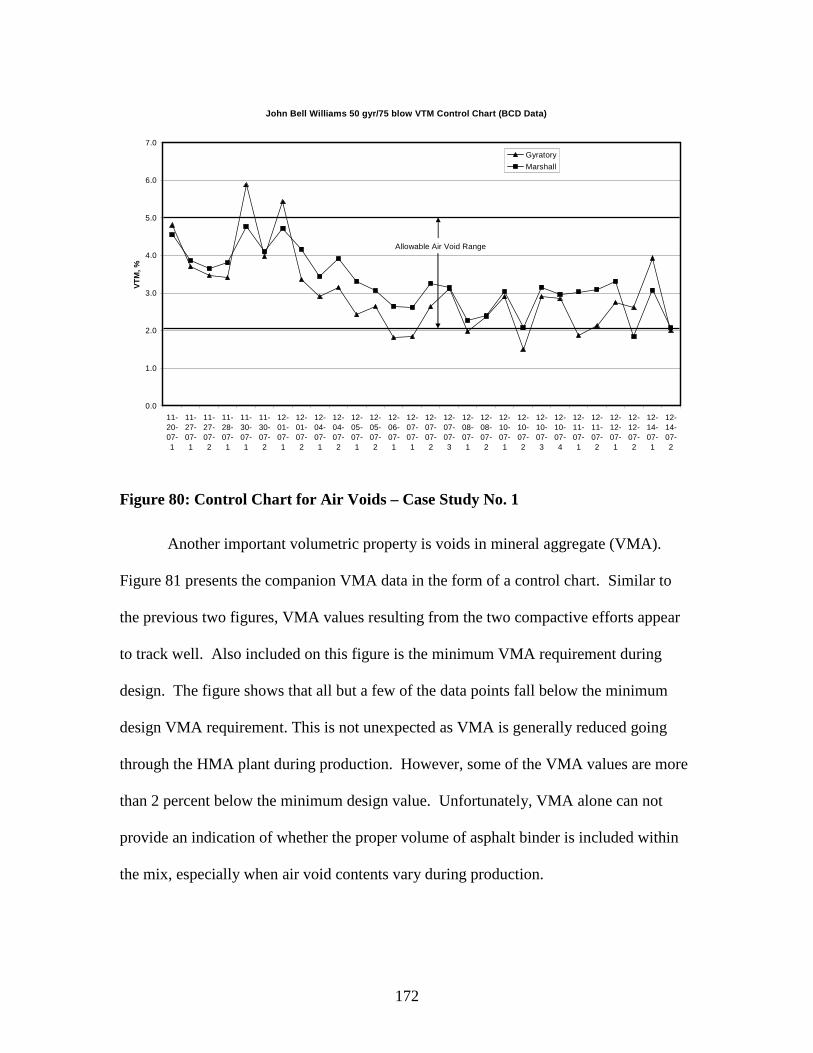
172
John Bell Williams 50 gyr/75 blow VTM Control Chart (BCD Data)
0.0
1.0
2.0
3.0
4.0
5.0
6.0
7.0
11-
20-
07-
1
11-
27-
07-
1
11-
27-
07-
2
11-
28-
07-
1
11-
30-
07-
1
11-
30-
07-
2
12-
01-
07-
1
12-
01-
07-
2
12-
04-
07-
1
12-
04-
07-
2
12-
05-
07-
1
12-
05-
07-
2
12-
06-
07-
1
12-
07-
07-
1
12-
07-
07-
2
12-
07-
07-
3
12-
08-
07-
1
12-
08-
07-
2
12-
10-
07-
1
12-
10-
07-
2
12-
10-
07-
3
12-
10-
07-
4
12-
11-
07-
1
12-
11-
07-
2
12-
12-
07-
1
12-
12-
07-
2
12-
14-
07-
1
12-
14-
07-
2
VT
M,
%
Gyratory
Marshall
Allowable Air Void Range
Figure 80: Control Chart for Air Voids – Case Study No. 1
Another important volumetric property is voids in mineral aggregate (VMA).
Figure 81 presents the companion VMA data in the form of a control chart. Similar to
the previous two figures, VMA values resulting from the two compactive efforts appear
to track well. Also included on this figure is the minimum VMA requirement during
design. The figure shows that all but a few of the data points fall below the minimum
design VMA requirement. This is not unexpected as VMA is generally reduced going
through the HMA plant during production. However, some of the VMA values are more
than 2 percent below the minimum design value. Unfortunately, VMA alone can not
provide an indication of whether the proper volume of asphalt binder is included within
the mix, especially when air void contents vary during production.
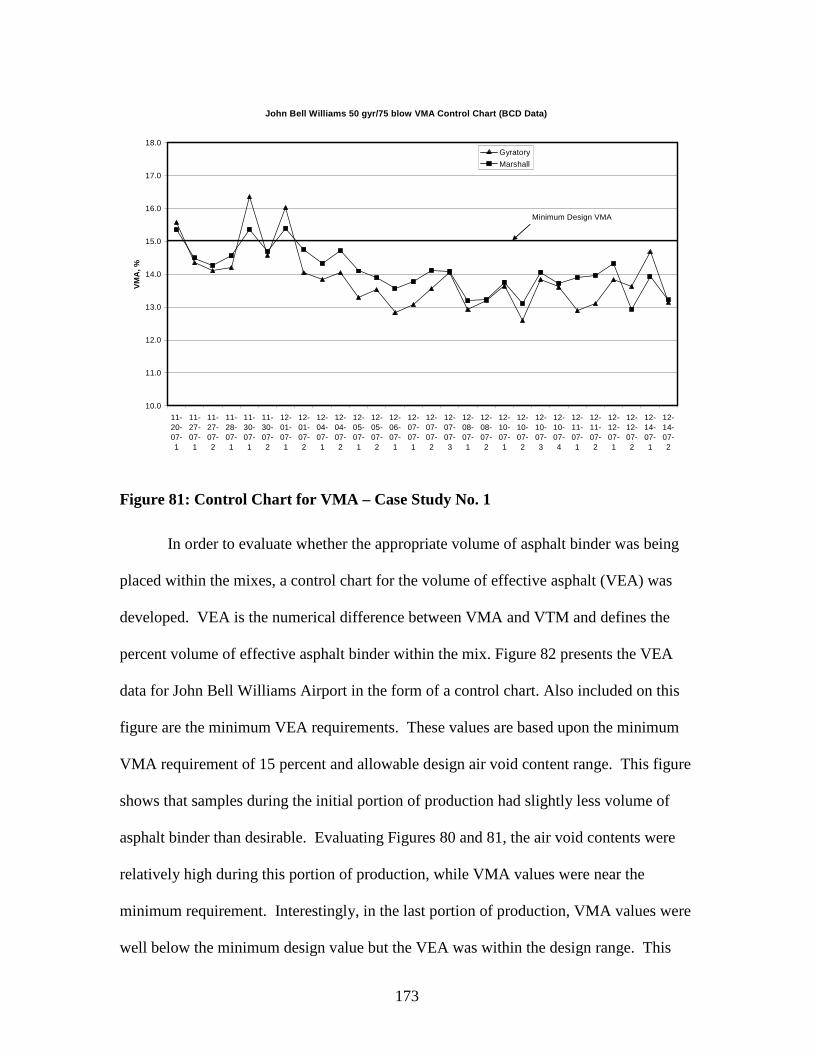
173
John Bell Williams 50 gyr/75 blow VMA Control Chart (BCD Data)
10.0
11.0
12.0
13.0
14.0
15.0
16.0
17.0
18.0
11-
20-
07-
1
11-
27-
07-
1
11-
27-
07-
2
11-
28-
07-
1
11-
30-
07-
1
11-
30-
07-
2
12-
01-
07-
1
12-
01-
07-
2
12-
04-
07-
1
12-
04-
07-
2
12-
05-
07-
1
12-
05-
07-
2
12-
06-
07-
1
12-
07-
07-
1
12-
07-
07-
2
12-
07-
07-
3
12-
08-
07-
1
12-
08-
07-
2
12-
10-
07-
1
12-
10-
07-
2
12-
10-
07-
3
12-
10-
07-
4
12-
11-
07-
1
12-
11-
07-
2
12-
12-
07-
1
12-
12-
07-
2
12-
14-
07-
1
12-
14-
07-
2
VM
A,
%
Gyratory
Marshall
Minimum Design VMA
Figure 81: Control Chart for VMA – Case Study No. 1
In order to evaluate whether the appropriate volume of asphalt binder was being
placed within the mixes, a control chart for the volume of effective asphalt (VEA) was
developed. VEA is the numerical difference between VMA and VTM and defines the
percent volume of effective asphalt binder within the mix. Figure 82 presents the VEA
data for John Bell Williams Airport in the form of a control chart. Also included on this
figure are the minimum VEA requirements. These values are based upon the minimum
VMA requirement of 15 percent and allowable design air void content range. This figure
shows that samples during the initial portion of production had slightly less volume of
asphalt binder than desirable. Evaluating Figures 80 and 81, the air void contents were
relatively high during this portion of production, while VMA values were near the
minimum requirement. Interestingly, in the last portion of production, VMA values were
well below the minimum design value but the VEA was within the design range. This
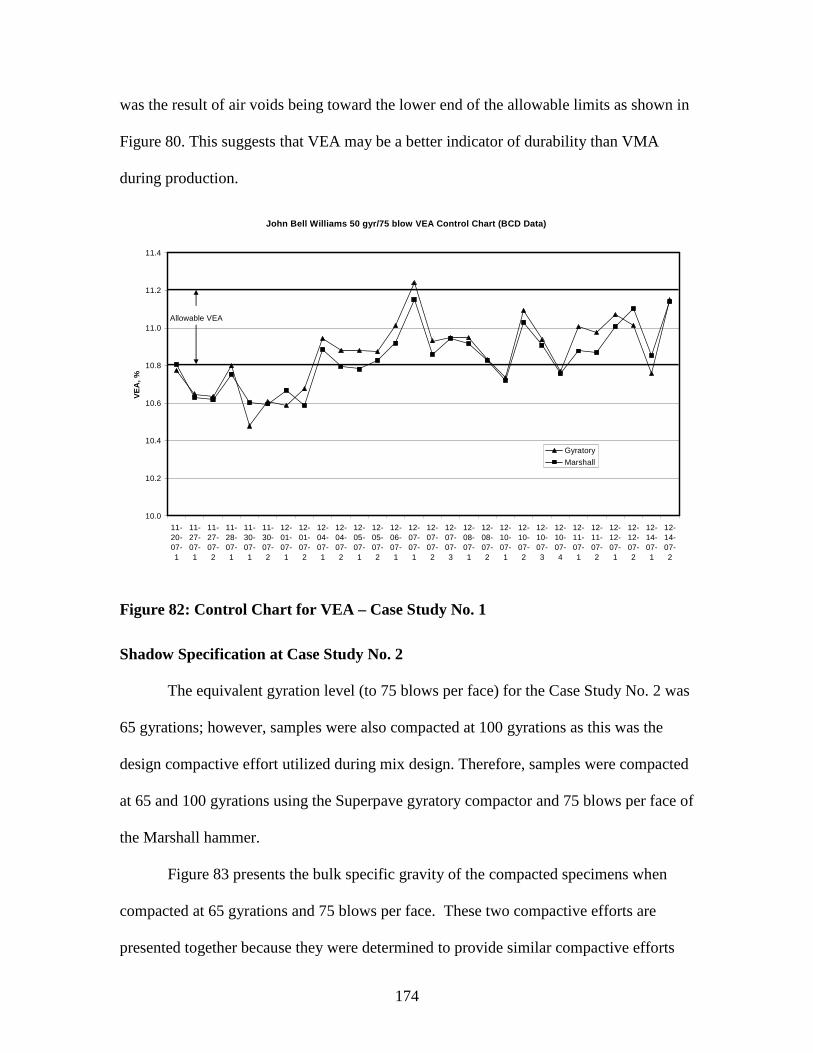
174
was the result of air voids being toward the lower end of the allowable limits as shown in
Figure 80. This suggests that VEA may be a better indicator of durability than VMA
during production.
John Bell Williams 50 gyr/75 blow VEA Control Chart (BCD Data)
10.0
10.2
10.4
10.6
10.8
11.0
11.2
11.4
11-
20-
07-
1
11-
27-
07-
1
11-
27-
07-
2
11-
28-
07-
1
11-
30-
07-
1
11-
30-
07-
2
12-
01-
07-
1
12-
01-
07-
2
12-
04-
07-
1
12-
04-
07-
2
12-
05-
07-
1
12-
05-
07-
2
12-
06-
07-
1
12-
07-
07-
1
12-
07-
07-
2
12-
07-
07-
3
12-
08-
07-
1
12-
08-
07-
2
12-
10-
07-
1
12-
10-
07-
2
12-
10-
07-
3
12-
10-
07-
4
12-
11-
07-
1
12-
11-
07-
2
12-
12-
07-
1
12-
12-
07-
2
12-
14-
07-
1
12-
14-
07-
2
VE
A,
%
Gyratory
Marshall
Allowable VEA
Figure 82: Control Chart for VEA – Case Study No. 1
Shadow Specification at Case Study No. 2
The equivalent gyration level (to 75 blows per face) for the Case Study No. 2 was
65 gyrations; however, samples were also compacted at 100 gyrations as this was the
design compactive effort utilized during mix design. Therefore, samples were compacted
at 65 and 100 gyrations using the Superpave gyratory compactor and 75 blows per face of
the Marshall hammer.
Figure 83 presents the bulk specific gravity of the compacted specimens when
compacted at 65 gyrations and 75 blows per face. These two compactive efforts are
presented together because they were determined to provide similar compactive efforts
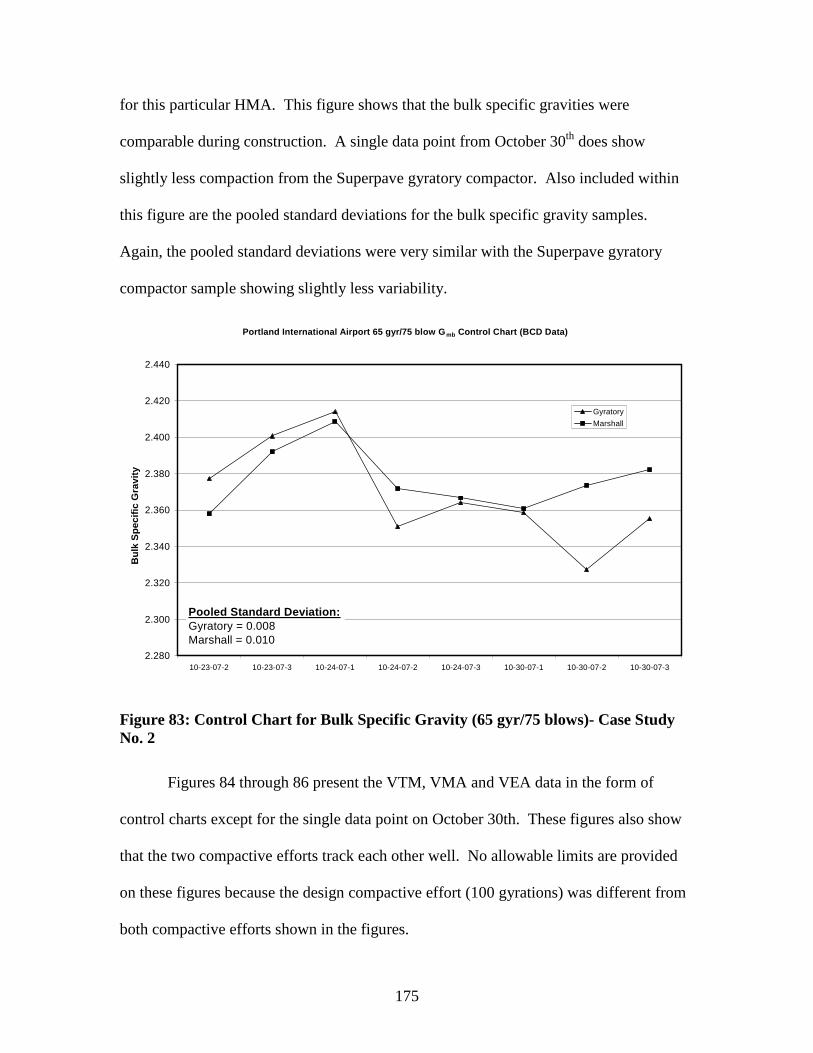
175
for this particular HMA. This figure shows that the bulk specific gravities were
comparable during construction. A single data point from October 30th does show
slightly less compaction from the Superpave gyratory compactor. Also included within
this figure are the pooled standard deviations for the bulk specific gravity samples.
Again, the pooled standard deviations were very similar with the Superpave gyratory
compactor sample showing slightly less variability.
Portland International Airport 65 gyr/75 blow Gmb Control Chart (BCD Data)
2.280
2.300
2.320
2.340
2.360
2.380
2.400
2.420
2.440
10-23-07-2 10-23-07-3 10-24-07-1 10-24-07-2 10-24-07-3 10-30-07-1 10-30-07-2 10-30-07-3
Bu
lkS
pe
cif
icG
rav
ity
Gyratory
Marshall
Pooled Standard Deviation:Gyratory = 0.008Marshall = 0.010
Figure 83: Control Chart for Bulk Specific Gravity (65 gyr/75 blows)- Case StudyNo. 2
Figures 84 through 86 present the VTM, VMA and VEA data in the form of
control charts except for the single data point on October 30th. These figures also show
that the two compactive efforts track each other well. No allowable limits are provided
on these figures because the design compactive effort (100 gyrations) was different from
both compactive efforts shown in the figures.
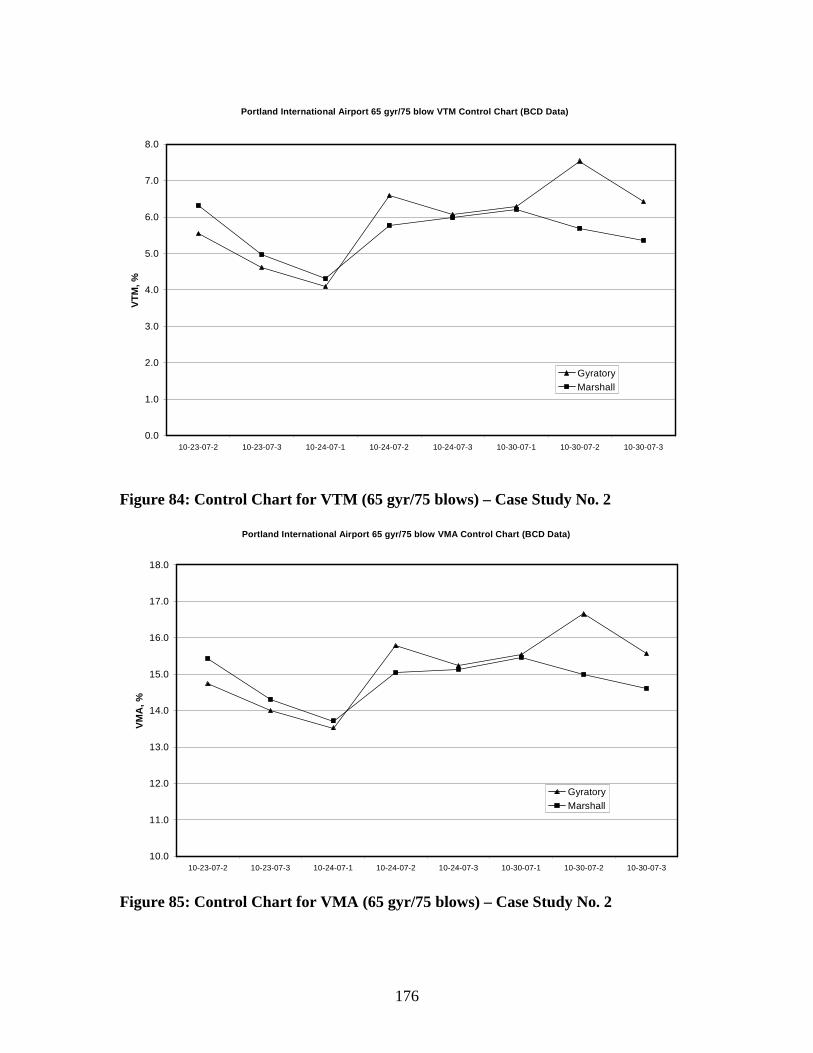
176
Portland International Airport 65 gyr/75 blow VTM Control Chart (BCD Data)
0.0
1.0
2.0
3.0
4.0
5.0
6.0
7.0
8.0
10-23-07-2 10-23-07-3 10-24-07-1 10-24-07-2 10-24-07-3 10-30-07-1 10-30-07-2 10-30-07-3
VT
M,
%
Gyratory
Marshall
Figure 84: Control Chart for VTM (65 gyr/75 blows) – Case Study No. 2
Portland International Airport 65 gyr/75 blow VMA Control Chart (BCD Data)
10.0
11.0
12.0
13.0
14.0
15.0
16.0
17.0
18.0
10-23-07-2 10-23-07-3 10-24-07-1 10-24-07-2 10-24-07-3 10-30-07-1 10-30-07-2 10-30-07-3
VM
A,
%
Gyratory
Marshall
Figure 85: Control Chart for VMA (65 gyr/75 blows) – Case Study No. 2
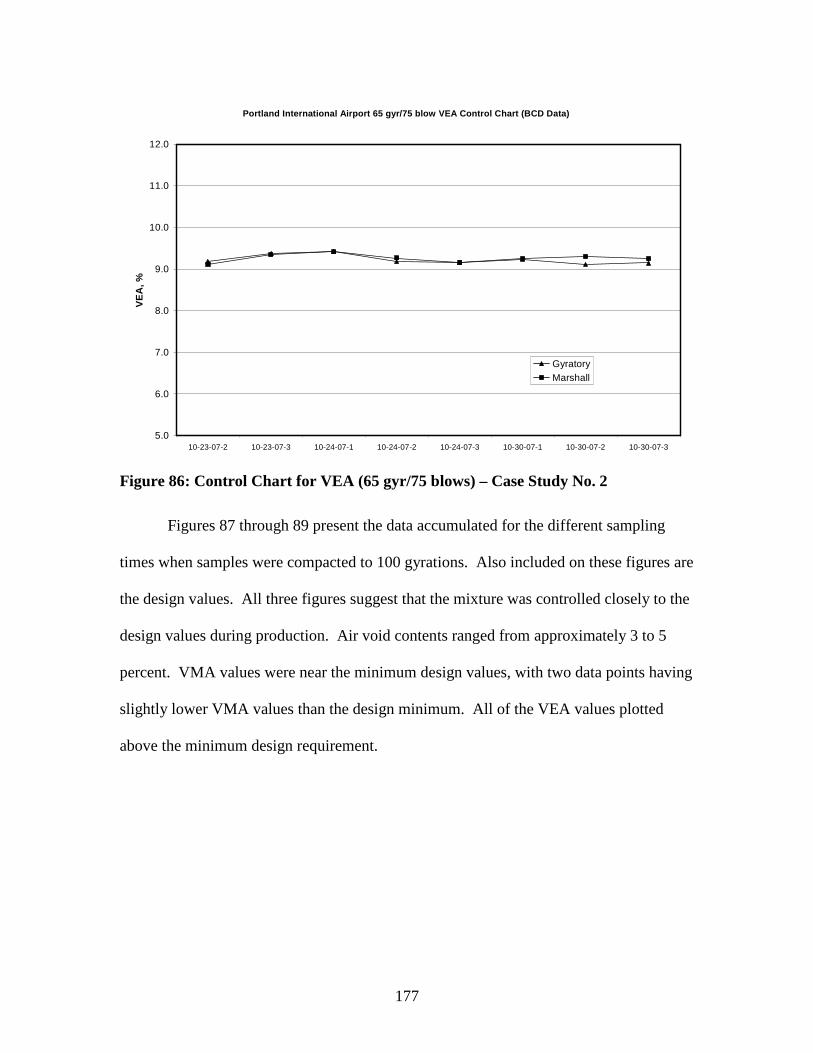
177
Portland International Airport 65 gyr/75 blow VEA Control Chart (BCD Data)
5.0
6.0
7.0
8.0
9.0
10.0
11.0
12.0
10-23-07-2 10-23-07-3 10-24-07-1 10-24-07-2 10-24-07-3 10-30-07-1 10-30-07-2 10-30-07-3
VE
A,
%
Gyratory
Marshall
Figure 86: Control Chart for VEA (65 gyr/75 blows) – Case Study No. 2
Figures 87 through 89 present the data accumulated for the different sampling
times when samples were compacted to 100 gyrations. Also included on these figures are
the design values. All three figures suggest that the mixture was controlled closely to the
design values during production. Air void contents ranged from approximately 3 to 5
percent. VMA values were near the minimum design values, with two data points having
slightly lower VMA values than the design minimum. All of the VEA values plotted
above the minimum design requirement.
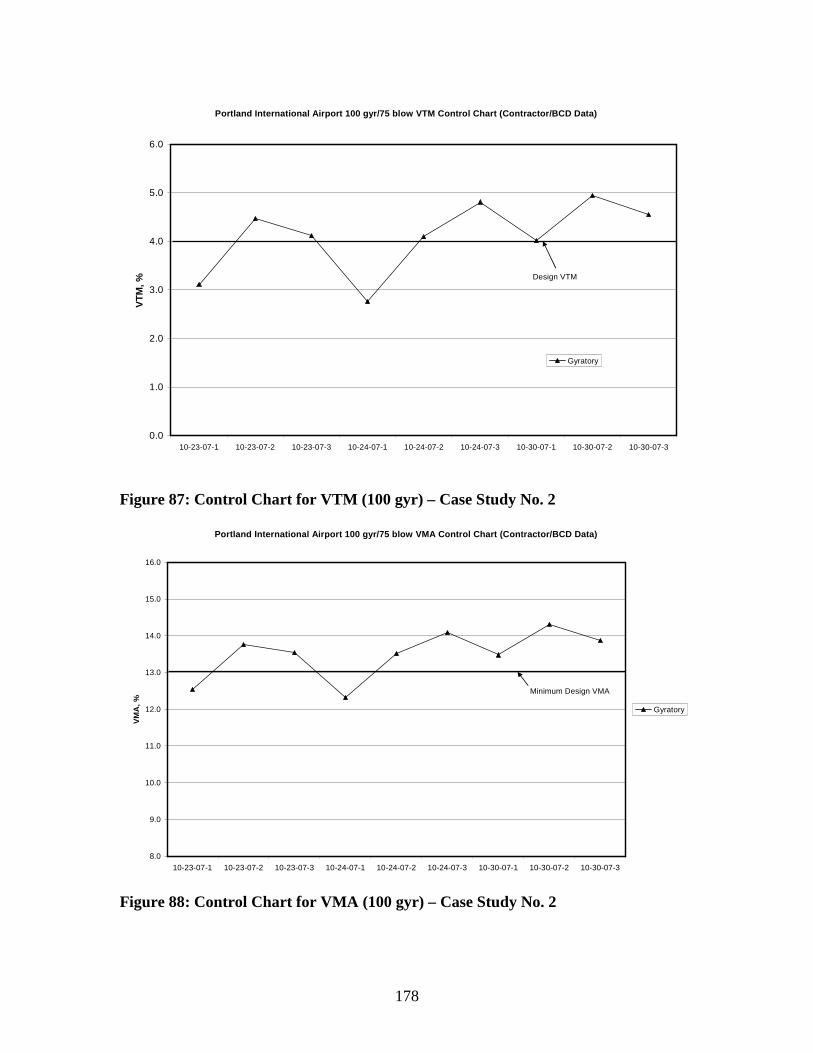
178
Portland International Airport 100 gyr/75 blow VTM Control Chart (Contractor/BCD Data)
0.0
1.0
2.0
3.0
4.0
5.0
6.0
10-23-07-1 10-23-07-2 10-23-07-3 10-24-07-1 10-24-07-2 10-24-07-3 10-30-07-1 10-30-07-2 10-30-07-3
VT
M,
%
Gyratory
Design VTM
Figure 87: Control Chart for VTM (100 gyr) – Case Study No. 2
Portland International Airport 100 gyr/75 blow VMA Control Chart (Contractor/BCD Data)
8.0
9.0
10.0
11.0
12.0
13.0
14.0
15.0
16.0
10-23-07-1 10-23-07-2 10-23-07-3 10-24-07-1 10-24-07-2 10-24-07-3 10-30-07-1 10-30-07-2 10-30-07-3
VM
A,
%
Gyratory
Minimum Design VMA
Figure 88: Control Chart for VMA (100 gyr) – Case Study No. 2

179
Portland International Airport 100 gyr/75 blow VEA Control Chart (Contractor/BCD Data)
5.0
6.0
7.0
8.0
9.0
10.0
11.0
12.0
10-23-07-1 10-23-07-2 10-23-07-3 10-24-07-1 10-24-07-2 10-24-07-3 10-30-07-1 10-30-07-2 10-30-07-3
VE
A,
%
GyratoryMinimum Design VEA
Figure 89: Control Chart for VEA (100 gyr) – Case Study No. 2
Summary
In summary, results from the shadow specification suggest that the control and
assurance of HMA with the Superpave gyratory compactor is very similar to that of the
Marshall hammer. When comparing the pooled standard deviations for replicate samples
compacted using the Marshall hammer and Superpave gyratory compactor the values
were very similar. However, the pooled standard deviations for the Superpave gyratory
compactor were slightly lower than for the Marshall hammer for both projects.
One of the potential concerns with utilizing the Superpave mix design method for
airfields is that there is no proof test for design or construction. Historically, the Marshall
mix design method utilized stability and flow as performance indicators. No such test
currently exists for the Superpave mix design system. During quality control and quality
assurance (QC/QA), only the mixture properties are evaluated. Both air voids and VMA
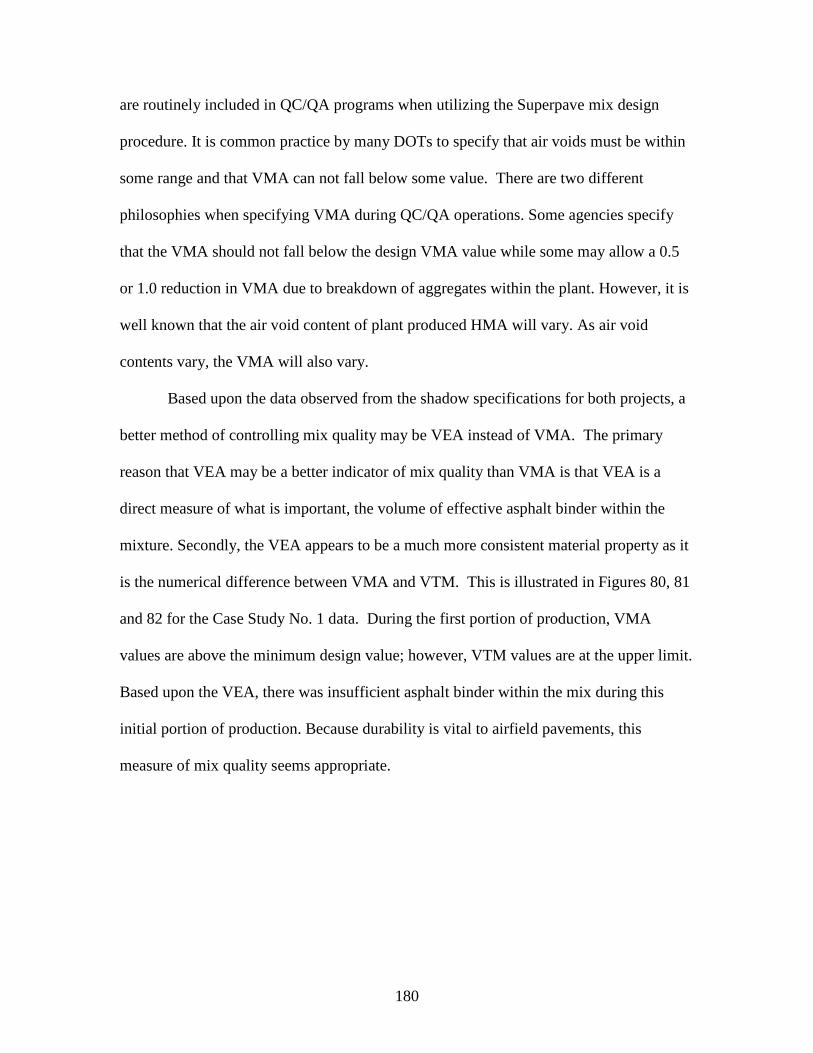
180
are routinely included in QC/QA programs when utilizing the Superpave mix design
procedure. It is common practice by many DOTs to specify that air voids must be within
some range and that VMA can not fall below some value. There are two different
philosophies when specifying VMA during QC/QA operations. Some agencies specify
that the VMA should not fall below the design VMA value while some may allow a 0.5
or 1.0 reduction in VMA due to breakdown of aggregates within the plant. However, it is
well known that the air void content of plant produced HMA will vary. As air void
contents vary, the VMA will also vary.
Based upon the data observed from the shadow specifications for both projects, a
better method of controlling mix quality may be VEA instead of VMA. The primary
reason that VEA may be a better indicator of mix quality than VMA is that VEA is a
direct measure of what is important, the volume of effective asphalt binder within the
mixture. Secondly, the VEA appears to be a much more consistent material property as it
is the numerical difference between VMA and VTM. This is illustrated in Figures 80, 81
and 82 for the Case Study No. 1 data. During the first portion of production, VMA
values are above the minimum design value; however, VTM values are at the upper limit.
Based upon the VEA, there was insufficient asphalt binder within the mix during this
initial portion of production. Because durability is vital to airfield pavements, this
measure of mix quality seems appropriate.
181
CHAPTER 7Conclusions, Recommendations and Implementation
The objective of this study was to adapt the Superpave gyratory compactor
procedures for designing airfields HMA mixes. In order to accomplish this objective,
HMA (in the form of cores) was obtained from ten airfield pavements located around the
US. Materials from the original sources were also obtained for each of these ten airfields.
These materials were used to conduct a laboratory study in order to adapt the Superpave
mix design system for airfield pavements.
During the course of this study, the Superpave mix design system was expressed
as a four step process. The first step is materials selection. Materials requiring selection
include coarse aggregates, fine aggregates, mineral fillers, asphalt binder, and/or anti-
stripping additives. Using the selected materials, a design gradation is obtained during the
second step. The third step involves selecting the optimum asphalt binder content. This
step involves the primary area where the Superpave mix design method had to be
modified for the design of airfield HMA, which is the use of the Superpave gyratory
compactor as the laboratory compactive effort. The final step of the mix design system is
to evaluate the mixture for the potential for moisture damage.
Conclusions
Based upon the activities conducted within this research project, the following
conclusions are provided:
There are many similarities between the historical airfield mix designs, Item P-401
and UFGS-32 12 15, and the highways version of the Superpave mix design system.
182
Aggregate quality characteristics required in the three mix design methods are similar
in that angularity, shape, toughness, soundness and cleanliness are all included.
Specified values differ slightly; however, the characteristics are consistent within the
different mix design methods.
There are differences between the gradation requirements contained in the three mix
design methods. The UFGS-32 12 15 requirements generally allows the finest
gradations while the Superpave mix design method for highways allows the coarsest.
The primary difference between the three mix design methods is that the Superpave
mix design procedure utilizes the Superpave gyratory compactor as the design
compactive effort while the two historical airfield mix design methods utilize the
Marshall hammer.
Similar volumetric properties are required when utilizing the three mix design
methods, though there are some differences in the required values. Most notably, the
Superpave mix design procedure for highways requires a single air void content for
selection of optimum asphalt binder content, 4.0 percent. The two historical airfield
mix design procedures utilize a range of design air void contents in selection of
optimum asphalt binder content.
All three methods of designing HMA evaluate the moisture susceptibility of designed
mixes using the tensile strength ratio method. Specified values are slightly different,
however.
For the ten airfields evaluated within this research, the Marshall hammer design
compactive effort appeared to more accurately reflect the ultimate density of
pavement layers than did the Superpave gyratory compactor. The data suggested that
183
design compactive efforts utilized for the different HMA pavement layers were too
high when using the Superpave gyratory compactor.
Based upon the obtained materials from the original sources for the ten airfields, 43 to
55 gyrations provide an equivalent compactive effort to 75 blows per face of the
Marshall hammer, while 32 to 40 gyrations provides an equivalent compactive effort
to 50 blows per face of the Marshall hammer.
The repeated load permanent deformation test (Flow Number) test was utilized in
order to identify the asphalt binder content at which the recreated HMA from each of
the ten airfields would begin to exhibit high rutting potential. This asphalt binder
content was then utilized to determine the gyration level that would result in 4 percent
air voids. A design gyration level (Ndesign) was then estimated that would maximize
the durability of HMA while minimizing rut potential. Estimated Ndesign values for
the ten airfield HMA mixtures ranged from a low of 35 to a high of 75 gyrations.
Estimated Ndesign values were more related to the design tire pressures than the
maximum gross aircraft weights.
Results of permeability testing conducted on HMA mixtures having varying
gradations suggested that the gradation requirements contained within the highways
version of the Superpave mix design allowed gradations that had potential for
permeable pavement layers.
Results from permeability testing suggested that the lower control points contained in
the gradation requirements of the highways version of the Superpave mix design
method should be increased by 5 percent passing.
184
The Superpave gyratory compactor was utilized on two ongoing airfield construction
projects as a shadow specification. Results of comparisons using the Marshall
hammer and the Superpave gyratory compactor indicated that the variability in bulk
specific gravity values were very similar even though three replicate samples were
compacted with the Marshall hammer and two samples were compacted with the
Superpave gyratory compactor.
The evaluation of the Superpave gyratory compactor within the shadow specifications
suggested that the percent volume of effective asphalt may be an effective tool for
ensuring a sufficient volume of asphalt binder is included within the mixture during
production.
Recommendations
Based upon the conclusions discussed above, a mix design procedure utilizing the
Superpave gyratory compactor was developed and is recommended. Table 40 presents
the recommended volumetric properties. This mix design method is presented in whole
within Volume II of this report. It is recommended that this mix design method be
evaluated by a number of persons that are experienced with both airfield pavement
construction and the highways version of the Superpave mix design procedure. The
recommended Superpave mix design method for airfields should be utilized to design
HMA for several demonstration projects in order to verify that HMA mix designed using
the recommended procedure can be properly produced. Currently, there are a number of
research efforts for adapting the Superpave mix design method for airfields; researchers
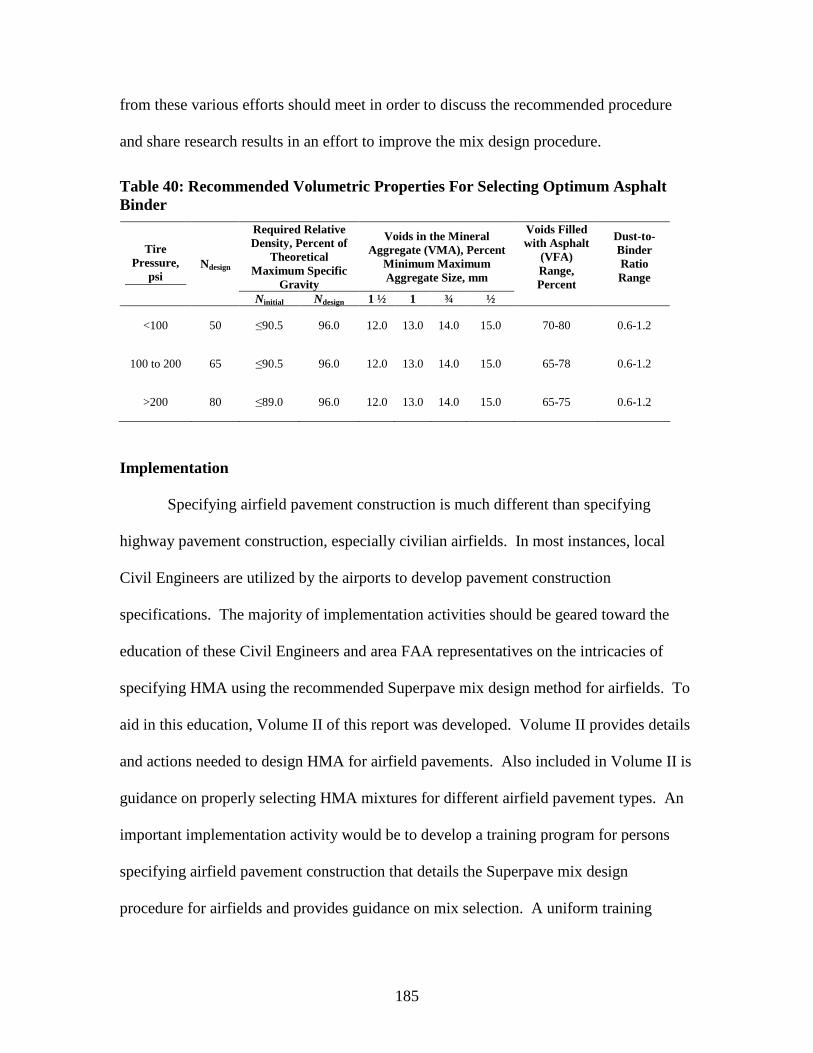
185
from these various efforts should meet in order to discuss the recommended procedure
and share research results in an effort to improve the mix design procedure.
Table 40: Recommended Volumetric Properties For Selecting Optimum AsphaltBinder
Required RelativeDensity, Percent of
TheoreticalMaximum Specific
Gravity
Voids in the MineralAggregate (VMA), Percent
Minimum MaximumAggregate Size, mm
Voids Filledwith Asphalt
(VFA)Range,Percent
Dust-to-BinderRatioRange
TirePressure,
psiNdesign
Ninitial Ndesign 1 ½ 1 ¾ ½
<100 50 ≤90.5 96.0 12.0 13.0 14.0 15.0 70-80 0.6-1.2
100 to 200 65 ≤90.5 96.0 12.0 13.0 14.0 15.0 65-78 0.6-1.2
>200 80 ≤89.0 96.0 12.0 13.0 14.0 15.0 65-75 0.6-1.2
Implementation
Specifying airfield pavement construction is much different than specifying
highway pavement construction, especially civilian airfields. In most instances, local
Civil Engineers are utilized by the airports to develop pavement construction
specifications. The majority of implementation activities should be geared toward the
education of these Civil Engineers and area FAA representatives on the intricacies of
specifying HMA using the recommended Superpave mix design method for airfields. To
aid in this education, Volume II of this report was developed. Volume II provides details
and actions needed to design HMA for airfield pavements. Also included in Volume II is
guidance on properly selecting HMA mixtures for different airfield pavement types. An
important implementation activity would be to develop a training program for persons
specifying airfield pavement construction that details the Superpave mix design
procedure for airfields and provides guidance on mix selection. A uniform training

186
program, whether presented on-line or in multiple locations, would greatly enhance the
ability to implement Superpave for airfields.
187
REFERENCES
1. Department of the Army. Corps of Engineers. Mississippi River Commission.“Investigation of the Design and Control of Asphalt Paving Mixtures.” TechnicalMemorandum Mo. 3-254. Waterways Experiment Station. Vicksburg,Mississippi. May 1948.
2. White, T. D. “Marshall Procedures for Design and Quality Control of AsphaltMixtures.” Proceedings of the Association of Asphalt Paving Technologists. Vol.54. pp. 265-284. 1985.
3. Regan, G. L. “A Laboratory Study of Asphalt Concrete Mix Designs for High-Contract Pressure Aircraft Traffic.” Final Report. ESL-TR-85-66
4. “Superpave Mix Design.” Superpave Series No. 2 (SP-2). Third Edition. AsphaltInstitute. Lexington, Kentucky. 2001.
5. Download from www.amrl.net.6. Ahlrich, R. C. “Influence of Aggregate Properties on Performance of Heavy-Duty
Hot Mix Asphalt Pavement.” Transportation Research Record No. 1547.Transportation Research Board. National Academy of Science. Pp 7-14. 1996.
7. Roque, R. and C. Drakos. “Superpave IDT and Energy Ratio Workshop.”University of Florida and Florida Department of Transportation. Gainesville,Florida 2004.
8. Kim, R. and H. Wen. “Fracture Energy from Indirect Tension Testing.” Journalof the Associations of Asphalt Paving Technologies. Vol. 71. pp 779-793. 2002.
9. Cooley, Jr., L. A., B. D. Prowell, and E. R. Brown. “Issues pertaining to thePermeability of Coarse-Grade Superpave Mixes.” Journal of the Association ofAsphalt Paving Technologists. Vol. 71. pp 1-29. 2002.
10. Cooley, Jr., L. A., E. R. Brown, and S. Maghsoodloo. “Development of CriticalField Permeability and Pavement Density Values for Coarse Graded SuperpavePavements.” Transportation Research Record No. 1761. Transportation ResearchBoard. National Academy of Science. pp 41-49. 2001.
11. Kumar, A. and W. H. Goetz. “Asphalt Hardening as Affected by Film Thickness,Voids and Permeability in Asphalt Mixtures.” Proceedings of the Association ofAsphalt Paving Technologists. Vol. 46. pp 571-606. 1977.
12. McGennis, R. B., R. M. Anderson, T. W. Kennedy, and M. Solaimanian.“Background of Superpave Mixture Design and Analysis.” Federal HighwayAdministration. Publication No. FHWA-SA-95-003. Feb. 1995.
13. “Mix Design Methods for Asphalt Concrete and Other Hot-Mix Types.” ManualSeries No. 2 (MS-2) Sixth Edition. Asphalt Institute. Lexington, Kentucky.
14. Brown, E. R. and R. Mallick. “An Initial Evaluation of Ndesign SuperpaveGyratory Compactor.” Journal of the Association of Asphalt PavingTechnologists. Vol. 67. pp 101-124. 1998.
15. Prowell, B. D. and J. E. Haddock. “Superpave for Low Volume Roads and BaseMixtures.” Journal of the Association of Asphalt Paving Technologists. Vol. 71.pp 417-443. 2002.