implementation of quality improvement tools in brass industry to improve quality & enhance...
DESCRIPTION
ÂTRANSCRIPT
Information and Knowledge Management www.iiste.org
ISSN 2224-5758 (Paper) ISSN 2224-896X (Online)
Vol.3, No.4, 2013
97
Implementation of Quality Improvement Tools In Brass Industry To
Improve Quality & Enhance Productivity
Dr Sajjad Akbar1*
Dr M Shahid Khalil ²Hafiz Ihsanullah.³& Dr Tahir Nawaz 1. CESET, Islamabad. Pakistan
2. UET, Taxila Pakistan
3. UET, Taxila Pakistan
4. CESET, Islamabad. Pakistan
* E-mail of the corresponding author: [email protected] Abstract
Significance of quality with increased productivity at an affordable cost is out of question. In this regard, applications
of Statistical Quality Tools go a long way not only to improve the quality of a product but also to eliminate the
causes, which gave birth to Non – Conforming units. In engineering production units where workforce is unaware to
Quality Management system (QMS) it is very difficult to manage production with in acceptable quality standard.
Heavy input costs at shrunk/ reduced outputs are no longer sustainable. In most of the production units the rejection
of components is never analyzed and resultantly factors causing these high rejection percentages are not rooted out.
The focus of study here has been Brass Industry with special emphasis on reducing rejection percentage to a lower
possible limit in 70:30 Brass strip and Gilding Metal Claded Steel (GMCS Strip). Initially, data regarding rejection in
Brass and GMCS Strip was collected for complete analysis. The process of applying relevant Statistical Quality
Tools was started in order to find out the major defects and the root causes of the same. The analysis made so far
revealed that existing rejection percentage in Brass and GMCS Strip has been in the range of Fifteen percent (15%)
and Twenty one percent (21%) respectively, which is an alarming situation. The ultimate end of the study was to
reduce the existing rejection percentage to a range of 8 – 10 % in Brass, and 12 – 14 % in GMCS, and thereby
improve the quality, savings, enhance productivity and hence to reduce the wastages.
Keywords: Quality improvement tools, brass industry, productivity and quality
1. Introduction
Today in this competitive environment where every moment comes with a new challenge, the only way to remain in
the business is through pacing up with the changes and focusing on the product quality and Productivity i.e. to take
care of all the processes that reduce the cost involved in the re-production and re-work of the products. The
importance of the quality cannot be overlooked during the development and production of new products and the
improvement of existing products. Quality increases the relative total cost, productivity, capacity & profit while
decreases the number of non-conforming units and their relative cost. Application of the Quality improvement tools
intended to improve the quality of the products by using different techniques and activities. The main objectives of
this paper are:-
• Identification of critical processes causing production of defective products in Brass industry by using
Pareto analysis.
• Diagnoses of defects and tracing out their causes by using “cause & effect diagram”
• Identification of major causes and recommendation for their remedial measures in Brass Industry.
• To reduce rejection percentage, Improve Quality, reduce cost and to enhance productivity of Brass Industry
Information and Knowledge Management www.iiste.org
ISSN 2224-5758 (Paper) ISSN 2224-896X (Online)
Vol.3, No.4, 2013
98
2. Methodology: -
The methodology adopted for implementation of quality improvement tools in Brass Industry is as under: -
2.1 Selection of Products for Analysis
The under mentioned two critical products of Brass Industry were selected for analysis/ study.
o Brass strip (size 3.98 ± 0.04 mm) used for manufacturing of 7.62 mm Cases
o GMCS strip (size 1.37 ± 0.07 mm) used for manufacturing of 12.7 mm Bullet
The rejection percentage in these two products is very high and our goal is to reduce the high rejection rate
through application of Statistical quality Tools.
2.2 Process stability and Data collection: -
Process Flow charts for manufacturing of Brass Strips and GMCS were made for better understanding of
Processes involved. Also critical processes can be identified through study of Flow charts. Data was
collected using Check sheet technique. With the help of collected data in Brass Industry, statistical
control charts were constructed during production of Brass strips. Control charts graphically represent the
quality characteristics and showed whether or not the process was in stable state. In case of unstable state,
an unsettled data point was plotted on the charts.
2.3 Diagnosis of defects: -
Pareto analysis was used to distinguish vital few defects from trivial many defects. After diagnosis of vital
few defects (major defects), their causes were then traced out.
2.4 Analysis of Causes: -
Cause and effect diagram (Fishbone diagram or Ishikawa diagram) was utilized to show the relation
between the quality characteristic and various causes of defects. Each and every process was strictly
analyzed and the reasons of major defects were plotted on the Fishbone diagrams. Also reasons were
elaborated which are self explanatory to help for taking remedial measures.
2.5 Conclusion: -
After collection of data and developing the control charts, Pareto analysis and using the cause & effect diagram for
Brass and GMCS, an over all conclusion will be established through experimental results.
3. Application of S.Q.C Tools for Brass & GMCS
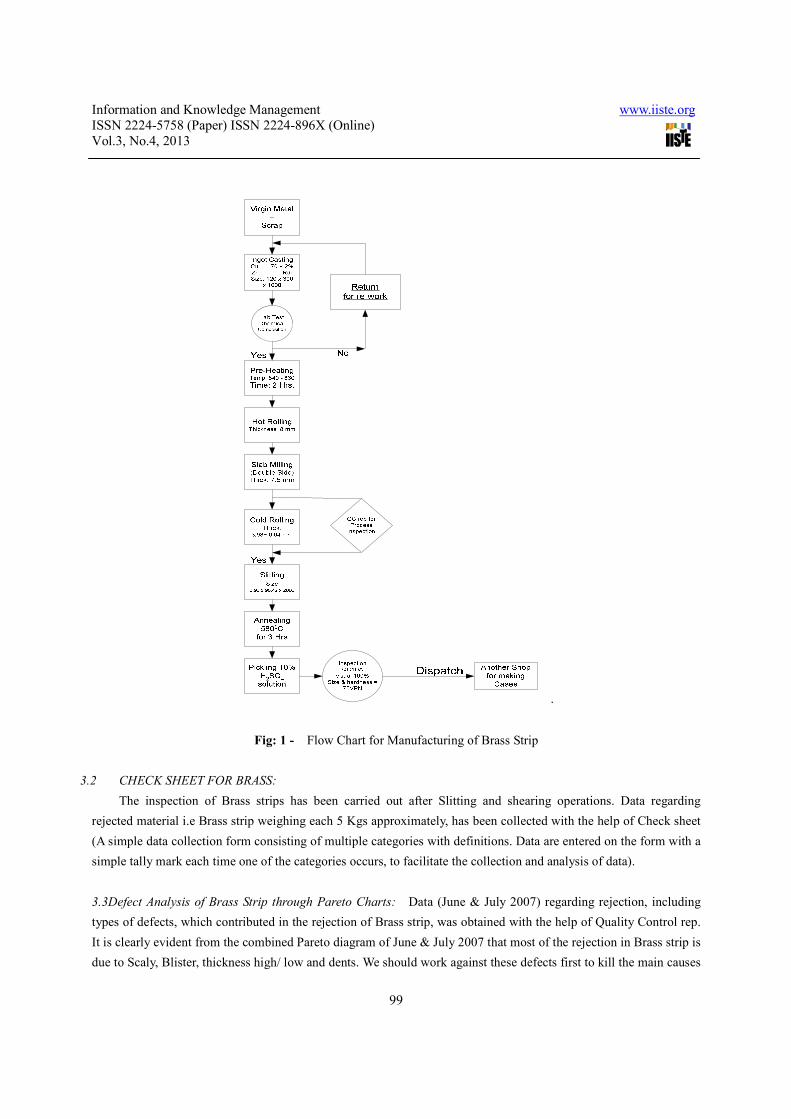
3.1 Flow Chart for Brass Strip: Flow chart is a diagram of activities involved in the process or in the solution of a
problem. A flow chart should be the first step in identifying problems and targeting areas for improvement. The
Process / Manufacturing steps are presented graphically in sequence so that an Analyst can examine the order
presented and come to a common understanding of how the process operates. A simple Flow chart (Fig: 1) is
established for Brass strip, which is given as under: -
Information and Knowledge Management www.iiste.org
ISSN 2224-5758 (Paper) ISSN 2224-896X (Online)
Vol.3, No.4, 2013
99
.
Fig: 1 - Flow Chart for Manufacturing of Brass Strip
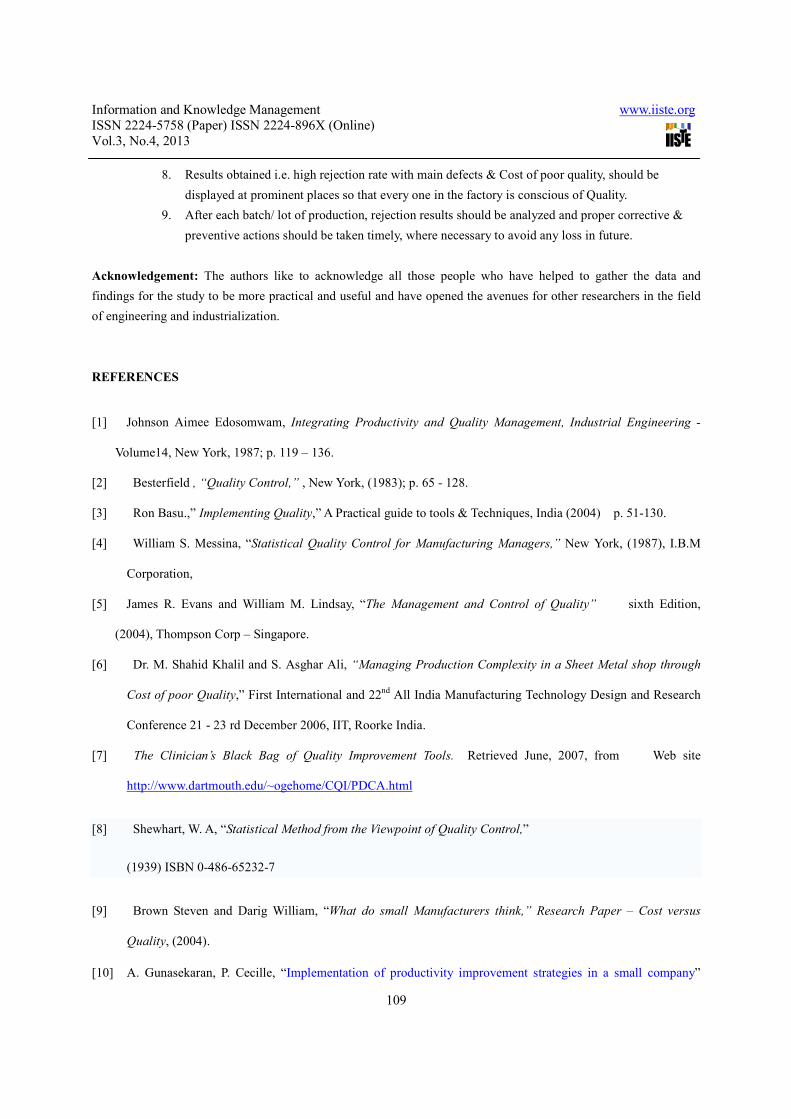
3.2 CHECK SHEET FOR BRASS:
The inspection of Brass strips has been carried out after Slitting and shearing operations. Data regarding
rejected material i.e Brass strip weighing each 5 Kgs approximately, has been collected with the help of Check sheet
(A simple data collection form consisting of multiple categories with definitions. Data are entered on the form with a
simple tally mark each time one of the categories occurs, to facilitate the collection and analysis of data).
3.3Defect Analysis of Brass Strip through Pareto Charts: Data (June & July 2007) regarding rejection, including
types of defects, which contributed in the rejection of Brass strip, was obtained with the help of Quality Control rep.
It is clearly evident from the combined Pareto diagram of June & July 2007 that most of the rejection in Brass strip is
due to Scaly, Blister, thickness high/ low and dents. We should work against these defects first to kill the main causes
Information and Knowledge Management www.iiste.org
ISSN 2224-5758 (Paper) ISSN 2224-896X (Online)
Vol.3, No.4, 2013
100
of rejection. The rejection figure touches 21 % in the month of July 2007, which is alarming and need immediate
corrective action to reduce the wastage.
4. CONTROL CHARTS FOR BRASS STRIP: Control Chart is a powerful statistical tool that may have many
different applications. For example, they may be used to monitor key product variables and process parameters
(Thickness etc). They may also be used in the maintenance of process control and in the identification of special and
common causes of variation. In addition, they may also be used for process improvement by showing the effects of
process of change.
In the light of above statistics (Pareto charts, cause & effect diagram etc) it is clearly shown that due to variation in
Thickness i.e High or Low, a large quantity of Brass strip is become wastage. A powerful method of Control charts
was utilized to identify the assignable / special causes of variations and to control the thickness of Brass strip.
CONTROL CHARTS FOR BRASS STRIP (THICKNESS), AUGUST 2007.Data on various days and shifts for the month
of August,2007 has been collected with the help of operators of Cold rolling mill, denoted by P1, P2 etc (where final
size of Brass is maintained) and QC reps i.e Q1, Q2, Q3 and Q4 etc. Different types of calculations, required to
generate control charts are done with the help of M.S Excel, using formulae as under.The central lines for the X and R
charts are obtained using the formulas:
andg
X
X
R
i
i∑== 1
g
R
R
R
i
i∑=
=1
Where X = average of the subgroup averages ( read “X double bar” )
X = Average of the i th subgroup.
g = number of subgroups.
R = average of the subgroup ranges
Ri = range of the i th subgroup.
Trail control limits for the charts are established at + 3 standard deviations from the central value, as shown by the
formulas:
UCLX
= X + 3 Xσ UCLR = R + 3 Rσ
LCLX
= X _ 3 Xσ LCLR = R - 3 Rσ
Where UCL = upper control limit
LCL = lover control limit
Xσ = Population standard deviation of the subgroup averages (X’s)
Information and Knowledge Management www.iiste.org
ISSN 2224-5758 (Paper) ISSN 2224-896X (Online)
Vol.3, No.4, 2013
101
Rσ = Population standard deviation of the range
In practice, the calculations are simplified by suing the product of the range R and a factor (A2) to replace the three
standard deviations (A2 R =3 Xσ ) in the formulas for the X chart. For the R chart, the range R is used to estimate
the standard deviation of the range ( Rσ ). Therefore, the derived formulas are:
UCLX
= X + A2 R UCLR = D4 R
LCLX
= X _ A2 R LCLR = D3 R where A2,
D3 and D4 are factors that vary with the subgroup size and can be found in Appendix – ‘B’ [2].
†: P1 – Plant Operator # 1 and Q 1 – Quality Control rep 1
Similarly data have been collected on different dates and shifts (August 2007) and Control charts have been
established. Only those are reproduced here which are prominent i.e where variation is clearly shown.
Similarly variable control charts have been established for various dated and causes of defects were analyzed through
Cause & Effect diagrams.
5. ANALYSIS OF CAUSES FOR BRASS & GMCS (causes of defects and their remedial measures)
All the critical processes / steps involved in the manufacturing of Brass & GMCS were studied, keeping in mind
the relevant Flow charts of these two products. Following team consisting of 4 members along with one leader was
formulated, to investigate the main causes of defects using brainstorming techniques..
• The Analyst ……………………………... Leader
• Rep of Quality Control Deptt…………..Member
• Rep of Design Office……………….…...Member
• Rep of Production Deptt………………..Member
• Rep of Met Lab……………………..……Member
On the basis of Pareto charts and control charts of both the products i.e Brass and GMCS strips, as mentioned earlier,
a list of irregularities / flaws were obtained. These are discussed in a chronological order as under.
5.1 CAUSE & EFFECT DIAGRAM FOR BRASS STRIP:
On the basis of Pareto analysis, we found that Blister, Scaly, Red stains, Dents & scratches and Thickness
High/ Low are the main defects/ non- conformities in Brass strip resulting in high rejection percentage. Primary
and Secondary causes of each defect were analyzed and finally Cause & Effect diagrams (Fishbone Diagram)
were established, which are given as under
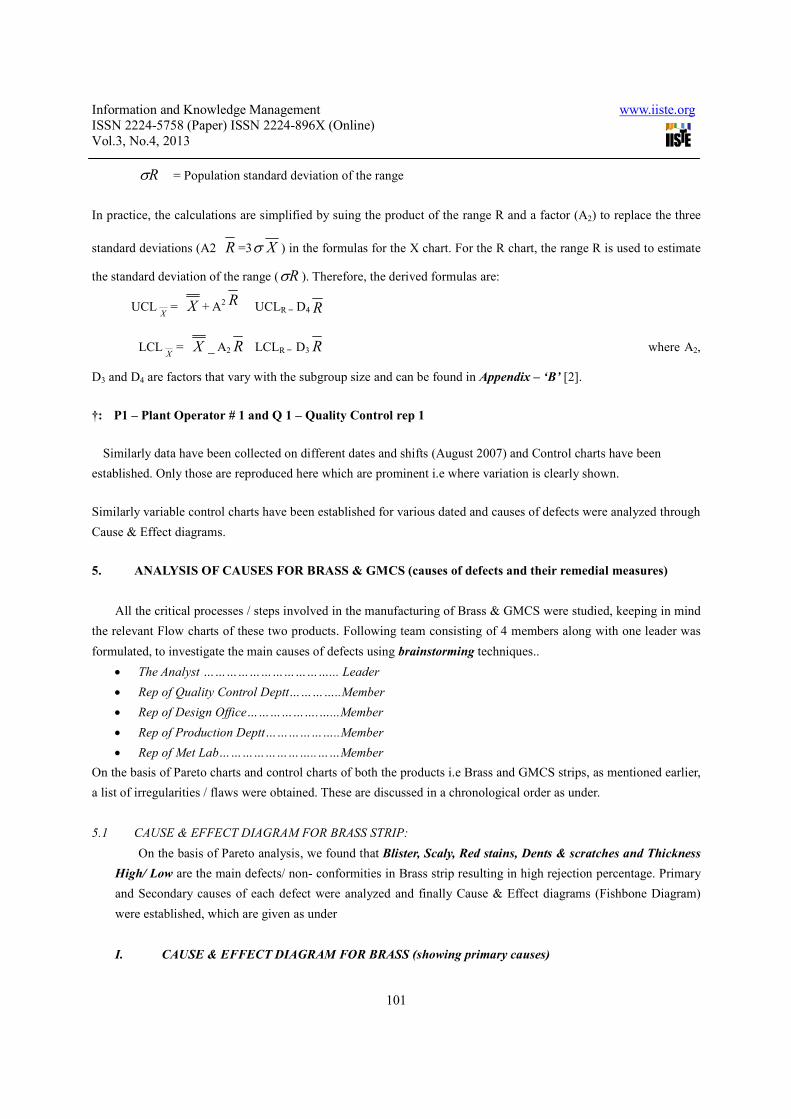
I. CAUSE & EFFECT DIAGRAM FOR BRASS (showing primary causes)
Information and Knowledge Management www.iiste.org
ISSN 2224-5758 (Paper) ISSN 2224-896X (Online)
Vol.3, No.4, 2013
102
The first step in analyzing an effect is to establish a Fish bone diagram showing primary causes of the main
effect. In our case the main effect is Non- conforming or high rejection rate of Brass and GMCS. Fig: 14,
below ‘Cause & effect diagram for Brass’ showing primary causes by using Pareto analysis.
Fig: 14 - Cause & effect diagram for Brass (showing primary causes)
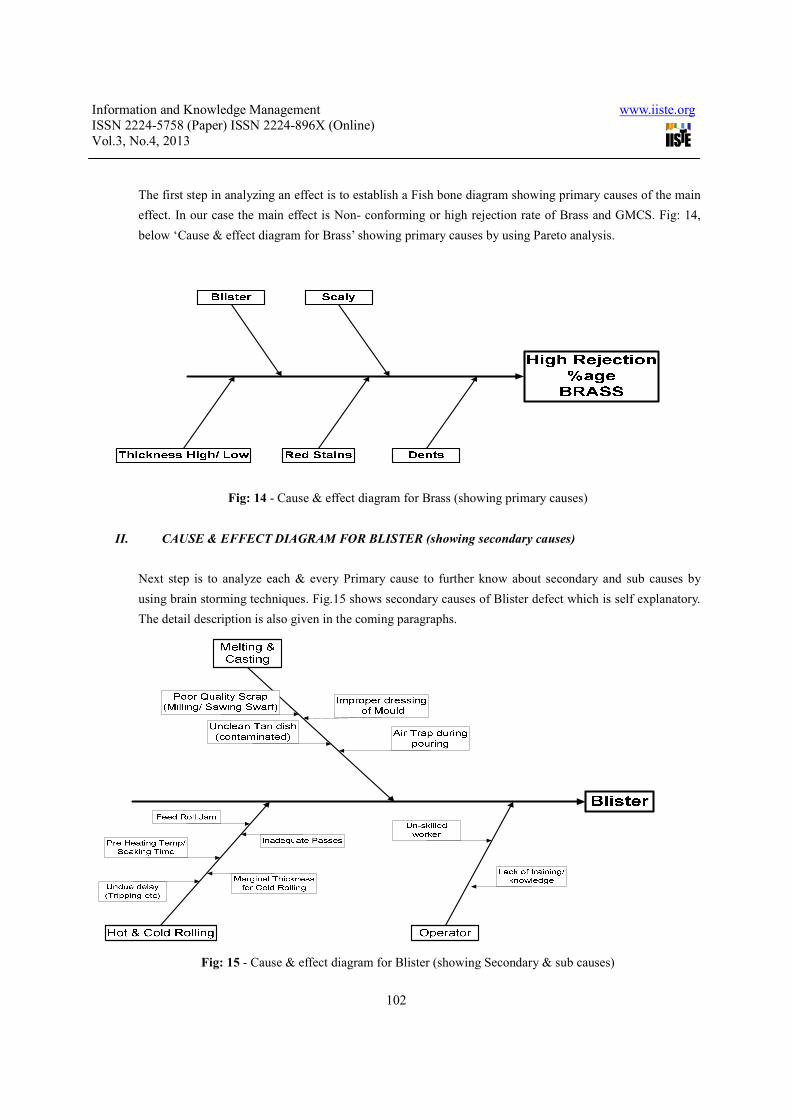
II. CAUSE & EFFECT DIAGRAM FOR BLISTER (showing secondary causes)
Next step is to analyze each & every Primary cause to further know about secondary and sub causes by
using brain storming techniques. Fig.15 shows secondary causes of Blister defect which is self explanatory.
The detail description is also given in the coming paragraphs.
Fig: 15 - Cause & effect diagram for Blister (showing Secondary & sub causes)
Information and Knowledge Management www.iiste.org
ISSN 2224-5758 (Paper) ISSN 2224-896X (Online)
Vol.3, No.4, 2013
103
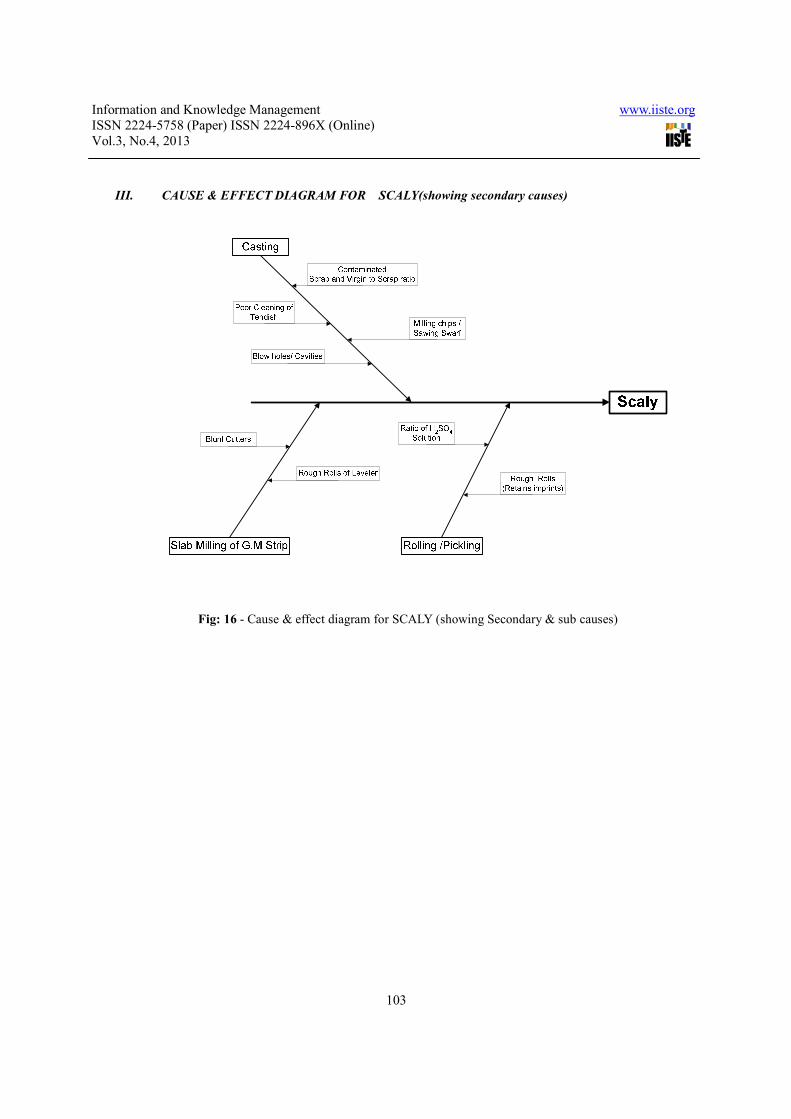
III. CAUSE & EFFECT DIAGRAM FOR SCALY(showing secondary causes)
Fig: 16 - Cause & effect diagram for SCALY (showing Secondary & sub causes)
Information and Knowledge Management www.iiste.org
ISSN 2224-5758 (Paper) ISSN 2224-896X (Online)
Vol.3, No.4, 2013
104
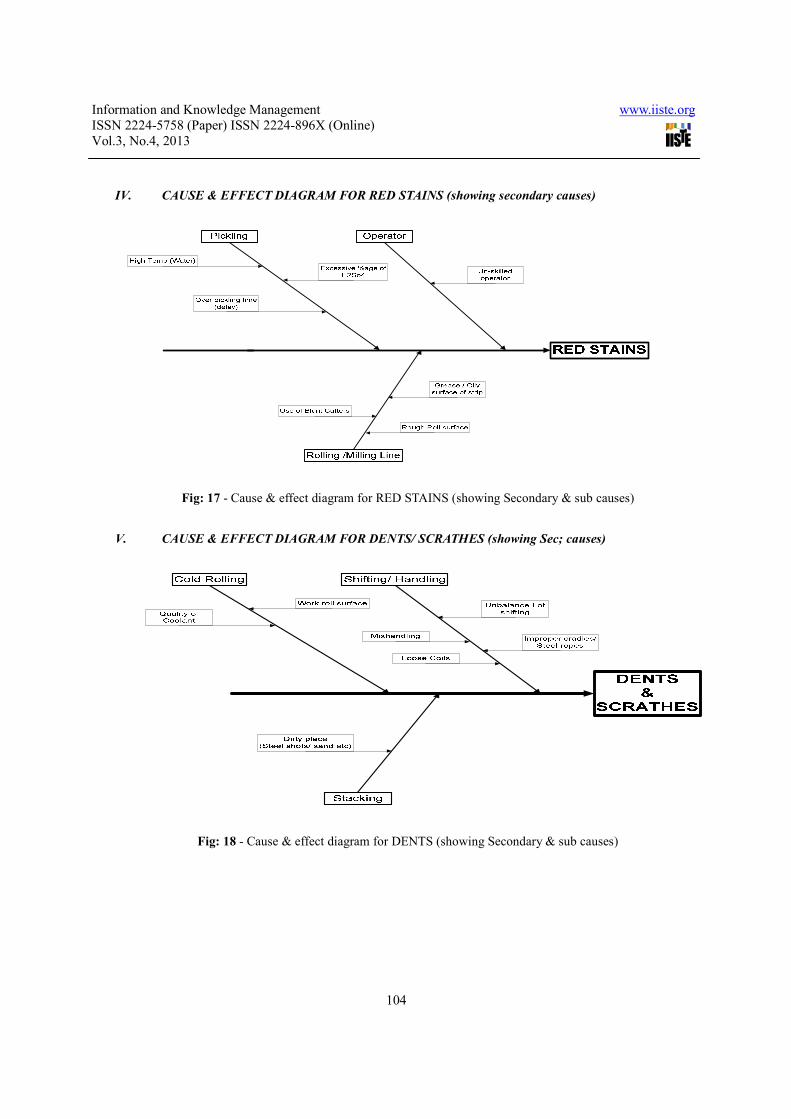
IV. CAUSE & EFFECT DIAGRAM FOR RED STAINS (showing secondary causes)
Fig: 17 - Cause & effect diagram for RED STAINS (showing Secondary & sub causes)
V. CAUSE & EFFECT DIAGRAM FOR DENTS/ SCRATHES (showing Sec; causes)
Fig: 18 - Cause & effect diagram for DENTS (showing Secondary & sub causes)
Information and Knowledge Management www.iiste.org
ISSN 2224-5758 (Paper) ISSN 2224-896X (Online)
Vol.3, No.4, 2013
105
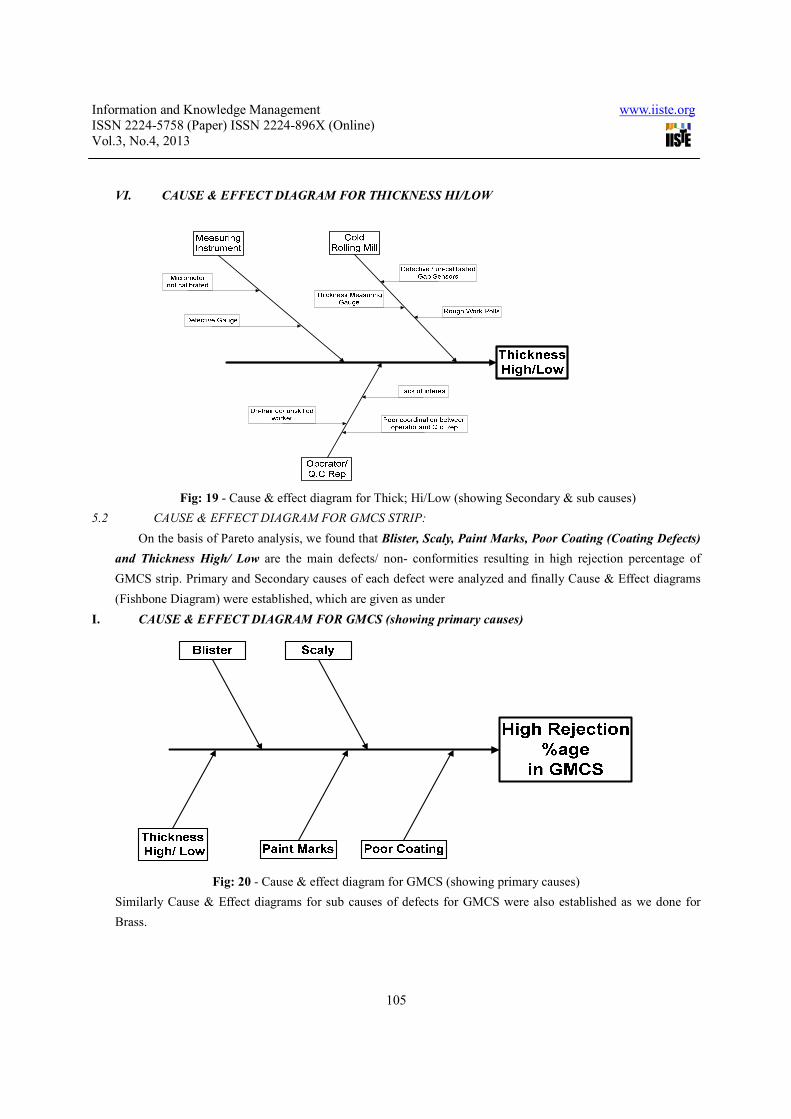
VI. CAUSE & EFFECT DIAGRAM FOR THICKNESS HI/LOW
Fig: 19 - Cause & effect diagram for Thick; Hi/Low (showing Secondary & sub causes)
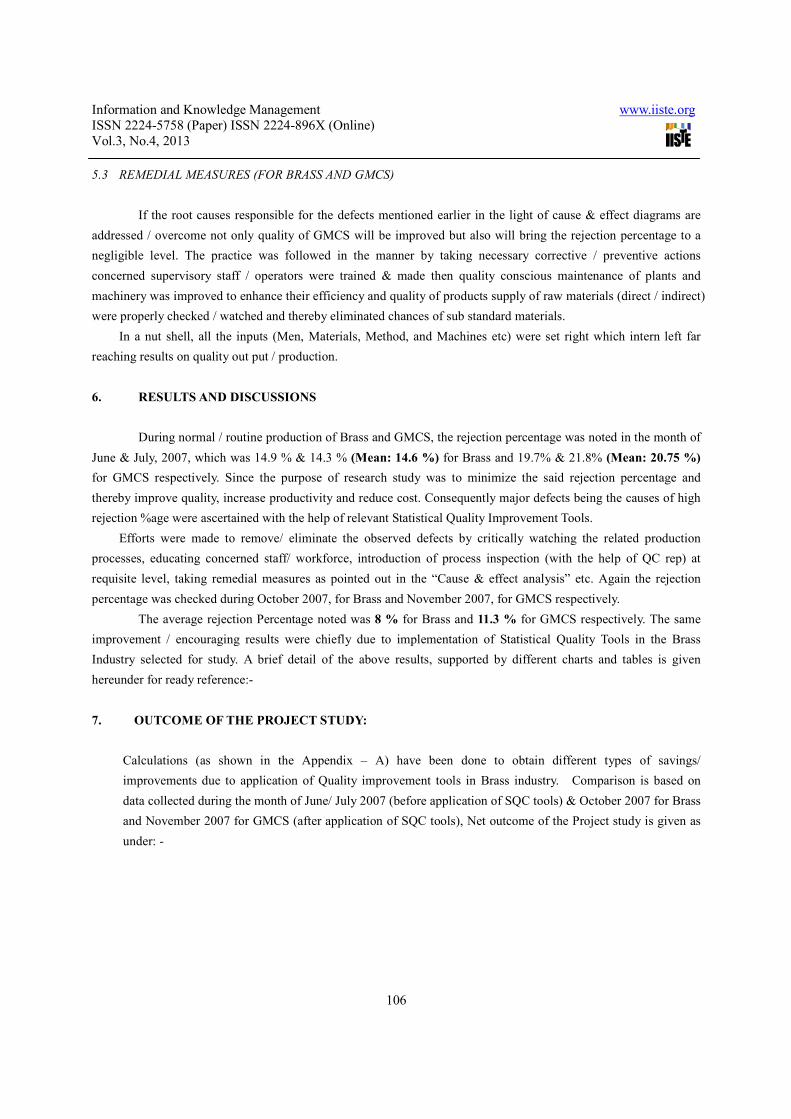
5.2 CAUSE & EFFECT DIAGRAM FOR GMCS STRIP:
On the basis of Pareto analysis, we found that Blister, Scaly, Paint Marks, Poor Coating (Coating Defects)
and Thickness High/ Low are the main defects/ non- conformities resulting in high rejection percentage of
GMCS strip. Primary and Secondary causes of each defect were analyzed and finally Cause & Effect diagrams
(Fishbone Diagram) were established, which are given as under
I. CAUSE & EFFECT DIAGRAM FOR GMCS (showing primary causes)
Fig: 20 - Cause & effect diagram for GMCS (showing primary causes)
Similarly Cause & Effect diagrams for sub causes of defects for GMCS were also established as we done for
Brass.
Information and Knowledge Management www.iiste.org
ISSN 2224-5758 (Paper) ISSN 2224-896X (Online)
Vol.3, No.4, 2013
106
5.3 REMEDIAL MEASURES (FOR BRASS AND GMCS)
If the root causes responsible for the defects mentioned earlier in the light of cause & effect diagrams are
addressed / overcome not only quality of GMCS will be improved but also will bring the rejection percentage to a
negligible level. The practice was followed in the manner by taking necessary corrective / preventive actions
concerned supervisory staff / operators were trained & made then quality conscious maintenance of plants and
machinery was improved to enhance their efficiency and quality of products supply of raw materials (direct / indirect)
were properly checked / watched and thereby eliminated chances of sub standard materials.
In a nut shell, all the inputs (Men, Materials, Method, and Machines etc) were set right which intern left far
reaching results on quality out put / production.
6. RESULTS AND DISCUSSIONS
During normal / routine production of Brass and GMCS, the rejection percentage was noted in the month of
June & July, 2007, which was 14.9 % & 14.3 % (Mean: 14.6 %) for Brass and 19.7% & 21.8% (Mean: 20.75 %)
for GMCS respectively. Since the purpose of research study was to minimize the said rejection percentage and
thereby improve quality, increase productivity and reduce cost. Consequently major defects being the causes of high
rejection %age were ascertained with the help of relevant Statistical Quality Improvement Tools.
Efforts were made to remove/ eliminate the observed defects by critically watching the related production
processes, educating concerned staff/ workforce, introduction of process inspection (with the help of QC rep) at
requisite level, taking remedial measures as pointed out in the “Cause & effect analysis” etc. Again the rejection
percentage was checked during October 2007, for Brass and November 2007, for GMCS respectively.
The average rejection Percentage noted was 8 % for Brass and 11.3 % for GMCS respectively. The same
improvement / encouraging results were chiefly due to implementation of Statistical Quality Tools in the Brass
Industry selected for study. A brief detail of the above results, supported by different charts and tables is given
hereunder for ready reference:-
7. OUTCOME OF THE PROJECT STUDY:
Calculations (as shown in the Appendix – A) have been done to obtain different types of savings/
improvements due to application of Quality improvement tools in Brass industry. Comparison is based on
data collected during the month of June/ July 2007 (before application of SQC tools) & October 2007 for Brass
and November 2007 for GMCS (after application of SQC tools), Net outcome of the Project study is given as
under: -
Information and Knowledge Management www.iiste.org
ISSN 2224-5758 (Paper) ISSN 2224-896X (Online)
Vol.3, No.4, 2013
107
7.1 OUTCOME IN BRASS:
���� Saving in PRODUCTION:
• saving in Production = 7471.20 Kgs/ month
• Improvement in reduction of Rejection
Percentage
= 45.2 %
• Percentage increase in Production = 7.17 %
• Saving Labor Hours = 560.34 Hrs / month
���� Saving in COST:
•••• Saving in Full Cost = Rs. 2458024.8
•••• Percentage saving in Full Cost = 7.2 %
•••• Also saving in Labor Cost = Rs. 35861.76
•••• and saving in material Cost = Rs. 2316072
7.2 OUTCOME IN GMCS:
���� Saving in PRODUCTION:
•••• Saving in Production = 1663.20 Kgs/ month
•••• Improvement in reduction of Rejection
Percentage
= 45.5 %
•••• Percentage increase in Production = 10.65 %
•••• Saving Labor Hours = 615.384 / month
���� Saving in COST:
•••• Saving in Full Cost (Rs) = Rs. 485654.4
• Percentage reduction in Full cost = 10.6 %
• Also saving in Labor Cost (Rs) = Rs. 37422
• and saving in material Cost (Rs) = Rs. 342619.20
8. CONCLUSION & RECOMMENDATIONS
8.1 CONCLUSION:
The purpose/ goal of the research study has been achieved to a greater extent regarding minimizing/ eliminating
the rejection percentage in Brass strip and GMCS. In course of the said study, rate of rejection in Brass strip was
brought down from 15% to 8 %. Similarly, rejection percentage in GMCS was reduced from 21% to 11.3 %. The
study has given new dimensions and awareness to management as well as workforce, to improve and maintain
Information and Knowledge Management www.iiste.org
ISSN 2224-5758 (Paper) ISSN 2224-896X (Online)
Vol.3, No.4, 2013
108
Quality in letter and spirit. A new culture has been observed that shows phenomenal increase in Productivity,
reduction in rejection percentage (reduction in waste0, and improvement in operator’s skill
In fact, the rate of rejection being on the higher side was due to the existence of major defects like Blister, Scaly,
Thickness high / low, Dents/ scratches, red stains, milling defects, Coating defects and Paint marks. The target of the
study was to arrest these defects by eliminating its causes. The main causes being observed/ pointed out were: -
� Production processes (Casting, Hot rolling, Cold rolling, Packing of sandwiches for GMCS, heat treatment
and pickling)
� Direct Materials (Brass scrap, steel slabs) and Indirect materials (wrapping sheets, paint powder, coolant oil
and acid for pickling)
� Plants & Machines (Shot blasting, Preheating furnaces, Hot Mill, Slab Milling line, Cold rolling Mill and
Annealing & Pickling Plant)
� Workforce involved in (Casting, packing of sandwiches for GMCS, Hot Rolling, Milling, Cold rolling,
Annealing & Pickling, Shearing/ Slitting)
The above defects/ causes were successfully controlled which left far reaching results on Quality, productivity
and Cost
The ultimate goal of enhancing the quality & productivity and reduction in cost was achieved to a considerable
extent, that is: -
� Rejection percentage of Brass and GMCS was reduced by 45%
� Productivity increased by 7.1 % in Brass and 10.7 % in GMCS.
� Also Full Cost of Brass is reduced by 7.25 and That of GMCS is reduced by 10.6%
The aforementioned improvement in Quality, productivity and reduction in cost owe its roots mainly in the
application of Statistical Quality Tools.
8.2 RECOMMENDATIONS FOR FUTURE PLANNING:
After having a detailed study of the production complexities in Brass Industry, factors causing high rejection of Brass
and GMCS products and their economic implications following are recommended for future.
1. Complete Flow / Process chart should be established for each product, for better understanding of
the processes and identification of critical operations.
2. Pareto Charts (Rejection categorization) should be implemented in production units to point out the
major defects causing high rejection.
3. Rejection categories should be analyzed carefully (by using Cause & Effect diagrams) and
preventive actions should be taken to control recurrence.
4. Supervisory staff / Work force should be trained before start of operation.
5. Process sheets should be well laid out so that these are well read / understand by Technicians.
6. Management responsibility as regards provision of material should be discharged carefully for
putting into operation-qualified material only.
7. Extra care should be given to maintenance of plants & machinery to always put them in Upkeep
condition for smooth production of quality products.
Information and Knowledge Management www.iiste.org
ISSN 2224-5758 (Paper) ISSN 2224-896X (Online)
Vol.3, No.4, 2013
109
8. Results obtained i.e. high rejection rate with main defects & Cost of poor quality, should be
displayed at prominent places so that every one in the factory is conscious of Quality.
9. After each batch/ lot of production, rejection results should be analyzed and proper corrective &
preventive actions should be taken timely, where necessary to avoid any loss in future.
Acknowledgement: The authors like to acknowledge all those people who have helped to gather the data and
findings for the study to be more practical and useful and have opened the avenues for other researchers in the field
of engineering and industrialization.
REFERENCES
[1] Johnson Aimee Edosomwam, Integrating Productivity and Quality Management, Industrial Engineering -
Volume14, New York, 1987; p. 119 – 136.
[2] Besterfield , “Quality Control,” , New York, (1983); p. 65 - 128.
[3] Ron Basu.,” Implementing Quality,” A Practical guide to tools & Techniques, India (2004) p. 51-130.
[4] William S. Messina, “Statistical Quality Control for Manufacturing Managers,” New York, (1987), I.B.M
Corporation,
[5] James R. Evans and William M. Lindsay, “The Management and Control of Quality” sixth Edition,
(2004), Thompson Corp – Singapore.
[6] Dr. M. Shahid Khalil and S. Asghar Ali, “Managing Production Complexity in a Sheet Metal shop through
Cost of poor Quality,” First International and 22nd
All India Manufacturing Technology Design and Research
Conference 21 - 23 rd December 2006, IIT, Roorke India.
[7] The Clinician’s Black Bag of Quality Improvement Tools. Retrieved June, 2007, from Web site
http://www.dartmouth.edu/~ogehome/CQI/PDCA.html
[8] Shewhart, W. A, “Statistical Method from the Viewpoint of Quality Control,”
(1939) ISBN 0-486-65232-7
[9] Brown Steven and Darig William, “What do small Manufacturers think,” Research Paper – Cost versus
Quality, (2004).
[10] A. Gunasekaran, P. Cecille, “Implementation of productivity improvement strategies in a small company”
Information and Knowledge Management www.iiste.org
ISSN 2224-5758 (Paper) ISSN 2224-896X (Online)
Vol.3, No.4, 2013
110
Technovation, Volume 18, Issue 5, May 1998, Pages 311-321
[11] “Presentation on Q7 – Basic seven tools” from Wikipedia, The free encyclopedia.
[12] “The 10 rules of Casting - Casting Practices” from Wikipedia, The free encyclopedia.
Date: 03-6-2007 Time: Material: 70:30 Brass (After Slitting & Shearing)
Shift: 2nd
CHAECKSHEET Lot # 1 Lot # 2 Lot # 3 Lot # 4 Lot # 5 Total strips
(Nos)
Weight
(Kgs)
Scaly IIII IIII
IIII
IIII IIII
IIII
IIII IIII
IIII
IIII IIII
IIII IIII
IIII IIII
IIII 78 390
Blister 0 0
Thickness High IIII II IIII III IIII IIII I IIII IIII 36 180
Thickness Low IIII IIII IIII IIII IIII IIII II IIII IIII 42 210
Dents II II I I 6 30
Red Stains III II III IIII IIII 18 90
Milling Defect I I 2 10
Miscellaneous 0 0
Total 182 910
Information and Knowledge Management www.iiste.org
ISSN 2224-5758 (Paper) ISSN 2224-896X (Online)
Vol.3, No.4, 2013
111
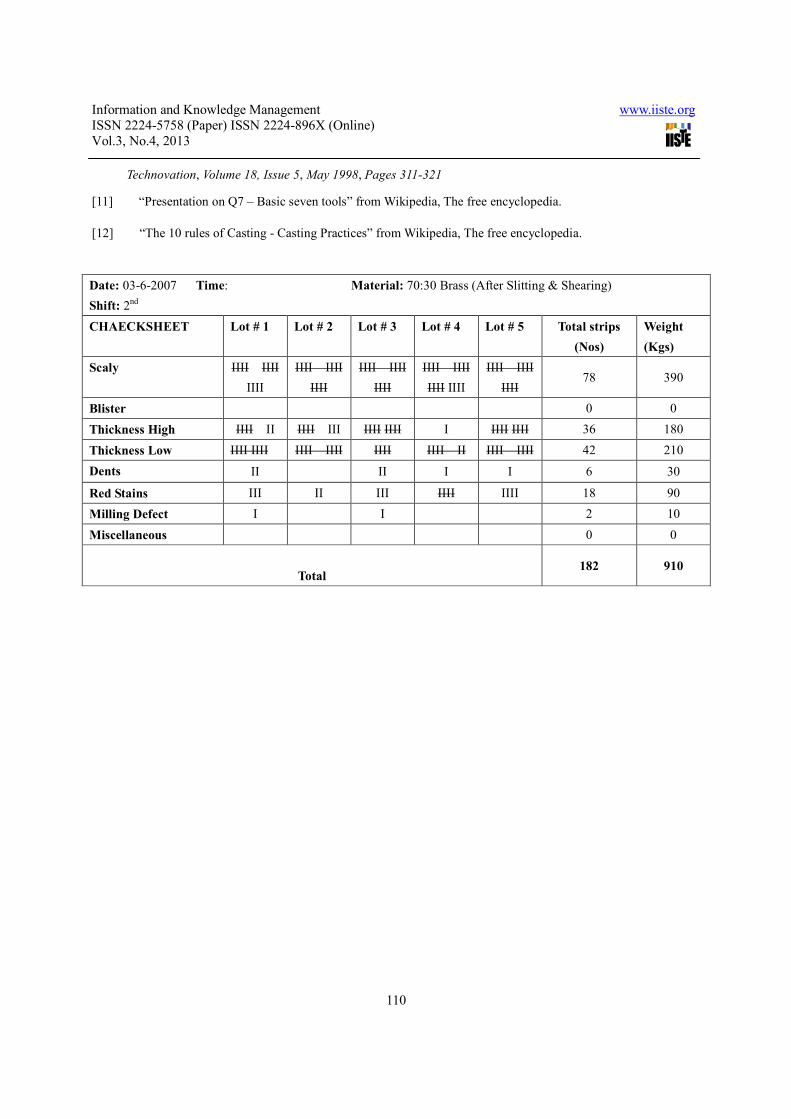
Table 1. Check sheet of Brass strip for 03-6-2007 is given as under:-
Date
Qty
Submitted
(Kgs)
Qty
passed
(Kgs)
Qty
rejected
(Kgs)
Rejection %age
DEFECTS IN Kgs
Scaly Blister High Low Dent R/Stain Milling Defect
03.06.07 6840 5930 910 13.3 390 0 180 210 30 90 10
15.06.07 8430 7290 1140 13.5 600 0 150 180 200 0 10
18.06.07 10000 8126 1874 18.7 800 456 100 135 232 136 15
20.06.07 9000 7913 1087 12.1 472 120 150 135 56 75 79
21.06.07 8000 6546 1454 18.2 392 344 152 208 208 150 0
25.06.07 13000 11297 1703 13.1 624 456 150 140 232 96 5
26.06.07 12000 10377 1623 13.5 700 350 140 160 131 142 0
27.06.07 5910 4920 990 16.8 450 0 400 110 0 0 30
28.06.07 8000 6674 1326 16.6 464 344 240 0 160 104 14
30.06.07 12000 10272 1728 14.4 744 416 160 24 184 200 0
30.06.07 8190 7050 1140 13.9 120 0 600 300 0 0 120
SUM= 59100.0 86395.0 14975.0 164.1 5756 2486 2422 1602 1433 993 283
Average Defects 523.3 226.0 220.2 145.6 130.3 90.3 25.7
%age Defects 38.4 16.6 16.2 10.7 9.6 6.6 1.9
Average Rej %age w.r.t Total Qty Submitted = 9.74 4.21 4.10 2.71 2.42 1.68 0.48
Average Rejection %age for June, 2007 = 14.9 %
Table:2 – Defect Analysis of Brass for the month of JUNE 2007
Information and Knowledge Management www.iiste.org
ISSN 2224-5758 (Paper) ISSN 2224-896X (Online)
Vol.3, No.4, 2013
112
Defect Analysis of Brass for JUNE 2007.
Defects analysis of Brass Strip.
JUNE,2007.
523.3
226.0 220.2
145.6 130.390.3
25.7
0.0
100.0
200.0
300.0
400.0
500.0
600.0
Scally Blister High Low Dent R/Stain Milling
Defect
Defects
Qu
an
tity
Kg
s
Fig. 2 – Pareto Diagram for Brass based on average defects – JUNE 2007.
D e f e c t s a n a l y s i s o f B r a s s S t r i p .
J u n e 2 0 0 7 .
9 . 7
4 . 2 4 . 1
2 . 7 2 . 4 1 . 7
0 . 5
0 .0 0
2 .0 0
4 .0 0
6 .0 0
8 .0 0
1 0 .0 0
1 2 .0 0
S c a ly B lis te r H ig h L o w D e n t R /S ta in M il lin g D e f e c t s
D e fe c t s
Reje
cti
on
%ag
e w
.r.t
To
tal
Q
ty S
ub
mit
ted
Fig. 3- Pareto Diagram for Brass w.r.t average
Defects & Total Quantity submitted – JUNE 2007
Information and Knowledge Management www.iiste.org
ISSN 2224-5758 (Paper) ISSN 2224-896X (Online)
Vol.3, No.4, 2013
113
Similarly Pareto Analysis was also carried out for the month of July 2007, which is given as under.
Defects Analysis of Brass Strip for JULY, 2007.
267.73
173.27 167.45195.09
95.2754.64 35.64
0 . 0
50 . 0
100 . 0
150 . 0
200 . 0
250 . 0
300 . 0
Scally
Blis
ter
Hig
hLow
Den
t
R/S
tain
Mill
ing D
efec
t
Defects
Qty
in
Kg
s
Fig. 4 – Pareto Diagram for Brass based on average defects – JULY 2007
Fig.5- Pareto Diagram for Brass w.r.t average defects & Total Quantity submitted – JULY 2007
Defects analysis of Brass Strip. July,2007.
6.4
4.2 4.04.7
2.3
1.30.9
0.00
2.00
4.00
6.00
8.00
Scaly Blister High Low Dent R/Stain Milling Defect
Defects
Reje
cti
on
%ag
e w
.r.t
To
tal
Qty
Su
bm
itte
d
Information and Knowledge Management www.iiste.org
ISSN 2224-5758 (Paper) ISSN 2224-896X (Online)
Vol.3, No.4, 2013
114
Fig: 6 – Combined Pareto Diagram for the Months of June-July,2007
Rejection %age of Brass 7.62 for June & July , 2007.
13.4
15.7
8.4
11.7 12.1 11.3
15.8
10.3
13.2
10.4
21.0
14.3
0.0
5.0
10.0
15.0
20.0
25.0
1 2 3 4 5 6 7 8 9 10 11 12
June-07
Jul-07
Fig. 7 – Line Graph showing rejection %age of Brass JUNE & JULY 2007
Defects analysis of Brass Strip.
June & July,2007.
8.1
4.3 4.1 3.8
2.41.5
0.7
0.0
2.0
4.0
6.0
8.0
10.0
Scally Blister High Low Dent R/Stain Milling
Defect
Defects
Reje
cti
on
%ag
e w
.r.t
To
tal Q
ty S
ub
mit
ted
Information and Knowledge Management www.iiste.org
ISSN 2224-5758 (Paper) ISSN 2224-896X (Online)
Vol.3, No.4, 2013
115
DAILY PRODUCTION REPORT 01-8-2007 to 22-8-2007.
Caliber: Brass Strip 7.62 mm Case Strip Size: 3.988 ± 0.04 (4.028 – 3.948 )
Shift: 1st
Operator: P1 Q.C Rep: Q1 Date: 01-8-2007
Coil
No. Readings SUM Average Range R*100 Remarks
1 3.99 3.99 3.98 3.99 15.95 3.988 0.01 1.00
2 4.05 4.02 4.01 4 16.08 4.020 0.05 5.00 Thickness High
3 3.96 3.96 3.95 3.93 15.8 3.950 0.03 3.00
4 3.99 3.98 4.01 4.02 16 4.000 0.04 4.00
Thickness at center will be
High
5 3.96 3.95 3.95 3.95 15.81 3.953 0.01 1.00
6 3.93 3.94 3.94 3.93 15.74 3.935 0.01 1.00 Thickness Low
7 3.97 3.95 3.94 3.96 15.82 3.955 0.03 3.00
8 3.96 3.95 3.95 3.94 15.8 3.950 0.02 2.00
9 3.93 3.9 3.98 3.93 15.74 3.935 0.08 8.00 Thickness Low
10 3.94 3.93 3.94 3.94 15.75 3.938 0.01 1.00 Thickness Low
Avge of Averages = 3.962 0.029 2.90
UCLAverage= 3.983 LCLAverage= 3.941 UCLRange= 6.618 LCLRange= 0
Table: 3 – Data of the Thickness (Brass Strip) 01-8-2007 - .
Information and Knowledge Management www.iiste.org
ISSN 2224-5758 (Paper) ISSN 2224-896X (Online)
Vol.3, No.4, 2013
116
C o n t r o l C h a r t 1 s t A u g u s t , 2 0 0 7 ( s h i f t : 1 s t ) .
3 . 9 7 3
4 . 0 2 0
3 . 9 5 0
3 . 9 3 5
3 . 9 5 5 3 . 9 5 0
3 . 9 3 5 3 . 9 3 8
4 . 0 0 0
3 . 9 5 3
3 . 8 8
3 . 9
3 . 9 2
3 . 9 4
3 . 9 6
3 . 9 8
4
4 . 0 2
4 . 0 4
1 2 3 4 5 6 7 8 9 1 0
C o i l N o s .
Th
ick
ne
ss
(m
m)
U C L X - B a r L C L X D B a r
RANGE CHART - Ist AUGUST, 2007.
0
1
2
3
4
5
6
7
8
9
1 2 3 4 5 6 7 8 9 10
Coil Nos.
Rnage (m
m) *
100
UCL Range
Range
LCL Range
R Bar
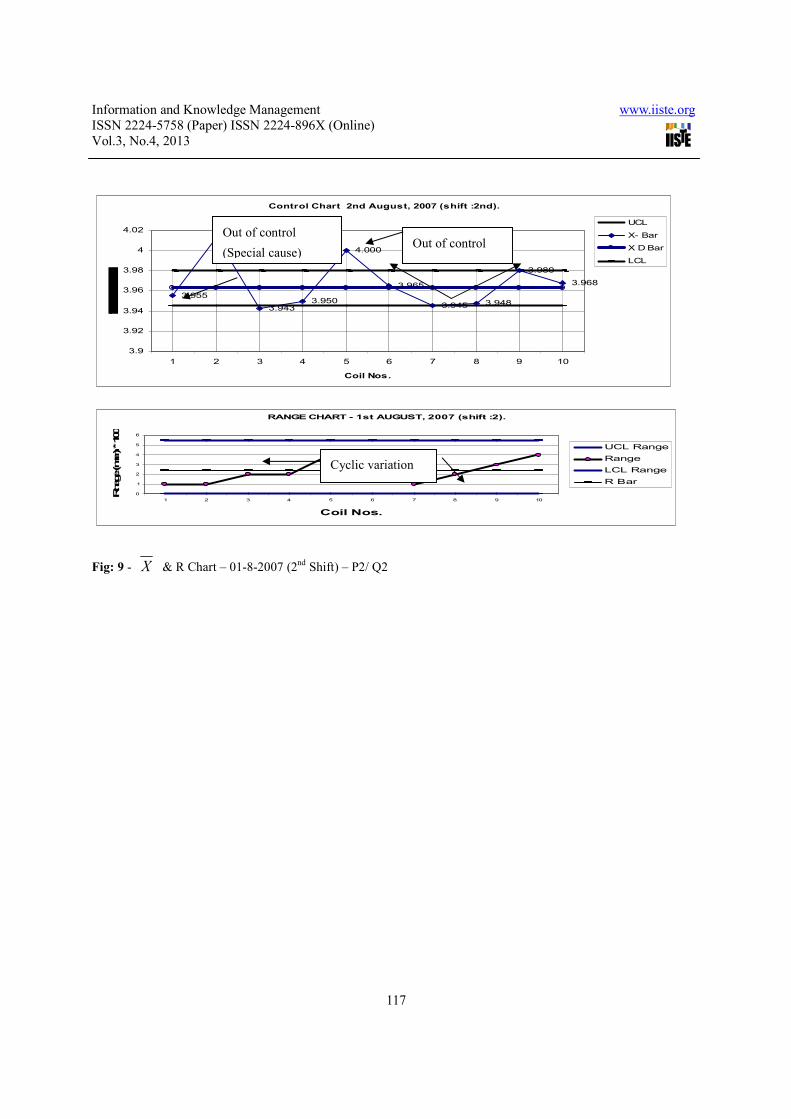
Fig: 8 - X & R Chart – 01-8-2007 (1st Shift) – P1/ Q1 †
Information and Knowledge Management www.iiste.org
ISSN 2224-5758 (Paper) ISSN 2224-896X (Online)
Vol.3, No.4, 2013
117
Control Chart 2nd August, 2007 (shift :2nd).
3.955
4.013
3.943
3.965
3.945 3.948
3.980
3.968
4.000
3.950
3.9
3.92
3.94
3.96
3.98
4
4.02
1 2 3 4 5 6 7 8 9 10
Coil Nos.
UCL
X- Bar
X D Bar
LCL
RANGE CHART - 1st AUGUST, 2007 (shift :2).
0
1
2
3
4
5
6
1 2 3 4 5 6 7 8 9 10
Coil Nos.
Rnage (mm) * 100
UCL Range
Range
LCL Range
R Bar
Fig: 9 - X & R Chart – 01-8-2007 (2nd
Shift) – P2/ Q2
Out of control
(Special cause) Out of control
Cyclic variation
Information and Knowledge Management www.iiste.org
ISSN 2224-5758 (Paper) ISSN 2224-896X (Online)
Vol.3, No.4, 2013
118
Control Chart August 3, 2007 (shift :1st).
4.020
3.9483.955
3.998
3.960
3.978
3.950 3.9503.950
3.933
3.88
3.9
3.92
3.94
3.96
3.98
4
4.02
4.04
1 2 3 4 5 6 7 8 9 10
Coil Nos.
Thic
kness (m
m)
UCL
X- Bar
LCL
X D Bar
RANGE CHART - AUGUST 3, 2007 (shift :1st).
0
1
2
3
4
5
6
7
8
1 2 3 4 5 6 7 8 9 10
Coil Nos.
Rnage (m
m) *
100
UCL Range
Range
LCL Range
R Bar
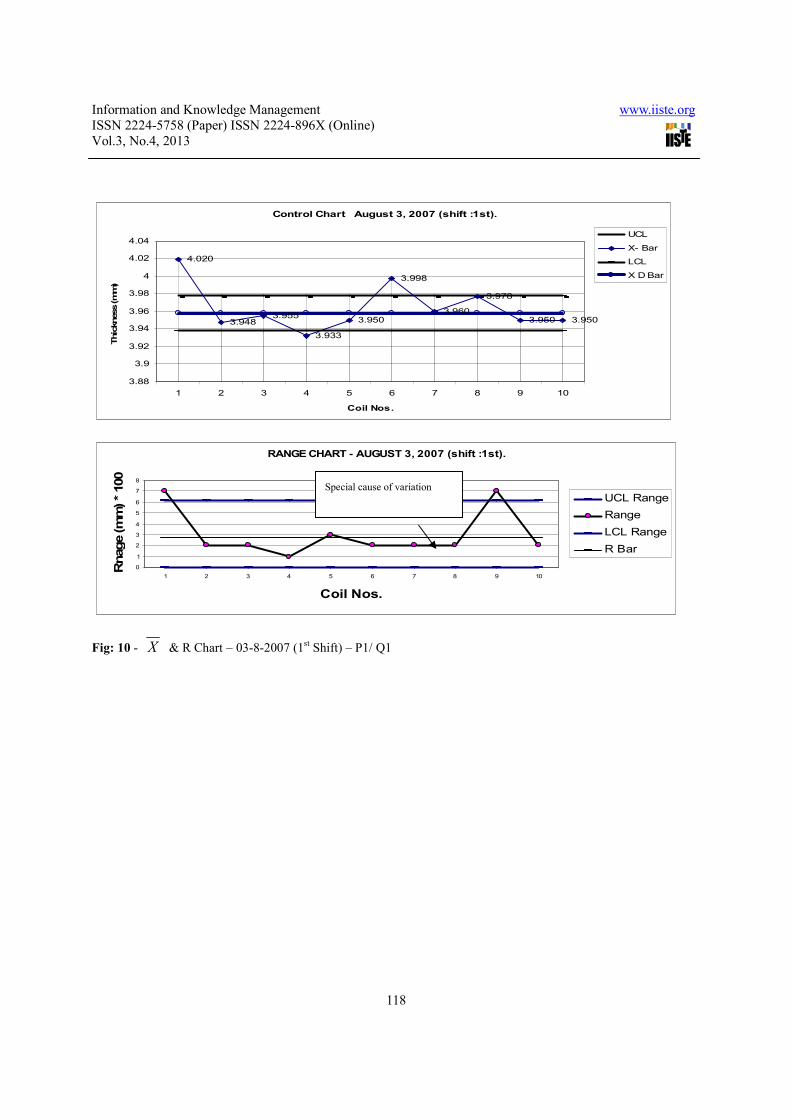
Fig: 10 - X & R Chart – 03-8-2007 (1st Shift) – P1/ Q1
Special cause of variation
Information and Knowledge Management www.iiste.org
ISSN 2224-5758 (Paper) ISSN 2224-896X (Online)
Vol.3, No.4, 2013
119
Control Chart August 3, 2007 (shift :2nd).
3.953
3.940 3.943
4.020
3.983
4.005
3.945
3.970
3.9483.955
3.88
3.9
3.92
3.94
3.96
3.98
4
4.02
4.04
1 2 3 4 5 6 7 8 9 10
Coil Nos.
Thickness (mm)
UCL
X- Bar
X D Bar
LCL
RANGE CHART - AUGUST 3, 2007 (shift :2nd).
2.00 2.00
3.00
1.00 1.00
2.00
8.00
7.00
2.00 2.00
0
1
2
3
4
5
6
7
8
9
1 2 3 4 5 6 7 8 9 10
Coil Nos.
Rnage (m
m) * 100
UCL Range
Range
R Bar
LCL Range
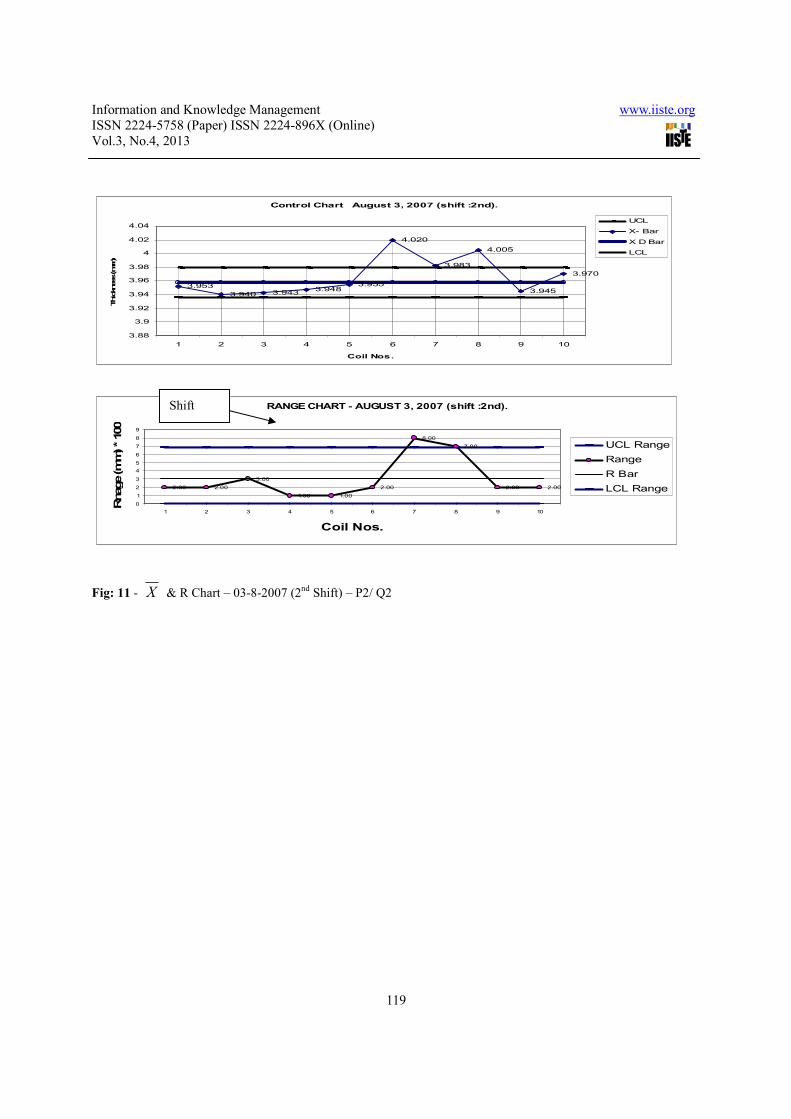
Fig: 11 - X & R Chart – 03-8-2007 (2nd
Shift) – P2/ Q2
Shift
Information and Knowledge Management www.iiste.org
ISSN 2224-5758 (Paper) ISSN 2224-896X (Online)
Vol.3, No.4, 2013
120
Control Chart August 5, 2007 (shift :1st).
4.008 4.005
3.953
3.915
3.958
3.945
3.960
3.915
3.958
3.935
3.86
3.88
3.9
3.92
3.94
3.96
3.98
4
4.02
1 2 3 4 5 6 7 8 9 10
Coil Nos.
Thickness (mm)
UCL
X- Bar
X D Bar
LCL
RANGE CHART - AUGUST 5, 2007 (shift :1st).
3.00
6.00
1.00
3.00
1.00 1.00
2.00 2.00 2.00
1.00
0
1
2
3
4
5
6
7
1 2 3 4 5 6 7 8 9 10
Coil Nos.
Rnage (m
m) * 100
UCL Range
Range
R Bar
LCL Range
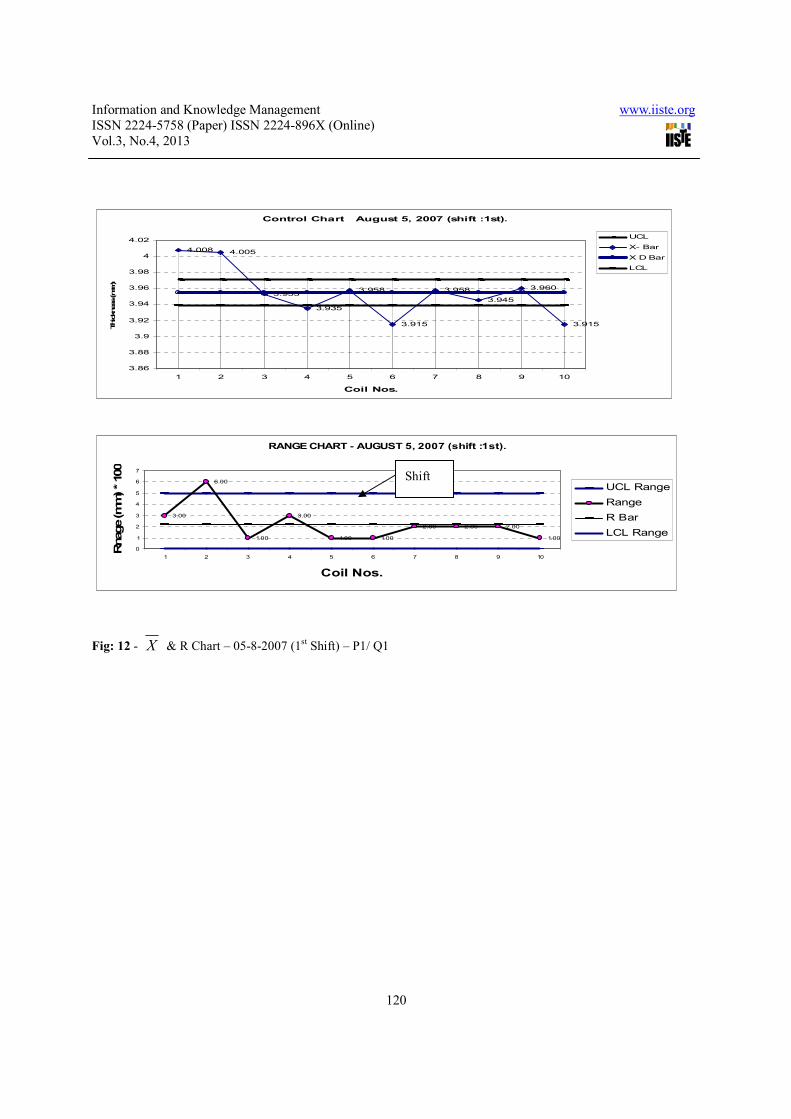
Fig: 12 - X & R Chart – 05-8-2007 (1st Shift) – P1/ Q1
Shift
Information and Knowledge Management www.iiste.org
ISSN 2224-5758 (Paper) ISSN 2224-896X (Online)
Vol.3, No.4, 2013
121
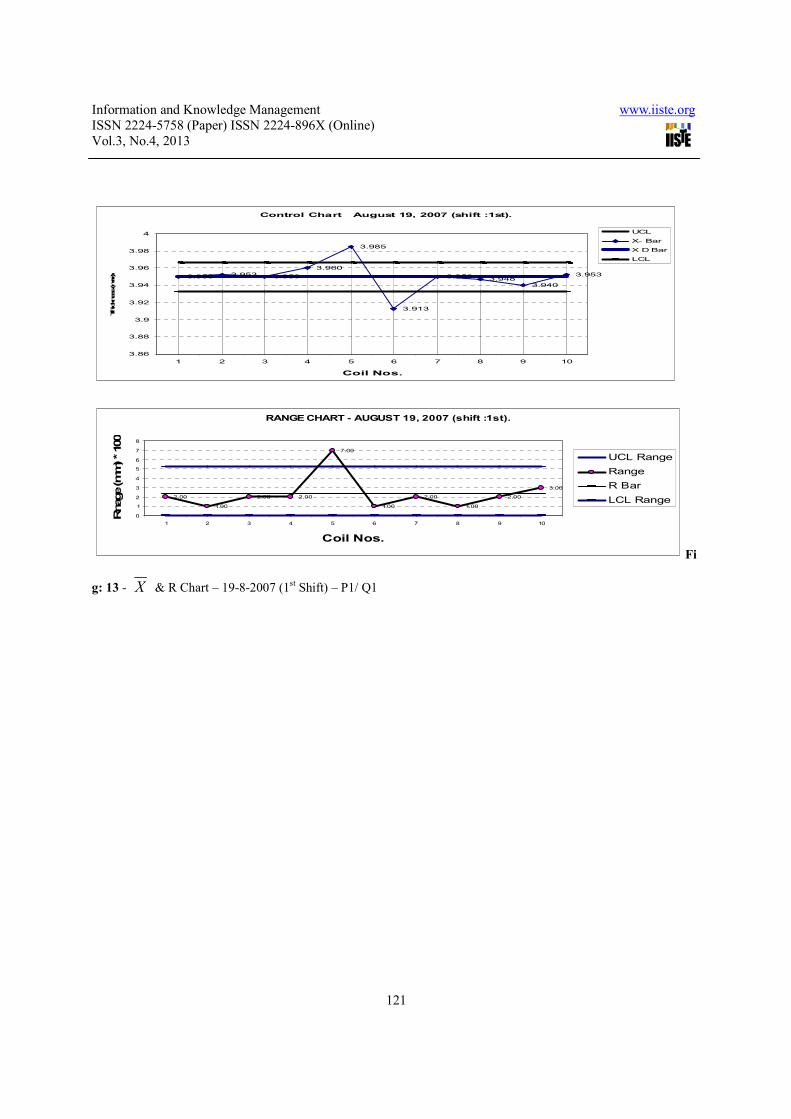
Control Chart August 19, 2007 (shift :1st).
3.950 3.953 3.950
3.913
3.950 3.948
3.940
3.953
3.985
3.960
3.86
3.88
3.9
3.92
3.94
3.96
3.98
4
1 2 3 4 5 6 7 8 9 10
Coil Nos.
Thickness (mm)
UCL
X- Bar
X D Bar
LCL
RANGE CHART - AUGUST 19, 2007 (shift :1st).
2.00
1.00
2.00 2.00
7.00
1.00
2.00
1.00
2.00
3.00
0
1
2
3
4
5
6
7
8
1 2 3 4 5 6 7 8 9 10
Coil Nos.
Rnage (m
m) * 100
UCL Range
Range
R Bar
LCL Range
Fi
g: 13 - X & R Chart – 19-8-2007 (1st Shift) – P1/ Q1
Information and Knowledge Management www.iiste.org
ISSN 2224-5758 (Paper) ISSN 2224-896X (Online)
Vol.3, No.4, 2013
122
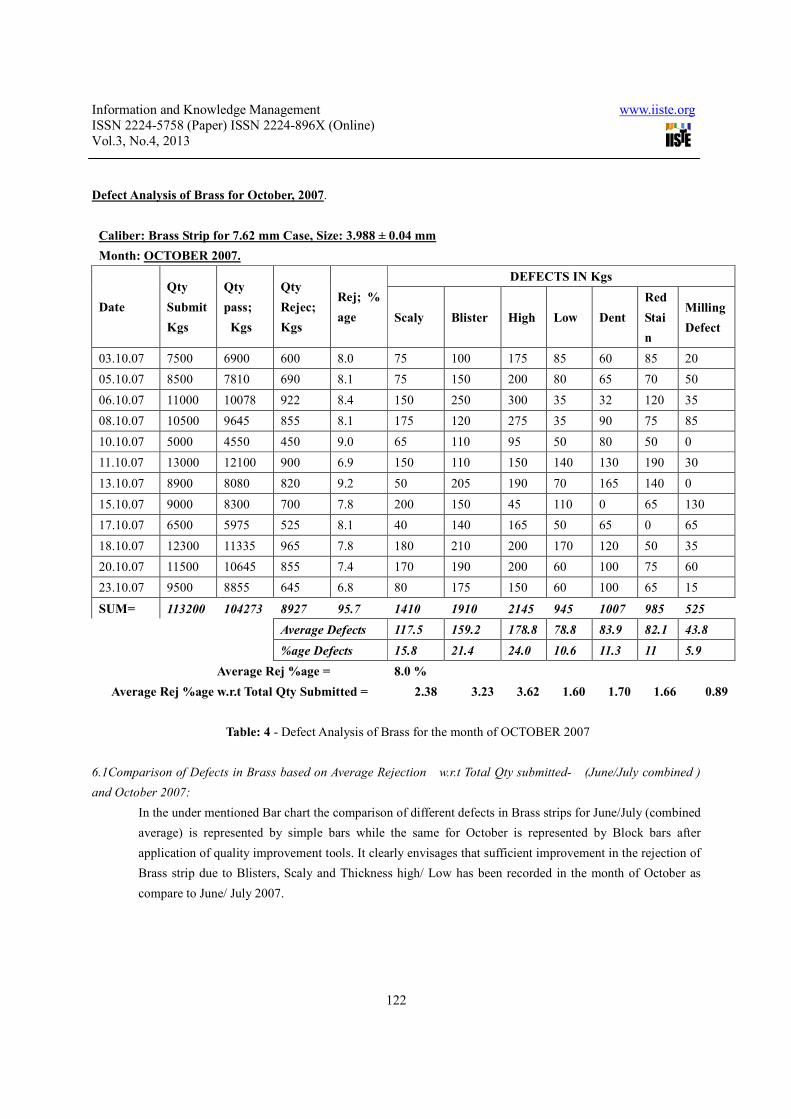
Defect Analysis of Brass for October, 2007.
Caliber: Brass Strip for 7.62 mm Case, Size: 3.988 ± 0.04 mm
Month: OCTOBER 2007.
Date
Qty
Submit
Kgs
Qty
pass;
Kgs
Qty
Rejec;
Kgs
Rej; %
age
DEFECTS IN Kgs
Scaly Blister High Low Dent
Red
Stai
n
Milling
Defect
03.10.07 7500 6900 600 8.0 75 100 175 85 60 85 20
05.10.07 8500 7810 690 8.1 75 150 200 80 65 70 50
06.10.07 11000 10078 922 8.4 150 250 300 35 32 120 35
08.10.07 10500 9645 855 8.1 175 120 275 35 90 75 85
10.10.07 5000 4550 450 9.0 65 110 95 50 80 50 0
11.10.07 13000 12100 900 6.9 150 110 150 140 130 190 30
13.10.07 8900 8080 820 9.2 50 205 190 70 165 140 0
15.10.07 9000 8300 700 7.8 200 150 45 110 0 65 130
17.10.07 6500 5975 525 8.1 40 140 165 50 65 0 65
18.10.07 12300 11335 965 7.8 180 210 200 170 120 50 35
20.10.07 11500 10645 855 7.4 170 190 200 60 100 75 60
23.10.07 9500 8855 645 6.8 80 175 150 60 100 65 15
SUM= 113200 104273 8927 95.7 1410 1910 2145 945 1007 985 525
Average Defects 117.5 159.2 178.8 78.8 83.9 82.1 43.8
%age Defects 15.8 21.4 24.0 10.6 11.3 11 5.9
Average Rej %age = 8.0 %
Average Rej %age w.r.t Total Qty Submitted = 2.38 3.23 3.62 1.60 1.70 1.66 0.89
Table: 4 - Defect Analysis of Brass for the month of OCTOBER 2007
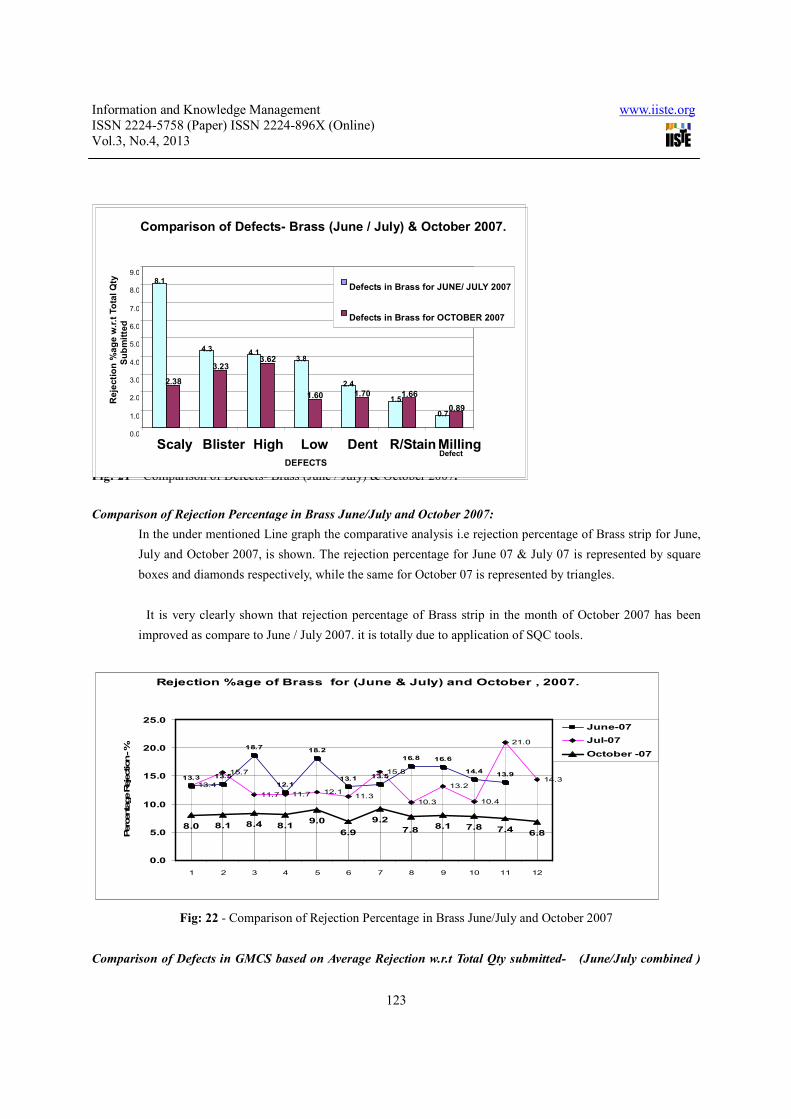
6.1Comparison of Defects in Brass based on Average Rejection w.r.t Total Qty submitted- (June/July combined )
and October 2007:
In the under mentioned Bar chart the comparison of different defects in Brass strips for June/July (combined
average) is represented by simple bars while the same for October is represented by Block bars after
application of quality improvement tools. It clearly envisages that sufficient improvement in the rejection of
Brass strip due to Blisters, Scaly and Thickness high/ Low has been recorded in the month of October as
compare to June/ July 2007.
Information and Knowledge Management www.iiste.org
ISSN 2224-5758 (Paper) ISSN 2224-896X (Online)
Vol.3, No.4, 2013
123
Fig: 21 – Comparison of Defects- Brass (June / July) & October 2007.
Comparison of Rejection Percentage in Brass June/July and October 2007:
In the under mentioned Line graph the comparative analysis i.e rejection percentage of Brass strip for June,
July and October 2007, is shown. The rejection percentage for June 07 & July 07 is represented by square
boxes and diamonds respectively, while the same for October 07 is represented by triangles.
It is very clearly shown that rejection percentage of Brass strip in the month of October 2007 has been
improved as compare to June / July 2007. it is totally due to application of SQC tools.
Rejection %age of Brass for (June & July) and October , 2007.
13.5
18.7
12.1
18.2
13.1 13.5
16.8 16.6
14.413.9
13.4
15.7
11.7 11.7 12.111.3
15.8
10.3
13.2
10.4
21.0
14.3
8.0 8.1 8.4 8.19.0
6.9
9.28.1 7.8 7.4 6.8
13.3
7.8
0.0
5.0
10.0
15.0
20.0
25.0
1 2 3 4 5 6 7 8 9 10 11 12
Perc
enta
ge R
ejection - %
June-07
Jul-07
October -07
Fig: 22 - Comparison of Rejection Percentage in Brass June/July and October 2007
Comparison of Defects in GMCS based on Average Rejection w.r.t Total Qty submitted- (June/July combined )
Comparison of Defects- Brass (June / July) & October 2007.
8.1
4.34.1
3.8
2.4
1.5
0.7
2.38
3.23 3.62
1.60 1.70 1.66
0.89
0.0
1.0
2.0
3.0
4.0
5.0
6.0
7.0
8.0
9.0
Scaly Blister High Low Dent R/Stain MillingDefect
DEFECTS
Reje
cti
on
%a
ge w
.r.t
To
tal Q
ty
Su
bm
itte
d
Defects in Brass for JUNE/ JULY 2007
Defects in Brass for OCTOBER 2007
Information and Knowledge Management www.iiste.org
ISSN 2224-5758 (Paper) ISSN 2224-896X (Online)
Vol.3, No.4, 2013
124
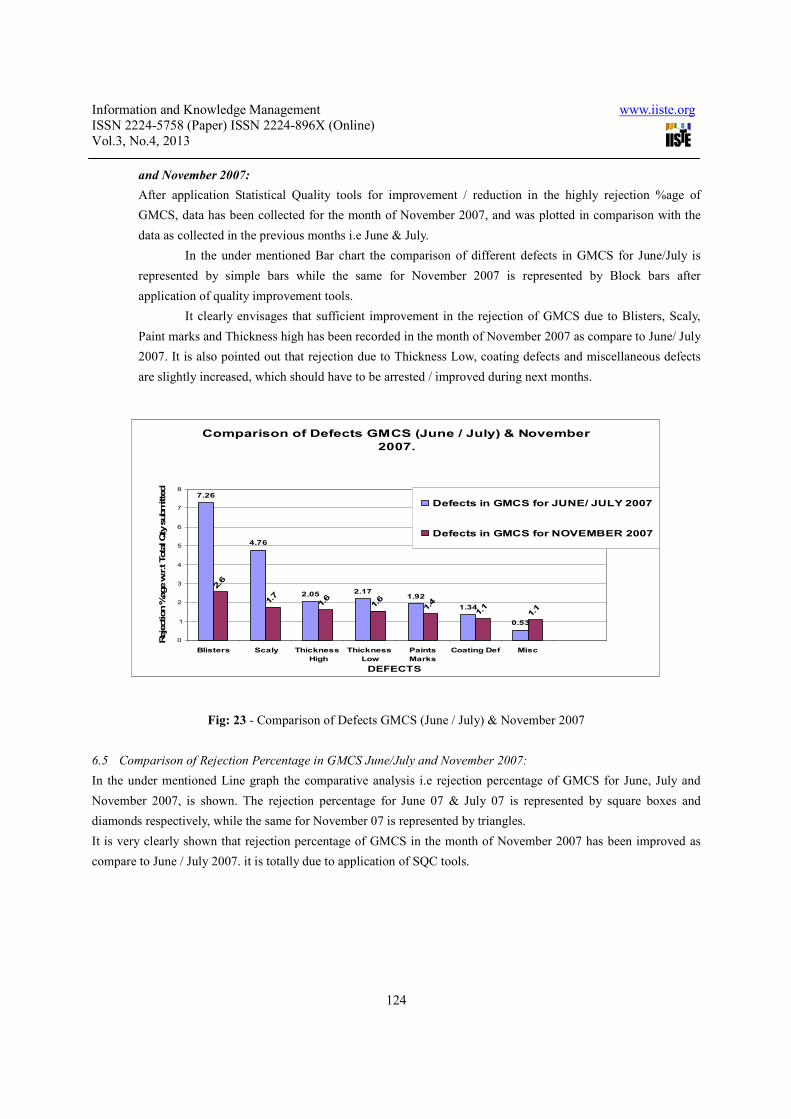
and November 2007:
After application Statistical Quality tools for improvement / reduction in the highly rejection %age of
GMCS, data has been collected for the month of November 2007, and was plotted in comparison with the
data as collected in the previous months i.e June & July.
In the under mentioned Bar chart the comparison of different defects in GMCS for June/July is
represented by simple bars while the same for November 2007 is represented by Block bars after
application of quality improvement tools.
It clearly envisages that sufficient improvement in the rejection of GMCS due to Blisters, Scaly,
Paint marks and Thickness high has been recorded in the month of November 2007 as compare to June/ July
2007. It is also pointed out that rejection due to Thickness Low, coating defects and miscellaneous defects
are slightly increased, which should have to be arrested / improved during next months.
Comparison of Defects GMCS (June / July) & November
2007.
7.26
4.76
2.05 2.171.92
1.34
0.53
2.6
1.7
1.6
1.6
1.4
1.1
1.1
0
1
2
3
4
5
6
7
8
Blisters Scaly Thickness
High
Thickness
Low
Paints
Marks
Coating Def Misc
DEFECTS
Reje
ction %
age w
.r.t T
ota
l Q
ty s
ubm
itte
d
Defects in GMCS for JUNE/ JULY 2007
Defects in GMCS for NOVEMBER 2007
Fig: 23 - Comparison of Defects GMCS (June / July) & November 2007
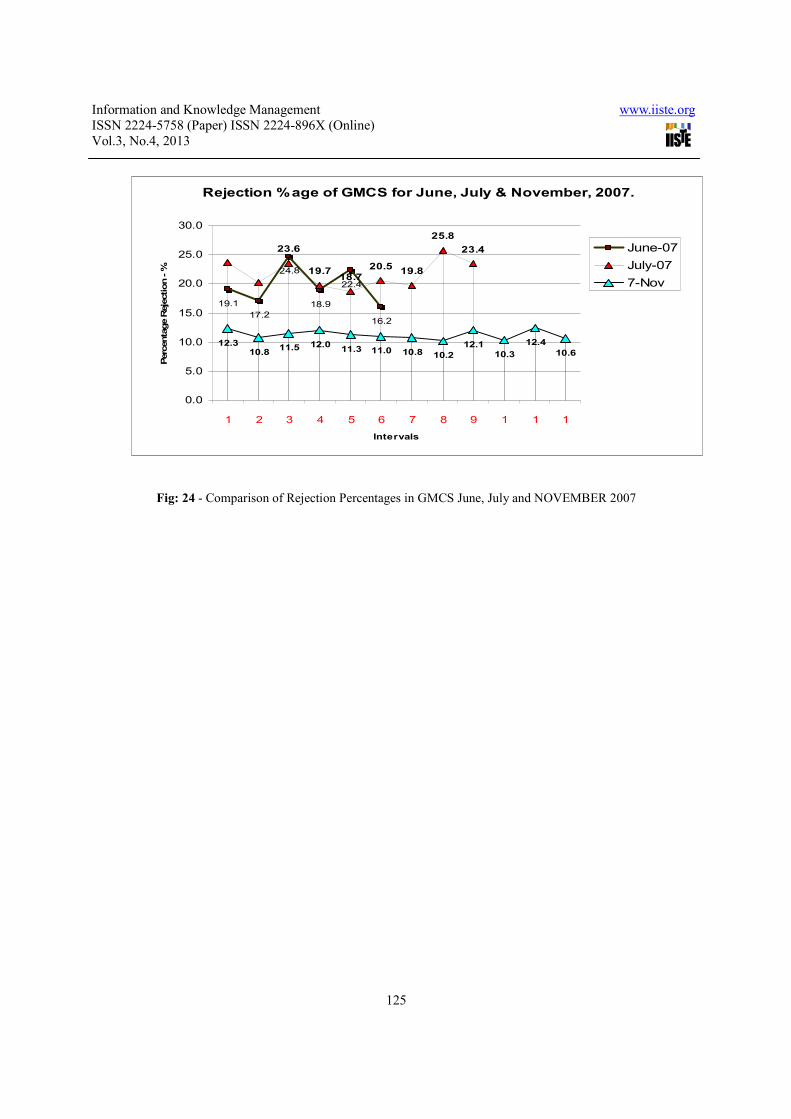
6.5 Comparison of Rejection Percentage in GMCS June/July and November 2007:
In the under mentioned Line graph the comparative analysis i.e rejection percentage of GMCS for June, July and
November 2007, is shown. The rejection percentage for June 07 & July 07 is represented by square boxes and
diamonds respectively, while the same for November 07 is represented by triangles.
It is very clearly shown that rejection percentage of GMCS in the month of November 2007 has been improved as
compare to June / July 2007. it is totally due to application of SQC tools.
Information and Knowledge Management www.iiste.org
ISSN 2224-5758 (Paper) ISSN 2224-896X (Online)
Vol.3, No.4, 2013
125
Rejection %age of GMCS for June, July & November, 2007.
17.2
24.8
18.9
22.4
16.2
23.6
19.718.7
20.519.8
25.8
23.4
12.310.8
11.5 12.011.3 11.0 10.8 10.2
12.1
10.3
12.4
10.6
19.1
0.0
5.0
10.0
15.0
20.0
25.0
30.0
1 2 3 4 5 6 7 8 9 1 1 1
Intervals
Perc
enta
ge R
eje
ction - %
June-07
July-07
7-Nov
Fig: 24 - Comparison of Rejection Percentages in GMCS June, July and NOVEMBER 2007
This academic article was published by The International Institute for Science,
Technology and Education (IISTE). The IISTE is a pioneer in the Open Access
Publishing service based in the U.S. and Europe. The aim of the institute is
Accelerating Global Knowledge Sharing.
More information about the publisher can be found in the IISTE’s homepage:
http://www.iiste.org
CALL FOR PAPERS
The IISTE is currently hosting more than 30 peer-reviewed academic journals and
collaborating with academic institutions around the world. There’s no deadline for
submission. Prospective authors of IISTE journals can find the submission
instruction on the following page: http://www.iiste.org/Journals/
The IISTE editorial team promises to the review and publish all the qualified
submissions in a fast manner. All the journals articles are available online to the
readers all over the world without financial, legal, or technical barriers other than
those inseparable from gaining access to the internet itself. Printed version of the
journals is also available upon request of readers and authors.
IISTE Knowledge Sharing Partners
EBSCO, Index Copernicus, Ulrich's Periodicals Directory, JournalTOCS, PKP Open
Archives Harvester, Bielefeld Academic Search Engine, Elektronische
Zeitschriftenbibliothek EZB, Open J-Gate, OCLC WorldCat, Universe Digtial
Library , NewJour, Google Scholar