implementation of intelligent compaction technologies … · intelligent compaction technologies...
TRANSCRIPT

Implementation of Intelligent Compaction Technologies for Road Constructions in Wyoming
MPC 15-281 | C. Savan , K. Ng, and K. Ksaibati
Colorado State University North Dakota State University South Dakota State University
University of Colorado Denver University of Denver University of Utah
Utah State UniversityUniversity of Wyoming
A University Transportation Center sponsored by the U.S. Department of Transportation serving theMountain-Plains Region. Consortium members:

IMPLEMENTATION OF INTELLIGENT COMPACTION
TECHNOLOGIES FOR ROAD CONSTRUCTIONS IN WYOMING
Prepared by:
Christopher M. Savan, M.S.
Dr. Kam Weng Ng, Ph.D., Assistant Professor
Dr. Khaled Ksaibati, Ph.D., Professor
Department of Civil and Architectural Engineering
University of Wyoming
Laramie, Wyoming 82071
March 2015

i
Acknowledgements
The authors would like to thank the Mountain-Plains Consortium for funding this work and the Wyoming
Department of Transportation for its contributions to the survey.
Note: This report has been published, with modification, as Mr. Christopher Savan’s master’s thesis.
Disclaimer
The contents of this report reflect the views of the authors, who are responsible for the facts and the
accuracy of the information presented. This document is disseminated under the sponsorship of the
Department of Transportation, University Transportation Centers Program, in the interest of information
exchange. The U.S. Government assumes no liability for the contents or use thereof.
North Dakota State University does not discriminate on the basis of age, color, disability, gender expression/identity, genetic information, marital status, national origin, public assistance status, sex, sexual orientation, status as a U.S. veteran, race or religion. Direct inquiries to the Vice President for Equity, Diversity and Global Outreach, 205 Old Main, (701) 231-7708.

ii
ABSTRACT
Conventional test methods for roadway compaction cover less than 1% of roadway; whereas, intelligent
compaction (IC) offers a method to measure 100% of a roadway. IC offers the ability to increase
compaction uniformity of soils and asphalt pavements, which leads to decreased maintenance costs and
an extended service life. This report examines IC technology, how IC quality control and assurance
specifications can encourage IC adoption, knowledge and use of IC through survey responses, and
benefits and costs of IC. The surveys reveal that a majority of respondents from state departments of
transportation have conducted IC demonstration projects, but questions about cost and willingness of
policymakers to adopt IC remain a barrier to implementation. The benefit-cost analysis demonstrates that
use of IC reduces compaction costs by as much as 54% and results in a $15,385 annual savings per lane
mile throughout the roadway’s life.

iii
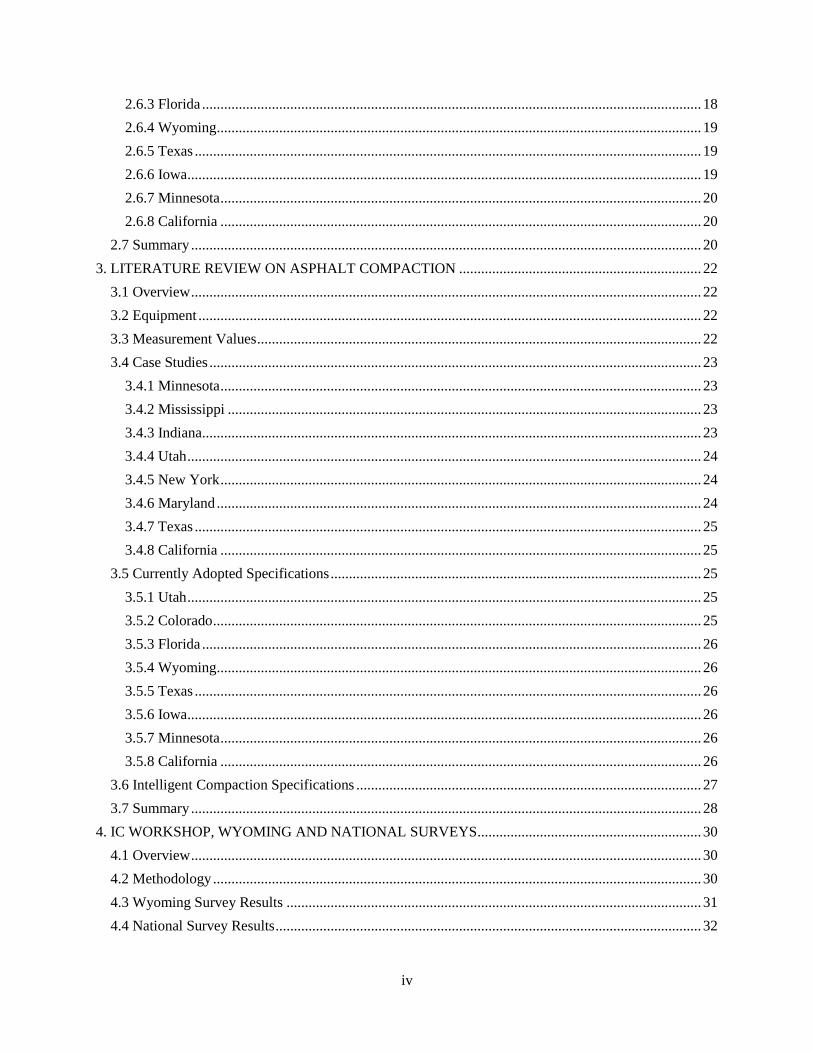
TABLE OF CONTENTS
1. INTRODUCTION .................................................................................................................................... 1
1.1 Overview ............................................................................................................................................. 1
1.2 Background ......................................................................................................................................... 1
1.3 Problem Statement .............................................................................................................................. 2
1.4 Project Scope ...................................................................................................................................... 2
1.5 Outline................................................................................................................................................. 2
2. LITERATURE REVIEW ON SOIL COMPACTION ............................................................................. 4
2.1 Overview ............................................................................................................................................. 4
2.2 Background of Intelligent Compaction ............................................................................................... 4
2.2.1 History .......................................................................................................................................... 4
2.2.2 Technology .................................................................................................................................. 4
2.2.3 Equipment .................................................................................................................................... 5
2.3 Measurement Values ........................................................................................................................... 7
2.3.1 Generation of Measurement Values ............................................................................................. 7
2.3.2 Relationship to Roller Operation and Site Conditions ................................................................. 7
2.3.3 Relationship to Conventional Methods of Testing ....................................................................... 9
2.4 Quality Assurance ............................................................................................................................... 9
2.4.1 QA Guidelines ........................................................................................................................... 10
2.4.2 QA Option 1 ............................................................................................................................... 11
2.4.3 QA Option 2a ............................................................................................................................. 11
2.4.4 QA Option 2b ............................................................................................................................. 11
2.4.5 QA Option 3a ............................................................................................................................. 11
2.4.6 QA Option 3b ............................................................................................................................. 12
2.4.7 QA Option 3c ............................................................................................................................. 12
2.4.7 Semi-Variogram ......................................................................................................................... 12
2.5 Case Studies ...................................................................................................................................... 13
2.5.1 Colorado ..................................................................................................................................... 13
2.5.2 Florida ........................................................................................................................................ 14
2.5.3 North Carolina ........................................................................................................................... 16
2.5.4 Minnesota ................................................................................................................................... 16
2.5.5 Indiana ........................................................................................................................................ 17
2.5.6 Texas .......................................................................................................................................... 17
2.6 Currently Adopted Specifications ..................................................................................................... 17
2.6.1 Colorado ..................................................................................................................................... 18
2.6.2 Utah ............................................................................................................................................ 18
iv
2.6.3 Florida ........................................................................................................................................ 18
2.6.4 Wyoming .................................................................................................................................... 19
2.6.5 Texas .......................................................................................................................................... 19
2.6.6 Iowa............................................................................................................................................ 19
2.6.7 Minnesota ................................................................................................................................... 20
2.6.8 California ................................................................................................................................... 20
2.7 Summary ........................................................................................................................................... 20
3. LITERATURE REVIEW ON ASPHALT COMPACTION .................................................................. 22
3.1 Overview ........................................................................................................................................... 22
3.2 Equipment ......................................................................................................................................... 22
3.3 Measurement Values ......................................................................................................................... 22
3.4 Case Studies ...................................................................................................................................... 23
3.4.1 Minnesota ................................................................................................................................... 23
3.4.2 Mississippi ................................................................................................................................. 23
3.4.3 Indiana ........................................................................................................................................ 23
3.4.4 Utah ............................................................................................................................................ 24
3.4.5 New York ................................................................................................................................... 24
3.4.6 Maryland .................................................................................................................................... 24
3.4.7 Texas .......................................................................................................................................... 25
3.4.8 California ................................................................................................................................... 25
3.5 Currently Adopted Specifications ..................................................................................................... 25
3.5.1 Utah ............................................................................................................................................ 25
3.5.2 Colorado ..................................................................................................................................... 25
3.5.3 Florida ........................................................................................................................................ 26
3.5.4 Wyoming .................................................................................................................................... 26
3.5.5 Texas .......................................................................................................................................... 26
3.5.6 Iowa............................................................................................................................................ 26
3.5.7 Minnesota ................................................................................................................................... 26
3.5.8 California ................................................................................................................................... 26
3.6 Intelligent Compaction Specifications .............................................................................................. 27
3.7 Summary ........................................................................................................................................... 28
4. IC WORKSHOP, WYOMING AND NATIONAL SURVEYS ............................................................. 30
4.1 Overview ........................................................................................................................................... 30
4.2 Methodology ..................................................................................................................................... 30
4.3 Wyoming Survey Results ................................................................................................................. 31
4.4 National Survey Results .................................................................................................................... 32

v
4.4.1 DOT Knowledge and Use of IC ................................................................................................. 33
4.4.2 Current DOT QC/QA Methods .................................................................................................. 35
4.4.3 Types of QC/QA Methods Used for IC ..................................................................................... 37
4.4.4 Short-term and Long-term Costs Associated with IC ................................................................ 40
5. ECONOMIC ANALYSIS ...................................................................................................................... 41
5.1 Methodology ..................................................................................................................................... 41
5.1.1 Definitions .................................................................................................................................. 41
5.1.2 Framework ................................................................................................................................. 42
5.2 Case Study No. 1: Pavement Analysis .............................................................................................. 44
5.2.1 Construction Cycle Data ............................................................................................................ 44
5.2.2 Roadway Lifecycle Data ............................................................................................................ 45
5.2.3 Results of Pavement Case Study ................................................................................................ 45
5.2.4 Sensitivity Analysis for Pavement Case Study .......................................................................... 47
5.3 Case Study No. 2: New Roadway Construction ............................................................................... 50
5.4 Summary ........................................................................................................................................... 53
6. CONCLUSIONS AND RECOMMENDATIONS ................................................................................. 54
6.1 Conclusions ....................................................................................................................................... 54
6.2 Recommendations ............................................................................................................................. 54
6.2.1 Implementation of IC in Wyoming ............................................................................................ 54
6.2.2 Future Research Needs............................................................................................................... 55
REFERENCES ........................................................................................................................................... 56
APPENDIX A. ABBREVATIONS AND ACRONYMS ........................................................................... 59
APPENDIX B. WYOMING SURVEY RESULTS .................................................................................... 60
APPENDIX C. NATIONAL SURVEY RESULTS ................................................................................... 66

vi
LIST OF TABLES
Figure 2.1. Roller-integrated CCC System by Dynapac (Dynapac, 2013) ................................................... 6
Figure 2.2. Vibratory Rollers for Roller-Integrated CCC/IC ........................................................................ 6
Figure 2.3. Example of a Semi-Variogram ................................................................................................. 13
Figure 3.1. IC QC/QA Specifications by States .......................................................................................... 28
Figure 4.1. IC Data Management Workshop in Laramie, WY ................................................................... 30
Figure 4.2. Results for Primary Source of IC Information from Wyoming Survey.................................... 31
Figure 4.3. Map of State DOT Respondents Shaded in Gray ..................................................................... 33
Figure 4.4. Methods for QC/QA of Subgrade, Subbase, and Base Layers ................................................. 36
Figure 4.5. Methods for QC/QA of Pavement Materials ............................................................................ 36
Figure 5.1. Flow Chart for Calculating Compaction Cost .......................................................................... 43
Figure 5.2. Cost Difference with Varying IC Efficiency ............................................................................ 48
Figure 5.3. Cost Difference Based on Hourly Cost of Conventional Roller ............................................... 49
Figure 5.4. Percent Cost Difference Based on Hourly Cost of Conventional Roller .................................. 49
Figure 5.5. Lifecycle Cost Saving Based on Service Life Improvement from IC ...................................... 50
vii
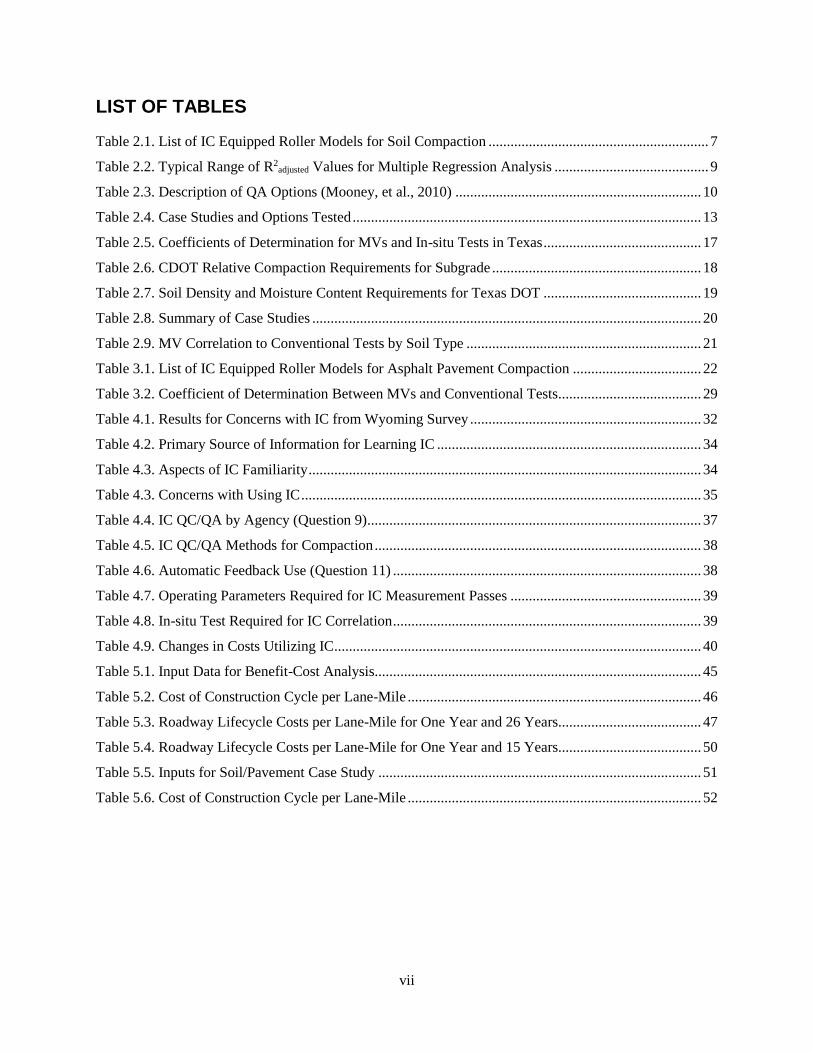
LIST OF TABLES
Table 2.1. List of IC Equipped Roller Models for Soil Compaction ............................................................ 7
Table 2.2. Typical Range of R2adjusted Values for Multiple Regression Analysis .......................................... 9
Table 2.3. Description of QA Options (Mooney, et al., 2010) ................................................................... 10
Table 2.4. Case Studies and Options Tested ............................................................................................... 13
Table 2.5. Coefficients of Determination for MVs and In-situ Tests in Texas ........................................... 17
Table 2.6. CDOT Relative Compaction Requirements for Subgrade ......................................................... 18
Table 2.7. Soil Density and Moisture Content Requirements for Texas DOT ........................................... 19
Table 2.8. Summary of Case Studies .......................................................................................................... 20
Table 2.9. MV Correlation to Conventional Tests by Soil Type ................................................................ 21
Table 3.1. List of IC Equipped Roller Models for Asphalt Pavement Compaction ................................... 22
Table 3.2. Coefficient of Determination Between MVs and Conventional Tests ....................................... 29
Table 4.1. Results for Concerns with IC from Wyoming Survey ............................................................... 32
Table 4.2. Primary Source of Information for Learning IC ........................................................................ 34
Table 4.3. Aspects of IC Familiarity ........................................................................................................... 34
Table 4.3. Concerns with Using IC ............................................................................................................. 35
Table 4.4. IC QC/QA by Agency (Question 9) ........................................................................................... 37
Table 4.5. IC QC/QA Methods for Compaction ......................................................................................... 38
Table 4.6. Automatic Feedback Use (Question 11) .................................................................................... 38
Table 4.7. Operating Parameters Required for IC Measurement Passes .................................................... 39
Table 4.8. In-situ Test Required for IC Correlation .................................................................................... 39
Table 4.9. Changes in Costs Utilizing IC .................................................................................................... 40
Table 5.1. Input Data for Benefit-Cost Analysis......................................................................................... 45
Table 5.2. Cost of Construction Cycle per Lane-Mile ................................................................................ 46
Table 5.3. Roadway Lifecycle Costs per Lane-Mile for One Year and 26 Years....................................... 47
Table 5.4. Roadway Lifecycle Costs per Lane-Mile for One Year and 15 Years....................................... 50
Table 5.5. Inputs for Soil/Pavement Case Study ........................................................................................ 51
Table 5.6. Cost of Construction Cycle per Lane-Mile ................................................................................ 52

1
1. INTRODUCTION
1.1 Overview
The quality of a roadway is related to the quality of the compaction of its pavement and underlying
aggregate. State and local officials have used two general techniques to evaluate the compaction of a
pavement and soil: stiffness tests or density tests. These tests reveal mechanistic properties of the soil or
pavement that are measured at several points along a roadway. Point measurement methods, such as the
light weight deflectometer (LWD), nuclear gage test (NG), static plate load test (PLT), and Proctor tests,
have been widely used to measure the stiffness, density, or moisture of compacted soils and pavements.
Roller-integrated continuous compaction control (CCC) and intelligent compaction (IC), which are
distinguished in Section 1.2, have become new methods to gather data about compaction by obtaining
stiffness values of the soil in real time. The Wyoming Department of Transportation (WYDOT) currently
utilizes point measurement methods to evaluate the compaction of its roadways. Point measurement
provide a means for verifying soil compaction; however, this method provides data for less than 1% of a
roadway section and requires staff to take field measurements. CCC and IC increase data collection to
100% of the roadway section and reduce the amount of point measurements. For these reasons, adoption
and implementation of roller-integrated CCC and IC has the potential to benefit transportation agencies,
including WYDOT. Roller-integrated CCC and IC are capable of leading to decreased construction costs
and duration, improved long-term pavement quality, and improved documentation. This report
demonstrates how adoption and implementation of roller-integrated CCC and IC technologies best benefit
the State of Wyoming and other jurisdictions nationally and internationally.
1.2 Background
Research on utilizing roller-integrated CCC and IC in the State of Wyoming commenced in 2013 by
researchers at the University of Wyoming in order to develop state-specific quality assurance (QA)
guidelines for the implementation of roller-integrated CCC or IC for soil and pavement compaction.
“Intelligent soil compaction systems,” also known as intelligent compaction (IC), were defined by the
National Cooperative Highway Research Program (NCHRP) Report 676 as having three characteristics
(Mooney, et al., 2010):
1) Continuous assessment of mechanistic soil properties (e.g., stiffness, modulus) through
roller vibration monitoring
2) On-the-fly modification of vibration amplitude and frequency
3) Integrated global position system (GPS) to provide a complete geographic information
system-based record of the earthwork site
Characteristics 1 and 3 define roller-integrated CCC, which was first introduced in Europe during the
1970s. Specifications for use of roller-integrated CCC were first introduced in Austria in 1990 and have
been endorsed by the International Society for Soil Mechanics and Geotechnical Engineering (ISSMGE).
Characteristic 2 describes an automatic feedback control (AFC) that allows compaction equipment to
adjust vibration amplitude and frequency in response to compaction data gathered by the equipment
during operation.
CCC and IC technologies on-board compaction equipment yield measurement values (MV) of soil
stiffness and modulus from compaction lifts, usually 6 to 12 inches, and their underlying layers up to 5
feet in depth. Collected MVs, in conjunction with GPS, allow for real-time compaction data to be
gathered to spatially analyze the compaction levels of soils and pavements. This information is used to
determine weak compaction areas and prevent unnecessary over-compaction (Mooney, et al., 2010).

2
The Federal Highway Administration (FHWA) has led efforts to introduce IC technology throughout the
country. In 2008, the FHWA began pilot projects in conjunction with state departments of transportation
(DOTs) in Colorado, Florida, Maryland, Minnesota, and North Carolina. Subsequently, several other
states have initiated pilot projects through their respective DOTs. Many states are developing or have
already developed QA standards for IC. Additionally, the FHWA included IC as part of a second
installment of its Every Day Counts initiative, which focuses FHWA resources on developing
technologies that decrease project delivery time, improve roadway safety, and help protect the
environment (Federal Highway Administration, 2012).
1.3 Problem Statement
Current soil and pavement compaction practices utilize point measurements techniques include tests with
a nuclear gage, dynamic cone penetrometer, or LWD. These methods measure approximately one percent
of the area being compacted, and the compaction quality of the entire compaction area is evaluated based
only on these point measurements. Thus, sufficient compaction quality may not be achieved in several
locations within the compaction area, which can lead to reduced long-term pavement quality and
increased road maintenance costs. This report investigates how to address these problems by utilizing IC
technologies and improving QA standards.
1.4 Project Scope
The goal of this research is to improve pavement quality and safety, decrease road maintenance and
construction costs, and decrease road construction duration in Wyoming using IC. Five objectives have
been established in order to achieve this goal: to 1) examine current IC technologies and practices, 2)
analyze survey results about how other agencies implement IC for soil and pavement compaction, 3)
conduct an economic analysis of IC, 4) propose recommendations for QA implementation in Wyoming,
and 5) establish future research needs.
1.5 Outline
A literature review was performed (Section 2 and 3) with the goal of evaluating technologies and
practices that best benefit Wyoming through learning IC technologies, IC case studies, and QA standards.
The literature review examines 1) current IC technologies and practices, 2) current design and
construction practices of soil and pavement compaction, 3) current national and state QA guidelines, 4)
implementation of IC technologies in compaction practices, and 5) current agency specifications on IC.
A nationwide survey and a Wyoming survey (Section 4) were conducted to complement the literature
review and provide information about how research from IC has been implemented. The goal is to
understand barriers to adoption of IC, how IC has been implemented, and evaluating the success of IC
implementation. The nationwide survey results were analyzed to learn how other transportation agencies
perform soil and pavement compaction and to ascertain if and how IC technologies are being utilized. The
survey questions address topics such as the current compaction process used, QA specifications enacted,
and how IC is integrated into compaction practices. The survey contains a variety or multiple choice and
short answer questions. The nationwide survey was available online and sent to transportation agencies
throughout the nation. The Wyoming survey was conducted during a WYDOT-sponsored workshop in
March 2014.

3
An economic analysis (Section 5) was conducted to evaluate the short-term and long-term benefits and
costs of utilizing IC for compaction of roadways. This includes construction related costs (short-term) and
increases to pavement life from benefits to improve compaction (long term). Cost data were obtained
from contractors, roller manufacturers, and roller retailers.
Evaluation of the literature review, survey results, and economic analysis helps to develop
recommendations for QA implementation and establish future research needs in Wyoming (Section 6).
Recommendations were established to 1) facilitate the implementation of IC technology in Wyoming, 2)
suggest the benefit/cost analysis of its implementation, and 3) highlight potential changes to current
construction practices.

4
2. LITERATURE REVIEW ON SOIL COMPACTION
2.1 Overview
This section highlights the findings about soil compaction from the literature review. The purpose of this
review is to present and analyze various CCC and IC technologies, QA options incorporating CCC and
IC, and current practices of CCC and IC. The analysis is used to develop survey questions for
transportation agencies and a recommendation for types of demonstrations to be conducted in Wyoming,
which are discussed in Section 4 and Section 6, respectively. This section includes the background of IC,
types of IC rollers, how MVs are generated, how MVs relate to point measurement compaction tests,
types of QA options using IC, case studies that evaluate QA options, and roadway compaction
specifications used by various transportation agencies.
2.2 Background of Intelligent Compaction
2.2.1 History
Mooney and Adam (2007) have documented the history of roller-integrated CCC, which should be
referred to for more detail. Dr. Heinz Thurner, a Swedish Highway Administration official, introduced the
first roller-integrated CCC by instrumenting a 5-ton-tractor drawn Dynapac vibratory roller with an
accelerometer. The research began in 1974, and the following year Dr. Thurner and his partner Ake
Sandstrom founded Geodynamik to advance the technology. Geodynamik introduced the compaction
meter value (CMV) in 1978 and, working in conjunction with Dynapac, has offered it commercially since
1980. Several companies have introduced compactometers with CMV, including Ammann, Caterpillar,
and Ingersoll Rand. Bomag introduced its proprietary Omega value and Terrameter in 1982. Bomag
added the Evib value in the late 1990s, which is a measure of dynamic soil stiffness (Kröber, Floss, &
Wallrath, 2001). Sakai introduced its compaction control value (CCV) in 2004 (Scherocman, Rakowski,
& Uchiyama, 2007). The advancement in compaction technology allowed for Austria, Germany, and
Sweden to establish QA specifications for CCC during the 1990s. ISSMGE has endorsed Austrian
specifications for CCC (Mooney, et al., 2010).
2.2.2 Technology
CCC is described as having two components: continuous assessment of mechanistic soil properties and
integrated global position system to provide a complete geographic information system-based record of
the earthwork site. IC includes an additional component, which is the ability to adjust the amplitude and
frequency in real time based on the mechanistic properties of the soil. Instrumentation is placed within the
roller to gather data on the vibration of the roller with regard to its amplitude and frequency. The
information received is translated into a roller MV, which is discussed further in Section 2.3. The MVs
are transmitted to a computer on board the compactor, which also plots the MV in real time to a
geographical location on a map from a GPS unit (Mooney, et al., 2010).
Geodynamik created the first instrumentation used to generate MVs as discussed in Section 2.2.1. The
company used a mechanically implemented two-piece clamshell eccentric mass assembly within the
drum. This drum would create two eccentric masses that would combine to create a maximum eccentric
mass moment moeo, where mo is the mass of the weight within the drum and the eo is related to the
distance of the weight from the center of the drum. This occurs when the roller is driven in one direction
with frequency Ω (rad/s). The eccentric mass moment and frequency would create a maximum time-
varying centrifugal force F(t). This force can be generated theoretically using Eq. 2.1, where t is time in

5
seconds. Fev, which is used by Bomag in its variocontrol roller with counter-rotating eccentric masses, is
the vertical component of the eccentric force moeoΩ (Mooney, et al., 2010).
𝐹(𝑡) = 𝑚𝑜𝑒𝑜Ω2 cos(Ω𝑡) = 𝐹𝑒𝑣 cos(Ω𝑡) (2.1)
The roller amplitude A was calculated using Eq. 2.2 on the basis of the eccentric mass moment and the
drum mass md.
𝐴 =𝑚𝑜𝑒𝑜
𝑚𝑑=
𝐹𝑒𝑣
𝑚𝑑Ω2 (2.2)
Servo-controlled rollers have allowed IC to occur more easily. Servo-controlled rollers have the ability to
automatically adjust the vibratory amplitude and frequency to improve roller performance.
Ammann/Case, Bomag, and Dynapac IC rollers have the ability to automatically adjust vertical vibration
force when operating conditions are not optimal. Furthermore, Bomag and Amman/Case rollers can
reduce the eccentric force amplitude as the user-defined roller threshold MVs are reached.
The recommended on-board GPS unit should be real-time kinematic, which generally exhibits better
accuracy than satellite differential GPS. Horizontal accuracy is approximately 0.98 inch, and vertical
accuracy is 1.46 inch; however, the MV resolution in the direction of the roller is between 0.66 feet and
3.3 feet. The resolution is recommended to be no less than 10 times the accuracy of the GPS unit being
used. The MV resolution in the roller’s direction of travel is a spatial average of data received within the
MV resolution area. Resolution parallel to the drum is approximately 6.6 feet, which is approximately the
width of the roller’s drum. The resolution parallel to the drum is an average of the MVs from the overlap
of roller passes with an overlap of approximately 0.3 feet on sequential passes (Facas & Mooney, 2010).
GPS positioning errors occur by 1) offset of the GPS receiver to the drum center, 2) data averaging during
calculation of the roller MV while the roller is moving, and 3) the roller’s travel direction. The error from
offset can be remedied by calculating the offset distance of the GPS receiver into the software of the on-
board IC computer. The software should also be designed to factor in the roller’s travel direction. Errors
resulting from data averaging occur because the MV occurs at the end of the reporting resolution area.
The software must be programmed to account for this error, adjusting the location of the MV to the center
of the resolution area (Facas & Mooney, 2010).
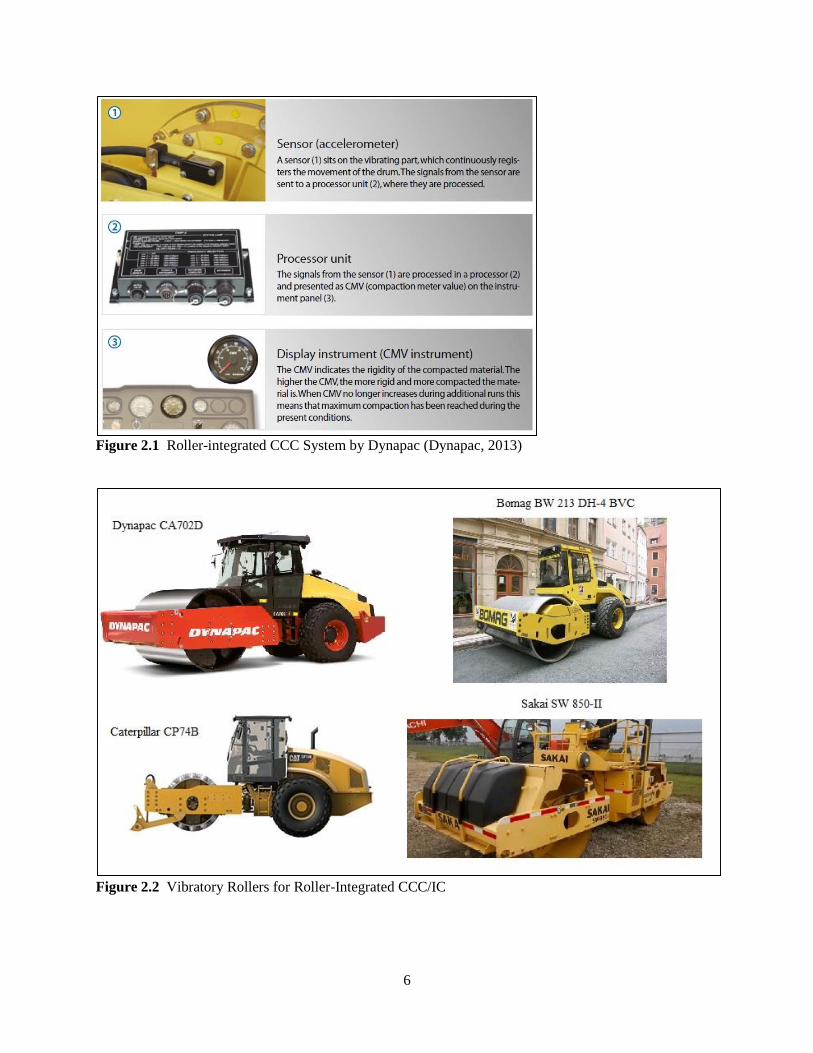
2.2.3 Equipment
IC equipment is typically attached to smooth drum rollers or sheep’s foot rollers; however, sheep’s foot
rollers have displayed large MV variability during repeatability studies and are less favored for use in
CCC and IC. Most rollers are retrofitted with the IC and GPS equipment. The IC equipment, which
includes a sensory processing unit and display as depicted in Figure 2.1, allows for generation of MVs
that are mapped using GPS equipment. Table 2.1 contains roller models that are capable of generating
MVs for soils (The Transtec Group, Inc., 2013). Figure 2.2 is an example of vibratory rollers that can be
outfitted with roller-integrated CCC/IC systems.
6
Figure 2.1 Roller-integrated CCC System by Dynapac (Dynapac, 2013)
Figure 2.2 Vibratory Rollers for Roller-Integrated CCC/IC

7
Table 2.1 List of IC Equipped Roller Models for Soil Compaction
Vendor Model Model No IC-MV Software
Ammann/Case ACEplus SV Kb ACEplus
Bomag VarioControl BW213-4BVC Evib BCM05
Caterpillar AccuGrade CS44-CS78
CP54-CP74
CMV, MDP AccuGrade,
VisionLink
Dynapac DCA-S CA 152-702 CMV DCA-S
HAMM(Wirtgen) HCQ HMV HCQ
Sakai CIS SW850-SW900 CCV AithionMT
Volvo Trimble retrofit CMV SiteVision,
VisionLink
IC-MV: Intelligent compaction measurement values; a generic term for all IC measurements
ACEplus: Ammann Compaction Expert – Plus DCA – S
Kb: Ammann soil stiffness value
GPS: Global Positioning System
Evib: Vibration Modulus
CMV: Caterpillar and Dynapac Compaction Meter Value
MDP: Caterpillar Machine Drive Power
CIS: Sakai Compaction Information System
CCV: Sakai Compaction Control Value
DCA: Dynamic Compaction Analyzer
HCQ: HAMM Compaction Quality
HMV: HAMM Measurement Value
2.3 Measurement Values
2.3.1 Generation of Measurement Values
As noted in Table 2.1, the manufacturers of roller-integrated CCC that generate MVs are Dynapac,
Caterpillar, Hamm, Volvo, Sakai, Ammann/Case, and Bomag. Currently, Dynapac, Caterpillar, Hamm,
and Volvo rollers generate the CMV. The CMV value is the ratio of vertical drum acceleration amplitudes
at the operating vibration frequency. Sakai uses the CCV, which is the algebraic relationship of multiple
vertical drum vibration amplitudes, including fundamental frequency, multiple harmonics, and
subharmonics. Ammann/Case rollers generate a stiffness value kb. The kb value takes into consideration
the vertical drum displacement and the drum-soil contact force. Bomag rollers generate an Evib value that
is generated similar to the kb value (Mooney, et al., 2010).
2.3.2 Relationship to Roller Operation and Site Conditions
Roller MVs correlate well with conventional measurement tests, such as the plate load test (PLT) and
lightweight deflectometer (LWD), due to the dependence of MVs on soil stiffness. However, the
generation of MVs is also affected by operating factors and site conditions. The amplitude, frequency,
speed, and direction of the vibratory roller are examples of operating factors that MVs are dependent
upon. Soil heterogeneity and lift characteristics are site conditions that affect MVs.
The measurement depth was affected by the amplitude of vibratory rollers. NCHRP Report 676
concluded through case studies that the each increase of 0.1 mm of amplitude corresponded to an increase
of 3 cm of depth (Mooney, et al., 2010). Depending on the soil characteristics, the change in measurement

8
depth had an impact on MVs. The dependence of MVs on measurement depth is discussed later in this
section. The dependence of MVs solely on amplitude was unpredictable, but a correlation existed between
the MV-amplitude dependence and soil type. Granular soils demonstrated a positive MV-amplitude
dependence; whereas, cohesive soils demonstrated a negative roller MV-amplitude dependence. Due to
the high unpredictably of the effect of amplitude on MVs, constant amplitude is recommended while
conducting QA.
The effect of roller MVs as a function of frequency was tested with Sakai and Ammann/Case rollers.
MVs depend on roller frequency due to the partial loss of contact with the soil. Sakai rollers experienced
a higher loss of contact when the frequency was set to 20 Hz, compared with 25 Hz (Mooney, et al.,
2010). Due to the MV dependence on frequency, constant frequency is recommended while conducting
QA.
The Sakai and Dynapac rollers displayed a decrease in MV with increasing speed. The roller speed
relationship in Sakai and Dynapac rollers occurs because a partial loss of contact with the soil is reduced
with the vibration energy spread over more soil at higher speeds. Constant roller speed is recommended
during QA with Sakai and Dynapac rollers (Mooney, et al., 2010).
Rollers are typically used in forward and reverse directions. MVs for each direction were taken for
Ammann, Bomag, Dynapac, and Sakai rollers. Discrepancies between the MVs for each direction were
“subtle” for each of the rollers (Mooney, et al., 2010). The MVs of each driving direction should be
measured at the site and compared to determine the amount of discrepancy.
Soil heterogeneity can greatly affect MVs, which can vary by 100% due to the variability in transverse
soil stiffness. LWD testing is recommended across the drum lane to evaluate the soil heterogeneity. If QA
is dependent on repeated passes, then the passes should be conducted over the same area of soil.
The soil characteristics of the lift and the soil underlying the lift can also affect MVs. IC equipment
measure at depths between 2.7 and 4.0 ft and an area from 0.1 to 0.3 ft in front of and behind the drum.
Measurement depth varies linearly at a rate of 1.2 in for each 0.04-in change in vibration amplitude. The
generation of MV based on the measurement of the depth is affected by the lift and layer thickness,
relative stiffness of layers underlying a lift, vibration amplitude, and drum-to-soil interaction (Mooney, et
al., 2010). The ratio of lift stiffness to sub-lift stiffness greatly affects MVs. MVs were especially
unreliable measures of soil stiffness, with up to 50% variability, when 6-in lifts of stiff soil were placed
above less stiff sub-lift soil.
In order to capture the mechanistic soil properties of a lift, a method was developed to calculate the lift
stiffness while accounting for sub-lift materials. This method involves forward modeling and inverse
analysis using finite element (FE) and boundary element (BE) methods. Forward modeling utilized FE
and BE to predict the expected MVs for individual lifts. The inverse analysis technique utilized FE and
BE to calculate MVs for a lift in real time; however, the calculation process proved timely, requiring
between 2.5 and 7.5 minutes to calculate MVs. Empirically based regression models were established
from BE results to allow for real-time calculation of MVs. Three models were developed that successfully
predicted FE and BE results with less than 3% error for 99% of the data (Mooney & Facas, 2013). The lift
calculation method is available to commercial equipment producers for integration into IC software. MV
variability still existed in small lifts, typically six inches, which contained greater stiffness than the
underlying sub-lift soil.
9
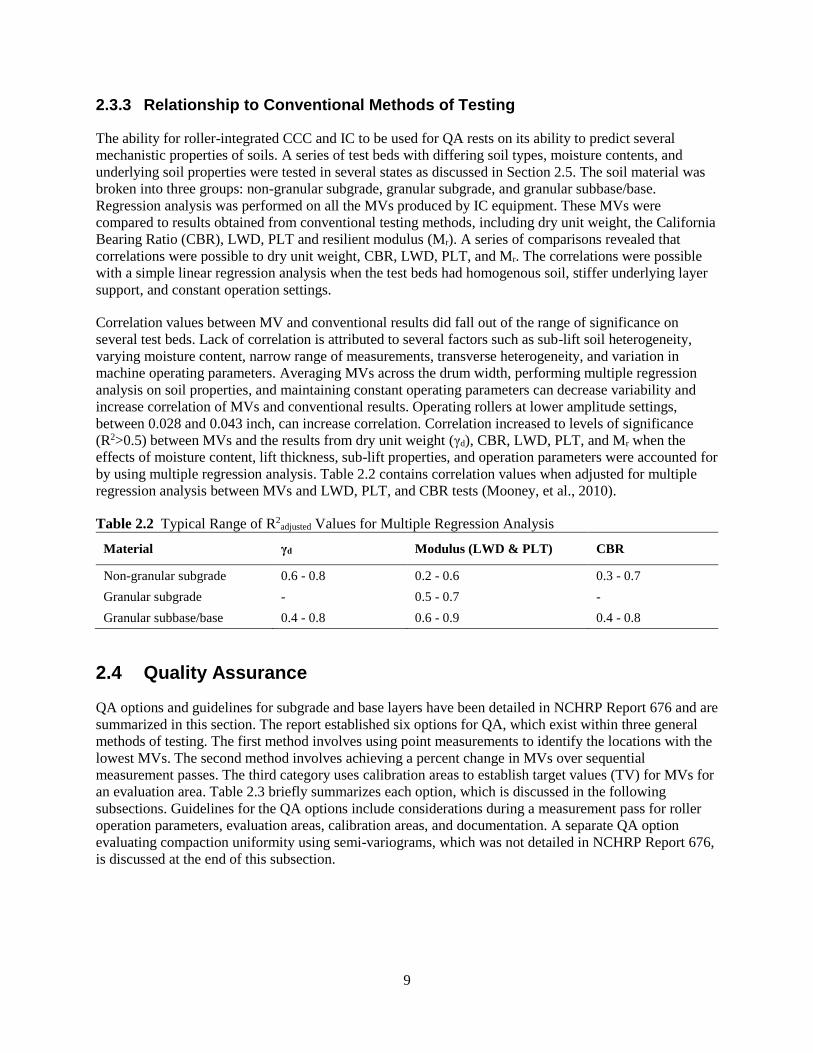
2.3.3 Relationship to Conventional Methods of Testing
The ability for roller-integrated CCC and IC to be used for QA rests on its ability to predict several
mechanistic properties of soils. A series of test beds with differing soil types, moisture contents, and
underlying soil properties were tested in several states as discussed in Section 2.5. The soil material was
broken into three groups: non-granular subgrade, granular subgrade, and granular subbase/base.
Regression analysis was performed on all the MVs produced by IC equipment. These MVs were
compared to results obtained from conventional testing methods, including dry unit weight, the California
Bearing Ratio (CBR), LWD, PLT and resilient modulus (Mr). A series of comparisons revealed that
correlations were possible to dry unit weight, CBR, LWD, PLT, and Mr. The correlations were possible
with a simple linear regression analysis when the test beds had homogenous soil, stiffer underlying layer
support, and constant operation settings.
Correlation values between MV and conventional results did fall out of the range of significance on
several test beds. Lack of correlation is attributed to several factors such as sub-lift soil heterogeneity,
varying moisture content, narrow range of measurements, transverse heterogeneity, and variation in
machine operating parameters. Averaging MVs across the drum width, performing multiple regression
analysis on soil properties, and maintaining constant operating parameters can decrease variability and
increase correlation of MVs and conventional results. Operating rollers at lower amplitude settings,
between 0.028 and 0.043 inch, can increase correlation. Correlation increased to levels of significance
(R2>0.5) between MVs and the results from dry unit weight (γd), CBR, LWD, PLT, and Mr when the
effects of moisture content, lift thickness, sub-lift properties, and operation parameters were accounted for
by using multiple regression analysis. Table 2.2 contains correlation values when adjusted for multiple
regression analysis between MVs and LWD, PLT, and CBR tests (Mooney, et al., 2010).
Table 2.2 Typical Range of R2adjusted Values for Multiple Regression Analysis
Material γd Modulus (LWD & PLT) CBR
Non-granular subgrade 0.6 - 0.8 0.2 - 0.6 0.3 - 0.7
Granular subgrade - 0.5 - 0.7 -
Granular subbase/base 0.4 - 0.8 0.6 - 0.9 0.4 - 0.8
2.4 Quality Assurance
QA options and guidelines for subgrade and base layers have been detailed in NCHRP Report 676 and are
summarized in this section. The report established six options for QA, which exist within three general
methods of testing. The first method involves using point measurements to identify the locations with the
lowest MVs. The second method involves achieving a percent change in MVs over sequential
measurement passes. The third category uses calibration areas to establish target values (TV) for MVs for
an evaluation area. Table 2.3 briefly summarizes each option, which is discussed in the following
subsections. Guidelines for the QA options include considerations during a measurement pass for roller
operation parameters, evaluation areas, calibration areas, and documentation. A separate QA option
evaluating compaction uniformity using semi-variograms, which was not detailed in NCHRP Report 676,
is discussed at the end of this subsection.

10
Table 2.3 Description of QA Options (Mooney, et al., 2010)
QA Option Description
Option 1 Point measurements on least compacted area based on MVs
Option 2a Comparing percent change in mean MV between consecutive passes
Option 2b Comparing percent change in MV at a location between consecutive passes and requiring a
certain percentage of locations to have a percent change lower than a set target value
Option 3a Establishing an acceptable correlation between MV and point measurement on a calibration
area to create TVs
Option 3b Establishing a TV based on the mean MV when the percent difference in MV consecutive
passes on the calibration area is less than or equal to 5% on 90% of the calibration area
Option 3c Establishing an acceptable correlation between MVs and lab-determined properties on the
calibration area to create TVs
2.4.1 QA Guidelines
Several guidelines are recommended while performing any of the QA options. The guidelines for
operating parameters, evaluation area, and calibration area allow for more uniformity while performing
measurement passes, allowing for more consistency in the generation of MVs. Documentation of each
measurement pass should include pre-established types of information. This information should include
the roller MV, three-dimensional position with time stamp and GPS quality, vibration amplitude,
vibration frequency, travel speed, driving direction, automatic feedback control setting, indication of
jumping, vibration setting, and pass sequence (Mooney, et al., 2010).
Operating parameters during measurement passes can have a profound effect on the generation of MVs.
The amplitude, frequency, roller speed, and direction are aspects of operation that should be carefully set
and monitored during measurement passes. Consistency with these aspects of operation allow for more
accurate roller repeatability checks. Amplitude between 0.7 and 1.1 mm with a tolerance of ±0.2 mm,
frequency between 28 and 32 Hz with a tolerance of ±2 Hz, and roller speed between 1.9 and 3.4 mph are
recommended. Roller MVs should not be collected during startup, stopping, and turning.
The MVs received from a measurement pass should be checked for validity using repeat measurement
passes and checking the MV consistency between forward and reverse driving directions. MVs should be
verified by a second roller pass on a test strip within the evaluation area. The percent difference in the
mean MV over the test strip should be less than 5%, and the maximum standard deviation of the MVs
should be less than or equal to 10%. MVs should be checked for positioning between travel modes. An
obstacle should be placed on the test strip perpendicular to the direction of the roller’s travel with the
roller passing it once in each direction. The mapping of the obstacle in each direction is used to indicate if
there is a discrepancy in the mapping locations between the driving directions. The positioning of the
MVs is accepted if the position error is less than one-half the reporting resolution.
Guidelines for selecting evaluation and calibration areas are established to provide for more consistent
MVs. Lengths for evaluation area are typically between 330 to 1,640 feet. Soil heterogeneity should be
minimized, avoiding a change in borrow material or transitions from a cut to a fill section. The calibration
test bed should have a minimum width of the roller’s width and a length of 100 feet. Minimum calibration
areas are ideal when soil homogeneity exists. Larger calibration areas should be used with increased soil
heterogeneity. The calibration area should be constructed similarly to the evaluation area, including the
material type, material placement procedure, moisture conditioning, and lift thickness.

11
IC instruments on the roller must provide sufficient documentation during measurement passes. NCHRP
Report 676 recommends the following parameters be documented during measurement passes: MV,
three-dimensional position with time stamp and GPS quality, vibration amplitude, vibration frequency,
travel speed, direction, automatic feedback control setting, jumping indication, vibration setting, and pass
sequence.
2.4.2 QA Option 1
Option 1 utilizes roller-integrated CCC to locate the least compacted soil locations. These locations are
then tested using point measurement methods. Locations with a length less than 10 feet should not be
tested. The evaluation area is acceptable if the point measurements meet the required point measurement
specifications. This option assumes that a positive correlation exists between soil compaction and MVs.
Heterogeneous soils should be examined further to see if this option is appropriate.
2.4.3 QA Option 2a
Option 2a is a comparison of the mean MV from two consecutive roller measurement passes. The percent
difference in the mean (%𝛥𝜇𝑀𝑉𝑖) between measurement passes is given by Equation 2.3. The QA is
accepted if the recommend percent difference in mean is 5% or less.
%𝛥𝜇𝑀𝑉𝑖 = (𝜇𝑀𝑉𝑖
−𝜇𝑀𝑉𝑖−1
𝜇𝑀𝑉𝑖−1
) × 100% (2.3)
2.4.4 QA Option 2b
Option 2b is a comparison of the percent change in MV (%𝛥𝑀𝑉) at a location between consecutive
passes and requiring a certain percentage of locations to have a percent change lower than a set target
value. Equation 2.4 provides the percent change in MV. It is recommend that between 80% and 95% of
the locations have a percent change in MV that is less than two times the standard deviation of the percent
change in MV. QA using this option requires a process to transform the spatial MV data in to a
comparable grid for each measurement pass. This process has not proven to be reliable and requires
careful consideration of the methodology if utilized.
%𝛥𝑀𝑉𝑖 = (𝑀𝑉𝑖−𝑀𝑉𝑖−1
𝑀𝑉𝑖−1) × 100% (2.4)
2.4.5 QA Option 3a
Option 3a starts with developing a correlation between point measurements and MVs on a calibration
area. A minimum of five measurements should be taken for each compaction level: low, medium, and
high. Generally, the coefficient of determination between the point measurement and MVs should be
greater than or equal to 0.5 (i.e.𝑅2 ≥ 0.5). When the correlation is established, MV corresponding to the
correlated point measurement value is used to create a TV. Typically, this can be achieved with a single-
variable regression; however, multivariate regression may be necessary to achieve the required coefficient
of determination to account for varying soil properties and different measurement depths. Acceptance is
met when a certain percentage of MVs in the evaluation area are equal to or greater than the TV. The
recommend acceptance percentage is between 80% and 95%.

12
2.4.6 QA Option 3b
Option 3b requires establishing a TV as the mean MV for the evaluation when the percent difference in
MV between consecutive passes on the calibration area is less than or equal to 5% for 90% of the
calibration area. Acceptance is met when the TV is achieved on the evaluation area.
2.4.7 QA Option 3c
Option 3c is aimed at developing a correlation between laboratory soil property value, such as the
resilient modulus (Mr) as a function of moisture contents and dry unit weights, and field-measured MVs
on a calibration area. This option enables the establishment of a target MV using the laboratory soil test.
First, a standard Proctor test is performed to determine the maximum dry unit weight and its optimum
moisture content of the soil. Using this soil information, dry unit weight and moisture content ranges
should be specified by the reviewing agency. Second, a series of laboratory resilient modulus tests are
performed in accordance with the standard protocol used by the state agency at the specified range of
moisture contents. A correlation of Mr as a function of soil dry unit weight and moisture content is then
established. Third, a relationship is established between field-measured roller MVs and moisture and dry
unit weight that are determined using the spot test methods. Forth, a multiple regression model is
established between MVs and the field measurements at the respective moisture and dry unit weight. This
model would be used to predict the laboratory soil property values based on the field measurements. TVs
are established based on the laboratory tests and desired soil properties. Pad foot rollers are not
recommended for this QA option.
2.4.7 Semi-Variogram
A semi-variogram is a geostatistical analysis method that can be used to analyze the uniformity of soil
and pavement compaction. While this QA option is helpful for visualizing uniformity characteristics of
soil or pavement and is becoming more prevalent, its use has extended only to academic literature and has
not been integrated into QA specifications by state DOTs. A brief description of this QA option is listed
below. More information is available in the referenced article by Vennapusa, White, and Morris.
A semi-variogram plot has a γ(h) value on the y-axis and a separation distance of h along the x-axis as
depicted in Figure 2.3. The γ(h) is defined as half the average squared differences of data values that have
a separation distance of h. Two sets of data are plotted: the exponential semi-variogram, represented by
the smooth curve, and the experimental semi-variogram plot, modeled by the circles in Figure 2.3. The
exponential semi-variogram represents the theoretically uniform compaction model and the circles
represent the data obtained from MVs. Acceptance is related to the distance between the exponential and
experimental plots. Set acceptance standards were not recommended by the authors but a “goodness-of-
fit” value can be assigned to demonstrate sufficient compaction uniformity.
Three parameters to be aware of when reading a semi-variogram are the range (R), Sill (C+Co), and
nugget (Co). The range represents the distance at which the separation distance from zero to the plateau of
the exponential semi-variogram. The sill represents the plateau height of the exponential semi-variogram
plot, which is nearly equal to the data’s variance. The nugget describes the sampling error in the data,
where the exponential semi-variogram theoretically should pass through the origin without any error
(Vennapusa, White, & Morris, 2010).

13
Figure 2.3 Example of a Semi-Variogram (Vennapusa, White, & Morris, 2010)
2.5 Case Studies
Several case studies have been conducted to evaluate the QA options described in Section 2.4. Table 2.4
shows the six case studies outlined in the NCHRP Report 676. Each of the studies tested at least one QA
option. Additional case studies from Texas are included in but were not a part of NCHRP Report 676.
Table 2.4 Case Studies and Options Tested (Mooney, et al., 2010)
State I.D. No. Options Tested Material
Colorado CO34 1, 2a, 2b, 3a Granular Subbase
Florida FL15 1, 2a, 2b Granular Subbase
Florida FL19 3a Aggregate Base
Florida FL23 1, 2a, 2b, 3a, 3b Granular Subgrade
North Carolina NC20 1, 3a Granular Subgrade
Minnesota MN10 3c Nongranular Subgrade
2.5.1 Colorado
2.5.1.1 Test Bed CO34
The case study on CO34 took place on a 40-foot wide by 1,000-foot long evaluation area of granular
subbase. AASHTO soil type A-4 was excavated and soil type A-1-a was used as fill material. The
evaluation and calibration areas were compacted using a Dynapac IC roller. The target soil dry-unit
weight (γd) was set at 100% of the maximum (γd-max). A target moisture content (w) was not used for
quality control because rock content was greater than 50% by weight. A Zorn lightweight deflectometer
(LWD) was used to determine the modulus, and a nuclear gauge was used to determine the dry unit
weight. The lift depth was 12 inches. QA options 1, 2a, 2b, and 3a were evaluated, while only options 2a
and 2b met the QA standards based on the NCHRP recommendations.

14
Option 1 required that all the point measurement tests in the weakest areas met the required γd-TV. The six
point measurements failed to meet the γd-TV requirements. The use of 100% as the γd-TV was stricter than
the existing Colorado standards. A standard that was lower, yet within acceptable practices, would have
increased the amount of passing point measurements.
Option 2a required that the percent change in the mean MV (%ΔμMVi) between roller passes be 5% or
less. Acceptance was met on pass six, which had a %ΔμMV equal to 4.1%. Option 2b required that 80% of
the evaluation area have MVs with a percent change in consecutive measurement passes less than two
times the standard deviation of the MVs from a repeatability test. A nearest neighbor interpolation method
was used to create fixed grids. Acceptance was met on pass six with 81% of the evaluation area passing.
Use of this method displayed great variability of MVs on consecutive roller passes with percent changes
ranging from a decrease of 50% of the original MV to an increase of 75%. Variability was attributed to
limitations in comparing MVs between measurement passes using the fixed grid evaluation method.
Option 3a required that correlations between point measurements and MVs be established on the
calibration area. The Dynapac compactor provides MVs in the form of compaction meter values (CMVD).
An acceptable correlation of R2 equal to 0.52 between the γd and CMVD was established. The correlation
between the LWD modulus and CMVD was not acceptable at R2 equal to 0.39. This was attributed to soil
heterogeneity and a stiffer calibration area than evaluation area. Based on the measured γd, the MV-TV
was set at CMVD equals 48. It was required that 90% of the evaluation area meets the MV-TV. The
standard was not met with only 3% of the evaluation area meeting the MV-TV.
2.5.2 Florida
2.5.2.1 Test Bed FL15
The case study on FL15 took place on a 40-foot wide by 200-foot long evaluation area. The lift was 12-
inches thick consisting of nine inches of granular subgrade: AASHTO soil type A-3 and three inches of
bed ash. A Sakai CCC roller was used for compaction, and point measurements were taken with a nuclear
gauge and Prima LWD. QA Options 1, 2a, and 2b were tested options, where 2a and 2b met the QA
standards.
Option 1 had a γd-TV equal to 98% of the maximum γd. None of the six point measurements in the
weakest areas indicated by the MVs met the γd-TV; though, the measurements would have met the
standard if the γd-TV had been equal to 94% of the maximum γd. Consideration of a less strict TV was
suggested for future use. Also, a positive correlation did not exist between the MVs and point
measurements indicating that lower MVs did not necessarily correspond to lower compaction. Option 1 is
effective when MV and point measurement have a significant positive correlation.
Option 2a required that %ΔμMVi be 5% or less. Acceptance was met on pass nine, which had a %ΔμMV
equal to 3.0%. Option 2b required that 80% of the evaluation area have MVs with a percent change in
consecutive measurement passes less than two times the standard deviation of the MVs from a
repeatability test, which was 10% in this case study. Nearest neighbor interpolation was used to create a
fixed grid of MVs for each pass. Acceptance was met as 92% of the evaluation area achieved less than a
10% %ΔμMV between consecutive passes.
2.5.2.2 Test Bed FL19
The case study on FL19 took place on a 30-foot by 917-foot evaluation section. The calibration area was
8 feet by 100 feet. The lift consisted of a 6-inch aggregate base: AASHTO A-1-b- over a stabilized
subgrade layer. A Dynapac IC roller was used for compaction, and the γd-TV was set at 98% of the

15
maximum γd. Point measurements from a nuclear gauge, CBR, and LWD were correlated to MVs. Option
3a was evaluated and was not accepted.
The γd-TV could not be achieved on the calibration area so inverse regression approach with an 80%
prediction interval (i.e., 80% of observations in evaluation area must fall within the prescribed MV-TV
range) was used to determine acceptance. Only 68% of the MVs in the evaluation area fell within the
prescribed MV-TV range. The result was less than the 80% required and did not meet acceptance. It was
noted that a significant correlation did not exist on the evaluation area, where it had on the calibration
area. This was due to soil heterogeneity in the underlying layer, which was confirmed by point
measurement tests. It was recommended that soil heterogeneity be studied in greater detail to ascertain
what level of homogeneity is needed to utilize this option.
2.5.2.3 Test Bed FL23
The case study on FL23 also was conducted in Florida with a 36-foot by 825-foot evaluation area and a
7.2-foot by 180-foot calibration area. The task was to cut 0.6 to 1.0 feet of an existing embankment of
subgrade material: ASSHTO A-1-b. Compaction of the scarified subgrade was completed by a Case IC
roller. The γd-TV was required to be greater than or equal to 95% of the maximum γd. QA options 1, 2a,
2b, 3a, and 3b were evaluated, and options 1, 2a, and 2b were accepted.
Forty point measurements were taken to check for acceptance based on Option 1. All 40 point
measurement met the 95% γd-TV, and the evaluation area was accepted. The point measurement yielded
an MV range of 97% to 109% of the maximum γd. The point measurements were taken after pass 6.
Option 2a required that %ΔμMVi be 5% or less. Acceptance was met on pass three, which had a %ΔμMV
equal to 3%. Option 2b required that 90% of the evaluation area have MVs with a percent change in
consecutive measurement passes less than 5%. Kriging, which is accounted for the exponential spatial
variation of points in all directions, was used to compare MVs from consecutive passes. Acceptance was
met on pass 5 with 94% of the area less than the 5% %ΔμMV relative to the previous pass.
Option 3a required that a correlation be established between point measurements and MVs on the
calibration area. The correlation was achieved using inverse regression with an 80% prediction interval.
The MV-TV was required for 90% of the evaluation area while only 20% of the evaluation area achieved
the MV-TV, and thus, acceptance was not met. When testing for γd using point measurements, it was
found that all the point measurements passed. The LWD modulus tests indicated that only 28 of 40 tests
passed. This reflects that the soil in the evaluation area based on γd was much closer to acceptance than
that indicated by the MVs and LWD modulus. Comparing the calibration area and evaluation area, point
measurement tests revealed that the calibration area had lower CBR profiles for the underlying support
conditions.
Option 3b requires that the TV to be established based on the mean MV when the percent difference in
MV consecutive passes on the calibration area is less than or equal to 5% on 90% of the calibration area.
The MV-TV was established after the fifth pass on the calibration area. However, the results were
inconclusive, because the calibration area was determined to not be representative of the evaluation, as
tested during Option 3a.
16
2.5.3 North Carolina
2.5.3.1 Test Bed NC20
The case study on NC20 took place on a 60-foot by 1640-foot evaluation area consisting of granular
subgrade. The section was compacted with a Sakai CCC roller on the silty sand subgrade: AASHTO A-2-
4. A calibration area of 60 feet by 300 feet was overlaid onto the evaluation area. A balloon density tester
was used to measure the dry unit weight on the evaluation area, and a nuclear gauge was used to measure
the dry unit weight on the calibration area. Additionally, an LWD was used to measure the modulus on
the calibration area.
Option 1 required that point measurements from the weakest areas indicated by MVs were equal to or
greater than 95% of the maximum dry unit weight. The dry unit weight range of the point measurements
was 100% to 102% of the maximum dry unit weight. Acceptance was met based on the target value of
95%. However, a significant positive correlation between the MVs and point measurements was not
obtained with R2 equal to 0.21. Therefore, option 1 should be used with caution, and additional testing is
recommended without a significant positive correlation between MVs and point measurements.
Option 3a required that 90% of the evaluation be equal to or greater than the MV-TV, which was
established based on tests on the calibration area. A measurement pass revealed that 93% of the area was
equal to or greater than the MV-TV; however, the significant correlations between the nuclear gauge
results and MVs did not exist as discussed in option 1. A significant correlation existed between the LWD
modulus and MVs and was used to develop the MV-TV. It is recommended that QA should not be
performed without a significant correlation between the QA required dry unit weight and MVs.
2.5.4 Minnesota
2.5.4.1 Test Bed MN10
The case study on MN10 was used to illustrate the application of option 3c. Acceptance of the evaluation
area was not tested. The test bed was filled with a non-granular subgrade material: AASHTO A-6, which
was supported by a relatively stiff and homogeneous subgrade layer. The subgrade layer was controlled in
three sections with differing moisture contents prior to compaction. The sections contained the optimum
moisture content and 3% above and below optimum moisture content. Moisture content was varied to
evaluate the effects of moisture on MVs. A pad foot Bomag IC roller was used for compaction.
Option 3c requires a specified percent of the evaluation area meet MV-TV established by correlating
point measurements from the field to MVs and laboratory data. The dry unit weight from field
measurements and MVs did not have a significant correlation with R2 equal to 0.37; however, the
adjusted coefficient of determination (R2adj) was equal to 0.54 when multiple regression analysis was
performed to account for the effects of moisture content. After relating field MV measurements to
laboratory measurements for the resilient modulus, the resilient modulus is then used to predict the MV
and establish the MV-TV. An acceptance envelop was then established as a combination of the MV-TV, a
moisture content within 2% of optimum and the 90% saturation curve. Variations of moisture content
must be accounted for when establishing MV-TVs to provide better relationships between MVs and
measurements taken by hand. In this case, the moisture content accounted for the difference between a not
significant and significant relationship.

17
2.5.5 Indiana
2.5.5.1 TB1 (White, Vennapusa, & Gieselman, 2011)
Test Bed 1 was located along SR-25 in West Lafayette, Indiana. A smooth single-drum roller was used to
compact a granular embankment. The objective of the project was to investigate the effect of the roller’s
vibration amplitude on soil density, modulus, and strength. MVs generally increased with an increase in
the number of passes with minimal decompaction occurring on the last pass—approximately 1% and 3%
of the MVs for an amplitude of 1.80 mm and 0.90 mm, respectively. The decompaction resulted in a
lower CBR values that were greater for the lower amplitude and approximately the same for the higher
amplitude value.
2.5.6 Texas
Texas DOT conducted soil compaction projects on seven test beds in 2008, which were not included in
NCHRP Report 676. Compaction was performed with a Case/Amman padfoot roller and Case/Amman
smooth drum roller. The values for the data for the smooth drum roller are presented in this section based
on the recommendation in NCHRP Report 676 to use smooth drum rollers for better MV consistency. The
compacted tests beds included a clay subgrade, lime-stabilized subgrade, and flex base material. A variety
of in-situ test methods were used to compare data to MVs, and data consisting of LWD, PLT, dry unit
weight, CBR, and FWD correlations are presented for each type of test bed material. Table 2.5 contains
the coefficient of determination for each material layer type (Chang, et al., 2008).
Table 2.5 Coefficients of Determination for MVs and In-situ Tests in Texas
Clay Subgrade
Lime-Stabilized
Subgrade 1
Lime-Stabilized
Subgrade 2
Flex Base
Material
LWD 0.10 0.45 0.37 0.25
PLT 0.67 0.51 - 0.48
ϒd - 0.37 - -
CBR 0.37 0.72 - -
FWD 0.75 0.64 0.73 0.37
"-" denotes data not available
While a positive correlation exists with all the in-situ tests and MVs, a majority of the coefficients of
determination do not meet statistical significance. FWD and PLT correlate better with MVs; however,
coefficients of determination from LWD and MV data never meet statistical significance. Several factors
can lead to lower values, which are discussed in Section 2.3. Values can be improved if multiple
regression analysis and accounting for underlying soils are taken into consideration when calculating
correlation values.
2.6 Currently Adopted Specifications
The QA specifications for soil compaction in this section are outlined on a state-by-state basis. The
specifications include CCC/IC, QA options, and traditional point measurement methods.

18
2.6.1 Colorado
Colorado DOT has developed specifications for the compaction of subgrade and base courses. Subgrade
requirements are detailed in Section 203 of the Colorado DOT 2011 Specifications Book, and base course
requirements are discussed in Section 304 (Colorado Department of Transportation, 2013).
Subgrade with AASHTO soil types A-2-6, A-2-7, A-4, and A-6 through A-7 shall be compacted to within
2% of the optimum moisture content per Section 203. All other soil types shall be compacted to a relative
compaction described by in Table 2.6 (Colorado Department of Transportation, 2013). AASHTO T-99
requires the use of a 5.5-lb (2.5-kg) rammer, and AASHTO T-180 requires the use of a 10-lb (4.54-kg)
rammer to obtain the optimum moisture content and maximum density, which is described in more detail
by Colorado DOT’s Colorado Procedure 23-10.
Table 2.6 CDOT Relative Compaction Requirements for Subgrade AASHTO Soil Classification AASHTO T-99 Minimum
Relative Compaction (Percent)
AASHTO T-180 Minimum
Relative Compaction (Percent)
A-1 100 95
A-3 100 95
A-2-4 100 95
A-2-5 100 95
All Others 95 90
Aggregate base course shall be compacted with a width of 6 inches to within 95% of the maximum
density determined by AASHTO T 180 as described in Section 304. The aggregate base course shall be
counted by ton of weight or cubic yard of volume as specified by contract. Measuring moisture content
and density is governed by Colorado DOT’s Colorado Procedure 25-12 and Colorado Procedure 80
(Colorado Department of Transportation, 2013). These procedures allow for point measurements to be
taken using a rammer, sand cone method, or nuclear gauge for both subgrade and base courses.
2.6.2 Utah
Utah DOT has developed specifications for the QA of the base course. The base course requirements are
detailed in Section 02721 of the UDOT 2012 Standard Specifications Book. UDOT requires testing for
dry density, moisture content, and soil gradation.
Utah DOT requires that the maximum dry density and optimum moisture content be calculated using
AASHTO T-180, which utilizes a 4.54-kg rammer to determine soil properties. Base courses for use in
the pavement section must have an average measured density of 97% of the maximum dry density and no
single density test can be below 94%. Moisture content must be within 2% of the optimum moisture
content. Moisture content and dry density can be measured per the UDOT minimum sampling and testing
requirements. A nuclear gauge (AASHTO T 310) is specified to obtain dry density, and evaporative
drying (AASHTO T-255) is specified to obtain moisture content (Utah Department of Transportation,
2012).
2.6.3 Florida
Florida DOT defines specifications for subgrade, subbase, and base layers accordingly. The subgrade,
subbase, and base layers must achieve a minimum of 98% of the modified Proctor maximum density.
Shoulders must have a minimum of 95% of the maximum density. The density shall be measured using a
10-lb (4.54 kg) rammer per Section 160-4 and Section 200-7 of the Florida DOT Standard Specifications
for Road and Bridge Construction 2014, which was adapted from AASHTO T-180.

19
2.6.4 Wyoming
Wyoming DOT allows the moisture content of the subbase and base layers to fall between 4% below and
2% above optimum moisture content per Section 301 of Wyoming DOT’s Standard Specifications for
Road and Bridge Construction 2010 Edition. The subbase and base layers must have a minimum soil
density of 95% of the maximum dry density determined in accordance with AASHTO T-180. Soil density
and moisture content can be determined by the sand cone method, nuclear gauge method, or Proctor tests
as described in the Wyoming DOT Materials Testing Manual.
2.6.5 Texas
Texas DOT requires that the density and moisture content of the subgrade and the base layers be tested
with quality control and quality assurance testing. Methods for testing the subgrade density and moisture
content are conducted using Texas DOT Designation TEX-114-E. The density and moisture content must
meet specific ranges based on the measured plastic index (PI) of the soil as summarized in Table 2.7. The
required density and moisture content are compared with the maximum dry density and optimum
moisture content determined by Proctor tests. The density of the base layer must meet the maximum
density. The density of the base layer can be tested using a rammer, soil compactor analyzer, and Proctor
tests.
Table 2.7 Soil Density and Moisture Content Requirements for Texas DOT Plastic Index Percent of Max. Dry Density Moisture Content
PI up to 15 98% or more -
PI above 15 and up to 35 98 - 102% At or above optimum
PI above 35 95 - 100 % At or above optimum
Draft IC specifications have been developed for the Texas DOT by the Transtec Group, a private
engineering firm contracted by the FHWA to coordinate the implementation of IC throughout the nation.
The IC specifications require that the dry unit weight is 100% of the target maximum dry unit weight and
that the moisture content is within 1% of the optimum moisture content. The procedure for compaction
involves the IC roller’s MVs compared with dry unit weight and moisture content along a control strip for
each layer. The control strips must have minimum length of 500 feet. The IC roller is used for compaction
and conventional tests are used for at least three locations along the control strip.
After the control strips are performed, the state’s engineer will determine MVs that are acceptable for
compaction target values. The IC roller then compacts the specified area. Preliminary acceptance is
achieved when the target values are met. Final acceptance is met if no more than one of five samples
tested using conventional methods is below the target density. If there is one test that failed to meet the
target value, the density must not be below 3 pcf of the target density. Compaction of the area must be
done again if final acceptance is not met. All samples must be conducted using conventional methods and
be taken within 24 hours of compaction by the IC roller.
2.6.6 Iowa
Iowa DOT requires that the subgrade and subbase layers achieve within a specific range of dry unit
weights and moisture contents, which are detailed in the Iowa DOT Standard Specifications for Highway
and Bridge Construction (2012). The subgrade and subbase layers must have a dry unit weight of at least
95% of the maximum dry unit weight and be within 6% of the optimum moisture content as determined
by standard Proctor tests. Acceptable tests for determining the moisture content are oven drying per
ASSHTO T-265, pan drying per AASHTO T-265 (open burner), microwave drying per ASTM D-4643,
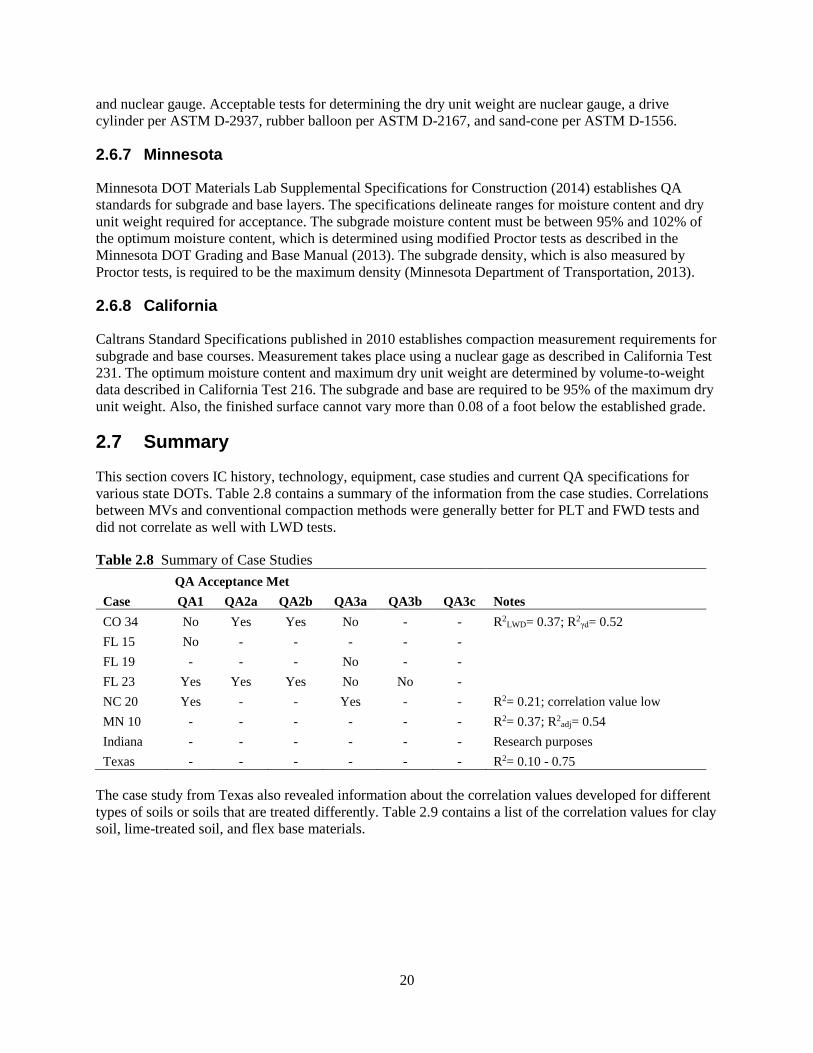
20
and nuclear gauge. Acceptable tests for determining the dry unit weight are nuclear gauge, a drive
cylinder per ASTM D-2937, rubber balloon per ASTM D-2167, and sand-cone per ASTM D-1556.
2.6.7 Minnesota
Minnesota DOT Materials Lab Supplemental Specifications for Construction (2014) establishes QA
standards for subgrade and base layers. The specifications delineate ranges for moisture content and dry
unit weight required for acceptance. The subgrade moisture content must be between 95% and 102% of
the optimum moisture content, which is determined using modified Proctor tests as described in the
Minnesota DOT Grading and Base Manual (2013). The subgrade density, which is also measured by
Proctor tests, is required to be the maximum density (Minnesota Department of Transportation, 2013).
2.6.8 California
Caltrans Standard Specifications published in 2010 establishes compaction measurement requirements for
subgrade and base courses. Measurement takes place using a nuclear gage as described in California Test
231. The optimum moisture content and maximum dry unit weight are determined by volume-to-weight
data described in California Test 216. The subgrade and base are required to be 95% of the maximum dry
unit weight. Also, the finished surface cannot vary more than 0.08 of a foot below the established grade.
2.7 Summary
This section covers IC history, technology, equipment, case studies and current QA specifications for
various state DOTs. Table 2.8 contains a summary of the information from the case studies. Correlations
between MVs and conventional compaction methods were generally better for PLT and FWD tests and
did not correlate as well with LWD tests.
Table 2.8 Summary of Case Studies
QA Acceptance Met
Case QA1 QA2a QA2b QA3a QA3b QA3c Notes
CO 34 No Yes Yes No - - R2LWD= 0.37; R2
γd= 0.52
FL 15 No - - - - -
FL 19 - - - No - -
FL 23 Yes Yes Yes No No -
NC 20 Yes - - Yes - - R2= 0.21; correlation value low
MN 10 - - - - - - R2= 0.37; R2adj= 0.54
Indiana - - - - - - Research purposes
Texas - - - - - - R2= 0.10 - 0.75
The case study from Texas also revealed information about the correlation values developed for different
types of soils or soils that are treated differently. Table 2.9 contains a list of the correlation values for clay
soil, lime-treated soil, and flex base materials.

21
Table 2.9 MV Correlation to Conventional Tests by Soil Type (Chang, et al., 2008)
Soil Type R2
Clay Subgrade 0.10 - 0.75
Lime-Treated Subgrade 0.37 - 0.73
Flex Base 0.25 - 0.48

22
3. LITERATURE REVIEW ON ASPHALT COMPACTION
3.1 Overview
The purpose of this section is to present and analyze how various CCC and IC rollers are applied to
asphalt pavements. Several aspects of asphalt compaction related to soil compaction are discussed in this
section. These aspects include different equipment types, different correlations between roller MVs and
conventional tests, and an additional QA option. Also, case studies of CCC and IC on asphalt pavements
are included. Conclusions of the literature review on soils described in Section 2 as well as pavement in
this section are included.
3.2 Equipment
The equipment used for compaction of asphalt pavements utilizes dual-drum smooth rollers instead of
single-drum rollers. The equipment is manufactured by the same companies as the single-drum rollers.
Table 3.1 summarizes roller models for asphalt pavement compaction (The Transtec Group, Inc., 2013).
The dual-drum rollers are equipped with the same technology as the soil compactors discussed in
Subsection 2.2.3. The technology generates the same MV values, measuring the stiffness of the asphalt
pavement. Dual-drum rollers are also equipped with temperature sensors to measure the asphalt
temperature. The asphalt’s temperature has an effect on the stiffness and can be used in formulae to adjust
the MVs into comparable terms data using regression analysis methods. The MVs are then related to
properties of the asphalt, which are discussed in Section 3.3.
Table 3.1 List of IC Equipped Roller Models for Asphalt Pavement Compaction
Vendor Model Model No IC-MV Software
Bomag AsphaltManager BW190AD-4AM Evib BCM05
Caterpillar AccuGrade CB44B,CB54B
CD44B,CD54B CMV VisionLink
HAMM(Wirtgen) HCQ HD+90/ HD+110
HD+120/HD+140 HMV HCQ
Sakai CIS SW850/ SW880/SW890 CCV AithionMT
IC-MV: Intelligent compaction measurement values; a generic term for all IC measurements; Evib: Vibration
modulus; CIS: Sakai Compaction Information System; CCV: Sakai Compaction Control Value; HCQ: HAMM
Compaction Quality; and HMV: HAMM Measurement Value
3.3 Measurement Values
MVs are generated in the same manner as soil compaction, which is discussed in Section 2.3. Asphalt
pavement compaction differs in its relationships to MVs, which generally require correlations based on
coring of the pavement. The techniques for measuring the density differ from those used in soils. The
basis of acceptance for a roadway asphalt pavement is defined by the density of a pavement to its
maximum density. The maximum density is obtained by taking cores of the asphalt pavement with test
conducted within two days of coring. The maximum density can be obtained in accordance with
AASHTO T-209. Many state DOTs use a volumetric process, such as AASHTO T-209, to measure the
cores and relate the constructed asphalt pavement density to the maximum density. Next, the densities
obtained from the volumetric tests are related to roller MVs to establish a correlation, whereby its degree
of fitting is evaluated based on the coefficient of determination. If the coefficient of determination is
23
significant enough, the MVs can then be used for relating various QA options. Several in-situ methods
have also been identified for measuring asphalt density and modulus in several case studies presented in
Section 3.5. These tests include light weight deflectometers (LWD), nuclear gauge (NG), non-nuclear
gauge (NNG), falling weight deflectometer (FWD), and portable seismic pavement analyzer (PSPA)
(Chang, et al., 2011).
3.4 Case Studies
Several case studies have been conducted to evaluate the effectiveness of IC rollers on asphalt
compaction. Certain case studies on pavement have evaluated QA options as described in Section 2.4 and
Section 3.4. Other case studies evaluate the consistency of the rollers’ temperature sensors with other
non-roller temperature devices, the correlation values with the MVs from the subbase layers, and
correlations to specific in-situ tests.
3.4.1 Minnesota
A FHWA-sponsored test took place on Route 4 in Kandiyohi County and mapped the hot mix asphalt
(HMA) base course and wearing course. The subbase was also mapped for further investigation related to
the quality of the asphalt courses. The case study was performed in June 2008 and utilized a Sakai SW880
double-drum vibratory roller. The goal of the case study was to monitor the consistency of the roller’s
temperature sensors. Also, the relationships of asphalt MVs and the subbase conditions as well as
correlations to in-situ testing were evaluated. The correlations to in-situ testing are established in
accordance with Option 3a. However, this case study did not establish target values (TV) to evaluate the
acceptance of asphalt compaction.
The findings from the case study demonstrated that temperature readings from the roller’s sensors were
consistent with temperatures from thermal cameras placed at the test site (Chang, et al., 2011). Also, the
MVs from the subbase and HMA base layers were found to have a coefficient of determination (R2) equal
to 0.69, which is higher than the required 0.5, indicating a correlation of significance. This indicates that
MVs on pavement layers are related to the compaction quality of the underlying layers. Strong
correlations were found between the MVs and lab density measurements with an R2 equal to 0.99 when
MVs were calculated using a 3.3-foot average radius. NG data and MV data had an R2 equal to 0.90. The
authors of the study noted that the correlations were developed using a limited number of data points: four
for the lab density and five for the NG.
3.4.2 Mississippi
The FHWA-sponsored test took place on US 84 in Wayne County in July 2009. A Sakai double roller
was utilized to measure the HMA base layer. MVs from the subbase were also measured. The goal of the
project was to familiarize Mississippi DOT officials and contractors with the technology. FWD and NG
density readings were taken to correlate with the MV data. The correlations were the principal
information gained from the demonstration with no specific QA option being tested. Correlations for the
FWD and MVs on the HMA were found to have an R2 equal to 0.75 while a low correlation was achieved
between MV and NG readings. The low correlation was attributed to the variability of layer thickness,
variations in HMA temperature, and roller operating variables (i.e., amplitude, frequency).
3.4.3 Indiana
The FHWA-sponsored test took place on US 52 between US 231 and Cumberland Ave in Lafayette,
Indiana. The test took place in September 2009 and utilized both Sakai and Bomag double-drum rollers.
The test consisted of milling 2 inches of existing HMA then compacting a 2.5-inch HMA base layer
24
followed by a 1.5-inch HMA surface layer. The compaction was completed above an existing 7-inch layer
of HMA underlain by 6 inches of concrete.
The purpose of the test was to introduce IC to INDOT officials and contractors. The test also included
correlations studies between MVs and in-situ tests. The Sakai MVs and non-nuclear gauge tests had an R2
equal to 0.48, which was near the level of significance. The correlation between Bomag MVs and FWD
tests as well as core densities did not result in a R2 near or above a level of significance. The lack of
correlation was attributed to 1) no temperature adjustment on Bomag MVs, and 2) MVs represent all
pavement layers, including the existing pavement while the in-situ tests are mostly influenced by the
newly laid HMA layers.
3.4.4 Utah
The FHWA-sponsored tests took place on US 89 in American Fork on August 6 through August 9, 2012.
The tests were organized into three adjacent test beds and were tested with Sakai and Hamm IC rollers.
The Sakai roller was equipped with a GPS system that was supported by a hand-held Trimble to obtain
real time kinematic precision (RTK) of 2 to 4 cm. The Hamm roller utilized an OmniStar HP signal with a
RTK precision between 5 and 10 cm (Chang, Xu, & Rutledge, 2012). Compaction was performed on
asphalt base courses on all test beds.
A nuclear gauge and core samples were used to obtain asphalt density. These values were compared to
roller MVs. The first test bed was used to determine correlations between roller MVs and operational and
site conditions. On the second test bed, the Hamm roller MVs had an adjusted R2 equal to 0.33 when
comparing to core densities while the Sakai roller MVs had a higher adjusted R2 of 0.48 when
multivariate regression was used for establishing the correlation. Analysis shows that the correlation
values were mostly affected by the roller frequency for the Hamm roller and asphalt temperature for both
rollers. The insignificant correlation values were attributed to the uncertainty of positioning
measurements and unusual rolling patterns. The third test bed, which utilized the Hamm roller, contained
significant correlations between roller MVs and nuclear gauge density measurements with an adjusted R2
of 0.92. Analysis demonstrated that no single factor, such as temperature or operating parameters, had a
large statistical influence on the correlation (Chang, Xu, & Rutledge, 2012).
3.4.5 New York
The FHWA-sponsored test took place on US 219 near the village of Springville. The test performed
between May 17 and May 22, 2009, using a Sakai double-drum roller. An HMA base, second lift HMA
base, and HMA binder course were compacted. The purpose of the test was to demonstrate the IC roller’s
ability to improve roadway compaction to New York State DOT officials and contractors. The test
revealed that MVs collected from underlying layers using a single-drum roller correlated to MVs in
asphalt layers using a dual-drum roller. However, NG and NNG density results did not correlate well with
MVs. The weak correlation was attributed to temperature variation, roller passes, roller amplitude, and
roller frequency (Chang, et al., 2011).
3.4.6 Maryland
The FHWA-sponsored test took place on eastbound US 340 in Frederick County from July 20 to July 24,
2009. The test consisted of grinding an existing HMA layer and compacting an overlay of stone matrix
asphalt. Sakai and Bomag rollers were used for compaction. The purpose of the project was to
demonstrate the ability of IC rollers to improve roadway compaction to Maryland State Highway
Administration officials and contractors. Correlation between Sakai MVs and in-situ densities were
conducted. MVs and NG tests results demonstrated an insignificant correlation with an R2 equal to 0.20.
25
The weak correlation was attributed to temperature variation, roller passes, roller amplitude, and roller
frequency.
3.4.7 Texas
The FHWA-sponsored test took place on Farm-to-Market Road 1281 between 0.3 and 3.301 miles east of
Interstate 10 in El Paso County. A new two-inch layer of HMA was constructed by milling the existing
asphalt layer and introducing 4% by weight cement to the top 4 inches of existing granular base. The test
utilized a Sakai double-drum roller to compact the new HMA layer. Two tests beds, TB 01A and TB 02A,
were analyzed for compaction. Correlation values were calculated between MVs and in-situ densities
using FWD, NNG, and portable seismic pavement analyzer (PSPA). MV and density correlations in TB
01A had an R2 equal to 0.75 with the FWD, 0.68 with NNG, and 0.91 with PSPA. However, the
correlation studies were concluded based on only five measurements. The coefficient of determination
between MVs and PSPA on TB 02A was equal to 0.48 for the six measurements (Chang, Xu, & Rutledge,
2012). Although three out of the four R2 values were significant, more data measurements are necessary
to draw a conclusive correlation study.
3.4.8 California
The demonstration project was conducted in Solano along a 1.26-mile section of eastbound I-80 in
September 2013. Compaction of HMA was performed with Caterpillar, Bomag, and Hamm IC rollers on
three test bed sections. Compaction took place on a 3-inch intermediate course for each test bed.
Correlations between core densities, NG, FWD, and MVs were conducted. Correlations between NG data
and core densities were low with an R2 value of 0.08. MVs from all three compactors demonstrated a
similar or lower correlation with core density. Correlations between FWD data and MVs were also low
with an R2 value of 0.16. However, the correlation between MVs and NG were substantial with R2 values
of 0.96 and 0.97 for the Hamm and Bomag IC roller, respectively. The reported low correlation between
NG and core densities was unknown, causing NG data and, subsequently, MVs to be unreliable.
3.5 Currently Adopted Specifications
In this section, the QA specifications for asphalt compaction are outlined in a state-by-state basis. The
specifications include IC QA options, and traditional point measurement methods. A group of
neighboring states were chosen (Utah and Colorado) and other states were chosen based on their progress
with IC case studies and specifications.
3.5.1 Utah
Utah DOT requires that cores of the asphalt be retrieved; the asphalt density is measured based on UDOT
Specification 02741 (Utah Department of Transportation, 2012). The core densities must be at least
93.5% of the theoretical maximum specific gravity as obtained from AASHTO T-209. An exception to
this requirement exists for thin layer asphalt overlays, which must have a minimum core density of 92.5%
of the theoretical maximum specific gravity.
3.5.2 Colorado
Colorado DOT requires that the specific gravity of the asphalt be equal to at least 92% of the theoretical
maximum specific gravity per Section 401.17 of the Colorado DOT Standard Specifications Manual
(Colorado Department of Transportation, 2013). The density of the asphalt can be measured by two
methods. The first method is taking cores of the asphalt and measuring the density through a volumetric
26
approach outlined in Colorado Procedure 44. In the second method, asphalt density is obtained from an
NG test per Colorado Procedure 81.
3.5.3 Florida
Florida DOT uses 6-inch diameter cores, NG, or other devices for measuring density with a frequency of
one test per 1,500 feet of pavement. The requirement is established in Section 330 of the Florida DOT
Standard Specifications for Road and Bridge Construction (2014). The standard specifications do not
outline specifications for IC.
3.5.4 Wyoming
Wyoming DOT has five roadway designations for density testing of pavements as listed in Section 401 of
the Wyoming DOT Standard Specifications for Road and Bridge Construction. Minimum core densities,
which are tested using a volumetric method, of 92% of the voidless unit weight are required by
Designation II, which is a road designation that has the most specified requirement (Wyoming
Department of Transportation, 2010).
3.5.5 Texas
Texas DOT Standard Specifications for Construction and Maintenance of Highways, Streets, and Bridges
(2004) has density requirements for dense-graded HMA and cold-laid HMA. Density is measured by
taking cores and using a volumetric method, which is specified by Texas Test Procedure Tex-207-F.
Dense-graded HMA must have a density equal to 96% of the maximum density. A tolerance of 1% is
permitted. Cold-laid HMA must have a density between 91% and 94%. Cold-laid HMA must also have a
moisture content no greater than 1% as tested by Texas DOT Test Procedure Tex-212-F.
3.5.6 Iowa
Iowa DOT requires that cores are taken to calculate the specific gravity. A volumetric method is used to
calculate the specific gravity, which is then related to the maximum specific gravity. Section 2303 of the
Iowa DOT Standards for Highway and Bridge Construction (2012) specifies that the contractor must
achieve a specific gravity between 91.5% and 96.5% of the maximum specific gravity for at least 50% of
the samples taken for each lot. Payouts are related to the percent of samples achieving the specific gravity
requirements. Certain types of roadways with less intense use, such as non-high-speed ramps, non-
interstate roads used for fewer than 12 months, and state park roadways, must have a minimum specific
gravity of 92% of the maximum specific gravity.
3.5.7 Minnesota
Minnesota DOT Materials Lab Supplemental Specifications for Construction (2014) requires a volumetric
measurement of cores from the asphalt pavement to be taken per Section 2360.3. The specifications
require that the cores have a minimum relative specific gravity depending whether the pavement is a wear
course and the percent of voids. A wear course must have a specific gravity of 92% of the maximum
specific gravity.
3.5.8 California
Caltrans Standard Specifications published in 2010 establishes compaction measurement requirements for
HMA (Caltrans, 2010). The requirements specify that density of the HMA be between 91% and 97% of
the maximum theoretical density. The density is measured using California Test 375, which correlates

27
nuclear gage density readings to core sample densities. The moisture content of the HMA must be a
maximum of 1% as determined by California Test 226 or 370, which are oven or microwave drying
methods, respectively.
3.6 Intelligent Compaction Specifications
FHWA has been promoting IC via its Every Day Counts initiative. The initiative supports local
workshops, demonstration projects, development of standard IC specifications, and additional technical
assistance for state and local governments to implement IC. State and local transportation agencies are
seen as the catalyst to adoption of IC because they provide contractors with quality control/quality
assurance (QC/QA) specifications for compaction of roadways. Quality control is referred to as the
method for testing compaction parameters, such as density and moisture content, by construction crews to
verify the quality of the roadway; whereas, quality assurance is referred to as the validation of quality
control methods and data through additional compaction testing.
A literature review on current state DOTs’ draft IC specifications indicates that state and local
transportation agencies continue to require conventional compaction testing methods even if IC guidance
is provided for roadway soil and pavement compaction (The Transtec Group, Inc, 2014). For example,
Caltrans uses a combination of nuclear gauge readings and core sampling for pavement QC/QA; however,
its draft IC specifications are not used system-wide. Similarly, Minnesota has created draft specifications
and has conducted several field demonstrations over the past decade; however, permanent specifications
for soils and pavement have not been integrated into their standard specifications manual. Texas,
Michigan, and Iowa have developed special provisions for soils, but do not include QC/QA parameters
for acceptance and use IC for research purposes or for demonstrating the technology.
Currently, 18 states are drafting or have adopted IC QC/QA specifications and special provisions based
on information gathered from the DOT survey described in Section 4 and the Transtec Group (The
Transtec Group, Inc, 2014). Eight states, shaded in black, are opting to provide draft specifications for
both soils and pavements, while 10 states, shaded in dark gray for soils and light gray for pavement, are
drafting specifications for either soils or pavements. More states are expected to begin drafting QC/QA
specifications as more workshop and field demonstrations are scheduled (The Transtec Group, Inc, 2014).
Figure 3.1 displays the types of IC QC/QA specifications drafted by states. These draft specifications
range from special provisions to comprehensive specifications to be used for statewide roadway
construction (The Transtec Group, Inc, 2014).

28
Figure 3.1 IC QC/QA Specifications by States
The specifications detail requirements for GPS data, documentation, test sections, and construction
QC/QA. The two types of outcomes for the specifications involve reporting compaction value results for
QC/QA and/or providing documentation of IC data for demonstration purposes. For soils, specifications
used for QC/QA involve acceptance based on a percent difference in measurement values (MVs) between
roller passes and/or correlation of IC MVs with in-situ point measurements to establish IC target values.
Georgia, Indiana, North Carolina, and Vermont require correlations from test trips between in-situ point
measurements and MVs. Georgia also required an optimal pass number established when there was a less
than 5% change in MVs. The remaining states’ IC specifications did not provide more detailed QC/QA
specifications for soils (The Transtec Group, Inc, 2014).
For pavements, most states have QC/QA specifications that establish a target number of roller passes by a
percent difference in MVs followed by establishing target values for MVs based on correlations of
nuclear gauge or core samples on a test section. The exceptions to these specifications are Iowa, Nevada,
Utah, and Rhode Island, which do not detail a method or requirements for compaction values (The
Transtec Group, Inc, 2014).
3.7 Summary
This section included information about the IC equipment, case studies, and specifications for asphalt.
The case studies and review of specifications sections revealed that IC can have statistically significant
correlations and that states are preparing IC QA specifications. The case studies displayed a wide range of
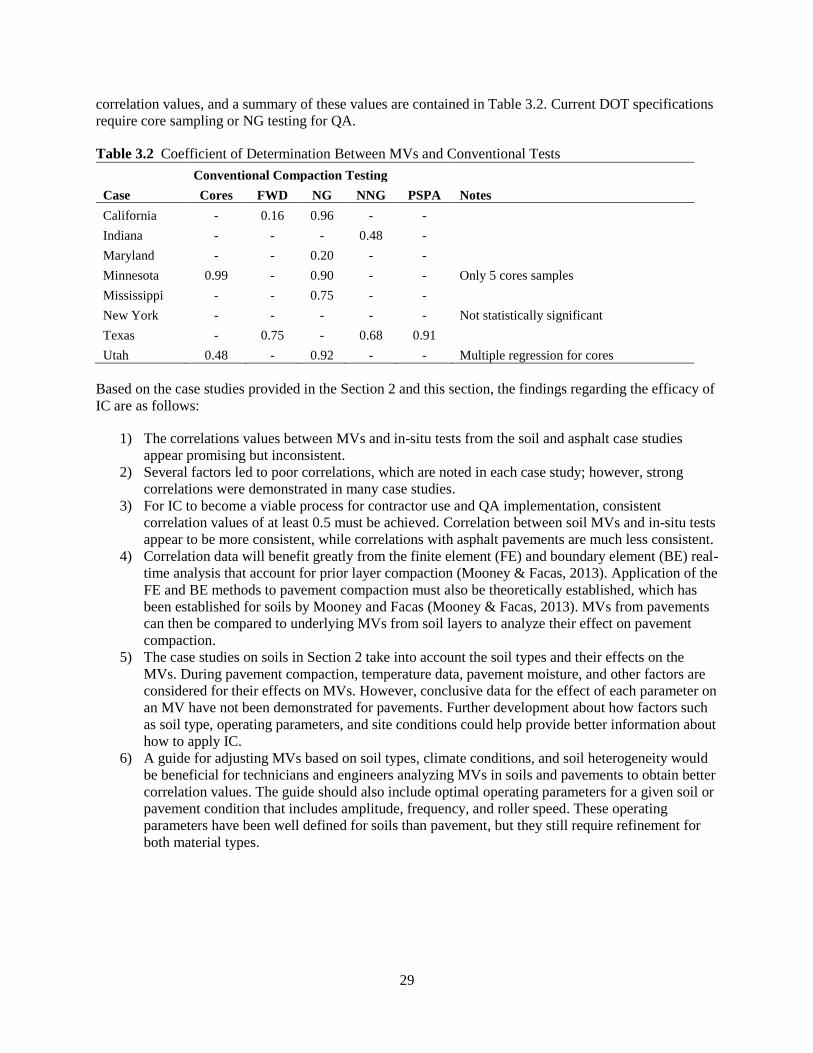
29
correlation values, and a summary of these values are contained in Table 3.2. Current DOT specifications
require core sampling or NG testing for QA.
Table 3.2 Coefficient of Determination Between MVs and Conventional Tests
Conventional Compaction Testing
Case Cores FWD NG NNG PSPA Notes
California - 0.16 0.96 - -
Indiana - - - 0.48 -
Maryland - - 0.20 - -
Minnesota 0.99 - 0.90 - - Only 5 cores samples
Mississippi - - 0.75 - -
New York - - - - - Not statistically significant
Texas - 0.75 - 0.68 0.91
Utah 0.48 - 0.92 - - Multiple regression for cores
Based on the case studies provided in the Section 2 and this section, the findings regarding the efficacy of
IC are as follows:
1) The correlations values between MVs and in-situ tests from the soil and asphalt case studies
appear promising but inconsistent.
2) Several factors led to poor correlations, which are noted in each case study; however, strong
correlations were demonstrated in many case studies.
3) For IC to become a viable process for contractor use and QA implementation, consistent
correlation values of at least 0.5 must be achieved. Correlation between soil MVs and in-situ tests
appear to be more consistent, while correlations with asphalt pavements are much less consistent.
4) Correlation data will benefit greatly from the finite element (FE) and boundary element (BE) real-
time analysis that account for prior layer compaction (Mooney & Facas, 2013). Application of the
FE and BE methods to pavement compaction must also be theoretically established, which has
been established for soils by Mooney and Facas (Mooney & Facas, 2013). MVs from pavements
can then be compared to underlying MVs from soil layers to analyze their effect on pavement
compaction.
5) The case studies on soils in Section 2 take into account the soil types and their effects on the
MVs. During pavement compaction, temperature data, pavement moisture, and other factors are
considered for their effects on MVs. However, conclusive data for the effect of each parameter on
an MV have not been demonstrated for pavements. Further development about how factors such
as soil type, operating parameters, and site conditions could help provide better information about
how to apply IC.
6) A guide for adjusting MVs based on soil types, climate conditions, and soil heterogeneity would
be beneficial for technicians and engineers analyzing MVs in soils and pavements to obtain better
correlation values. The guide should also include optimal operating parameters for a given soil or
pavement condition that includes amplitude, frequency, and roller speed. These operating
parameters have been well defined for soils than pavement, but they still require refinement for
both material types.
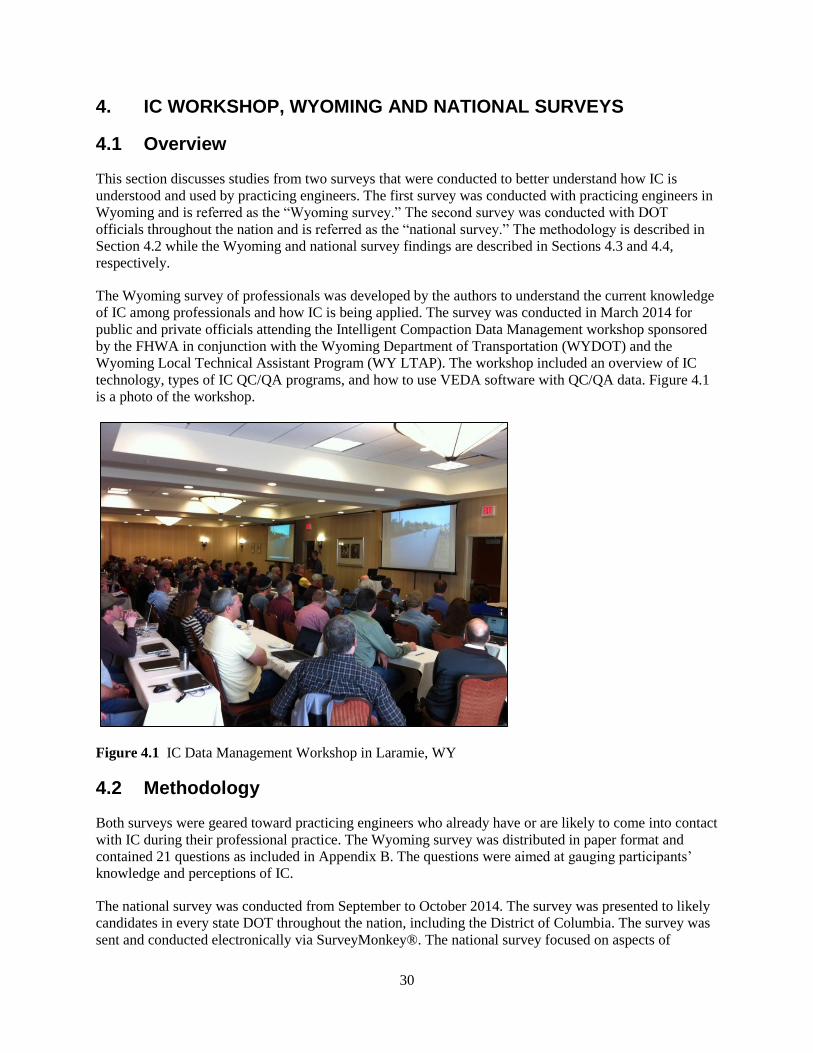
30
4. IC WORKSHOP, WYOMING AND NATIONAL SURVEYS
4.1 Overview
This section discusses studies from two surveys that were conducted to better understand how IC is
understood and used by practicing engineers. The first survey was conducted with practicing engineers in
Wyoming and is referred as the “Wyoming survey.” The second survey was conducted with DOT
officials throughout the nation and is referred as the “national survey.” The methodology is described in
Section 4.2 while the Wyoming and national survey findings are described in Sections 4.3 and 4.4,
respectively.
The Wyoming survey of professionals was developed by the authors to understand the current knowledge
of IC among professionals and how IC is being applied. The survey was conducted in March 2014 for
public and private officials attending the Intelligent Compaction Data Management workshop sponsored
by the FHWA in conjunction with the Wyoming Department of Transportation (WYDOT) and the
Wyoming Local Technical Assistant Program (WY LTAP). The workshop included an overview of IC
technology, types of IC QC/QA programs, and how to use VEDA software with QC/QA data. Figure 4.1
is a photo of the workshop.
Figure 4.1 IC Data Management Workshop in Laramie, WY
4.2 Methodology
Both surveys were geared toward practicing engineers who already have or are likely to come into contact
with IC during their professional practice. The Wyoming survey was distributed in paper format and
contained 21 questions as included in Appendix B. The questions were aimed at gauging participants’
knowledge and perceptions of IC.
The national survey was conducted from September to October 2014. The survey was presented to likely
candidates in every state DOT throughout the nation, including the District of Columbia. The survey was
sent and conducted electronically via SurveyMonkey®. The national survey focused on aspects of

31
practice as several DOTs have had experienced performing IC projects in their respective states. The
survey asked about participants’ knowledge of IC, current QC/QA methods, usage of IC, drafted QC/QA
specifications for IC, and cost data for IC. The survey was structured to allow applicants to answer
questions that were applicable to their level of experience with IC. For example, a person responding that
they had not conducted IC demonstrations project in their state were not asked technical questions about
the results from IC demonstrations. Therefore, the survey ranged from nine questions to 18 questions
based on a person’s responses. A sample of the national survey with total 18 questions is included in
Appendix C
4.3 Wyoming Survey Results
The objective of the Wyoming survey was to understand how much knowledge private and public
professionals practicing in Wyoming have about IC. The survey questioned respondents about their
familiarity with IC, technical knowledge they may have, perceptions of IC, and their opinion about IC’s
future role in Wyoming. There were 79 total respondents, of which 69 were employed by WYDOT, seven
by private firms, and three by local governments. Results for every question are located in Appendix B.
The survey results revealed that respondents were receptive to the idea of intelligent compaction but had a
limited knowledge of and concerns about IC. Fifty-one percent of respondents said that they had heard of
IC prior to the workshop. Figure 4.2 contains what respondents considered their primary sources of
information about IC. A majority of respondents indicated that the FHWA was a primary source of
information, which is considered a result of FHWA’s promotion of IC and the prompting of respondents
to learn about IC leading up to the FHWA-sponsored workshop. One respondent indicated in a later
section that his agency owns an IC roller for use in landfill construction. None of the other 78 respondents
had experience with IC rollers; however, 13 respondents noted interest in utilizing one for their company
or agency.
Figure 4.2 Results for Primary Source of IC Information from Wyoming Survey
The lack of experience with IC rollers was indicated by the respondents’ desire to conduct a field
demonstration. The highest percent of responses with familiarity of aspects to any single aspect of IC in
Question 6 was 42%. Of the respondents, 58% indicated that a field demonstration would help them learn
0%
10%
20%
30%
40%
50%
60%
FH
WA
repre
senta
tives
or
publi
cati
ons
Aca
dem
ic
journ
als
Pro
fess
ional
soci
ety
new
slet
ters
Contr
acto
rs
Inte
rnet
rese
arch
None
of
the
above
What is your primary source of information for learning about
intelligent compaction? [Select all that apply]
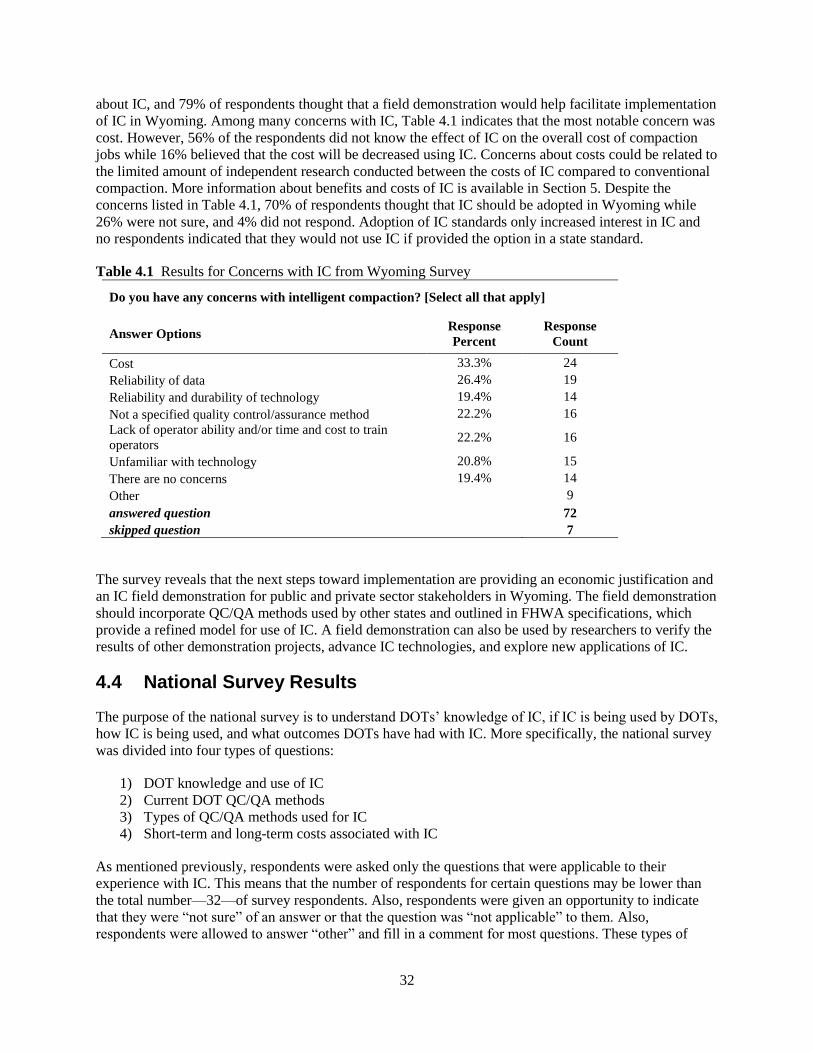
32
about IC, and 79% of respondents thought that a field demonstration would help facilitate implementation
of IC in Wyoming. Among many concerns with IC, Table 4.1 indicates that the most notable concern was
cost. However, 56% of the respondents did not know the effect of IC on the overall cost of compaction
jobs while 16% believed that the cost will be decreased using IC. Concerns about costs could be related to
the limited amount of independent research conducted between the costs of IC compared to conventional
compaction. More information about benefits and costs of IC is available in Section 5. Despite the
concerns listed in Table 4.1, 70% of respondents thought that IC should be adopted in Wyoming while
26% were not sure, and 4% did not respond. Adoption of IC standards only increased interest in IC and
no respondents indicated that they would not use IC if provided the option in a state standard.
Table 4.1 Results for Concerns with IC from Wyoming Survey
Do you have any concerns with intelligent compaction? [Select all that apply]
Answer Options Response
Percent
Response
Count
Cost 33.3% 24
Reliability of data 26.4% 19
Reliability and durability of technology 19.4% 14
Not a specified quality control/assurance method 22.2% 16
Lack of operator ability and/or time and cost to train
operators 22.2% 16
Unfamiliar with technology 20.8% 15
There are no concerns 19.4% 14
Other 9
answered question 72
skipped question 7
The survey reveals that the next steps toward implementation are providing an economic justification and
an IC field demonstration for public and private sector stakeholders in Wyoming. The field demonstration
should incorporate QC/QA methods used by other states and outlined in FHWA specifications, which
provide a refined model for use of IC. A field demonstration can also be used by researchers to verify the
results of other demonstration projects, advance IC technologies, and explore new applications of IC.
4.4 National Survey Results
The purpose of the national survey is to understand DOTs’ knowledge of IC, if IC is being used by DOTs,
how IC is being used, and what outcomes DOTs have had with IC. More specifically, the national survey
was divided into four types of questions:
1) DOT knowledge and use of IC
2) Current DOT QC/QA methods
3) Types of QC/QA methods used for IC
4) Short-term and long-term costs associated with IC
As mentioned previously, respondents were asked only the questions that were applicable to their
experience with IC. This means that the number of respondents for certain questions may be lower than
the total number—32—of survey respondents. Also, respondents were given an opportunity to indicate
that they were “not sure” of an answer or that the question was “not applicable” to them. Also,
respondents were allowed to answer “other” and fill in a comment for most questions. These types of

33
responses are indicated during the discussion of each question where they are considered pertinent
information. Results for each question are located in Appendix C. Figure 4.3 displays the state DOTs that
responded to the survey shaded in gray.
Figure 4.3 Map of State DOT Respondents Shaded in Gray
4.4.1 DOT Knowledge and Use of IC
Four questions in the survey were presented to understand where DOT representatives receive their
information about IC (Question 2), the aspects of IC that they are familiar with (Question 3), concerns
about IC (Question 4), and the number of IC demonstrations conducted (Question 7). The results for
Question 2 are listed in Table 4.2. The highest number of responses was for “FHWA representatives or
publications.” This is most likely due to the funding of workshops for state DOTs by the FHWA. Also,
four respondents that choose the “other” option specifically specified that the pooled fund projects
sponsored by the FHWA were a source of information. The results from this question emphasize
FHWA’s vital role in promoting IC, where it may have been a collective action problem for states to
otherwise undertake individually.
Results for Question 3 are listed in Table 4.3. The responses reveal that the technology as well as the
operation of rollers is fairly well understood by the respondents. QC/QA standards and costs and benefits
of IC are less well understood. The lower response rate for QC/QA standards can be related to the types
of demonstration projects that have occurred in several states. Many states have opted to demonstrate the
ability of IC rollers to document roller passes and provide information but not necessarily act as a QC/QA
tool. The benefit from using IC rollers for this purpose lies in their ability to reduce the amount of time a
roller is operating by avoiding redundant passes and providing a more orderly visual representation of
rolling pattern to the operator. Also, operation of rollers and roller technology can be more readily
understood by reading literature on performance and case studies; however, it may be more difficult for
those DOTs that haven’t had demonstration projects to understand the costs and QC/QA aspects of IC.

34
Table 4.2 Primary Source of Information for Learning IC (Results for Question 2)
What is your primary source of information for learning about intelligent compaction?
[Select all that apply]
Answer Options Response
Percent
Response
Count
FHWA representatives or publications 90.3% 28
Academic journals 19.4% 6
Professional society newsletters 3.2% 1
Contractors 19.4% 6
Internet research 35.5% 11
None of the above 6.5% 2
Other (please specify) 11
answered question 31
skipped question 1
Table 4.3 Aspects of IC Familiarity (Results for Question 3)
Which aspects of intelligent compaction is your agency familiar with? [Select all that
apply]
Answer Options Response
Percent
Response
Count
Operation of intelligent compaction rollers 76.7% 23
Technology used during intelligent compaction 90.0% 27
Cost and benefits 50.0% 15
Quality Control and Assurance Standards 56.7% 17
None of the above 6.7% 2
Other (please specify) 5
answered question 30
skipped question 2
Question 4 gauges concerns of DOTs with IC, which are listed in Table 4.3. The two largest concerns
dealt with policymaker approval for quality assurance and lack of staff knowledge to confirm data. The
first concern may be due to the recent introduction of IC as a tool for QC/QA, which was
comprehensively documented for soils by Mooney, et al. (2010) and for asphalt by Chang, et al. (2011).
As indicated by the responses to Question 7, several states are still being introduced to IC with 11 out of
32 respondents indicating that their state has held multiple IC demonstrations and 12 have conducted only
one demonstration. The low number of states with experience using IC on multiple occasions can also
explain the lack of staff knowledge. When a demonstration project does occur, FHWA representatives
and roller manufacturers are training a limited number of DOT officials on how to use the IC. FHWA has
sponsored Intelligent Compaction Data Management classes in more than 30 states in order to increase
staff knowledge about how to use IC for QC/QA; however, that knowledge must be practiced using first-
hand data. It is expected that DOT staff knowledge will increase as more demonstration projects occur
and IC adoption becomes more prevalent. It is worth noting that four respondents selecting “other” had
concerns with ICMV correlations to conventional tests. This is a valid concern, and considerations about
site conditions and historical correlation values must be taken into account when applying IC to a given
road section. This is discussed in more detail in Section 2.3.

35
Table 4.3. Concerns with Using IC (Results for Question 4)
Does your agency have any concerns with the use of intelligent compaction for soil or
pavement materials? [Select all that apply]
Answer Options Response
Percent
Response
Count
There are no concerns 10.3% 3
Cost 31.0% 9
Reliability of data 34.5% 10
Ability to have it approved as a quality assurance
technique by policymakers 41.4% 12
Less strict than current quality assurance methods 17.2% 5
Lack of staff knowledge to confirm data 41.4% 12
Unfamiliar with technology 20.7% 6
Other (please specify) 11
answered question 29
skipped question 3
4.4.2 Current DOT QC/QA Methods
This section of the survey contained two questions: QC/QA methods for subgrade, subbase, and base
(Question 5); and QC/QA methods used for pavement (Question 6). Figure 4.4 contains the responses for
Question 5 and Figure 4.5 for Question 6.
All respondents except one indicated that they use nuclear gauge for QC/QA. Proctor tests were the next
more common followed by sand cone tests. Nuclear gauge and core sampling were the most common
methods used for QC/QA on pavements. Three respondents, Alaska, Indiana, and Texas, indicated that IC
can be used for QC/QA for soils. Two of those respondents, Indiana and Texas, indicated the use of IC for
QC/QA on pavements as well. Refer to Section 2.7 for soils and Section 3.7 for pavements for more
information about IC QC/QA specifications.

36
Figure 4.4 Methods for QC/QA of Subgrade, Subbase, and Base Layers (Results for Question 5)
Figure 4.5 Methods for QC/QA of Pavement Materials (Results for Question 6)
0%10%20%30%40%50%60%70%80%90%
100%N
ucl
ear
Gau
ge
No
n-n
ucl
ear
Gau
ge
/ E
lect
ric
Den
sity
Gau
ge
LW
D (
Lig
ht
wei
gh
t
def
lect
om
eter
)
DC
P (
Dy
nam
ic
cone
pen
etro
met
er)
CB
R (
Cal
ifo
rnia
bea
ring
rat
io)
Pro
cto
r te
sts
San
d C
one
test
Inte
llig
ent
Com
pac
tio
n
What method does your agency require for quality control and
quality assurance of roadway compaction of subgrade, subbase,
and base layers? [Select all that apply]
0%
10%
20%
30%
40%
50%
60%
70%
80%
90%
100%
Nuclear Gauge Non-Nuclear
Gauge / Electric
Density Gauge
Core Sampling Intelligent
Compaction
What method does your agency require for quality control and
quality assurance of roadway compaction of pavement materials?
[Select all that apply]
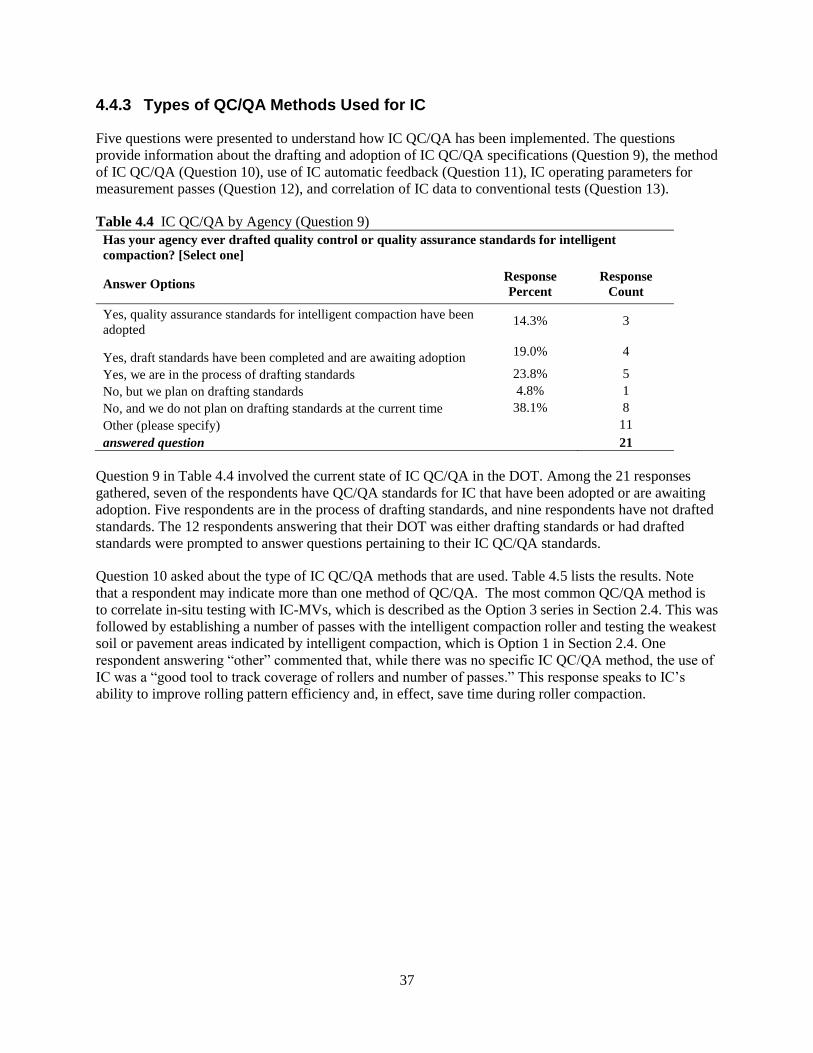
37
4.4.3 Types of QC/QA Methods Used for IC
Five questions were presented to understand how IC QC/QA has been implemented. The questions
provide information about the drafting and adoption of IC QC/QA specifications (Question 9), the method
of IC QC/QA (Question 10), use of IC automatic feedback (Question 11), IC operating parameters for
measurement passes (Question 12), and correlation of IC data to conventional tests (Question 13).
Table 4.4 IC QC/QA by Agency (Question 9)
Has your agency ever drafted quality control or quality assurance standards for intelligent
compaction? [Select one]
Answer Options Response
Percent
Response
Count
Yes, quality assurance standards for intelligent compaction have been
adopted 14.3% 3
Yes, draft standards have been completed and are awaiting adoption 19.0% 4
Yes, we are in the process of drafting standards 23.8% 5
No, but we plan on drafting standards 4.8% 1
No, and we do not plan on drafting standards at the current time 38.1% 8
Other (please specify) 11
answered question 21
Question 9 in Table 4.4 involved the current state of IC QC/QA in the DOT. Among the 21 responses
gathered, seven of the respondents have QC/QA standards for IC that have been adopted or are awaiting
adoption. Five respondents are in the process of drafting standards, and nine respondents have not drafted
standards. The 12 respondents answering that their DOT was either drafting standards or had drafted
standards were prompted to answer questions pertaining to their IC QC/QA standards.
Question 10 asked about the type of IC QC/QA methods that are used. Table 4.5 lists the results. Note
that a respondent may indicate more than one method of QC/QA. The most common QC/QA method is
to correlate in-situ testing with IC-MVs, which is described as the Option 3 series in Section 2.4. This was
followed by establishing a number of passes with the intelligent compaction roller and testing the weakest
soil or pavement areas indicated by intelligent compaction, which is Option 1 in Section 2.4. One
respondent answering “other” commented that, while there was no specific IC QC/QA method, the use of
IC was a “good tool to track coverage of rollers and number of passes.” This response speaks to IC’s
ability to improve rolling pattern efficiency and, in effect, save time during roller compaction.

38
Table 4.5 IC QC/QA Methods for Compaction (Results for Question 10)
If your agency has or is drafting quality control or quality assurance standards for intelligent
compaction, what quality control or quality assurance methods does you agency utilize for intelligent
compaction? [Select all that apply]
Answer Options Response
Percent
Response
Count
Number of passes with intelligent compaction roller 41.2% 7
Testing weak soil / pavement areas indicated by intelligent compaction roller 41.2% 7
Percent difference of compaction values from intelligent compaction roller
within a given area / uniformity testing 11.8% 2
Correlation of in-situ testing with intelligent compaction values 58.8% 10
Not sure 17.6% 3
Other (please specify) 29.4% 5
When asked in Question 11 about whether auto feedback was allowed during measurement passes, the
largest response was “No.” These responses are in line with recommendations from NCHRP Report 676,
which does not recommend auto feedback to occur while performing a measurement pass. Table 4.6 lists
the responses.
Table 4.6 Automatic Feedback Use (Question 11)
If your agency has or is drafting quality assurance standards for intelligent
compaction, does your agency allow for automatic feedback to adjust compaction
parameters during compaction? [Select one]
Answer Options Response
Percent
Response
Count
Yes, but it is not required 11.8% 2
Yes, and it is required 17.6% 3
No 35.3% 6
Not Sure 35.3% 6
Question 12 involved the requirements for operating parameters for measurement passes. NCHRP Report
676 recommends constant amplitude and frequency during measurement passes in order to increase MV
accuracy; however, only three respondents explicitly indicated those parameters for measurement passes.
Other responses can also encompass constant amplitude and frequency parameters, but that decision may
be left up to a project manager or roller operator. This may occur due to lack of knowledge about MV
accuracy due to operating parameters or a reliance on construction teams to carry out IC data retrieval.
The responses for Question 12 are listed in Table 4.7.
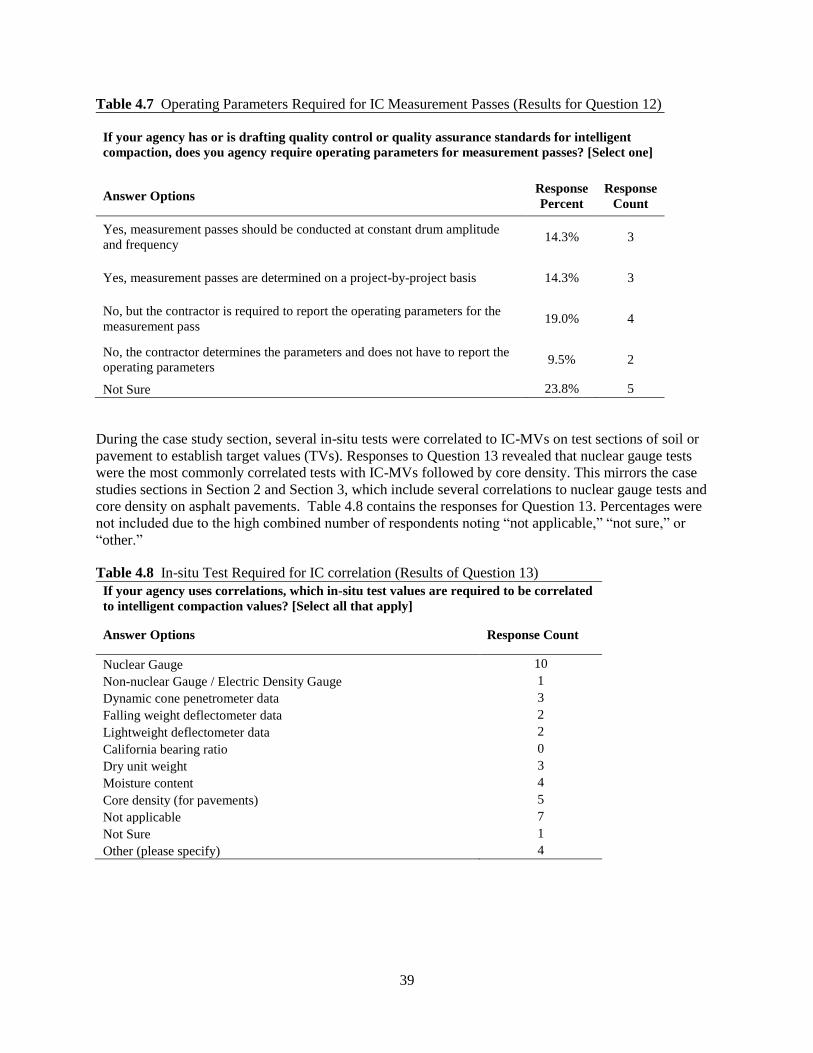
39
Table 4.7 Operating Parameters Required for IC Measurement Passes (Results for Question 12)
If your agency has or is drafting quality control or quality assurance standards for intelligent
compaction, does you agency require operating parameters for measurement passes? [Select one]
Answer Options Response
Percent
Response
Count
Yes, measurement passes should be conducted at constant drum amplitude
and frequency 14.3% 3
Yes, measurement passes are determined on a project-by-project basis 14.3% 3
No, but the contractor is required to report the operating parameters for the
measurement pass 19.0% 4
No, the contractor determines the parameters and does not have to report the
operating parameters 9.5% 2
Not Sure 23.8% 5
During the case study section, several in-situ tests were correlated to IC-MVs on test sections of soil or
pavement to establish target values (TVs). Responses to Question 13 revealed that nuclear gauge tests
were the most commonly correlated tests with IC-MVs followed by core density. This mirrors the case
studies sections in Section 2 and Section 3, which include several correlations to nuclear gauge tests and
core density on asphalt pavements. Table 4.8 contains the responses for Question 13. Percentages were
not included due to the high combined number of respondents noting “not applicable,” “not sure,” or
“other.”
Table 4.8 In-situ Test Required for IC correlation (Results of Question 13)
If your agency uses correlations, which in-situ test values are required to be correlated
to intelligent compaction values? [Select all that apply]
Answer Options Response Count
Nuclear Gauge 10
Non-nuclear Gauge / Electric Density Gauge 1
Dynamic cone penetrometer data 3
Falling weight deflectometer data 2
Lightweight deflectometer data 2
California bearing ratio 0
Dry unit weight 3
Moisture content 4
Core density (for pavements) 5
Not applicable 7
Not Sure 1
Other (please specify) 4

40
4.4.4 Short-term and Long-term Costs Associated with IC
The survey contained three questions related to benefits and costs on a short-term basis (Question 15) and
a long-term basis (Question 16 and Question 17). All the respondents that answered Question 15
indicated that bid or in-house compaction costs increase due to the use of intelligent compaction. These
responses are listed in Table 4.9. Twenty-two of the 32 respondents indicated that they were “not sure”
about the short-term costs or that the question was “not applicable” to them. Of these 22 respondents, 18
had conducted no more than one demonstration project and one respondent was “not sure” how many
demonstration projects had been conducted. While several DOTs have conducted IC demonstrations,
these demonstrations are often conducted with the financial support of the FHWA. Cost data are not
necessarily collected or analyzed after a demonstration, especially during the first demonstration projects
where the goal is to introduce DOT officials to IC technology. Conversely, eight of the 10 respondents
indicating an increase in short-term costs had conducted more than one demonstration, and the other two
respondents had conducted one demonstration project.
Table 4.9 Changes in Costs Utilizing IC (Results for Question 15)
What changes in bid costs or in-house costs does your agency incur with compaction
services utilizing intelligent compaction? [Select one]
Answer Options Response
Percent
Response
Count
An increase in cost 31.3% 10
About the same cost 0.0% 0
A decrease in cost 0.0% 0
Not sure 34.4% 11
Not applicable 34.4% 11
answered question 32
skipped question 0
Section 5 contains an analysis of short-term costs and demonstrates that there is a reduction in cost when
using IC. This is due to the decreased amount of QC/QA in-situ testing required and time savings from
more efficient roller patterns. It is noted that these are under conditions where roller operators have been
trained to use IC equipment, technicians are trained to efficiently perform QC/QA, and engineers
understand how to analyze QC/QA data. Demonstration projects, especially the initial projects, are
expected to hold an increased cost due to the training requirements associated with IC technology.
Long-term benefit and cost data were less available with only three respondents—from Alaska, Texas,
and Utah—indicating that they had information (Question 16). Of these respondents, the respondent from
Texas, who noted that Texas DOT had conducted eight IC projects in the past six years, indicated with a
qualitative response that IC projects had “higher benefits than costs.” The sample size of this single
response is too low to be conclusive, but it does support the conclusions in Section 5 that long-term
benefits of IC are higher than the costs. On the other hand, nine respondents, who do not have the long-
term cost data, are planning to assess the long-term cost benefit of IC or eager to obtain this information
from other independent agencies.

41
5. ECONOMIC ANALYSIS
The FHWA has cited reduced construction and maintenance costs as a feature of IC rollers (Federal
Highway Administration, 2011); however, limited benefit-cost data are available to validate this claim.
This is echoed by Wyoming professionals, who indicated that the cost of IC was their largest concern, and
state DOTs, which responded that cost was a concern. To address the prominent concern of cost, a
framework for a benefit-cost analysis was developed based on costs for construction of a roadway and
savings from improved compaction uniformity over the pavement lifecycle. The framework is illustrated
using two case studies: a thick (2- to 4-inch) asphalt overlay, and a new roadway section that includes soil
and pavement layer compaction. The methodology to obtain cost data includes two specific cost cycles:
construction and roadway life. Definitions for each cycle are included in Section 5.1.1. The summation of
the cycle costs are to be compared between two compaction methods: conventional compaction and
testing versus IC compaction. Sensitivity analysis is also provided for each case study in order to further
analyze costs where there are few data points for inputs.
5.1 Methodology
The methodology used for analysis takes into account construction costs and roadway lifecycle costs as
two separate time periods. Definitions for the time periods and compaction types are presented first. The
framework for analyzing the differences between the conventional and intelligent compaction types is
then presented for each time period.
5.1.1 Definitions
The definitions below provide an outline for types of costs that would be defined within each time period
and type of compaction.
Construction Cycle Cost: The construction cycle includes the time period that begins with the
preparations for conducting roadway compaction. This encompasses the costs for rollers, labor to operate
the rollers, and conducting QC/QA testing.
Roadway Lifecycle Cost: The roadway lifecycle means the expected service life of the roadway. The
costs per year for conventional compaction and IC are calculated based on the capital cost of the roadway
improvement divided by the service life of the roadway in years. Pavement maintenance costs are not
considered because the type of maintenance is highly dependent on the transportation agency and
roadway characteristics.
Conventional Compaction and Testing: Conventional compaction means any method of compaction used
by contractors to perform roadway compaction and subsequent QC/QA methods that do not use a roller
equipped with on-board stiffness or density measuring devices. QC/QA data are obtained by in-situ field
tests.
IC Compaction: IC compaction means the compaction of a roadway section by use of a device, such as
one defined in the FHWA QC/QA sample specifications for IC, attached to a roller that allows for the
measurement of soil stiffness. Generally, this includes the use of an accelerometer, GPS unit, and on-
board computer to aid roller operators in compaction efforts. QC/QA data are obtained from the roller and
is analyzed by a QC/QA technician or engineer (Federal Highway Administration, 2014).

42
5.1.2 Framework
The comparison between the two compaction methods comprises a summation of the costs from the two
cost cycles over similar construction lengths and roadway lifecycles. The summed costs for each time
period are compared to each other independently. In order to illustrate the framework, a project type and
size must be chosen. The first case study, described in Section 5.2, is a project with a thick, one-lane mile
asphalt overlay. The second case study, described in Section 5.5, is a new construction of a one-lane mile
section, which includes subgrade compaction. This framework not only can be applied to new road
construction but also can be applied to different types of roadway improvements, including
reconstructions, so long as the data for each type of improvement are gathered and used accordingly.
The calculation of costs is based on QC/QA Option 3a when using IC, which is described in Section 2.
Option 3a was used for this analysis because it is the most commonly implemented QC/QA option based
on responses from DOTs as listed in Table 4.4 within Section 4.4.3. Cost differences between compaction
methods using QC/QA Option 1 can be taken from Figure 5.6 in Section 5.3.
Construction Cycle: Construction costs regarding roller equipment and labor for conventional
compaction are gathered using pricing data from contractors. The costs are set as an hourly rate so that
they can be used for different types of projects if necessary. A rate of compaction for construction crews
can also be obtained from the contractors. The rate should yield an area per unit time period, for example,
6,000 square feet per hour. This allows for calculation of the amount of time that it would take a
construction crew to complete the type of work that is being analyzed. This amount of time is then
multiplied by the roller equipment and labor costs for each type of compaction as illustrated by Equation
5.1.
Construction Cost = (Compaction Time in Hours) × [(Roller Cost per Hour) + (Roller Operator
Cost per Hour) + (GPS Cost per Hour)] + [(QC/QA Cost per Area) × (Area)] (5.1)
Construction costs for IC were calculated based on a reduced amount of time to perform roller operations
and the cost of an IC roller. The IC roller cost may be available from contractors, but if it is not, it should
be obtained from IC roller manufacturers. The roller manufacturer chosen for a specific analysis should
be based on similarities to the conventional roller used, such as setup (drum roller number and type),
weight, and vibratory characteristics. In order to calculate the number of hours for compaction using IC, a
30% reduction in the number of hours it would take a conventional roller is applied, which is given by
Equation 5.2. The reduction was based on the number of roller passes from IC rollers compared with
conventional rollers to perform similar compaction work as observed by Briaud and Seo (Briaud & Seo,
2003). The test section area, used for QC/QA purposes, must be added into the amount of time needed for
compaction using the IC roller. The total time required for compaction of the test area and the roadway
section is then multiplied by the hourly rates for labor and equipment to obtain the cost as demonstrated
in Equation 5.3.
IC Hours = (Conventional Compaction Hours for Roadway Section + Conventional
Compaction Hours for Test Section) × (100% – IC Efficiency %) (5.2)
Cost per Line Item = (Hourly Rate of Line Item Cost) × (Hours) (5.3)

43
Conventional Compaction Intelligent Compaction
Figure 5.1 Flow Chart for Calculating Compaction Cost
The QC/QA program costs are also part of the total construction cost. The information for conventional
compaction and testing can be obtained by surveying contractors on their costs related to QC/QA.
Contractors may provide this information with equipment and labor costs separated or combined. The
costs will be in either an hourly or unit area rate, such as square feet. In order to calculate the QC/QA
program costs from hours, the rate of QC/QA performance must be converted using a time per unit
volume or area as given by Equation 5.4. The calculated unit volume or unit area can then be converted
into a total cost based on the size of the roadway being analyzed. The cost for the QC/QA program for
intelligent compaction is then multiplied by the test section area divided by the total project area. QC/QA
is provided on the test section area in order to correlate MVs with conventional testing methods, such as
nuclear gauge or core sampling. The area used can vary depending on the project but is often between 300
to 600 feet (Mooney, et al., 2010) and several DOT IC specifications (The Transtec Group, Inc, 2014).
Figure 5.1 is a flow chart for calculating the cost of each type of compaction based on the equations and
description of calculations.
Number of Hours of
Conventional Compaction Number of Hours of
Conventional Compaction
+ Hours to Compact
Test Section) ×
(100% – IC
Efficiency %)
(Eqn. 5.2)
Multiply (Eqn. 5.3)
Line Item Cost Per Hour
Roller Operator Line Item Cost Per Hour
Roller Operator GPS
Add Add
QC/QA Cost based on
roadway area (Eqn. 5.4) QC/QA Cost based on test
section area (Eqn. 5.4)
Cost of Conventional
Compaction Cost of Intelligent
Compaction
Multiply (Eqn. 5.3)

44
QC/QA Cost = (Hours to perform QC/QA) × (Area of QC/QA per hour) × (Cost of QC/QA
per area) (5.4)
Roadway Lifecycle: One of the largest benefits provided by IC is that it provides a more uniform
compaction. Uniformity translates into an extended pavement life. In order to calculate the benefit from
using IC, the cost per lane mile for a thick asphalt overlay was divided by the remaining service life
improvement to the roadway as noted in Equation 5.5. The average cost per lane mile and remaining
service life improvement should be obtained from a state DOT or local municipality. The increase in
remaining service life from IC is 2.6 times (260%) the conventional compaction method based on Chang,
et al. (Chang, et al., 2012). This is due to an increase in fatigue life, where pavement fatigue from loading
is assumed to be the cause of most roadway failures.
Cost per lane-mile per year = (Cost of Roadway per Lane-Mile) / (Service Life in Years) (5.5)
5.2 Case Study No. 1: Pavement Analysis
The cost comparison between the two compaction methods comprises a summation of the costs from the
two cost cycles over similar construction lengths and roadway lifecycles. To illustrate the application of
proposed benefit-cost analysis framework, a case study of a thick, one lane-mile overlay asphalt pavement
was presented. Table 5.1 contains the data inputs used for the analysis, which are discussed in more
details in the subsections.
5.2.1 Construction Cycle Data
The construction cycle costs for conventional compaction were gathered from a survey of contractors
performing compaction services in Wyoming. The data used were the cost of a roller, roller operator, and
GPS system per hour. These data were obtained from roller manufacturers, a phone survey of Wyoming
contractors, and GPS system providers (Jones, 2014; Bastian, 2014; Newman, 2014; Trimble Navigation
Limited, 2014). Also, QC/QA data were based on local contractor information (Bastian, 2014). The
summation of these data was used to create a cost per lane mile for the construction of a 2- to 4-inch thick
asphalt overlay as given in Equation 5.1.
Where data were given in ranges, a value within the range was assumed in order to create comparable
data between the two compaction types. Also, the hourly rate for the roller operator was assumed to be the
same for each type of roller. The cost of intelligent compaction was then calculated using a 30% reduction
in the number of hours it would take a conventional roller. The reduction was based on the number of
roller passes from IC rollers compared with conventional rollers as observed by Briaud and Seo (2003).
The time to compact the 500-foot by 12-foot test section area for establishing MV correlational to
conventional compaction testing was added.
QC/QA costs for IC were reduced to the area of the test section required to calibrate conventional testing
methods with the IC’s measurement values. The cost of QC/QA testing was then multiplied by lineal feet
of the test section, 500 feet, divided by the lineal feet in a mile, 5,280 feet, which resulted in a multiplier
of 0.095. Equation 5.6 is the cost of QC/QA for IC based on the conventional compaction QC/QA cost.
This can also be described as the test section being 0.095 times the lineal length of one mile. Veda, a free
software program developed by the Minnesota Department of Transportation, allows for instantaneous
determination whether data comply with QC/QA standards. An initial expense to program QC/QA
compliance into the software and train QC/QA engineers to use the software are required; however, it
would not be a significant contributor to cost to a single project when averaged over several compaction
projects.
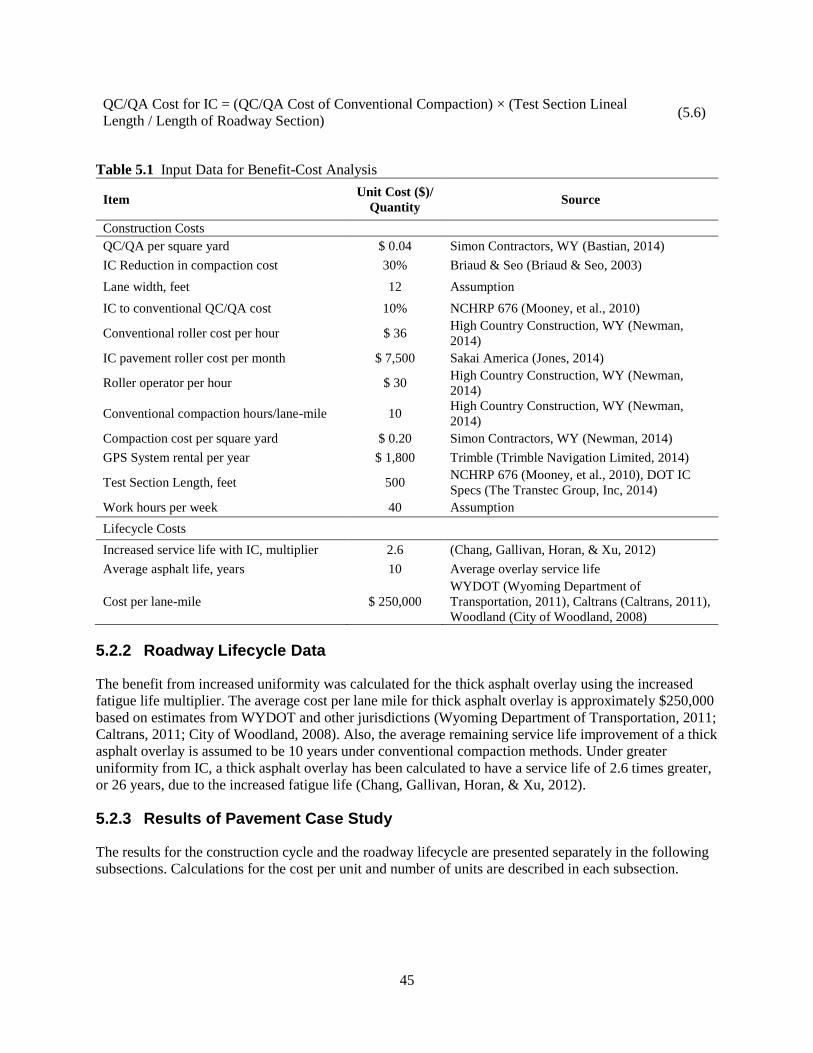
45
QC/QA Cost for IC = (QC/QA Cost of Conventional Compaction) × (Test Section Lineal
Length / Length of Roadway Section) (5.6)
Table 5.1 Input Data for Benefit-Cost Analysis
Item Unit Cost ($)/
Quantity Source
Construction Costs
QC/QA per square yard $ 0.04 Simon Contractors, WY (Bastian, 2014)
IC Reduction in compaction cost 30% Briaud & Seo (Briaud & Seo, 2003)
Lane width, feet 12 Assumption
IC to conventional QC/QA cost 10% NCHRP 676 (Mooney, et al., 2010)
Conventional roller cost per hour $ 36 High Country Construction, WY (Newman,
2014)
IC pavement roller cost per month $ 7,500 Sakai America (Jones, 2014)
Roller operator per hour $ 30 High Country Construction, WY (Newman,
2014)
Conventional compaction hours/lane-mile 10 High Country Construction, WY (Newman,
2014)
Compaction cost per square yard $ 0.20 Simon Contractors, WY (Newman, 2014)
GPS System rental per year $ 1,800 Trimble (Trimble Navigation Limited, 2014)
Test Section Length, feet 500 NCHRP 676 (Mooney, et al., 2010), DOT IC
Specs (The Transtec Group, Inc, 2014)
Work hours per week 40 Assumption
Lifecycle Costs
Increased service life with IC, multiplier 2.6 (Chang, Gallivan, Horan, & Xu, 2012)
Average asphalt life, years 10 Average overlay service life
Cost per lane-mile $ 250,000
WYDOT (Wyoming Department of
Transportation, 2011), Caltrans (Caltrans, 2011),
Woodland (City of Woodland, 2008)
5.2.2 Roadway Lifecycle Data
The benefit from increased uniformity was calculated for the thick asphalt overlay using the increased
fatigue life multiplier. The average cost per lane mile for thick asphalt overlay is approximately $250,000
based on estimates from WYDOT and other jurisdictions (Wyoming Department of Transportation, 2011;
Caltrans, 2011; City of Woodland, 2008). Also, the average remaining service life improvement of a thick
asphalt overlay is assumed to be 10 years under conventional compaction methods. Under greater
uniformity from IC, a thick asphalt overlay has been calculated to have a service life of 2.6 times greater,
or 26 years, due to the increased fatigue life (Chang, Gallivan, Horan, & Xu, 2012).
5.2.3 Results of Pavement Case Study
The results for the construction cycle and the roadway lifecycle are presented separately in the following
subsections. Calculations for the cost per unit and number of units are described in each subsection.
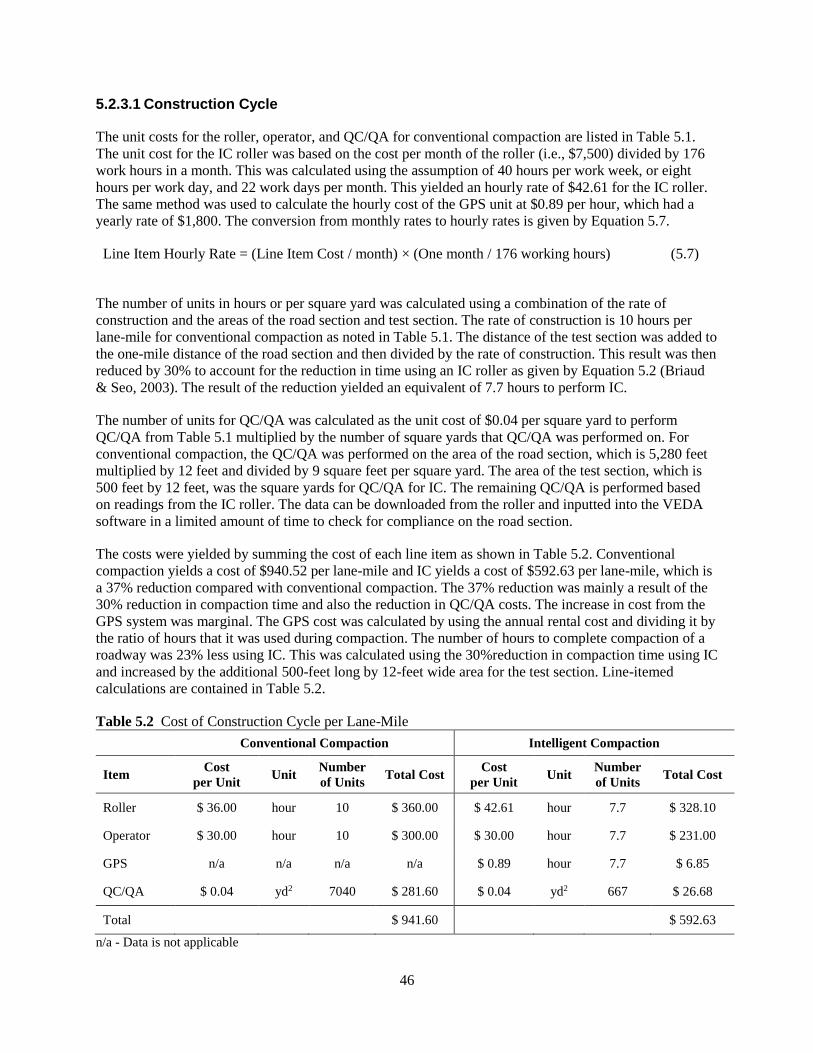
46
5.2.3.1 Construction Cycle
The unit costs for the roller, operator, and QC/QA for conventional compaction are listed in Table 5.1.
The unit cost for the IC roller was based on the cost per month of the roller (i.e., $7,500) divided by 176
work hours in a month. This was calculated using the assumption of 40 hours per work week, or eight
hours per work day, and 22 work days per month. This yielded an hourly rate of $42.61 for the IC roller.
The same method was used to calculate the hourly cost of the GPS unit at $0.89 per hour, which had a
yearly rate of $1,800. The conversion from monthly rates to hourly rates is given by Equation 5.7.
Line Item Hourly Rate = (Line Item Cost / month) × (One month / 176 working hours) (5.7)
The number of units in hours or per square yard was calculated using a combination of the rate of
construction and the areas of the road section and test section. The rate of construction is 10 hours per
lane-mile for conventional compaction as noted in Table 5.1. The distance of the test section was added to
the one-mile distance of the road section and then divided by the rate of construction. This result was then
reduced by 30% to account for the reduction in time using an IC roller as given by Equation 5.2 (Briaud
& Seo, 2003). The result of the reduction yielded an equivalent of 7.7 hours to perform IC.
The number of units for QC/QA was calculated as the unit cost of $0.04 per square yard to perform
QC/QA from Table 5.1 multiplied by the number of square yards that QC/QA was performed on. For
conventional compaction, the QC/QA was performed on the area of the road section, which is 5,280 feet
multiplied by 12 feet and divided by 9 square feet per square yard. The area of the test section, which is
500 feet by 12 feet, was the square yards for QC/QA for IC. The remaining QC/QA is performed based
on readings from the IC roller. The data can be downloaded from the roller and inputted into the VEDA
software in a limited amount of time to check for compliance on the road section.
The costs were yielded by summing the cost of each line item as shown in Table 5.2. Conventional
compaction yields a cost of $940.52 per lane-mile and IC yields a cost of $592.63 per lane-mile, which is
a 37% reduction compared with conventional compaction. The 37% reduction was mainly a result of the
30% reduction in compaction time and also the reduction in QC/QA costs. The increase in cost from the
GPS system was marginal. The GPS cost was calculated by using the annual rental cost and dividing it by
the ratio of hours that it was used during compaction. The number of hours to complete compaction of a
roadway was 23% less using IC. This was calculated using the 30%reduction in compaction time using IC
and increased by the additional 500-feet long by 12-feet wide area for the test section. Line-itemed
calculations are contained in Table 5.2.
Table 5.2 Cost of Construction Cycle per Lane-Mile
Conventional Compaction Intelligent Compaction
Item Cost
per Unit Unit
Number
of Units Total Cost
Cost
per Unit Unit
Number
of Units Total Cost
Roller $ 36.00 hour 10 $ 360.00 $ 42.61 hour 7.7 $ 328.10
Operator $ 30.00 hour 10 $ 300.00 $ 30.00 hour 7.7 $ 231.00
GPS n/a n/a n/a n/a $ 0.89 hour 7.7 $ 6.85
QC/QA $ 0.04 yd2 7040 $ 281.60 $ 0.04 yd2 667 $ 26.68
Total $ 941.60 $ 592.63
n/a - Data is not applicable

47
5.2.3.2 Roadway Lifecycle
The total cost of performing a thick, one lane-mile asphalt overlay was divided by the service life increase
from the improvement. The service life improvement using conventional compaction was noted as 10
years in Table 5.1. The total cost per lane-mile of $250,000 was divided by 10 years to yield the annual
cost for conventional compaction. The total cost was then divided by 26 years for IC, reflecting the 2.6
times of improved service life (Chang, Gallivan, Horan, & Xu, 2012). The annual costs were then
multiplied by 26 years for each conventional compaction and IC to demonstrate comparable costs during
the lifecycle of a one lane-mile road section using IC.
Table 5.3 contains the data used for each of the compaction types. Conventional compaction yielded 16
years less service life compared with IC. The cost savings for IC compared with conventional compaction
is $15,385 per year, or $400,000, when spread over the lifetime of an IC road section. The cost savings
using IC resulted from increased material uniformity.
Table 5.3 Roadway Lifecycle Costs per Lane-Mile for One Year and 26 Years
Compaction Type Service Life (years) Cost Per Year Cost Over 26 Years
Conventional 10 $ 25,000 $ 375,000
Intelligent 26 $ 9,615 $ 250,000
Difference -16 $ 15,385 $ 400,000
5.2.4 Sensitivity Analysis for Pavement Case Study
The results from the prior section demonstrate a cost savings by using IC in both the construction cycle
and the roadway lifecycle. These results were based on the inputs from Table 5.1. A sensitivity analysis
was performed on the pavement section analyzed in the prior sections in order to understand the effect of
variations in input values on the outcome of the economic analysis. Variations may be anticipated because
of the limited data that have been provided for inputs as well as different agencies in different regions.
The inputs included in this sensitivity analysis include a range of values for compaction efficiency, roller
cost, and the IC service life multiplier.
5.2.4.1 Compaction Efficiency
The compaction efficiency improvement for IC was provided at a rate of 30% based on work by Briaud
and Seo (2003). Beyond these authors’ work, very little has been done to summarize the efficiency
savings of IC. The sensitivity analysis for this section includes compaction efficiency for IC ranging from
negative 15% to 45%. The IC efficiency is plotted against the percent cost difference of conventional
compaction to IC in Figure 5.2. The remaining inputs were held constant at the values provided in Table
5.1. The results of the sensitivity analysis apply only to the construction cycle. For example, at the
previously selected IC efficiency of 30%, the percent cost difference is 37.1%, which is the difference in
total costs of $941.60 for conventional and $592.63 for IC as indicated in Table 5.2 and expressed in
percentage.
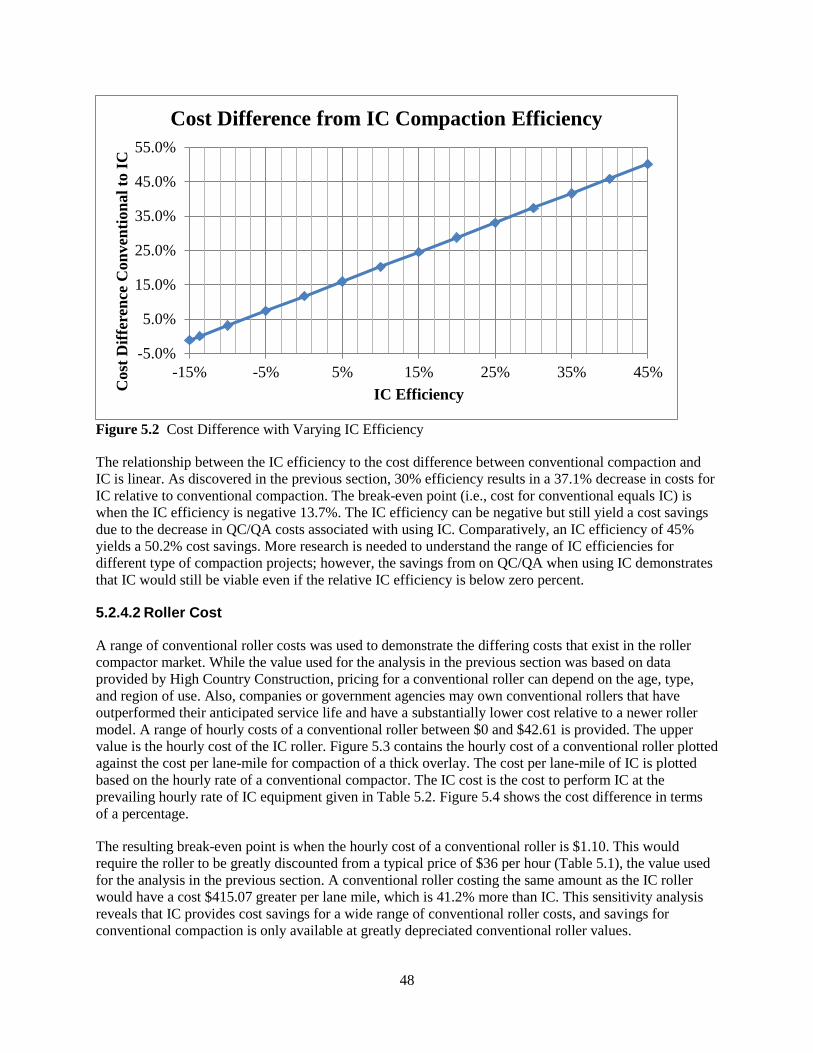
48
Figure 5.2 Cost Difference with Varying IC Efficiency
The relationship between the IC efficiency to the cost difference between conventional compaction and
IC is linear. As discovered in the previous section, 30% efficiency results in a 37.1% decrease in costs for
IC relative to conventional compaction. The break-even point (i.e., cost for conventional equals IC) is
when the IC efficiency is negative 13.7%. The IC efficiency can be negative but still yield a cost savings
due to the decrease in QC/QA costs associated with using IC. Comparatively, an IC efficiency of 45%
yields a 50.2% cost savings. More research is needed to understand the range of IC efficiencies for
different type of compaction projects; however, the savings from on QC/QA when using IC demonstrates
that IC would still be viable even if the relative IC efficiency is below zero percent.
5.2.4.2 Roller Cost
A range of conventional roller costs was used to demonstrate the differing costs that exist in the roller
compactor market. While the value used for the analysis in the previous section was based on data
provided by High Country Construction, pricing for a conventional roller can depend on the age, type,
and region of use. Also, companies or government agencies may own conventional rollers that have
outperformed their anticipated service life and have a substantially lower cost relative to a newer roller
model. A range of hourly costs of a conventional roller between $0 and $42.61 is provided. The upper
value is the hourly cost of the IC roller. Figure 5.3 contains the hourly cost of a conventional roller plotted
against the cost per lane-mile for compaction of a thick overlay. The cost per lane-mile of IC is plotted
based on the hourly rate of a conventional compactor. The IC cost is the cost to perform IC at the
prevailing hourly rate of IC equipment given in Table 5.2. Figure 5.4 shows the cost difference in terms
of a percentage.
The resulting break-even point is when the hourly cost of a conventional roller is $1.10. This would
require the roller to be greatly discounted from a typical price of $36 per hour (Table 5.1), the value used
for the analysis in the previous section. A conventional roller costing the same amount as the IC roller
would have a cost $415.07 greater per lane mile, which is 41.2% more than IC. This sensitivity analysis
reveals that IC provides cost savings for a wide range of conventional roller costs, and savings for
conventional compaction is only available at greatly depreciated conventional roller values.
-5.0%
5.0%
15.0%
25.0%
35.0%
45.0%
55.0%
-15% -5% 5% 15% 25% 35% 45%
Cost
Dif
fere
nce
Con
ven
tion
al
to I
C
IC Efficiency
Cost Difference from IC Compaction Efficiency

49
Figure 5.3 Cost Difference Based on Hourly Cost of Conventional Roller
Figure 5.4 Percent Cost Difference Based on Hourly Cost of Conventional Roller
$-
$200
$400
$600
$800
$1,000
$1,200
$- $10 $20 $30 $40 $50
Cost
per
Lan
e M
ile
Cost of Conventional Roller
Compaction Cost Based on Cost of
Conventional Roller
Conventional Compaction IC
-5%
0%
5%
10%
15%
20%
25%
30%
35%
40%
45%
$- $10 $20 $30 $40 $50Cost
per
Lan
e M
ile
Con
ven
tion
al
to I
C
Cost of Conventional Roller
Relative Compaction Cost Based on Cost
of Conventional Roller

50
5.2.4.3 Service Life Improvement from Using IC
Improved pavement quality from compaction uniformity using IC was assumed to result in 2.6 times the
service life of a conventionally compacted pavement section based on Chang, et al. (2012). Figure 5.5
shows the lifecycle cost savings based on a variety of service life multipliers from using IC. This
sensitivity analysis was performed due to the limited amount of research on increased service life from
using IC.
Figure 5.5 Lifecycle Cost Saving Based on Service Life Improvement from IC
The multiplier of 2.6 times the service life of a conventionally compacted pavement results in an annual
cost savings of $15,385 per lane mile as demonstrated earlier in this section. A multiplier of 3 results in
an annual cost savings of $16,667. A more conservative estimate for improved service life would be an
improvement of 1.5 times the service life of a conventionally compacted section. A 1.5-times
improvement results in an annual savings of $8,333, and annual cost savings decreases more rapidly as
the multiplier approaches one. Table 5.4 contains the data for a roadway section that has a service life
improvement of 1.5 times using IC.
Table 5.4 Roadway Lifecycle Costs per Lane-Mile for One Year and 15 Years
Compaction Type Service Life (years) Cost Per Year Cost Over 15 Years
Conventional 10 $ 25,000 $ 375,000
Intelligent 15 $ 16,667 $ 250,000
Difference -5 $ 8,333 $ 125,000
5.3 Case Study No. 2: New Roadway Construction
This case study examines the cost difference between compaction of a roadway section for both soil and
pavement layers for a lane mile using conventional compaction and IC. The methodology used is similar
to the methodology outlined in Section 5.1; however, there are two differences. The cost of rollers for soil
materials were used for corresponding soil layers and the calculation of hours to complete the compaction
was based on the speed of rollers. Speeds of three and eight miles per hour were used to demonstrate the
$-
$5,000
$10,000
$15,000
$20,000
1 1.5 2 2.5 3
An
nu
al
Cost
Dif
fere
nce
Per
Lan
e M
ile
Service Life Increase Multiplier Using IC
Annual Cost Difference Conventional to IC

51
difference in cost based on varying speeds, which were used in case studies (Mooney, et al., 2010). Table
5.5 lists the inputs used to calculate costs.
Table 5.6 contains the cost calculation per lane-mile of roadway based on the inputs and using the more
conservative speed of three miles per hour. In order to calculate the amount of time to compact the soil
and the pavement, the lane width divided by the roller width of 7 feet was rounded up to the nearest
whole number and multiplied by the number of passes and the length and finally divided by the speed as
given in Equation 5.8. The number of hours to perform compaction was then multiplied to the
corresponding hourly rate for the soil and pavement compactors. The operator, GPS, and QC/QA costs
were calculated similarly to the pavement case study.
Table 5.5 Inputs for Soil/Pavement Case Study
Construction Cycle
Item
Cost /
Quantity Source
QC / QA per square yard per layer $ 0.04 Simon Contractors, WY
IC Reduction in Compaction Cost 30% Briaud & Seo, 2003
Lane Width, feet 12 Assumption
IC to Conventional QC/QA cost 10% NCHRP 676 based on test section size
Conventional Soil Roller Cost per hour $ 34.03 Wagner Rents, Fort Collins, CO
Conventional Pavement Roller Cost per
hour $ 36.00 High Country Construction, WY
IC Soil Roller Cost per month $ 7,000 Sakai America
IC Pavement Roller Cost per month $ 7,500 Sakai America
Operator Cost per hour $ 30.00 High Country Construction, WY
Number of passes per layer 6 Assumption
Average Roller Speed (mph) 3 and 8 Assumption
Layer Thickness, inches (Subgrade/
subbase/ base/ binder/ surface)
8 / 8 / 8 / 4 /
2 Assumption
GPS System, per year $ 1,800.00 Trimble
Compaction Hours = [ROUNDUP TO INTEGER (Lane width / Roller Width)] × (Number of
passes) × (Roadway length) / (Roller speed) (5.8)

52
Table 5.6 Cost of Construction Cycle per Lane-Mile
Conventional Compaction Intelligent Compaction
Item
Cost per
Unit Unit
Number of
Units Total Cost Cost per Unit Unit
Number
of Units Total Cost
Soil Roller $ 34.03 hour 12.0 $ 408.41 $ 39.77 hour 9.2 $ 365.83
Pav. Roller $ 36.00 hour 8.0 $ 288.00 $ 42.61 hour 6.1 $ 261.31
Operator $ 30.00 hour 20.0 $ 600.00 $ 30.00 hour 15.3 $ 459.90
GPS - - - $ - $ 0.89 hour 15.3 $ 13.64
QC/QA $ 0.20 sq yd 7040 $ 1,408.00 $ 0.20 sq yd 667 $ 133.40
Total $ 2,704.41 $ 1,234.08
Compaction of the soil and pavement lanes for a lane mile at an average roller speed of three miles per
hour results in a $1,470.33 savings using IC, which is a 54.4% decrease compared with conventional
compaction. A sensitivity analysis was performed to demonstrate the cost savings at average roller speeds
of three and eight miles per hour. These values were plotted with the percent of in-situ QC/QA performed
on the roadway section versus the percentage of cost savings. Figure 5.6 depicts the results from the
sensitivity analysis. The analysis reveals that using IC is more cost effective for each speed and percent of
in-situ QC/QA performed except when 100% in-situ QC/QA is performed with a roller speed of eight
miles per hour.
Figure 5.6 also serves as a way to calculate cost differences using QC/QA Option 1 for IC. QC/QA
Option 1 requires testing the least compact areas, which are indicated by lower MVs, with conventional
testing methods. Acceptance is met when an established percentage of conventional tests are above the
required test result value. While there is not an established percentage of testing that must occur for
Option 1, Figure 5.6 can be used to understand the reduction in cost that occurs from a decrease in the
amount of conventional testing that is performed. For example, a reduction of conventional testing by
50% while using IC QC/QA Option 1 results in a cost savings of 28% assuming the roller speed is three
miles per hour.

53
Figure 5.6 Cost Saving by Amount of QC/QA performed
5.4 Summary
The following summarizes the benefit-cost analysis from this section:
1. A thick asphalt overlay on one lane-mile yields a 37% savings on compaction costs when using
IC versus conventional compaction;
2. Annual savings on a lane-mile’s value for a pavement compacted with IC is approximately
$15,000;
3. Sensitivity analysis for the thick overlay example demonstrated that a conventional roller would
have to have nearly no cost in order to be more cost effective than an IC roller; and
4. Compaction of a new roadway section using IC results in a 54% savings compared with
conventional compaction.
-10%
0%
10%
20%
30%
40%
50%
60%
70%
80%
0% 25% 50% 75% 100%Cost
Savin
gs
IC t
o C
on
ven
tion
al
Percent of QC/QA on Road Section Using IC
Cost Difference by Percent QC/QA During IC
Roller Speed 3 mph Roller Speed 8 mph

54
6. CONCLUSIONS AND RECOMMENDATIONS
Conclusions highlighting key points from the literature review, surveys, and economic analysis are noted.
Based on the information provided in the prior sections, conclusions and recommendations for
implementation of IC in Wyoming and future research needs are included in this section.
6.1 Conclusions
This paper examined IC technology, IC QC/QA methods, application of IC QC/QA methods by various
state DOTs, knowledge and perceptions of IC among practicing professionals, and the benefits and costs
of IC as related to construction and lifecycle time periods. Conclusions about these topics are summarized
as follows:
1. The FHWA is actively promoting IC as a tool to improve roadway quality and decrease roadway
related costs;
2. IC can provide 100% coverage of compaction where conventional methods currently provide less
than 1% coverage;
3. Roller manufacturers have formulas for calculating compaction values (MVs) that are unique to
their system, but they are generally mechanistic-based or harmonic-based calculations;
4. Correlations between in-situ tests and MVs are more reliable for soils and less reliable for asphalt,
but these values can be improved by multiple regression analysis and BE/FE analysis;
5. Most Wyoming professionals are supportive of implementation of IC, but there are concerns
about cost and the reliability of data;
6. Twelve of 21 respondents on the national survey indicated that they are drafting, have drafted, or
have adopted IC QC/QA specifications, and a majority of those respondents rely on correlations
between MVs and in-situ tests to perform QC/QA;
7. National survey respondents indicated that construction costs with IC currently involve an
increase in cost relative to conventional compaction;
8. IC, when used effectively, can produce a 37% decrease in construction costs based on a
hypothetical thick asphalt overlay on one lane-mile long roadway and a 54% decrease in costs on
a new roadway section; and
9. Improved pavement performance based on compaction uniformity using IC can yield
approximately $15,000 per lane-mile per year in cost savings.
6.2 Recommendations
6.2.1 Implementation of IC in Wyoming
Implementation of IC at the state level has already begun due to the efforts of the FHWA to promote IC
through its Every Day Counts initiative mentioned in Section 1.2. These efforts are bolstered by a body
of research and practice in Europe that have laid the foundation for IC throughout the world. Specifically,
implementation of IC in Wyoming unofficially began with the Intelligent Compaction Data Management
workshop held in March 2014. This FHWA-sponsored workshop allowed private and public sector
engineers, contractors, and other interested parties to learn about IC and understand QC/QA tools that can
be used to analyze field data from IC rollers. The next steps for implementation of IC in Wyoming
include:
1. Working with the FHWA and WYDOT to secure funding and a site for an IC demonstration
project;
55
2. Adapting IC QC/QA specifications to be used during the demonstration project as a special
provision;
3. Holding the demonstration project and inviting members from WYDOT, local governments, and
the private sector to observe the demonstration;
4. Analyzing QC/QA data from the demonstration project to evaluate the performance of the IC
roller with regard to its ability to ensure quality compaction;
5. Analyzing construction cost data and accounting for both training expenses and regularly
anticipated IC costs after training;
6. Beginning a monitoring program of the pavement section where the demonstration project took
place to obtain changes in pavement performance relative to conventionally compacted sections;
7. Preparing subsequent demonstration projects to confer with results from the first demonstration
project and to test for other applications of IC;
8. Drafting QC/QA standards for adoption by public agencies to promote the use of IC by
contractors if the demonstration projects prove that IC generates a net benefit;
9. Providing an incentive for contractors to adopt IC by establishing a monetary bonus structure for
a temporary time period to offset initial costs associated with training and creating economies of
scale with IC; and
10. Beginning IC QC/QA with Option 1, described in Section 2.4.2, in order to gain immediate
roadway compaction quality benefits from IC while using it as method to establish correlation
values in preparation for adoption of IC QC/QA Option 3a in the future.
6.2.2 Future Research Needs
Research has proven that IC can be used effectively given proper conditions. IC has demonstrated
sufficient correlations with soil measurements taking into account discretion necessary for certain job
sites. IC still requires further examination before it can be declared as a reliable tool for asphalt
compaction. Also, economic analysis data can be improved by incorporating analysis of real-world IC
projects and providing those data to academic and trade publications.
Reliability of IC data for compaction of soil and asphalt can be improved by incorporating various
methods. Several IC project reports have used multiple regression analysis to improve correlation values
between in-situ tests and MVs, but factors affecting the analysis may vary from project to project. An
analysis of the types of factors that affect correlation values would provide better guidance for QC/QA
engineers to improve the effectiveness of IC. Also, boundary element (BE) and finite element (FE)
methods can help improve MV accuracy by accounting for different underlying layer properties.
Literature on these approaches was published in 2013 and should be adapted for use in a demonstration
projects to evaluate their practical application (Mooney & Facas, 2013). These methods may also improve
the low correlation values that have been observed during asphalt case studies with the ability to make IC
more viable as a tool for asphalt compaction.
From an economic standpoint, more data about construction-related costs must be analyzed to understand
if real-world IC projects support the theoretical cost savings demonstrated in this paper. This requires that
training costs be identified and accounted for in order to obtain the true construction costs of IC relative to
conventional compaction. Also, pavement performance of existing roadway sections compacted with IC
should be compiled to understand how IC affects long-term pavement performance. The first IC projects
began approximately 10 years ago and any data regarding the pavement performance on those sections
can provide valuable insight into the long-term benefits of IC. Also, literature on the economics of IC can
be bolstered by starting a monitoring program of recent and new roadway sections constructed with IC.
Specifically, the roadway sections should be monitored for various pavement condition metrics and
compared to similar roadway sections that were compacted with conventional methods.

56
REFERENCES
Bastian, S. (2014, March 26). Simon Contractors: Phone Interview.
Beainy, F., Commuri, S., & Zaman, M. (2012). "Quality Assurance of Hot Mix Asphalt Pavements
Using." Journal of Construction Engineering and Management, 138(2), 178-187.
Briaud, J.-L., & Seo, J. (2003). Intelligent Compaction: Overview and Research Needs. College Station:
Texas A&M.
Caltrans. (2010). Standard Specifications. Sacramento: Department of Transportation, State of California.
Caltrans. (2011, December). 2011 State of the Pavement Report. Retrieved July 30, 2014, from
http://www.dot.ca.gov/hq/maint/Pavement/Pavement_Program/PDF/2011_SOP.pdf
Chang, G. K., Gallivan, V. L., Horan, R. D., & Xu, Q. (2012). "Influences of intelligent compaction
uniformity on pavement performances of hot mix asphalt." Construction and Building Materials,
30(1), 746-752.
Chang, G., Merritt, D., Xu, Q., Horan, B., White, D., Vennapusa, P., . . . Goldsmith, R. (2008). IC Field
Demonstration on Cohesive Subgrade, Stabilized Subgrade, and Flex Base, Texas Department of
Transportation Final Report. Washington, DC: Federal Highway Administration.
Chang, G., Xu, Q., & Rutledge, J. (2012). Intelligent Compaction: Quality Assurance for In-Place
Density Acceptance - Asphalt IC Demonstration in Utah. Washington, DC: Federal Highway
Administration.
Chang, G., Xu, Q., Rutledge, J., Horan, B., Michael, L., White, D., & Vennapusa, P. (2011). Accelerated
Implementation of Intelligent Compaction Technology for Embankment Subgrade Soils,
Aggregate Base, and Asphalt Pavement Materials - Final Report. Washington, DC: Federal
Highway Administration.
City of Woodland. (2008). Appendix C- Repair, Maintenance and Rehabilitation Techniques. Retrieved
July 24, 2014, from
http://www.cityofwoodland.org/civicax/filebank/blobdload.aspx?blobid=3813
Colorado Department of Transportation. (2013). 2011 Specifications Book - CDOT. Retrieved from
Colorado Department of Transportation:
http://www.coloradodot.info/business/designsupport/construction-specifications/2011-
Specs/2011-specs-book
Colorado Department of Transportation. (2013). Colorado Procedures (CP) - CDOT. Retrieved from
Colorado Department of Transportation:
http://www.coloradodot.info/business/designsupport/bulletins_manuals/field-materials-
manuals/2014-field-materials-manua/cp-10s
Dynapac. (2013). Dynapac - Rollers - Compaction control systems - Compaction meter. Retrieved August
18, 2013, from Dynapac: http://www.dynapac.com/en/Products/?cat=36&product=662
Facas, N. W., & Mooney, M. A. (2010). "Position Reporting of Data from Intelligent Compaction
Rollers." Journal of Testing and Evaluation, ASTM, Vol. 38 (No.1), 1-6.
57
Federal Highway Administration. (2011, April 4). Intelligent Compaction - Innovations - Highways for
LIFE - FHWA. (United States Department of Transportation) Retrieved April 18, 2014, from
https://www.fhwa.dot.gov/hfl/innovations/intelligentcompaction.cfm
Federal Highway Administration. (2012, May 18). About Every Day Counts. Retrieved from Federal
Highway Adminstration: http://www.fhwa.dot.gov/everydaycounts/about
Federal Highway Administration. (2014). Intelligent Compaction Technology for Soils Applications.
Washington, DC. www.intelligentcompaction.com. Retrieved from
http://www.intelligentcompaction.com/projects/specifications/
Jones, D. (2014, April 9). Sakai America: Email Correspondence.
Kröber, W., Floss, R., & Wallrath, W. (2001). "Dynamic Soil Stiffness as Quality Criterion for Soil
Compaction." Geotechnics for Roads, Rail Tracks and Earth Structures.
Miller, J. S., & Bellinger, W. Y. (2003). Distress Identification Manual for the Long-Term Pavement
Performance Program. McLean: Federal Highway Administration.
Minnesota Department of Transportation. (2013). Grading and Base Manual. St. Paul: Minnesota
Department of Transportation.
Minnesota Department of Transportation. (2013, April 29). Materials Lab Supplemental Specifications
for Construction 2014 Edition. St. Paul: Minnesota Department of Transportation.
Minnesota Department of Transportation. (2013). Standard Specifications for Construction 2014 Edition.
St. Paul: Minnesota Department of Transportation.
Mooney, M. A., & Adam, D. (2007). Vibratory Roller Integrated Measurement of Earthwork
Compaction: An Overview. Proceedings FMGM2007 - International Symposium on Field
Measurements in Geomechanics. Boston.
Mooney, M. A., & Facas, N. W. (2013). Extraction of Layer Properties from Intelligent Compaction
Data. IDEA Programs. Washington, DC: Transportation Research Board.
Mooney, M. A., Rinehart, R. V., White, D. J., Vennapusa, P., Facas, N., & Musimbi, O. (2010).
Intelligent Soil Compaction Systems. Washington, DC: Transportation Research Board.
Mooney, M. A., Rinehart, R. V., White, D. J., Vennapusa, P., Facas, N., & Musimbi, O. (2010). National
Cooperative Highway Research Program, Report 676- Intelligent Soil Compaction Systems.
Washington, DC: Transportation Research Board.
Newman, N. (2014, July 21). High Country Construction: Phone Interview.
Scherocman, J., Rakowski, S., & Uchiyama, K. (2007). Intelligent Compaction, Does It Exist?
Proceedings of Annual Conference-Canadian Technical Asphalt Association, No. 52, pp. 373-
398.
Texas Department of Transportation. (2004). Standard Specifications for Construction and Maintenance
of Highways, Streets, and Bridges 2004. Austin: Texas Department of Transportation.
58
The Transtec Group, Inc. (2014, April 4). IC Specifications - Intelligent Compaction. Retrieved April 17,
2014, from http://www.intelligentcompaction.com/projects/specifications/
The Transtec Group, Inc. (2014). Intelligent Compaction Data Management Workshop. Laramie.
The Transtec Group, Inc. (2013). Asphalt IC Rollers. Retrieved August 8, 2013, from Intelligent
Compaction: http://www.intelligentcompaction.com/index.php?q=node/11
The Transtec Group, Inc. (2013). Soil IC Rollers. Retrieved August 8, 2013, from Intelligent Compaction:
http://www.intelligentcompaction.com/index.php?q=node/10
The Transtect Group, Inc. (2014). Intelligent Compaction Data Management Workshop. Laramie.
Trimble Navigation Limited. (2014). Trimble - Positioning Services - Trimble VRS Now. Retrieved June
24, 2014, from http://www.trimble.com/positioning-services/vrs-now.aspx
Utah Department of Transportation. (2012, January 1). 2012 Standard Specifications. Retrieved from
Utah Department of Transportation: http://udot.utah.gov/main/f?p=100:pg:0:::1:T,V:3696,
Vennapusa, P. K., White, D. J., & Morris, M. D. (2010). "Geostatistical Analysis for Spatially Referenced
Roller-Integrated Compaction Measurements." Journal of Geotechnical and Geoenvironmental
Engineering, 813-822.
White, D. J., Vennapusa, P. K., & Gieselman, H. (2011). Accelerated Implementation of Intelligent
Compaction Technology for Embankment Subgrade Soils, Aggregate Base, and Asphalt
Pavement Materials: SR-25 West Lafayette, Indiana. Ames: Iowa State University.
Wyoming Department of Transportation. (2010). Standard Specifications for Road and Bridge
Construction. Cheyenne: Wyoming Department of Transportation.
Wyoming Department of Transportation. (2011). State transportation improvement plan (stip). Retrieved
July 30, 2014, from
https://www.dot.state.wy.us/files/live/sites/wydot/files/shared/District_3/STIP-LINC.pdf
Wyoming Department of Transportation. (2013, December 20). 2013 Weighted Average Bid Prices.
Retrieved June 24, 2014, from
http://www.dot.state.wy.us/home/business_with_wydot/contractors/contractor_bids/weighted_bid
_price.html
Wyoming Department of Transportation. (2013). Materials Testing Manual. Cheyenne: Wyoming
Department of Transportation.
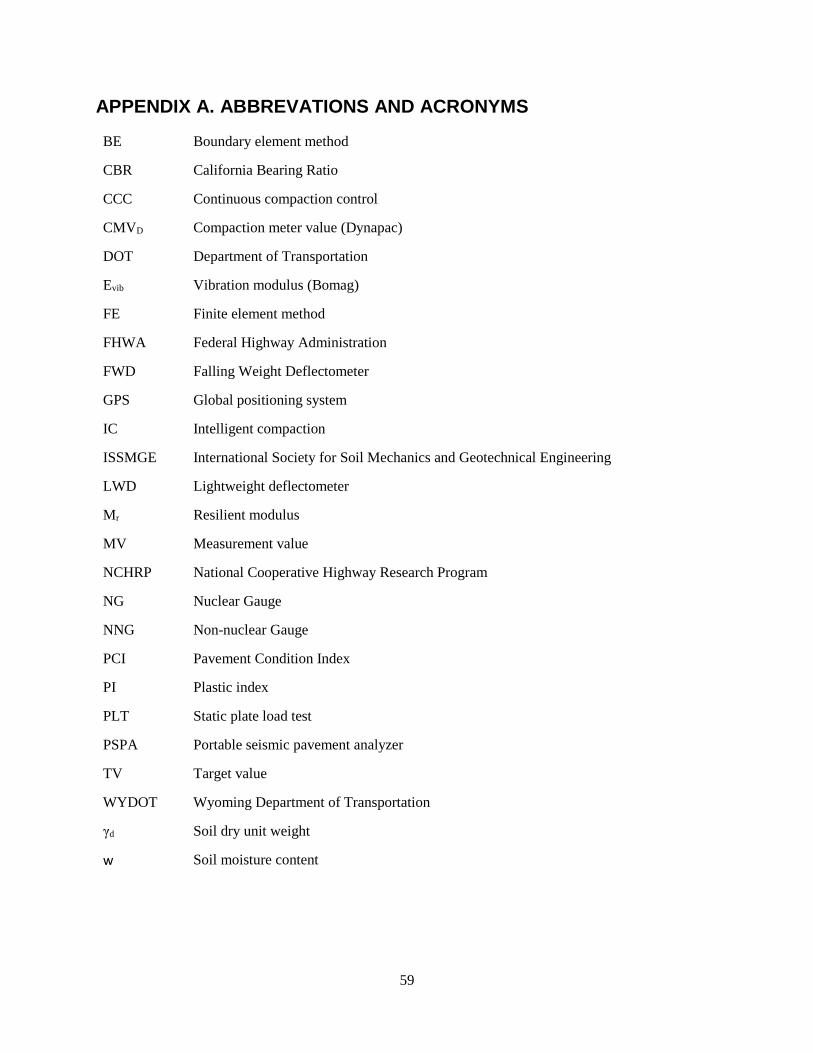
59
APPENDIX A. ABBREVATIONS AND ACRONYMS
BE Boundary element method
CBR California Bearing Ratio
CCC Continuous compaction control
CMVD Compaction meter value (Dynapac)
DOT Department of Transportation
Evib Vibration modulus (Bomag)
FE Finite element method
FHWA Federal Highway Administration
FWD Falling Weight Deflectometer
GPS Global positioning system
IC Intelligent compaction
ISSMGE International Society for Soil Mechanics and Geotechnical Engineering
LWD Lightweight deflectometer
Mr Resilient modulus
MV Measurement value
NCHRP National Cooperative Highway Research Program
NG Nuclear Gauge
NNG Non-nuclear Gauge
PCI Pavement Condition Index
PI Plastic index
PLT Static plate load test
PSPA Portable seismic pavement analyzer
TV Target value
WYDOT Wyoming Department of Transportation
γd Soil dry unit weight
w Soil moisture content

60
APPENDIX B. WYOMING SURVEY RESULTS
A list of the raw data from the survey responses are listed in the tables below. The question number is
indicated by “Q#.” Requests for a complete set of data may be sent to the authors or the Department of
Civil and Architectural Engineering at the University of Wyoming.
Q1. What is your name and contact info?
Answer Options Response
Percent
Response
Count
Name 100.0% 79
Title 86.1% 68
Business/Agency 93.7% 74
Address 84.8% 67
Email 91.1% 72
Phone 82.3% 65
answered question 79
skipped question 0
Q2. What field(s) do you primarily work in? [Select all that apply]
Answer Options Response
Percent
Response
Count
Geotechnical Engineering 10.4% 8
Transportation Engineering 31.2% 24
Construction 49.4% 38
Department of Transportation 89.6% 69
County Government 2.6% 2
City Government 1.3% 1
Other (please specify) 4
answered question 77
skipped question 2
Q3. Does your agency/company perform or contract roadway compaction? [Select all
that apply]
Answer Options Response
Percent
Response
Count
Performs Compaction Services 19.2% 14
Contracts Compaction Services 93.2% 68
Not sure 2.7% 2
Other (please specify) 3
answered question 73
skipped question 6
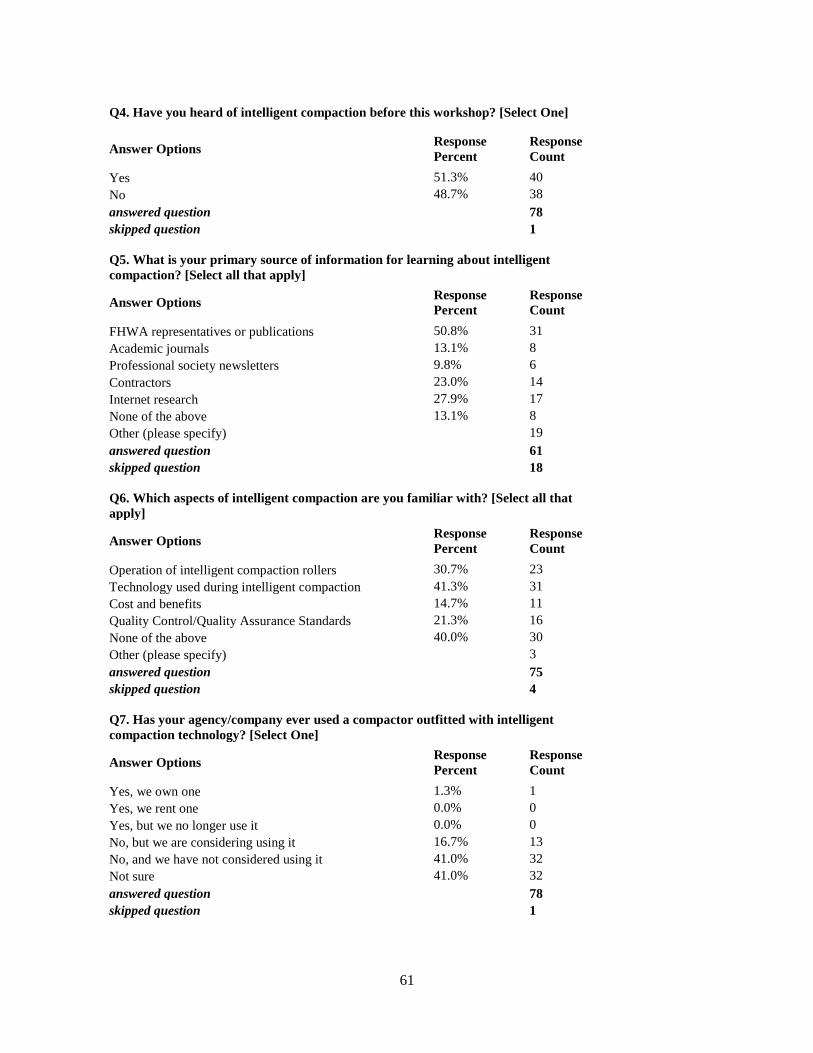
61
Q4. Have you heard of intelligent compaction before this workshop? [Select One]
Answer Options Response
Percent
Response
Count
Yes 51.3% 40
No 48.7% 38
answered question 78
skipped question 1
Q5. What is your primary source of information for learning about intelligent
compaction? [Select all that apply]
Answer Options Response
Percent
Response
Count
FHWA representatives or publications 50.8% 31
Academic journals 13.1% 8
Professional society newsletters 9.8% 6
Contractors 23.0% 14
Internet research 27.9% 17
None of the above 13.1% 8
Other (please specify) 19
answered question 61
skipped question 18
Q6. Which aspects of intelligent compaction are you familiar with? [Select all that
apply]
Answer Options Response
Percent
Response
Count
Operation of intelligent compaction rollers 30.7% 23
Technology used during intelligent compaction 41.3% 31
Cost and benefits 14.7% 11
Quality Control/Quality Assurance Standards 21.3% 16
None of the above 40.0% 30
Other (please specify) 3
answered question 75
skipped question 4
Q7. Has your agency/company ever used a compactor outfitted with intelligent
compaction technology? [Select One]
Answer Options Response
Percent
Response
Count
Yes, we own one 1.3% 1
Yes, we rent one 0.0% 0
Yes, but we no longer use it 0.0% 0
No, but we are considering using it 16.7% 13
No, and we have not considered using it 41.0% 32
Not sure 41.0% 32
answered question 78
skipped question 1

62
Q8. Which intelligent compaction rollers has your agency/company used? [Select all
that apply]
Answer Options Response
Percent
Response
Count
Ammann 0.0% 0
Bomag 10.0% 1
Case 0.0% 0
Caterpillar 0.0% 0
Dynapac 10.0% 1
Hamm – Wirtgen 0.0% 0
Sakai 10.0% 1
Volvo 0.0% 0
Not sure 80.0% 8
Other (please specify) 4
answered question 10
skipped question 69
Q9. Does your agency/company have operators that can operate compactors outfitted
with intelligent compaction technology? [Select One]
Answer Options Response
Percent
Response
Count
Yes 4.2% 1
No 54.2% 13
Not Sure 41.7% 10
answered question 24
skipped question 55
Q10. What effect does use of intelligent compaction have on the overall cost of
compaction jobs? Consider total job costs including quality control/assurance savings
and costs. [Select one]
Answer Options Response
Percent
Response
Count
An increase in cost 0.0% 0
About the same cost 0.0% 0
A decrease in cost 16.0% 4
Not sure 56.0% 14
Not applicable 28.0% 7
answered question 25
skipped question 54
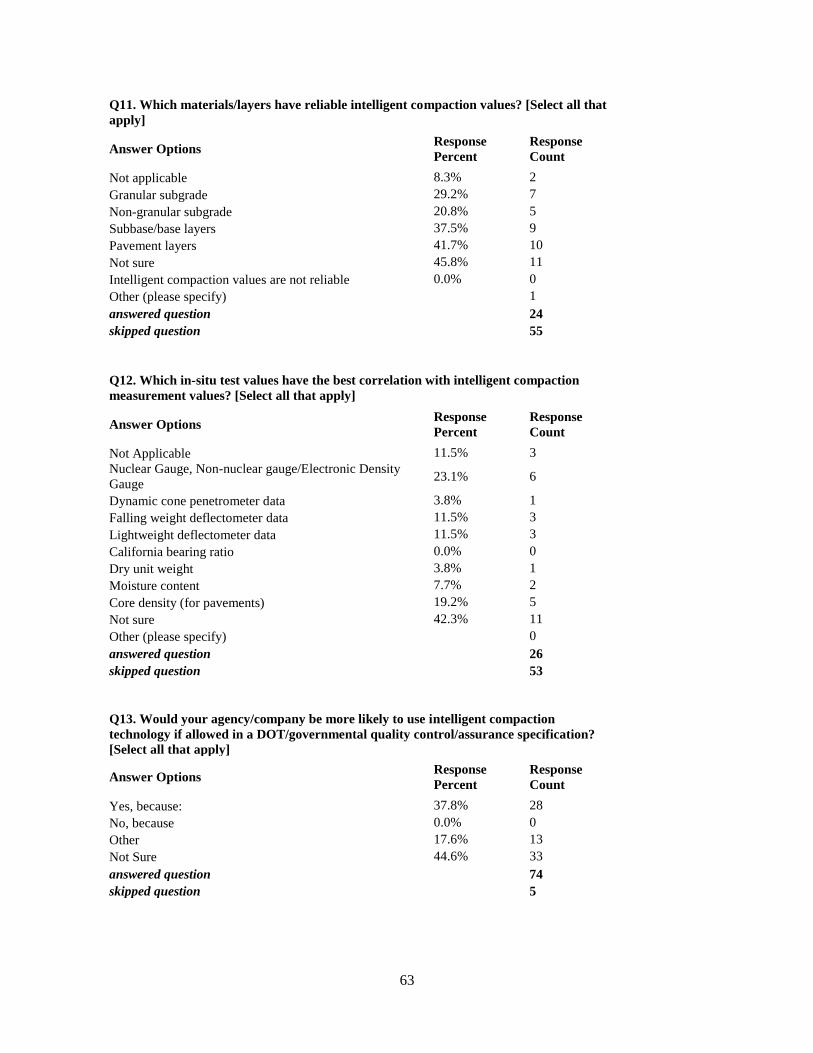
63
Q11. Which materials/layers have reliable intelligent compaction values? [Select all that
apply]
Answer Options Response
Percent
Response
Count
Not applicable 8.3% 2
Granular subgrade 29.2% 7
Non-granular subgrade 20.8% 5
Subbase/base layers 37.5% 9
Pavement layers 41.7% 10
Not sure 45.8% 11
Intelligent compaction values are not reliable 0.0% 0
Other (please specify) 1
answered question 24
skipped question 55
Q12. Which in-situ test values have the best correlation with intelligent compaction
measurement values? [Select all that apply]
Answer Options Response
Percent
Response
Count
Not Applicable 11.5% 3
Nuclear Gauge, Non-nuclear gauge/Electronic Density
Gauge 23.1% 6
Dynamic cone penetrometer data 3.8% 1
Falling weight deflectometer data 11.5% 3
Lightweight deflectometer data 11.5% 3
California bearing ratio 0.0% 0
Dry unit weight 3.8% 1
Moisture content 7.7% 2
Core density (for pavements) 19.2% 5
Not sure 42.3% 11
Other (please specify) 0
answered question 26
skipped question 53
Q13. Would your agency/company be more likely to use intelligent compaction
technology if allowed in a DOT/governmental quality control/assurance specification?
[Select all that apply]
Answer Options Response
Percent
Response
Count
Yes, because: 37.8% 28
No, because 0.0% 0
Other 17.6% 13
Not Sure 44.6% 33
answered question 74
skipped question 5
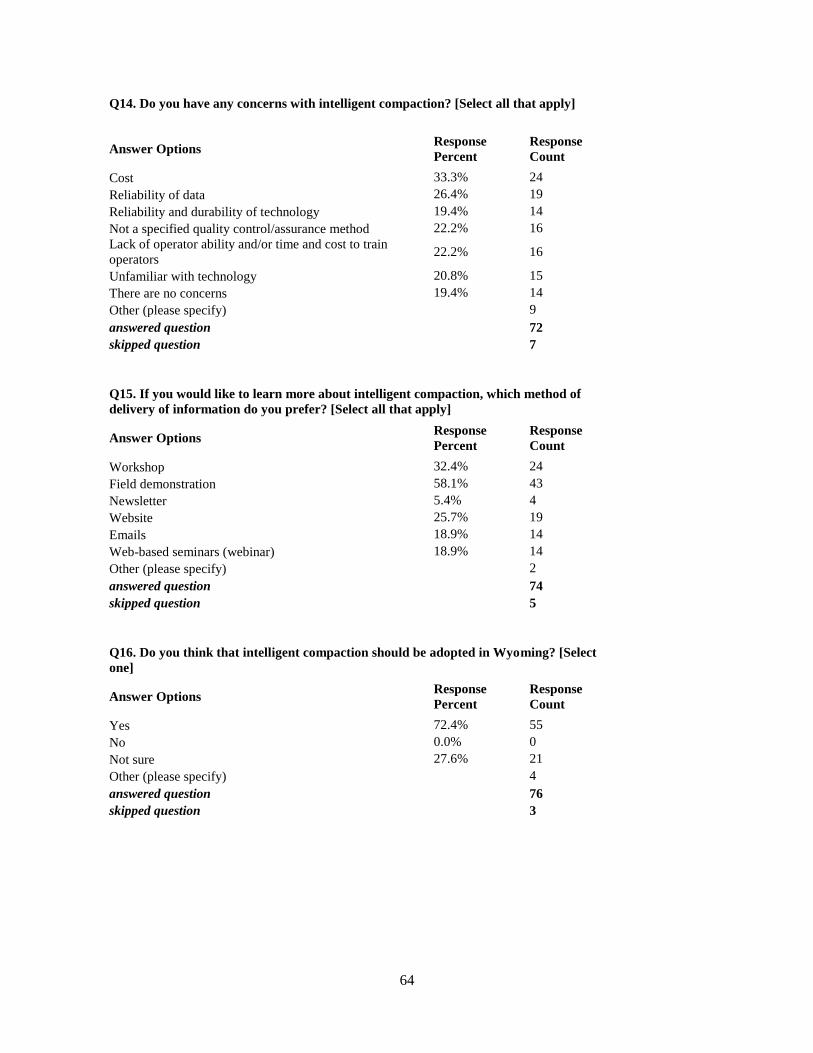
64
Q14. Do you have any concerns with intelligent compaction? [Select all that apply]
Answer Options Response
Percent
Response
Count
Cost 33.3% 24
Reliability of data 26.4% 19
Reliability and durability of technology 19.4% 14
Not a specified quality control/assurance method 22.2% 16
Lack of operator ability and/or time and cost to train
operators 22.2% 16
Unfamiliar with technology 20.8% 15
There are no concerns 19.4% 14
Other (please specify) 9
answered question 72
skipped question 7
Q15. If you would like to learn more about intelligent compaction, which method of
delivery of information do you prefer? [Select all that apply]
Answer Options Response
Percent
Response
Count
Workshop 32.4% 24
Field demonstration 58.1% 43
Newsletter 5.4% 4
Website 25.7% 19
Emails 18.9% 14
Web-based seminars (webinar) 18.9% 14
Other (please specify) 2
answered question 74
skipped question 5
Q16. Do you think that intelligent compaction should be adopted in Wyoming? [Select
one]
Answer Options Response
Percent
Response
Count
Yes 72.4% 55
No 0.0% 0
Not sure 27.6% 21
Other (please specify) 4
answered question 76
skipped question 3

65
Q17. What additional information would help facilitate implementation of intelligent
compaction in Wyoming? [Select all that apply]
Answer Options Response
Percent
Response
Count
Field demonstration 78.9% 56
Additional workshops 26.8% 19
Learning about other states’ experience 52.1% 37
Learning about costs 52.1% 37
Other (please specify) 9
answered question 71
skipped question 8
Q18. Are you aware of any upcoming construction projects that would be suitable for an
intelligent compaction demonstration project? [Select one and comment if applicable]
Answer Options Response
Percent
Response
Count
Yes 48.6% 35
No 51.4% 37
answered question 72
skipped question 7
Q19. Was the training provided at this workshop beneficial in understanding intelligent
compaction? [Select one and comment if applicable]
Answer Options Response
Percent
Response
Count
Yes 100.0% 79
No 0.0% 0
answered question 79
skipped question 0
Q20. Would you like to receive a summary of the results from this survey? [Select one]
Answer Options Response
Percent
Response
Count
Yes 26.0% 19
No 74.0% 54
answered question 73
skipped question 6

66
APPENDIX C. NATIONAL SURVEY RESULTS
A list of the raw data from the survey responses are listed in the table below. The question number is
indicated by “Q#.” Requests for a complete set of data may be sent to the authors or the Department of
Civil and Architectural Engineering at the University of Wyoming. Note that response counts include
responses included in comments from respondents selecting “Other.”
Q1. What is your contact info (contact name, agency name, address, email, phone
number)?
Answer Options Response
Percent
Response
Count
Name 100.0% 32
Title 100.0% 32
Agency 100.0% 32
Address 96.9% 31
Email 100.0% 32
Phone 96.9% 31
answered question 32
skipped question 0
Q2. What is your primary source of information for learning about intelligent
compaction? [Select all that apply]
Answer Options Response
Percent
Response
Count
FHWA representatives or publications 90.3% 28
Academic journals 19.4% 6
Professional society newsletters 3.2% 1
Contractors 19.4% 6
Internet research 35.5% 11
None of the above 6.5% 2
Other (please specify) 11
answered question 31
skipped question 1
Q3. Which aspects of intelligent compaction is your agency familiar with? [Select all
that apply]
Answer Options Response
Percent
Response
Count
Operation of intelligent compaction rollers 76.7% 23
Technology used during intelligent compaction 90.0% 27
Cost and benefits 50.0% 15
Quality Control and Assurance Standards 56.7% 17
None of the above 6.7% 2
Other (please specify) 5
answered question 30
skipped question 2

67
Q4. Does your agency have any concerns with the use of intelligent compaction for soil
or pavement materials? [Select all that apply]
Answer Options Response
Percent
Response
Count
There are no concerns 10.3% 3
Cost 31.0% 9
Reliability of data 34.5% 10
Ability to have it approved as a quality assurance
technique by policymakers 41.4% 12
Less strict than current quality assurance methods 17.2% 5
Lack of staff knowledge to confirm data 41.4% 12
Unfamiliar with technology 20.7% 6
Other (please specify) 11
answered question 29
skipped question 3
Q5. What method does your agency require for quality control and quality assurance of
roadway compaction of subgrade, subbase, and base layers? [Select all that apply]
Answer Options Response
Percent
Response
Count
Nuclear Gauge 96.9% 31
Non-nuclear Gauge / Electric Density Gauge 9.4% 3
LWD (Light weight deflectometer) 3.1% 1
DCP (Dynamic cone penetrometer) 6.3% 2
CBR (California bearing ratio) 6.3% 2
Proctor tests 59.4% 19
Sand Cone test 18.8% 6
Intelligent Compaction 9.4% 3
Other (please specify) 8
answered question 32
skipped question 0
Q6. What method does your agency require for quality control and quality assurance of
roadway compaction of pavement materials? [Select all that apply]
Answer Options Response
Percent
Response
Count
Nuclear Gauge 75.0% 24
Non-Nuclear Gauge / Electric Density Gauge 28.1% 9
Core Sampling 81.3% 26
Intelligent Compaction 6.3% 2
Other (please specify) 2
answered question 32
skipped question 0

68
Q7. Has your agency conducted an intelligent compaction demonstration project?
[Select one]
Answer Options Response
Percent
Response
Count
Yes, multiple demonstrations 34.4% 11
Yes, one demonstration 37.5% 12
No, but we are scheduled to perform a demonstration 15.6% 5
No 9.4% 3
Not Sure 3.1% 1
answered question 32
skipped question 0
Q8. If your agency has published a report(s) of the demonstration
projects, please write in the report titles, and, if applicable, attach a
web link.
Answer Options Response
Count
12
answered question 12
skipped question 20
Q9. Has your agency ever drafted quality control or quality assurance standards for intelligent
compaction? [Select one]
Answer Options Response
Percent
Response
Count
Yes, quality assurance standards for intelligent compaction have
been adopted 14.3% 3
Yes, draft standards have been completed and are awaiting adoption 19.0% 4
Yes, we are in the process of drafting standards 23.8% 5
No, but we plan on drafting standards 4.8% 1
No, and we do not plan on drafting standards at the current time 38.1% 8
Other (please specify) 11
answered question 21
skipped question 11

69
Q10. If your agency has or is drafting quality control or quality assurance standards for intelligent
compaction, what quality control or quality assurance methods does you agency utilize for intelligent
compaction? [Select all that apply]
Answer Options Response
Percent
Response
Count
Number of passes with intelligent compaction roller 41.2% 7
Testing weak soil / pavement areas indicated by intelligent compaction roller 41.2% 7
Percent difference of compaction values from intelligent compaction roller
within a given area / uniformity testing 11.8% 2
Correlation of in-situ testing with intelligent compaction values 58.8% 10
Not sure 17.6% 3
Other (please specify) 29.4% 5
Q11. If your agency has or is drafting quality assurance standards for intelligent
compaction, does your agency allow for automatic feedback to adjust compaction
parameters during compaction? [Select one]
Answer Options Response
Percent
Response
Count
Yes, but it is not required 11.8% 2
Yes, and it is required 17.6% 3
No 35.3% 6
Not Sure 35.3% 6
Q12. If your agency has or is drafting quality control or quality assurance standards for
intelligent compaction, does you agency require operating parameters for measurement
passes? [Select one]
Answer Options Response
Percent
Response
Count
Yes, measurement passes should be conducted at constant drum
amplitude and frequency 14.3% 3
Yes, measurement passes are determined on a project-by-project
basis 14.3% 3
No, but the contractor is required to report the operating
parameters for the measurement pass 19.0% 4
No, the contractor determines the parameters and does not have to
report the operating parameters 9.5% 2
Not Sure 23.8% 5

70
Q13. If your agency uses correlations, which in-situ test values are required to be
correlated to intelligent compaction values? [Select all that apply]
Answer Options Response Count
Nuclear Gauge 10
Non-nuclear Gauge / Electric Density Gauge 1
Dynamic cone penetrometer data 3
Falling weight deflectometer data 2
Lightweight deflectometer data 2
California bearing ratio 0
Dry unit weight 3
Moisture content 4
Core density (for pavements) 5
Not applicable 7
Not Sure 1
Other (please specify) 4
Q14. If your agency uses correlations, what types of correlation values (e.g. coefficient of
determination / R2) has your agency encountered and with each type of in-situ test?
[Select one]
Answer Options Response
Percent
Response
Count
Not sure 65.0% 13
Not applicable 35.0% 7
Other (please specify) 3
answered question 20
skipped question 12
Q15. What changes in bid costs or in-house costs does your agency incur with
compaction services utilizing intelligent compaction? [Select one]
Answer Options Response
Percent
Response
Count
An increase in cost 31.3% 10
About the same cost 0.0% 0
A decrease in cost 0.0% 0
Not sure 34.4% 11
Not applicable 34.4% 11
answered question 32
skipped question 0

71
Q16. Does your agency collect any data about the long-term benefits and costs of
intelligent compaction? [Select all that apply]
Answer Options Response
Percent
Response
Count
Yes, we have information specific to past projects that we
have performed 7.1% 2
Yes, we have compiled information from other agencies 3.6% 1
No, but we plan on conducting a long-term assessment of
the benefits and costs of intelligent compaction 17.9% 5
No, and we are awaiting benefit-cost information from
independent agencies 14.3% 4
No, and we have no plans to collect benefit-cost
information 7.1% 2
Not sure 21.4% 6
Not applicable 32.1% 9
Other (please specify) 7
answered question 28
skipped question 4
Q17. If your agency collects long-term benefit and cost information about intelligent
compaction, what outcome has your agency encountered with projects using intelligent
compaction compared to conventional compaction methods? [Select all that apply]
Answer Options Response
Percent
Response
Count
Higher benefits than costs 7.1% 2
Higher costs than benefits 0.0% 0
No Change 0.0% 0
Not sure 28.6% 8
Not applicable 64.3% 18
Other (please specify) 1
answered question 28
skipped question 4
Q18. Would you like to receive a summary of the results from this survey? [Select one]
Answer Options Response
Percent
Response
Count
Yes 90.6% 29
No 9.4% 3
answered question 32
skipped question 0