implementation of genomic selection and crossbreeding … iceland 7 10.pdf · implementation of...
TRANSCRIPT
Implementation of genomic selection and
crossbreeding in dairy cattle
Dr. Gary Rogers
Geno Global
Hamar, Norway
&
New Market, Tennessee, USA
Genomic Selection
• Extends our current quantitative selection approach – but revolutionary
• Still a “black box” approach to selection – do not know exact function of individual genes
• Not “ditching” old basic concepts just enhancing them
• Does not eliminate the need for data on important families & individuals
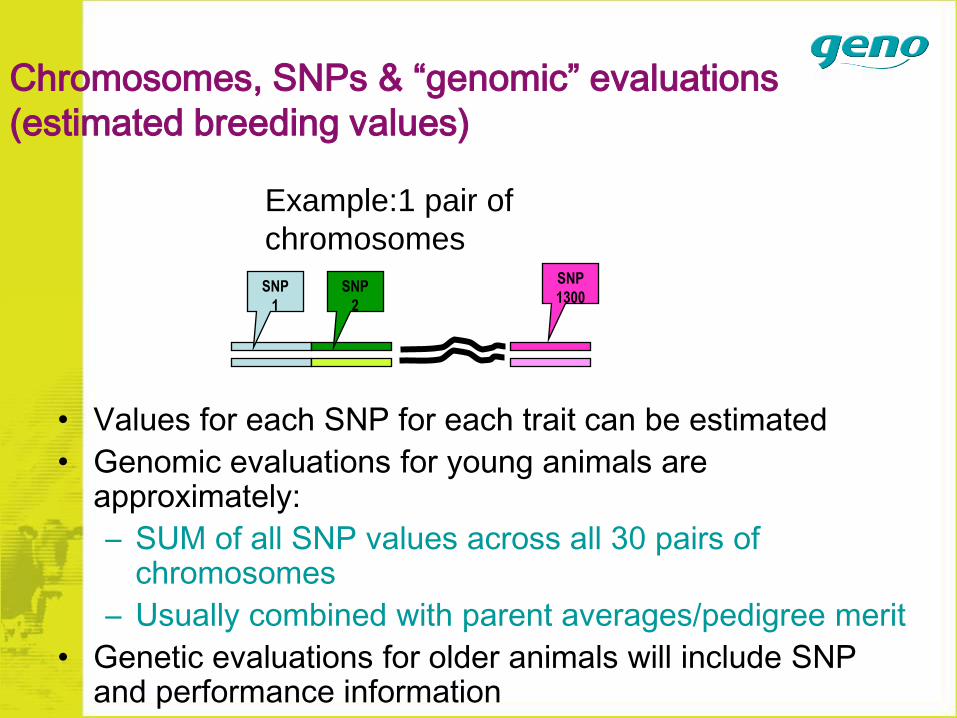
Chromosomes, SNPs & “genomic” evaluations
(estimated breeding values)
Example:1 pair of
chromosomes
SNP
1
SNP
2
SNP
1300
• Values for each SNP for each trait can be estimated
• Genomic evaluations for young animals are approximately:
– SUM of all SNP values across all 30 pairs of chromosomes
– Usually combined with parent averages/pedigree merit
• Genetic evaluations for older animals will include SNP and performance information
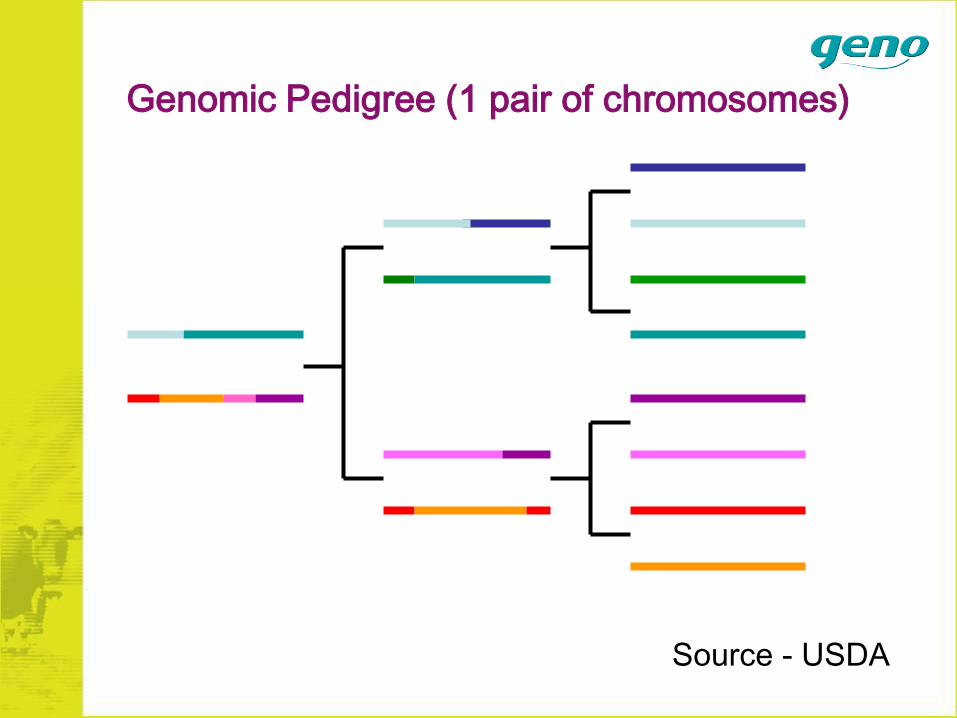
Genomic Pedigree (1 pair of chromosomes)
Source - USDA
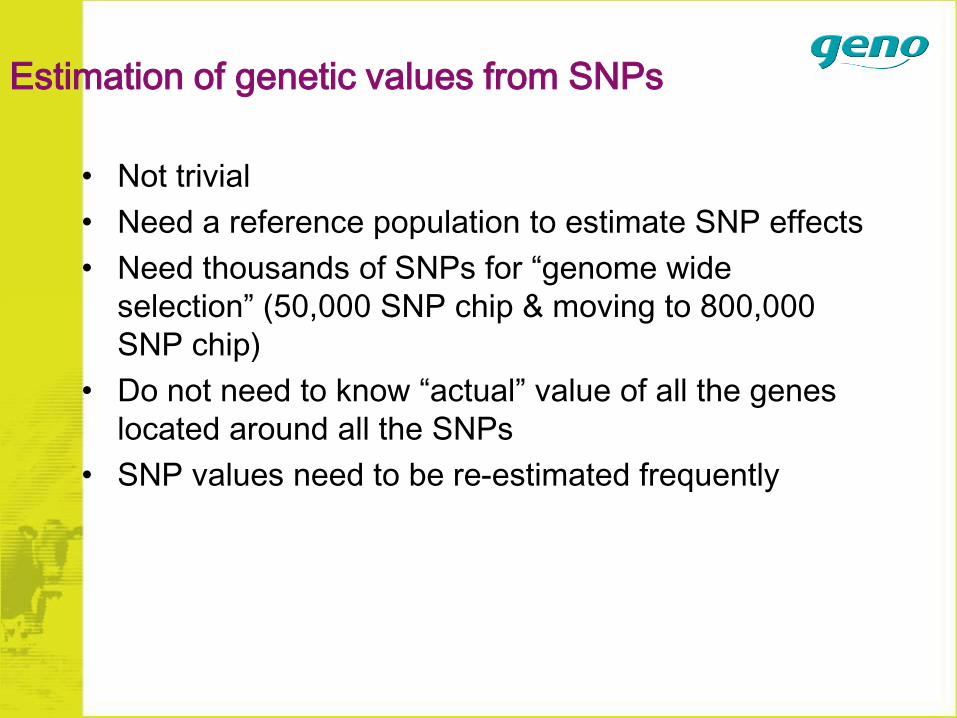
Estimation of genetic values from SNPs
• Not trivial
• Need a reference population to estimate SNP effects
• Need thousands of SNPs for “genome wide
selection” (50,000 SNP chip & moving to 800,000
SNP chip)
• Do not need to know “actual” value of all the genes
located around all the SNPs
• SNP values need to be re-estimated frequently
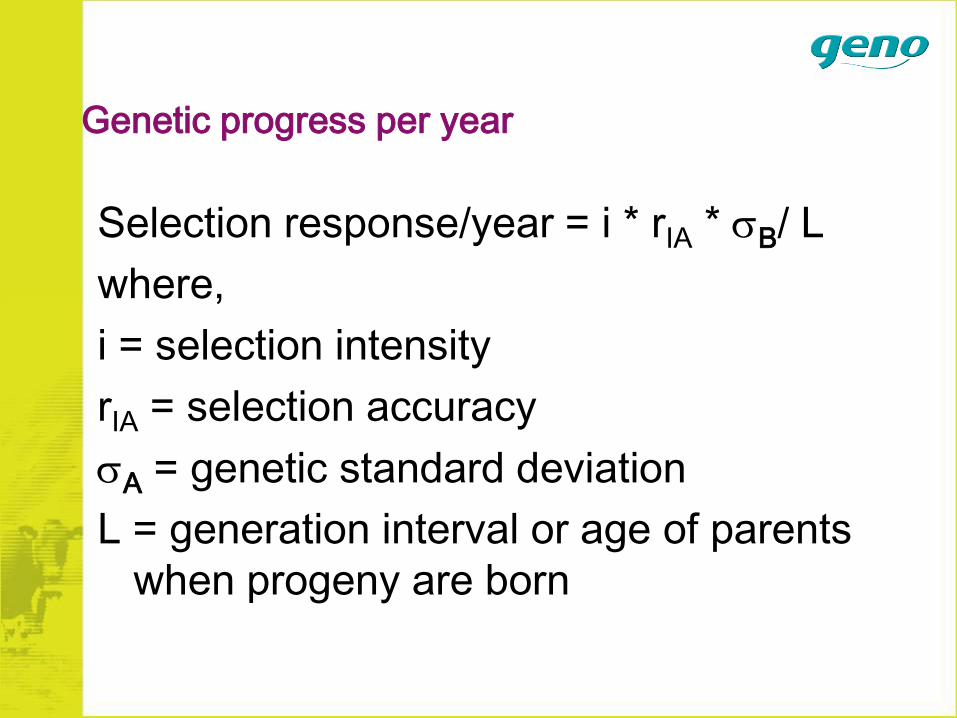
Genetic progress per year
Selection response/year = i * rIA * B/ L
where,
i = selection intensity
rIA = selection accuracy
A = genetic standard deviation
L = generation interval or age of parents
when progeny are born
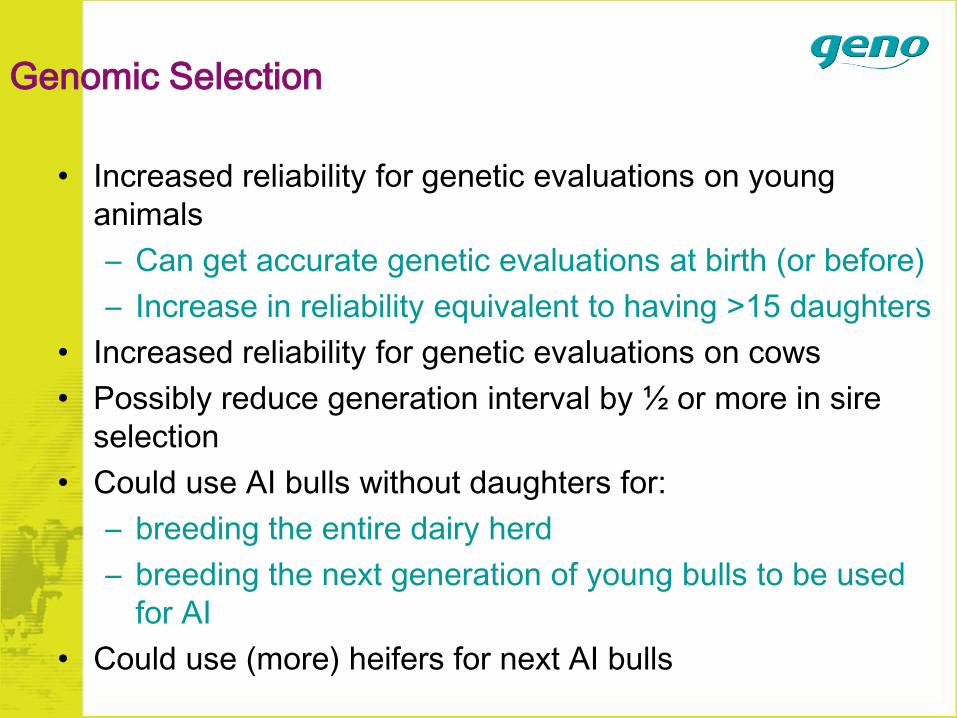
Genomic Selection
• Increased reliability for genetic evaluations on young
animals
– Can get accurate genetic evaluations at birth (or before)
– Increase in reliability equivalent to having >15 daughters
• Increased reliability for genetic evaluations on cows
• Possibly reduce generation interval by ½ or more in sire
selection
• Could use AI bulls without daughters for:
– breeding the entire dairy herd
– breeding the next generation of young bulls to be used
for AI
• Could use (more) heifers for next AI bulls
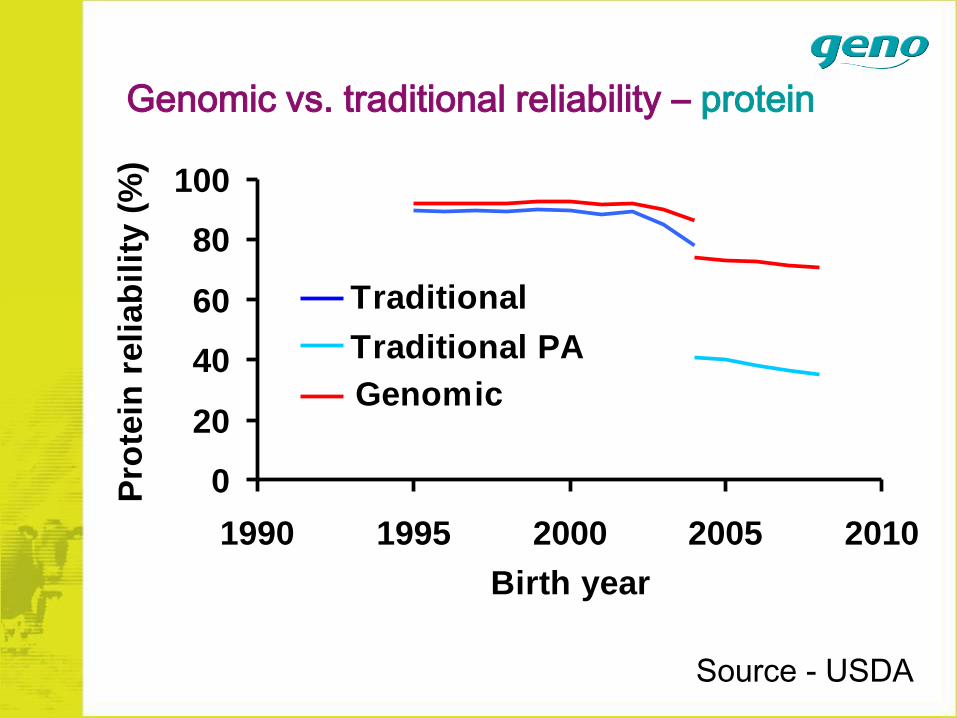
Genomic vs. traditional reliability – protein
0
20
40
60
80
100
1990 1995 2000 2005 2010
Birth year
Pro
tein
reli
ab
ilit
y (
%)
Traditional
Genomic
Traditional PA
Source - USDA
Enhanced genetic change from genomic
selection
• Near future - a 5% to 15% increase in genetic gain
• Long term - a 50% increase in genetic gain –
theoretical increase is higher
Genomic Selection Issues
• Cost of program
• Population size & linkage disequilibrium
– Larger reference population results in improved
accuracy of genomic predictions
– Highly selected populations have more linkage
disequilibrium
• Reliability of prediction for lowly heritable traits
has been disappointing (except DFS data)
Genomic Selection Issues (continued)
• Potential increase in inbreeding (homozygousity)
– Actual selection for the same SNPs (directly choosing
animals with the same sequences/genes)
– Those selected will be more homozygous than their
pedigree will indicate
• Could allow use of some non-traditional or
outcross families to reduce inbreeding?
– No documented success yet
• Could use SNPs to decrease inbreeding
Genomic Selection Issues (continued)
• Inbreeding from genomic selection could lead
to an increase in crossbreeding in
commercial herds
• Could use genomic selection to create inbred
lines for crossbreeding
– Maize & other important plants
– Poultry & swine
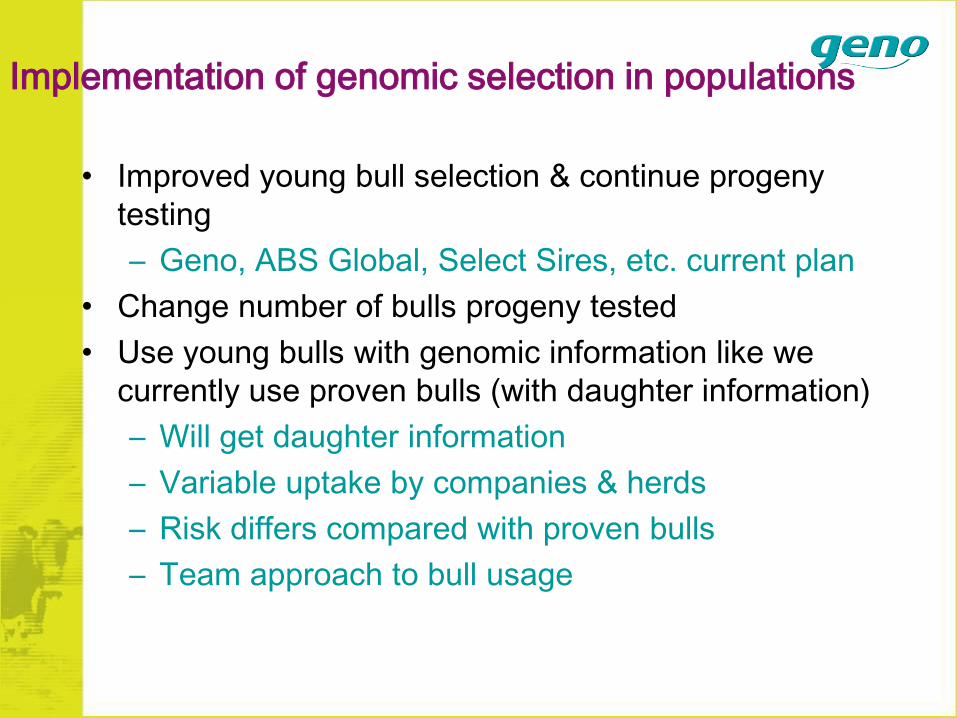
Implementation of genomic selection in populations
• Improved young bull selection & continue progeny
testing
– Geno, ABS Global, Select Sires, etc. current plan
• Change number of bulls progeny tested
• Use young bulls with genomic information like we
currently use proven bulls (with daughter information)
– Will get daughter information
– Variable uptake by companies & herds
– Risk differs compared with proven bulls
– Team approach to bull usage
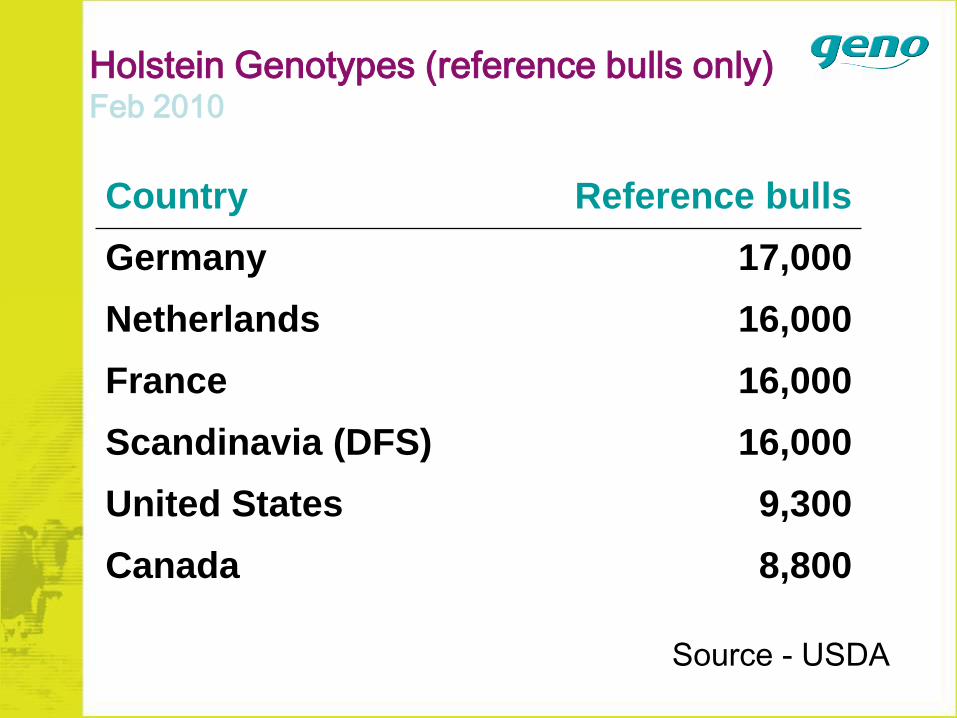
Holstein Genotypes (reference bulls only)Feb 2010
Country Reference bulls
Germany 17,000
Netherlands 16,000
France 16,000
Scandinavia (DFS) 16,000
United States 9,300
Canada 8,800
Source - USDA
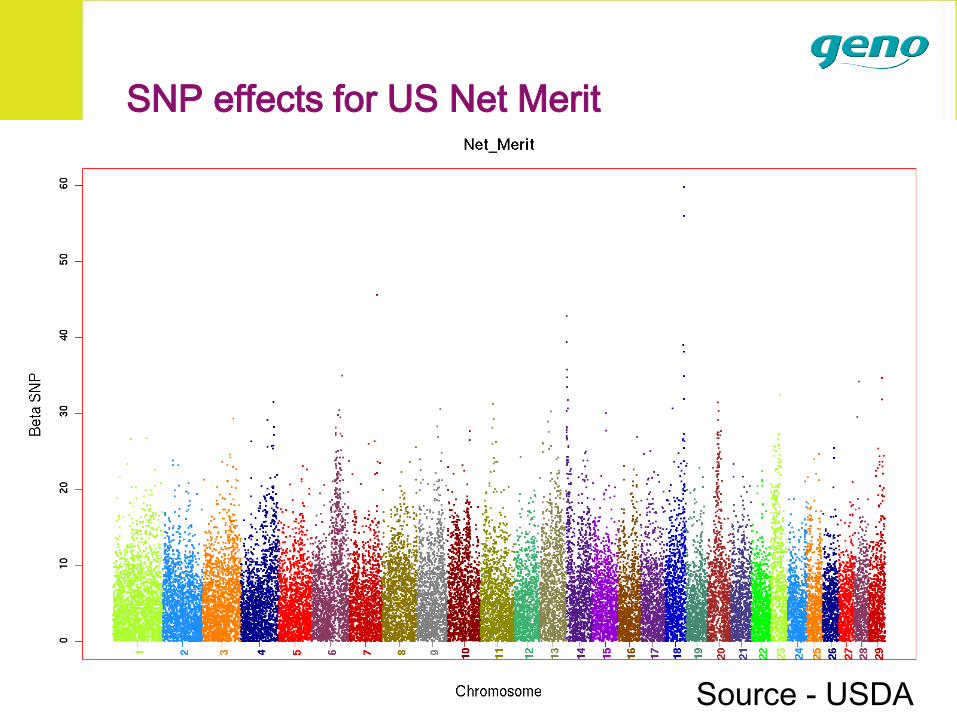
SNP effects for US Net Merit
Source - USDA
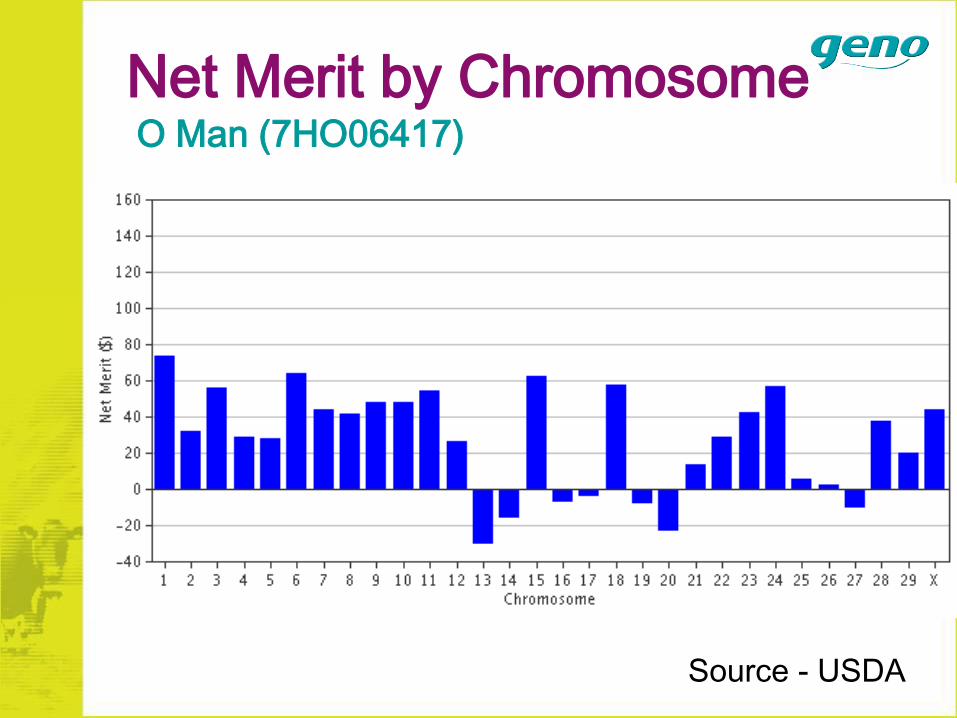
Net Merit by ChromosomeO Man (7HO06417)
Source - USDA
• Enhanced quantitative based selection
• Substantially increase rates of genetic improvement
• Require some changes in breeding programs to reap the benefits
• Take some time to be optimized
• Inbreeding must be properly considered
Summary on Genomic Selection
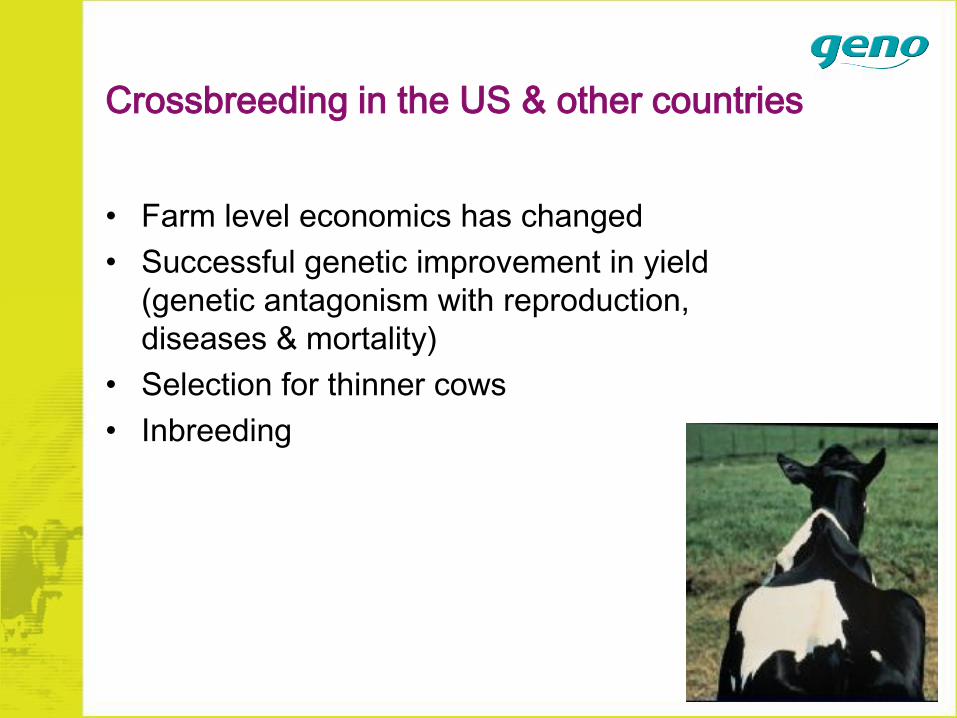
Crossbreeding in the US & other countries
• Farm level economics has changed
• Successful genetic improvement in yield
(genetic antagonism with reproduction,
diseases & mortality)
• Selection for thinner cows
• Inbreeding
Crossbreeding around the world
• New Zealand – 30% to 50% crossbred cows
• Australia
• Europe
• US - 9.1 million dairy cows – 53,000 herds
– Approximately 80-90% Holstein genes
– Many Jersey X Holstein crosses (>6% of cows in national recording)
– >600,000 crossbred cows of milking age
– Perhaps 1 million crossbred dairy cows in US very soon
• Benefits of crossbreeding in “commercial herds”
– Higher farm profit (cheaper cost of production)
– Hybrid vigor (heterosis) & relief for inbreeding
– Healthier cows with improved reproduction & survival
– Improved calving performance
– Improved genes for some traits from a different breed
– Can simplify some aspects of mating system (no worry
over inbreeding when mate cows)
• Potential negative aspects of crossbreeding
– Change in traditional breeding policy
– Identifying the appropriate breeds to use
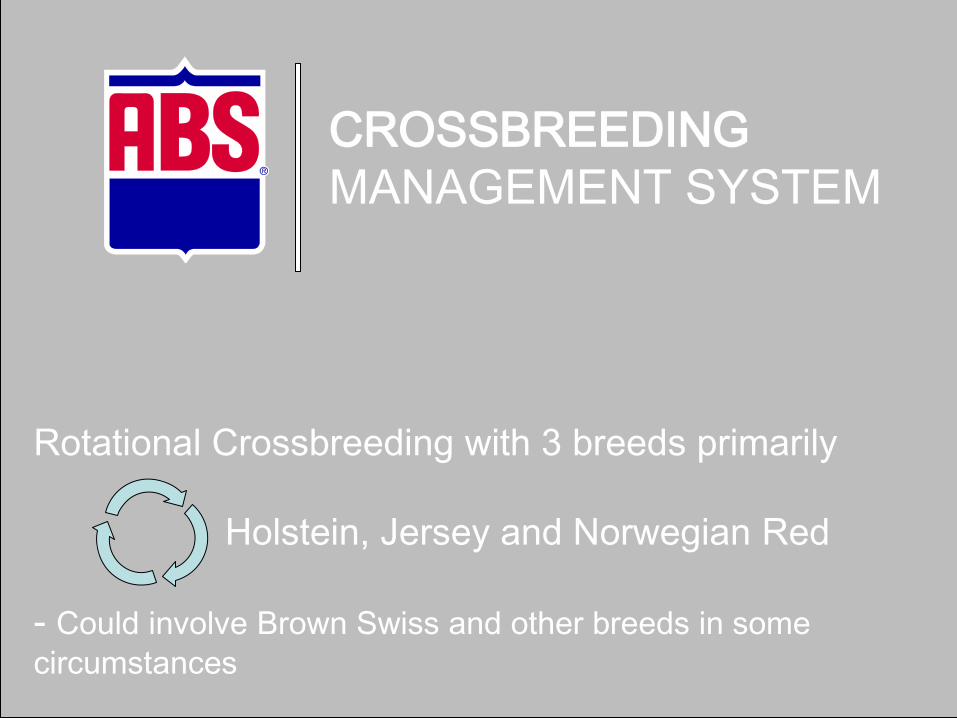
CROSSBREEDING
MANAGEMENT SYSTEM
Rotational Crossbreeding with 3 breeds primarily
Holstein, Jersey and Norwegian Red
- Could involve Brown Swiss and other breeds in some
circumstances
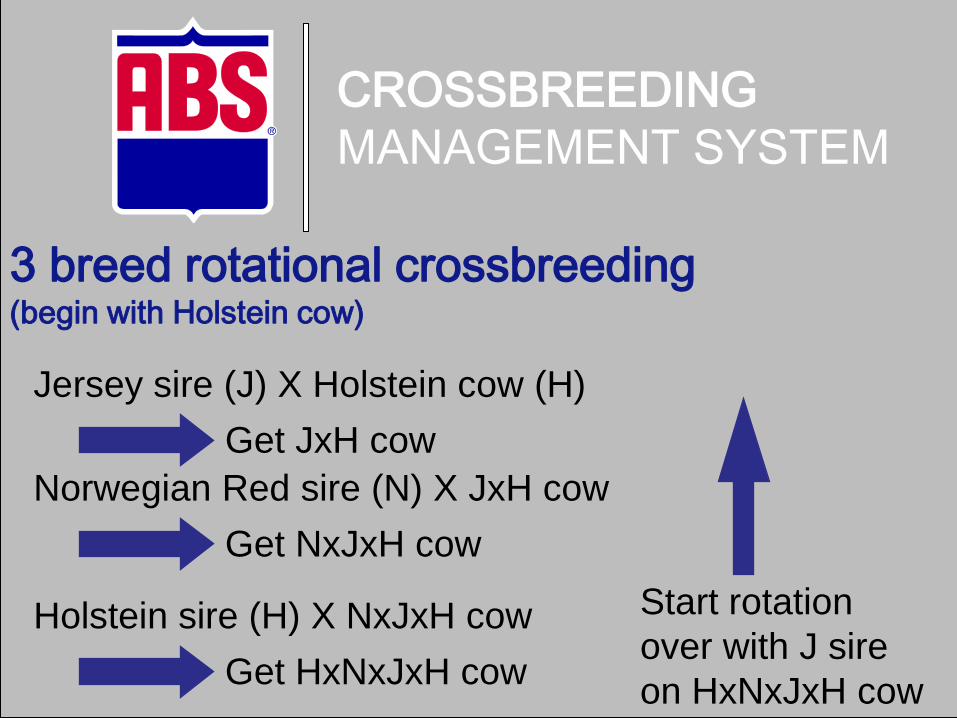
3 breed rotational crossbreeding (begin with Holstein cow)
Jersey sire (J) X Holstein cow (H)
Get JxH cow
Start rotation
over with J sire
on HxNxJxH cow
Norwegian Red sire (N) X JxH cow
Get NxJxH cow
Holstein sire (H) X NxJxH cow
Get HxNxJxH cow
CROSSBREEDING
MANAGEMENT SYSTEM
Creative Genetics of California & Select Sires
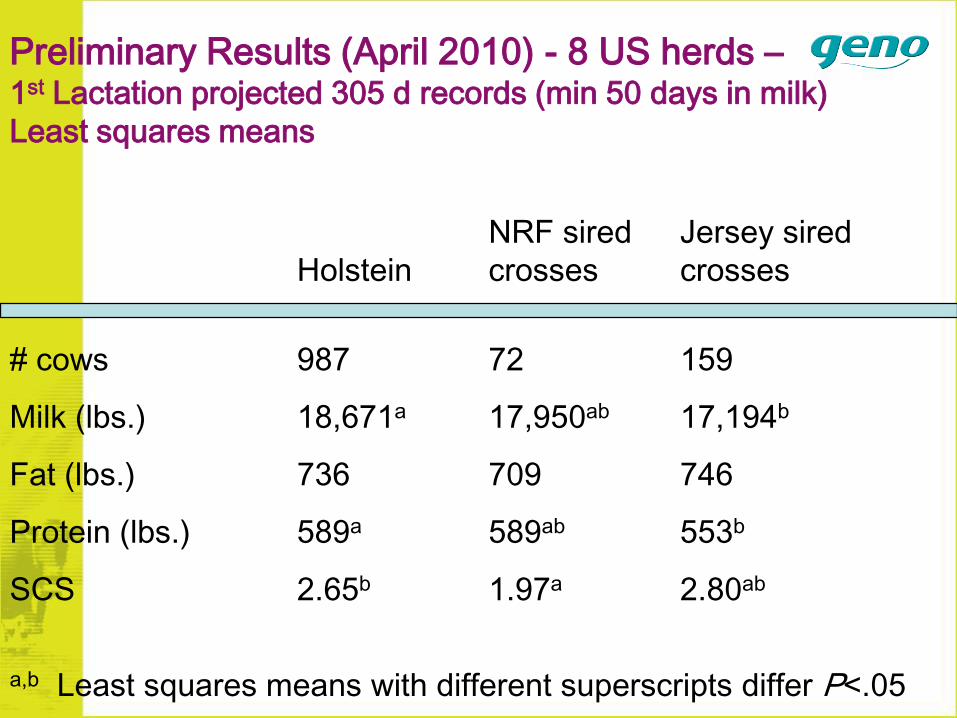
Preliminary Results (April 2010) - 8 US herds –1st Lactation projected 305 d records (min 50 days in milk)
Least squares means
# cows 987 72 159
Milk (lbs.) 18,671a 17,950ab 17,194b
Fat (lbs.) 736 709 746
Protein (lbs.) 589a 589ab 553b
SCS 2.65b 1.97a 2.80ab
a,b Least squares means with different superscripts differ P<.05
NRF sired Jersey sired
Holstein crosses crosses
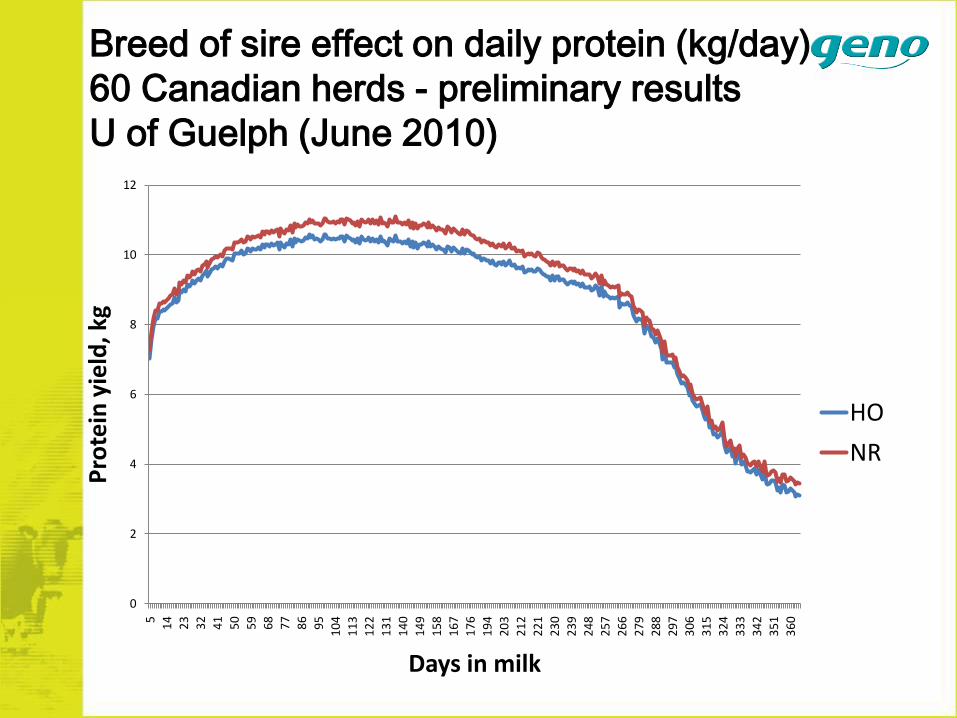
0
2
4
6
8
10
12
5
14
23
32
41
50
59
68
77
86
95
104
113
122
131
140
149
158
167
176
194
203
212
221
230
239
248
257
266
279
288
297
306
315
324
333
342
351
360
Pro
tein
yie
ld, k
g
Days in milk
HO
NR
Breed of sire effect on daily protein (kg/day)
60 Canadian herds - preliminary results
U of Guelph (June 2010)
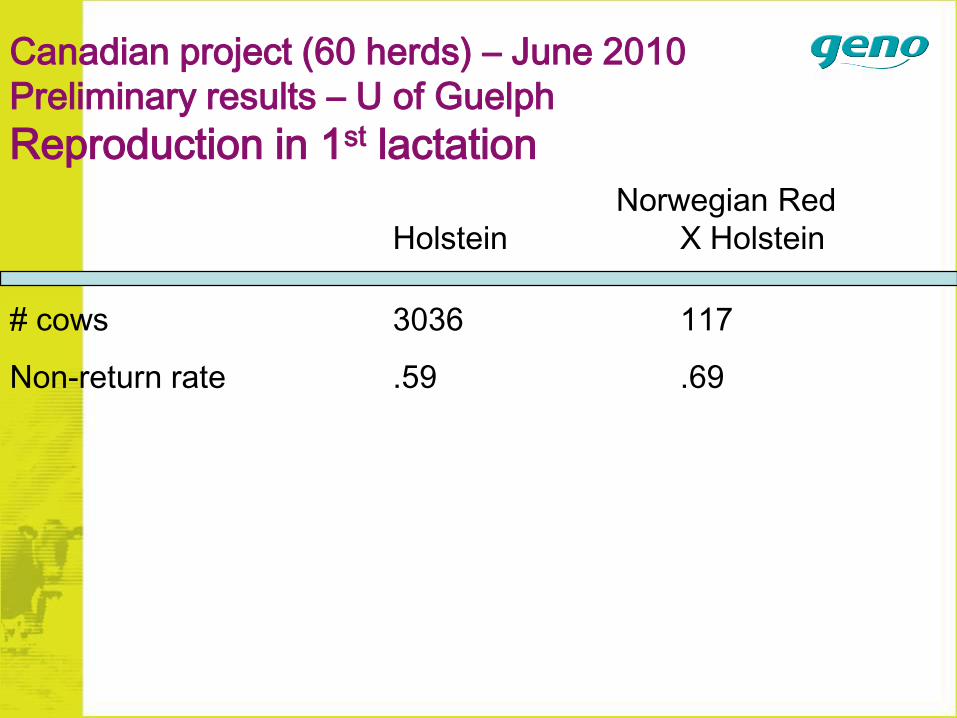
Canadian project (60 herds) – June 2010
Preliminary results – U of Guelph
Reproduction in 1st lactation
# cows 3036 117
Non-return rate .59 .69
Norwegian Red
Holstein X Holstein
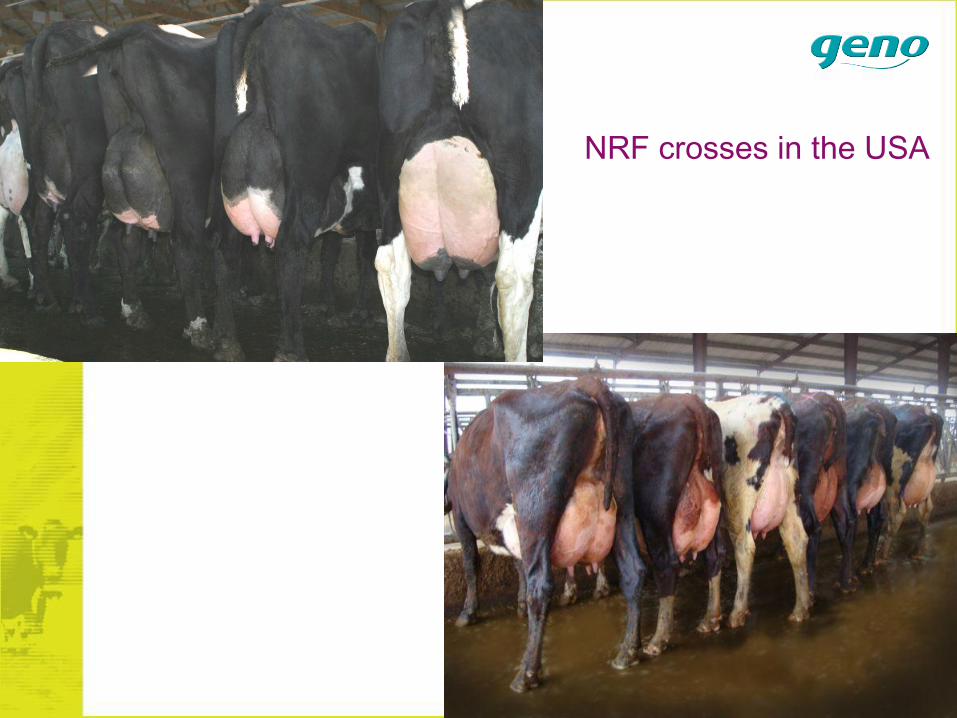
NRF crosses in the USA
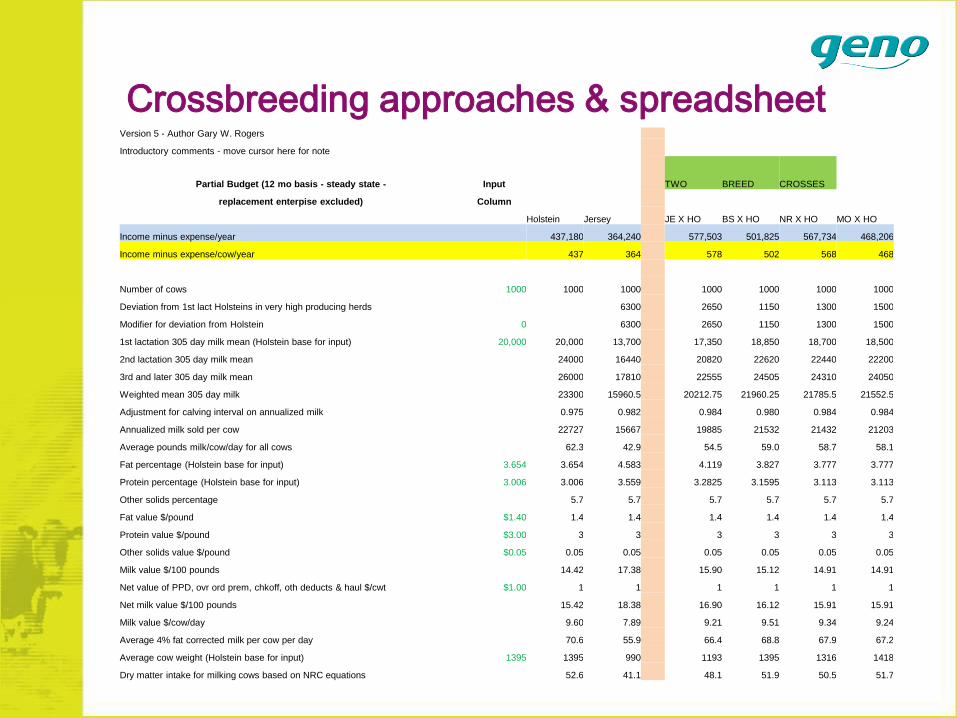
Crossbreeding approaches & spreadsheetVersion 5 - Author Gary W. Rogers
Introductory comments - move cursor here for note
Partial Budget (12 mo basis - steady state - Input TWO BREED CROSSES
replacement enterpise excluded) Column
Holstein Jersey JE X HO BS X HO NR X HO MO X HO
Income minus expense/year 437,180 364,240 577,503 501,825 567,734 468,206
Income minus expense/cow/year 437 364 578 502 568 468
Number of cows 1000 1000 1000 1000 1000 1000 1000
Deviation from 1st lact Holsteins in very high producing herds 6300 2650 1150 1300 1500
Modifier for deviation from Holstein 0 6300 2650 1150 1300 1500
1st lactation 305 day milk mean (Holstein base for input) 20,000 20,000 13,700 17,350 18,850 18,700 18,500
2nd lactation 305 day milk mean 24000 16440 20820 22620 22440 22200
3rd and later 305 day milk mean 26000 17810 22555 24505 24310 24050
Weighted mean 305 day milk 23300 15960.5 20212.75 21960.25 21785.5 21552.5
Adjustment for calving interval on annualized milk 0.975 0.982 0.984 0.980 0.984 0.984
Annualized milk sold per cow 22727 15667 19885 21532 21432 21203
Average pounds milk/cow/day for all cows 62.3 42.9 54.5 59.0 58.7 58.1
Fat percentage (Holstein base for input) 3.654 3.654 4.583 4.119 3.827 3.777 3.777
Protein percentage (Holstein base for input) 3.006 3.006 3.559 3.2825 3.1595 3.113 3.113
Other solids percentage 5.7 5.7 5.7 5.7 5.7 5.7
Fat value $/pound $1.40 1.4 1.4 1.4 1.4 1.4 1.4
Protein value $/pound $3.00 3 3 3 3 3 3
Other solids value $/pound $0.05 0.05 0.05 0.05 0.05 0.05 0.05
Milk value $/100 pounds 14.42 17.38 15.90 15.12 14.91 14.91
Net value of PPD, ovr ord prem, chkoff, oth deducts & haul $/cwt $1.00 1 1 1 1 1 1
Net milk value $/100 pounds 15.42 18.38 16.90 16.12 15.91 15.91
Milk value $/cow/day 9.60 7.89 9.21 9.51 9.34 9.24
Average 4% fat corrected milk per cow per day 70.6 55.9 66.4 68.8 67.9 67.2
Average cow weight (Holstein base for input) 1395 1395 990 1193 1395 1316 1418
Dry matter intake for milking cows based on NRC equations 52.6 41.1 48.1 51.9 50.5 51.7
Summary
• Crossbred cows will return more net revenue per cow per
year than pure Holsteins in most herds in the US
• Various crossbreeding schemes are in use
• Three breed rotations:
– Holstein, Nordic Reds and Jersey (likely most profitable
in most US herds)
– Holstein, Nordic Reds and Montbeliarde or Fleckvieh or
Brown Swiss
– Other combinations