impacts of swine manure & aqua-ammonia nitrogen application timing on subsurface drainage water...
TRANSCRIPT

Department of Agricultural and Biosystems Engineering
Impacts of Swine Manure & Aqua-ammonia
Nitrogen Application Timing on Subsurface
Drainage Water Quality
Matthew Helmers, Bob Zhou, and Carl Pederson
Dept. of Agricultural and Biosystems Engineering
Iowa State University
Department of Agricultural and
Biosystems Engineering
Goals
• Investigate the impacts of aqua-
ammonia and liquid swine manure
application timing on nitrate-
nitrogen concentrations in
subsurface drainage and the
impacts on crop production
Department of Agricultural and
Biosystems Engineering
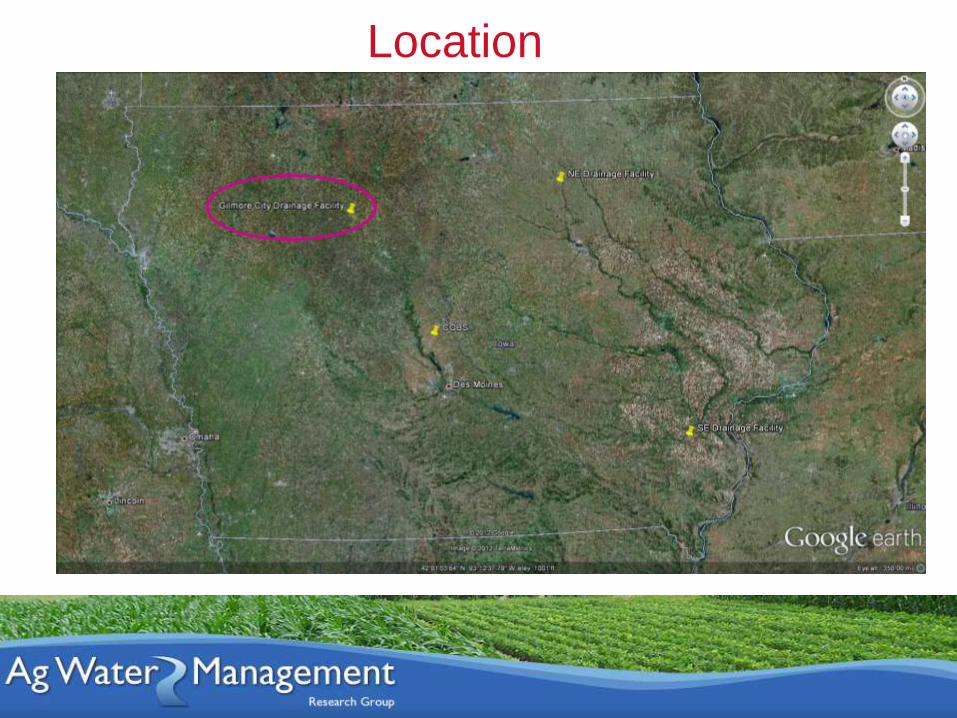
Location

Department of Agricultural and
Biosystems Engineering
Plot Sampling Layout
125 ft
50 ft
Perforated border tile -drains to remote outlet
Flow monitoring sump(three drain lines in each sump)
Treatment plot
Department of Agricultural and
Biosystems Engineering
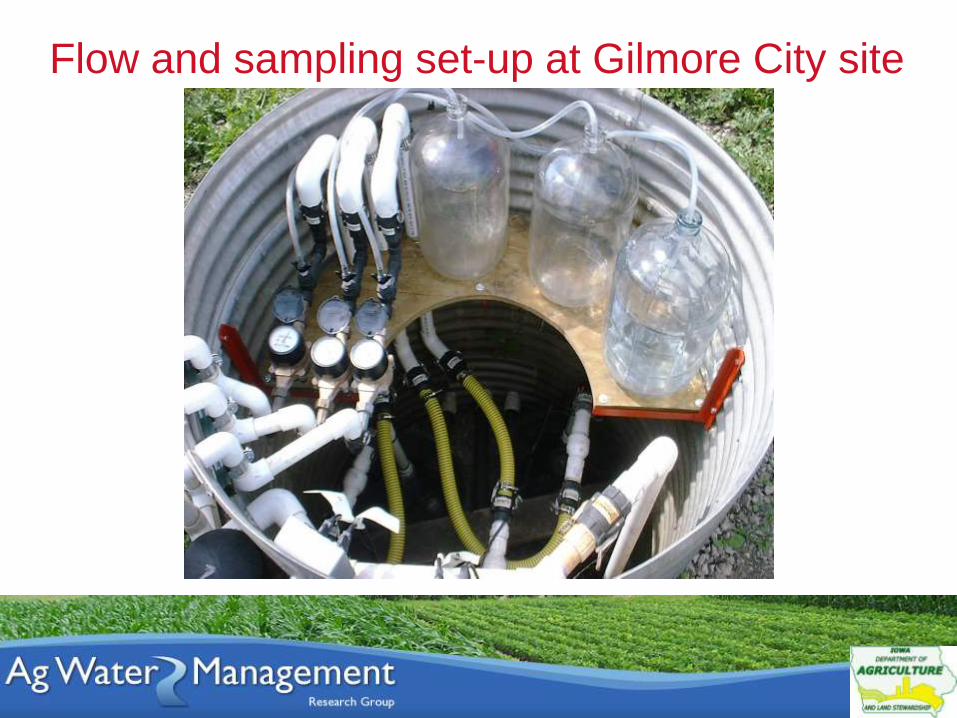
Flow and sampling set-up at Gilmore City site
Department of Agricultural and
Biosystems Engineering
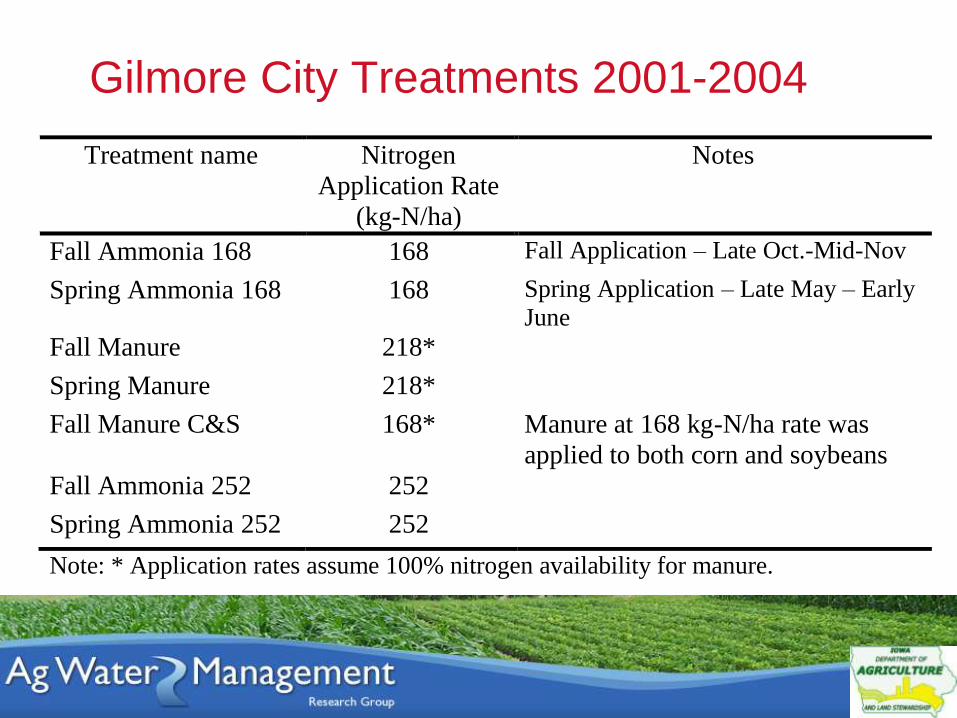
Gilmore City Treatments 2001-2004
Treatment name Nitrogen
Application Rate
(kg-N/ha)
Notes
Fall Ammonia 168 168 Fall Application – Late Oct.-Mid-Nov
Spring Ammonia 168 168 Spring Application – Late May – Early
June
Fall Manure 218*
Spring Manure 218*
Fall Manure C&S 168* Manure at 168 kg-N/ha rate was
applied to both corn and soybeans
Fall Ammonia 252 252
Spring Ammonia 252 252
Note: * Application rates assume 100% nitrogen availability for manure.

Department of Agricultural and
Biosystems Engineering
Precipitation
2001 2002 2003 20042001-04
average
long term
average[a]
Month precipitation (mm)
Mar. 16 7 28 97 37 55
Apr. 89 65 79 80 78 81
May 143 77 109 168 124 99
Jun. 68 51 218 98 109 116
Jul. 90 77 147 80 99 110
Aug. 72 262 42 13 97 111
Sep. 40 30 0 88 40 78
Oct. 42 87 0 14 36 57
Nov. 54 1 0 68 31 46
Drainage season (Mar-Nov)
precipitation614 657 623 706 650 753
Annual precipitation 702 680 689 767 710 821
Department of Agricultural and
Biosystems Engineering
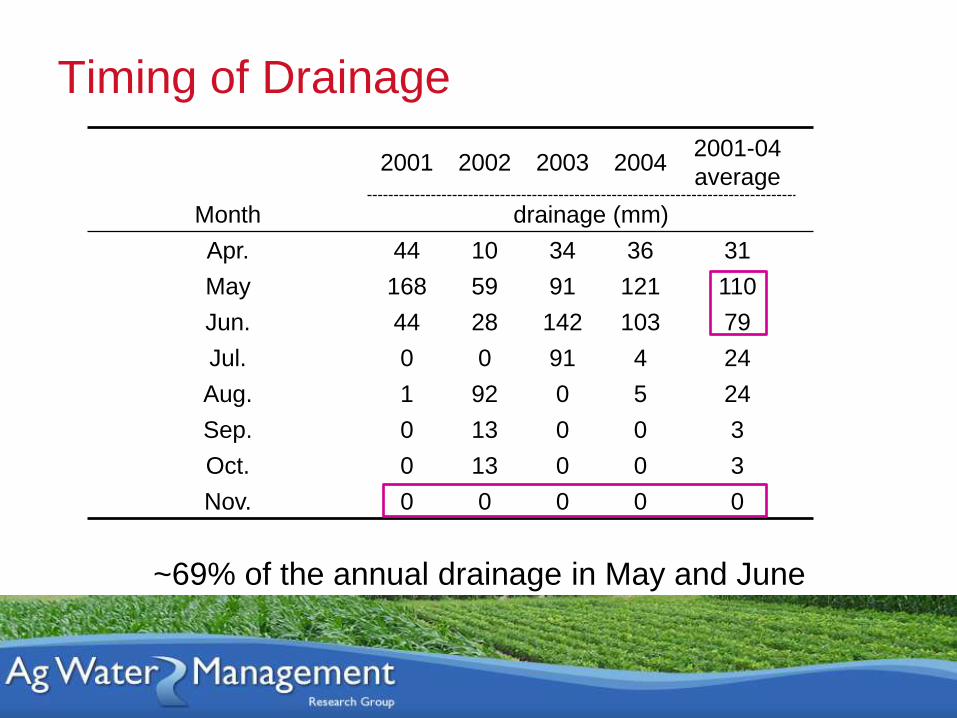
Timing of Drainage
2001 2002 2003 20042001-04
average
Month drainage (mm)
Apr. 44 10 34 36 31
May 168 59 91 121 110
Jun. 44 28 142 103 79
Jul. 0 0 91 4 24
Aug. 1 92 0 5 24
Sep. 0 13 0 0 3
Oct. 0 13 0 0 3
Nov. 0 0 0 0 0
~69% of the annual drainage in May and June
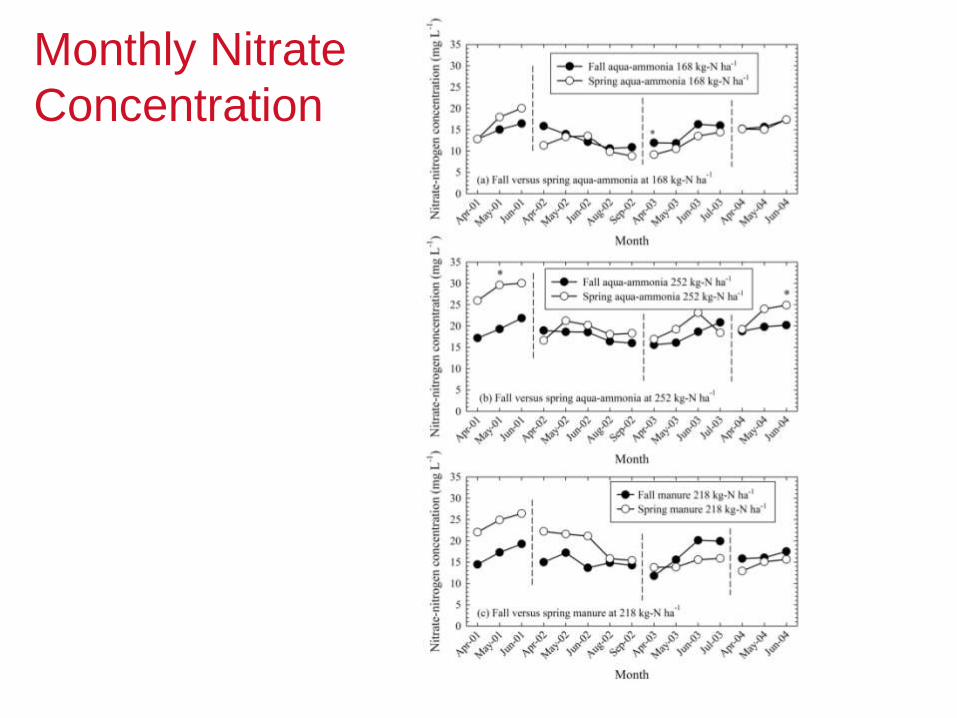
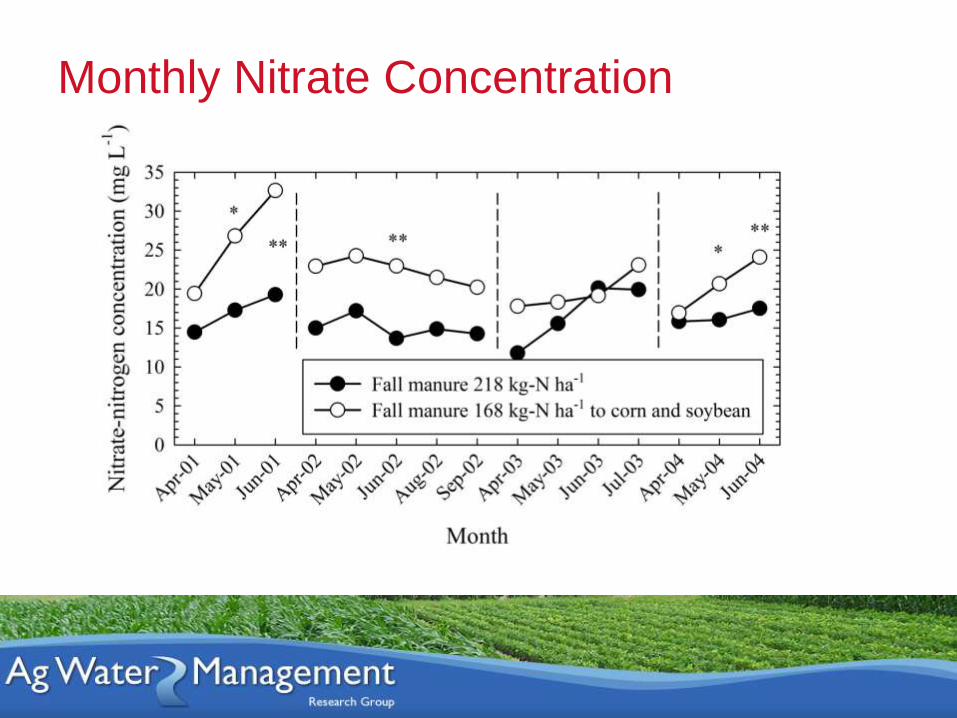
Monthly Nitrate
Concentration
Department of Agricultural and
Biosystems Engineering
Monthly Nitrate Concentration

Department of Agricultural and
Biosystems Engineering
Flow-weighted Annual Nitrate-N
Concentrations
2001 2002 2003 2004
Average
(2001-04)
Treatment NO3-N concentration (mg L-1) [a]
Fall 168 - Ammonia 14.8d 11.7c 14.7b 15.7c 14.2c
Spring 168 - Ammonia 18.0bcd 10.9c 15.0b 15.8c 14.9c
Fall 252 - Ammonia 19.5bcd 17.4ab 19.7ab 19.9ab 19.0b
Spring 252 - Ammonia 28.7a 19.3ab 23.0a 21.9a 23.2a
Fall Manure 218 17.0cd 15.6bc 18.6ab 16.0bc 16.8bc
Spring Manure 218 24.6abc 18.7ab 15.0b 15.1c 18.4b
Fall Manure 168 every year 26.3ab 22.5a 20.2ab 23.0a 23.0a
LSD0.05 8.4 5.3 6.3 4.1 3.0
[a]means within years and on average with the same letter are not significantly different at p = 0.05
Department of Agricultural and
Biosystems Engineering
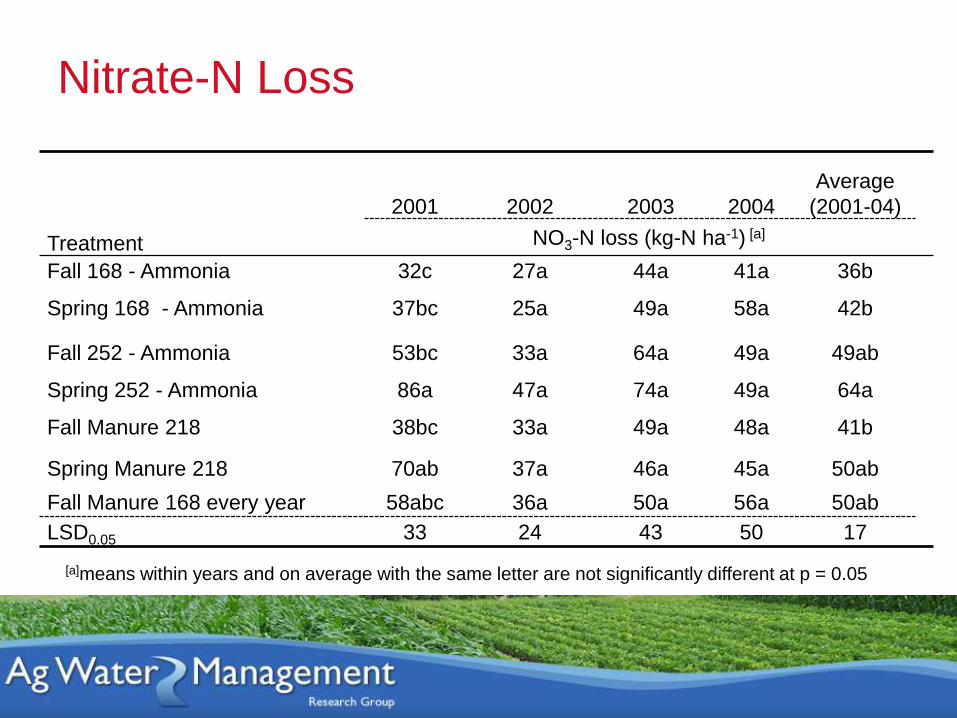
Nitrate-N Loss
2001 2002 2003 2004
Average
(2001-04)
Treatment NO3-N loss (kg-N ha-1) [a]
Fall 168 - Ammonia 32c 27a 44a 41a 36b
Spring 168 - Ammonia 37bc 25a 49a 58a 42b
Fall 252 - Ammonia 53bc 33a 64a 49a 49ab
Spring 252 - Ammonia 86a 47a 74a 49a 64a
Fall Manure 218 38bc 33a 49a 48a 41b
Spring Manure 218 70ab 37a 46a 45a 50ab
Fall Manure 168 every year 58abc 36a 50a 56a 50ab
LSD0.05 33 24 43 50 17
[a]means within years and on average with the same letter are not significantly different at p = 0.05
Department of Agricultural and
Biosystems Engineering
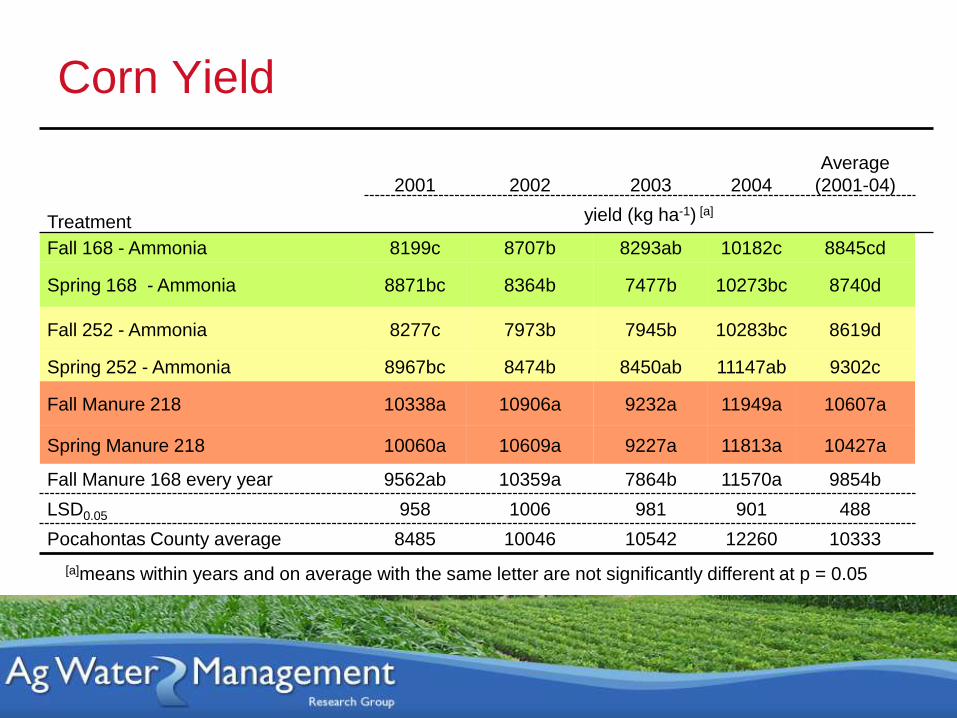
Corn Yield
2001 2002 2003 2004
Average
(2001-04)
Treatment yield (kg ha-1) [a]
Fall 168 - Ammonia 8199c 8707b 8293ab 10182c 8845cd
Spring 168 - Ammonia 8871bc 8364b 7477b 10273bc 8740d
Fall 252 - Ammonia 8277c 7973b 7945b 10283bc 8619d
Spring 252 - Ammonia 8967bc 8474b 8450ab 11147ab 9302c
Fall Manure 218 10338a 10906a 9232a 11949a 10607a
Spring Manure 218 10060a 10609a 9227a 11813a 10427a
Fall Manure 168 every year 9562ab 10359a 7864b 11570a 9854b
LSD0.05 958 1006 981 901 488
Pocahontas County average 8485 10046 10542 12260 10333
[a]means within years and on average with the same letter are not significantly different at p = 0.05
Department of Agricultural and
Biosystems Engineering
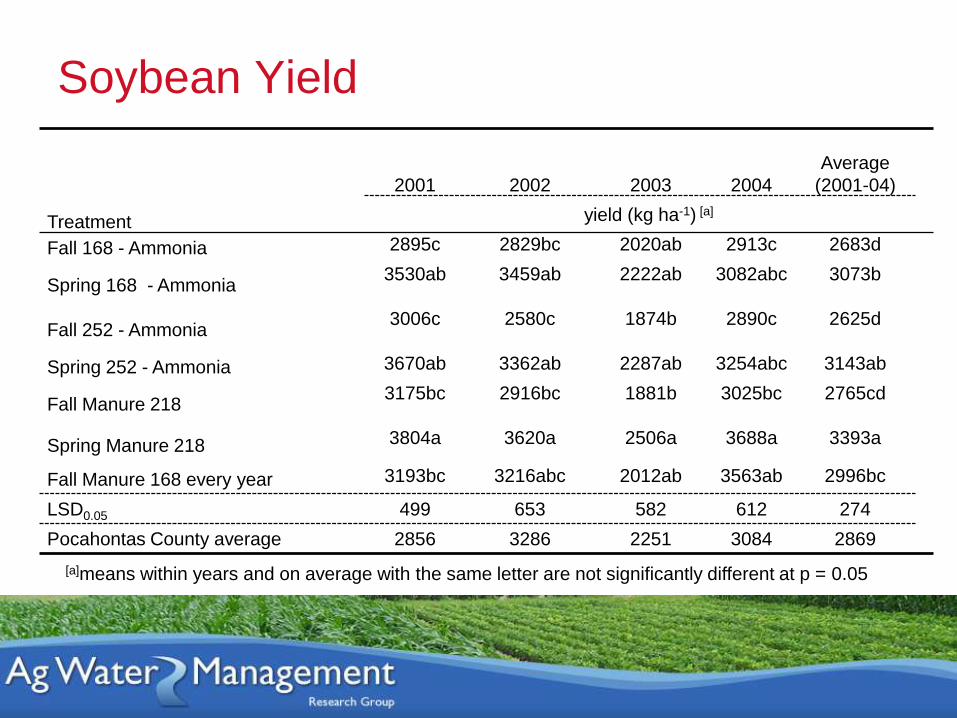
Soybean Yield
2001 2002 2003 2004
Average
(2001-04)
Treatment yield (kg ha-1) [a]
Fall 168 - Ammonia 2895c 2829bc 2020ab 2913c 2683d
Spring 168 - Ammonia3530ab 3459ab 2222ab 3082abc 3073b
Fall 252 - Ammonia3006c 2580c 1874b 2890c 2625d
Spring 252 - Ammonia 3670ab 3362ab 2287ab 3254abc 3143ab
Fall Manure 218 3175bc 2916bc 1881b 3025bc 2765cd
Spring Manure 218 3804a 3620a 2506a 3688a 3393a
Fall Manure 168 every year 3193bc 3216abc 2012ab 3563ab 2996bc
LSD0.05 499 653 582 612 274
Pocahontas County average 2856 3286 2251 3084 2869
[a]means within years and on average with the same letter are not significantly different at p = 0.05
Department of Agricultural and
Biosystems Engineering
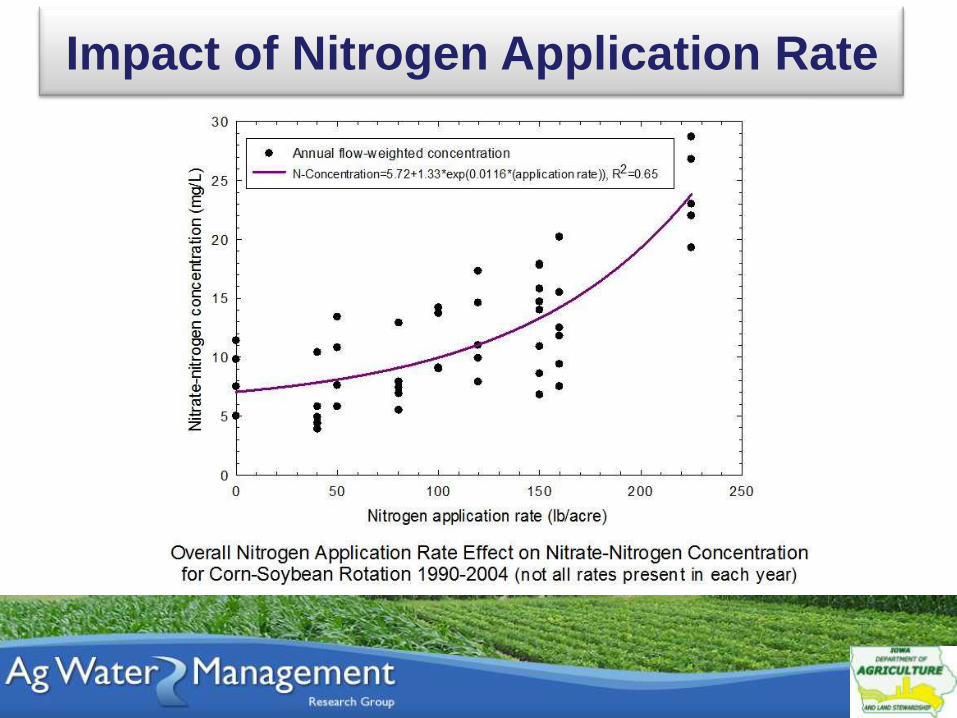
Impact of Nitrogen Application Rate
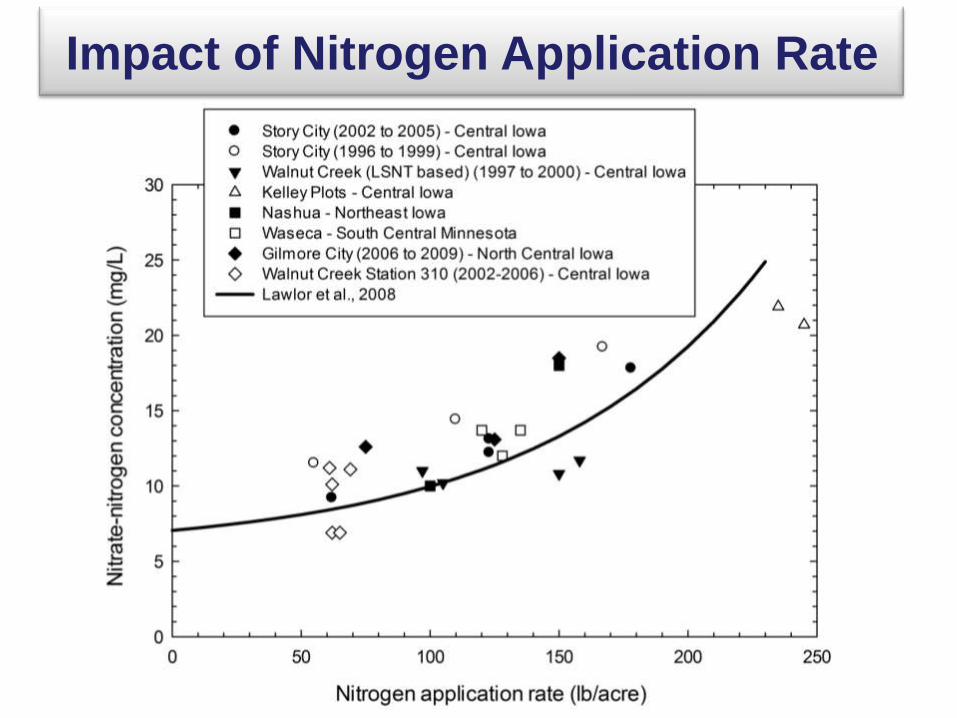
Impact of Nitrogen Application Rate

Department of Agricultural and
Biosystems Engineering
Summary• Fall or spring application of ammonia or manure
resulted in similar nitrate-N concentrations in
subsurface drainage
• Manure application every year in a corn-soybean
rotation increased nitrate-N concentrations in
subsurface drainage
• Similar nitrate-N concentrations in subsurface drainage
between liquid swine manure and ammonia
• Use of liquid swine manure increase corn yield
• Nitrogen application rate is a critical factor relative to
drainage water quality
Department of Agricultural and
Biosystems Engineering
Source
• Lawlor, P.A., M.J. Helmers, J.L. Baker, S.W.
Melvin, and D.W. Lemke. 2011. Comparison of
liquid swine manure and ammonia nitrogen
application timing on subsurface drainage water
quality in Iowa. Trans. ASABE 54(3): 973-981.
Funding
• Funding for this project was provided by the
Iowa Department of Agriculture and Land
Stewardship through the Ag. Management Fund
Department of Agricultural and Biosystems Engineering
Questions and Comments
Contact info:
Matt Helmers
219B Davidson Hall
Iowa State University
Ames, IA 50011
515-294-6717