impact of syrian refugees on the jordanian labour market · royal norwegian embassy in amman. ......
TRANSCRIPT
International Labour OrganizationRegional Office for the Arab StatesAresco Center, Justinien Street, Kantari P.O.Box 11-4088 Riad El Solh 1107-2150 Beirut – LebanonTel: +961-1-752400Fax: +961-1-752405Email: [email protected]: www.ilo.org/arabstatesFollow ILO in Arab States on Twitter: @iloarabic
ISBN 9789221295839 ISBN 9789221295846 (web pdf)
Fafo Borggata 2B/P.O.Box 2947 TøyenNO-0608 Oslowww.fafo.no
Fafo-report 2015:16ISBN 978-82-324-0198-7ISSN 0801-6143
Impact of Syrian refugees on the Jordanian labour marketBy Svein Erik Stave and Solveig Hillesund
20421-cover.indd 1 24.04.2015 09:21:47

By Svein Erik Stave and Solveig Hillesund
Impact of Syrian refugees on the Jordanian labour market
Findings from the governorates of Amman, Irbid and Mafraq
International Labour Organization Regional Office for the Arab States
and
Fafo
2
Fafo-report 2015:16 / ISBN 978-82-324-0198-7 / ISSN 0801-6143
Cover photos:
1. Construction worker in Mafraq. ILO/Nadia Bseiso
2. Syrian men cleaning a car at a petrol station in central Irbid where they work. ILO/Nadia Bseiso
3. Syrian man working at a tomato farm in Dafiana (35 KM outside the city of Mafraq). ILO/Nadia Bseiso
Cover page: Fafo Information Office
Copyright © International Labour Organization 2015 / Fafo 2015
First published 2015
Publications of the International Labour Office enjoy copyright under Protocol 2 of the Universal Copyright Convention. Nevertheless, short
excerpts from them may be reproduced without authorization, on condition that the source is indicated. For rights of reproduction or transla-
tion, application should be made to ILO Publications (Rights and Permissions), International Labour Office, CH-1211 Geneva 22, Switzerland, or
by email: [email protected]. The International Labour Office welcomes such applications.
Libraries, institutions and other users registered with reproduction rights organizations may make copies in accordance with the licen-
ces issued to them for this purpose. Visit www.ifrro.org to find the reproduction rights organization in your country.
ILO Cataloguing in Publication Data
Stave, Svein Erik; Hillesund, Solveig
Impact of the influx of Syrian refugees on the Jordanian labour market : findings from the governorates of Amman, Irbid and Magraq
/ Svein Erik Stave and Solveig Hillesund ; International Labour Office ; Fafo Institute for Applied International Studies. - Geneva: ILO,
2015
ISBN: 9789221295839; 9789221295846 (web pdf)
International Labour Office
refugee / Arabs / migrant worker / labour force participation / social integration / labour market / regional level / Syrian Arab Republic
/ Jordan
14.09.2
The designations employed in ILO publications, which are in conformity with United Nations practice, and the presentation of material
therein do not imply the expression of any opinion whatsoever on the part of the International Labour Office concerning the legal
status of any country, area or territory or of its authorities, or concerning the delimitation of its frontiers.
The responsibility for opinions expressed in signed articles, studies and other contributions rests solely with their authors, and publica-
tion does not constitute an endorsement by the International Labour Office of the opinions expressed in them.
Reference to names of firms and commercial products and processes does not imply their endorsement by the International Labour
Office, and any failure to mention a particular firm, commercial product or process is not a sign of disapproval.
ILO publications can be obtained through major booksellers or ILO local offices in many countries, or direct from ILO Publications,
International Labour Office, CH-1211 Geneva 22, Switzerland. Catalogues or lists of new publications are available free of charge from
the above address, or by email: [email protected] Visit our website: www.ilo.org/publns
For ILO Regional Office for Arab States publications, please contact:
ILO Regional Office for Arab States
P.O.Box 11-4088 Riad El Solh 1107-2150
Beirut – Lebanon
Publications are available on: www.ilo.org/arabstates
Printed in (Jordan)
Preface
This report presents the main findings of a household survey conducted in the Jordanian governorates of Amman, Irbid and Mafraq between February and March 2014, aimed at assessing the implications of the large influx of Syrian Refugees onto the labour market in the three geographical areas. The results are based on information gathered on the current labour market situation, as well as some of the changes that have occurred since the beginning of the Syrian Refugee influx into Jordan in March 2011.
The study was initiated by the International Labour Organization (ILO) and carried out and led by Fafo Institute for Applied International Studies (Fafo), alongside the Jordanian Department of Statistics (DoS) who executed the fieldwork. The ILO is the main funder of the study, with an additional contribution from the Norwegian Ministry of Foreign Affairs (MFA) through the Royal Norwegian Embassy in Amman. The study was led by Svein Erik Stave, Research Director of Sustainable Development and Living-conditions at Fafo. The main report was written by Solveig Hillesund and Svein Erik Stave, with contributions from Åge Tiltnes from Fafo, and Mary Kawar and Maha Kattaa from ILO.
The report is based on three separate tabulation reports presenting a total of nearly one thousand tables of the survey data, produced by Jing Liu at Fafo’s Beijing office in collaboration with Solveig Hillesund, Huafeng Zhang and Jon Pedersen, the Head of Research at Fafo, who was also responsible for the quality assurance of the study. Working in close collaboration with DOS, Akram Athalla from Fafo’s regional office in Palestine was responsible for training and supervising the interviewers during the implementation of the household survey. Social Anthropologist Mona Abdel-Fadil was responsible for the qualitative interviews and analyses of the study, and Khalid Wazani, chairman of Issnaad Consulting, acted as local consultant and supervisor.
The following staff from the Department of Statistics were involved in planning and implementation of the household questionnaire surveys: Mohammad Al-Jundi, Amer Aljammal, Ramadan Abu Haia, Kamal Shboul, Abdalwahed Alharaizeh, and Ghaida Khasawneh.
Secretary General Assistant Dr Mohammad Al Qudah, and Suha Labadi, from the International Relations Directorate of the Ministry of Labour have provided invaluable assistance in coordinating the study with the work and the needs of the Ministry.
Frank Hagemann, Deputy Director of the ILO Regional Office for Arab States, has been responsible for leading the ILO team in providing technical advice and assistance, alongside Mary Kawar, Senior Employment Policy Specialist, and Maha Kattaa, coordinator of the ILO response to the Syrian refugee crisis in Jordan.
The ILO and Fafo team
3
Executive summary
The Jordanian government and people are highly, and rightfully, concerned about the potentially serious economic and social effects of the large influx of Syrian refugees to the country, including potential negative effects on the labour market.
According to UNHCR there are currently about 616,000 Syrian refugees in Jordan, of whom more than 500,000 live in Jordanian communities outside camps. The Syrian refugee population in Jordan is equivalent to about 10 per cent of the total population in Jordan prior to the Syrian crisis (2010), and puts heavy pressure on the Jordanian society and economy, including the labour market.
The largest numbers of Syrian refugees are located in the northern governorates of the country. Amman, Irbid and Mafraq governorates alone are hosting more than 76 per cent of all the Syrian refugees in Jordan. Syrian refugees constitute 52 per cent of the total population of Mafraq, with nearly half living in communities outside the refugee camps. Syrian refugees constitute 12 per cent of the total population of Irbid, and 7 per cent of the total population of the Amman governorate1.
There are already reports of significant impacts from the influx of Syrian refugees on the Jordanian labour market, and there are strong concerns about the effects on available job opportunities, wage levels, working conditions, access to work, etc., for Jordanians as well as for the refugees and immigrant workers. This is of particular concern in the northern governorates, where the share of Syrian refugees and the pressure on the labour market are greatest.
This report presents the results from a study on the situation and changes in the Jordanian labour market in relation to the large influx of Syrian refugees to the country since March 2011. The study is primarily based on a household survey carried out in February and March 2014, and which covered a total of 3,800 households in the governorates of Amman, Irbid and Mafraq, including the Zaatari refugee camp. In addition, complementary information has been obtained from qualitative interviews and from secondary sources, including reports and news media.
The general objective of the study has been to assess the implications of the large influx of Syrian refugees to Jordan on the country’s labour market, primarily by identifying current trends and future threats that can be attributed to the influx of Syrian refugees. Although the main focus of the report is on implications for Jordanians, the survey also covers the situation for Syrian refugees and their interrelationship with the Jordanian labour market. This aspect is not only important for improving the knowledge on the refugees’ situation as such, but also for better understanding the present and future labour market implications for Jordanians.
This analytical report is accompanied by three separate tabulation reports, which present the results from the household survey in more detail for the three population groups covered in the
1 Estimates based on UNHCR statistics of Syrian refugees in Jordan (http://data.unhcr.org/syrianrefugees/country.php?id=107) and DoS Population Statistics for 2011 (http://www.dos.gov.jo/dos_home_e/main/).
4
survey, respectively: The Jordanian host population; the Syrian refugee population outside refugee camps; and the Syrian refugee population inside Zaatari refugee camp.
Key findings
Demographic characteristics of the Syrian refugee population in Jordan provide important background information for understanding their interactions with the Jordanian labour market today. The general demographic picture of the refugees is that the vast majority of them come from rural areas in Syria; they constitute a relatively young population compared to the Jordanian host population; and, perhaps most importantly with respect to the labour market, they have considerably lower education compared to Jordanians. 60 per cent of the Syrian refugees above the age of 15 have never completed basic schooling, and only about 15 per cent of the refugees have completed secondary education, compared to 42 per cent of Jordanians above the age of 15.
Another key characteristic with respect to the refugees’ interaction with the labour market is the low enrolment rate of Syrian children in basic schools. While nearly 100 per cent of Jordanian children are enrolled in basic schools, only 65 per cent of Syrian children are enrolled. Furthermore, about 95 per cent of Jordanian children are still enrolled in school at the age of 17, while the enrolment rate for Syrian children starts declining from the age of 11, and by the age of 15 less than 40 per cent of Syrian children are enrolled in school.
When it comes to the work experience and background of the Syrian refugees living outside camps, 63 per cent of the men participated in the labour market in Syria before the crisis started in March 2011, while at the same time the unemployment rate was 17 per cent. At present, about 51 per cent of the Syrian men living outside camps participate in the Jordanian labour market, while the unemployment rate is as high as 57 per cent. Only 7 per cent of Syrian women participate in the Jordanian labour market, which is similar to their participation rate in Syria before the crisis. The unemployment rate of Syrian women before they became refugees in Jordan was about 28 per cent, while the present unemployment rate for Syrian women living outside camps is 88 per cent. In combination with the low participation rate of Syrian women, this means in practice that relatively few Syrian women are engaged in paid work in Jordan at present.
Before they became refugees, Syrians who live outside camps in Amman, Irbid and Mafraq mainly worked in industries of construction (23 per cent), wholesale and retail sale (23 per cent), manufacturing (16 per cent), transportation and storage (10 per cent), and agriculture, forestry and fishing (9 per cent). With respect to occupations, Syrian refugees living outside camps today mainly worked as craft and related trade workers (39 per cent), service and sales workers (22 per cent), plant and machine operators and assemblers (12 per cent), and as skilled agricultural, forestry and fishing workers (7 per cent) before the Syrian crisis started in March 2011.
At present, more than 40 per cent of employed Syrians outside camps in Amman, Irbid and Mafraq work in the construction industry, while 23 per cent work in the wholesale and retail trade and repair industry, 12 per cent in manufacturing, and 8 per cent in the accommodation and food service industry. When it comes to occupations, 53 per cent of the Syrian refugees employed
5
outside camps work as craft and related trade workers, 24 per cent as service and sales workers, and 12 per cent in elementary occupations.
The labour market situation for Jordanians prior to the Syrian crisis was characterised by a labour participation rate of 67 per cent among men and about 18 per cent among women, which is relatively low but considerably higher than among Syrian women. The total unemployment rate among Jordanians prior to the Syrian conflict was just above 14 per cent. Both female unemployment as well as youth unemployment (15-25 years) was considerably higher than this average, standing at around 30 per cent for both groups.
At present the labour force participation rate for Jordanians is similar to what it was before the Syrian crisis, while the unemployment rate has increased from 14.5 to 22.1 per cent. Current unemployment rates are highest among youth, and among the lowest educated and poorest segments of the population.
In terms of industry, most employed Jordanians worked in the public administration and defence industry (25 per cent) before the crisis in Syria, while 18 per cent worked in the wholesale and retail trade and repair industry, 11 per cent in the education sector, and 11 per cent in the manufacturing industry. The distribution of workers between the different sectors at present is almost identical to what it was prior to the Syrian crisis. The same picture of stability is found for the distribution of workers between different occupations as well, where most Jordanians work as service and sales workers (25 per cent), as craft and related trades workers (20 per cent), and as professionals (18 per cent).
Perhaps the most interesting finding related to change in industrial occupations among Jordanians is the fact that about 30 per cent of the workers who were employed in construction and in agriculture just before the crisis in Syria do not work in these industries today, while the corresponding percentages in all other industries are between 0 and 20. Moreover, the share of total Jordanian male workers employed in the construction industry has decreased from 9 to 7 per cent from March 2011 to March 2014, of which the main decrease is seen in the age group of 15-25. At the same time, the share of total Syrian refugee workers in the construction industry has increased quite substantially, indicating that Jordanians might have been crowded out of this industry by Syrians to some extent. Similar signs of out-crowding can be found in the wholesale and retail trade industry, in which 23 per cent of the Syrian refugee workers outside camps have found work.
Another key finding is related to the fact that refugee status of Syrians does not include the right to work in Jordan. Consequently, only about 10 per cent of employed Syrians have obtained formal work permits, and practically all Syrian refugees working outside camps do not have work permits and are as such employed in the informal economy and outside the bounds of Jordanian labour law. The implications of this fact are, however, more interesting when looking at the present trend in the expanding informal employment sector, which is characterised by low and declining wages, longer working days, and poor working conditions and regulations, including lack of proper work contracts.
Although informally employed Jordanian workers face many of the same challenges as informally employed Syrian workers, findings show that Syrian workers are generally being paid less, have to
6
work more, and have poorer contracts compared to Jordanians in the same sector. A likely explanation of this situation is that Syrian refugees are willing to work for lower wages than Jordanians, which is also underscored by the survey finding of a widespread agreement among both Jordanians and Syrians that Syrian workers are willing to accept jobs and wages that Jordanians would not accept.
Economic activities carried out by children are substantially more prevalent among Syrian children living outside camps than among Jordanian children. Only 1.6 per cent of Jordanian boys in the age group 9-15 are economically active, while more than 8 per cent of Syrian boys in the same age group are economically active. In the age group 15-18, about 37 per cent of Syrian boys are economically active, compared to about 17 per cent of Jordanian boys. This picture corresponds well with the school enrolment rates describe above.
Child employment among Jordanian boys in the age of 9-15 is less than 1 per cent, while the corresponding figure for Syrian boys is 3 per cent. Almost 14 per cent of Syrian boys in the age of 15-18 are employed, compared to 8 per cent of Jordanian boys in the same age. Figures describing child employment in Syria prior to the crisis suggest that the relatively high percentage of Syrian boys being employed in Jordan today is similar to the percentage where the refugees came from.
General conclusions
From a Jordanian perspective, four main implications of the influx of Syrian refugees on the Jordanian labour market can be derived from this study:
A loss of opportunity for increased employment of Jordanians in newly emerged low-skilled jobs: The majority of Syrian refugees who have obtained work in Jordan seem to occupy jobs that have emerged during the arrival of refugees from Syria, that is, primarily low-skilled/lower wage jobs in an expanded informal sector. Whether these jobs have emerged as a result of government policies directed towards dealing with the relatively large unemployment rates that existed also prior to the influx of Syrian refugees, and in particular the high rates among youth, or as a consequence of a growing aid economy and increased demands due to the influx of Syrians, is difficult to assess. In any case, it can be argued that many of these jobs could have been available to Jordanians, particularly youth, if they were not occupied by Syrian refugees, and that a prime cause of this is that Jordanians are out-competed by the refugees who are willing to accept considerably lower wages and poorer working conditions than Jordanians. Clear signs of this can be seen in the construction industry, where Syrian refugees have benefited from an increasing number of jobs in the sector, while the share of Jordanians working in construction has slightly decreased.
Increased unemployment and competition for existing jobs: There are some signs of Syrian refugees also entering into jobs that were part of the job market that existed prior to their arrival, and hence that they do to some degree push Jordanians out of the labour market. A general sign of this is the increase in the unemployment rate of Jordanians from 14.5 to 22.1 per cent between 2011 and 2014, and particularly the increase from 19 to 35 per cent unemployment among the
7
youngest age group of 15–24 years, indicating that it has become more difficult for young and new Jordanian workers to enter the labour market. A more specific sign is the increase in employment of Syrians in the construction industry from 2011 to 2014 in combination with a relatively high number of Jordanian workers who have dropped out of this sector since the start of the Syrian crisis. A similar trend of increased competition can be sensed for the wholesale and retail sector, in which a large share of Syrian refugees living outside camps has found jobs (23 per cent). About 18 per cent of the Jordanian workers are employed in the same sector, which is similar to the share who worked in this sector prior to the crisis in Syria and thus another sign of “loss of opportunities” as described above. However, signs of crowding out do not seem to be a general implication of the influx of Syrians in other sectors up to date, but, again, more a problem related to “loss of opportunities” as described above.
Future threats of crowding out in the labour market: Although signs of crowding out are relatively modest in most sectors at present, with clearer signs in the construction and wholesale and retail sectors, the low participation rate and high unemployment rate of Syrian refugees poses a serious threat to the labour market in future. It is reasonable to assume that access to humanitarian aid and other types of support prevent many Syrian refugees from entering the labour market today. If no measures are taken, a large number of these refugees will potentially enter into the labour market once the humanitarian aid is scaled down and ultimately stopped. At the same time, it is a likely scenario that the conflict in Syria will last for a long time, and that many Syrians will remain in Jordan for years to come.
An overall deterioration in working conditions leading to increased decent work deficits in Jordan: A main finding of the study is that Syrians are willing to accept lower wages and harsher working conditions compared to Jordanians. The impact of this is not just crowding out the Jordanians but also an increased informalisation of the Jordanian labour market, making compliance with labour standards a serious threat for all workers alike. Deteriorating labour standards also put more strain on the Jordanian authorities in terms of their ability to enforce existing labour laws such as compliance with the minimum wage.
Policy recommendations
In order to address these main types of implications of the influx of Syrian refugees on the Jordanian labour market, the following key policy recommendations are given:
Address and formalize the informal economy and reduce informal employment All four main types of implications presented above are strongly related to size and conditions of the informal economy and to informal employment. A large share of low-skill and low wage jobs are found in the informal economic sector, and it is no surprise that practically all Syrian refugees are informally employed in this sector given their background and their status as refugees. However, the informality of the market gives the refugees a comparative advantage over Jordanians who might compete for the same jobs, due to their willingness to accept lower wages and poorer conditions. Furthermore, the unregulated and strongly competitive nature of the informal economy also leads to unsustainable conditions for the workers who become informally employed, including the Syrian refugees themselves. In addition, the large and seemingly
8

expanding informal employment sector is characterized by low productivity and few direct contributions to the national economy. Findings from this and other studies also clearly show that minimum wage limits are not respected in the informal sector in general, and that high numbers of Syrian refugees, and probably also many vulnerable Jordanians, are paid far less than the stated minimum wages in Jordan. In addition to addressing informal employment more widely, direct and short-term measures should be implemented to deal with this problem specifically.
Encourage private sector to employ Syrian refugees in sectors where migrant workers are permitted to work One step towards dealing with the problem of informalisation, and the negative labour condition aspects associated with the informal labour market, would be to actively encourage formal employment of Syrian refugees in sectors that are open to migrant workers. A controlled inclusion of Syrian refugee workers into the Jordanian labour market has the potential of lowering some of the present tensions in the labour market as identified in this study. It could also contribute to a more regulated labour market in the future, with particular respect to a situation where humanitarian aid is being scaled down and the pressure on the labour market from Syrian refugees still present in Jordan is likely to increase. Encouragement of the private sector might play an important role in such a strategy, but an encouragement strategy also has to be closely coordinated with adaptations in the regulatory system, and with the authorities who issue work permits. Clarify realistic scenarios for the development of the Jordanian labour market as basis for any strategy on the labour market The key to any successful strategy is to base it on realistic scenarios, and to utilize the identified actors and forces in play to contribute towards realistic visions. As an example, it may be recommended that two overarching premises should guide any policy related to Syrian refugees’ relationship with the Jordanian labour market: 1) Syrian refugees will most probably be in Jordan and make implications on the labour market for many years to come, and 2) focus should be kept on how Syrian refugees involvement in the Jordanian labour market can be formalised in ways that could be beneficial for the Jordanian economy. And here, given a possible protracted situation of Syrian refugees in Jordan and also in order to avoid even larger challenges when development aid and international support are decreased, the sooner this issue is addressed the better
Maximize the short-term employment potential of the aid economy and coordinate measures between international community and the government of Jordan The high unemployment rates among Jordanians, particularly youth, as well as among Syrian refugees should be addressed by maximizing short-term employment and capacity building opportunities in relation to the activities of development aid organizations in the study governorates. This could directly create new job opportunities for Jordanians as well as ease pressure in other parts of the labour market by livelihoods support to Syrian refugees. It could also contribute to boosting local economies and thereby create additional jobs. Attention must however be given to the sustainability of such interventions to avoid potential collapse when development aid activities are scaled down in the future. Furthermore, international organizations
9
and donors are key actors that influence the Jordanian labour market directly and indirectly. Coordination of these actors’ activities related to the labour market is important to maximize efforts towards dealing with identified challenges, and a clear and comprehensive national strategy is important in guiding international efforts in a coordinated direction and according to the visions of the Jordanian government.
Improve linkages with the National Employment Strategy The National Employment Strategy (NES) provides a vision for an inclusive and productive labour market. The Strategy document is complemented by an Action Plan, which was approved by the Council of Ministers in May 2011. The final Action Plan was then further elaborated into an Implementation Plan which outlined for each action the main public agency responsible for oversight and delivery of the action, other implementation partners, resources required and a timetable. Currently the NES Action Plan, if adjusted only slightly, can provide the right framework for Jordan’s best response to the labour market impact of Syrian refugee crisis. It is critical to link this response with the existing national policy framework. For example, there are currently a large number of livelihoods programmes in Jordan addressing both Jordanian host communities as well as Syrian refugees. Coordination and coherence between these different programmes is quite pertinent. There is a definite need for a national coordinating mechanism led by the Ministry of Labour and linked to NES implementation. This also should include ministerial collaboration and coordination in establishing a common monitoring and evaluation system in order to build sustainable processes at the national level. Otherwise the impact of the efforts addressing host communities and refugees will remain limited and unsustainable.
Promote school enrolment among Syrian children While the Jordanian authorities have generously opened Jordanian schools for Syrian children, the low school enrolment rate among Syrian children have both short- and long-term implications on the labour market. First, it contributes to a relatively high child labour activity at present, and second, it has implications for the long term employment opportunities for the children not attending school, possibly in the Jordanian labour market. Strengthening the national framework of child labour to Syrian child labourers can help to implement a comprehensive and integrated policy on the labour market.
10
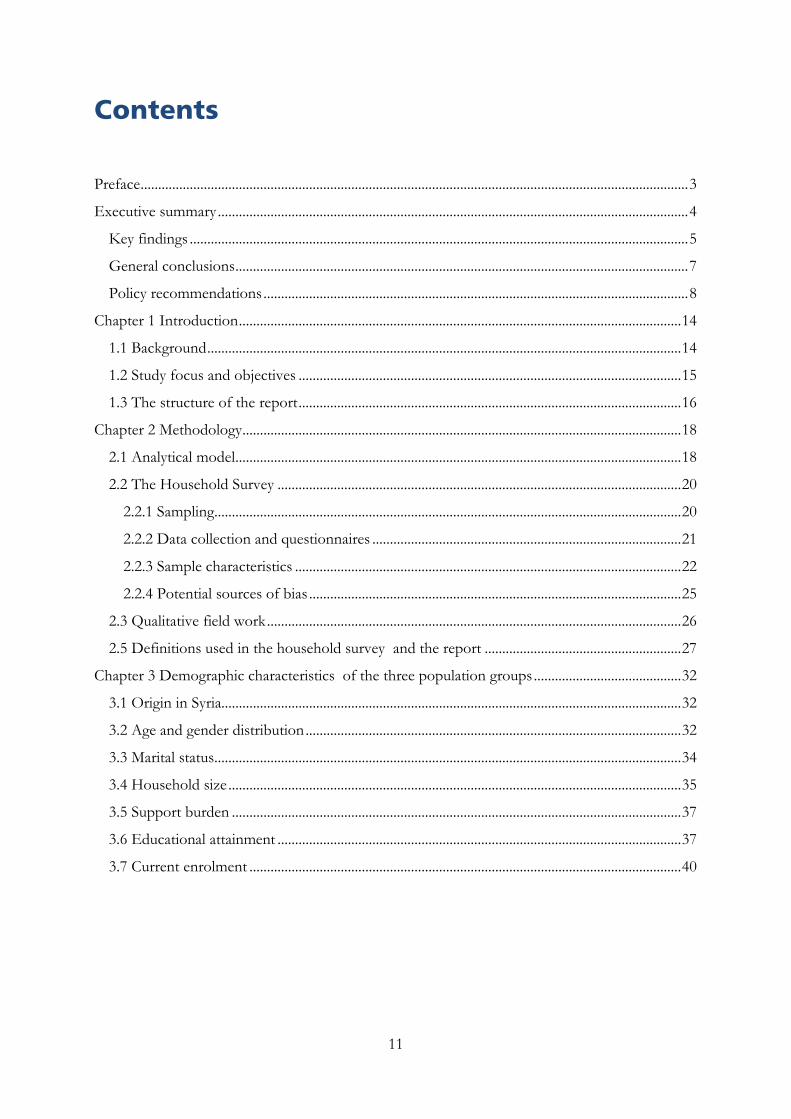
Contents
Preface ............................................................................................................................................................ 3
Executive summary ...................................................................................................................................... 4
Key findings .............................................................................................................................................. 5
General conclusions ................................................................................................................................. 7
Policy recommendations ......................................................................................................................... 8
Chapter 1 Introduction .............................................................................................................................. 14
1.1 Background ....................................................................................................................................... 14
1.2 Study focus and objectives ............................................................................................................. 15
1.3 The structure of the report ............................................................................................................. 16
Chapter 2 Methodology ............................................................................................................................. 18
2.1 Analytical model ............................................................................................................................... 18
2.2 The Household Survey ................................................................................................................... 20
2.2.1 Sampling ..................................................................................................................................... 20
2.2.2 Data collection and questionnaires ........................................................................................ 21
2.2.3 Sample characteristics .............................................................................................................. 22
2.2.4 Potential sources of bias .......................................................................................................... 25
2.3 Qualitative field work ...................................................................................................................... 26
2.5 Definitions used in the household survey and the report ........................................................ 27
Chapter 3 Demographic characteristics of the three population groups .......................................... 32
3.1 Origin in Syria................................................................................................................................... 32
3.2 Age and gender distribution ........................................................................................................... 32
3.3 Marital status ..................................................................................................................................... 34
3.4 Household size ................................................................................................................................. 35
3.5 Support burden ................................................................................................................................ 37
3.6 Educational attainment ................................................................................................................... 37
3.7 Current enrolment ........................................................................................................................... 40
11

Chapter 4 Labour force participation and unemployment ................................................................. 42
4.1 Labour force participation .............................................................................................................. 42
4.2 Unemployment ................................................................................................................................. 46
Chapter 5 Work experience and access to employment ...................................................................... 51
5.1 Current and previous employment ............................................................................................... 52
5.2 Employment by industry ................................................................................................................ 53
5.3 Employment by occupation ........................................................................................................... 56
5.4 Employment Status ......................................................................................................................... 58
5.5 Sector of employment ..................................................................................................................... 59
5.6 Method used to find main job ....................................................................................................... 59
5.7 The labour market in the Zaatari refugee camp .......................................................................... 61
Chapter 6 Labour regulations, informal employment, underemployment, and stability ................ 63
6.1 Labour regulations and access to work ........................................................................................ 63
6.2 Stability of employment .................................................................................................................. 65
6.3 Informal employment ..................................................................................................................... 66
6.4 Underemployment and inadequate work ..................................................................................... 70
6.5 Distance to work .............................................................................................................................. 71
Chapter 7 Working conditions ................................................................................................................. 72
7.1 Hours of work .................................................................................................................................. 73
7.2 Payment ............................................................................................................................................. 74
7.3 Contractual arrangements and practice ........................................................................................ 75
7.3.1 Type of contract ....................................................................................................................... 76
7.3.2 Hours, salary, task and termination rules .............................................................................. 77
7.3.3 Social security ............................................................................................................................ 79
7.3.4 Additional payments ................................................................................................................ 81
7.3.5 Paid leave ................................................................................................................................... 82
7.3.6 Non-pay benefits ...................................................................................................................... 83
7.4 Occupational health and safety ...................................................................................................... 84
7.4.1 Perceptions of workplace safety ............................................................................................. 84
7.4.2 Work-related hazards and protective equipment ................................................................. 85
7.4.3 Workplace conflicts .................................................................................................................. 85
7.5 Trade union membership ............................................................................................................... 86
12
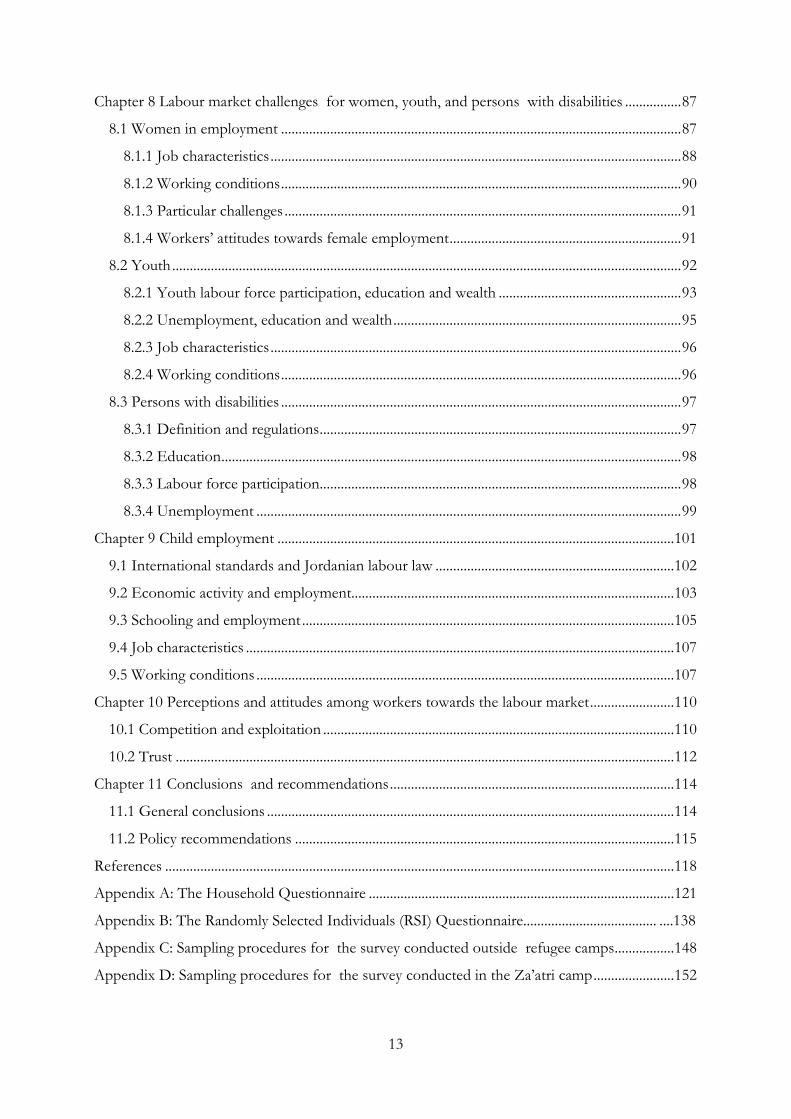
Chapter 8 Labour market challenges for women, youth, and persons with disabilities ................ 87
8.1 Women in employment .................................................................................................................. 87
8.1.1 Job characteristics ..................................................................................................................... 88
8.1.2 Working conditions .................................................................................................................. 90
8.1.3 Particular challenges ................................................................................................................. 91
8.1.4 Workers’ attitudes towards female employment .................................................................. 91
8.2 Youth ................................................................................................................................................. 92
8.2.1 Youth labour force participation, education and wealth .................................................... 93
8.2.2 Unemployment, education and wealth .................................................................................. 95
8.2.3 Job characteristics ..................................................................................................................... 96
8.2.4 Working conditions .................................................................................................................. 96
8.3 Persons with disabilities .................................................................................................................. 97
8.3.1 Definition and regulations ....................................................................................................... 97
8.3.2 Education ................................................................................................................................... 98
8.3.3 Labour force participation....................................................................................................... 98
8.3.4 Unemployment ......................................................................................................................... 99
Chapter 9 Child employment ................................................................................................................. 101
9.1 International standards and Jordanian labour law .................................................................... 102
9.2 Economic activity and employment............................................................................................ 103
9.3 Schooling and employment .......................................................................................................... 105
9.4 Job characteristics .......................................................................................................................... 107
9.5 Working conditions ....................................................................................................................... 107
Chapter 10 Perceptions and attitudes among workers towards the labour market ........................ 110
10.1 Competition and exploitation .................................................................................................... 110
10.2 Trust .............................................................................................................................................. 112
Chapter 11 Conclusions and recommendations ................................................................................. 114
11.1 General conclusions .................................................................................................................... 114
11.2 Policy recommendations ............................................................................................................ 115
References ................................................................................................................................................. 118
Appendix A: The Household Questionnaire ....................................................................................... 121
Appendix B: The Randomly Selected Individuals (RSI) Questionnaire...................................... ....138
Appendix C: Sampling procedures for the survey conducted outside refugee camps ................. 148
Appendix D: Sampling procedures for the survey conducted in the Za’atri camp ....................... 152
13

Chapter 1 Introduction
1.1 Background
According to UNHCR there are currently about 616,000 Syrian refugees in Jordan, of whom more than 500,000 live in Jordanian communities outside camps. The Syrian refugee population in Jordan is equivalent to about 10 per cent of the total population in Jordan prior to the Syrian crisis (2010), and puts heavy pressure on the Jordanian society and economy, including the labour market.
The largest numbers of Syrian refugees are located in the northern governorates of the country. Amman, Irbid and Mafraq governorates alone are hosting more than 76 per cent of the total Syrian refugee population in Jordan. Syrian refugees constitute 52 per cent of the total population of Mafraq, with nearly half living in communities outside the refugee camps. Syrian refugees constitute 12 per cent of the total population of Irbid, and seven per cent of the total population of Amman governorate2.
There are already reports of Syrian refugees having significant impacts on the Jordanian labour market, and there are strong concerns about the effects on available job opportunities, wage levels, working conditions, access to work, and other aspects of the labour market related to Jordanians, Syrians and other immigrant workers. This is of particular concern in the northern governorates where the share of Syrian refugees, and the pressure on the labour market, is largest.
Concerns are also based on the fact that the Jordanian labour market already had a number of challenges before the Syrian crisis started. In 2010, the national unemployment rate was 12.7 per cent, and had been around that level for some time already (ILO 2012). In addition, Jordan had one of the lowest labour force participation rates in the world, and one of the lowest female participation rates, with only 14 per cent of women participating in the labour force, compared with 65 per cent of men. Furthermore, the national youth unemployment rate (persons aged 15-24 years) was as high as 41.3 per cent in 2012 (DOS 2012).
Before and at the start of the Syrian crisis, job creation in Jordan was predominantly in low status and low-skilled roles. This trend paved the way for a large number of low-skilled foreign workers in the country. In the beginning of the Syrian crisis, 335,000 foreign workers were officially employed in Jordan, of whom almost 90 per cent were illiterate, according to 2009 statistics (ILO 2012). Seventy per cent of foreign workers in Jordan in 2009 were Egyptians. More than 96 per cent of foreign workers received wages of less than 199 JOD in 2009, contributing to an effective decline in real wages over time (ILO 2012).
A number of studies have already been carried out to assess the impacts of the influx of Syrians on the Jordanian economy, including impacts on the labour market. Among the most recent research dealing with impacts on the labour market is the preliminary study of impacts on the
2 Estimated from UNHCR refugees statistics (June 2014) and DoS population statistics (2011).
14
labour market conducted by ILO (ILO 2014), and the joint needs assessment review of the impact of the Syrian crisis on Jordan conducted by the Government of Jordan in collaboration with UNDP and HCSP in November 2013 (UNDP/HCSP 2013).
Previous studies generally indicate that the influx of Syrian refugees could have severe implications for the Jordanian labour market in many fields. Given the fact that the number of Syrian refugees has increased dramatically since many of these studies were conducted, it is of vital importance to obtain more, and better, information on the situation in the labour market to guide response strategies aimed at addressing challenges and priorities pertaining to the Jordanian labour market.
1.2 Study focus and objectives
The general objective of this study has been to assess the implications of the large influx of Syrian refugees to Jordan on the country’s labour market, primarily by identifying current trends and future threats that can be attributed to the influx of Syrian refugees. Although the study’s main focus is on implications for Jordanians, it also looks at Syrian refugees and their interrelationships with the Jordanian labour market. This important not only for improving our knowledge of the refugees’ situation as such, but also for better understanding the present and future labour market implications for Jordanians.
More specifically the study had the following main objectives:
1. Assess the implications of the Syrian crisis on the Jordanian labour market with a particular focus on the northern governorates of Irbid, Mafraq, and Amman. This includes analysing: 1) the impact of Syrians competing with the Jordanians and/or other migrants in the private/informal sector; 2) the impact of Syrians on the unemployment rate in the Jordanian labour market; and 3) the capacity of the Jordanian labour market to provide employment to Syrians.
2. Provide a better understanding of the occupational and employment profile of Syrian refugees in Jordan, including the skills brought in by the refugees.
3. Propose a set of policy recommendations that would guide the development of an ILO response strategy aimed at addressing challenges and priorities pertaining to employment and livelihoods of Syrian refugees and Jordanian hosting communities. These areas of intervention would be integrated in the UN Inter-Agency Regional Response Plan for Syrian Refugees (RRP) and in the efforts of the Jordan UN Country Teams to support the vulnerable hosting communities who are directly affected by the Syrian crisis.
The main focus of the study has been on implications on the labour market in host communities (outside camps), both with respect to Jordanians as well as to Syrian refugees. More specifically, the study covers the following dimensions:
15

a. Characteristics of the refugees, including their educational background, occupational profile, and the sectors in which they have been employed so far or have potential to be employed.
b. Extent to which the Syrian refugees have had an impact on: 1) Jordanians’ ability to access job opportunities (i.e. crowding effect in the Jordanian labour market)3, and 2) the working conditions of Jordanians.
c. Current working conditions of Syrian refugees, including contractual arrangements, hours of work, remuneration in cash and kind, access to social protection, occupational safety and health, and share of transport costs on salary.
d. Challenges facing women in the labour market and available job opportunities.
e. Challenges facing youth and persons with disabilities.
f. The phenomenon of child labour among the Syrian refugee community.
g. Access to the labour market, including legal constraints and barriers that prevent refugees from accessing the formal labour market (e.g. ease of obtaining work permit), and share of the refugees working in the informal economy.
h. Specific recommendations and entry points that would inform an ILO response strategy to support Syrian refugees and the Jordanian hosting communities in the areas of jobs, livelihoods, disability and skills development. These recommendations will be based on priorities identified as a result of this assessment and ILO’s mandate and comparative advantages.
1.3 The structure of the report
The many aspects to be covered in the report pose some challenges to the way the results are presented. In general, the structure of the report is based on the themes defined in the objectives of the study.
The next chapter (2) describes the data collection methods used for the study, the primary of which was a specially designed household questionnaire survey, implemented by the Department of Statistics (DoS) in the governorates of Amman, Mafraq and Irbid (the study governorates) in February and March 2014
Chapter 3 provides an overview of key demographic characteristics of the three population groups covered in the study: 1) The Jordanian host population; 2) The Syrian refugee population outside camps; and 3) the Syrian population in the Zaatari camp.
Chapters 4 to 10 present the main results from the Impact of Syrian Refugees on the Jordanian Labour Market household survey, primarily organized according to the themes defined in the study objectives, supplemented by data from qualitative interviews and secondary sources.
The last chapter (11) summarizes the main findings from the study and provides some policy recommendations based on the findings.
3 One major concern of the Jordanian government in relation to the Syrian crisis and the influx of refugees into Jordan is social unrest.
16

This analytical report is primarily based on the Impact of Syrian Refugees on the Jordanian Labour Market household survey. The key figures from this survey are presented in three additional reports. These reports contain a total of nearly 900 tables and provide statistics for each of the three population groups covered in the study, respectively. References to tables in the tabulation reports are given as footnotes in the various sections of this report.
17
Chapter 2 Methodology
The present study is primarily based on a specially designed household survey conducted in collaboration with the Department of Statistics (DOS). The survey was implemented by DOS in February and March this year and covered 3,800 households in the governorates of Amman, Irbid and Mafraq, including 800 households in Zaatari refugee camp in Mafraq. Data from the household survey have been complemented by information obtained from qualitative interviews, and by information from existing studies and reports from various sources.
2.1 Analytical model
The survey questionnaire was designed as a typical labour force survey with some additions from Fafo’s living conditions survey, mainly on demographic and socio-economic characteristics of the respondents. To conceptually link the large number of topics and questions covered in the survey’s questionnaire with the overall objectives of the study, a general analytical model was developed to guide analyses as well as to structure the presentation of the study results (figure 2.1).
The model distinguishes between the two main population groups in question, the Jordanian host population and the Syrian refugee population, and defines the main characteristics of these two populations relevant to their interactions with the labour market. In addition, a third population group, other non-Jordanians, is included to cover all actors in the Jordanian labour market and for assessing implications for other foreign workers in Jordan, such as Egyptians. The core of the model describes main indicators of the labour market in addition to legal, political and social barriers which affect access to the labour market.
18
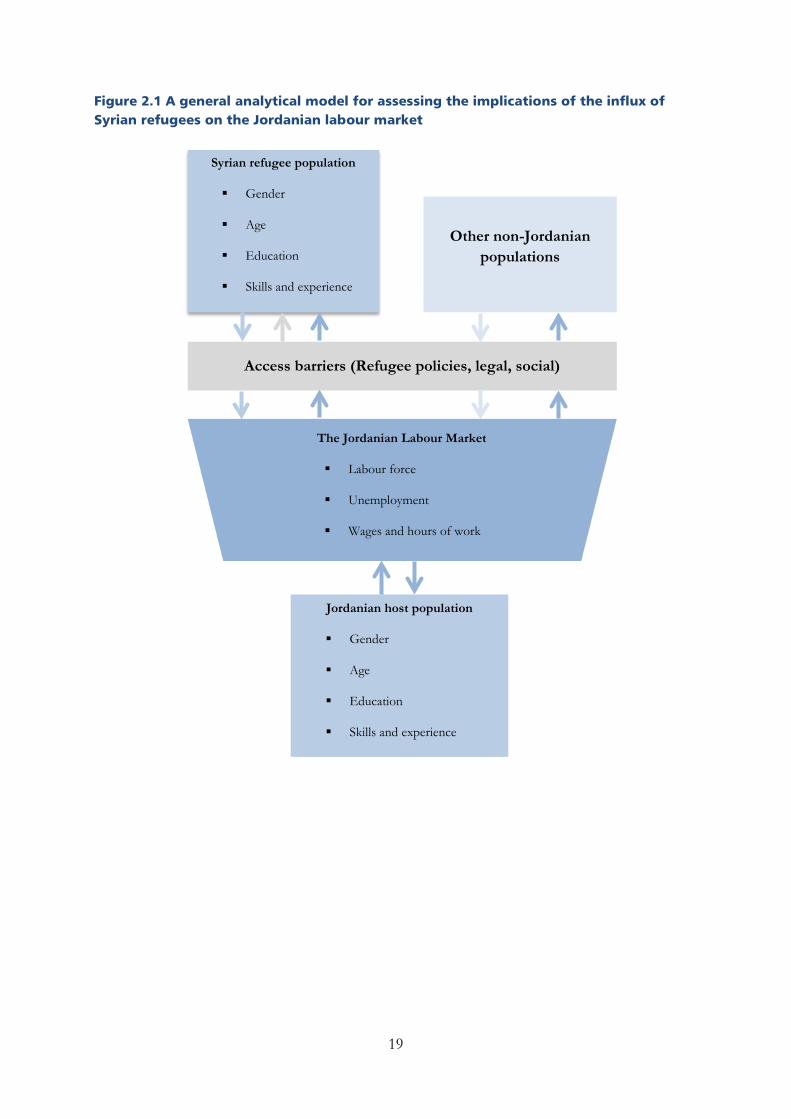
Figure 2.1 A general analytical model for assessing the implications of the influx of Syrian refugees on the Jordanian labour market
The Jordanian Labour Market
Labour force
Unemployment
Wages and hours of work
Access barriers (Refugee policies, legal, social)
Syrian refugee population
Gender
Age
Education
Skills and experience
Jordanian host population
Gender
Age
Education
Skills and experience
Other non-Jordanian populations
19
2.2 The Household Survey
2.2.1 Sampling The household survey was designed to cover the three governorates Amman, Irbid and Mafraq, as well as the Zaatari refugee camp. It targeted an approximate 3,800 households, 800 of them in Zaatari.
Outside the Zaatari camp, a stratified two-level adaptive cluster design was adopted to select Syrian refugee households and Jordanian host community households. Enumeration areas (Blocks) from the 2004 census served as primary sampling units (PSUs). The PSUs were stratified by governorate, and a first set of 79 PSUs per governorate was drawn using linear systematic probability proportional to the size (PPS).
The households in the selected PSUs were re-listed, recording as Syrian households all households that reported containing at least one Syrian. To assure a sufficient number of Syrians in the sample, this listing was used to draw a second set of PSUs with adaptive cluster sampling. For all PSUs in the first set that contained a number of Syrian households exceeding a given threshold, their neighbouring PSUs were selected in this second set of 113 PSUs.
For the first set of PSUs, up to eight Syrian refugee households and eight other households were selected with linear systematic sampling from the updated lists. For the second set of PSUs, up to 8 Syrian refugee households were selected.4 For PSUs with less than eight Syrian households, all Syrian households were selected.
In the Zaatari refugee camp, a two-stage cluster sampling design was applied. The administrative sub-division into streets served as primary sampling units (PSUs). In the first stage, 80 PSUs were drawn with linear systematic probability proportional to the size (PPS). The selected PSUs were re-listed by counting the number of identifiable dwellings per PSU, using satellite images of the camp. In the second stage, approximately 10 households were drawn from each PSU and 11-21 households in the nine largest PSUs, depending on their estimated size, using linear systematic sampling with a specified systematic walking pattern. Deviations from this sampling occurred where PSUs were found to be larger or smaller than expected when calculating sampling intervals, due to imperfections in re-listing.
For the household questionnaire, one responsible adult in each sampled household was interviewed, answering questions about the household as a whole and each household member specifically. In most households, however, more than one household member was present during the interview. In addition, one household member aged 15+ and working or temporarily absent from work during the previous seven days before the interview was randomly selected, by using a Kish table, to answer the RSI questionnaire.
In tabulation analysis, households and RSI respondents were weighted. Weights were calculated as the inverse probability of a household/individual being selected and adjusted to account for non-response. Detailed descriptions of sampling procedure and weights calculation are available in the Appendices.
4 Up to 6 in the second set PSUs clusters in Mafraq governorate.
20
2.2.2 Data collection and questionnaires The data collection for the study was implemented by the Jordanian Department of Statistics (DOS), under the supervision of Fafo AIS staff. The interviews were conducted by interviewers trained and supervised by DOS and Fafo staff.
For the household questionnaire, one responsible adult in each sampled household was interviewed. The adult household member was asked to answer each question for him- or herself, and then answer them as a proxy respondent for each of the other household members, as is the case in most labour force surveys. In most households, however, more than one household member was present during the interview and contributed to the answers where needed.
The following paragraphs outline the content and structure of the questionnaires applied, and refer to the specific chapter in the tabulation report where tabulation of the variables in question can be found.
The household questionnaire consisted of nine thematic sections. The first, second and ninth sections recorded information about the household as a whole. The first section recorded household, interview and staff identification variables. The second section recorded characteristics of the household’s dwelling and its amenities (Chapter 2 in tabulation report). The ninth section recorded household income, poverty support, economic self-assessment and household consumer durable goods ownership (Chapter 3).
The remaining sections were household rosters, where the proxy respondent answered the questions for each household member in turn. The third section recorded the demographic characteristics of each household member, including sex, age, nationality, refugee status and relationship to the household head (Chapter 1), and Syrian refugees’ connections to Syria (Chapter 14). The fourth section mapped the educational status and attainment of each household member (Chapter 4). The fifth section mapped the employment status of all household members and job characteristics for those working (Chapter 5). The sixth section mapped employment status around 15 March 2011, when the Syrian crisis began (Chapter 6). The seventh section recorded health and disability (Chapter 7). The eight section recorded interaction with society outside camp for refugees in the Zaatari refugee camp (Chapter 15).
For the selection of one household member to be interviewed with the RSI questionnaire, all individuals aged 15 and above who were working or temporarily absent from work during the seven days before the interview were considered eligible. From each household, one eligible individual (if the household contained any) was selected using a Kish table.
The RSI questionnaire consisted of six thematic sections. The first section recorded household, interview and staff identification variables. The second section covered job characteristics and working conditions, with sub-sections on conflicts in the workplace and the additional challenges facing women (Chapter 8). The third section covered refugees from the Syrian conflict only, mapping their access to work permits (Chapter 13). The fourth section covered attitudes and perceptions about the labour market, focusing on perceptions of different nationalities in particular (Chapter 9). The fifth section covered satisfaction with the Zaatari refugee camp market and service delivery (Chapter 16). Finally, the sixth section set out to map the level of trust between Syrian and Jordanian nationals (Chapter 12).
21
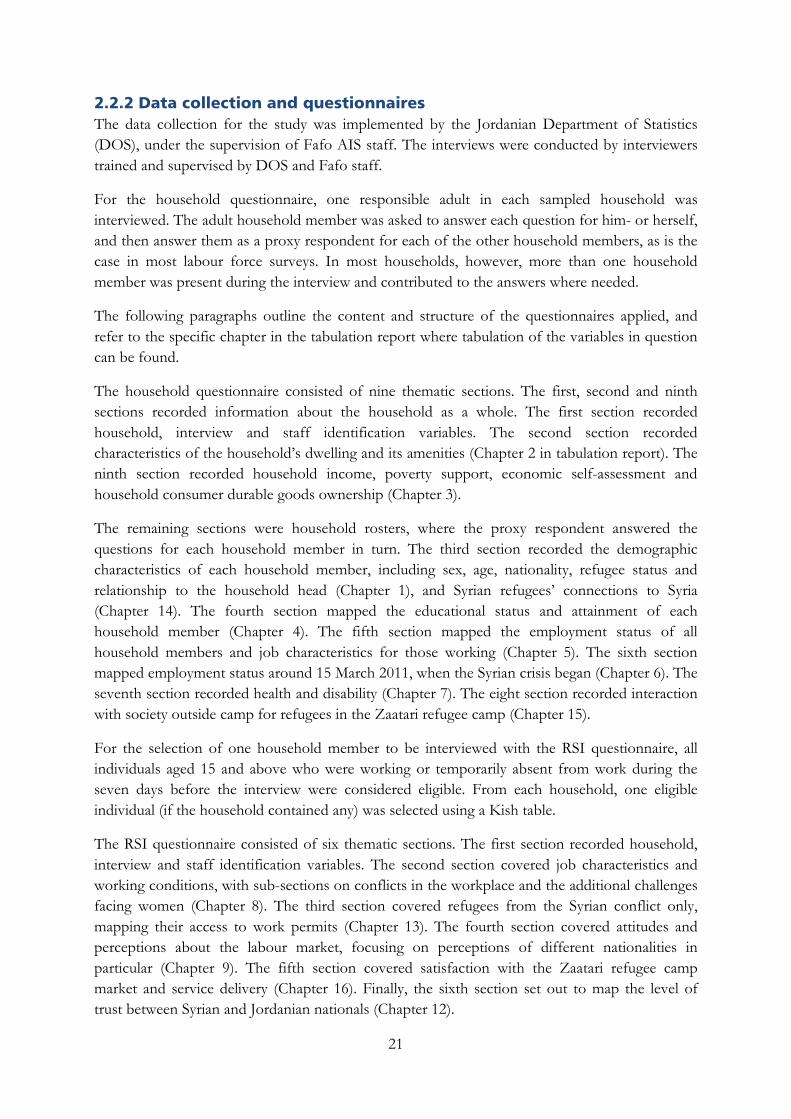
2.2.3 Sample characteristics
Table 2.1 Household interview status, unweighted
Interview status Number of
households Percent Partial or complete interview 3860 86 No usable information 1 0,02 Refusal 134 3 No eligible person 2 0,04 No contact 11 0,2 Dwelling non-exsistent/ closed/ vacant/ under construction/ change in usage
465 10
Total 4473 100
Table 2.2 RSI interview status, unweighted
Interview status Number of
households Percent Partial or complete interview 1511 39 No usable information 1 0,03 Refusal 28 1 No eligible RSI respondent 2147 56 No contact 173 4 Total 3860 100
Out of the 4,473 households selected, 3,860 households, encompassing a total of 21,524 household members, were successfully interviewed. From the 1,713 of these households that contained at least one worker aged 15 and above, one member fulfilling these criteria was selected. 1,511 RSI interviews were successfully completed. The tables below report how this sample is distributed across population groups and governorates.
22
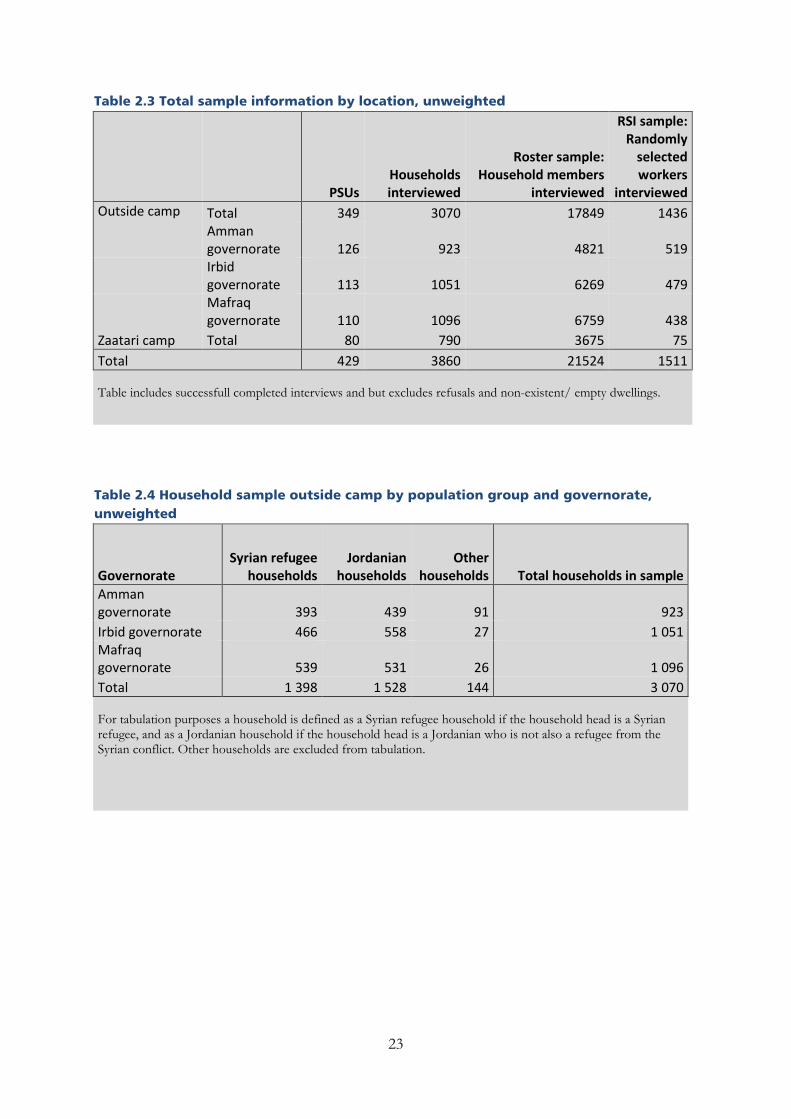
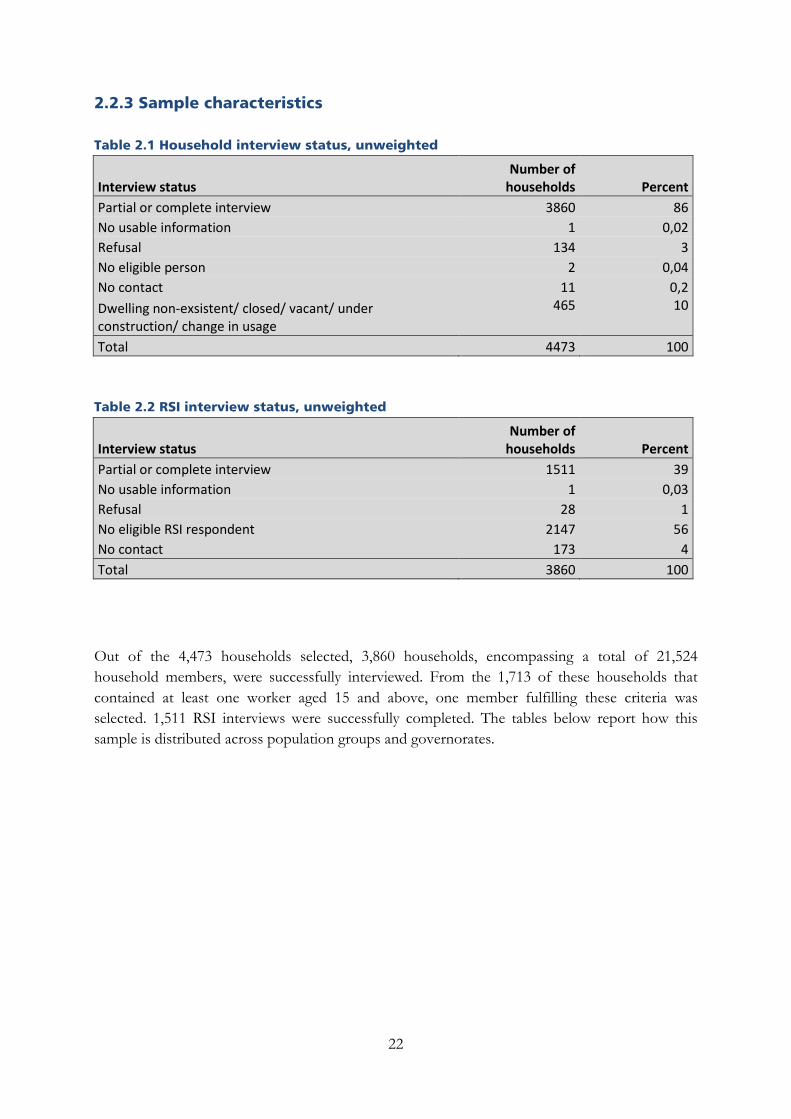
Table 2.3 Total sample information by location, unweighted
PSUs Households interviewed
Roster sample: Household members
interviewed
RSI sample: Randomly
selected workers
interviewed Outside camp Total 349 3070 17849 1436
Amman governorate 126 923 4821 519
Irbid governorate 113 1051 6269 479
Mafraq governorate 110 1096 6759 438
Zaatari camp Total 80 790 3675 75 Total 429 3860 21524 1511 Table includes successfull completed interviews and but excludes refusals and non-existent/ empty dwellings.
Table 2.4 Household sample outside camp by population group and governorate, unweighted
Governorate Syrian refugee
households Jordanian
households Other
households Total households in sample Amman governorate 393 439 91 923 Irbid governorate 466 558 27 1 051 Mafraq governorate 539 531 26 1 096 Total 1 398 1 528 144 3 070 For tabulation purposes a household is defined as a Syrian refugee household if the household head is a Syrian refugee, and as a Jordanian household if the household head is a Jordanian who is not also a refugee from the Syrian conflict. Other households are excluded from tabulation.
23
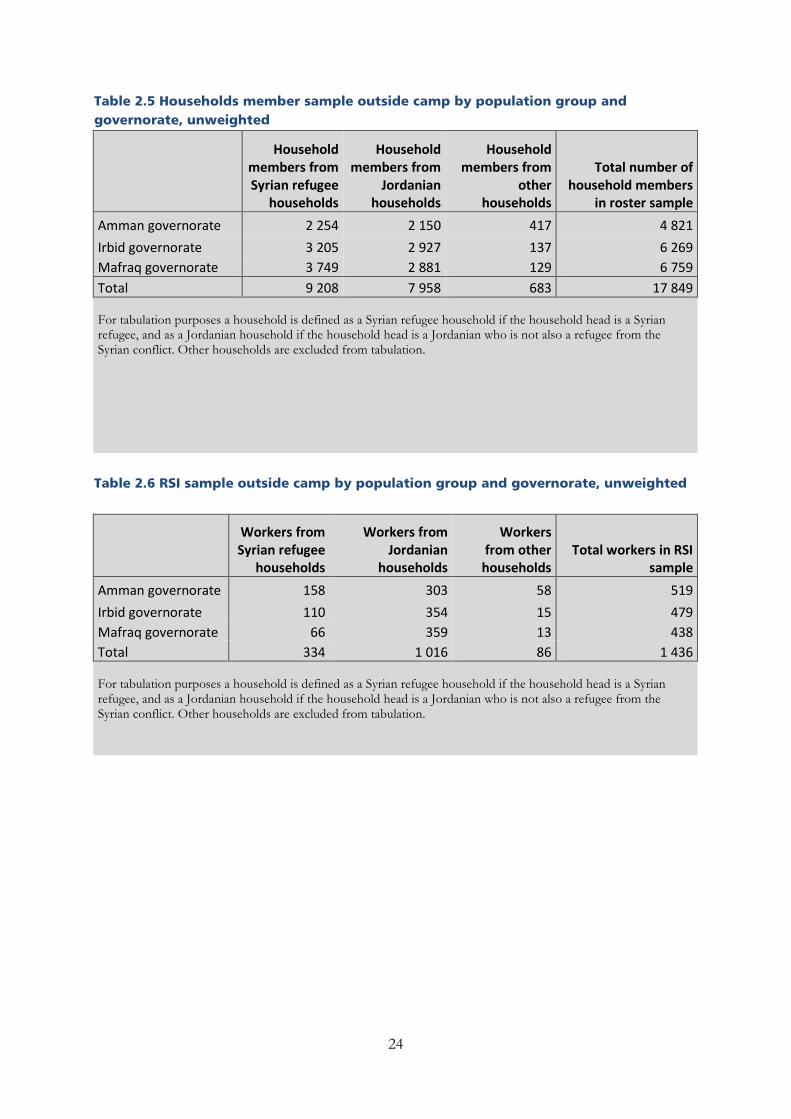
Table 2.5 Households member sample outside camp by population group and governorate, unweighted
Household members from Syrian refugee
households
Household members from
Jordanian households
Household members from
other households
Total number of household members
in roster sample Amman governorate 2 254 2 150 417 4 821 Irbid governorate 3 205 2 927 137 6 269 Mafraq governorate 3 749 2 881 129 6 759 Total 9 208 7 958 683 17 849 For tabulation purposes a household is defined as a Syrian refugee household if the household head is a Syrian refugee, and as a Jordanian household if the household head is a Jordanian who is not also a refugee from the Syrian conflict. Other households are excluded from tabulation.
Table 2.6 RSI sample outside camp by population group and governorate, unweighted
Workers from Syrian refugee
households
Workers from Jordanian
households
Workers from other households
Total workers in RSI sample
Amman governorate 158 303 58 519 Irbid governorate 110 354 15 479 Mafraq governorate 66 359 13 438 Total 334 1 016 86 1 436 For tabulation purposes a household is defined as a Syrian refugee household if the household head is a Syrian refugee, and as a Jordanian household if the household head is a Jordanian who is not also a refugee from the Syrian conflict. Other households are excluded from tabulation.
24
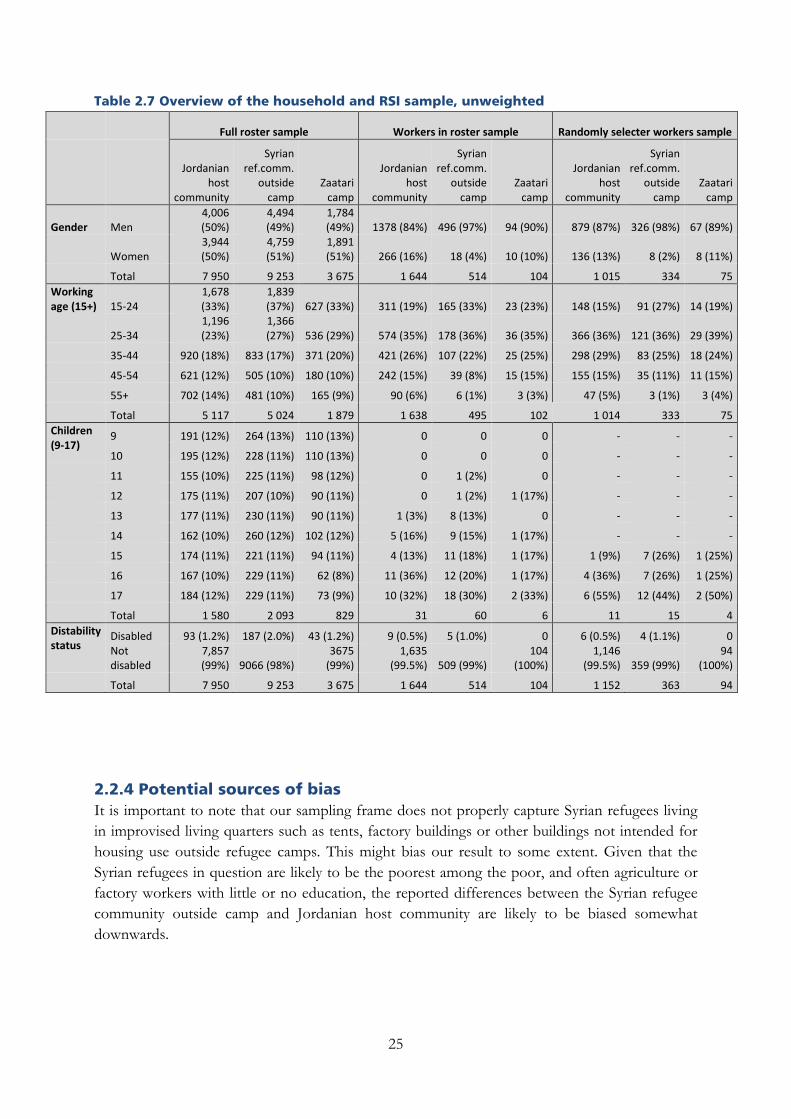
Table 2.7 Overview of the household and RSI sample, unweighted
Full roster sample Workers in roster sample Randomly selecter workers sample
Jordanian host
community
Syrian ref.comm.
outside camp
Zaatari camp
Jordanian host
community
Syrian ref.comm.
outside camp
Zaatari camp
Jordanian host
community
Syrian ref.comm.
outside camp
Zaatari camp
Gender Men 4,006 (50%)
4,494 (49%)
1,784 (49%) 1378 (84%) 496 (97%) 94 (90%) 879 (87%) 326 (98%) 67 (89%)
Women 3,944 (50%)
4,759 (51%)
1,891 (51%) 266 (16%) 18 (4%) 10 (10%) 136 (13%) 8 (2%) 8 (11%)
Total 7 950 9 253 3 675 1 644 514 104 1 015 334 75 Working age (15+) 15-24
1,678 (33%)
1,839 (37%) 627 (33%) 311 (19%) 165 (33%) 23 (23%) 148 (15%) 91 (27%) 14 (19%)
25-34 1,196 (23%)
1,366 (27%) 536 (29%) 574 (35%) 178 (36%) 36 (35%) 366 (36%) 121 (36%) 29 (39%)
35-44 920 (18%) 833 (17%) 371 (20%) 421 (26%) 107 (22%) 25 (25%) 298 (29%) 83 (25%) 18 (24%)
45-54 621 (12%) 505 (10%) 180 (10%) 242 (15%) 39 (8%) 15 (15%) 155 (15%) 35 (11%) 11 (15%)
55+ 702 (14%) 481 (10%) 165 (9%) 90 (6%) 6 (1%) 3 (3%) 47 (5%) 3 (1%) 3 (4%)
Total 5 117 5 024 1 879 1 638 495 102 1 014 333 75 Children (9-17)
9 191 (12%) 264 (13%) 110 (13%) 0 0 0 - - -
10 195 (12%) 228 (11%) 110 (13%) 0 0 0 - - -
11 155 (10%) 225 (11%) 98 (12%) 0 1 (2%) 0 - - -
12 175 (11%) 207 (10%) 90 (11%) 0 1 (2%) 1 (17%) - - -
13 177 (11%) 230 (11%) 90 (11%) 1 (3%) 8 (13%) 0 - - -
14 162 (10%) 260 (12%) 102 (12%) 5 (16%) 9 (15%) 1 (17%) - - -
15 174 (11%) 221 (11%) 94 (11%) 4 (13%) 11 (18%) 1 (17%) 1 (9%) 7 (26%) 1 (25%)
16 167 (10%) 229 (11%) 62 (8%) 11 (36%) 12 (20%) 1 (17%) 4 (36%) 7 (26%) 1 (25%)
17 184 (12%) 229 (11%) 73 (9%) 10 (32%) 18 (30%) 2 (33%) 6 (55%) 12 (44%) 2 (50%)
Total 1 580 2 093 829 31 60 6 11 15 4 Distability status
Disabled 93 (1.2%) 187 (2.0%) 43 (1.2%) 9 (0.5%) 5 (1.0%) 0 6 (0.5%) 4 (1.1%) 0 Not disabled
7,857 (99%) 9066 (98%)
3675 (99%)
1,635 (99.5%) 509 (99%)
104 (100%)
1,146 (99.5%) 359 (99%)
94 (100%)
Total 7 950 9 253 3 675 1 644 514 104 1 152 363 94
2.2.4 Potential sources of bias It is important to note that our sampling frame does not properly capture Syrian refugees living in improvised living quarters such as tents, factory buildings or other buildings not intended for housing use outside refugee camps. This might bias our result to some extent. Given that the Syrian refugees in question are likely to be the poorest among the poor, and often agriculture or factory workers with little or no education, the reported differences between the Syrian refugee community outside camp and Jordanian host community are likely to be biased somewhat downwards.
25
2.3 Qualitative field work
A qualitative research component was designed in order to obtain rich, contextualizing, in-depth data for this report. The research team conducted two brief but intensive rounds of qualitative fieldwork for this study.
The first round of fieldwork was conducted 22–23 August, 2013 and aimed at obtaining a more layered understanding of the research questions and designing a more targeted questionnaire. The rationale is that order to ensure valuable survey data, it is essential that the HHQ and RSI questions are as precise and meaningful to the respondents as possible.
Qualitative semi-structured interview guides were designed and subsequently continuously adapted to better capture the valuable data collected during fieldwork. Interview questions included questions about contract, social security, health insurance, payment (amount and regularity), differentiated payment or treatment, previous job or expertise, job stability, conceptions of differential treatment, how many nationalities worked there, and conceptions of workers based on nationalities. The semi-structured interview guides and collected qualitative data have been instrumental in the design of the questions for HHQ and RSI. Moreover, the collected qualitative data from both rounds add depth and layered understanding to the interpretations of the quantitative HHQ data and the RSI.
The first round of qualitative fieldwork entailed observation and interviews in Amman, Mafraq and Irbid governorates. Drawing on the contacts of local partners, we were able to conduct a series of observations and interviews at construction sites, in the informal and formal services sector (restaurants, shops in both traditional quarters and malls), the day labour market, factories, and the Zaatari camp informal market. In addition, the research team conducted a meeting with a work permit issuer, and a focus group interview with Syrian workers.
Through this first round of fieldwork, the research team was able to establish which terms respondents understood intuitively and which they did not. These interviews also provided clues as to which topics respondents were likely to be evasive about in the questionnaire, and enabled necessary adaptation. Interviewing people at work gives the added value of actually seeing their workplace, and often co-workers, and observing multiple in situ responses to our line of questioning.
The second round of qualitative fieldwork was conducted 11–17 November, 2013 and aimed at filling in knowledge gaps. These were: child labour, women working from home, the service sector in Irbid and agricultural farms. In addition to visits, observation and interviews conducted in workplaces, a meeting with Save the Children Jordan was arranged. Moreover, the research team’s local research partners and assistants arranged for a focus group interview with the Economic and Social Council to discuss the council members’ views on the impact of the Syrian worker influx on the Jordanian labour market.
The fieldwork and qualitative interviews were conducted in Arabic by the research team’s qualitative senior researcher. A Jordanian research assistant aided in setting up the interviews. On a full day of fieldwork, nine or ten brief semi-structured interviews were conducted per day on average, which for qualitative fieldwork is a very high number. Taking notes from qualitative
26
interviews and observation is very time consuming. Converting one day of interviews or observation from ethnographic shorthand to full field notes took roughly two to three days of writing up, in addition to analysis. During the writing up of full field notes, all notes were manually indexed and coded by the qualitative researcher who conducted the research, to ease subsequent analysis and summarising of findings.
2.5 Definitions used in the household survey and the report
Communities: Separate tabulation reports are produced for three communities covered by the survey. Zaatari camp residents and individuals from Syrian refugee households outside camp make up two separate refugee community populations, while individuals from Jordanian households are considered the host community. All households located in the Zaatari refugee camp are considered Zaatari camp households. Outside the refugee camp, a household is considered a Syrian refugee household if the household head is a Syrian refugee and a Jordanian household if the household head is a Jordanian citizen, and not also a refugee from the Syrian conflict. Households falling outside these three groups are excluded from tabulation.
Employment: Individuals aged nine and above are defined as employed if the household proxy respondent reports that they worked for at least one hour (for a wage, as self-employed or in a household enterprise), or had a job or business from which they were temporarily absent during the reference period (during the seven days before the interview). The reference period applied when defining labour force participation in March 2011 is different from the reference period for current estimates. The questions used to determine current labour force participation clearly delimit the reference period with the opening phrase ‘Last week (past 7 days)’. The corresponding questions for 2011 use the phrase ‘on (or around) 15 March 2011, when the violent conflict in Syria began’. This less clearly delimited reference period is necessary, given that respondents cannot be expected to remember precisely what they were doing in a specified week three years ago, but it is likely to bias estimates for March 2011 somewhat upwards, because the reference period becomes longer in practice.
Unemployment: Individuals aged nine and above are defined as unemployed if they are not employed and the household proxy respondent reported that they fulfilled the following three criteria: (i) able to work; (ii) were available to start work; and (iii) had been actively looking for work or trying to start a business.
Labour force: Employed and unemployed individuals above the age of 15 are considered part of the labour force. The reference period applied when defining unemployment in March 2011 is different from the reference period for current estimates. The questions used to determine current unemployment clearly delimit the reference period for wanting to work to in the past week, for being available to work to in the past week and the coming two weeks, and for looking actively for work to in the past four weeks. The corresponding questions for 2011 use the phrase ‘on (or around) 15 March 2011, when the violent conflict in Syria began’. This less clearly delimited reference period is necessary, given that respondents cannot be expected to remember precisely what they were doing in a specified week three years ago, but it is likely to bias
27

unemployment estimates for March 2011 somewhat downwards, as it is more difficult for the household respondent to remember whether each household member fulfilled all the criteria for being defined as unemployed (being willing to work, available to work, and actively looking for work at the time).
Informal employment: Informal employment is defined in accordance with the International Conference on Labour Statistics Conference (ICLS) guidelines concerning a statistical definition of informal employment (ICLS 2003) and Resolution concerning statistics of employment in the informal sector (ICLS 1993). In line with Article 3, Paragraph 2, of the guidelines, informal employment is considered to include the following types of jobs:
(i) Own-account workers employed in their own informal sector enterprises. Because the survey does not record enterprise-level information about whether or not the enterprise is registered under national legislation, all own-account enterprises, and by extension all own-account workers, are included in the category. This is in line with the operational definition of informal own-account enterprises outlined in the 1993 resolution (Article 8(2)).
(ii) Contributing family workers, irrespective of whether they work in formal or informal sector enterprises. This is operationalized as unpaid workers employed in family businesses.
(iii) Employees holding informal jobs, whether in formal or informal enterprises, defined in Article 2, Paragraph 5 of the guidelines as employment relationships not subject to national labour legislation, income taxation, social protection or entitlement to certain employment benefits, or jobs for which labour regulations are not complied with. As recommended in the guidelines, the operational criteria chosen to capture such employment relationships are determined in accordance with national circumstances and data availability, to include:
a. Workers with no written or verbal contract
b. Workers not covered by a social security scheme in their main job
c. Workers below the minimum working age of 16
d. Non-Jordanian workers employed without obtaining the legally required work permit
e. Workers paid less than the minimum wage, defined by executive decree as 190 JD per month for Jordanian citizens and 150 JD per month for non-Jordanian workers.
This operational definition diverges from the guidelines in two ways. First, it does not directly capture employers employed in their own informal sector enterprises, members of informal producer’s cooperatives and contributing family workers who are paid based on the profit of the family business. Many of these workers are likely to be captured by one or more of the criteria
28

defined under point (ii), however. Second, for reasons of data availability, the definition only takes into account the worker’s main job.
Level of education completed: Combines the levels of the current Jordanian education system, the old Jordanian education system and the Syrian education system into the following categories:
i. Never attended school, kindergarten or pre-school. ii. Never completed any level / Elementary: Attending but never completing ‘Basic’ in the
current Jordanian education system is considered comparable to completing or attending but never completing ‘Elementary’ in the Syrian and the old Jordanian education system.
iii. Basic / Intermediate: Having completed ‘Preparatory’ in Syria or ‘Intermediate’ in the old Jordanian education system is considered comparable to having completed ‘Basic’ in the current Jordanian system.
iv. Applied vocational training (VTC): Vocational education centres (VTC), an applied alternative to secondary schooling that does not qualify students for higher education, are only available in the Jordanian system.
v. Academic / Vocational secondary: All systems encompass both academic and vocational streams of secondary education.
vi. College: Syrian vocational training after secondary is considered comparable to Jordanian/Syrian community college and intermediate diploma.
vii. University degree: For individuals currently enrolled in school, the level below the level they are currently enrolled in is reported.5 When education is reported as a background variable, categories iv and v, and vi and vii, are collapsed.
Formal vocational education: Encompasses individuals currently enrolled in formal vocational training in vocational training centres (VTC) or vocational secondary school, and individuals that have previously completed such training. This is only reported for individuals that have completed basic education, making them eligible for formal vocational training. Short-term vocational and other skills development courses: Covers participation in vocational or skills development courses that are short-term in nature (<12 months) and taught outside the formal vocational education system, through NGOs, private or government schools, in the military, at work or other. Reported for individuals aged 15 and above. Child: In line with the 1989 UN Convention on the Rights of the Child (UN 1989) and the 1999 ILO Convention No. 182 on the worst forms of child labour (ILO 1999), a child is defined as an individual under the age of 18. Children aged 15–17 are also considered a sub-category of youth, as defined below. In some tables concerning schooling, the age category 16–17 is applied, to denote the age where school is no longer compulsory.
5 For individuals enrolled in Basic, the previous level is no level completed. For individuals enrolled in VTC or secondary, the previous level is Basic. For individuals enrolled in a college or university bachelor/undergraduate program, the previous level is secondary school. For individuals enrolled in a graduate program, the previous level is university diploma.
29
Children in employment (‘working children’): Children are defined as ‘in employment’ if the household proxy respondent reports that they worked for at least one hour at a job or business from which they were temporarily absent during the reference period of seven days preceding the interview. In this study, information about employment is available for children aged 9–17. Child labour: Child labourers are defined as children who are engaged in work unsuitable for their capacities as children or in work that may jeopardize their health, education or moral development. The definition is based on ILO Convention No. 138 on minimum age (ILO 1973) and ILO Convention No. 182 on the worst forms of child labour (ILO 1999). Taking into account the minimum age for employment in Jordan (age 16), child labourers are generally defined as: (i) all children in employment under the age of 12; (ii) children aged 12–15 employed for 14 hours or more per week; and (iii) children under the age of 18 engaged in hazardous work. This study cannot ascertain the full scope of child labour as defined here, because the survey does not record engagement in hazardous work. Other aspects of the child labour definition, however, such as working hours by age group, are discussed where relevant. Youth: In line with the United Nations definition, respondents aged 15–24 are considered youth (UNDESA 2013). In a Middle Eastern context, the upper limit for the definition of youth is often extended upwards. To facilitate interpreting the results in light of such a broad definition of youth, an age category spanning 25–34 is added in tabulation. Disability status: A respondent is considered disabled if a health problem of prolonged nature (more than six months duration) (q702, household questionnaire) has resulted in a lot of difficulty with, or complete lack of ability to perform, the following activities: (i) seeing, even if wearing glasses; (ii) hearing, even if using a hearing aid; (iii) walking or climbing steps; (iv) self-care, such as washing all over or dressing; (v) communicating – understanding or being understood by others (q703, household questionnaire). This definition is in line with the Washington Group’s recommendations (Washington Group 2009).
Community support burden (dependency ratio): A community’s support burden can be measured in either demographic or economic terms. When measured at the community level, the demographic support burden is calculated as the number of community members below or above working age (15–64) per working age community member. This is an indicator of the age composition of the community, and tells us how many children and elderly each potential worker has to support. In societies with low labour force participation and less than full employment, however, a more realistic measure of community support burden compares the number of community members in actual employment to community members not in employment. The fewer workers per economic dependent in a community, the higher is the support burden. The community level economic support burden measure is the inverse of the economic dependency ratio, and the demographic support burden measure is equivalent to the well-known demographic dependency ratio.
Household support burden (dependency ratio): A household’s support burden can be measured in either demographic or economic terms. When measured at the demographic level, the household support burden is calculated as the share of household members that below or above working
30
age (15–64). This is a measure of the age composition of the household, and tells us how many children and elderly each potential worker has to support. Analogous to the community level, however, a more realistic measure of household support burden is calculated as the share of household members in actual employment. The lower the share of workers in a household, the higher is the support burden. On the household level, total household size thus replaces the usual denominator in the dependency ratio measures, in order to avoid the problem of division by zero in households with no working age members or no economic dependents.
Wealth index: The wealth index is constructed separately for households located inside and outside the Zaatari refugee camp. In Zaatari, the index is based on variables denoting household ownership of a list of consumer durables (q910, household questionnaire). Outside camp, certain household dwelling characteristics are added: the size of living area per capita (q205/q115_t), independent kitchen (q206), type of toilet facility (q207–q208), water supply (q209–q210), electricity supply (q212), and ownership status of dwelling (q214). For both indices, the categorical variables are separated into dichotomous indicator variables and scale variables normalized to z-scores. Principal component analysis, executed separately for Jordanian households, Syrian refugee households outside camp and households in Zaatari, is used to construct the index, its first dimension selected. The wealth index score is weighted by a household member weight, made by multiplying the relative weight of the household by the number of household members and ranked separately for Jordanian households, Syrian refugee households outside camp, and households in Zaatari. Because the principal component analysis and ranking is done separately for each community, wealth index scores are not comparable across communities. Most Syrian refugee households, also among those rating highly on the Syrian refugee wealth index, would fall into the lower wealth categories on the Jordanian wealth index if compared directly.
31
Chapter 3 Demographic characteristics of the three population groups
This chapter provides some background information with regard to the three population groups (referred to as ‘communities’ in the text) that we study and compare, namely Jordanian citizens in the governorates of Irbid, Mafraq and Amman, Syrian refugees in residing outside refugee camps in the same governorates, and finally Syrian refugees residing inside the Zaatari refugee camp. It presents demographic features and also describes people’s educational attainment. First, however, the chapter describes the governorate of origin in Syria for the two Syrian refugee communities.6
3.1 Origin in Syria
The vast majority of Syrian refugees residing in the Zaatari refugee camp (85 per cent) have fled from Dar’aa governorate. Ten per cent originate from rural Damascus, two per cent used to live in urban Damascus, and two per cent in Homs.
The situation is different amongst Syrian refugees settled outside the refugee camps. Most of these refugees still come from Dar’aa, as 47 per cent acknowledge having lived there before taking refuge in Jordan. However, 26 per cent come from Homs, rural Damascus and urban Damascus each housed seven per cent of the non-camp refugees, and as large a share have left Aleppo governorate. Two per cent of Syrian refugees residing outside camp come from Raqqa and two per cent from Hama.
Eighty-seven per cent of Syrian refugees residing in Zaatari refugee camp used to live in a rural area , whereas 58 per cent of Syrian refugees residing outside camps have a rural background.
The population in Zaatari refugee camp includes a larger share of recent arrivals than the Syrian refugee population outside camp. Two in three Zaatari camp refugees, compared to about half of Syrian refugees outside camp, report arriving in Jordan in 2013.
3.2 Age and gender distribution
The gender distribution in all three communities is even, but Syrian refugees make up a younger population.
Both Syrian refugee communities comprise 51 per cent women and 49 per cent men, whilst the gender distribution amongst Jordanians is 50-50. In practice, thus, the gender distribution is even and there is no significant variation between the three population groups at the aggregate level.
6 Additional tables describing the demography, education and living conditions of the three communities are available in the tabulation report, Chapter 1–4.
32
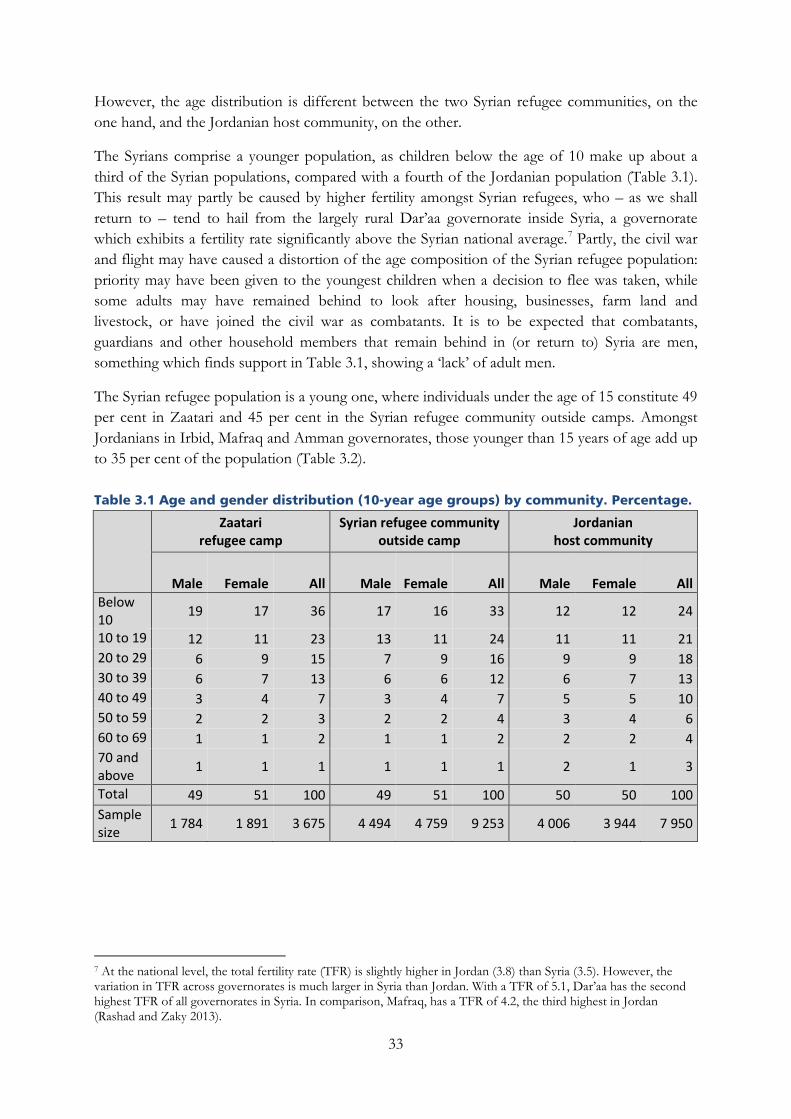
However, the age distribution is different between the two Syrian refugee communities, on the one hand, and the Jordanian host community, on the other.
The Syrians comprise a younger population, as children below the age of 10 make up about a third of the Syrian populations, compared with a fourth of the Jordanian population (Table 3.1). This result may partly be caused by higher fertility amongst Syrian refugees, who – as we shall return to – tend to hail from the largely rural Dar’aa governorate inside Syria, a governorate which exhibits a fertility rate significantly above the Syrian national average.7 Partly, the civil war and flight may have caused a distortion of the age composition of the Syrian refugee population: priority may have been given to the youngest children when a decision to flee was taken, while some adults may have remained behind to look after housing, businesses, farm land and livestock, or have joined the civil war as combatants. It is to be expected that combatants, guardians and other household members that remain behind in (or return to) Syria are men, something which finds support in Table 3.1, showing a ‘lack’ of adult men.
The Syrian refugee population is a young one, where individuals under the age of 15 constitute 49 per cent in Zaatari and 45 per cent in the Syrian refugee community outside camps. Amongst Jordanians in Irbid, Mafraq and Amman governorates, those younger than 15 years of age add up to 35 per cent of the population (Table 3.2).
Table 3.1 Age and gender distribution (10-year age groups) by community. Percentage.
Zaatari refugee camp
Syrian refugee community outside camp
Jordanian host community
Male Female All Male Female All Male Female All Below 10 19 17 36 17 16 33 12 12 24
10 to 19 12 11 23 13 11 24 11 11 21 20 to 29 6 9 15 7 9 16 9 9 18 30 to 39 6 7 13 6 6 12 6 7 13 40 to 49 3 4 7 3 4 7 5 5 10 50 to 59 2 2 3 2 2 4 3 4 6 60 to 69 1 1 2 1 1 2 2 2 4 70 and above 1 1 1 1 1 1 2 1 3
Total 49 51 100 49 51 100 50 50 100 Sample size 1 784 1 891 3 675 4 494 4 759 9 253 4 006 3 944 7 950
7 At the national level, the total fertility rate (TFR) is slightly higher in Jordan (3.8) than Syria (3.5). However, the variation in TFR across governorates is much larger in Syria than Jordan. With a TFR of 5.1, Dar’aa has the second highest TFR of all governorates in Syria. In comparison, Mafraq, has a TFR of 4.2, the third highest in Jordan (Rashad and Zaky 2013).
33
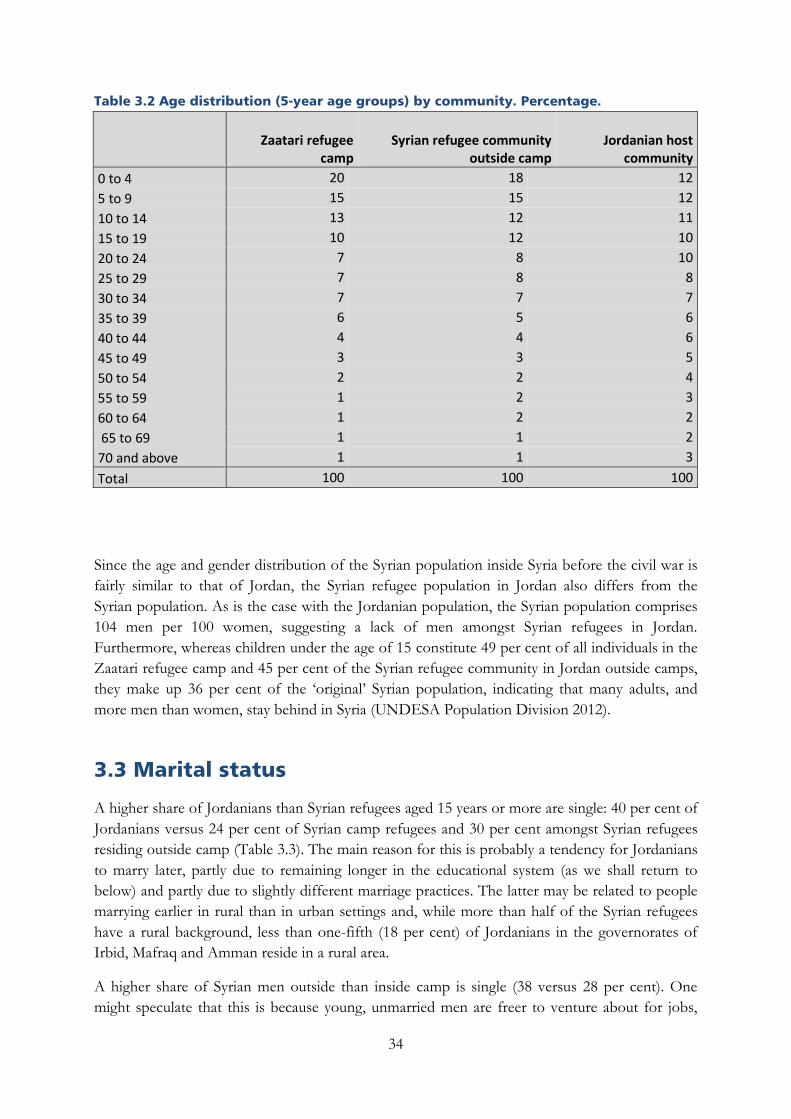
Table 3.2 Age distribution (5-year age groups) by community. Percentage.
Zaatari refugee
camp Syrian refugee community
outside camp Jordanian host
community 0 to 4 20 18 12 5 to 9 15 15 12 10 to 14 13 12 11 15 to 19 10 12 10 20 to 24 7 8 10 25 to 29 7 8 8 30 to 34 7 7 7 35 to 39 6 5 6 40 to 44 4 4 6 45 to 49 3 3 5 50 to 54 2 2 4 55 to 59 1 2 3 60 to 64 1 2 2 65 to 69 1 1 2 70 and above 1 1 3 Total 100 100 100
Since the age and gender distribution of the Syrian population inside Syria before the civil war is fairly similar to that of Jordan, the Syrian refugee population in Jordan also differs from the Syrian population. As is the case with the Jordanian population, the Syrian population comprises 104 men per 100 women, suggesting a lack of men amongst Syrian refugees in Jordan. Furthermore, whereas children under the age of 15 constitute 49 per cent of all individuals in the Zaatari refugee camp and 45 per cent of the Syrian refugee community in Jordan outside camps, they make up 36 per cent of the ‘original’ Syrian population, indicating that many adults, and more men than women, stay behind in Syria (UNDESA Population Division 2012).
3.3 Marital status
A higher share of Jordanians than Syrian refugees aged 15 years or more are single: 40 per cent of Jordanians versus 24 per cent of Syrian camp refugees and 30 per cent amongst Syrian refugees residing outside camp (Table 3.3). The main reason for this is probably a tendency for Jordanians to marry later, partly due to remaining longer in the educational system (as we shall return to below) and partly due to slightly different marriage practices. The latter may be related to people marrying earlier in rural than in urban settings and, while more than half of the Syrian refugees have a rural background, less than one-fifth (18 per cent) of Jordanians in the governorates of Irbid, Mafraq and Amman reside in a rural area.
A higher share of Syrian men outside than inside camp is single (38 versus 28 per cent). One might speculate that this is because young, unmarried men are freer to venture about for jobs,
34
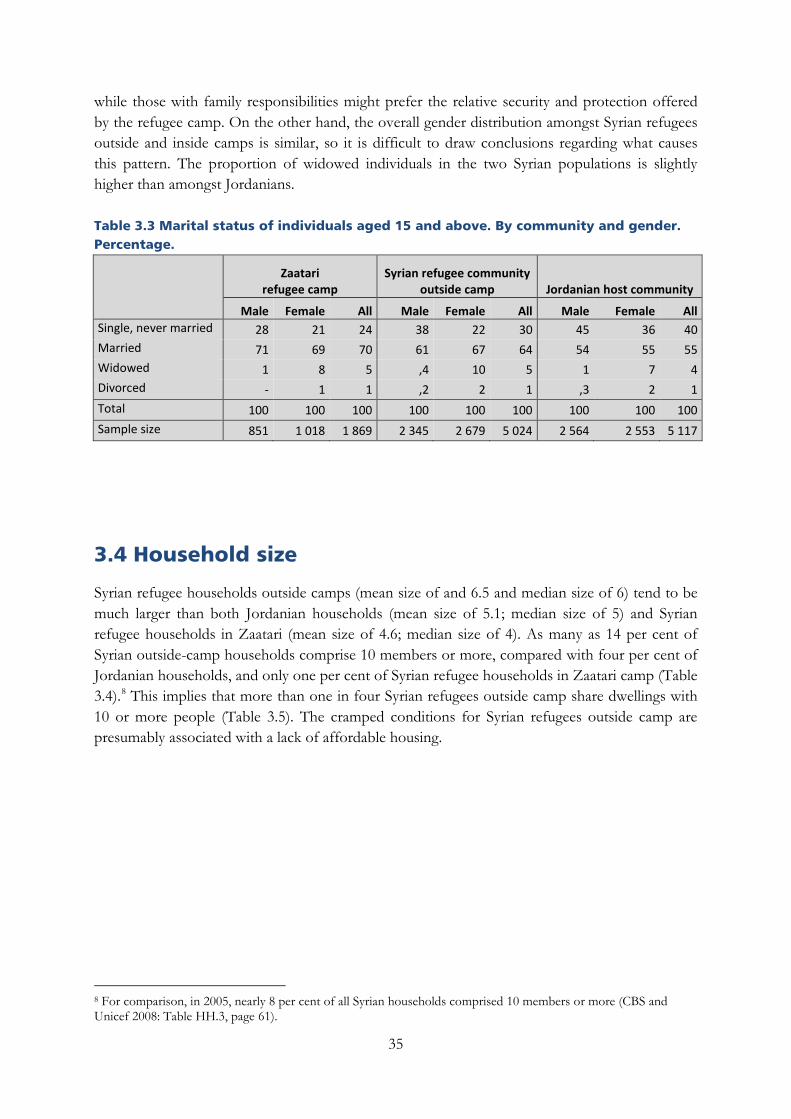
while those with family responsibilities might prefer the relative security and protection offered by the refugee camp. On the other hand, the overall gender distribution amongst Syrian refugees outside and inside camps is similar, so it is difficult to draw conclusions regarding what causes this pattern. The proportion of widowed individuals in the two Syrian populations is slightly higher than amongst Jordanians.
Table 3.3 Marital status of individuals aged 15 and above. By community and gender. Percentage.
Zaatari refugee camp
Syrian refugee community outside camp Jordanian host community
Male Female All Male Female All Male Female All Single, never married 28 21 24 38 22 30 45 36 40 Married 71 69 70 61 67 64 54 55 55 Widowed 1 8 5 ,4 10 5 1 7 4 Divorced - 1 1 ,2 2 1 ,3 2 1 Total 100 100 100 100 100 100 100 100 100 Sample size 851 1 018 1 869 2 345 2 679 5 024 2 564 2 553 5 117
3.4 Household size
Syrian refugee households outside camps (mean size of and 6.5 and median size of 6) tend to be much larger than both Jordanian households (mean size of 5.1; median size of 5) and Syrian refugee households in Zaatari (mean size of 4.6; median size of 4). As many as 14 per cent of Syrian outside-camp households comprise 10 members or more, compared with four per cent of Jordanian households, and only one per cent of Syrian refugee households in Zaatari camp (Table 3.4).8 This implies that more than one in four Syrian refugees outside camp share dwellings with 10 or more people (Table 3.5). The cramped conditions for Syrian refugees outside camp are presumably associated with a lack of affordable housing.
8 For comparison, in 2005, nearly 8 per cent of all Syrian households comprised 10 members or more (CBS and Unicef 2008: Table HH.3, page 61).
35
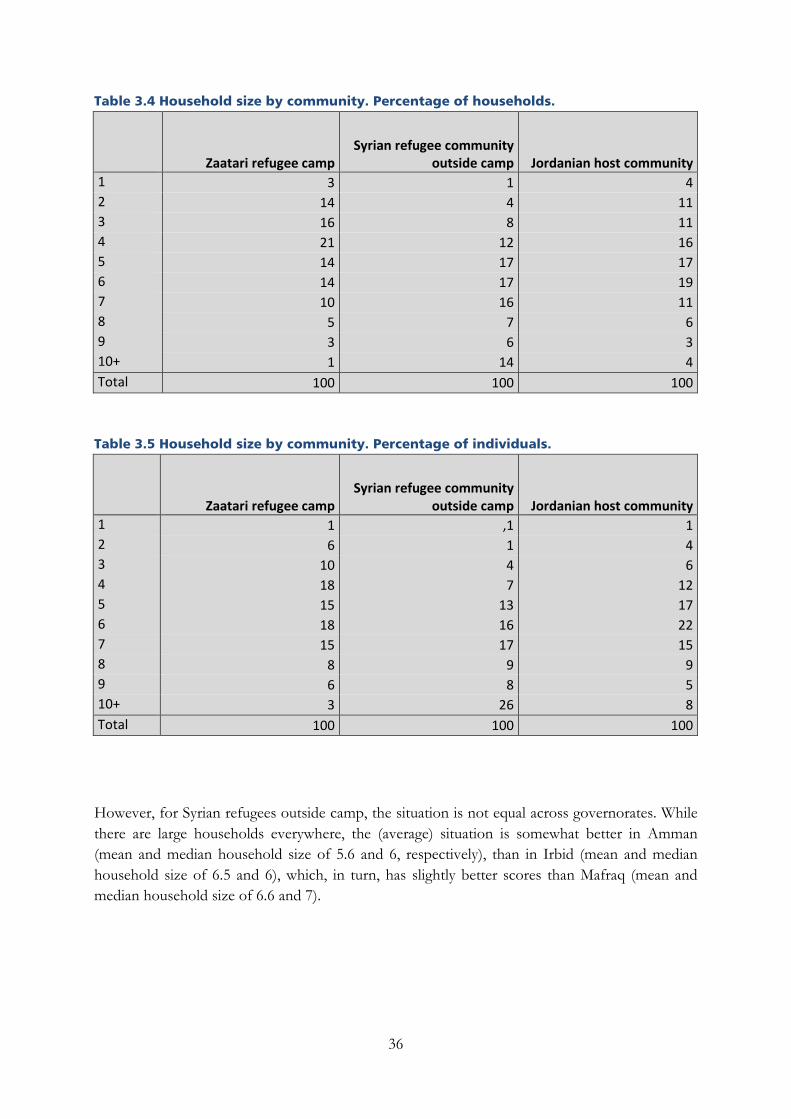
Table 3.4 Household size by community. Percentage of households.
Zaatari refugee camp Syrian refugee community
outside camp Jordanian host community 1 3 1 4 2 14 4 11 3 16 8 11 4 21 12 16 5 14 17 17 6 14 17 19 7 10 16 11 8 5 7 6 9 3 6 3 10+ 1 14 4 Total 100 100 100
Table 3.5 Household size by community. Percentage of individuals.
Zaatari refugee camp Syrian refugee community
outside camp Jordanian host community 1 1 ,1 1 2 6 1 4 3 10 4 6 4 18 7 12 5 15 13 17 6 18 16 22 7 15 17 15 8 8 9 9 9 6 8 5 10+ 3 26 8 Total 100 100 100
However, for Syrian refugees outside camp, the situation is not equal across governorates. While there are large households everywhere, the (average) situation is somewhat better in Amman (mean and median household size of 5.6 and 6, respectively), than in Irbid (mean and median household size of 6.5 and 6), which, in turn, has slightly better scores than Mafraq (mean and median household size of 6.6 and 7).
36
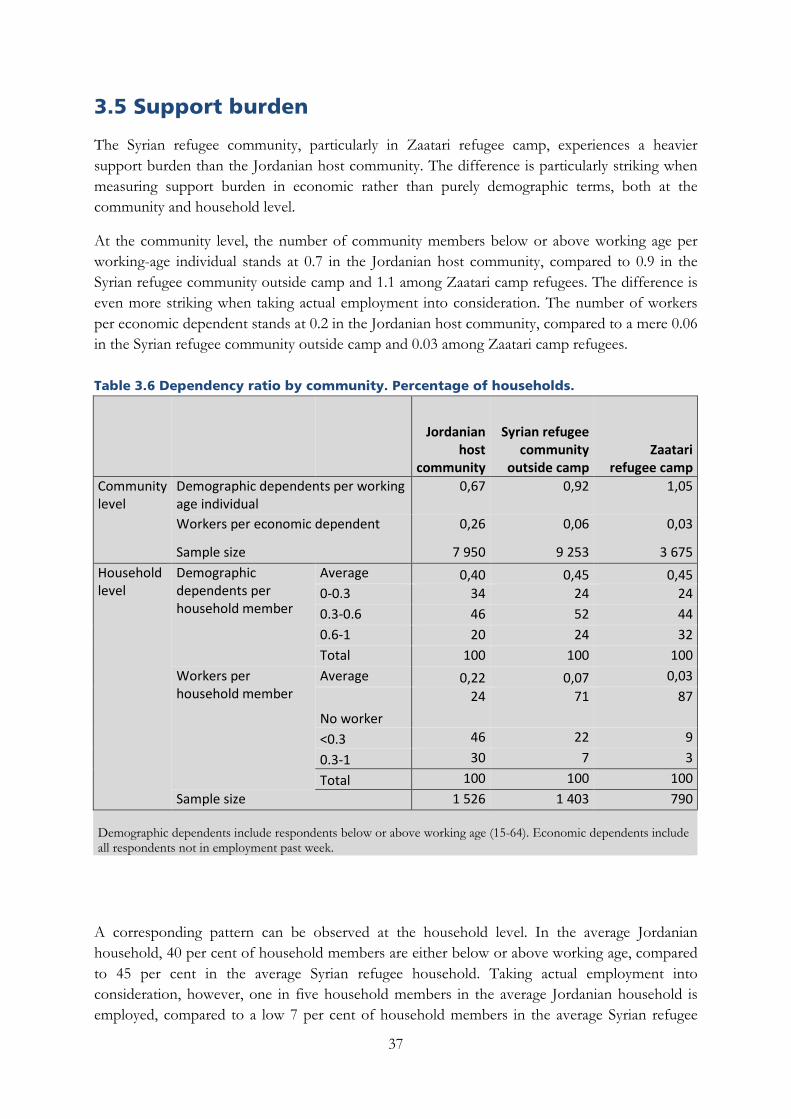
3.5 Support burden
The Syrian refugee community, particularly in Zaatari refugee camp, experiences a heavier support burden than the Jordanian host community. The difference is particularly striking when measuring support burden in economic rather than purely demographic terms, both at the community and household level.
At the community level, the number of community members below or above working age per working-age individual stands at 0.7 in the Jordanian host community, compared to 0.9 in the Syrian refugee community outside camp and 1.1 among Zaatari camp refugees. The difference is even more striking when taking actual employment into consideration. The number of workers per economic dependent stands at 0.2 in the Jordanian host community, compared to a mere 0.06 in the Syrian refugee community outside camp and 0.03 among Zaatari camp refugees.
Table 3.6 Dependency ratio by community. Percentage of households.
Jordanian host
community
Syrian refugee community
outside camp Zaatari
refugee camp Community level
Demographic dependents per working age individual
0,67 0,92 1,05
Workers per economic dependent 0,26 0,06 0,03
Sample size 7 950 9 253 3 675 Household level
Demographic dependents per household member
Average 0,40 0,45 0,45 0-0.3 34 24 24 0.3-0.6 46 52 44 0.6-1 20 24 32 Total 100 100 100
Workers per household member
Average 0,22 0,07 0,03
No worker 24 71 87
<0.3 46 22 9 0.3-1 30 7 3 Total 100 100 100
Sample size 1 526 1 403 790 Demographic dependents include respondents below or above working age (15-64). Economic dependents include all respondents not in employment past week.
A corresponding pattern can be observed at the household level. In the average Jordanian household, 40 per cent of household members are either below or above working age, compared to 45 per cent in the average Syrian refugee household. Taking actual employment into consideration, however, one in five household members in the average Jordanian household is employed, compared to a low 7 per cent of household members in the average Syrian refugee
37
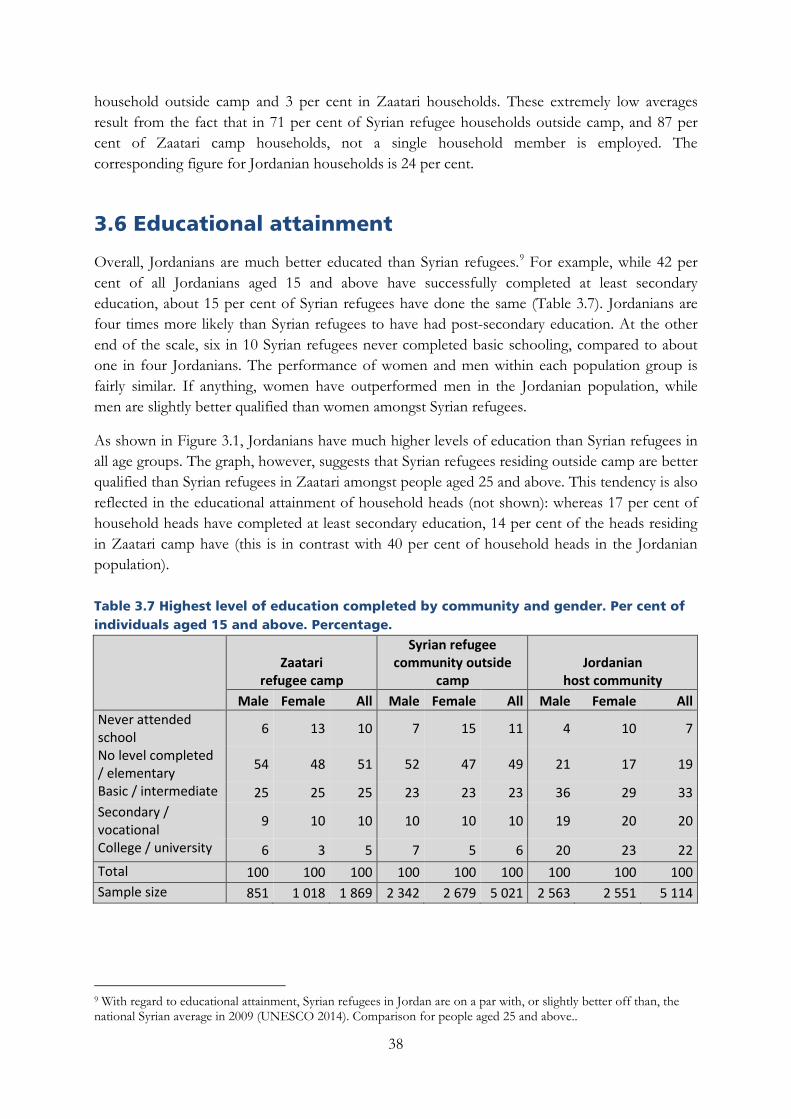
household outside camp and 3 per cent in Zaatari households. These extremely low averages result from the fact that in 71 per cent of Syrian refugee households outside camp, and 87 per cent of Zaatari camp households, not a single household member is employed. The corresponding figure for Jordanian households is 24 per cent.
3.6 Educational attainment
Overall, Jordanians are much better educated than Syrian refugees.9 For example, while 42 per cent of all Jordanians aged 15 and above have successfully completed at least secondary education, about 15 per cent of Syrian refugees have done the same (Table 3.7). Jordanians are four times more likely than Syrian refugees to have had post-secondary education. At the other end of the scale, six in 10 Syrian refugees never completed basic schooling, compared to about one in four Jordanians. The performance of women and men within each population group is fairly similar. If anything, women have outperformed men in the Jordanian population, while men are slightly better qualified than women amongst Syrian refugees.
As shown in Figure 3.1, Jordanians have much higher levels of education than Syrian refugees in all age groups. The graph, however, suggests that Syrian refugees residing outside camp are better qualified than Syrian refugees in Zaatari amongst people aged 25 and above. This tendency is also reflected in the educational attainment of household heads (not shown): whereas 17 per cent of household heads have completed at least secondary education, 14 per cent of the heads residing in Zaatari camp have (this is in contrast with 40 per cent of household heads in the Jordanian population).
Table 3.7 Highest level of education completed by community and gender. Per cent of individuals aged 15 and above. Percentage.
Zaatari refugee camp
Syrian refugee community outside
camp Jordanian
host community Male Female All Male Female All Male Female All
Never attended school 6 13 10 7 15 11 4 10 7
No level completed / elementary 54 48 51 52 47 49 21 17 19
Basic / intermediate 25 25 25 23 23 23 36 29 33 Secondary / vocational 9 10 10 10 10 10 19 20 20
College / university 6 3 5 7 5 6 20 23 22 Total 100 100 100 100 100 100 100 100 100 Sample size 851 1 018 1 869 2 342 2 679 5 021 2 563 2 551 5 114
9 With regard to educational attainment, Syrian refugees in Jordan are on a par with, or slightly better off than, the national Syrian average in 2009 (UNESCO 2014). Comparison for people aged 25 and above..
38
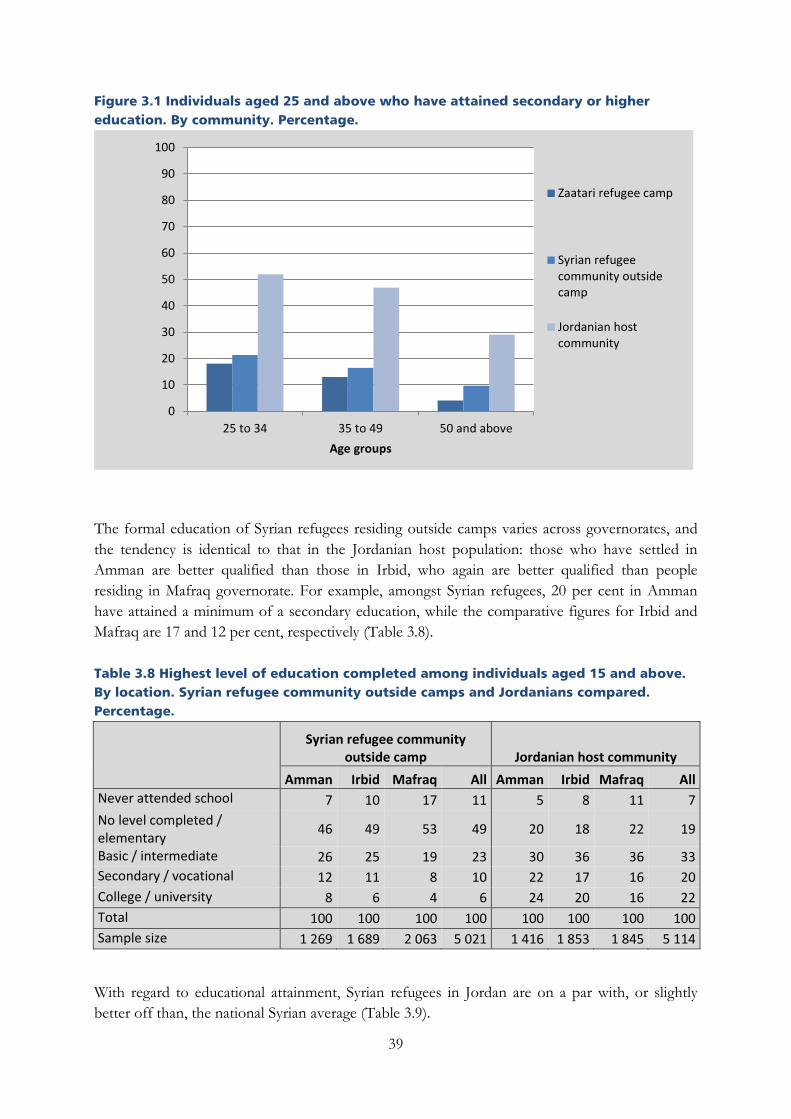
Figure 3.1 Individuals aged 25 and above who have attained secondary or higher education. By community. Percentage.
The formal education of Syrian refugees residing outside camps varies across governorates, and the tendency is identical to that in the Jordanian host population: those who have settled in Amman are better qualified than those in Irbid, who again are better qualified than people residing in Mafraq governorate. For example, amongst Syrian refugees, 20 per cent in Amman have attained a minimum of a secondary education, while the comparative figures for Irbid and Mafraq are 17 and 12 per cent, respectively (Table 3.8).
Table 3.8 Highest level of education completed among individuals aged 15 and above. By location. Syrian refugee community outside camps and Jordanians compared. Percentage.
Syrian refugee community outside camp Jordanian host community
Amman Irbid Mafraq All Amman Irbid Mafraq All Never attended school 7 10 17 11 5 8 11 7 No level completed / elementary 46 49 53 49 20 18 22 19
Basic / intermediate 26 25 19 23 30 36 36 33 Secondary / vocational 12 11 8 10 22 17 16 20 College / university 8 6 4 6 24 20 16 22 Total 100 100 100 100 100 100 100 100 Sample size 1 269 1 689 2 063 5 021 1 416 1 853 1 845 5 114
With regard to educational attainment, Syrian refugees in Jordan are on a par with, or slightly better off than, the national Syrian average (Table 3.9).
0
10
20
30
40
50
60
70
80
90
100
25 to 34 35 to 49 50 and aboveAge groups
Zaatari refugee camp
Syrian refugeecommunity outsidecamp
Jordanian hostcommunity
39
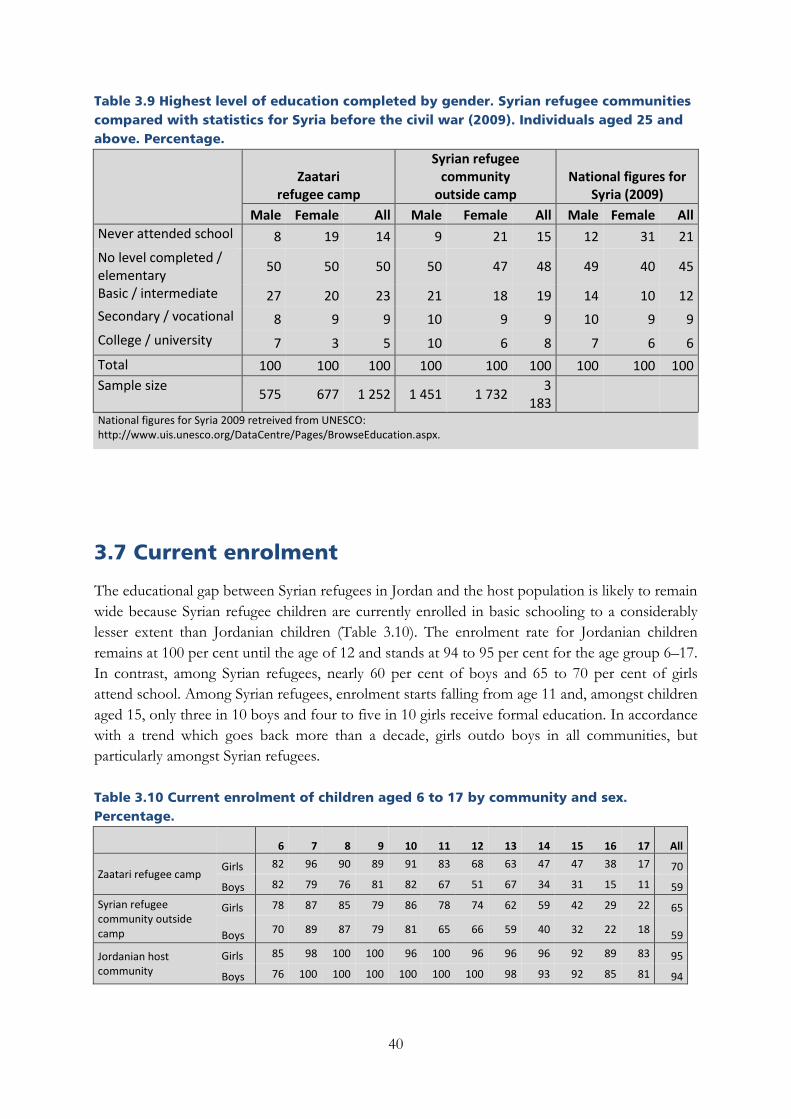
Table 3.9 Highest level of education completed by gender. Syrian refugee communities compared with statistics for Syria before the civil war (2009). Individuals aged 25 and above. Percentage.
Zaatari refugee camp
Syrian refugee community
outside camp National figures for
Syria (2009) Male Female All Male Female All Male Female All
Never attended school 8 19 14 9 21 15 12 31 21 No level completed / elementary 50 50 50 50 47 48 49 40 45
Basic / intermediate 27 20 23 21 18 19 14 10 12 Secondary / vocational 8 9 9 10 9 9 10 9 9 College / university 7 3 5 10 6 8 7 6 6 Total 100 100 100 100 100 100 100 100 100 Sample size 575 677 1 252 1 451 1 732 3
183
National figures for Syria 2009 retreived from UNESCO: http://www.uis.unesco.org/DataCentre/Pages/BrowseEducation.aspx.
3.7 Current enrolment
The educational gap between Syrian refugees in Jordan and the host population is likely to remain wide because Syrian refugee children are currently enrolled in basic schooling to a considerably lesser extent than Jordanian children (Table 3.10). The enrolment rate for Jordanian children remains at 100 per cent until the age of 12 and stands at 94 to 95 per cent for the age group 6–17. In contrast, among Syrian refugees, nearly 60 per cent of boys and 65 to 70 per cent of girls attend school. Among Syrian refugees, enrolment starts falling from age 11 and, amongst children aged 15, only three in 10 boys and four to five in 10 girls receive formal education. In accordance with a trend which goes back more than a decade, girls outdo boys in all communities, but particularly amongst Syrian refugees.
Table 3.10 Current enrolment of children aged 6 to 17 by community and sex. Percentage.
6 7 8 9 10 11 12 13 14 15 16 17 All
Zaatari refugee camp Girls 82 96 90 89 91 83 68 63 47 47 38 17 70
Boys 82 79 76 81 82 67 51 67 34 31 15 11 59 Syrian refugee community outside camp
Girls 78 87 85 79 86 78 74 62 59 42 29 22 65
Boys 70 89 87 79 81 65 66 59 40 32 22 18 59
Jordanian host community
Girls 85 98 100 100 96 100 96 96 96 92 89 83 95
Boys 76 100 100 100 100 100 100 98 93 92 85 81 94
40
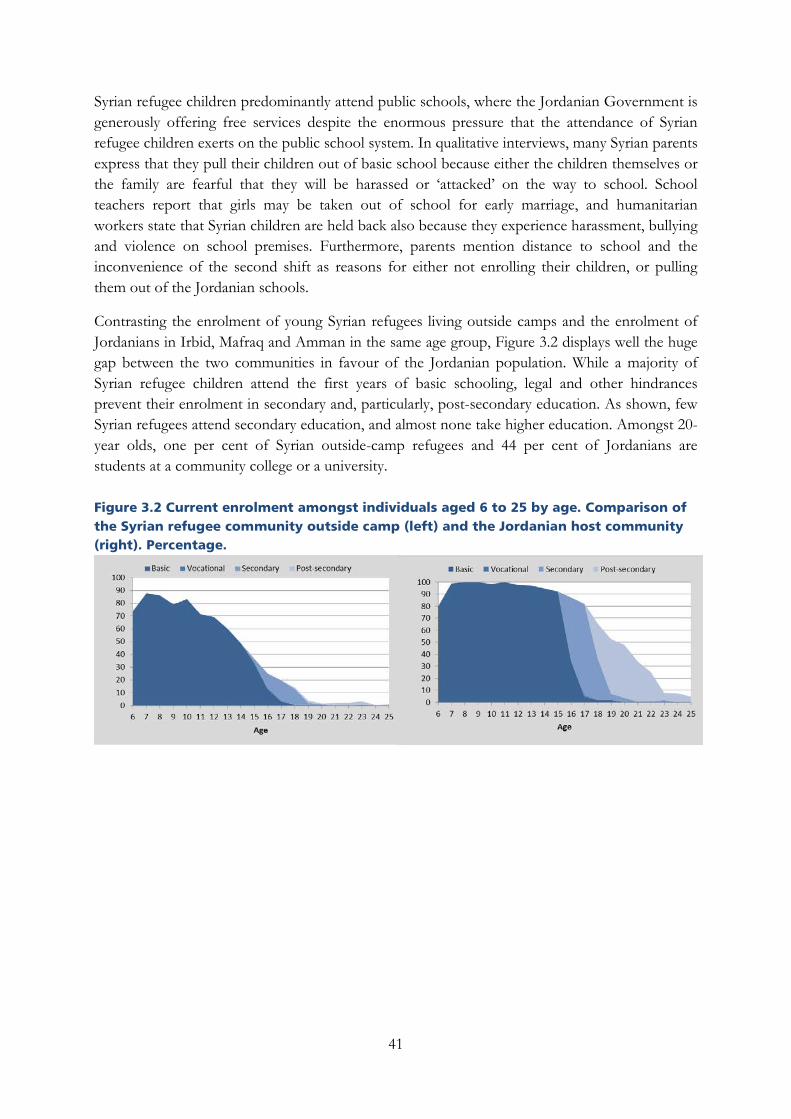
Syrian refugee children predominantly attend public schools, where the Jordanian Government is generously offering free services despite the enormous pressure that the attendance of Syrian refugee children exerts on the public school system. In qualitative interviews, many Syrian parents express that they pull their children out of basic school because either the children themselves or the family are fearful that they will be harassed or ‘attacked’ on the way to school. School teachers report that girls may be taken out of school for early marriage, and humanitarian workers state that Syrian children are held back also because they experience harassment, bullying and violence on school premises. Furthermore, parents mention distance to school and the inconvenience of the second shift as reasons for either not enrolling their children, or pulling them out of the Jordanian schools.
Contrasting the enrolment of young Syrian refugees living outside camps and the enrolment of Jordanians in Irbid, Mafraq and Amman in the same age group, Figure 3.2 displays well the huge gap between the two communities in favour of the Jordanian population. While a majority of Syrian refugee children attend the first years of basic schooling, legal and other hindrances prevent their enrolment in secondary and, particularly, post-secondary education. As shown, few Syrian refugees attend secondary education, and almost none take higher education. Amongst 20-year olds, one per cent of Syrian outside-camp refugees and 44 per cent of Jordanians are students at a community college or a university.
Figure 3.2 Current enrolment amongst individuals aged 6 to 25 by age. Comparison of the Syrian refugee community outside camp (left) and the Jordanian host community (right). Percentage.
41
Chapter 4 Labour force participation and unemployment
This chapter describes and compares the labour force and unemployment10 situation in the Jordanian host community and the Syrian refugee community, and describes changes between 2011 and 2014, which may be attributed to the influx of Syrian refugees in the Jordanian labour market.
Three years into the Syrian conflict and the refugee crisis, labour force participation rates in the Jordanian host community remain practically the same as when the crisis erupted. Labour force participation among men in the Syrian refugee community has seen a slight decrease upon arrival in Jordan. Current labour force participation is therefore somewhat higher among Jordanians than among Syrian refugee workers.
While labour force participation rates appear close to unaltered, current unemployment rates are substantially higher than before the crisis for both resident Jordanians and for Syrian refugees, indicating a negative impact of the influx of Syrian refugees on the Jordanian labour market with respect to increased competition for work and some degree of crowding out. In the Jordanian host community, the total unemployment rate has increased from 14.5 to 22 per cent between 2011 and March 2014. Among economically active Syrian refugees, the unemployment rate in Jordan is more than three times as high as the rate they experienced in Syria right before the crisis.11
Almost one in two unemployed Jordanians have been actively looking for work for more than a year, compared to about one in four Syrian refugee workers. This prevalence of long-term unemployment among Jordanians was already established when the Syrian conflict began, but has probably been further consolidated along with the rise in unemployment rates since 2011.
4.1 Labour force participation12
When the Syrian conflict began around 15 March 2011, total labour force participation stood at 42 per cent among Jordanians, and 33 per cent among the Syrians who would later become refugees in Jordan. In Jordan three years later, total labour force participation remains unchanged
10 Current employment figures calculated for the working age population, individuals aged 15 and above. Employment figures for March 2011 calculated for individuals currently aged 18 and above, who were 15 and above at the time. 11 It should be kept in mind that Syrian refugees face the additional legal restriction of having to obtain a work permit to be able to work legally in Jordan. As reported in Chapter 6, however, many Syrian refugees circumvent these restrictions and find work without having a work permit. 12 Labour force participation rates calculated for the working age population, age 15 and above. As reported in Chapter 9, the pattern is different for children age 9–14, of whom a larger share of Syrian refugees than Jordanians currently participate in the labour force. Tables in the tabulation report relevant for this section include Table 6.1, 6.2, 5.1, 5.2, 5.11.
42
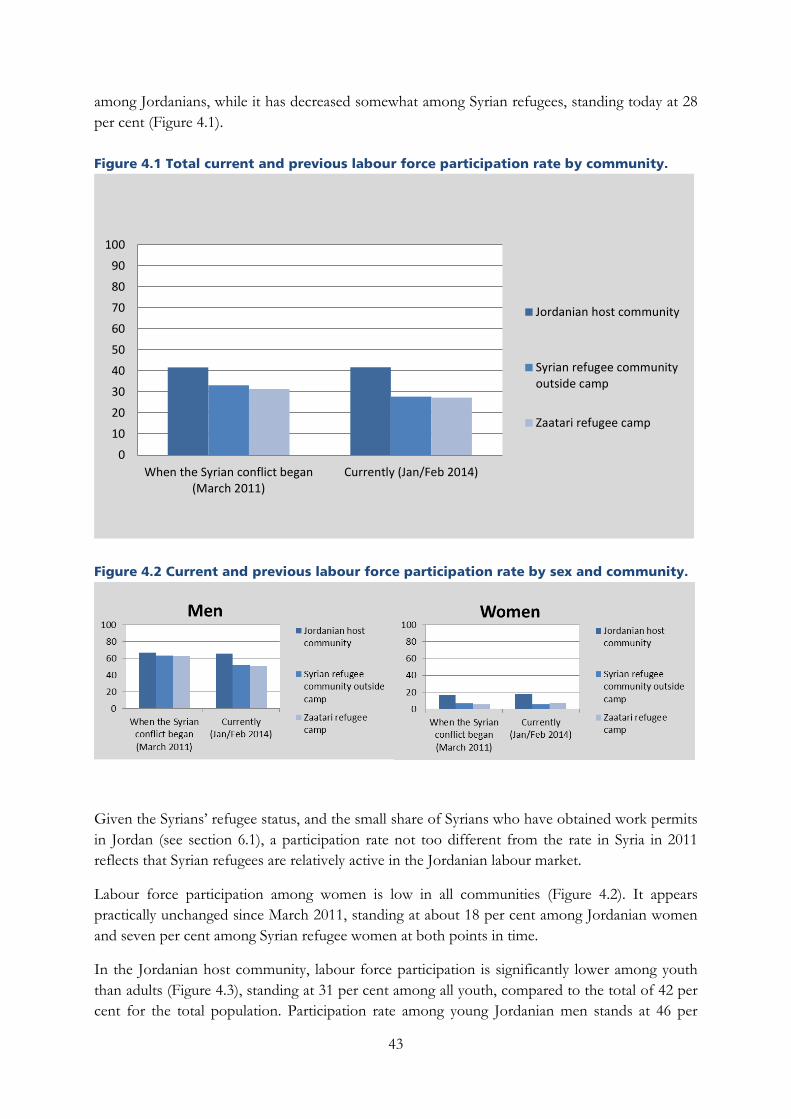
among Jordanians, while it has decreased somewhat among Syrian refugees, standing today at 28 per cent (Figure 4.1).
Figure 4.1 Total current and previous labour force participation rate by community.
Figure 4.2 Current and previous labour force participation rate by sex and community.
Given the Syrians’ refugee status, and the small share of Syrians who have obtained work permits in Jordan (see section 6.1), a participation rate not too different from the rate in Syria in 2011 reflects that Syrian refugees are relatively active in the Jordanian labour market.
Labour force participation among women is low in all communities (Figure 4.2). It appears practically unchanged since March 2011, standing at about 18 per cent among Jordanian women and seven per cent among Syrian refugee women at both points in time.
In the Jordanian host community, labour force participation is significantly lower among youth than adults (Figure 4.3), standing at 31 per cent among all youth, compared to the total of 42 per cent for the total population. Participation rate among young Jordanian men stands at 46 per
0
10
20
30
40
50
60
70
80
90
100
When the Syrian conflict began(March 2011)
Currently (Jan/Feb 2014)
Jordanian host community
Syrian refugee communityoutside camp
Zaatari refugee camp
43

cent, compared to 66 per cent for all men in the country, while the rate for young Jordanian women stands at 15 per cent (figure 4.4). In the Syrian refugee community, however, labour force participation among youth hardly diverges from the average, neither for men nor women. Part of this difference between the communities is likely due to a larger share of Jordanian youth remaining in school after completing basic schooling, while a larger share of Syrian refugee youth is required to help support their families at this age. In Syria in March 2011, youth labour force participation was lower than for men in total, more in line with the pattern for Jordanian youth. This indicates that the dynamics pushing more young refugee men into the labour market changed with the flight. In all communities, current labour force participation of men and women gradually decreases after the age of 45.
Figure 4.3 Current labour force participation rate by age and community.
Figure 4.4 Current labour force participation rate by sex, age and community.
Across all communities, current labour force participation is clearly correlated to levels of education. Rates for highly educated persons are higher than the community average, while for
0
10
20
30
40
50
60
70
80
90
100
15-24 25-34 35-44 45-54 55+
Jordanian host community
Syrian refugee communityoutside camp
Zaatari refugee camp
44

persons with little or no education, rates are lower than the community average (table 4.1). This general picture is the same for both men and women in all three communities.
Differences in labour force participation by households’ wealth are relatively small (Table 4.1). Women’s labour force participation, however, tends to be higher in more wealthy households, particularly in the Jordanian host community of which 23 per cent of women in the wealthiest tertile participate in the labour market, compared to 14 per cent in the bottom tertile. The difference in wealth between the top and bottom tertile is less apparent in the Syrian refugee community, where the vast majority of men and women fall into the bottom wealth tertile.
Table 4.1 Labour force participation rate by education, wealth, sex and community
Jordanian host community
Syrian refugee commmunity outside
camp Zaatari camp
Men Women Total Men Women Total Men Women Total Total 66 18 42 52 6 28 51 7 27
Highest level of education completed
Never attended school 21 5 9 27 2 10 32 2 10
No level completed / Elementary
54 5 32 54 4 29 50 5 27
Basic / Intermediate 71 11 44 50 5 26 51 5 26
Secondary / Vocational 60 11 35 52 14 32 66 19 39
College / University 84 48 64 67 26 50 55 41 50
Wealth index tertile
Poorest third 66 14 40 48 5 25 47 6 25
Middle third 68 18 43 50 4 27 55 7 29
Richest third 63 23 42 58 8 31 51 9 28
For Syrian refugees outside camp, labour force participation is highest in Amman governorate, standing at 67 per cent among men and 10 per cent among women, compared to 47 and 4 per cent in Irbid, and 41 and 5 per cent in Mafraq, respectively. In the Jordanian host community, labour force participation is similar across governorates for men and women.
Between half and two thirds of women out of the labour force in all communities report that the main reason why they are not looking for a job is family responsibility, housework, or family objection. This share is largest among women in Zaatari camp and lowest among Jordanian women. In all communities, about 20 to 25 per cent of all household members aged 15 and above who are out of the labour force are accounted for by individuals who are retired, considered too young or too old to work, or have a disability or illness.
Three community-specific patterns stand out with respect to reasons for being outside the labour market. First, 67 per cent of Jordanian youth out of the labour force are accounted for by full-time schooling, compared to only about 15 per cent among Syrian refugee youth. This mirrors the generally lower levels of enrolment and educational attainment among the Syrian refugee population. Second, 13 per cent of Syrian refugees outside camp cite the lack of a work permit as the main reason for not looking for a job. This problem, further outlined in Chapter 6, is not
45
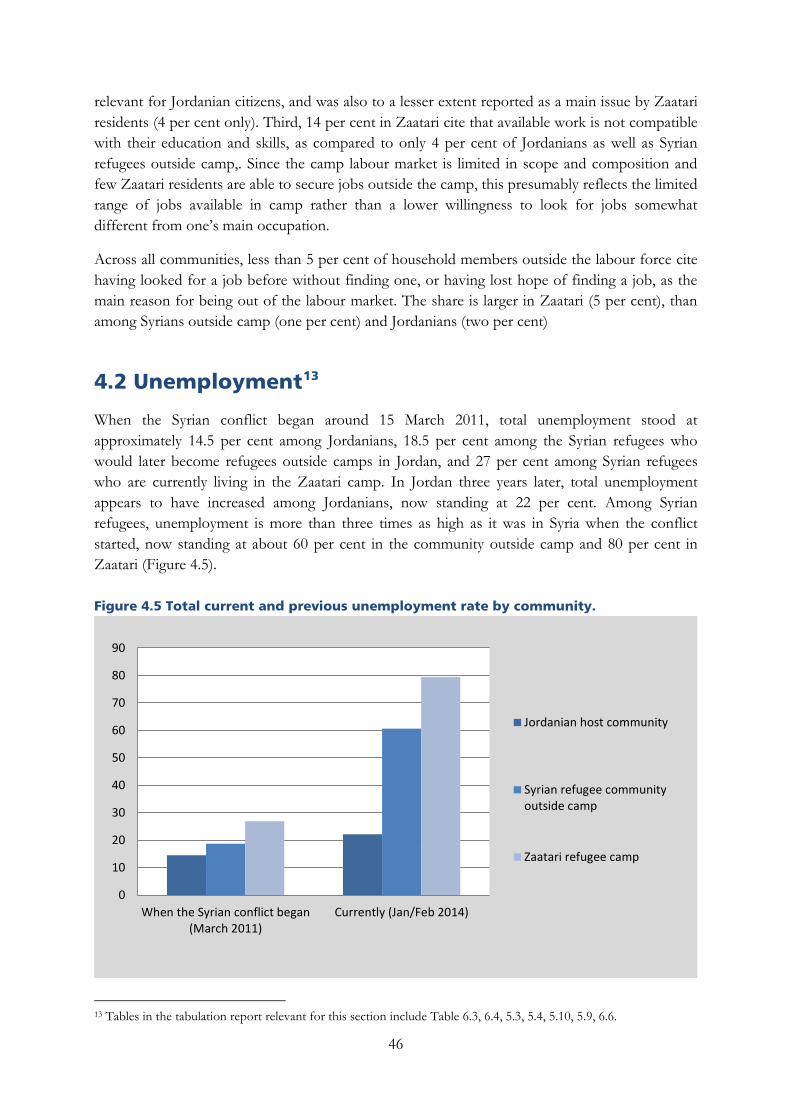
relevant for Jordanian citizens, and was also to a lesser extent reported as a main issue by Zaatari residents (4 per cent only). Third, 14 per cent in Zaatari cite that available work is not compatible with their education and skills, as compared to only 4 per cent of Jordanians as well as Syrian refugees outside camp,. Since the camp labour market is limited in scope and composition and few Zaatari residents are able to secure jobs outside the camp, this presumably reflects the limited range of jobs available in camp rather than a lower willingness to look for jobs somewhat different from one’s main occupation.
Across all communities, less than 5 per cent of household members outside the labour force cite having looked for a job before without finding one, or having lost hope of finding a job, as the main reason for being out of the labour market. The share is larger in Zaatari (5 per cent), than among Syrians outside camp (one per cent) and Jordanians (two per cent)
4.2 Unemployment13
When the Syrian conflict began around 15 March 2011, total unemployment stood at approximately 14.5 per cent among Jordanians, 18.5 per cent among the Syrian refugees who would later become refugees outside camps in Jordan, and 27 per cent among Syrian refugees who are currently living in the Zaatari camp. In Jordan three years later, total unemployment appears to have increased among Jordanians, now standing at 22 per cent. Among Syrian refugees, unemployment is more than three times as high as it was in Syria when the conflict started, now standing at about 60 per cent in the community outside camp and 80 per cent in Zaatari (Figure 4.5).
Figure 4.5 Total current and previous unemployment rate by community.
13 Tables in the tabulation report relevant for this section include Table 6.3, 6.4, 5.3, 5.4, 5.10, 5.9, 6.6.
0
10
20
30
40
50
60
70
80
90
When the Syrian conflict began(March 2011)
Currently (Jan/Feb 2014)
Jordanian host community
Syrian refugee communityoutside camp
Zaatari refugee camp
46
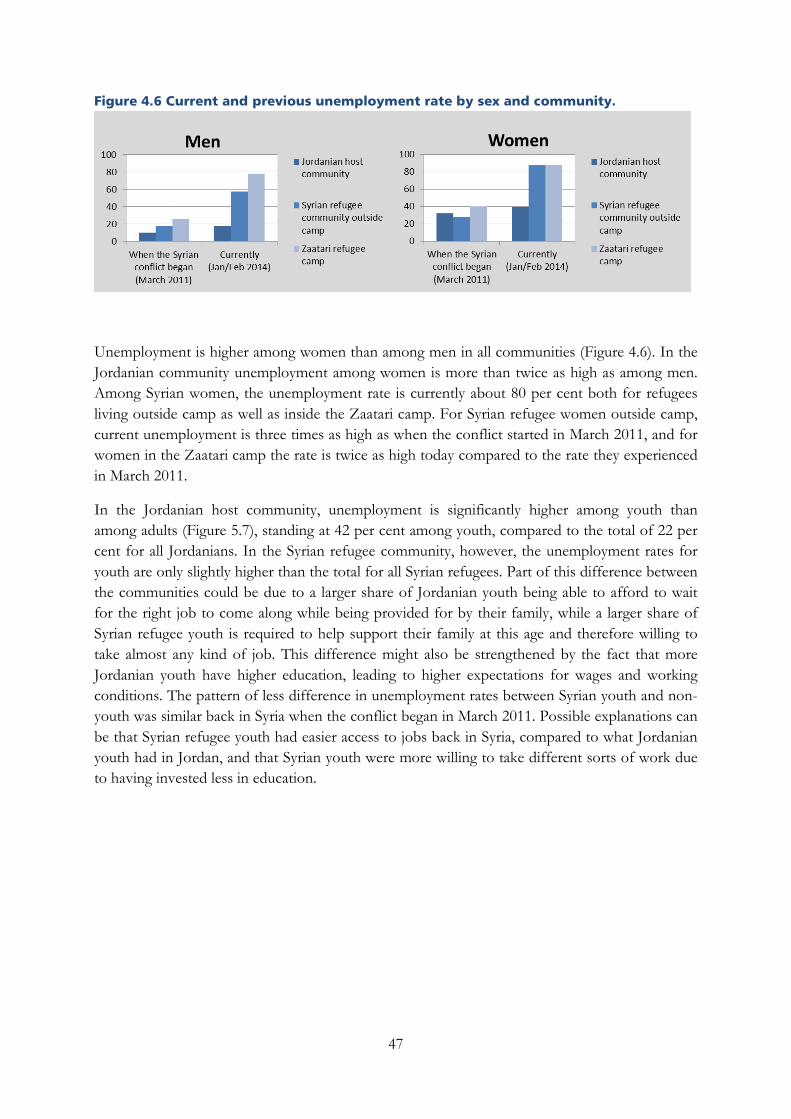
Figure 4.6 Current and previous unemployment rate by sex and community.
Unemployment is higher among women than among men in all communities (Figure 4.6). In the Jordanian community unemployment among women is more than twice as high as among men. Among Syrian women, the unemployment rate is currently about 80 per cent both for refugees living outside camp as well as inside the Zaatari camp. For Syrian refugee women outside camp, current unemployment is three times as high as when the conflict started in March 2011, and for women in the Zaatari camp the rate is twice as high today compared to the rate they experienced in March 2011.
In the Jordanian host community, unemployment is significantly higher among youth than among adults (Figure 5.7), standing at 42 per cent among youth, compared to the total of 22 per cent for all Jordanians. In the Syrian refugee community, however, the unemployment rates for youth are only slightly higher than the total for all Syrian refugees. Part of this difference between the communities could be due to a larger share of Jordanian youth being able to afford to wait for the right job to come along while being provided for by their family, while a larger share of Syrian refugee youth is required to help support their family at this age and therefore willing to take almost any kind of job. This difference might also be strengthened by the fact that more Jordanian youth have higher education, leading to higher expectations for wages and working conditions. The pattern of less difference in unemployment rates between Syrian youth and non-youth was similar back in Syria when the conflict began in March 2011. Possible explanations can be that Syrian refugee youth had easier access to jobs back in Syria, compared to what Jordanian youth had in Jordan, and that Syrian youth were more willing to take different sorts of work due to having invested less in education.
47
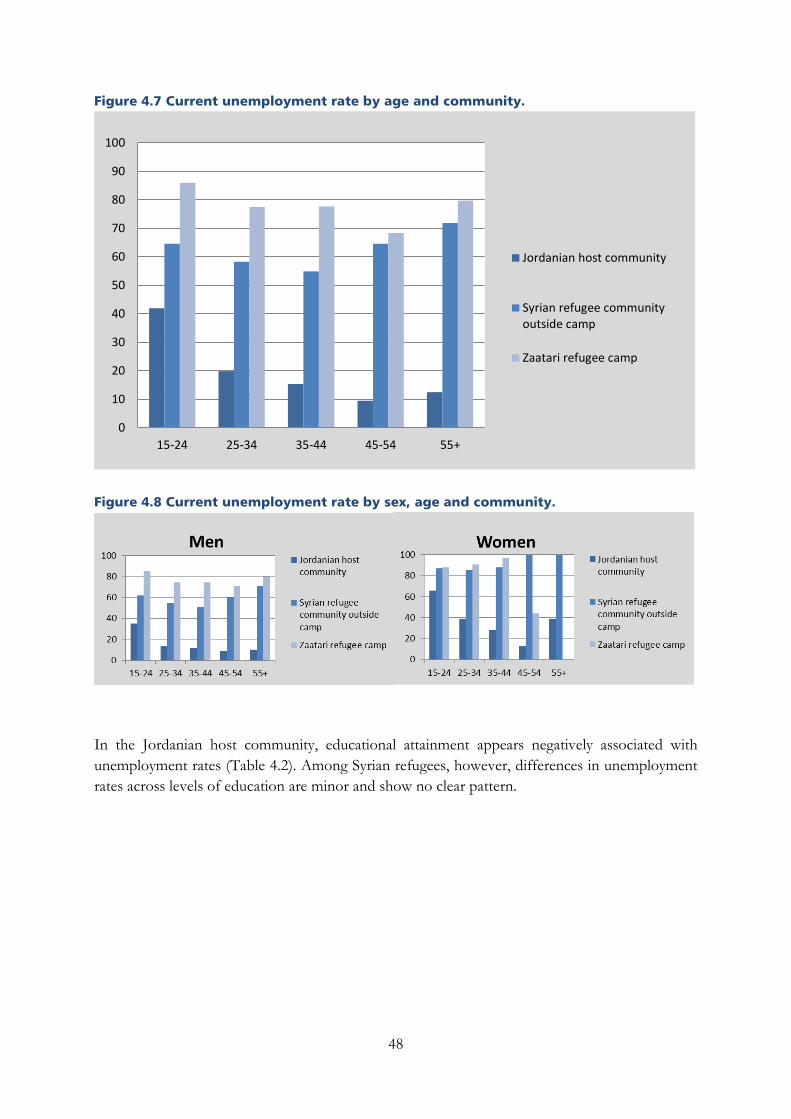
Figure 4.7 Current unemployment rate by age and community.
Figure 4.8 Current unemployment rate by sex, age and community.
In the Jordanian host community, educational attainment appears negatively associated with unemployment rates (Table 4.2). Among Syrian refugees, however, differences in unemployment rates across levels of education are minor and show no clear pattern.
0
10
20
30
40
50
60
70
80
90
100
15-24 25-34 35-44 45-54 55+
Jordanian host community
Syrian refugee communityoutside camp
Zaatari refugee camp
48
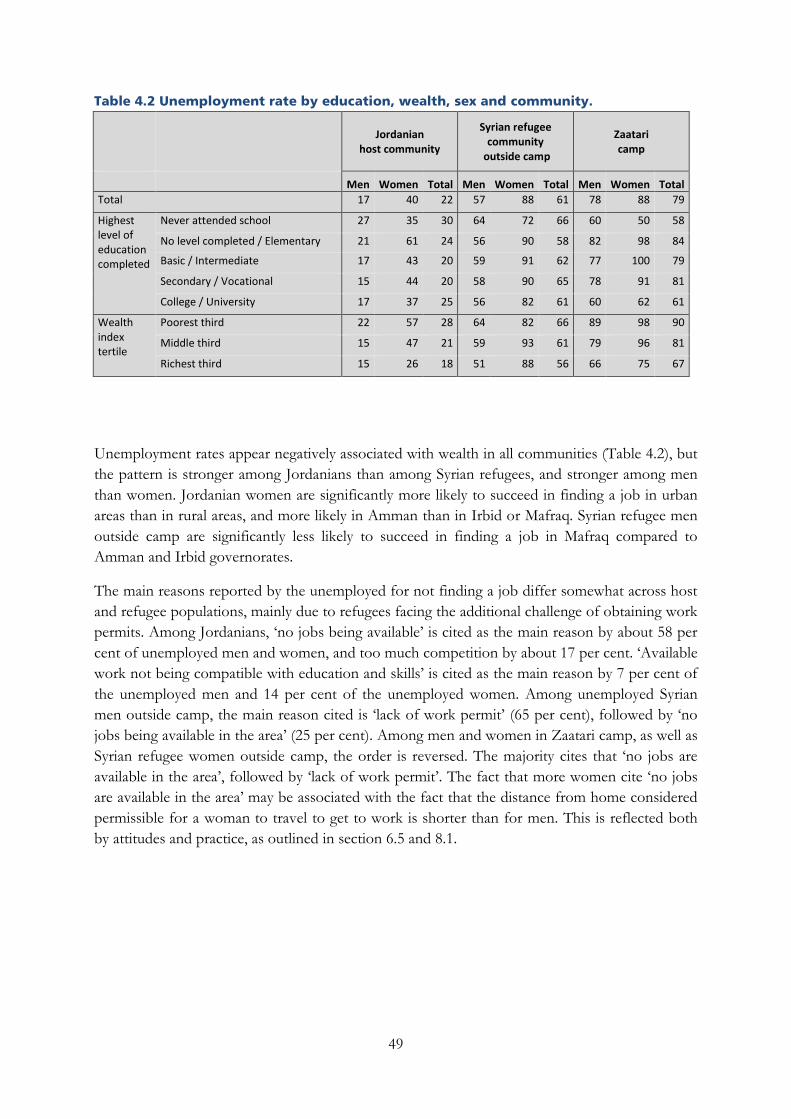
Table 4.2 Unemployment rate by education, wealth, sex and community.
Jordanian host community
Syrian refugee community
outside camp
Zaatari camp
Men Women Total Men Women Total Men Women Total Total 17 40 22 57 88 61 78 88 79
Highest level of education completed
Never attended school 27 35 30 64 72 66 60 50 58
No level completed / Elementary 21 61 24 56 90 58 82 98 84
Basic / Intermediate 17 43 20 59 91 62 77 100 79
Secondary / Vocational 15 44 20 58 90 65 78 91 81
College / University 17 37 25 56 82 61 60 62 61
Wealth index tertile
Poorest third 22 57 28 64 82 66 89 98 90
Middle third 15 47 21 59 93 61 79 96 81
Richest third 15 26 18 51 88 56 66 75 67
Unemployment rates appear negatively associated with wealth in all communities (Table 4.2), but the pattern is stronger among Jordanians than among Syrian refugees, and stronger among men than women. Jordanian women are significantly more likely to succeed in finding a job in urban areas than in rural areas, and more likely in Amman than in Irbid or Mafraq. Syrian refugee men outside camp are significantly less likely to succeed in finding a job in Mafraq compared to Amman and Irbid governorates.
The main reasons reported by the unemployed for not finding a job differ somewhat across host and refugee populations, mainly due to refugees facing the additional challenge of obtaining work permits. Among Jordanians, ‘no jobs being available’ is cited as the main reason by about 58 per cent of unemployed men and women, and too much competition by about 17 per cent. ‘Available work not being compatible with education and skills’ is cited as the main reason by 7 per cent of the unemployed men and 14 per cent of the unemployed women. Among unemployed Syrian men outside camp, the main reason cited is ‘lack of work permit’ (65 per cent), followed by ‘no jobs being available in the area’ (25 per cent). Among men and women in Zaatari camp, as well as Syrian refugee women outside camp, the order is reversed. The majority cites that ‘no jobs are available in the area’, followed by ‘lack of work permit’. The fact that more women cite ‘no jobs are available in the area’ may be associated with the fact that the distance from home considered permissible for a woman to travel to get to work is shorter than for men. This is reflected both by attitudes and practice, as outlined in section 6.5 and 8.1.
49

Figure 4.9 Duration of unemployment by community.
Figure 4.10 Duration of unemployment by sex and community.
When asked how long they have been actively looking for work (Figure 4.9), unemployed Syrian refugees fall quite evenly into all the time categories used in the survey questionnaire. With respect to unemployed Jordanians, nearly 50 per cent of them have been unemployed for more than 12 months, while about 23 per cent have been unemployed for less than 3 months. This pattern is practically identical for unemployed Jordanian men and women.
The pattern of long-term unemployment among unemployed Jordanians has probably been reinforced by the influx of Syrian refugees, although this situation did not emerge with the influx of Syrian refugees. Looking back to March 2011, more than half of all unemployed Jordanian men and women report they had been looking for work for more than 12 months at the time.
0
10
20
30
40
50
60
Less than 3months
3-6 months 7-12 months More than 12months
Jordanian host community
Syrian refugee communityoutside camp
Zaatari refugee camp
50
Chapter 5 Work experience and access to employment
This chapter outlines central aspects of the Syrian refugees’ work experience in from Syria and the experience they are currently obtaining in the Jordanian labour market14, in terms of status in employment, sector, type of economic activity, and occupation. It also compares the ease of access to employment for Syrian refugees who were employed in Syria when the crisis started to that of Jordanians with similar work experience.15
In terms of industry, a larger share of the Syrians who would become refugees in Jordan, compared to Jordanians in employment, worked in the construction industry in March 2011, and a smaller share in public administration and defence, education and health, and social work. In Jordan three years later, the distribution across industries of employed Jordanians remains the same, but a larger share of workers in the Syrian refugee community outside camp has come to work in construction, and a larger share of refugees in Zaatari camp in the education industry.
In terms of occupation, a larger share of the Syrians who would become refugees in Jordan, compared to Jordanians, worked as skilled agricultural and fishery workers and in craft and related trades occupations in March 2011, and a smaller share in white-collar occupations such as professionals, technicians and associate professionals. In Jordan three years later, the distribution across occupations of employed Jordanians is almost identical, while Syrian refugee workers outside camp are employed as crafts and related trades workers to a larger extent, and as professionals, technicians, associate professionals or clerical support workers to a lesser extent, compared to both Jordanian workers and Syrian refugee workers in Zaatari.
In terms of sector of employment, Jordanian workers and Syrian workers who would become refugees in Jordan were similarly distributed across status in employment in March 2011. In Jordan three years later, the distribution of employed Jordanians across status in employment is almost identical, but nine out of ten employed Syrian refugees work as paid employees.
Syrian refugees’ success or failure in finding a job in Jordan appears associated with the kind of industry, occupation and employment status they have experience with from Syria. Syrians with
14 Current employment figures calculated for the working age population, individuals aged 15 or above. Employment figures for March 2011 are calculated for individuals currently aged 18 and above, who were 15 and above at the time. 15 The work experience profiles should be interpreted with some care. Given that the characteristics of respondents’ work experience is only recorded for two points in time, March 2011 and January/February 2014, any prior or intermediate experience among respondents who were unemployed or out of the labour force at both points of time remains uncaptured by the analysis. 800 Syrian refugees outside camp, 326 in Zaatari and 658 Jordanians were neither employed when the survey was implemented nor when the Syrian conflict began in March 2011, but report having been previously employed. These individuals have at least some work experience, but are not captured in this mapping of the characteristics of work experience. To the extent that the work experience of this group differs from the experience of those employed in 2011 and 2014, results may be biased with regards to employability at the aggregate level.
51
experience as paid employees in the construction industry, and/or from craft and related trade occupations are most likely to have found a job in Jordan, and Syrians with experience in agriculture, forestry and fishery and family businesses are least likely to have succeeded. No corresponding differences are present in the Jordanian host population, suggesting that the pattern is not due to changing demand in the Jordanian labour market.
Three important caveats should be kept in mind when interpreting the results in this chapter. First, for Zaatari camp refugees, distributions of workers across jobs with different characteristics entail a high level of uncertainty, as there are only 104 workers in the Zaatari sample. Results from Zaatari are therefore not reported in all sections. Second, the work experience profiles from March 2011 are based on recollection with a long reference period, increasing the risk of imprecise answers. Third, the sample size is small for many sub-categories in the analysis of how access is related to work experience, increasing the uncertainty of results.
5.1 Current and previous employment16
Nine out of ten Jordanians who were above working age and employed in March 2011 are also employed three years later, while more than two thirds of the Syrian refugees who were employed in Syria when the conflict began have become unemployed or left the labour force after arriving Jordan.
Among Jordanians, 89 per cent of those employed and aged 15 and above in March 2011 are also employed three years later, and 10 per cent of those unemployed in March 2011 have become employed. Among Syrian refugees outside camp who were employed in Syria in March 2011, however, only 32 per cent are employed in Jordan three years later. Thirty-one per cent have become unemployed and 37 per cent have moved out of the labour force. In the same period, only 14 per cent of those unemployed in March 2011 and three per cent of those not in the labour force in Syria have become employed in Jordan. The pattern is even clearer among Syrian refugees in Zaatari camp. Among those who were employed in Syria in March 2011, only 19 per cent are employed in Jordan three years later. 43 per cent have become unemployed and 38 per cent have left the labour force. In the same period, only four per cent of those unemployed in March 2011 and two per cent of those not in the labour force have become employed.
16 See Table 6.11 in tabulation report.
52
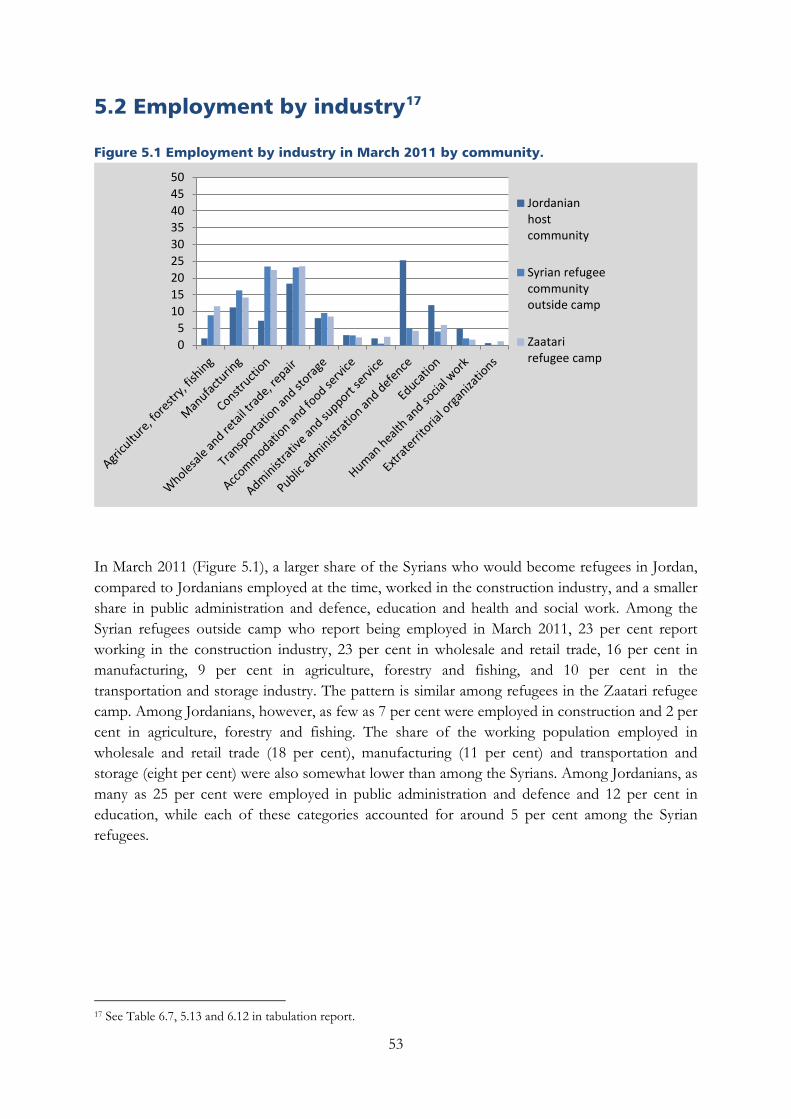
5.2 Employment by industry17
Figure 5.1 Employment by industry in March 2011 by community.
In March 2011 (Figure 5.1), a larger share of the Syrians who would become refugees in Jordan, compared to Jordanians employed at the time, worked in the construction industry, and a smaller share in public administration and defence, education and health and social work. Among the Syrian refugees outside camp who report being employed in March 2011, 23 per cent report working in the construction industry, 23 per cent in wholesale and retail trade, 16 per cent in manufacturing, 9 per cent in agriculture, forestry and fishing, and 10 per cent in the transportation and storage industry. The pattern is similar among refugees in the Zaatari refugee camp. Among Jordanians, however, as few as 7 per cent were employed in construction and 2 per cent in agriculture, forestry and fishing. The share of the working population employed in wholesale and retail trade (18 per cent), manufacturing (11 per cent) and transportation and storage (eight per cent) were also somewhat lower than among the Syrians. Among Jordanians, as many as 25 per cent were employed in public administration and defence and 12 per cent in education, while each of these categories accounted for around 5 per cent among the Syrian refugees.
17 See Table 6.7, 5.13 and 6.12 in tabulation report.
05
101520253035404550
Jordanianhostcommunity
Syrian refugeecommunityoutside camp
Zaatarirefugee camp
53
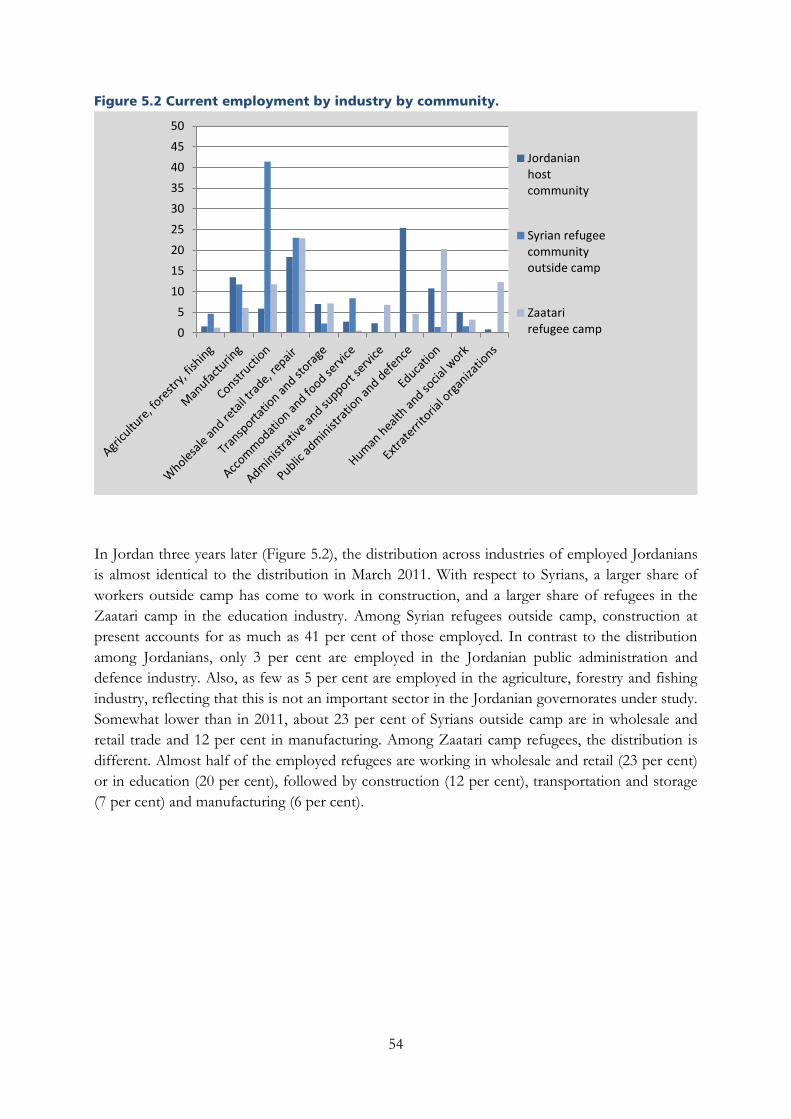
Figure 5.2 Current employment by industry by community.
In Jordan three years later (Figure 5.2), the distribution across industries of employed Jordanians is almost identical to the distribution in March 2011. With respect to Syrians, a larger share of workers outside camp has come to work in construction, and a larger share of refugees in the Zaatari camp in the education industry. Among Syrian refugees outside camp, construction at present accounts for as much as 41 per cent of those employed. In contrast to the distribution among Jordanians, only 3 per cent are employed in the Jordanian public administration and defence industry. Also, as few as 5 per cent are employed in the agriculture, forestry and fishing industry, reflecting that this is not an important sector in the Jordanian governorates under study. Somewhat lower than in 2011, about 23 per cent of Syrians outside camp are in wholesale and retail trade and 12 per cent in manufacturing. Among Zaatari camp refugees, the distribution is different. Almost half of the employed refugees are working in wholesale and retail (23 per cent) or in education (20 per cent), followed by construction (12 per cent), transportation and storage (7 per cent) and manufacturing (6 per cent).
05
101520253035404550
Jordanianhostcommunity
Syrian refugeecommunityoutside camp
Zaatarirefugee camp
54
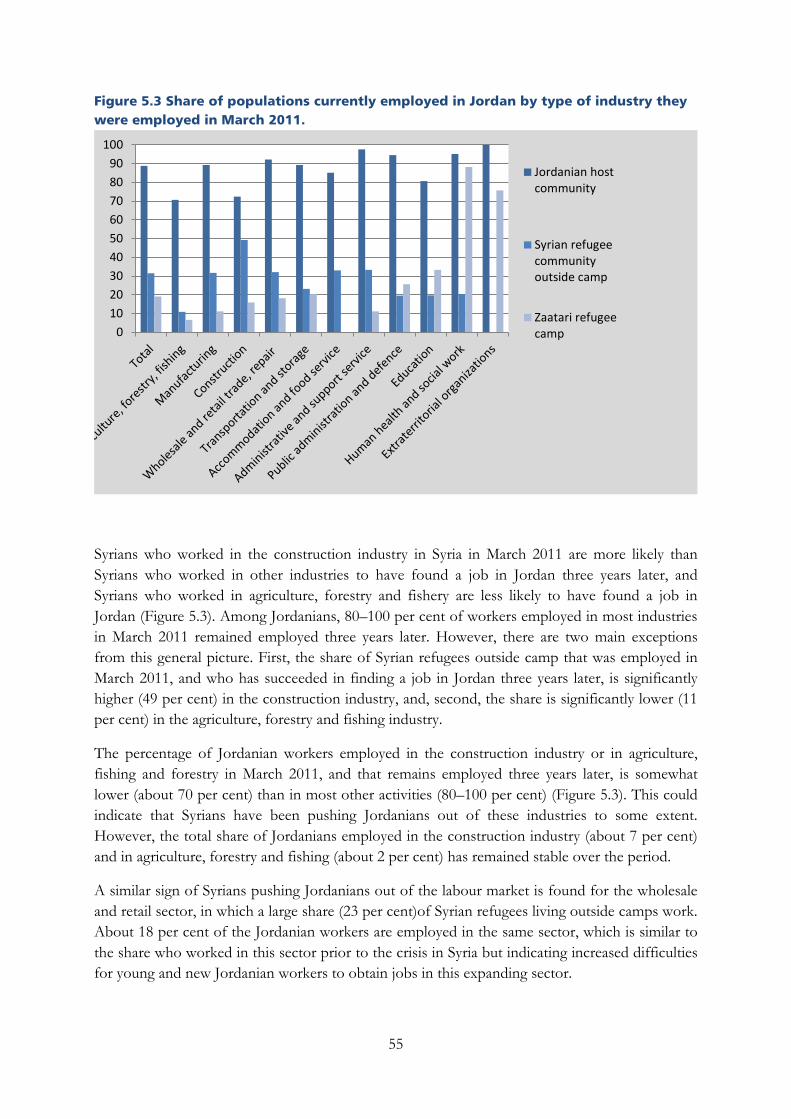
Figure 5.3 Share of populations currently employed in Jordan by type of industry they were employed in March 2011.
Syrians who worked in the construction industry in Syria in March 2011 are more likely than Syrians who worked in other industries to have found a job in Jordan three years later, and Syrians who worked in agriculture, forestry and fishery are less likely to have found a job in Jordan (Figure 5.3). Among Jordanians, 80–100 per cent of workers employed in most industries in March 2011 remained employed three years later. However, there are two main exceptions from this general picture. First, the share of Syrian refugees outside camp that was employed in March 2011, and who has succeeded in finding a job in Jordan three years later, is significantly higher (49 per cent) in the construction industry, and, second, the share is significantly lower (11 per cent) in the agriculture, forestry and fishing industry.
The percentage of Jordanian workers employed in the construction industry or in agriculture, fishing and forestry in March 2011, and that remains employed three years later, is somewhat lower (about 70 per cent) than in most other activities (80–100 per cent) (Figure 5.3). This could indicate that Syrians have been pushing Jordanians out of these industries to some extent. However, the total share of Jordanians employed in the construction industry (about 7 per cent) and in agriculture, forestry and fishing (about 2 per cent) has remained stable over the period.
A similar sign of Syrians pushing Jordanians out of the labour market is found for the wholesale and retail sector, in which a large share (23 per cent)of Syrian refugees living outside camps work. About 18 per cent of the Jordanian workers are employed in the same sector, which is similar to the share who worked in this sector prior to the crisis in Syria but indicating increased difficulties for young and new Jordanian workers to obtain jobs in this expanding sector.
0102030405060708090
100
Jordanian hostcommunity
Syrian refugeecommunityoutside camp
Zaatari refugeecamp
55
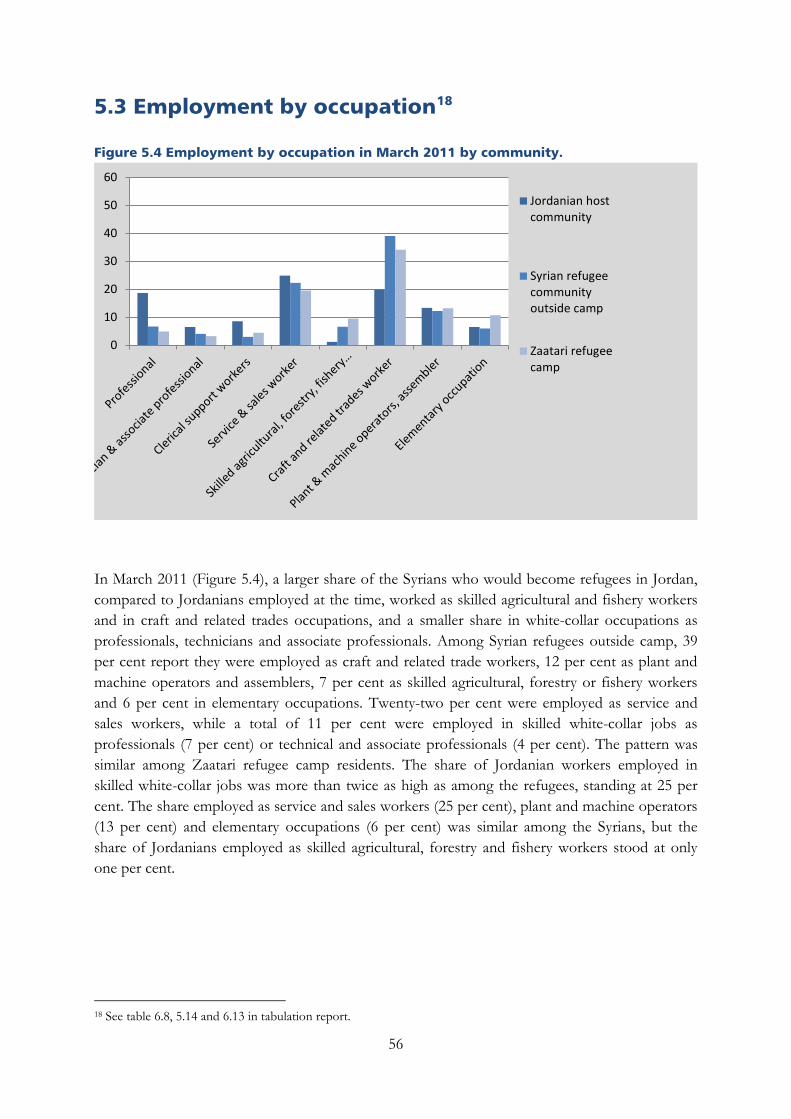
5.3 Employment by occupation18
Figure 5.4 Employment by occupation in March 2011 by community.
In March 2011 (Figure 5.4), a larger share of the Syrians who would become refugees in Jordan, compared to Jordanians employed at the time, worked as skilled agricultural and fishery workers and in craft and related trades occupations, and a smaller share in white-collar occupations as professionals, technicians and associate professionals. Among Syrian refugees outside camp, 39 per cent report they were employed as craft and related trade workers, 12 per cent as plant and machine operators and assemblers, 7 per cent as skilled agricultural, forestry or fishery workers and 6 per cent in elementary occupations. Twenty-two per cent were employed as service and sales workers, while a total of 11 per cent were employed in skilled white-collar jobs as professionals (7 per cent) or technical and associate professionals (4 per cent). The pattern was similar among Zaatari refugee camp residents. The share of Jordanian workers employed in skilled white-collar jobs was more than twice as high as among the refugees, standing at 25 per cent. The share employed as service and sales workers (25 per cent), plant and machine operators (13 per cent) and elementary occupations (6 per cent) was similar among the Syrians, but the share of Jordanians employed as skilled agricultural, forestry and fishery workers stood at only one per cent.
18 See table 6.8, 5.14 and 6.13 in tabulation report.
0
10
20
30
40
50
60
Jordanian hostcommunity
Syrian refugeecommunityoutside camp
Zaatari refugeecamp
56
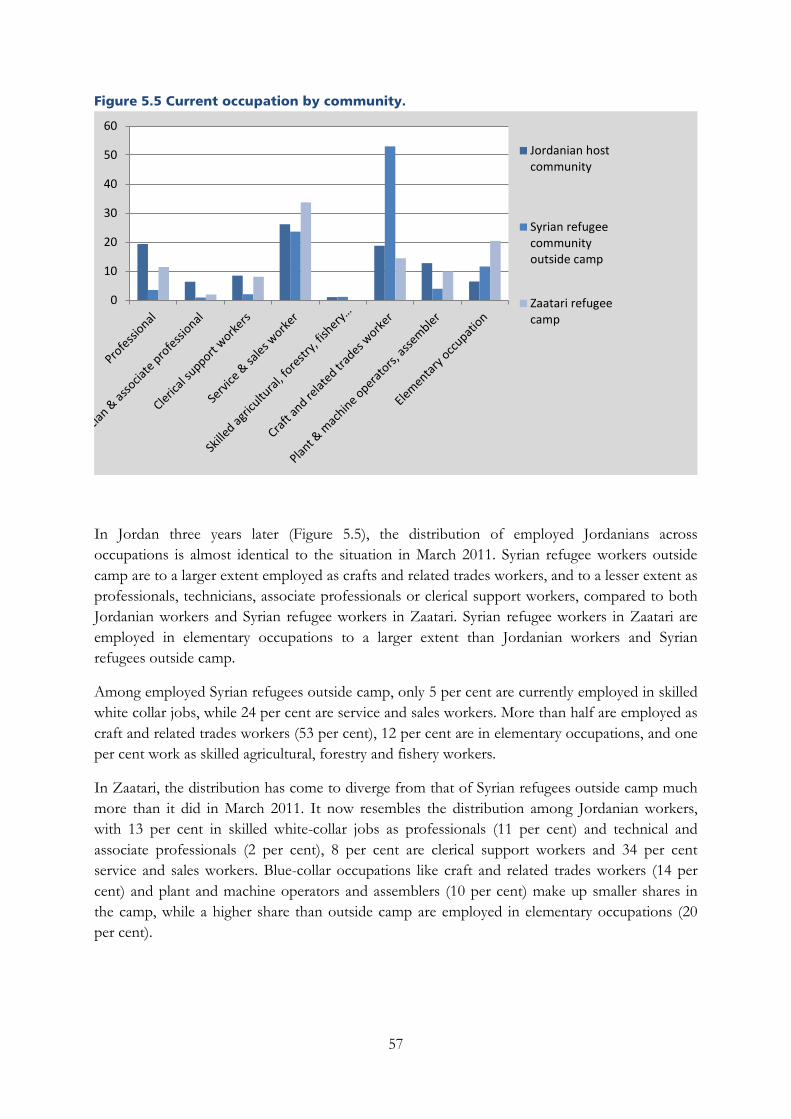
Figure 5.5 Current occupation by community.
In Jordan three years later (Figure 5.5), the distribution of employed Jordanians across occupations is almost identical to the situation in March 2011. Syrian refugee workers outside camp are to a larger extent employed as crafts and related trades workers, and to a lesser extent as professionals, technicians, associate professionals or clerical support workers, compared to both Jordanian workers and Syrian refugee workers in Zaatari. Syrian refugee workers in Zaatari are employed in elementary occupations to a larger extent than Jordanian workers and Syrian refugees outside camp.
Among employed Syrian refugees outside camp, only 5 per cent are currently employed in skilled white collar jobs, while 24 per cent are service and sales workers. More than half are employed as craft and related trades workers (53 per cent), 12 per cent are in elementary occupations, and one per cent work as skilled agricultural, forestry and fishery workers.
In Zaatari, the distribution has come to diverge from that of Syrian refugees outside camp much more than it did in March 2011. It now resembles the distribution among Jordanian workers, with 13 per cent in skilled white-collar jobs as professionals (11 per cent) and technical and associate professionals (2 per cent), 8 per cent are clerical support workers and 34 per cent service and sales workers. Blue-collar occupations like craft and related trades workers (14 per cent) and plant and machine operators and assemblers (10 per cent) make up smaller shares in the camp, while a higher share than outside camp are employed in elementary occupations (20 per cent).
0
10
20
30
40
50
60
Jordanian hostcommunity
Syrian refugeecommunityoutside camp
Zaatari refugeecamp
57

Figure 5.6 Share of populations currently employed in Jordan by the type of occupation they had in March 2011.
Syrians with experience in craft and related trade occupations in March 2011, and Syrians with experience in skilled agricultural, forestry and fishery occupations are more likely to have found a job in Jordan three years later compared to workers with experience in most other occupations (Figure 5.6). Among Jordanians, about 80–90 per cent of workers in all occupations in March 2011 remained employed three years later. However, the share of Syrian refugees outside camp that were employed in March 2011, and who have succeeded in finding a job in Jordan three years later, is higher among those employed as craft and related trades workers (45 per cent) in March 2011, and lower among agricultural workers (10 per cent), compared to workers in most other occupations (around 20–25 per cent).
5.4 Employment Status19
When the Syrian conflict began in March 2011, Jordanian workers and Syrian workers who would become refugees in Jordan were similarly distributed across employment status. Among Jordanians employed in March 2011, 83 per cent report having been paid employees, 10 per cent own-account workers, 4 per cent employers, and 2 per cent employed in a family business. Among the Syrian refugees outside camp who reported being employed in Syria in March 2011, 77 per cent were paid employees, 13 per cent own-account workers, 8 per cent employers, and 2
19 See table 6.10, 5.17, 6.14 in tabulation report.
0102030405060708090
100
Jordanian hostcommunity
Syrian refugeecommunityoutside camp
Zaatari refugeecamp
58
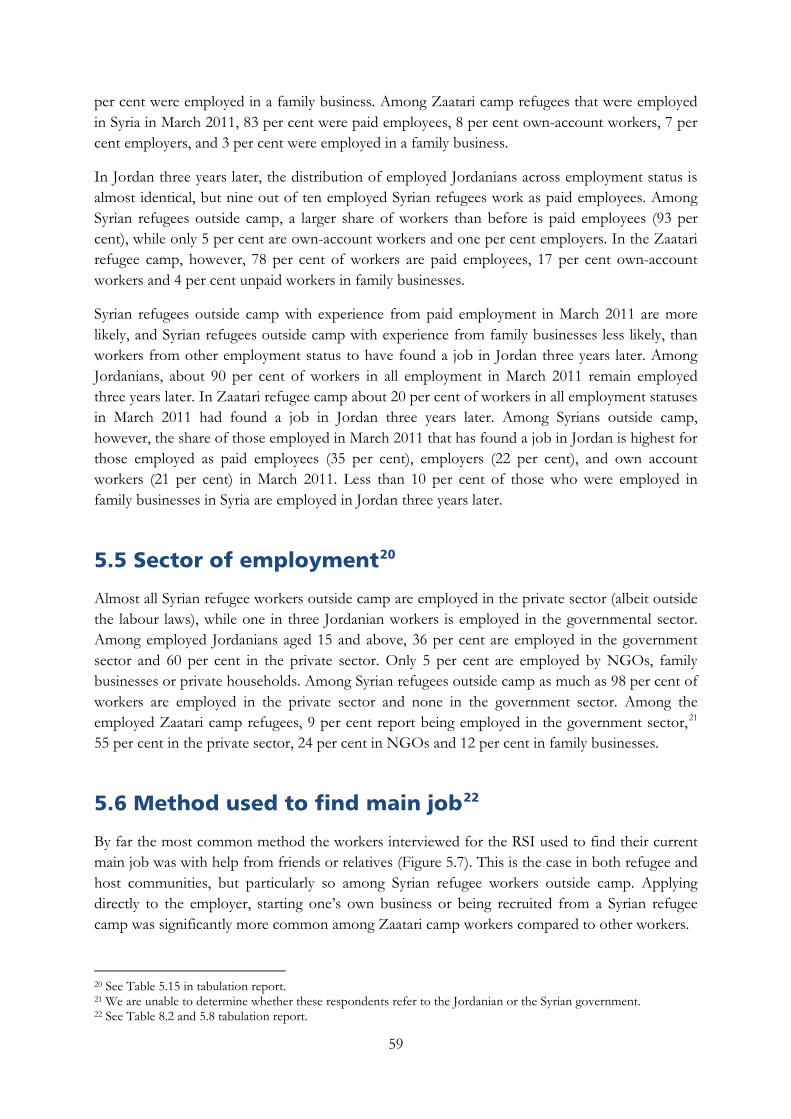
per cent were employed in a family business. Among Zaatari camp refugees that were employed in Syria in March 2011, 83 per cent were paid employees, 8 per cent own-account workers, 7 per cent employers, and 3 per cent were employed in a family business.
In Jordan three years later, the distribution of employed Jordanians across employment status is almost identical, but nine out of ten employed Syrian refugees work as paid employees. Among Syrian refugees outside camp, a larger share of workers than before is paid employees (93 per cent), while only 5 per cent are own-account workers and one per cent employers. In the Zaatari refugee camp, however, 78 per cent of workers are paid employees, 17 per cent own-account workers and 4 per cent unpaid workers in family businesses.
Syrian refugees outside camp with experience from paid employment in March 2011 are more likely, and Syrian refugees outside camp with experience from family businesses less likely, than workers from other employment status to have found a job in Jordan three years later. Among Jordanians, about 90 per cent of workers in all employment in March 2011 remain employed three years later. In Zaatari refugee camp about 20 per cent of workers in all employment statuses in March 2011 had found a job in Jordan three years later. Among Syrians outside camp, however, the share of those employed in March 2011 that has found a job in Jordan is highest for those employed as paid employees (35 per cent), employers (22 per cent), and own account workers (21 per cent) in March 2011. Less than 10 per cent of those who were employed in family businesses in Syria are employed in Jordan three years later.
5.5 Sector of employment20
Almost all Syrian refugee workers outside camp are employed in the private sector (albeit outside the labour laws), while one in three Jordanian workers is employed in the governmental sector. Among employed Jordanians aged 15 and above, 36 per cent are employed in the government sector and 60 per cent in the private sector. Only 5 per cent are employed by NGOs, family businesses or private households. Among Syrian refugees outside camp as much as 98 per cent of workers are employed in the private sector and none in the government sector. Among the employed Zaatari camp refugees, 9 per cent report being employed in the government sector,21 55 per cent in the private sector, 24 per cent in NGOs and 12 per cent in family businesses.
5.6 Method used to find main job22
By far the most common method the workers interviewed for the RSI used to find their current main job was with help from friends or relatives (Figure 5.7). This is the case in both refugee and host communities, but particularly so among Syrian refugee workers outside camp. Applying directly to the employer, starting one’s own business or being recruited from a Syrian refugee camp was significantly more common among Zaatari camp workers compared to other workers.
20 See Table 5.15 in tabulation report. 21 We are unable to determine whether these respondents refer to the Jordanian or the Syrian government. 22 See Table 8.2 and 5.8 tabulation report.
59
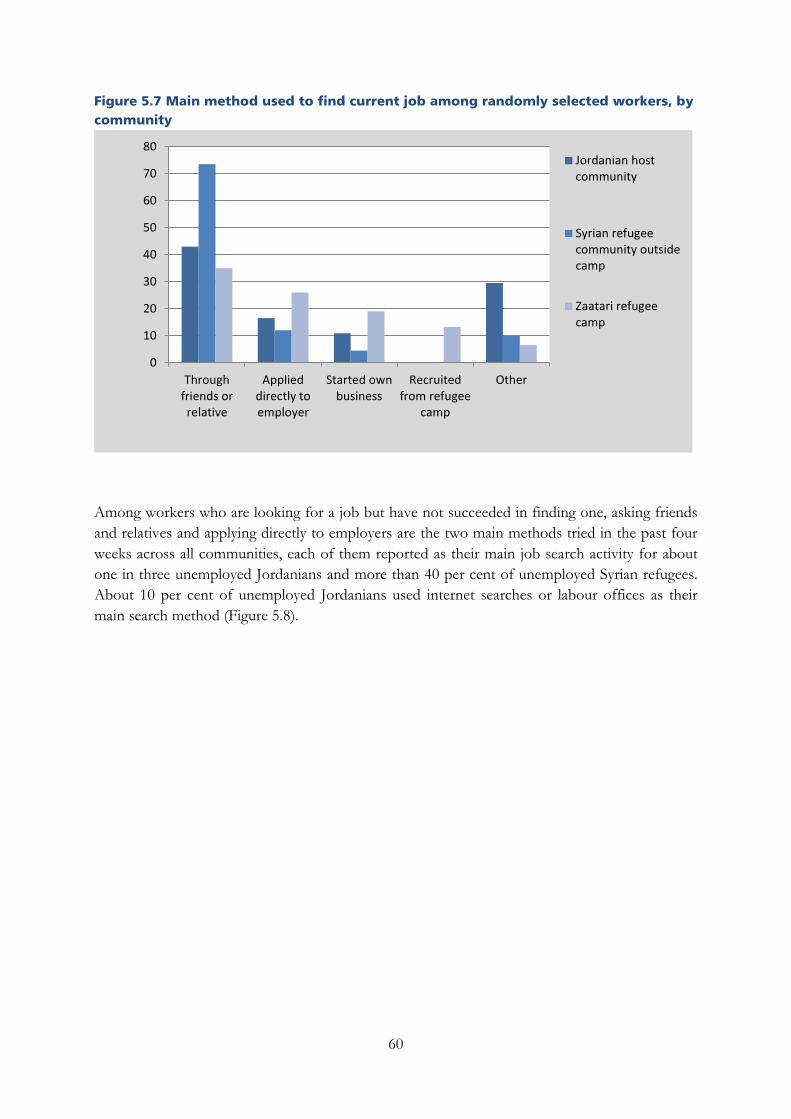
Figure 5.7 Main method used to find current job among randomly selected workers, by community
Among workers who are looking for a job but have not succeeded in finding one, asking friends and relatives and applying directly to employers are the two main methods tried in the past four weeks across all communities, each of them reported as their main job search activity for about one in three unemployed Jordanians and more than 40 per cent of unemployed Syrian refugees. About 10 per cent of unemployed Jordanians used internet searches or labour offices as their main search method (Figure 5.8).
0
10
20
30
40
50
60
70
80
Throughfriends orrelative
Applieddirectly toemployer
Started ownbusiness
Recruitedfrom refugee
camp
Other
Jordanian hostcommunity
Syrian refugeecommunity outsidecamp
Zaatari refugeecamp
60
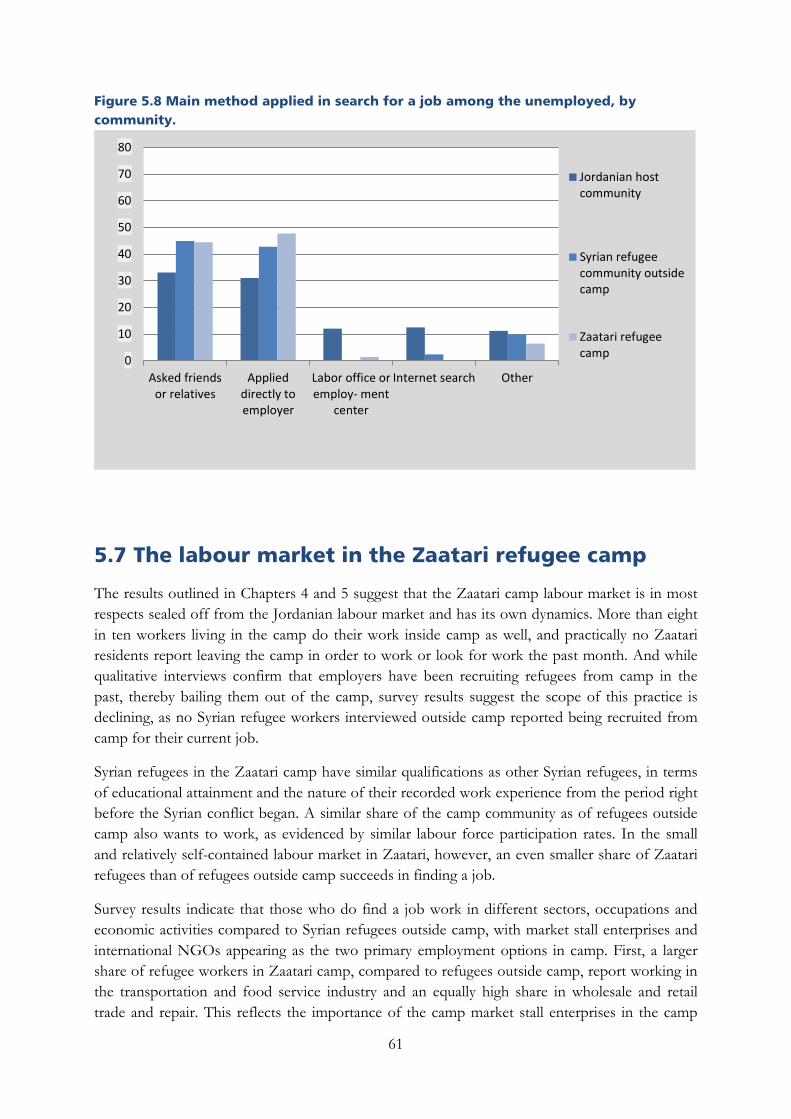
Figure 5.8 Main method applied in search for a job among the unemployed, by community.
5.7 The labour market in the Zaatari refugee camp
The results outlined in Chapters 4 and 5 suggest that the Zaatari camp labour market is in most respects sealed off from the Jordanian labour market and has its own dynamics. More than eight in ten workers living in the camp do their work inside camp as well, and practically no Zaatari residents report leaving the camp in order to work or look for work the past month. And while qualitative interviews confirm that employers have been recruiting refugees from camp in the past, thereby bailing them out of the camp, survey results suggest the scope of this practice is declining, as no Syrian refugee workers interviewed outside camp reported being recruited from camp for their current job.
Syrian refugees in the Zaatari camp have similar qualifications as other Syrian refugees, in terms of educational attainment and the nature of their recorded work experience from the period right before the Syrian conflict began. A similar share of the camp community as of refugees outside camp also wants to work, as evidenced by similar labour force participation rates. In the small and relatively self-contained labour market in Zaatari, however, an even smaller share of Zaatari refugees than of refugees outside camp succeeds in finding a job.
Survey results indicate that those who do find a job work in different sectors, occupations and economic activities compared to Syrian refugees outside camp, with market stall enterprises and international NGOs appearing as the two primary employment options in camp. First, a larger share of refugee workers in Zaatari camp, compared to refugees outside camp, report working in the transportation and food service industry and an equally high share in wholesale and retail trade and repair. This reflects the importance of the camp market stall enterprises in the camp
0
10
20
30
40
50
60
70
80
Asked friendsor relatives
Applieddirectly toemployer
Labor office oremploy- ment
center
Internet search Other
Jordanian hostcommunity
Syrian refugeecommunity outsidecamp
Zaatari refugeecamp
61
labour market (Figure 5.2). Additionally, a much larger share of refugees in camp work in education, for extraterritorial organizations, and in the administrative and support services , compared to refugees outside camp, and a smaller share work in manufacturing and construction, reflecting the relative isolation of the camp labour market from the world outside the camp.
Second, a larger share of camp refugees work in elementary occupations and as service and sales workers compared to refugees outside camp, (Figure 5.5), further underlining the relative importance of informal market stall enterprises in the camp. Otherwise, the distribution of Zaatari workers across occupations resembles that of Jordanian workers more than that of Syrian refugee workers outside camp, with a larger share in professional, technician, associate professional and clerical support work than among Syrian workers outside the camp. Finally, a larger share of refugee workers in Zaatari than outside the camp report being own-account workers, or being employed in a family business or in the NGO sector.
The twin challenges of high informality and poor working conditions, outlined in Chapter 6 and 7, apply for Zaatari workers as well as for Syrian refugee workers outside camp. The share of workers with a written contract regulating central aspects of the employment situation is somewhat higher among Syrian refugees in Zaatari than among refugees outside the camp, however, and the share working above maximum hours or in potentially unhealthy conditions somewhat lower. This is to be expected given that a larger share of Zaatari workers is employed by international NGOs, and in education and administration compared to refugees outside camp, jobs which tend to offer more formalized employment situations.
62
Chapter 6 Labour regulations, informal employment, underemployment, and stability
This chapter describes accessibility to the labour market for Syrian refugees in Jordan, in comparison to the Jordanian host population, in terms of legal constraints, the share of workers in informal employment, prevalence of underemployment, and stability of employment situation.
Foreign citizens’ access to the Jordanian labour market is formally restricted by the legal requirement that they obtain a one-year renewable work permit and have a sponsor. In practice, however, these formal restrictions are circumvented by many Syrian refugees, with less than 10 per cent of Syrian refugee workers reporting they have obtained such a permit for their current main job.
In relation to this, practically all Syrian refugee workers (99 per cent) are working outside labour regulations and therefore informally employed. The corresponding figure for Jordanian workers is about 50 per cent. Indeed the large presence of Syrian refugees in the informal economy affects the Jordanian labour market in terms of increasing rates of overall informality, and is of great concern for the future development of the labour market.
Furthermore, compared to Jordanian workers a smaller share of Syrian refugee workers has been in stable employment during the past six months. Also, a substantially smaller share of Syrian refugee workers report being in permanent employment rather than temporary or irregular employment. Underemployment is about three times as high among Syrian refugee workers as among Jordanian workers.
Findings from the qualitative interviews indicate discrepancies between legal regulations and practice. Working hours may be less regulated than expressed during interviews. Consequently, the number of hours in shifts might be underreported. A similar tendency is observed for work contracts. During fieldwork many workers, both Jordanian and Syrian, expressed that they had a work contract, but simultaneously gave indications that they in fact did not. Finally, it appears to be a common conception amongst both Syrians and Jordanians that Syrian refugees might lose their UNHCR refugee status if they obtain a work permit.
6.1 Labour regulations and access to work23
Access to the Jordanian labour market for foreign citizens is formally restricted in two main ways. First, the Labour Law, Article 12, states that non-Jordanian workers might be employed only when they have qualifications that are unavailable in the Jordanian labour force, or where there
23 Tables in the tabulation report relevant for this section include Table 5.41 and all tables in Chapter 13.
63
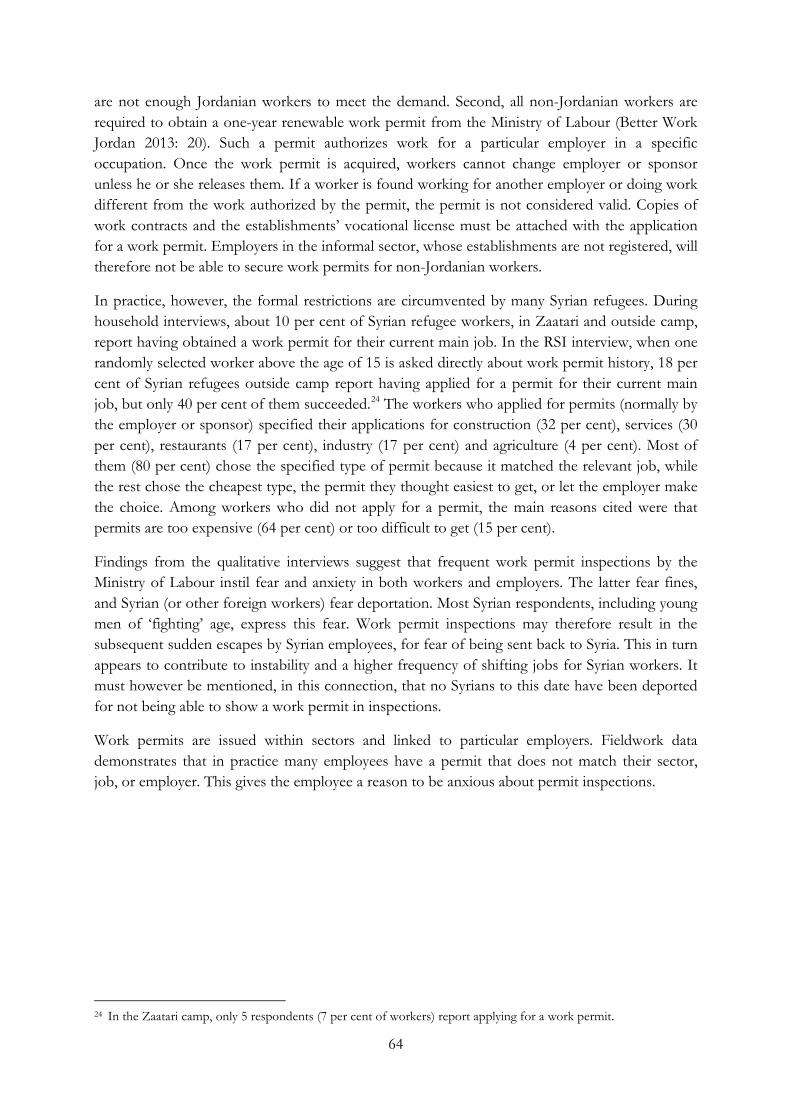
are not enough Jordanian workers to meet the demand. Second, all non-Jordanian workers are required to obtain a one-year renewable work permit from the Ministry of Labour (Better Work Jordan 2013: 20). Such a permit authorizes work for a particular employer in a specific occupation. Once the work permit is acquired, workers cannot change employer or sponsor unless he or she releases them. If a worker is found working for another employer or doing work different from the work authorized by the permit, the permit is not considered valid. Copies of work contracts and the establishments’ vocational license must be attached with the application for a work permit. Employers in the informal sector, whose establishments are not registered, will therefore not be able to secure work permits for non-Jordanian workers.
In practice, however, the formal restrictions are circumvented by many Syrian refugees. During household interviews, about 10 per cent of Syrian refugee workers, in Zaatari and outside camp, report having obtained a work permit for their current main job. In the RSI interview, when one randomly selected worker above the age of 15 is asked directly about work permit history, 18 per cent of Syrian refugees outside camp report having applied for a permit for their current main job, but only 40 per cent of them succeeded.24 The workers who applied for permits (normally by the employer or sponsor) specified their applications for construction (32 per cent), services (30 per cent), restaurants (17 per cent), industry (17 per cent) and agriculture (4 per cent). Most of them (80 per cent) chose the specified type of permit because it matched the relevant job, while the rest chose the cheapest type, the permit they thought easiest to get, or let the employer make the choice. Among workers who did not apply for a permit, the main reasons cited were that permits are too expensive (64 per cent) or too difficult to get (15 per cent).
Findings from the qualitative interviews suggest that frequent work permit inspections by the Ministry of Labour instil fear and anxiety in both workers and employers. The latter fear fines, and Syrian (or other foreign workers) fear deportation. Most Syrian respondents, including young men of ‘fighting’ age, express this fear. Work permit inspections may therefore result in the subsequent sudden escapes by Syrian employees, for fear of being sent back to Syria. This in turn appears to contribute to instability and a higher frequency of shifting jobs for Syrian workers. It must however be mentioned, in this connection, that no Syrians to this date have been deported for not being able to show a work permit in inspections.
Work permits are issued within sectors and linked to particular employers. Fieldwork data demonstrates that in practice many employees have a permit that does not match their sector, job, or employer. This gives the employee a reason to be anxious about permit inspections.
24 In the Zaatari camp, only 5 respondents (7 per cent of workers) report applying for a work permit.
64
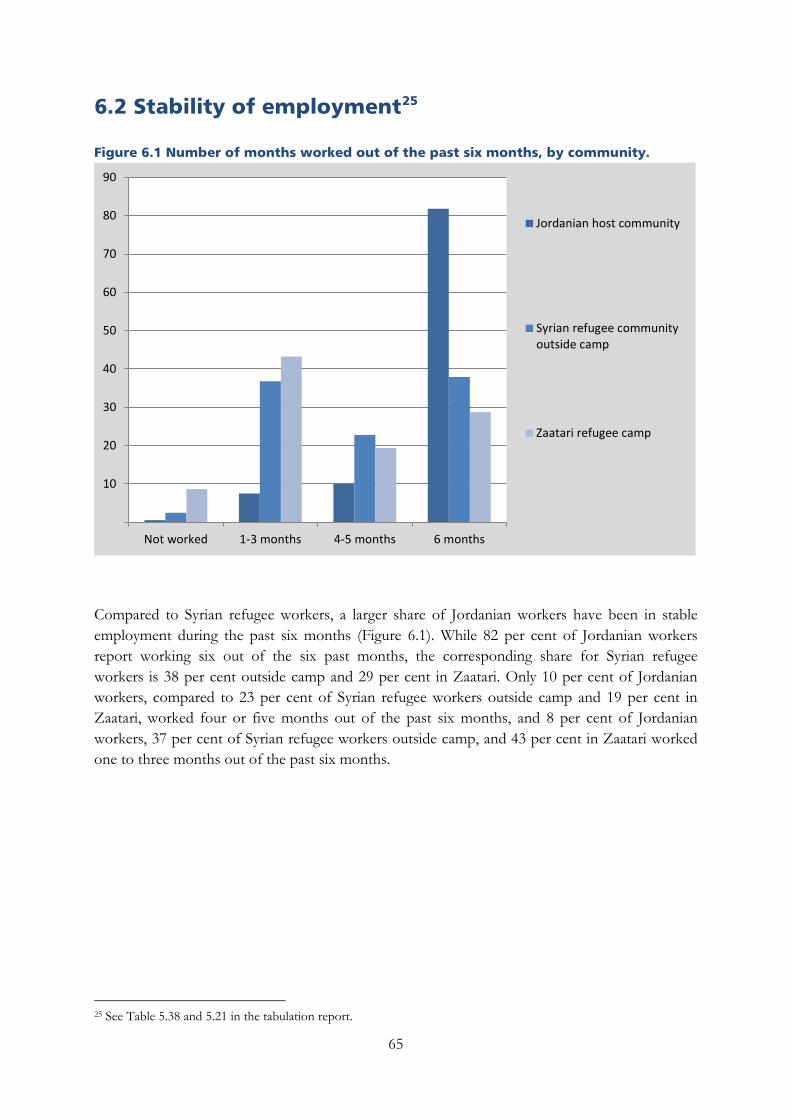
6.2 Stability of employment25
Figure 6.1 Number of months worked out of the past six months, by community.
Compared to Syrian refugee workers, a larger share of Jordanian workers have been in stable employment during the past six months (Figure 6.1). While 82 per cent of Jordanian workers report working six out of the six past months, the corresponding share for Syrian refugee workers is 38 per cent outside camp and 29 per cent in Zaatari. Only 10 per cent of Jordanian workers, compared to 23 per cent of Syrian refugee workers outside camp and 19 per cent in Zaatari, worked four or five months out of the past six months, and 8 per cent of Jordanian workers, 37 per cent of Syrian refugee workers outside camp, and 43 per cent in Zaatari worked one to three months out of the past six months.
25 See Table 5.38 and 5.21 in the tabulation report.
10
20
30
40
50
60
70
80
90
Not worked 1-3 months 4-5 months 6 months
Jordanian host community
Syrian refugee communityoutside camp
Zaatari refugee camp
65
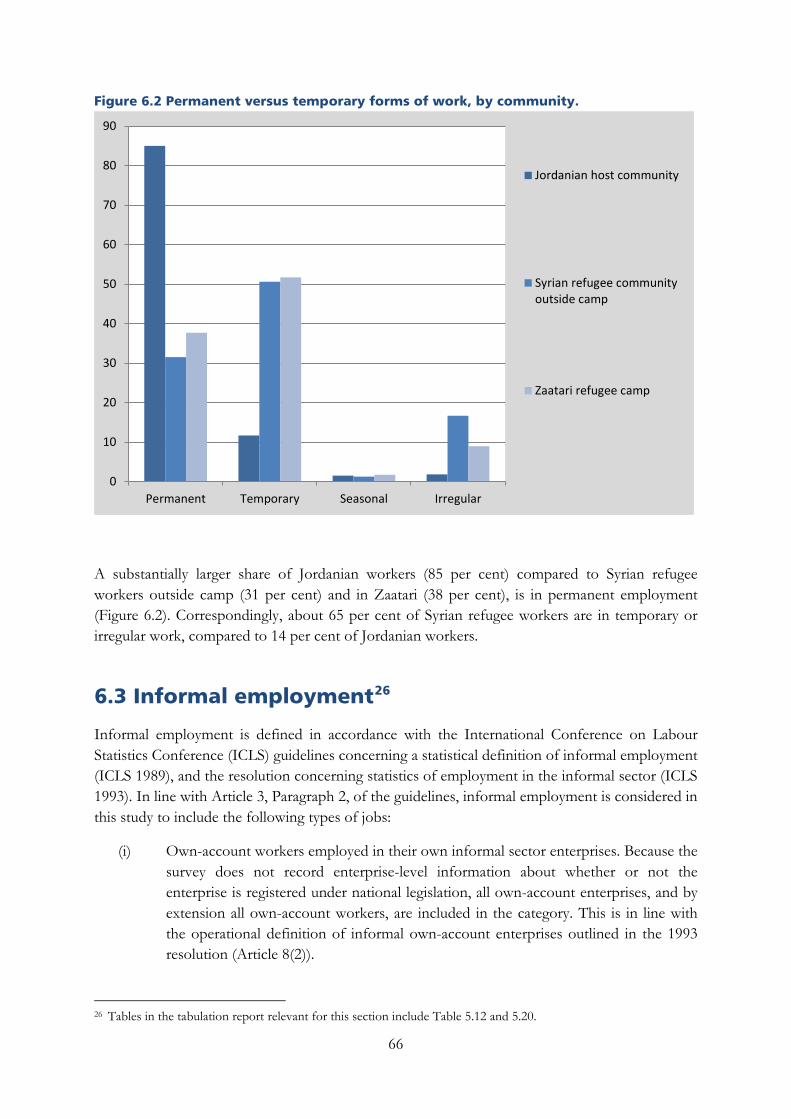
Figure 6.2 Permanent versus temporary forms of work, by community.
A substantially larger share of Jordanian workers (85 per cent) compared to Syrian refugee workers outside camp (31 per cent) and in Zaatari (38 per cent), is in permanent employment (Figure 6.2). Correspondingly, about 65 per cent of Syrian refugee workers are in temporary or irregular work, compared to 14 per cent of Jordanian workers.
6.3 Informal employment26
Informal employment is defined in accordance with the International Conference on Labour Statistics Conference (ICLS) guidelines concerning a statistical definition of informal employment (ICLS 1989), and the resolution concerning statistics of employment in the informal sector (ICLS 1993). In line with Article 3, Paragraph 2, of the guidelines, informal employment is considered in this study to include the following types of jobs:
(i) Own-account workers employed in their own informal sector enterprises. Because the survey does not record enterprise-level information about whether or not the enterprise is registered under national legislation, all own-account enterprises, and by extension all own-account workers, are included in the category. This is in line with the operational definition of informal own-account enterprises outlined in the 1993 resolution (Article 8(2)).
26 Tables in the tabulation report relevant for this section include Table 5.12 and 5.20.
0
10
20
30
40
50
60
70
80
90
Permanent Temporary Seasonal Irregular
Jordanian host community
Syrian refugee communityoutside camp
Zaatari refugee camp
66

(ii) Contributing family workers, irrespective of whether they work in formal or informal sector enterprises. This is operationalized as unpaid workers employed in family businesses.
(iii) Employees holding informal jobs, whether in formal or informal enterprises, defined in Article 2, Paragraph 5 of the guidelines as employment relationships not subject to national labour legislation, income taxation, social protection or entitlement to certain employment benefits, or jobs for which labour regulations are not complied with. As recommended in the guidelines, the operational criteria chosen to capture such employment relationships are determined in accordance with national circumstances and data availability to include:
a. Workers with no written or verbal contract
b. Workers not covered by a social security scheme in their main job
c. Workers below the minimum working age of 16
d. Non-Jordanian workers employed without obtaining the legally required work permit
e. Workers paid less than the minimum wage, defined by executive decree as 190 JD per month for Jordanian citizens and 150 JD per month for non-Jordanian workers.
This operational definition diverges from the guidelines in two ways. First, it does not directly capture employers employed in their own informal sector enterprises, members of informal producers’ cooperatives, and contributing family workers who are paid based on the profit of the family business. However, many of these workers are likely to be captured by one or more of the criteria defined under point (ii). Second, for reasons of data availability the definition only takes into account the workers’ main job.
67
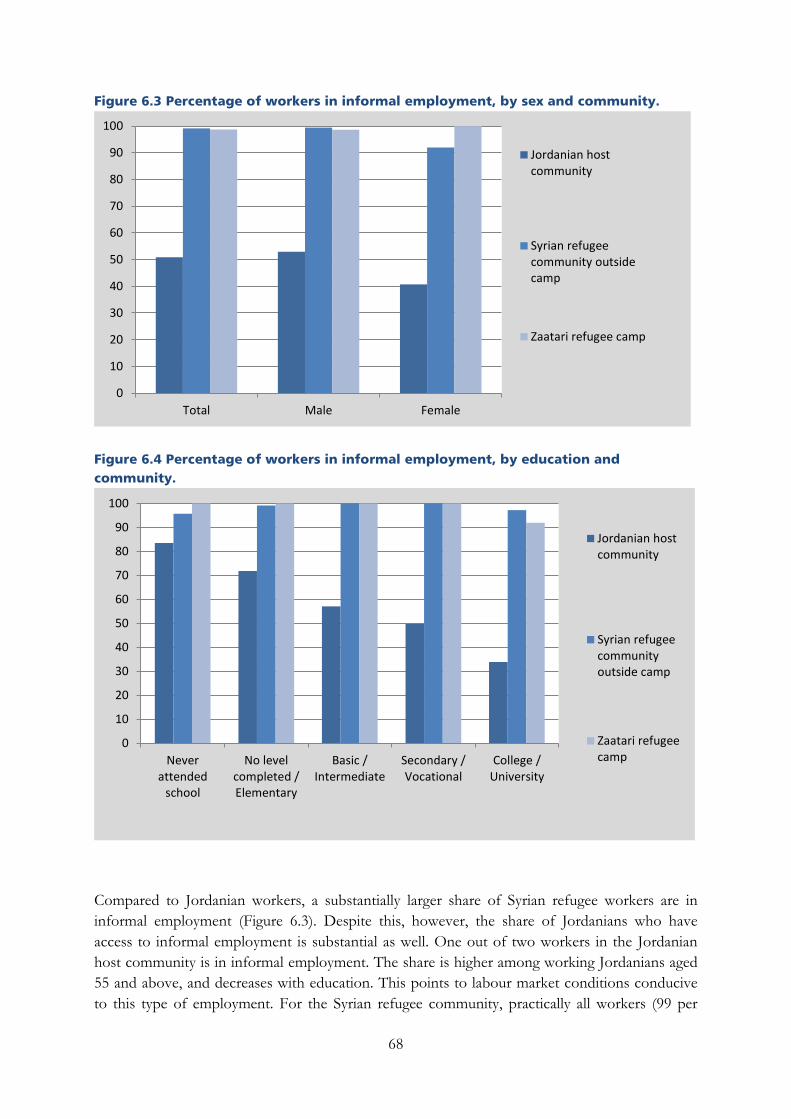
Figure 6.3 Percentage of workers in informal employment, by sex and community.
Figure 6.4 Percentage of workers in informal employment, by education and community.
Compared to Jordanian workers, a substantially larger share of Syrian refugee workers are in informal employment (Figure 6.3). Despite this, however, the share of Jordanians who have access to informal employment is substantial as well. One out of two workers in the Jordanian host community is in informal employment. The share is higher among working Jordanians aged 55 and above, and decreases with education. This points to labour market conditions conducive to this type of employment. For the Syrian refugee community, practically all workers (99 per
0
10
20
30
40
50
60
70
80
90
100
Total Male Female
Jordanian hostcommunity
Syrian refugeecommunity outsidecamp
Zaatari refugee camp
0
10
20
30
40
50
60
70
80
90
100
Neverattended
school
No levelcompleted /Elementary
Basic /Intermediate
Secondary /Vocational
College /University
Jordanian hostcommunity
Syrian refugeecommunityoutside camp
Zaatari refugeecamp
68
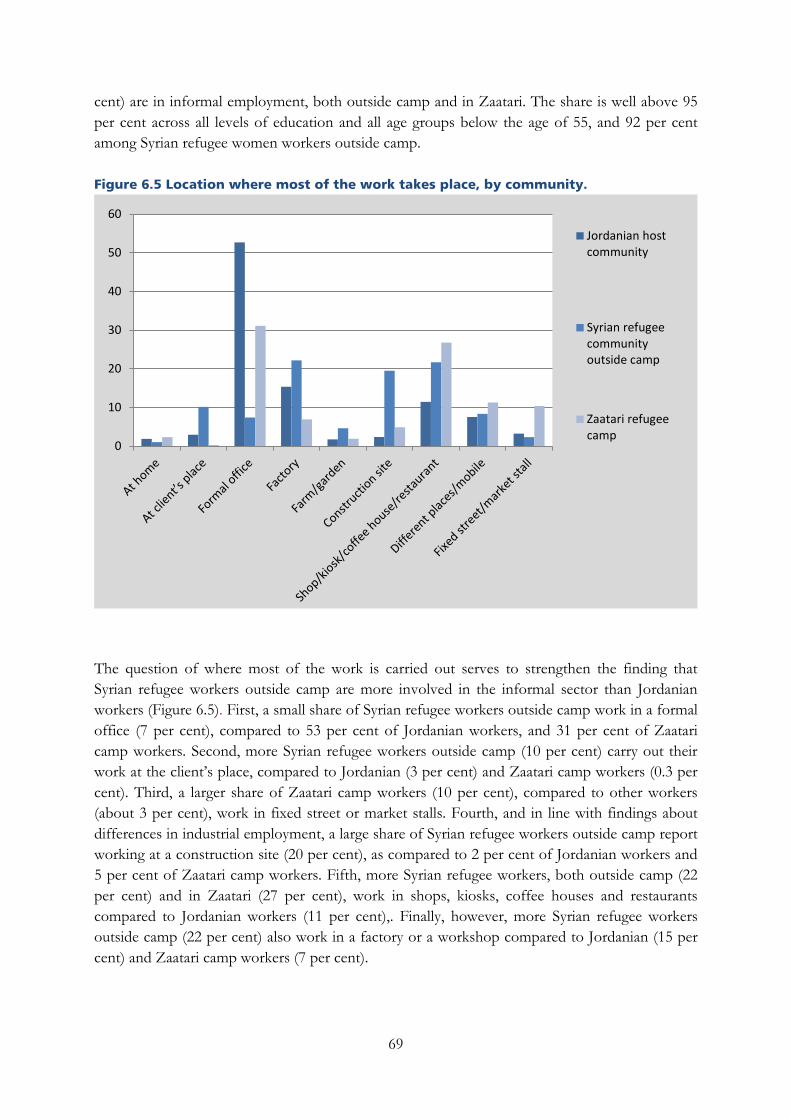
cent) are in informal employment, both outside camp and in Zaatari. The share is well above 95 per cent across all levels of education and all age groups below the age of 55, and 92 per cent among Syrian refugee women workers outside camp.
Figure 6.5 Location where most of the work takes place, by community.
The question of where most of the work is carried out serves to strengthen the finding that Syrian refugee workers outside camp are more involved in the informal sector than Jordanian workers (Figure 6.5). First, a small share of Syrian refugee workers outside camp work in a formal office (7 per cent), compared to 53 per cent of Jordanian workers, and 31 per cent of Zaatari camp workers. Second, more Syrian refugee workers outside camp (10 per cent) carry out their work at the client’s place, compared to Jordanian (3 per cent) and Zaatari camp workers (0.3 per cent). Third, a larger share of Zaatari camp workers (10 per cent), compared to other workers (about 3 per cent), work in fixed street or market stalls. Fourth, and in line with findings about differences in industrial employment, a large share of Syrian refugee workers outside camp report working at a construction site (20 per cent), as compared to 2 per cent of Jordanian workers and 5 per cent of Zaatari camp workers. Fifth, more Syrian refugee workers, both outside camp (22 per cent) and in Zaatari (27 per cent), work in shops, kiosks, coffee houses and restaurants compared to Jordanian workers (11 per cent),. Finally, however, more Syrian refugee workers outside camp (22 per cent) also work in a factory or a workshop compared to Jordanian (15 per cent) and Zaatari camp workers (7 per cent).
0
10
20
30
40
50
60
Jordanian hostcommunity
Syrian refugeecommunityoutside camp
Zaatari refugeecamp
69
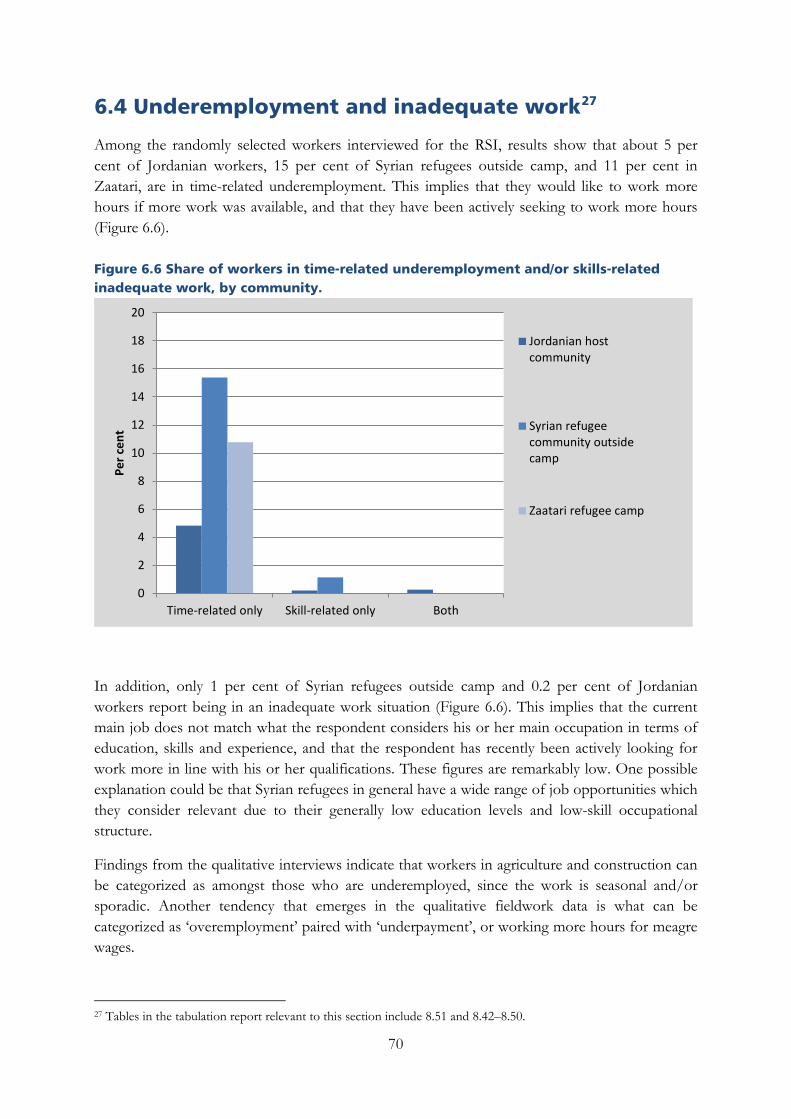
6.4 Underemployment and inadequate work27
Among the randomly selected workers interviewed for the RSI, results show that about 5 per cent of Jordanian workers, 15 per cent of Syrian refugees outside camp, and 11 per cent in Zaatari, are in time-related underemployment. This implies that they would like to work more hours if more work was available, and that they have been actively seeking to work more hours (Figure 6.6).
Figure 6.6 Share of workers in time-related underemployment and/or skills-related inadequate work, by community.
In addition, only 1 per cent of Syrian refugees outside camp and 0.2 per cent of Jordanian workers report being in an inadequate work situation (Figure 6.6). This implies that the current main job does not match what the respondent considers his or her main occupation in terms of education, skills and experience, and that the respondent has recently been actively looking for work more in line with his or her qualifications. These figures are remarkably low. One possible explanation could be that Syrian refugees in general have a wide range of job opportunities which they consider relevant due to their generally low education levels and low-skill occupational structure.
Findings from the qualitative interviews indicate that workers in agriculture and construction can be categorized as amongst those who are underemployed, since the work is seasonal and/or sporadic. Another tendency that emerges in the qualitative fieldwork data is what can be categorized as ‘overemployment’ paired with ‘underpayment’, or working more hours for meagre wages.
27 Tables in the tabulation report relevant to this section include 8.51 and 8.42–8.50.
0
2
4
6
8
10
12
14
16
18
20
Time-related only Skill-related only Both
Per c
ent
Jordanian hostcommunity
Syrian refugeecommunity outsidecamp
Zaatari refugee camp
70

6.5 Distance to work28
Compared to Syrian refugee workers, a larger share of Jordanian workers, has to leave their town or village to go to work. While two in three Jordanian workers report their workplace is located outside their own living area, town or village, the corresponding figure for Syrian refugee workers outside camp is one in two. For 87 per cent of Zaatari workers, all or some of their work is carried out inside the camp.
The amount of time spent travelling to work one way differs accordingly. Among Jordanian workers, 61 per cent spend half an hour or less travelling to work. The corresponding figure is 74 per cent for Syrian workers outside camp, and 85 per cent for Zaatari camp workers.
About 90 per cent of camp refugees, and one third of Jordanian and Syrian refugee workers outside camp, spend no money on transportation to work. Among workers who pay for transportation to work, Syrians tend to spend a little less than Jordanians, reflecting that they tend to travel shorter distances. When transportation costs are measured as a share of the normal monthly cash income, the distribution is similar for Jordanian workers and Syrian refugee workers outside camp, although Syrians tend to spend a slightly larger share of their income. One in two workers in both communities who spend money on transportation spend 10–29 per cent of their income, but more Jordanians (25 per cent) than Syrian refugees workers (18 per cent) spend less than 10 per cent of their usual income.
28 Tables in the tabulation report relevant to this section include Table 5.18, 5.19 and 5.23–5.25.
71
Chapter 7 Working conditions
This chapter describes and compares the working conditions for Jordanian and Syrian workers in Amman, Irbid and Mafraq governorates, in terms of working hours, payment, contractual arrangements, access to social protection, occupational health and safety, and the workers’ own perceptions of their working conditions.
Given the fact that practically all Syrian workers are employed outside labour regulations and in the informal sector, and that only around 10 per cent of them have working permits, it is no surprise that the Syrian workers as a whole group are employed under worse conditions when compared to the Jordanian workers as a whole group. Hence the differences described in this chapter basically reflect the informality of Syrian workers in the Jordanian labour market rather than a structural discrimination, with respect to working conditions, at the workplaces and in the labour market as such. However, the findings also reflect the situation in the growing informal sector, which also negatively affects Jordanian workers. Three main differences are found when comparing the general working conditions of Jordanian and Syrian workers: First, Syrian workers tend to work longer hours than Jordanian workers, and are generally paid less.
Second, being employed on the basis of a written contract is significantly less common among Syrian refugee workers, who are more often employed on the basis of an oral agreement or employed without contract, than among Jordanian workers. Correspondingly, having items such as maximum hours, minimum salary, work tasks, work injury, unemployment insurance, additional pay, and non-pay benefits regulated in one’s contract or agreement is less common among Syrian refugee workers than among Jordanian workers. This difference across communities is to be expected, given that the benefits in question are much less common among workers with oral agreements or no contract or agreement compared to workers with written contracts, and the fact that a larger share of Syrian refugee workers lack a written contract and work in informal, presumably unregistered enterprises.
Third, a smaller share of Syrian refugee workers, compared to Jordanian workers, report having been informed about work-related hazards and necessary precautions as well as having received necessary protective equipment from their employer. In addition, a larger share of Syrian refugee workers, compared to Jordanian workers, perceive the work they perform as exhausting, stressful, dangerous, or unpleasant. Across all communities, however, most workers perceive the safety and physical environment of their workplace as good.
In addition, and in relation to their informal employment situation, very few Syrian workers are members of a trade union or a professional association, giving them few avenues to pursue their grievances.
72
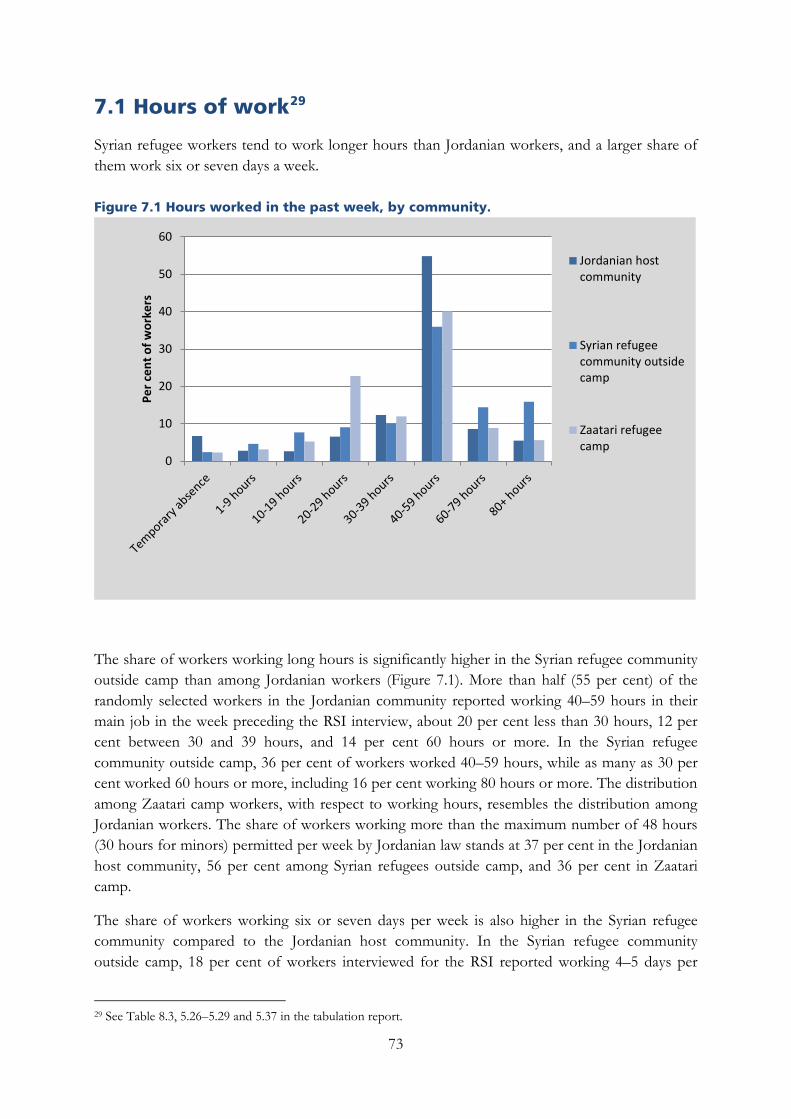
7.1 Hours of work29
Syrian refugee workers tend to work longer hours than Jordanian workers, and a larger share of them work six or seven days a week.
Figure 7.1 Hours worked in the past week, by community.
The share of workers working long hours is significantly higher in the Syrian refugee community outside camp than among Jordanian workers (Figure 7.1). More than half (55 per cent) of the randomly selected workers in the Jordanian community reported working 40–59 hours in their main job in the week preceding the RSI interview, about 20 per cent less than 30 hours, 12 per cent between 30 and 39 hours, and 14 per cent 60 hours or more. In the Syrian refugee community outside camp, 36 per cent of workers worked 40–59 hours, while as many as 30 per cent worked 60 hours or more, including 16 per cent working 80 hours or more. The distribution among Zaatari camp workers, with respect to working hours, resembles the distribution among Jordanian workers. The share of workers working more than the maximum number of 48 hours (30 hours for minors) permitted per week by Jordanian law stands at 37 per cent in the Jordanian host community, 56 per cent among Syrian refugees outside camp, and 36 per cent in Zaatari camp.
The share of workers working six or seven days per week is also higher in the Syrian refugee community compared to the Jordanian host community. In the Syrian refugee community outside camp, 18 per cent of workers interviewed for the RSI reported working 4–5 days per
29 See Table 8.3, 5.26–5.29 and 5.37 in the tabulation report.
0
10
20
30
40
50
60
Per c
ent o
f wor
kers
Jordanian hostcommunity
Syrian refugeecommunity outsidecamp
Zaatari refugeecamp
73
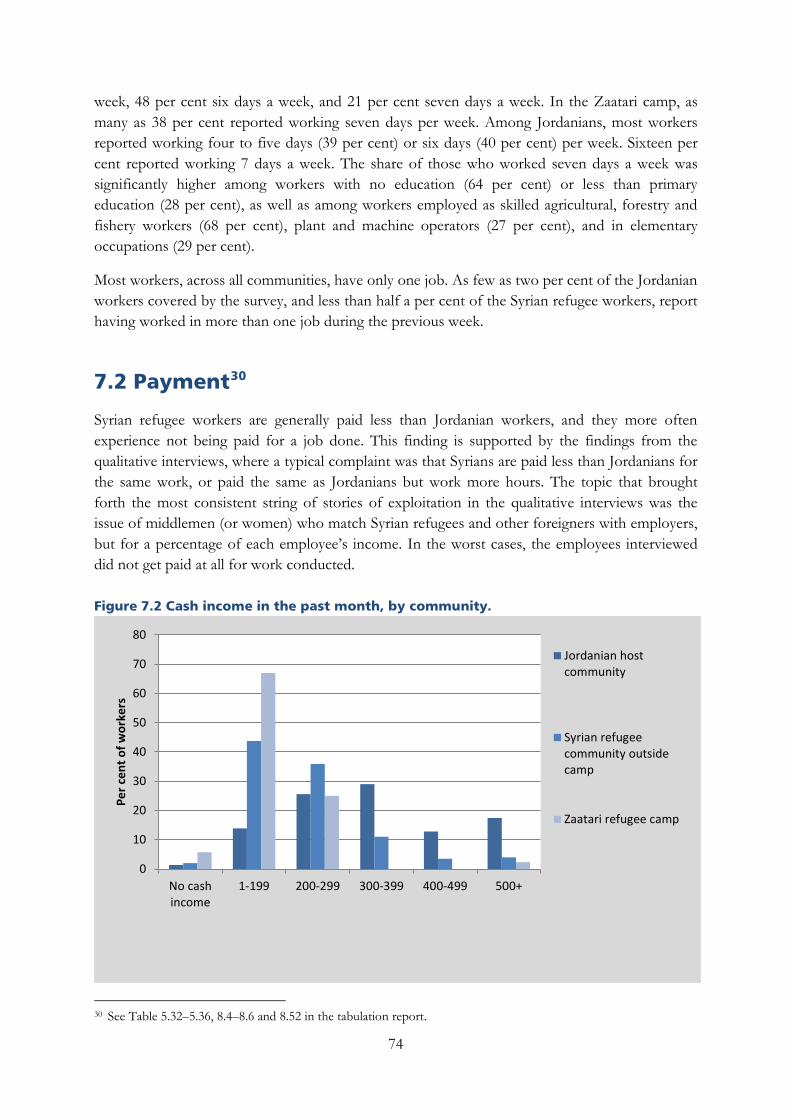
week, 48 per cent six days a week, and 21 per cent seven days a week. In the Zaatari camp, as many as 38 per cent reported working seven days per week. Among Jordanians, most workers reported working four to five days (39 per cent) or six days (40 per cent) per week. Sixteen per cent reported working 7 days a week. The share of those who worked seven days a week was significantly higher among workers with no education (64 per cent) or less than primary education (28 per cent), as well as among workers employed as skilled agricultural, forestry and fishery workers (68 per cent), plant and machine operators (27 per cent), and in elementary occupations (29 per cent).
Most workers, across all communities, have only one job. As few as two per cent of the Jordanian workers covered by the survey, and less than half a per cent of the Syrian refugee workers, report having worked in more than one job during the previous week.
7.2 Payment30
Syrian refugee workers are generally paid less than Jordanian workers, and they more often experience not being paid for a job done. This finding is supported by the findings from the qualitative interviews, where a typical complaint was that Syrians are paid less than Jordanians for the same work, or paid the same as Jordanians but work more hours. The topic that brought forth the most consistent string of stories of exploitation in the qualitative interviews was the issue of middlemen (or women) who match Syrian refugees and other foreigners with employers, but for a percentage of each employee’s income. In the worst cases, the employees interviewed did not get paid at all for work conducted.
Figure 7.2 Cash income in the past month, by community.
30 See Table 5.32–5.36, 8.4–8.6 and 8.52 in the tabulation report.
0
10
20
30
40
50
60
70
80
No cashincome
1-199 200-299 300-399 400-499 500+
Per c
ent o
f wor
kers
Jordanian hostcommunity
Syrian refugeecommunity outsidecamp
Zaatari refugee camp
74
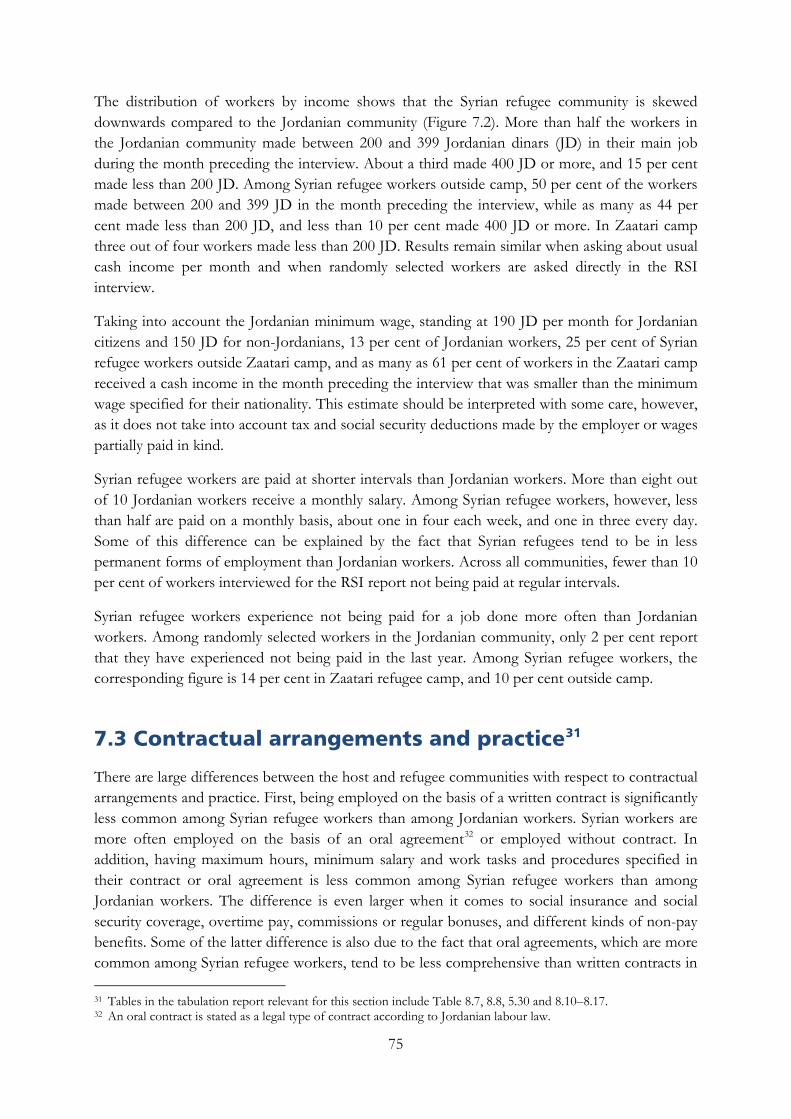
The distribution of workers by income shows that the Syrian refugee community is skewed downwards compared to the Jordanian community (Figure 7.2). More than half the workers in the Jordanian community made between 200 and 399 Jordanian dinars (JD) in their main job during the month preceding the interview. About a third made 400 JD or more, and 15 per cent made less than 200 JD. Among Syrian refugee workers outside camp, 50 per cent of the workers made between 200 and 399 JD in the month preceding the interview, while as many as 44 per cent made less than 200 JD, and less than 10 per cent made 400 JD or more. In Zaatari camp three out of four workers made less than 200 JD. Results remain similar when asking about usual cash income per month and when randomly selected workers are asked directly in the RSI interview.
Taking into account the Jordanian minimum wage, standing at 190 JD per month for Jordanian citizens and 150 JD for non-Jordanians, 13 per cent of Jordanian workers, 25 per cent of Syrian refugee workers outside Zaatari camp, and as many as 61 per cent of workers in the Zaatari camp received a cash income in the month preceding the interview that was smaller than the minimum wage specified for their nationality. This estimate should be interpreted with some care, however, as it does not take into account tax and social security deductions made by the employer or wages partially paid in kind.
Syrian refugee workers are paid at shorter intervals than Jordanian workers. More than eight out of 10 Jordanian workers receive a monthly salary. Among Syrian refugee workers, however, less than half are paid on a monthly basis, about one in four each week, and one in three every day. Some of this difference can be explained by the fact that Syrian refugees tend to be in less permanent forms of employment than Jordanian workers. Across all communities, fewer than 10 per cent of workers interviewed for the RSI report not being paid at regular intervals.
Syrian refugee workers experience not being paid for a job done more often than Jordanian workers. Among randomly selected workers in the Jordanian community, only 2 per cent report that they have experienced not being paid in the last year. Among Syrian refugee workers, the corresponding figure is 14 per cent in Zaatari refugee camp, and 10 per cent outside camp.
7.3 Contractual arrangements and practice31
There are large differences between the host and refugee communities with respect to contractual arrangements and practice. First, being employed on the basis of a written contract is significantly less common among Syrian refugee workers than among Jordanian workers. Syrian workers are more often employed on the basis of an oral agreement32 or employed without contract. In addition, having maximum hours, minimum salary and work tasks and procedures specified in their contract or oral agreement is less common among Syrian refugee workers than among Jordanian workers. The difference is even larger when it comes to social insurance and social security coverage, overtime pay, commissions or regular bonuses, and different kinds of non-pay benefits. Some of the latter difference is also due to the fact that oral agreements, which are more common among Syrian refugee workers, tend to be less comprehensive than written contracts in
31 Tables in the tabulation report relevant for this section include Table 8.7, 8.8, 5.30 and 8.10–8.17. 32 An oral contract is stated as a legal type of contract according to Jordanian labour law.
75
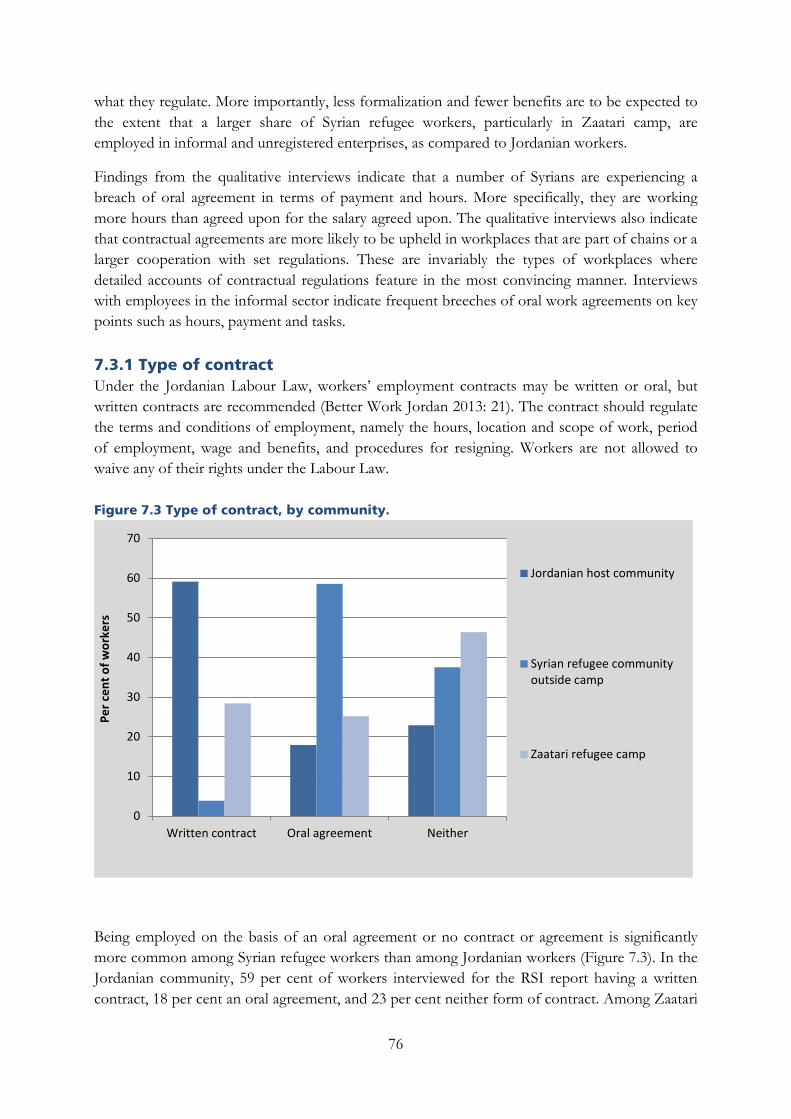
what they regulate. More importantly, less formalization and fewer benefits are to be expected to the extent that a larger share of Syrian refugee workers, particularly in Zaatari camp, are employed in informal and unregistered enterprises, as compared to Jordanian workers.
Findings from the qualitative interviews indicate that a number of Syrians are experiencing a breach of oral agreement in terms of payment and hours. More specifically, they are working more hours than agreed upon for the salary agreed upon. The qualitative interviews also indicate that contractual agreements are more likely to be upheld in workplaces that are part of chains or a larger cooperation with set regulations. These are invariably the types of workplaces where detailed accounts of contractual regulations feature in the most convincing manner. Interviews with employees in the informal sector indicate frequent breeches of oral work agreements on key points such as hours, payment and tasks.
7.3.1 Type of contract Under the Jordanian Labour Law, workers’ employment contracts may be written or oral, but written contracts are recommended (Better Work Jordan 2013: 21). The contract should regulate the terms and conditions of employment, namely the hours, location and scope of work, period of employment, wage and benefits, and procedures for resigning. Workers are not allowed to waive any of their rights under the Labour Law.
Figure 7.3 Type of contract, by community.
Being employed on the basis of an oral agreement or no contract or agreement is significantly more common among Syrian refugee workers than among Jordanian workers (Figure 7.3). In the Jordanian community, 59 per cent of workers interviewed for the RSI report having a written contract, 18 per cent an oral agreement, and 23 per cent neither form of contract. Among Zaatari
0
10
20
30
40
50
60
70
Written contract Oral agreement Neither
Per c
ent o
f wor
kers
Jordanian host community
Syrian refugee communityoutside camp
Zaatari refugee camp
76
camp workers, 28 per cent report having a written contract, 25 per cent an oral agreement, and 46 per cent neither. Among Syrians outside camp, however, as few as four per cent have a written contract, 59 per cent have an oral agreement, and 38 per cent have neither form of contract.
Among workers with formal contracts or oral agreements, 83 per cent of Jordanians, 70 per cent of Syrians in Zaatari, and 95 per cent of Syrian refugees outside camp report that their contract is an unlimited period employment contract rather than a limited period employment contract.
7.3.2 Hours, salary, task and termination rules
Box 7.1 Hours, salary, task and termination rules
Working hours should not exceed 8 hours per day, but up to 11 hours per day can be accepted as long as regular working hours do not exceed 48 hours per week (Article 56). Minor workers above minimum working age (16–17) may not work more than 6 hours per day (Article 74–75). Workers are entitled to at least one day of rest per week, which usually falls on Friday (Article 60).
Wages may be determined by time or piece, and may be paid in cash or kind. Jordanian workers must be paid at least 190, and non-Jordanian workers 150, Jordanian dinars (JD) per month. In the textile industry the minimum wage is 110 JD, excluding food and accommodation. Overtime must be paid 125% of normal wages for ordinary overtime hours and 150% for overtime on weekly rest days, religious feasts and public holidays.
To avoid deceptive hiring practices for migrant workers, workers are generally not required to perform work that is markedly different from the type of work agreed upon in the work contract.
The employment contract ends when the agreement expires, the worker dies or is certifiably unable to perform the work, the employer and worker agree to end the contract, or the worker reaches pensionable age (Article 21). To terminate an unlimited period employment contract the worker must be given at least one month’s written notice. Workers cannot be dismissed for filing a complaint, while pregnant, during leave or based on trade union membership (Article 25–27). Workers on unlimited duration contracts not covered by the Social Security Law are entitled to one month’s salary for every year worked upon termination.
Source: Jordanian Labour Law, as outlined in Better Work Jordan (2013).
77
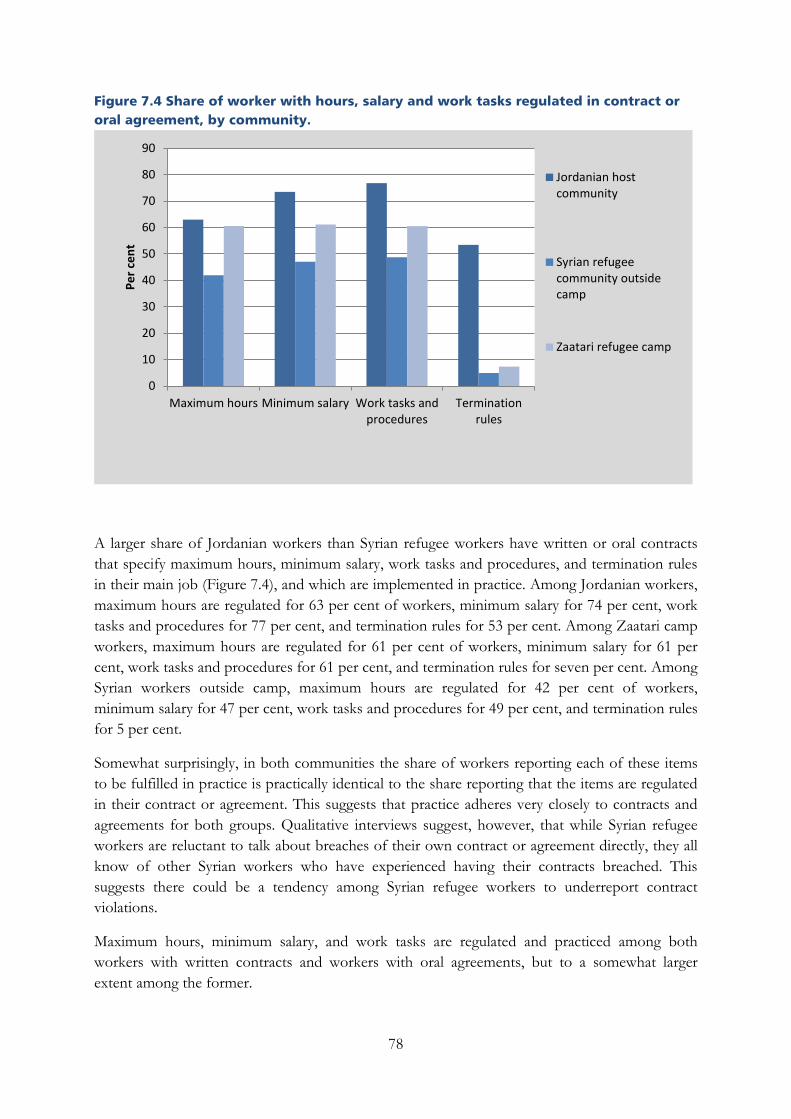
Figure 7.4 Share of worker with hours, salary and work tasks regulated in contract or oral agreement, by community.
A larger share of Jordanian workers than Syrian refugee workers have written or oral contracts that specify maximum hours, minimum salary, work tasks and procedures, and termination rules in their main job (Figure 7.4), and which are implemented in practice. Among Jordanian workers, maximum hours are regulated for 63 per cent of workers, minimum salary for 74 per cent, work tasks and procedures for 77 per cent, and termination rules for 53 per cent. Among Zaatari camp workers, maximum hours are regulated for 61 per cent of workers, minimum salary for 61 per cent, work tasks and procedures for 61 per cent, and termination rules for seven per cent. Among Syrian workers outside camp, maximum hours are regulated for 42 per cent of workers, minimum salary for 47 per cent, work tasks and procedures for 49 per cent, and termination rules for 5 per cent.
Somewhat surprisingly, in both communities the share of workers reporting each of these items to be fulfilled in practice is practically identical to the share reporting that the items are regulated in their contract or agreement. This suggests that practice adheres very closely to contracts and agreements for both groups. Qualitative interviews suggest, however, that while Syrian refugee workers are reluctant to talk about breaches of their own contract or agreement directly, they all know of other Syrian workers who have experienced having their contracts breached. This suggests there could be a tendency among Syrian refugee workers to underreport contract violations.
Maximum hours, minimum salary, and work tasks are regulated and practiced among both workers with written contracts and workers with oral agreements, but to a somewhat larger extent among the former.
0
10
20
30
40
50
60
70
80
90
Maximum hours Minimum salary Work tasks andprocedures
Terminationrules
Per c
ent
Jordanian hostcommunity
Syrian refugeecommunity outsidecamp
Zaatari refugee camp
78
7.3.3 Social security
Box 7.2 Social security law
The provisions of the social security law are applicable to all labourers 16 years of age and above without any discrimination to nationality and regardless of the duration or form of contract, the nature and amount of wage and whether the work is to be performed mainly inside or outside the Kingdom. It includes self-employed, employers and acting partners working in their facilities. It also includes Jordanian citizens employed by regional, international, political, foreign or Arab military missions operating inside the Kingdom, and attaché, educational and technical centers affiliated to them.
The provisions do not include public employees covered by the provisions of civil or military pension laws. For these groups, encompassing civil servants hired before 1995 and military personnel hired before 2002, separate schemes for old age disability and death pensions apply. Foreign employees employed by regional, international, political or Arab or foreign military, and attaché, educational and art centers affiliated to them are also not included in the provisions of the social security law. In addition, the law excludes labourers whose relationship with their employer is irregular.
Insurance against work injuries
The employer pays monthly contributions at a rate of two percent of the wages of the employee for insurance against work injuries. This insurance is compulsory and includes all labourers covered by the labour force law (Art 4, 24).
Maternity insurance (paid maternity leave)
The employer pays monthly contributions at a rate of 0.25 percent of the wages of the employee for maternity insurance. This insurance is compulsory and includes all labourers covered by the labour force law (Art 42, 43).
Insurance against old age, disability and death
Both the employer and employee contribute towards old age, disability and death insurance. The employer pays monthly contributions at a rate of nine percent of the wages of the employee and deducts monthly contributions of 5.5 percent from the wages of the employee. This insurance is compulsory and includes all labourers covered by the labour force law until the age of 60 for males and 55 for females (Art 59, 62).
Insurance against unemployment
The employer, employee and the state contribute towards unemployment insurance. The employer pays monthly contributions at a rate of 0.5 percent of the wages of the employee and deducts monthly contributions of one percent from the wages of the employee. Any contributions paid by the government treasure to finance this insurance are also included. This insurance is compulsory and includes all labourers covered by the labour force law (Art 48, 49).
Source: Social Security Law, Temporary law no. (7) for the year 2010
79
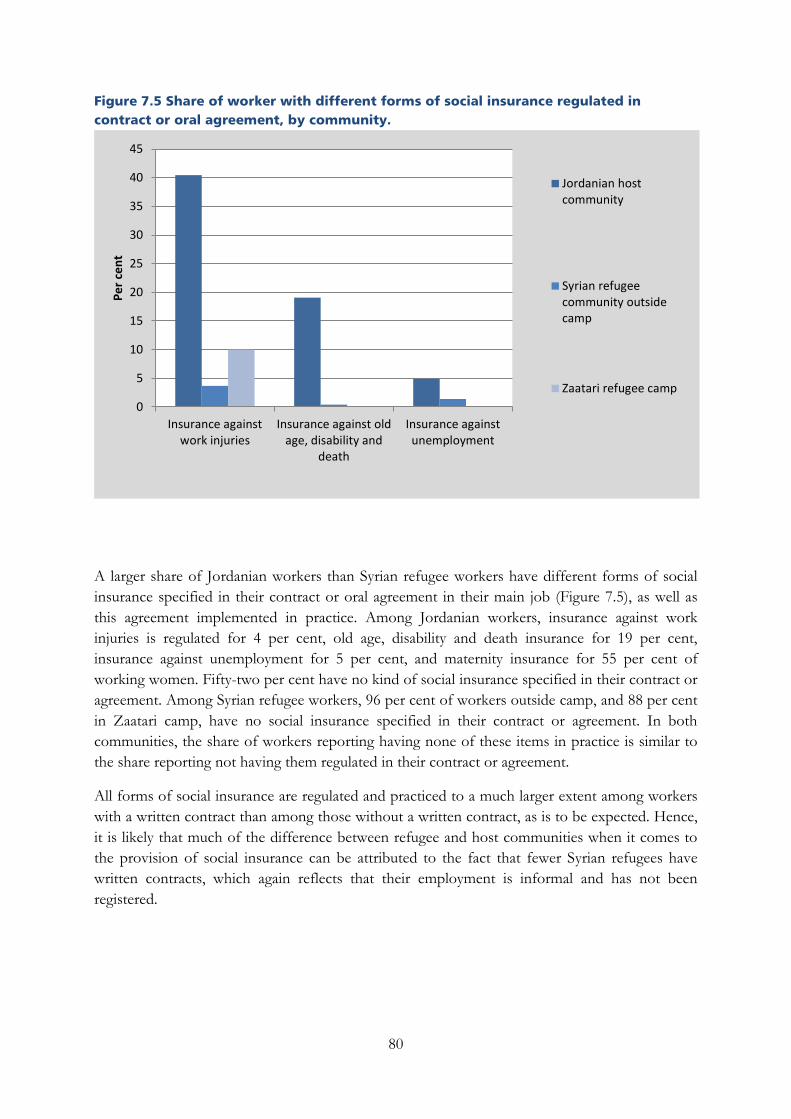
Figure 7.5 Share of worker with different forms of social insurance regulated in contract or oral agreement, by community.
A larger share of Jordanian workers than Syrian refugee workers have different forms of social insurance specified in their contract or oral agreement in their main job (Figure 7.5), as well as this agreement implemented in practice. Among Jordanian workers, insurance against work injuries is regulated for 4 per cent, old age, disability and death insurance for 19 per cent, insurance against unemployment for 5 per cent, and maternity insurance for 55 per cent of working women. Fifty-two per cent have no kind of social insurance specified in their contract or agreement. Among Syrian refugee workers, 96 per cent of workers outside camp, and 88 per cent in Zaatari camp, have no social insurance specified in their contract or agreement. In both communities, the share of workers reporting having none of these items in practice is similar to the share reporting not having them regulated in their contract or agreement.
All forms of social insurance are regulated and practiced to a much larger extent among workers with a written contract than among those without a written contract, as is to be expected. Hence, it is likely that much of the difference between refugee and host communities when it comes to the provision of social insurance can be attributed to the fact that fewer Syrian refugees have written contracts, which again reflects that their employment is informal and has not been registered.
0
5
10
15
20
25
30
35
40
45
Insurance againstwork injuries
Insurance against oldage, disability and
death
Insurance againstunemployment
Per c
ent
Jordanian hostcommunity
Syrian refugeecommunity outsidecamp
Zaatari refugee camp
80
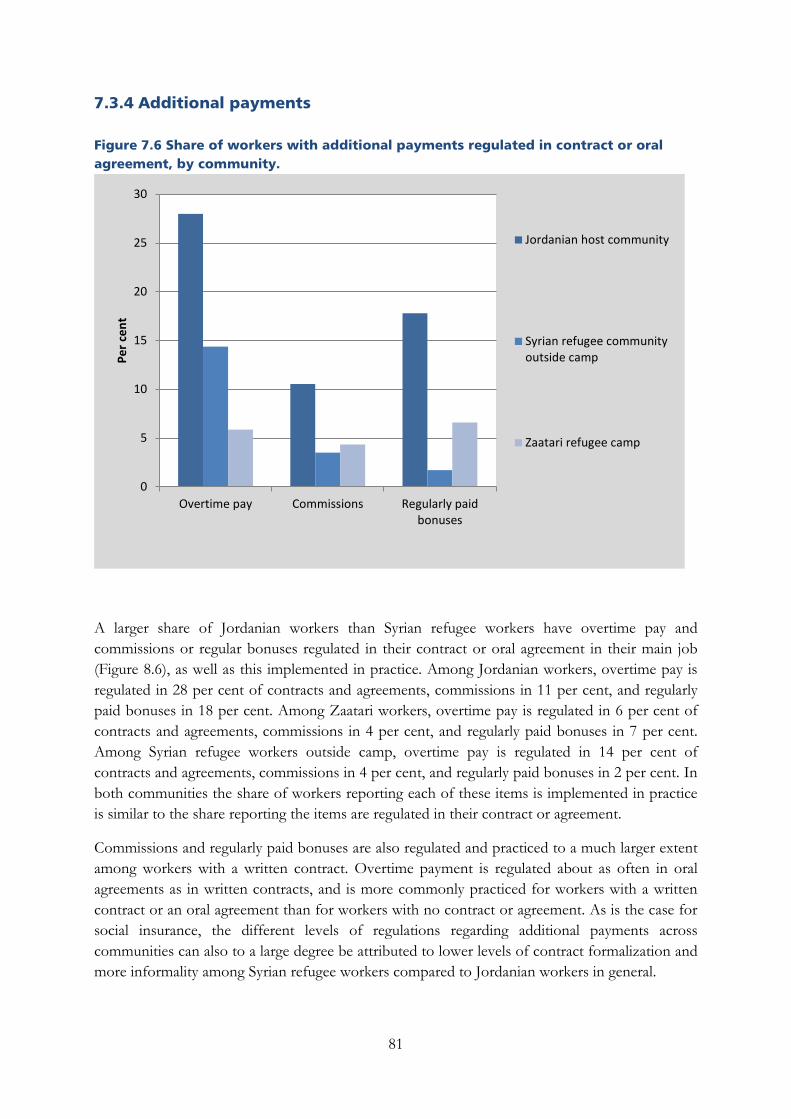
7.3.4 Additional payments
Figure 7.6 Share of workers with additional payments regulated in contract or oral agreement, by community.
A larger share of Jordanian workers than Syrian refugee workers have overtime pay and commissions or regular bonuses regulated in their contract or oral agreement in their main job (Figure 8.6), as well as this implemented in practice. Among Jordanian workers, overtime pay is regulated in 28 per cent of contracts and agreements, commissions in 11 per cent, and regularly paid bonuses in 18 per cent. Among Zaatari workers, overtime pay is regulated in 6 per cent of contracts and agreements, commissions in 4 per cent, and regularly paid bonuses in 7 per cent. Among Syrian refugee workers outside camp, overtime pay is regulated in 14 per cent of contracts and agreements, commissions in 4 per cent, and regularly paid bonuses in 2 per cent. In both communities the share of workers reporting each of these items is implemented in practice is similar to the share reporting the items are regulated in their contract or agreement.
Commissions and regularly paid bonuses are also regulated and practiced to a much larger extent among workers with a written contract. Overtime payment is regulated about as often in oral agreements as in written contracts, and is more commonly practiced for workers with a written contract or an oral agreement than for workers with no contract or agreement. As is the case for social insurance, the different levels of regulations regarding additional payments across communities can also to a large degree be attributed to lower levels of contract formalization and more informality among Syrian refugee workers compared to Jordanian workers in general.
0
5
10
15
20
25
30
Overtime pay Commissions Regularly paidbonuses
Per c
ent
Jordanian host community
Syrian refugee communityoutside camp
Zaatari refugee camp
81
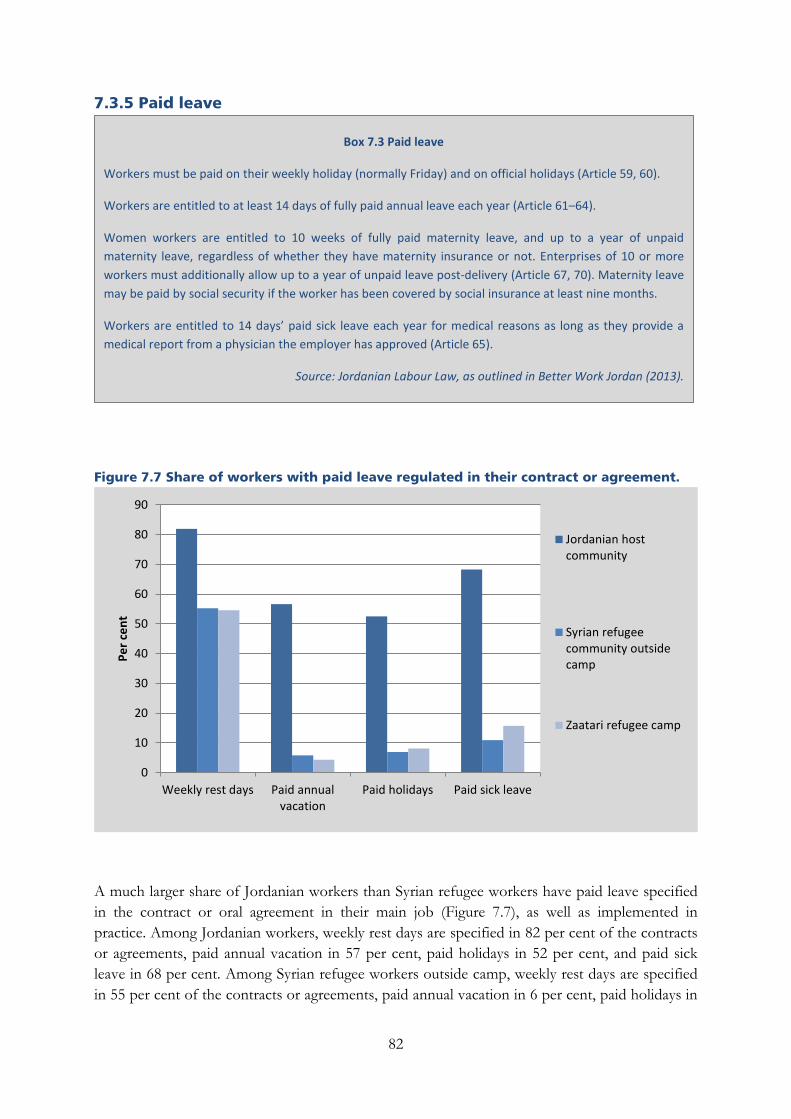
7.3.5 Paid leave
Figure 7.7 Share of workers with paid leave regulated in their contract or agreement.
A much larger share of Jordanian workers than Syrian refugee workers have paid leave specified in the contract or oral agreement in their main job (Figure 7.7), as well as implemented in practice. Among Jordanian workers, weekly rest days are specified in 82 per cent of the contracts or agreements, paid annual vacation in 57 per cent, paid holidays in 52 per cent, and paid sick leave in 68 per cent. Among Syrian refugee workers outside camp, weekly rest days are specified in 55 per cent of the contracts or agreements, paid annual vacation in 6 per cent, paid holidays in
0
10
20
30
40
50
60
70
80
90
Weekly rest days Paid annualvacation
Paid holidays Paid sick leave
Per c
ent
Jordanian hostcommunity
Syrian refugeecommunity outsidecamp
Zaatari refugee camp
Box 7.3 Paid leave
Workers must be paid on their weekly holiday (normally Friday) and on official holidays (Article 59, 60).
Workers are entitled to at least 14 days of fully paid annual leave each year (Article 61–64).
Women workers are entitled to 10 weeks of fully paid maternity leave, and up to a year of unpaid maternity leave, regardless of whether they have maternity insurance or not. Enterprises of 10 or more workers must additionally allow up to a year of unpaid leave post-delivery (Article 67, 70). Maternity leave may be paid by social security if the worker has been covered by social insurance at least nine months.
Workers are entitled to 14 days’ paid sick leave each year for medical reasons as long as they provide a medical report from a physician the employer has approved (Article 65).
Source: Jordanian Labour Law, as outlined in Better Work Jordan (2013).
82
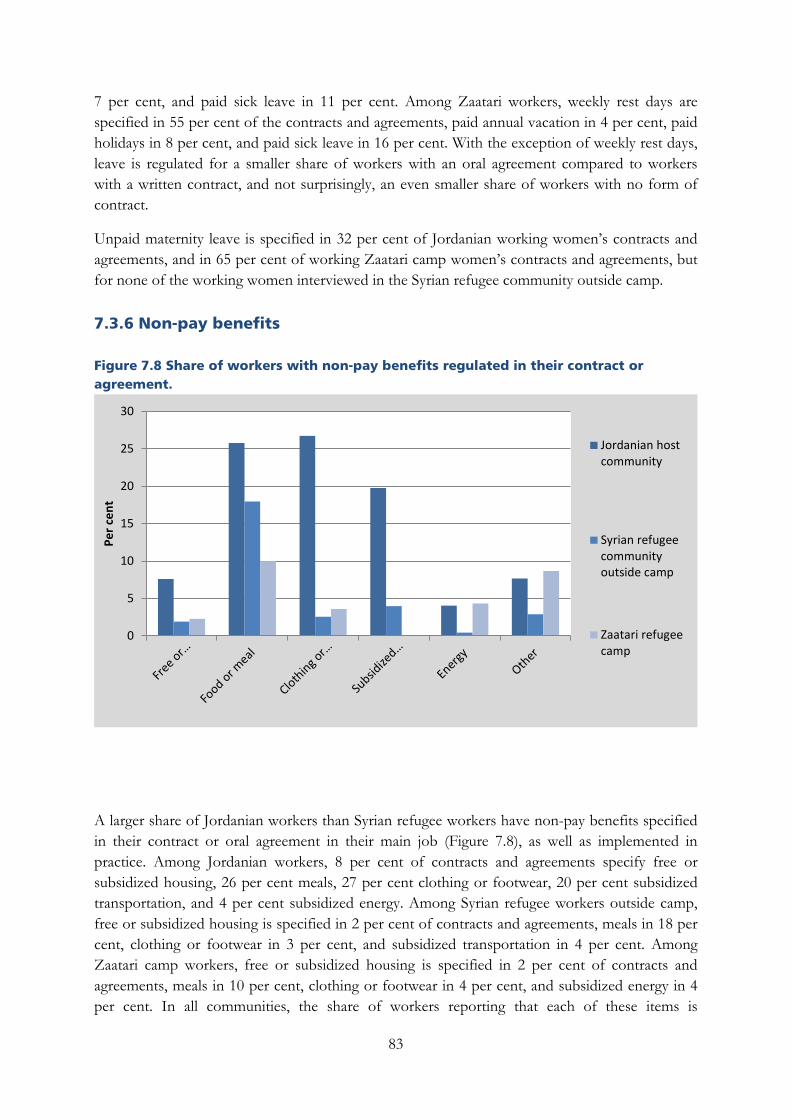
7 per cent, and paid sick leave in 11 per cent. Among Zaatari workers, weekly rest days are specified in 55 per cent of the contracts and agreements, paid annual vacation in 4 per cent, paid holidays in 8 per cent, and paid sick leave in 16 per cent. With the exception of weekly rest days, leave is regulated for a smaller share of workers with an oral agreement compared to workers with a written contract, and not surprisingly, an even smaller share of workers with no form of contract.
Unpaid maternity leave is specified in 32 per cent of Jordanian working women’s contracts and agreements, and in 65 per cent of working Zaatari camp women’s contracts and agreements, but for none of the working women interviewed in the Syrian refugee community outside camp.
7.3.6 Non-pay benefits
Figure 7.8 Share of workers with non-pay benefits regulated in their contract or agreement.
A larger share of Jordanian workers than Syrian refugee workers have non-pay benefits specified in their contract or oral agreement in their main job (Figure 7.8), as well as implemented in practice. Among Jordanian workers, 8 per cent of contracts and agreements specify free or subsidized housing, 26 per cent meals, 27 per cent clothing or footwear, 20 per cent subsidized transportation, and 4 per cent subsidized energy. Among Syrian refugee workers outside camp, free or subsidized housing is specified in 2 per cent of contracts and agreements, meals in 18 per cent, clothing or footwear in 3 per cent, and subsidized transportation in 4 per cent. Among Zaatari camp workers, free or subsidized housing is specified in 2 per cent of contracts and agreements, meals in 10 per cent, clothing or footwear in 4 per cent, and subsidized energy in 4 per cent. In all communities, the share of workers reporting that each of these items is
0
5
10
15
20
25
30
Per c
ent
Jordanian hostcommunity
Syrian refugeecommunityoutside camp
Zaatari refugeecamp
83
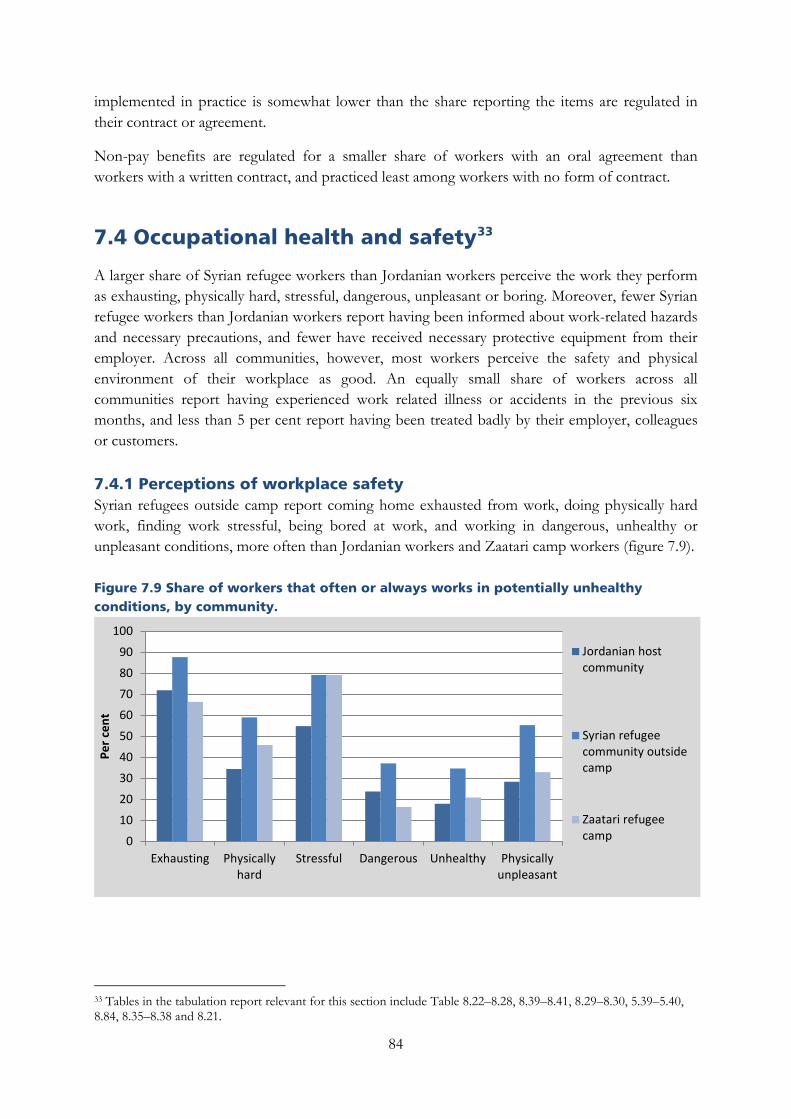
implemented in practice is somewhat lower than the share reporting the items are regulated in their contract or agreement.
Non-pay benefits are regulated for a smaller share of workers with an oral agreement than workers with a written contract, and practiced least among workers with no form of contract.
7.4 Occupational health and safety33
A larger share of Syrian refugee workers than Jordanian workers perceive the work they perform as exhausting, physically hard, stressful, dangerous, unpleasant or boring. Moreover, fewer Syrian refugee workers than Jordanian workers report having been informed about work-related hazards and necessary precautions, and fewer have received necessary protective equipment from their employer. Across all communities, however, most workers perceive the safety and physical environment of their workplace as good. An equally small share of workers across all communities report having experienced work related illness or accidents in the previous six months, and less than 5 per cent report having been treated badly by their employer, colleagues or customers.
7.4.1 Perceptions of workplace safety Syrian refugees outside camp report coming home exhausted from work, doing physically hard work, finding work stressful, being bored at work, and working in dangerous, unhealthy or unpleasant conditions, more often than Jordanian workers and Zaatari camp workers (figure 7.9).
Figure 7.9 Share of workers that often or always works in potentially unhealthy conditions, by community.
33 Tables in the tabulation report relevant for this section include Table 8.22–8.28, 8.39–8.41, 8.29–8.30, 5.39–5.40, 8.84, 8.35–8.38 and 8.21.
0
10
20
30
40
50
60
70
80
90
100
Exhausting Physicallyhard
Stressful Dangerous Unhealthy Physicallyunpleasant
Per c
ent
Jordanian hostcommunity
Syrian refugeecommunity outsidecamp
Zaatari refugeecamp
84
Across refugee and host communities, however, most workers perceive the safety, social environment and physical environment of their workplace as good or very good. There is a certain difference across communities in the perception of the physical workplace environment, where 84 per cent of Jordanian workers and 81 per cent of Zaatari workers, but only 70 per cent of Syrian refugee workers outside camp perceive the environment as good or very good. Around 10 per cent of Syrian refugee workers find the physical work environment bad or very bad. Regarding workplace safety, 92 per cent of Jordanian workers perceive it as good or very good. Among Syrian refugee workers, the corresponding shares are 85 per cent outside camp and 79 per cent in Zaatari. Regarding workplace social environment, 94 per cent of Jordanian workers report it is good or very good. Among Syrian refugee workers, the corresponding shares are 85 per cent outside camp and 90 per cent in Zaatari.
7.4.2 Work-related hazards and protective equipment Employers are required by law to protect workers from work-related accidents and illnesses, inform them about work-related hazards and necessary precautions prior to employment and to provide necessary protective equipment, such as goggles, aprons, masks, gloves, and/or footwear (Better Work Jordan 2013: 32). Workers are not required to pay for these measures.
About 30 per cent of Syrian refugee workers compared to 43 per cent of Jordanian workers report having been informed by their employer about work-related hazards and necessary precautions. While about one in four Jordanian employees reports necessary protective equipment has been provided by employer, this applies to only one in 10 Syrian refugee workers. The share of workers who state that no protective equipment is necessary is similar across the two groups.
In the construction sites visited during the fieldwork, none of the construction workers, regardless of nationality, were wearing any protection gear at any site.
4 per cent of Jordanian workers, 2 per cent of Syrian workers outside camp, and 0.2 per cent of the Zaatari camp workers report having experienced work related illness or accidents during the past six months.
7.4.3 Workplace conflicts During the 6 months preceding the interview, conflicts related to salary were slightly more prevalent among Syrian refugee workers (14 per cent) than among Jordanian workers (10 per cent), while conflicts related to working conditions were somewhat more prevalent among Jordanians (9 per cent) than among Syrian refugee workers (5 to 7 per cent). In both the Jordanian and Syrian refugee community, 80 per cent or more of the workers report not having experienced any conflicts at work in the previous six months.
Across refugee and host communities, more than 90 per cent of workers report being treated well or very well by their employer, by Jordanian colleagues, by colleagues of other nationalities and by customers. Less than 5 per cent of workers, in most cases one to two per cent, report being treated badly.
85
The qualitative interviews reveal a reluctance to disclose information about maltreatment and conflict, particularly when speaking about the employer. Syrian employees complain about too much prying into their wellbeing and the Syrian conflict from their Jordanian colleagues, which is perceived as unwanted curiosity and/or sympathy. In all-Syrian work environments, psychological problems, aggression and anxieties are said to mix, and create tension in interpersonal relations between employees.
7.5 Trade union membership
According to Jordanian law, workers in all professions are entitled to join a trade union, and employers may not condition employment on a worker not joining a trade union (Better Work Jordan 2013: 12-13). Workers in informal employment, however, are unlikely to be able to do so, given that their jobs per definition fall outside the purview of the law. The high degree of informality among Syrian refugee workers is therefore likely to leave them with few avenues to pursue their grievances.
In line with this argument, very few workers in the Syrian refugee community are members of a trade union or a professional association. Among the Syrian refugee workers outside camp interviewed for the RSI, only one per cent reported being members in a trade union or professional association. In Zaatari camp no workers did. Among Jordanian workers, 10 per cent reported being members of a trade union and one per cent being members of a professional association. Membership rates were even higher among women (25 per cent), workers aged 40 and above (17 per cent), workers earning 400 JD a month and more (21 per cent), workers with a college or university degree (28 per cent), and workers employed as managers (67 per cent) and professionals (39 per cent). Among the members, 69 per cent reported their trade union or professional association takes part in negotiations about salary or working conditions.
86
Chapter 8 Labour market challenges for women, youth, and persons with disabilities
This chapter describes particular challenges facing women, youth (15–24), and persons with disabilities in the Jordanian labour market. It describes the present situation in the labour market with reference to the Jordanian host community and the Syrian communities outside and inside the Zaatari refugee camp. Assessments of the implications of the influx of Syrian refugees on the labour market are primarily implicit in the description, as it can be generally assumed that the large influx of Syrian refugees and increased competition in the labour market lead to consolidation and possibly further enforcement of the various aspects outlined in this chapter. Some of the underlying changes in labour force participation and unemployment for youth and women between 2011 and today are also presented in chapter 4.
Across all communities, women work shorter hours and make less money compared to men. In terms of contract arrangements and social security coverage, however, women tend to be in somewhat more regulated forms of employment than men, and less often in informal employment.
Two particular challenges facing women in the labour market should be highlighted. First, a majority of working women report they are having trouble combining the household burden with working. Second, while a majority of workers think women should be allowed to work, most of them express scepticism towards combining work and raising children. There is also high scepticism towards women working when they are otherwise provided for, and in times of high unemployment, and towards women working far from home.
Youth in the Jordanian labour market tend to be in less permanent work situations, work longer hours, and make less money compared to adult workers.
Across all communities, educational attainment, school enrolment and labour force participation are substantially lower, and unemployment is higher, among persons with disabilities, compared to persons without disabilities.
8.1 Women in employment
As outlined in Chapter 3, there are only minor differences in educational attainment between men and women in all communities. However, labour force participation rates are substantially lower and unemployment rates are higher among women, compared to men in both host and refugee communities. While labour force participation among women has not changed much in any of the communities since the Syrian conflict began, female unemployment has increased among Jordanian women and more than doubled among Syrian refugee women.
87
This section outlines particular challenges facing women who have succeeded in finding a job in the Jordanian labour market. One key finding is that women in all communities work shorter hours and make less money than men. In terms of contract arrangements and social security coverage, however, women tend to be in somewhat more regulated forms of employment and less often in informal employment compared to men. Two particular challenges facing women in the labour market are highlighted. First, a majority of working women report they are having trouble combining the household burden with working. Second, negative attitudes among workers towards women working represent an important obstacle across all communities.
While figures reported in this section provide an important overview of the additional challenges faced by Jordanian and Syrian women in employment in Jordan, it should be kept in mind that the sample of female workers is small as a result of the low labour force participation and high unemployment among women in Jordan. This is particularly true in the case of Syrian refugee women. Certain estimates therefore entail a considerable amount of uncertainty, and should be interpreted with caution.
Qualitative findings verify that Syrian women in general work shorter hours than men, and their salaries are lower. A number of Syrian women working at home in a variety of jobs, ranging from assembling electrical equipment to handicraft, do not work full time. Handicraft work in particular is usually the product of arts and crafts projects targeting Syrian women in order to assist them in generating some income. Many women state that they must work from home due to family responsibilities and household chores. However, Syrian women working in agricultural farms work full time and equal hours to Syrian men on the same farms.
8.1.1 Job characteristics34
Among workers in the Jordanian host community, as well as in the Syrian refugee community outside camp,35 a slightly smaller share of women is in informal employment compared to men. Among Jordanian women, the share stands at 41 per cent, compared to 53 per cent among Jordanian men. Among Syrian women outside camp, the share is 92 per cent, compared to 99 per cent for Syrian men.
34 Tables in the tabulation report relevant for this section include Table 5.12, 5.20, 5.19, 5.13, 5.14 and 5.17, describing job characteristics, and Table 5.30, 5.26–29, 5.32–35 and 5.31, describing working conditions. Particular challenges for women in the labour market, as reported by working women themselves, are tabulated in Tables 8.56–8.58. More general attitudes among workers towards female employment are described in Table 9.21–9.31. 35 The sample captures 266 Jordanian women in employment, but only 18 Syrian refugee women in employment outside camp and 10 in Zaatari. Results for the Syrian refugee community are therefore highly uncertain and should therefore be interpreted with caution. Results from Zaatari are not reported.
88

Figure 8.1 Place where most women’s work takes place, by community.
A larger share of employed women than men in both communities work from home (Figure 9.1). Eight per cent of working Jordanian women work from home compared to only 1 per cent of Jordanian men, while 16 per cent of Syrian women outside camp work from home compared to zero Syrian men. The same picture is representative for working in a formal office, which is the case for 74 per cent of working women compared to 48 per cent of working men in the Jordanian host community. The corresponding figure for Syrian women outside camp is 36 per cent of women compared to 6 per cent of men, and 55 per cent of women in the Zaatari camp compared to 29 per cent of men.
Furthermore, a larger share of women in both communities work within their own neighbourhood, compared to men, and a smaller share outside their own town or village. This is in line with widespread negative attitudes about women working far from home, outlined below.
Among workers in all communities, a much larger share of women than men are employed in education and human health and social work industries, while a smaller share of women are employed in wholesale trade and retail and construction industries. Education employs 31 per cent of working Jordanian women compared to 7 per cent of the men, while 12 per cent of the women are employed in human health and social work, compared to 4 per cent of the men. Among working Syrian women outside camp, 29 per cent work in education, compared to only one per cent of the Syrian men, while 15 per cent work with human health and social work, compared to one per cent of the men. On the other hand, 10 per cent of working Jordanian women are employed in wholesale and retail trade, compared to 20 per cent of men, while only 1 per cent of the women are employed in construction, compared to 7 per cent of the men. Among working Syrian women outside camp, 7 per cent work in wholesale and retail trade, compared to 23 per cent of Syrian men, while 5 per cent of working Syrian women work in construction, compared to 43 per cent of Syrian men.
0
10
20
30
40
50
60
70
80
At home Formaloffice
Factoryoratelier
Farm orgarden
Shop, kiosk,coffee
house orrestaurant
Other
Per c
ent o
f wor
kers
Jordanian hostcommunity
Syrian refugeecommunity
Zaatari refugeecamp
89
A larger share of women than men are employed as professionals, technical and associate professionals and in elementary occupations, and a smaller share in crafts and related trades. Comparing women and men in the Jordanian host community, Syrian refugee community outside camp, and in Zaatari refugee camp, respectively shows that 60, 31 and 64 per cent of women are employed as professionals or technical and associate professionals, compared to 19, 4 and 9 per cent of men. In elementary occupations the corresponding figures are 10, 22, and zero per cent of the women, compared to 6, 1 and 22 per cent of the men in the three communities, respectively. In crafts and related trades, the share of employed women in the three communities are 7, 4 and zero per cent, respectively, compared to 21, 55, and 16 per cent of the men in the same communities. Among employed Jordanians, fewer women (15 per cent) than men (28 per cent) are employed in service and sales occupations. This is not the case among Syrian refugee workers outside camp.36
Regarding employment status, a larger share of employed Jordanian women (94 per cent) than men (81 per cent) are paid employees, and fewer women (4 per cent) than men (12 per cent) are own-account workers. 2, 5 and zero per cent of women, compared to 3, zero and 4 per cent of men, are employed in family businesses in the Jordanian host community, the Syrian refugee community outside camp, and in Zaatari refugee camp, respectively.
8.1.2 Working conditions Women in the Jordanian labour market work shorter hours and make less money than men. In terms of contract arrangements and social security coverage, however, women tend to be in somewhat more regulated forms of employment compared to men.
Among Jordanian workers, more women (72 per cent) than men (52 per cent) have written contracts. A corresponding difference can be found between Syrian refugee women (16 per cent) and men (3 per cent) outside camp. Fewer Jordanian women (12 per cent) than men (28 per cent) have neither a written contract nor an oral agreement regulating their employment, while fewer Syrian refugee women (43 per cent) than men (41 per cent) outside camp have an oral agreement.
Across host and refugee communities, women work somewhat shorter hours than men. A smaller share of women than men work 60 hours or more per week. With the exception of Zaatari camp, a smaller share of women than men work seven days per week: 10 per cent of women and 24 per cent of men in the Jordanian host community, and 25 per cent of women and 42 per cent of men in the Syrian refugee community outside camp. A smaller share of women than men work 7 days a week, standing at 8, 16 and 6 per cent of women, compared to 17, 21 and 41 per cent of men, in the Jordanian host community, the Syrian refugee community outside camp, and in the Zaatari camp, respectively.
A larger share of employed women than men in both communities have a normal cash income of less than 200 Jordanian dinars (JD) per month: 22 and 77 per cent of women, compared to 12 and 41 per cent of men, in the Jordanian host community and in the Syrian refugee community outside camp, respectively.
36 A further disaggregation of women into sub-groups, e.g. by occupational distribution, is not recommended due to small samples of Syrian women outside camps and in Zaatari.
90
A larger share of employed women than men are covered by a social security scheme in their main job: 70 and 8 per cent of women, compared to 55 and 1 per cent of men, in the Jordanian host community and the Syrian refugee community outside camp, respectively.
8.1.3 Particular challenges Among the Jordanian women selected for the RSI interview, 59 per cent state that the burden of household chores is the main challenge for women at work. Fifteen per cent state the main challenge to be that women get paid less than men for the same job. Eleven per cent states the main challenge to be that women only get low-paid jobs, while only 5 per cent highlight family objections as the main challenge. Fifty-three per cent of the Jordanian working women report having trouble combining household chores with work. Twenty-five per cent of the women report being paid less than men, and 6 per cent report having to share toilet facilities with men as a particular challenge. Five per cent report having experienced sexual harassment. These results should be interpreted with care, however. Because employment among women is low in Jordan, only 136 Jordanian women were captured in the RSI interview sample. From the Syrian refugee community, where even fewer women work, results of the survey questions asked to female workers only are not reported, as the RSI sample covers only 8 women outside camp and 8 in Zaatari.
In the qualitative interviews, Syrian women working as domestic workers state that they are wary of potential rumours of being of immoral character, and of possible exploitation by male employers, and therefore take great care to work in groups of at least two women when entering private homes. In larger mansions, female domestic workers team up with one trusted Syrian male employee who takes care of heavy work but is also considered the women’s protection against sexual assault.
8.1.4 Workers’ attitudes towards female employment37
Attitudes towards female employment among workers in all communities reflect important challenges facing women seeking work in Jordan. While a majority of workers think women should be allowed to work, most of them express scepticism towards combining work and raising children. Furthermore, there is a general scepticism towards women working when they are otherwise provided for, and in times of high unemployment, and towards women working far from home. Negative attitudes towards female employment are somewhat more prevalent among workers in the Syrian refugee community than among Jordanian workers, which may be attributed to differences in social characteristics and in educational background in particular.
Across all communities, a majority of workers think women should be allowed to work. About 60 per cent of Syrian refugee workers and 80 per cent of Jordanian workers think women should be allowed to work in the public sector. Around 50 per cent of Syrian refugee workers and 65 per cent of Jordanian workers think women should be allowed to work in the private sector. 62 per cent of Zaatari workers, 54 per cent of Syrian refugee workers outside camp, and 71 per cent of Jordanian workers, respectively, think women should be allowed to work in self-employment. Finally, around 60 per cent of Syrian refugee workers and 75 per cent of Jordanian workers disagree with the statement that women should only be allowed to work in family businesses.
37 As this sub-section maps attitudes towards female employment among workers only, it may not be representative for the population as a whole.
91
Workers in all communities have reservations about the circumstances under which women should be allowed to work, however. First, most workers consider female employment of secondary importance to male employment and think that women should not work unless they have to. Around 80 per cent of Syrian refugee workers and 55 per cent of Jordanian workers agree that married women should not work in times of high unemployment, and about 85 per cent of Syrian refugee workers and 75 per cent of Jordanian workers agree that a married woman should not work if her husband is capable of supporting her.
Second, many workers think women should not work too far from home. Sixty-two per cent of Zaatari workers, 68 per cent of Syrian refugee workers outside camp, and 54 per cent of Jordanian workers, respectively, agree that women should not work outside their camp or living area. Results from the qualitative interviews suggest this has to do with a combination of safety concerns and the need to combine work with family obligations.
Third, workers tend to see a pronounced trade-off between female labour force participation and the welfare of young children. More than 90 per cent of the workers in each community selected for the RSI interview agree that women should not try to combine a career with raising children. Furthermore, about 80 per cent of Syrian refugee workers and 73 per cent of Jordanian workers agree that a pre-school child is likely to suffer if the mother works. If the children are well looked after, however, around 60 per cent of Syrian refugee workers, and 80 per cent of Jordanian workers, agree that it is good for a woman to work. This could imply that improved child care and early age education systems may ease women’s entry into the labour market.
Negative attitudes towards working women are generally more prevalent among workers with little or no education. Some of the differences between the attitudes of Jordanian and Syrian refugee workers may therefore be explained by the fact that the Syrian refugees as a group are less educated, as compared to Jordanians as a group.
In qualitative interviews some Syrian men stated ‘our womenfolk don’t work’, when asked if their wives are employed. A number of Syrian women also explained that they are forced to work in Jordan, while in Syria they did not need to work because they were provided for. Working is thus perceived as an indicator of hardship. Yet other Syrian women were used to paid work in Syria and try to find similar work in Jordan. Finding similar work appears to be more challenging, particularly when twinned with the need to work close to home, due to family obligations and safety concerns.
8.2 Youth38
As outlined in Chapter 4, labour force participation among Jordanian youth is lower than the adult average, and unemployment is higher than average, while for Syrian refugee youth neither figure deviates much from the community average. This section outlines how youth labour force participation and unemployment rates vary with education and wealth, and how job
38 Tables in the tabulation report relevant for this section include Table 12.1–12.4, disaggregating youth labour force participation and unemployment rates by background characteristics, Table 5.12, 5.13, 5.14 and 5.17, describing job characteristics, and Table 5.30, 5.26–29, 5.32–35, 5.31, 5.38 and 5.21, describing the working conditions of youth.
92
characteristics and working conditions among youth who have succeeded in finding a job differ from the jobs and working conditions in the adult population.
With respect to education and wealth, young Jordanian men stand out, with lower labour force participation rates and higher unemployment in wealthier households and households with a highly educated household head. One explanation of this is that this socio-economically well-off group can afford to take higher education and then wait to find the right job, while being provided for by their family in the meantime. For young women, labour force participation is somewhat higher in wealthier households, possibly because of less restrictive attitudes towards women in work in the middle and upper classes.
In terms of working conditions, youth in general tend to be in less permanent work situations, work longer hours, and make less money than adult workers.
Findings from the qualitative interviews suggest that Jordanian youth may be more antagonistic towards Syrian workers and fearful that Syrians are taking their jobs, compared to other age groups. Similarly, more youth speak of managerial decisions at the workplace to ensure that jobs go to ‘sons of the nation’, that is to say Jordanians, due to high unemployment rates amongst Jordanian youth.
8.2.1 Youth labour force participation, education and wealth Labour force participation among youth increases with higher levels of education in all communities (Table 8.1). It also increases with age (Figure 8.2). Young, Syrian refugee men appear to begin working somewhat earlier than young Jordanian men, however, with 60–70 per cent of young Syrian men being in the labour force from around the age of 19. Much of this difference may be explained by the fact that a larger number of Jordanian boys are still in school at this age. An exception to the general trend is found among young Syrian refugee women in Zaatari camp, whose labour force participation peaks around the age of 20 before decreasing, presumably due to marriage and family responsibility.
The labour force participation of young women appears positively associated with the education of the head of the household across all communities (Table 8.1), with higher labour force participation in households where the household head has higher education. Labour force participation among male youth, however, shows different patterns in the different communities. Young men in Zaatari have higher labour force participation the higher the education of the household head, while the labour force participation among young Syrian refugee men outside camp differs little across household head education. In the Jordanian host community, however, young men appear less likely to take part in the labour force the higher the education of the household head. This could be because the sons of men with higher education tend to be more likely to pursue higher education themselves, and thus less likely to enter the labour force before their mid-twenties.
93
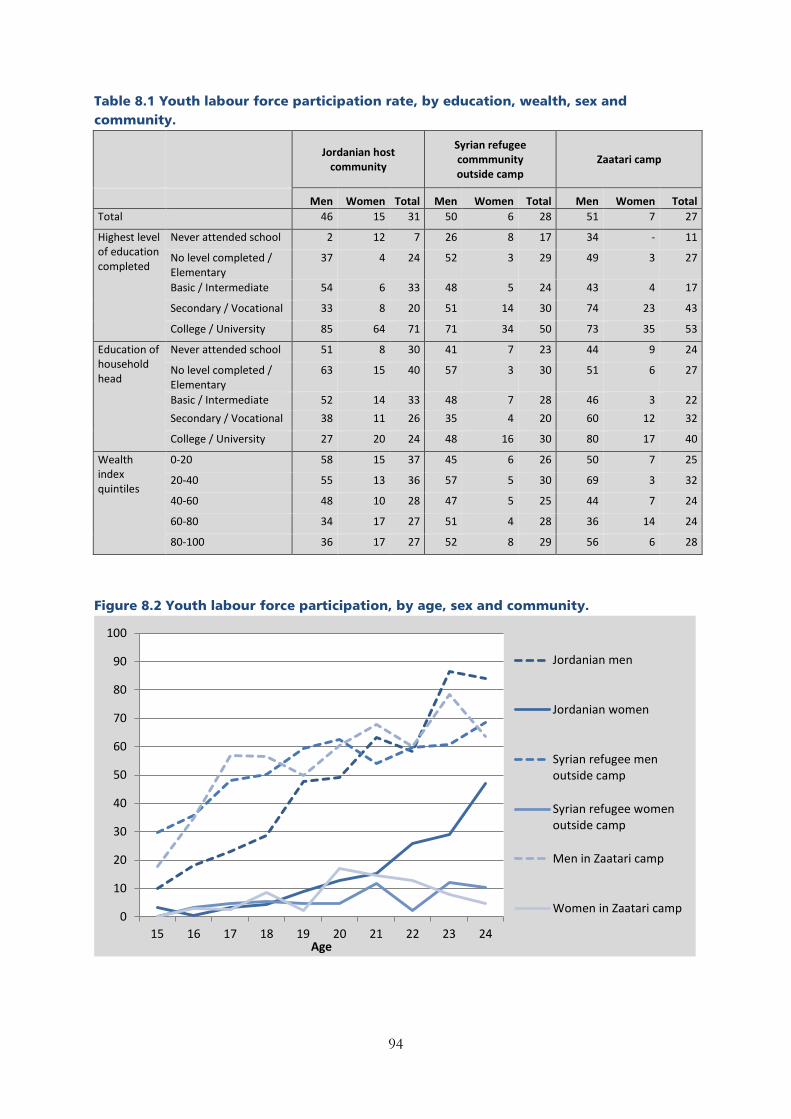
Table 8.1 Youth labour force participation rate, by education, wealth, sex and community.
Jordanian host community
Syrian refugee commmunity outside camp
Zaatari camp
Men Women Total Men Women Total Men Women Total Total 46 15 31 50 6 28 51 7 27
Highest level of education completed
Never attended school 2 12 7 26 8 17 34 - 11
No level completed / Elementary
37 4 24 52 3 29 49 3 27
Basic / Intermediate 54 6 33 48 5 24 43 4 17
Secondary / Vocational 33 8 20 51 14 30 74 23 43
College / University 85 64 71 71 34 50 73 35 53
Education of household head
Never attended school 51 8 30 41 7 23 44 9 24
No level completed / Elementary
63 15 40 57 3 30 51 6 27
Basic / Intermediate 52 14 33 48 7 28 46 3 22 Secondary / Vocational 38 11 26 35 4 20 60 12 32
College / University 27 20 24 48 16 30 80 17 40
Wealth index quintiles
0-20 58 15 37 45 6 26 50 7 25
20-40 55 13 36 57 5 30 69 3 32
40-60 48 10 28 47 5 25 44 7 24
60-80 34 17 27 51 4 28 36 14 24
80-100 36 17 27 52 8 29 56 6 28
Figure 8.2 Youth labour force participation, by age, sex and community.
0
10
20
30
40
50
60
70
80
90
100
15 16 17 18 19 20 21 22 23 24Age
Jordanian men
Jordanian women
Syrian refugee menoutside camp
Syrian refugee womenoutside camp
Men in Zaatari camp
Women in Zaatari camp
94
In the Jordanian host community, labour force participation among young men is lower among youth from wealthier households (Table 8.1). Again, this could be a result of young men from wealthier households being more likely to take higher education, and thus less likely to enter the labour force before their mid-twenties. No corresponding pattern is visible among young men in the Syrian refugee community, presumably because most of them come from less wealthy households by Jordanian standards, and most of them therefore have to enter the labour force early instead of pursuing higher education. Young women from the wealthier households in both communities are more likely to be part of the labour force. Again, this may partly be explained due to wealthier households being more likely to have their youth pursue higher education, although it may also be a result of less restrictive attitudes towards women working in the more educated middle and upper classes.
Findings from the qualitative interviews suggest that higher income families are more often made up of several working family members, and that all youth appear to be working in some families. In such instances, the youth (of both sexes) may be the primary income providers for the family. In contrast, in other families, none of the family members have any work or income at all. These patterns appear to reflect general levels of resourcefulness. Several of the households where all the youth worked were comprised of individuals who were taking university degrees in Syria when the war broke out. They had to abandon their education after fleeing to Jordan, and were now bringing income for their families. The households without any income were often of much more humble backgrounds, usually uneducated and from rural backgrounds.
8.2.2 Unemployment, education and wealth Unemployment rates for Jordanian youth in Amman, Irbid, and Mafraq (42 per cent) are significantly higher than the average unemployment rate among Jordanians in these three governorates in total (22 per cent). However, youth unemployment does not appear to be significantly associated with age in any of the communities.
In the Jordanian host community, unemployment for men is higher among youth with a college or university degree (52 per cent), compared to the male youth average (35 per cent) (Table 8.2). It is also higher among youth from the richest quintile of the population (44 per cent). This might reflect that young men from households with high socio-economic status can afford to wait for the right job to come along while being provided for by their family. This does not appear to be the case among young men in the Syrian refugee community, or among young women in any of the communities. If anything, estimates based on the few individuals in this group that have completed higher education suggest they are less likely to be unemployed compared to youth with less education. The same appears to be the case for youth in the top wealth quintile.
95
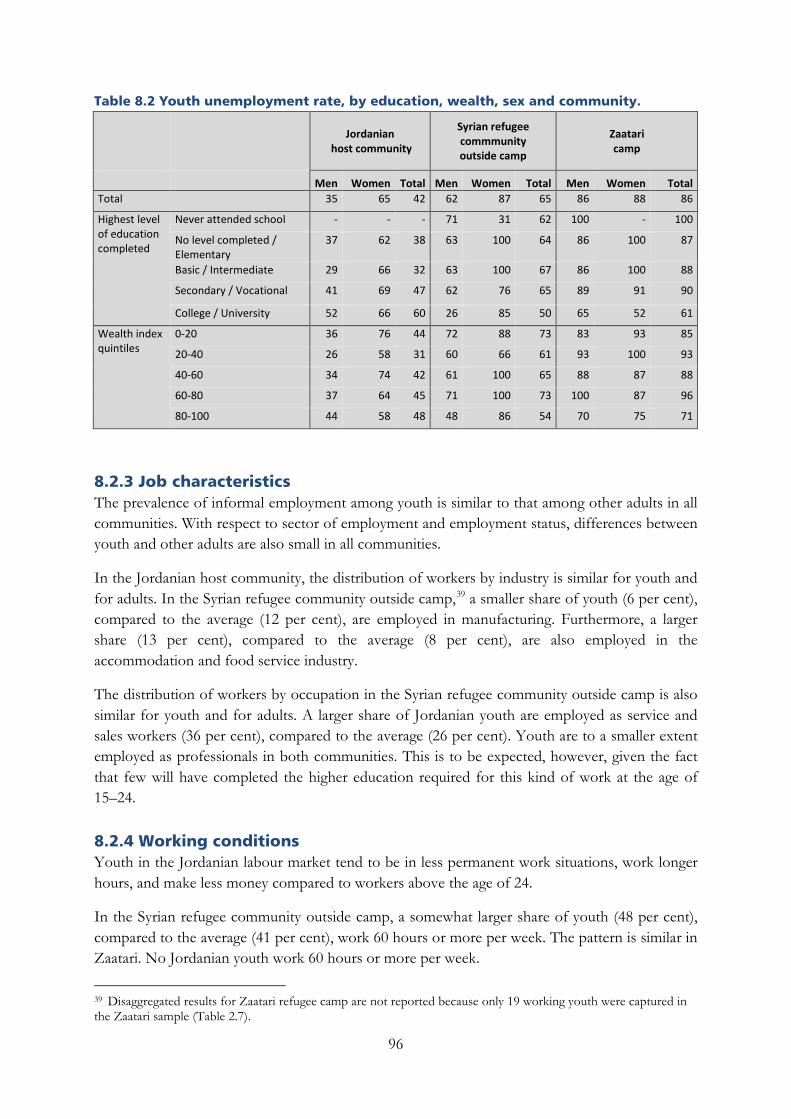
Table 8.2 Youth unemployment rate, by education, wealth, sex and community.
Jordanian host community
Syrian refugee commmunity outside camp
Zaatari camp
Men Women Total Men Women Total Men Women Total Total 35 65 42 62 87 65 86 88 86
Highest level of education completed
Never attended school - - - 71 31 62 100 - 100
No level completed / Elementary
37 62 38 63 100 64 86 100 87
Basic / Intermediate 29 66 32 63 100 67 86 100 88
Secondary / Vocational 41 69 47 62 76 65 89 91 90
College / University 52 66 60 26 85 50 65 52 61
Wealth index quintiles
0-20 36 76 44 72 88 73 83 93 85
20-40 26 58 31 60 66 61 93 100 93
40-60 34 74 42 61 100 65 88 87 88
60-80 37 64 45 71 100 73 100 87 96
80-100 44 58 48 48 86 54 70 75 71
8.2.3 Job characteristics The prevalence of informal employment among youth is similar to that among other adults in all communities. With respect to sector of employment and employment status, differences between youth and other adults are also small in all communities.
In the Jordanian host community, the distribution of workers by industry is similar for youth and for adults. In the Syrian refugee community outside camp,39 a smaller share of youth (6 per cent), compared to the average (12 per cent), are employed in manufacturing. Furthermore, a larger share (13 per cent), compared to the average (8 per cent), are also employed in the accommodation and food service industry.
The distribution of workers by occupation in the Syrian refugee community outside camp is also similar for youth and for adults. A larger share of Jordanian youth are employed as service and sales workers (36 per cent), compared to the average (26 per cent). Youth are to a smaller extent employed as professionals in both communities. This is to be expected, however, given the fact that few will have completed the higher education required for this kind of work at the age of 15–24.
8.2.4 Working conditions Youth in the Jordanian labour market tend to be in less permanent work situations, work longer hours, and make less money compared to workers above the age of 24.
In the Syrian refugee community outside camp, a somewhat larger share of youth (48 per cent), compared to the average (41 per cent), work 60 hours or more per week. The pattern is similar in Zaatari. No Jordanian youth work 60 hours or more per week.
39 Disaggregated results for Zaatari refugee camp are not reported because only 19 working youth were captured in the Zaatari sample (Table 2.7).
96
In both host and refugee communities, a larger share of youth than of adults fall into the bottom two categories of normal cash income, making 1–199 JD or 200–299 JD per month. The pattern is clearest among Jordanian workers, where 65 per cent of youth make 1–299 JD, compared to an average of 38 per cent among all Jordanian workers. Among Syrian refugee workers, 89 per cent of youth, compared to an average of 77 per cent, make 1-299 JD. In Zaatari camp, practically no workers make more than 299 JD per month, regardless of age. Taking into account the Jordanian minimum wage, a much larger share of Jordanian youth (27 per cent),) made less than the minimum wage of 190 JD in the past month, compared to the average (13 per cent). In the Syrian refugee community, however, the share of youth that made less than the migrant worker minimum wage of 150 JD in last month is similar to the community average
Among Jordanian workers, a larger share of youth (30 per cent) than average (19 per cent) have the terms of their employment regulated by an oral agreement. The pattern is similar but somewhat less prominent among Syrian refugee workers outside camp, with 70 per cent of youth, compared to an average of 65 per cent, having an oral agreement.
In host and refugee communities, the share of workers in a permanent employment situation is smaller among youth than for older generations, and the share of youth in temporary work is larger than among adults. The share of Jordanian youth with permanent, irregular, or temporary work stands at 74 per cent, compared to the average of 85 per cent. The corresponding shares of Syrian youth are 22 and 30 per cent for youth outside and inside Zaatari, respectively, compared to the average of 31 per cent outside camp and 38 per cent in Zaatari. In line with this pattern, a larger share of Jordanian youth workers (15 per cent) than average (8 per cent) report having worked only one to three months out of the last six months.
8.3 Persons with disabilities40
Across all communities, educational attainment, school enrolment and labour force participation are substantially lower among persons with disabilities, compared to persons without disabilities, while unemployment is higher
8.3.1 Definition and regulations In accordance with international standards, disability is defined as a prolonged health problem (in this case lasting more than 6 months) resulting in a lot of difficulty with, or lack of ability to: see (even with glasses); hear (even with hearing aid); walk; climb steps; remember; concentrate; perform self-care; or communicate. Applying this definition, persons with disabilities make up 1.1 per cent of the Jordanian host community, 1.2 per cent of Zaatari camp residents, and 2.0 per cent of the Syrian refugee community outside camp.
40 Tables in the tabulation report relevant for this section include Table 7.2–7.9, defining disability, Table 4.1 and 4.7, describing levels of education and enrollment, and Table 12.6–12.8, describing labour force participation and unemployment among persons with disabilities.
97
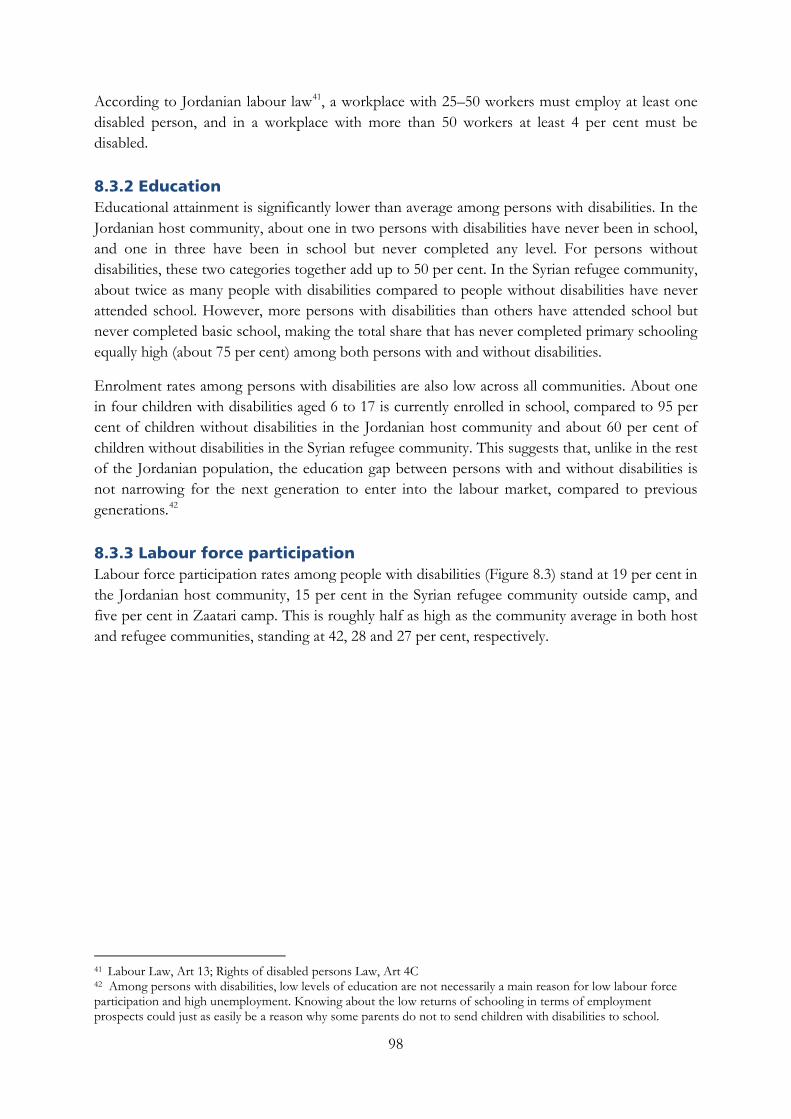
According to Jordanian labour law41, a workplace with 25–50 workers must employ at least one disabled person, and in a workplace with more than 50 workers at least 4 per cent must be disabled.
8.3.2 Education Educational attainment is significantly lower than average among persons with disabilities. In the Jordanian host community, about one in two persons with disabilities have never been in school, and one in three have been in school but never completed any level. For persons without disabilities, these two categories together add up to 50 per cent. In the Syrian refugee community, about twice as many people with disabilities compared to people without disabilities have never attended school. However, more persons with disabilities than others have attended school but never completed basic school, making the total share that has never completed primary schooling equally high (about 75 per cent) among both persons with and without disabilities.
Enrolment rates among persons with disabilities are also low across all communities. About one in four children with disabilities aged 6 to 17 is currently enrolled in school, compared to 95 per cent of children without disabilities in the Jordanian host community and about 60 per cent of children without disabilities in the Syrian refugee community. This suggests that, unlike in the rest of the Jordanian population, the education gap between persons with and without disabilities is not narrowing for the next generation to enter into the labour market, compared to previous generations.42
8.3.3 Labour force participation Labour force participation rates among people with disabilities (Figure 8.3) stand at 19 per cent in the Jordanian host community, 15 per cent in the Syrian refugee community outside camp, and five per cent in Zaatari camp. This is roughly half as high as the community average in both host and refugee communities, standing at 42, 28 and 27 per cent, respectively.
41 Labour Law, Art 13; Rights of disabled persons Law, Art 4C 42 Among persons with disabilities, low levels of education are not necessarily a main reason for low labour force participation and high unemployment. Knowing about the low returns of schooling in terms of employment prospects could just as easily be a reason why some parents do not to send children with disabilities to school.
98
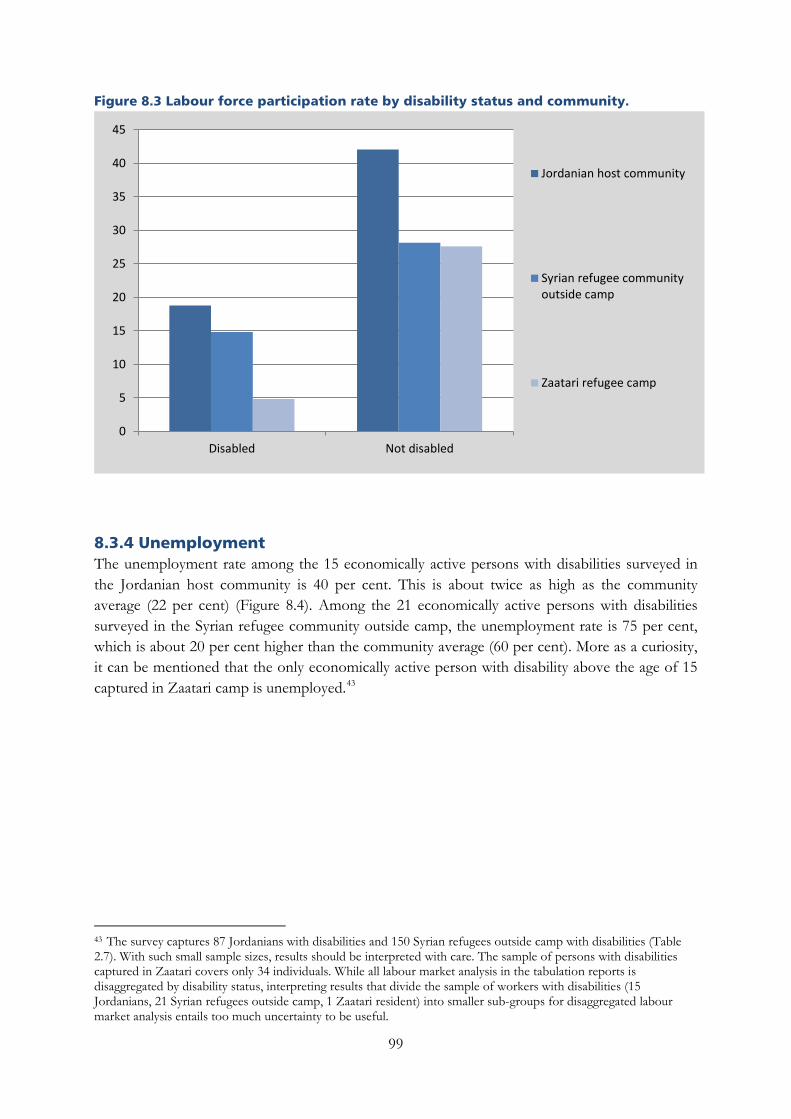
Figure 8.3 Labour force participation rate by disability status and community.
8.3.4 Unemployment The unemployment rate among the 15 economically active persons with disabilities surveyed in the Jordanian host community is 40 per cent. This is about twice as high as the community average (22 per cent) (Figure 8.4). Among the 21 economically active persons with disabilities surveyed in the Syrian refugee community outside camp, the unemployment rate is 75 per cent, which is about 20 per cent higher than the community average (60 per cent). More as a curiosity, it can be mentioned that the only economically active person with disability above the age of 15 captured in Zaatari camp is unemployed.43
43 The survey captures 87 Jordanians with disabilities and 150 Syrian refugees outside camp with disabilities (Table 2.7). With such small sample sizes, results should be interpreted with care. The sample of persons with disabilities captured in Zaatari covers only 34 individuals. While all labour market analysis in the tabulation reports is disaggregated by disability status, interpreting results that divide the sample of workers with disabilities (15 Jordanians, 21 Syrian refugees outside camp, 1 Zaatari resident) into smaller sub-groups for disaggregated labour market analysis entails too much uncertainty to be useful.
0
5
10
15
20
25
30
35
40
45
Disabled Not disabled
Jordanian host community
Syrian refugee communityoutside camp
Zaatari refugee camp
99
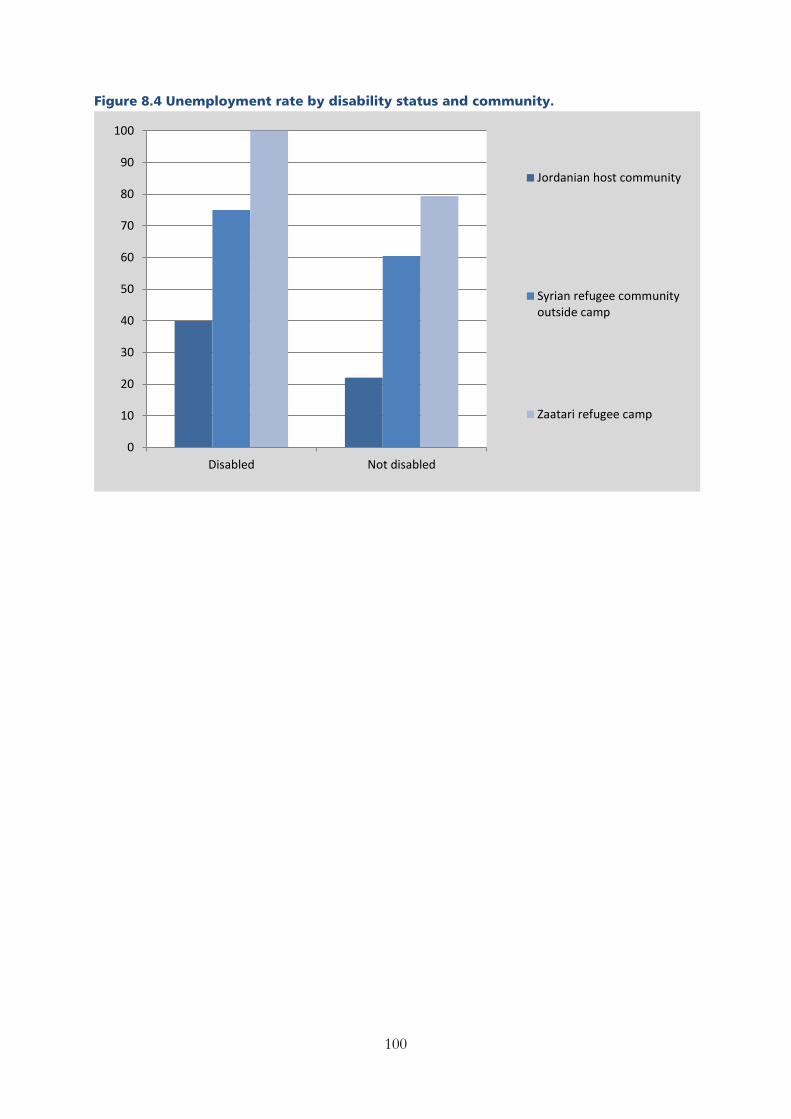
Figure 8.4 Unemployment rate by disability status and community.
0
10
20
30
40
50
60
70
80
90
100
Disabled Not disabled
Jordanian host community
Syrian refugee communityoutside camp
Zaatari refugee camp
100
Chapter 9 Child employment
This chapter outlines the scope and manifestations of child labour in the Syrian refugee communities and in the Jordanian host community. The results are based on information reported by a responsible adult in the children’s household.
The prevalence of economic activity among children and child employment is higher among boys in the Syrian refugee community than among boys in the Jordanian host community, and substantially higher for boys aged 15 to 17 than for boys aged 9 to 14 in all communities. Comparing current estimates with estimated child employment before the Syrian crisis began, however, indicates that boys in the Syrian refugee community were already employed back in Syria before the movement to a larger extent than Jordanian boys of the same age.
When looking at economic activity among children, employment is more prevalent among boys than among girls in all communities..
Very few children, less than 0.5 per cent in both communities, are employed and enrolled in school at the same time. The share of children aged 9–17 who are in school is substantially lower among Syrian refugee children than among Jordanian children, while the share of Syrian children who are neither in school nor in employment is substantially higher.
Most Syrian refugee children in employment are employed in the construction, wholesale and retail, trade and repairs, accommodation and food services or manufacturing industries. The majority of Jordanian children in employment work in manufacturing. In terms of occupation, one in two employed children, both in the refugee and host communities, are employed as craft and related trades workers. The rest are primarily in service and sales, or elementary occupations.
Employed children tend to work long hours, and for a large majority this makes their work qualify as child labour. In terms of income, most employed children make 1–199 JD per month, which often makes a significant contribution to their household’s total income.
Employment that is detrimental to a child’s health and development is classified as child labour by international standards. Taking into account that very few children are able to combine work and schooling, that they work long hours, and that many work in industries where they are likely to be exposed to conditions potentially detrimental to their health, it appears likely that a vast majority of the employed children are in employment classified as child labour. This is particularly true for children in the age group 9 to 14.
Since the prevalence of child employment is relatively low in Jordan, the number of employed children captured in the survey is small. The analysis of job characteristics and working conditions should therefore be interpreted with caution, as it is associated with high levels of
101
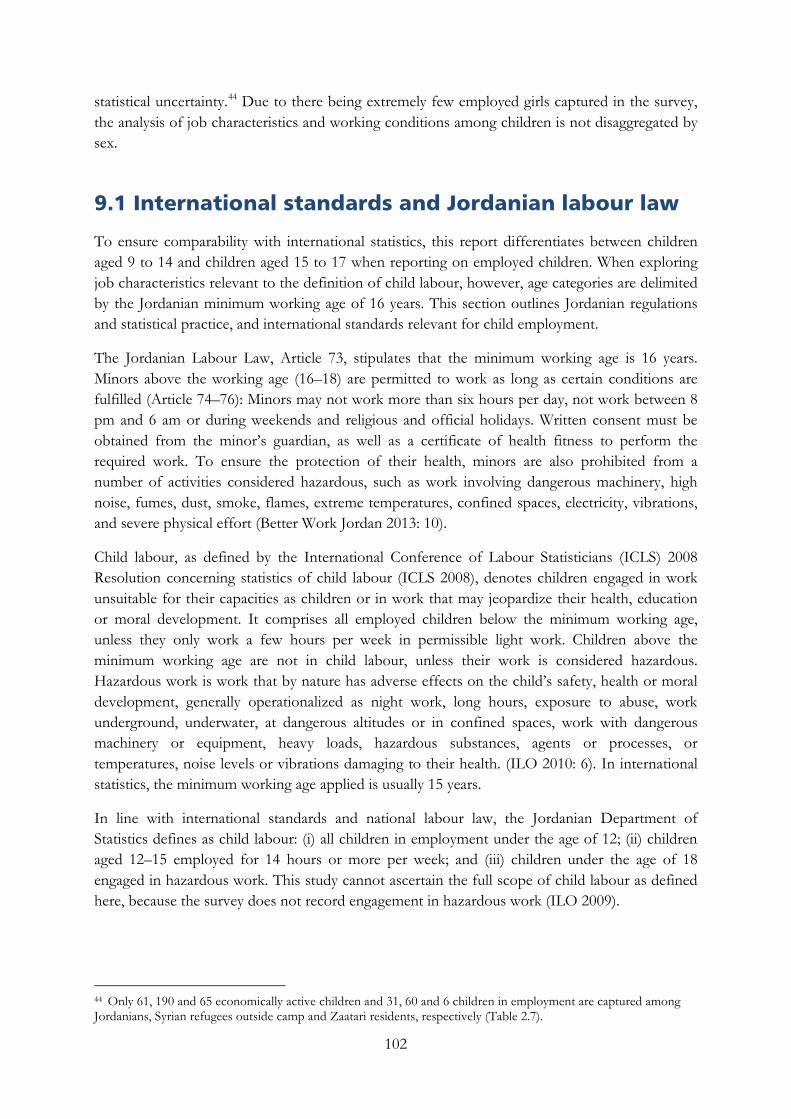
statistical uncertainty.44 Due to there being extremely few employed girls captured in the survey, the analysis of job characteristics and working conditions among children is not disaggregated by sex.
9.1 International standards and Jordanian labour law
To ensure comparability with international statistics, this report differentiates between children aged 9 to 14 and children aged 15 to 17 when reporting on employed children. When exploring job characteristics relevant to the definition of child labour, however, age categories are delimited by the Jordanian minimum working age of 16 years. This section outlines Jordanian regulations and statistical practice, and international standards relevant for child employment.
The Jordanian Labour Law, Article 73, stipulates that the minimum working age is 16 years. Minors above the working age (16–18) are permitted to work as long as certain conditions are fulfilled (Article 74–76): Minors may not work more than six hours per day, not work between 8 pm and 6 am or during weekends and religious and official holidays. Written consent must be obtained from the minor’s guardian, as well as a certificate of health fitness to perform the required work. To ensure the protection of their health, minors are also prohibited from a number of activities considered hazardous, such as work involving dangerous machinery, high noise, fumes, dust, smoke, flames, extreme temperatures, confined spaces, electricity, vibrations, and severe physical effort (Better Work Jordan 2013: 10).
Child labour, as defined by the International Conference of Labour Statisticians (ICLS) 2008 Resolution concerning statistics of child labour (ICLS 2008), denotes children engaged in work unsuitable for their capacities as children or in work that may jeopardize their health, education or moral development. It comprises all employed children below the minimum working age, unless they only work a few hours per week in permissible light work. Children above the minimum working age are not in child labour, unless their work is considered hazardous. Hazardous work is work that by nature has adverse effects on the child’s safety, health or moral development, generally operationalized as night work, long hours, exposure to abuse, work underground, underwater, at dangerous altitudes or in confined spaces, work with dangerous machinery or equipment, heavy loads, hazardous substances, agents or processes, or temperatures, noise levels or vibrations damaging to their health. (ILO 2010: 6). In international statistics, the minimum working age applied is usually 15 years.
In line with international standards and national labour law, the Jordanian Department of Statistics defines as child labour: (i) all children in employment under the age of 12; (ii) children aged 12–15 employed for 14 hours or more per week; and (iii) children under the age of 18 engaged in hazardous work. This study cannot ascertain the full scope of child labour as defined here, because the survey does not record engagement in hazardous work (ILO 2009).
44 Only 61, 190 and 65 economically active children and 31, 60 and 6 children in employment are captured among Jordanians, Syrian refugees outside camp and Zaatari residents, respectively (Table 2.7).
102
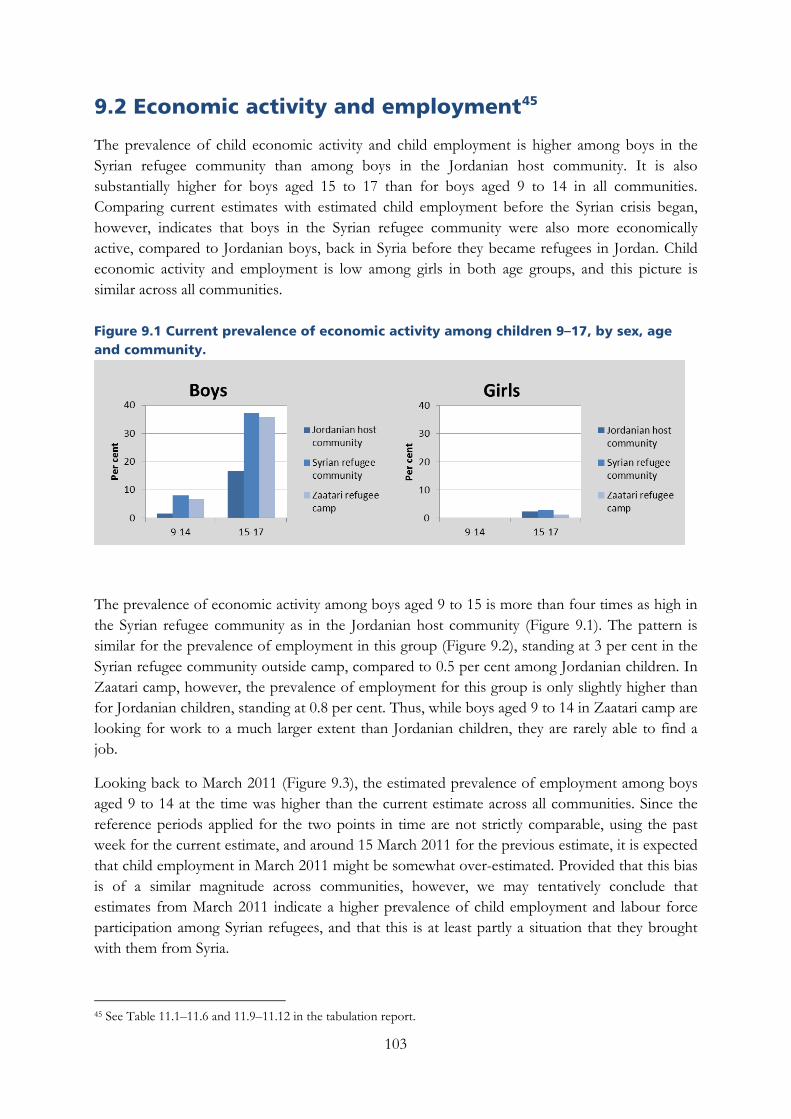
9.2 Economic activity and employment45
The prevalence of child economic activity and child employment is higher among boys in the Syrian refugee community than among boys in the Jordanian host community. It is also substantially higher for boys aged 15 to 17 than for boys aged 9 to 14 in all communities. Comparing current estimates with estimated child employment before the Syrian crisis began, however, indicates that boys in the Syrian refugee community were also more economically active, compared to Jordanian boys, back in Syria before they became refugees in Jordan. Child economic activity and employment is low among girls in both age groups, and this picture is similar across all communities.
Figure 9.1 Current prevalence of economic activity among children 9–17, by sex, age and community.
The prevalence of economic activity among boys aged 9 to 15 is more than four times as high in the Syrian refugee community as in the Jordanian host community (Figure 9.1). The pattern is similar for the prevalence of employment in this group (Figure 9.2), standing at 3 per cent in the Syrian refugee community outside camp, compared to 0.5 per cent among Jordanian children. In Zaatari camp, however, the prevalence of employment for this group is only slightly higher than for Jordanian children, standing at 0.8 per cent. Thus, while boys aged 9 to 14 in Zaatari camp are looking for work to a much larger extent than Jordanian children, they are rarely able to find a job.
Looking back to March 2011 (Figure 9.3), the estimated prevalence of employment among boys aged 9 to 14 at the time was higher than the current estimate across all communities. Since the reference periods applied for the two points in time are not strictly comparable, using the past week for the current estimate, and around 15 March 2011 for the previous estimate, it is expected that child employment in March 2011 might be somewhat over-estimated. Provided that this bias is of a similar magnitude across communities, however, we may tentatively conclude that estimates from March 2011 indicate a higher prevalence of child employment and labour force participation among Syrian refugees, and that this is at least partly a situation that they brought with them from Syria.
45 See Table 11.1–11.6 and 11.9–11.12 in the tabulation report.
103
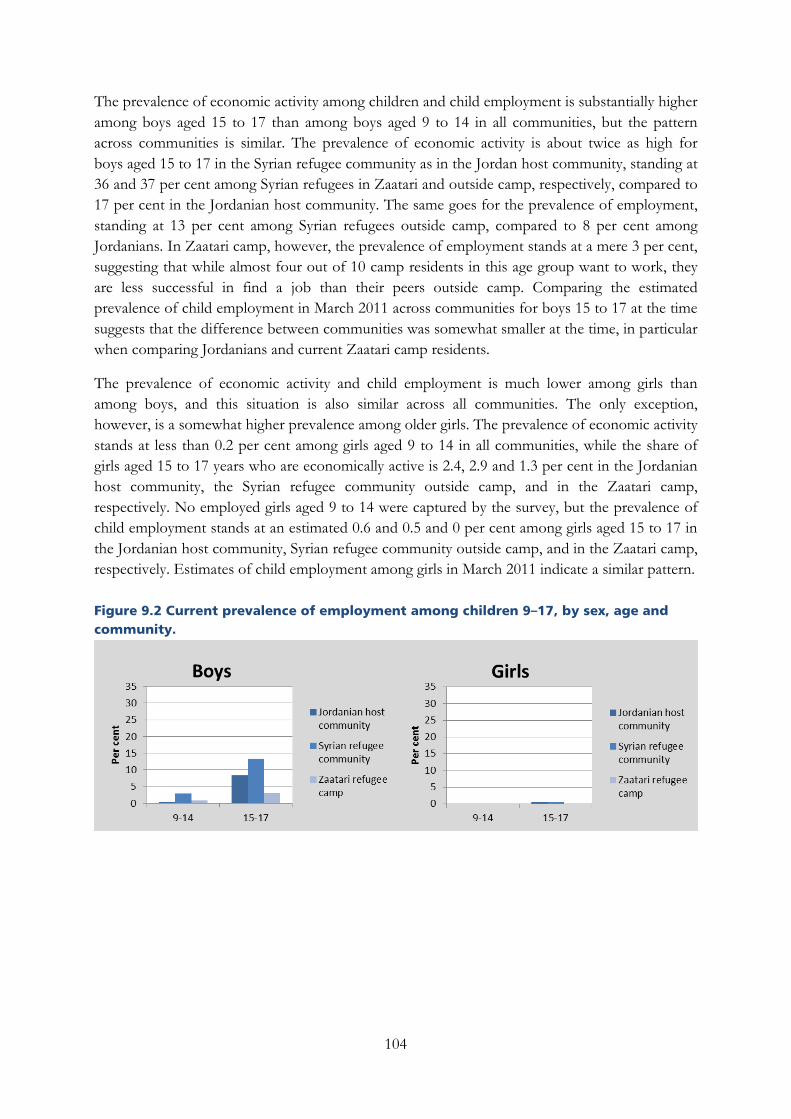
The prevalence of economic activity among children and child employment is substantially higher among boys aged 15 to 17 than among boys aged 9 to 14 in all communities, but the pattern across communities is similar. The prevalence of economic activity is about twice as high for boys aged 15 to 17 in the Syrian refugee community as in the Jordan host community, standing at 36 and 37 per cent among Syrian refugees in Zaatari and outside camp, respectively, compared to 17 per cent in the Jordanian host community. The same goes for the prevalence of employment, standing at 13 per cent among Syrian refugees outside camp, compared to 8 per cent among Jordanians. In Zaatari camp, however, the prevalence of employment stands at a mere 3 per cent, suggesting that while almost four out of 10 camp residents in this age group want to work, they are less successful in find a job than their peers outside camp. Comparing the estimated prevalence of child employment in March 2011 across communities for boys 15 to 17 at the time suggests that the difference between communities was somewhat smaller at the time, in particular when comparing Jordanians and current Zaatari camp residents.
The prevalence of economic activity and child employment is much lower among girls than among boys, and this situation is also similar across all communities. The only exception, however, is a somewhat higher prevalence among older girls. The prevalence of economic activity stands at less than 0.2 per cent among girls aged 9 to 14 in all communities, while the share of girls aged 15 to 17 years who are economically active is 2.4, 2.9 and 1.3 per cent in the Jordanian host community, the Syrian refugee community outside camp, and in the Zaatari camp, respectively. No employed girls aged 9 to 14 were captured by the survey, but the prevalence of child employment stands at an estimated 0.6 and 0.5 and 0 per cent among girls aged 15 to 17 in the Jordanian host community, Syrian refugee community outside camp, and in the Zaatari camp, respectively. Estimates of child employment among girls in March 2011 indicate a similar pattern.
Figure 9.2 Current prevalence of employment among children 9–17, by sex, age and community.
104
Figure 9.3 Prevalence of employment among children 9–17 in March 2011, by sex, age and community.
In the Jordanian host community, labour force participation among boys is highest among children from households in the lower wealth quintiles, and among households whose head has little or no education. In the Syrian refugee community, labour force participation among boys is quite even across all levels of wealth and household head education. Among Jordanian boys, labour force participation is even across urban and rural areas and across the three governorates, while it is somewhat higher in Amman governorate and in urban areas for Syrian refugee boys.
Among both boys and girls in all communities, irrespective of age, child employment is most prevalent among children from households in the lower wealth quintiles. Among boys aged 9 to 14 it is also more prevalent in households where the household head has little or no education. For Jordanian and Syrian refugee boys outside camp aged 15 to 17, child employment is significantly more prevalent in urban than in rural areas, presumably reflecting the higher availability of job opportunities in the cities.
9.3 Schooling and employment46
In the Jordanian host community, school enrolment rates are generally high, standing at 94 per cent for children aged 9 to 17. However, the rates drop to 62 per cent among children actively seeking work, and to 23 per cent among children currently in employment.
Enrolment rates among Syrian refugee children are generally low, standing at 54 per cent for children aged 9 to 17. They are particularly low among economically active children, standing at 8 per cent among currently employed children and 3 per cent among children who are actively looking for work.
Disaggregated by age, the total enrolment rate for Syrian refugee children aged 9 to 15 still in compulsory schooling age stands at 63 per cent, but drops to 18 per cent among currently employed children and 3 per cent among children who are actively looking for work. The total enrolment rate for Syrian refugee children aged 16 to 17 no longer in compulsory schooling age stands at 22 per cent, and drops to 4 per cent among children who are actively looking for work.
46 See Table 11.7, 11.8 and 11.13–11.21 in the tabulation report.
105
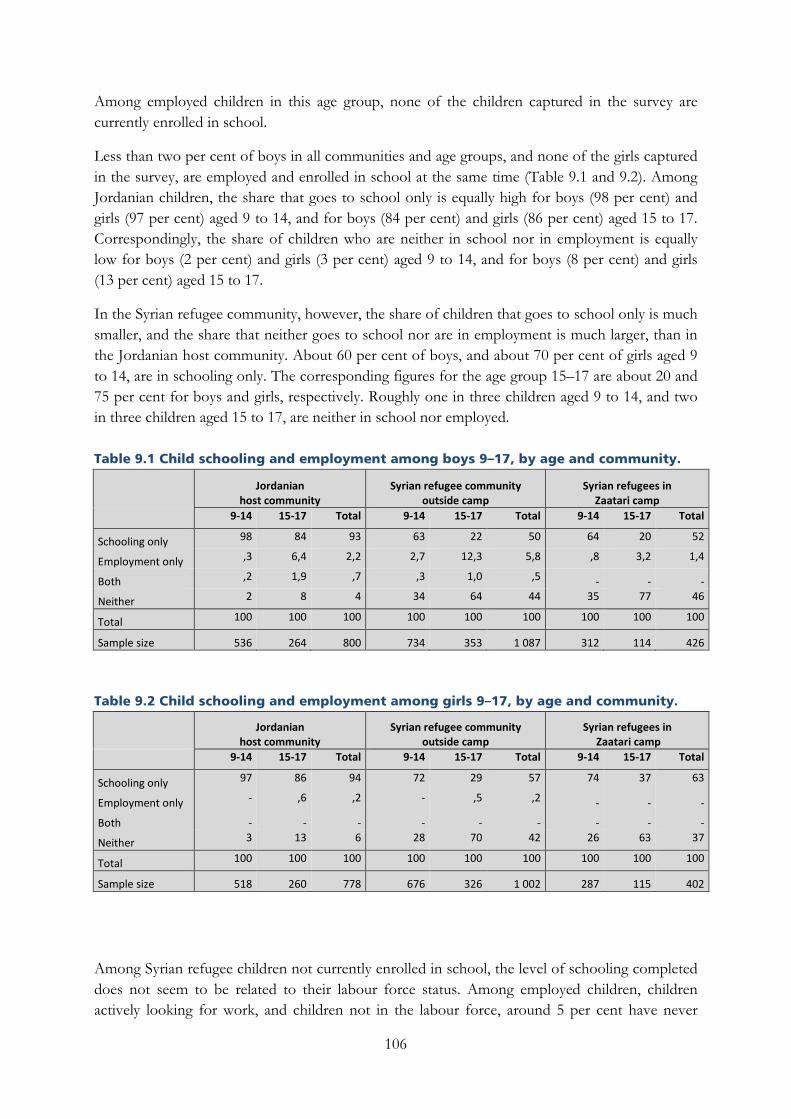
Among employed children in this age group, none of the children captured in the survey are currently enrolled in school.
Less than two per cent of boys in all communities and age groups, and none of the girls captured in the survey, are employed and enrolled in school at the same time (Table 9.1 and 9.2). Among Jordanian children, the share that goes to school only is equally high for boys (98 per cent) and girls (97 per cent) aged 9 to 14, and for boys (84 per cent) and girls (86 per cent) aged 15 to 17. Correspondingly, the share of children who are neither in school nor in employment is equally low for boys (2 per cent) and girls (3 per cent) aged 9 to 14, and for boys (8 per cent) and girls (13 per cent) aged 15 to 17.
In the Syrian refugee community, however, the share of children that goes to school only is much smaller, and the share that neither goes to school nor are in employment is much larger, than in the Jordanian host community. About 60 per cent of boys, and about 70 per cent of girls aged 9 to 14, are in schooling only. The corresponding figures for the age group 15–17 are about 20 and 75 per cent for boys and girls, respectively. Roughly one in three children aged 9 to 14, and two in three children aged 15 to 17, are neither in school nor employed.
Table 9.1 Child schooling and employment among boys 9–17, by age and community.
Jordanian
host community Syrian refugee community
outside camp Syrian refugees in
Zaatari camp
9-14 15-17 Total 9-14 15-17 Total 9-14 15-17 Total
Schooling only 98 84 93 63 22 50 64 20 52
Employment only ,3 6,4 2,2 2,7 12,3 5,8 ,8 3,2 1,4
Both ,2 1,9 ,7 ,3 1,0 ,5 - - -
Neither 2 8 4 34 64 44 35 77 46
Total 100 100 100 100 100 100 100 100 100
Sample size 536 264 800 734 353 1 087 312 114 426
Table 9.2 Child schooling and employment among girls 9–17, by age and community.
Jordanian
host community Syrian refugee community
outside camp Syrian refugees in
Zaatari camp
9-14 15-17 Total 9-14 15-17 Total 9-14 15-17 Total
Schooling only 97 86 94 72 29 57 74 37 63
Employment only - ,6 ,2 - ,5 ,2 - - -
Both - - - - - - - - -
Neither 3 13 6 28 70 42 26 63 37
Total 100 100 100 100 100 100 100 100 100
Sample size 518 260 778 676 326 1 002 287 115 402
Among Syrian refugee children not currently enrolled in school, the level of schooling completed does not seem to be related to their labour force status. Among employed children, children actively looking for work, and children not in the labour force, around 5 per cent have never
106

attended school, 75–80 per cent have attended school but never completed any level, and around 20 per cent have completed primary schooling.
In the qualitative interviews, several Syrian parents expressed that they did not want to take their children out of school but that they had no choice because they needed the income. Regret was expressed by parents who had enrolled their children in school in Jordan and then had to pull their child or children out due to lack of income. Usually there was a change of circumstance that prompted pulling children out of school, for instance the death of a previous income provider or running out of savings. These parents were guilt-ridden but felt that they had no alternative. For other households, child labour seemed to be considered a normal part of life and had been so prior to their arrival in Jordan.
9.4 Job characteristics47
Almost all employed children from Syrian refugee households outside camp are employed in the private sector (97 per cent) and as paid employees (97 per cent). Among Jordanian children the corresponding figures are 87 and 81 per cent, respectively, while 6 per cent are employed in family businesses, and 7 per cent in the other sectors.
In terms of employment by industry, most of the employed Syrian refugee children are employed in the industries of construction (37 per cent), wholesale and retail trade and repairs (19 per cent), accommodation and food services (18 per cent), and manufacturing (16 per cent). Younger children (9 to 14) are mostly employed in the accommodation and food service industry (37 per cent), and older children (15 to 17) in the manufacturing industry (48 per cent). Among Jordanian children, employment in the manufacturing industry is most common (60 per cent). The construction and manufacturing industries are where children are particularly at risk of being exposed to hazardous conditions with potentially detrimental consequences for their health, such as hazardous substances, high noise or vibration, and working in high or confined spaces. The probability that many of these children are engaged in child labour is therefore substantial.
In terms of employment by occupation, one in two employed children, both in the refugee and host communities, are employed as craft and related trades workers. The rest are primarily in service and sales (17 per cent among Jordanian and 32 per cent among Syrians) or elementary occupations (17–19 per cent). Among Syrian children, the youngest (9 to 14) are mostly employed as service and sales workers (54 per cent), and older children (15 to 17) as craft and related trade workers (59 per cent).
9.5 Working conditions48
Employed children tend to work many days per week and long hours, and for a large majority of employed children, including more than eight out of 10 children aged 9 to 14, their work hours
47 See Table 11.22–11.25 in the tabulation report. 48 See Table 11.26–11.32 in the tabulation report.
107

make their employment qualify as child labour. Most children make 1–199 JD per month, often contributing significantly to their household’s total income.
None of the working children aged 9 to 14 have a written contract. This is to be expected for children below the minimum working age, and whose work is illegal according to Jordanian law. However, about one third of Syrian refugee children in this age range have their work regulated by an oral agreement, compared to two thirds of Jordanian children.}
Among working children aged 15 to 17, two per cent of Syrian refugees outside camp and 18 per cent of Jordanians have a written contract, 61 per cent of Syrian refugees and 48 per cent of Jordanians have an oral agreement, and 37 per cent of Syrian refugees and 34 per cent of Jordanians have neither.
Table 9.3 Hours worked past week among employed children 9–17, by age and community.
Jordanian host community Syrian refugee community outside camp 9-11 12-15 16-17 9-11 12-15 16-17 Absent - 4 4 - 5 2 1-13 hours - 5 15 - 11 11 14-30 hours - 21 16 100 11 23 31-42 hours - 33 12 - 2 4 43-59 hours - 28 44 - 21 18 60+ hours - 8 9 - 49 41 Total - 100 100 100 100 100 Sample size 0 10 21 1 29 30
The darkest shade marks the share of employed children whose work hours qualify as child labour according to the definition of the Jordanian Department of Statistics (DOS), the lighter shade marks children working more than permitted by Jordanin law but not enough to qualify as child labor.
Employed children in both communities also tend to work long hours (Table 9.3). In the Syrian refugee community outside camp, an estimated 63 per cent worked 43 hours or more in the previous week, of which 44 per cent worked more than 60 hours. Fifty-eight per cent of the employed Jordanian children worked 43 hours or more, and 9 per cent of the children worked 60 hours or more.
For a large majority of employed children, their working hours qualify as child labour, as defined by the Jordanian Labour Law. Among employed children aged 12 to 15, 84 per cent in the Syrian refugee community and 91 per cent in the Jordanian host community work more than 13 hours per week. According to the Labour Law, working children in this age group are all working illegally, but children working less than 14 hours are not classified as performing child labour. Among employed children aged 16 to 17, 59 per cent in the Syrian refugee community and 53 per cent in the Jordanian host community worked more than 42 hours, amounting to hazardous work, and thereby considered child labour. An additional 12 per cent in this age group in the
108
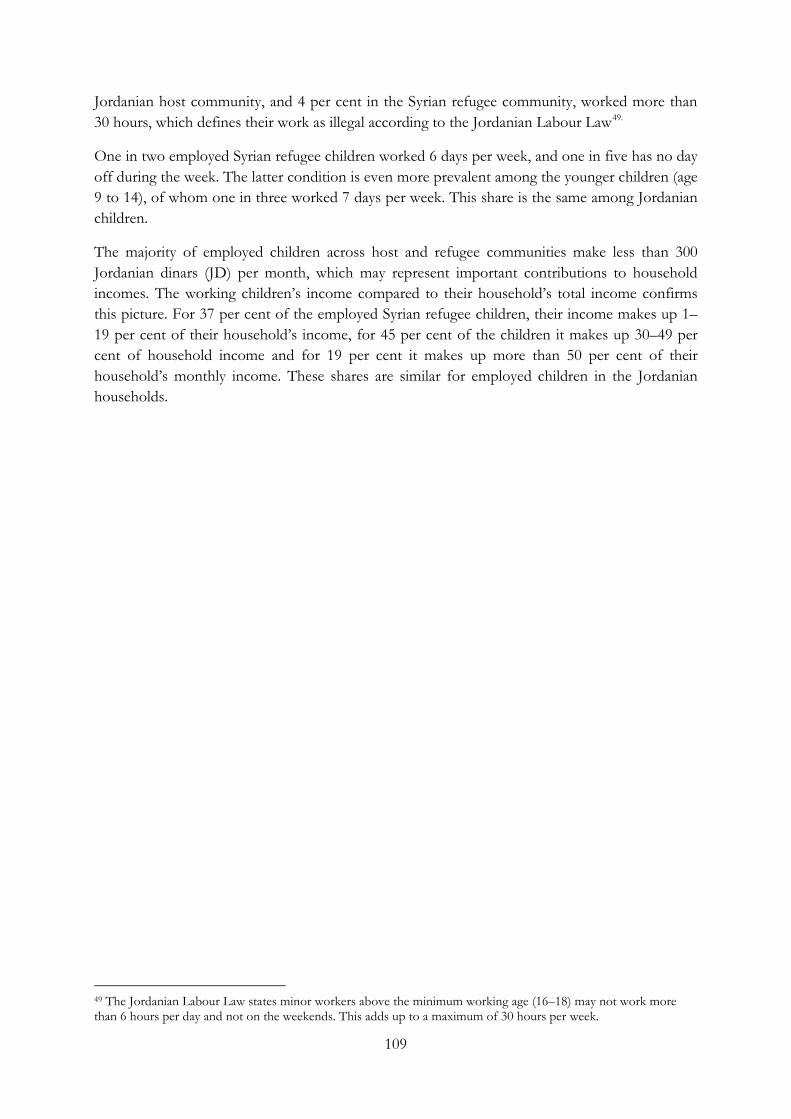
Jordanian host community, and 4 per cent in the Syrian refugee community, worked more than 30 hours, which defines their work as illegal according to the Jordanian Labour Law49.
One in two employed Syrian refugee children worked 6 days per week, and one in five has no day off during the week. The latter condition is even more prevalent among the younger children (age 9 to 14), of whom one in three worked 7 days per week. This share is the same among Jordanian children.
The majority of employed children across host and refugee communities make less than 300 Jordanian dinars (JD) per month, which may represent important contributions to household incomes. The working children’s income compared to their household’s total income confirms this picture. For 37 per cent of the employed Syrian refugee children, their income makes up 1–19 per cent of their household’s income, for 45 per cent of the children it makes up 30–49 per cent of household income and for 19 per cent it makes up more than 50 per cent of their household’s monthly income. These shares are similar for employed children in the Jordanian households.
49 The Jordanian Labour Law states minor workers above the minimum working age (16–18) may not work more than 6 hours per day and not on the weekends. This adds up to a maximum of 30 hours per week.
109

Chapter 10 Perceptions and attitudes among workers towards the labour market
This chapter outlines perceptions and attitudes among workers towards various aspects of the labour market, including drivers and effects of increased competition for work, and exploitation of workers. It also touches upon the levels of trust among workers in the refugee and host communities.
There is widespread agreement across communities that Syrian workers are willing to accept jobs and salaries which Jordanians will not accept. This could indicate that: (i) Syrian refugees take many of the jobs that Jordanians do not want, and thus that the refugees to some extent do not compete with Jordanians for the same jobs; or (ii) that the increased presence of Syrian refugees in parts of the labour market has led to a lowering of wages and working conditions to a level which Jordanians no longer will accept. Indeed, many Jordanian workers believe Syrian refugee workers are taking jobs from Jordanians and pushing down their wages, and workers across all communities fear the consequences of increased competition in the labour market.
There is also a widespread agreement that Syrian refugee workers are being exploited. Furthermore, Jordanian workers exhibit a lower level of trust in Syrians than the other way around, and while a large share of Jordanian workers are comfortable living in close proximity to Syrians, a majority believe the Syrian refugee influx is detrimental to the country and should be limited.
10.1 Competition and exploitation50
Findings from the qualitative interviews suggest two partially competing hypotheses concerning the competition for jobs between Syrian refugees and Jordanians. First, many Jordanians believe that Syrians are taking jobs from local Jordanians. Other Jordanians, however, express the opinion that Syrians and Jordanians are not competing for the same jobs.
The latter hypothesis finds some tentative support in the finding that both Syrian refugees (over 50 per cent) and Jordanian workers (over 70 per cent) agree that Jordanians are unwilling to take a number of jobs that they believe are unacceptable for them, while there is widespread agreement between Syrian refugees and Jordanians that Syrians will take any kind of job (over 80 per cent agree on this in each community). Additionally, Syrian refugee workers are willing to accept lower salaries than Jordanians. The share of workers that would accept a minimum salary of less than 10 Jordanian dinars (JD) per day is significantly larger among Syrian refugee workers (20 per cent) than among Jordanian workers (5 per cent).
50 See Table 9.1–9.20 in the tabulation report.
110
Regarding the former hypothesis, a significant share of workers in all communities fears the consequences of increased competition in the labour market. Two in three Jordanian workers and one in two Syrian refugee workers agree that Syrians are increasingly opening up their own businesses and employing only Syrians, and 95 per cent of Jordanian workers agree that Syrians are, to some extent or to a great extent, taking jobs from Jordanians.
Not very surprisingly, Syrian refugee workers express more uncertainty about their prospects in the labour market than Jordanians. One in two Syrian refugee workers and one in three Jordanian workers fear having their salary reduced in the coming years due to increasing competition. Six out of 10 Syrian refugee workers and one in two Jordanian workers perceive the possibility of finding an acceptable replacement job if they lose their current job as being low (‘very difficult’). In addition, a larger portion of Syrian refugees outside camps (71 per cent), compared to Syrian refugee workers in Zaatari camp (53 per cent) and Jordanian workers (63 per cent), do not feel they will be able to switch to a better job in the near future.
The primary disagreement between workers in host and refugee communities is related to the role Syrian workers have in pushing down wages. A majority of Syrian refugees (57 per cent in Zaatari camp and 56 per cent outside camps) do not agree that Syrians are pushing wages down, but 93 per cent of Jordanians believe that they are. Eighty-five per cent of Jordanians, compared to 30 per cent of Syrian refugee workers, believe that Syrians are pushing down wages of Egyptian workers.
Syrians are considered hard workers, and both Syrian refugee workers (over 90 per cent) and Jordanian workers (over 70 per cent) agree that this is the case. When asked to rank Syrian, Egyptian and Jordanian workers by how hard they work, however, one in two Jordanian workers think Egyptians are most hard working. Two in three Syrian refugee workers think Syrian workers are most hard working. When ranking workers of the different nationalities by reliability, results remain similar, with one in two Jordanians considering Egyptian workers more reliable than both Jordanian and Syrian workers, and two in three Syrian refugee workers finding Syrian workers more reliable than both Jordanian and Egyptian workers. Less than 5 per cent of Syrian refugee workers consider Egyptian workers most reliable or most hardworking, and less than 15 per cent of Jordanian workers consider Syrian workers the most reliable or hardworking.
The perception that Syrian workers are being exploited by employers is widespread. Over 70 per cent of Syrian refugees and 50 per cent of Jordanian workers believe this to be the case. This mirrors previously outlined findings from the qualitative interviews. Syrian respondents may be reluctant to express experiences of exploitation or violation by their own employer, as indicated by the small share admitting to have experienced conflict or having their contract or oral agreement broken, but tending to emphasize that they know of others who have been exploited.
Approximately 73 per cent of Syrian refugees outside camps and 53 per cent of Jordanians believe that Jordanian employers rather than Syrian employers exploit Syrian employees, but only 38 per cent of Syrian refugees in Zaatari camp agree with this claim. Sixty-two per cent of Syrian refugees inside the camp feel that Syrian employers exploit workers more than Jordanian employers. This discrepancy may be explained by the fact that Syrians inside refugee camps are mostly hired by other Syrians and therefore experience exploitation from Syrian employers more than Jordanians.
111
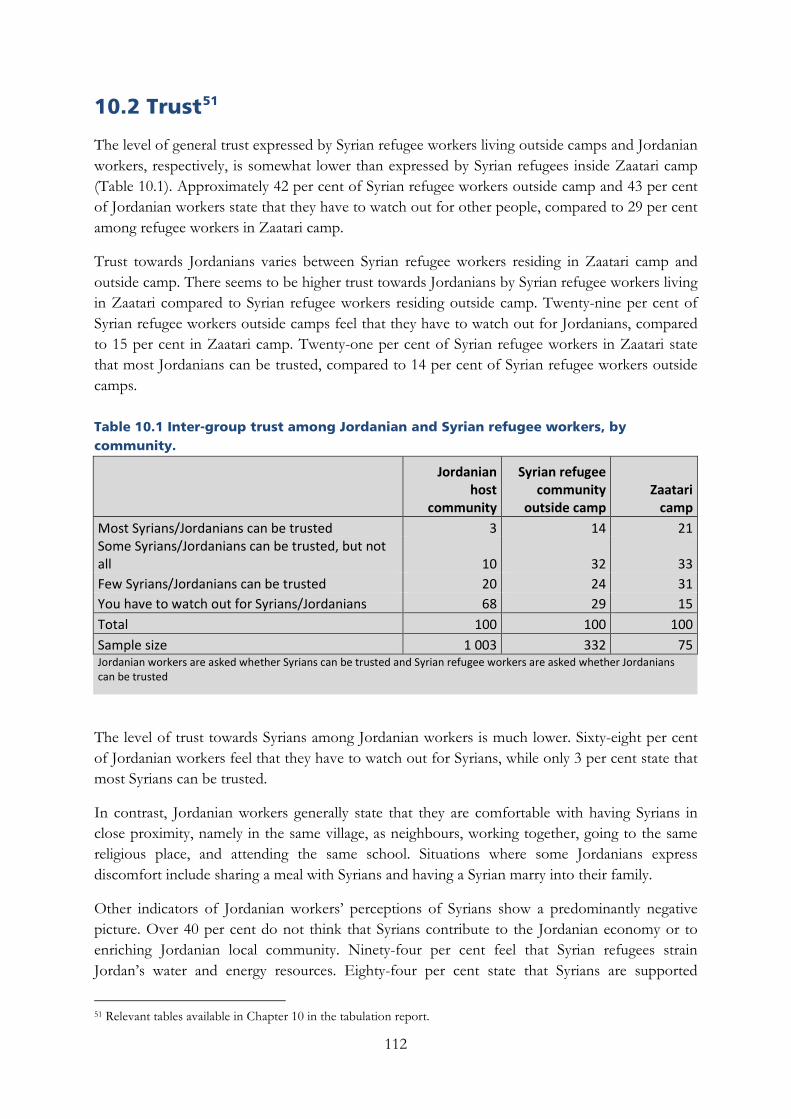
10.2 Trust51
The level of general trust expressed by Syrian refugee workers living outside camps and Jordanian workers, respectively, is somewhat lower than expressed by Syrian refugees inside Zaatari camp (Table 10.1). Approximately 42 per cent of Syrian refugee workers outside camp and 43 per cent of Jordanian workers state that they have to watch out for other people, compared to 29 per cent among refugee workers in Zaatari camp.
Trust towards Jordanians varies between Syrian refugee workers residing in Zaatari camp and outside camp. There seems to be higher trust towards Jordanians by Syrian refugee workers living in Zaatari compared to Syrian refugee workers residing outside camp. Twenty-nine per cent of Syrian refugee workers outside camps feel that they have to watch out for Jordanians, compared to 15 per cent in Zaatari camp. Twenty-one per cent of Syrian refugee workers in Zaatari state that most Jordanians can be trusted, compared to 14 per cent of Syrian refugee workers outside camps.
Table 10.1 Inter-group trust among Jordanian and Syrian refugee workers, by community.
Jordanian host
community
Syrian refugee community
outside camp Zaatari
camp Most Syrians/Jordanians can be trusted 3 14 21 Some Syrians/Jordanians can be trusted, but not all 10 32 33 Few Syrians/Jordanians can be trusted 20 24 31 You have to watch out for Syrians/Jordanians 68 29 15 Total 100 100 100 Sample size 1 003 332 75 Jordanian workers are asked whether Syrians can be trusted and Syrian refugee workers are asked whether Jordanians can be trusted
The level of trust towards Syrians among Jordanian workers is much lower. Sixty-eight per cent of Jordanian workers feel that they have to watch out for Syrians, while only 3 per cent state that most Syrians can be trusted.
In contrast, Jordanian workers generally state that they are comfortable with having Syrians in close proximity, namely in the same village, as neighbours, working together, going to the same religious place, and attending the same school. Situations where some Jordanians express discomfort include sharing a meal with Syrians and having a Syrian marry into their family.
Other indicators of Jordanian workers’ perceptions of Syrians show a predominantly negative picture. Over 40 per cent do not think that Syrians contribute to the Jordanian economy or to enriching Jordanian local community. Ninety-four per cent feel that Syrian refugees strain Jordan’s water and energy resources. Eighty-four per cent state that Syrians are supported
51 Relevant tables available in Chapter 10 in the tabulation report.
112

financially to an unfair degree, and 80 per cent feel that Syrians pose a threat to national security and stability.
A significant portion of Jordanian workers (85 per cent) feel that Syrians should not be allowed to enter Jordan freely and 65 per cent state that all Syrian refugees in Jordan should live in refugee camps. Nine out of ten Jordanian workers state that the international community should carry the economic costs of hosting Syrian refugees. Finally, 45 per cent of the Jordanian workers interviewed believe that the Syrian refugees will never return to Syria, compared to less than 20 per cent of Syrian refugee workers.
113
Chapter 11 Conclusions and recommendations
11.1 General conclusions
Four main types of implications of the influx of Syrian refugees on the Jordanian labour market can be derived from the findings of this study:
A loss of opportunity for increased employment of Jordanians in newly emerged low-skilled jobs: The majority of Syrian refugees who have obtained work in Jordan seem to occupy jobs that have emerged during the arrival of refugees from Syria, that is, primarily low-skilled/lower wage jobs in an expanded informal sector. Whether these jobs have emerged as a result of government policies directed towards dealing with the relatively large unemployment rates that existed also prior to the influx of Syrian refugees, and in particular the high rates among youth, or as a consequence of a growing aid economy and increased demands due to the influx of Syrians, is difficult to assess. In any case, it can be argued that many of these jobs could have been available to Jordanians, particularly youth, if they were not occupied by Syrian refugees, and that a prime cause of this is that Jordanians are out-competed by the refugees who are willing to accept considerably lower wages and poorer working conditions than Jordanians. Clear signs of this can be seen in the construction industry, where Syrian refugees have benefited from an increasing number of jobs in the sector, while the share of Jordanians working in construction has slightly decreased.
Increased unemployment and competition for existing jobs: There are some signs of Syrian refugees also entering into jobs that were part of the job market that existed prior to their arrival, and hence that they do to some degree push Jordanians out of the labour market. A general sign of this is the increase in the unemployment rate of Jordanians from 14.5 to 22.1 per cent between 2011 and 2014, and particularly the increase from 19 to 35 per cent unemployment among the youngest age group of 15–24 years, indicating that it has become more difficult for young and new Jordanian workers to enter the labour market. A more specific sign is the increase in employment of Syrians in the construction industry from 2011 to 2014 in combination with a relatively high number of Jordanian workers who have dropped out of this sector since the start of the Syrian crisis. A similar trend of increased competition can be sensed for the wholesale and retail sector, in which a large share of Syrian refugees living outside camps has found jobs (23 per cent). About 18 per cent of the Jordanian workers are employed in the same sector, which is similar to the share who worked in this sector prior to the crisis in Syria and thus another sign of “loss of opportunities” as described above. However, signs of crowding out do not seem to be a general implication of the influx of Syrians in other sectors up to date, but, again, more a problem related to “loss of opportunities” as described above.
Future threats of crowding out in the labour market: Although signs of crowding out are relatively modest in most sectors at present, with clearer signs in the construction and wholesale
114
and retail sectors, the low participation rate and high unemployment rate of Syrian refugees poses a serious threat to the labour market in future. It is reasonable to assume that access to humanitarian aid and other types of support prevent many Syrian refugees from entering the labour market today. If no measures are taken, a large number of these refugees will potentially enter into the labour market once the humanitarian aid is scaled down and ultimately stopped. At the same time, it is a likely scenario that the conflict in Syria will last for a long time, and that many Syrians will remain in Jordan for years to come.
An overall deterioration in working conditions leading to increased decent work deficits in Jordan: A main finding of the study is that Syrians are willing to accept lower wages and harsher working conditions compared to Jordanians. The impact of this is not just crowding out the Jordanians but also an increased informalisation of the Jordanian labour market making compliance with labour standards a serious threat for all workers alike. Deteriorating labour standards also put more strain on the Jordanian authorities in terms of their ability to enforce existing labour laws such as compliance with the minimum wage.
11.2 Policy recommendations
In order to address these main types of implications of the influx of Syrian refugees on the Jordanian labour market, the following key policy recommendations are given:
Address and formalize the informal economy and reduce informal employment: All four main types of implications presented above are strongly related to size and conditions of the informal economy and to informal employment. A large share of low-skill and low wage jobs are found in the informal economic sector, and it is no surprise that practically all Syrian refugees are informally employed in this sector given their background and their status as refugees. However, the informality of the market gives the refugees a comparative advantage over Jordanians who might compete for the same jobs, due to their willingness to accept lower wages and poorer conditions. Furthermore, the unregulated and strongly competitive nature of the informal economy also leads to unsustainable conditions for the workers who become informally employed, including the Syrian refugees themselves. In addition, the large and seemingly expanding informal employment sector is characterized by low productivity and few direct contributions to the national economy. Findings from this and other studies also clearly show that minimum wage limits are not respected in the informal sector in general, and that high numbers of Syrian refugees, and probably also many vulnerable Jordanians, are paid far less than the stated minimum wages in Jordan. In addition to addressing informal employment more widely, direct and short-term measures should be implemented to deal with this problem specifically.
Encourage private sector to employ Syrian refugees in sectors where migrant workers are permitted to work One step towards dealing with the problem of informalisation, and the negative labour condition aspects associated with the informal labour market, would be to actively encourage formal employment of Syrian refugees in sectors that are open to migrant workers. A controlled inclusion of Syrian refugee workers into the Jordanian labour market has the potential of
115
lowering some of the present tensions in the labour market as identified in this study. It could also contribute to a more regulated labour market in the future, with particular respect to a situation where humanitarian aid is being scaled down and the pressure on the labour market from Syrian refugees still present in Jordan is likely to increase. Encouragement of the private sector might play an important role in such a strategy, but an encouragement strategy also has to be closely coordinated with adaptations in the regulatory system, and with the authorities who issue work permits. Clarify realistic scenarios for the development of the Jordanian labour market as basis for any strategy on the labour market: The key to any successful strategy is to base it on realistic scenarios, and to utilize the identified actors and forces in play to contribute towards realistic visions. As an example, it may be recommended that two overarching premises should guide any policy related to Syrian refugees’ relationship with the Jordanian labour market: 1) Syrian refugees will most probably be in Jordan and make implications on the labour market for many years to come, and 2) focus should be kept on how Syrian refugees involvement in the Jordanian labour market can be formalised in ways that could be beneficial for the Jordanian economy. And here, given a possible protracted situation of Syrian refugees in Jordan and also in order to avoid even larger challenges when development aid and international support are decreased, the sooner this issue is addressed the better
Maximize the short-term employment potential of the aid economy and coordinate measures between international community and the government of Jordan: The high unemployment rates among Jordanians, particularly youth, as well as among Syrian refugees should be addressed by maximizing short-term employment and capacity building opportunities in relation to the activities of development aid organizations in the study governorates. This could directly create new job opportunities for Jordanians as well as ease pressure in other parts of the labour market by livelihoods support to Syrian refugees. It could also contribute to boosting local economies and thereby create additional jobs. Attention must however be given to the sustainability of such interventions to avoid potential collapse when development aid activities are scaled down in the future. Furthermore, international organizations and donors are key actors that influence the Jordanian labour market directly and indirectly. Coordination of these actors’ activities related to the labour market is important to maximize efforts towards dealing with identified challenges, and a clear and comprehensive national strategy is important in guiding international efforts in a coordinated direction and according to the visions of the Jordanian government.
Improve linkages with the National Employment Strategy The National Employment Strategy (NES) provides a vision for an inclusive and productive labour market. The Strategy document is complemented by an Action Plan, which was approved by the Council of Ministers in May 2011. The final Action Plan was then further elaborated into an Implementation Plan which outlined for each action the main public agency responsible for oversight and delivery of the action, other implementation partners, resources required and a timetable. Currently the NES Action Plan, if adjusted only slightly, can provide the right framework for Jordan’s best response to the labour market impact of Syrian refugee crisis. It is critical to link this response with the existing national policy framework. For example, there are
116
currently a large number of livelihoods programmes in Jordan addressing both Jordanian host communities as well as Syrian refugees. Coordination and coherence between these different programmes is quite pertinent. There is a definite need for a national coordinating mechanism led by the Ministry of Labour and linked to NES implementation. This also should include ministerial collaboration and coordination in establishing a common monitoring and evaluation system in order to build sustainable processes at the national level. Otherwise the impact of the efforts addressing host communities and refugees will remain limited and unsustainable.
Promote school enrolment among Syrian children: While the Jordanian authorities have generously opened Jordanian schools for Syrian children, the low school enrolment rate among Syrian children have both short- and long-term implications on the labour market. First, it contributes to a relatively high child labour activity at present, and second, it has implications for the long term employment opportunities for the children not attending school, possibly in the Jordanian labour market. Strengthening the national framework of child labour to Syrian child labourers can help to implement a comprehensive and integrated policy on the labour market.
117
References
Better Work Jordan, 2013: Guide to Jordanian Labour Law for the Garment Industry. International Labour Office; International Finance Corporation. Geneva: ILO. Accessed 20 September 2013: http://www.ilo.org/wcmsp5/groups/public/---arabstates/---ro-beirut/documents/publication/wcms_218390.pdf.
Bidinger et.al. 2014: Protecting Syrian Refugees: Laws, Policies, and Global Responsibility Sharing. Boston University School of Law: http://www.bu.edu/law/central/jd/programs/clinics/international-human-rights/documents/FINALFullReport.pdf
Central Bureau of Statistics and Unicef, 2008: Multiple Indicator Cluster Survey 2006. Monitoring the Situation of Cchildren and Women: http://www.childinfo.org/files/MICS3_Syria_FinalReport_2006_Eng.pdf.
Government of Jordan, 2010: Jordan’s National Employment Strategy 2011-2020: http://www.google.no/url?sa=t&rct=j&q=&esrc=s&frm=1&source=web&cd=1&ved=0CB0QFjAA&url=http%3A%2F%2Fdata.unhcr.org%2Fsyrianrefugees%2Fadmin%2Fdownload.php%3Fid%3D4233&ei=vSZzVJC9B8XDPPeHgOgG&usg=AFQjCNEJhEtomZD2rf1GOHS3TcP9hVURdg&bvm=bv.80185997,d.ZWU
ICLS, 1993: Resolution concerning statistics of employment in the informal sector. Fifteenth International Conference of Labour Statisticians. Accessed 11 September 2014: http://www.ilo.org/wcmsp5/groups/public/---dgreports/---stat/documents/normativeinstrument/wcms_087484.pdf.
ICLS, 2003: Guidelines concerning a statistical definition of informal employment. Seventeenth International Conference of Labour Statisticians. Accessed 11 September 2014: http://www.ilo.org/wcmsp5/groups/public/---dgreports/---stat/documents/normative instrument/wcms_087622.pdf.
ICLS, 2008: Resolution concerning statistics of child labour. Eighteenth International Conference of Labour Statisticians. Accessed 13 August 2014: http://www.ilo.org/wcmsp5/groups/public/---dgreports/---stat/documents/normative instrument/wcms_112458.pdf.
ILO, 1973: Convention concerning Minimum Age for Admission to Employment (No. 138). Fifty-eighth International Labour Conference Session. Accessed 7 June 2014: http://www.ilo.org/dyn/normlex/en/f?p=NORMLEXPUB:12100:0::NO:12100:P12100_ILO_CODE:C138.
ILO, 1999: Convention concerning the Prohibition and Immediate Action for the Elimination of the Worst Forms of Child Labour (No. 182). Eighty-seventh International Labour Conference Session. Accessed 6 June 2014: http://www.ilo.org/dyn/normlex/en/f?p=NORMLEXPUB:12100:0::NO::P12100_ILO_CODE:C182.
118
ILO, 2008: Resolution Concerning Updating the International Standard Classification of Occupations. Accessed 15 May 2014: http://www.ilo.org/public/english/bureau/stat/isco/docs/resol08.pdf.
ILO, 2009: Working Children in the Hashemite Kingdom of Jordan: Results of the 2007 Child Labour Survey. Meltem Dayioglu; International Labour Office. Geneva: ILO. Accessed 6 June 2014: http://www.ilo.org/ipec/Informationresources/WCMS_IPEC_PUB_12013/lang--en/index.htm.
ILO (2010). Accelerating action against child labour. Global Report under the follow-up of the ILO Declaration on Fundaental Principles and Rights at Work. Ninety-ninth International Labuor Conference Session. Accessed 5 June 2014, http://www.ilo.org/wcmsp5/groups/public/---dgreports/---dcomm/documents/publication/wcms_126752.pdf.
ILO, 2014: The impact of the Syrian refugee crisis on the labour market in Jordan: a preliminary analysis. ILO Regional Office for Arab States, Beirut
Rashad, Hoda and Zaky, Hassan. 2013: A Comparative Analysis of Fertility Plateau in Egypt, Syria and Jordan: Policy Implications, Social Research Center, The American University in Cairo. Accessed 12 September 2014: http://www.aucegypt.edu/research/src/Documents/Fertility_Plateau/A%20Comparative%20Analysis%20of%20Fertility%20Plateau.pdf.
Social Security Law for the year 2010. Temporary Law No. (7). Social Security Corporation. Government of Jordan. Accessed 11 September 2014: http://www.ilo.org/dyn/natlex/docs/ELECTRONIC/90791/104877/F-1376300373/temporary%20law%207%20of%202010%20on%20social%20security.pdf.
UN, 1989: Convention on the rights of the child. General Assembly resolution 44/25. Accessed 12 September 2014: http://www.ohchr.org/en/professionalinterest/pages/crc.aspx.
UNESCO, 2014: Education (full dataset). Accessed 10.September 2014: http://data.uis.unesco.org/Index.aspx?queryid=120.
UNDESA, 2008: International Standard Industrial Classification of All Economic Activities. Revision 4. United Nations, Department of Economic and Social Affairs. Accessed 15 May 2014: http://unstats.un.org/unsd/publication/seriesM/seriesm_4rev4e.pdf.
UNDESA Population Division, 2012: World Population Prospects: The 2012 Revision. United Nations, Department of Economic and Social Affairs, Popluation Division, Population Estimated and Projections Section. Accessed 10 September: http://esa.un.org/unpd/wpp/index.htm.
UNDESA, 2013: Definition of youth. United Nations Department of Economic and Social Affairs. Accessed 6 June 2014: http://www.un.org/esa/socdev/documents/youth/fact-sheets/youth-definition.pdf
119

Washington Group, 2009: The Measurement of Disability: Recommendations for the 2010 Round of Censuses. Washington Group on Disability Statistics. Accessed 15 September 2013: http://www.cdc.gov/nchs/data/washington_group/recommendations_for_disability_measurement.pdf.
120
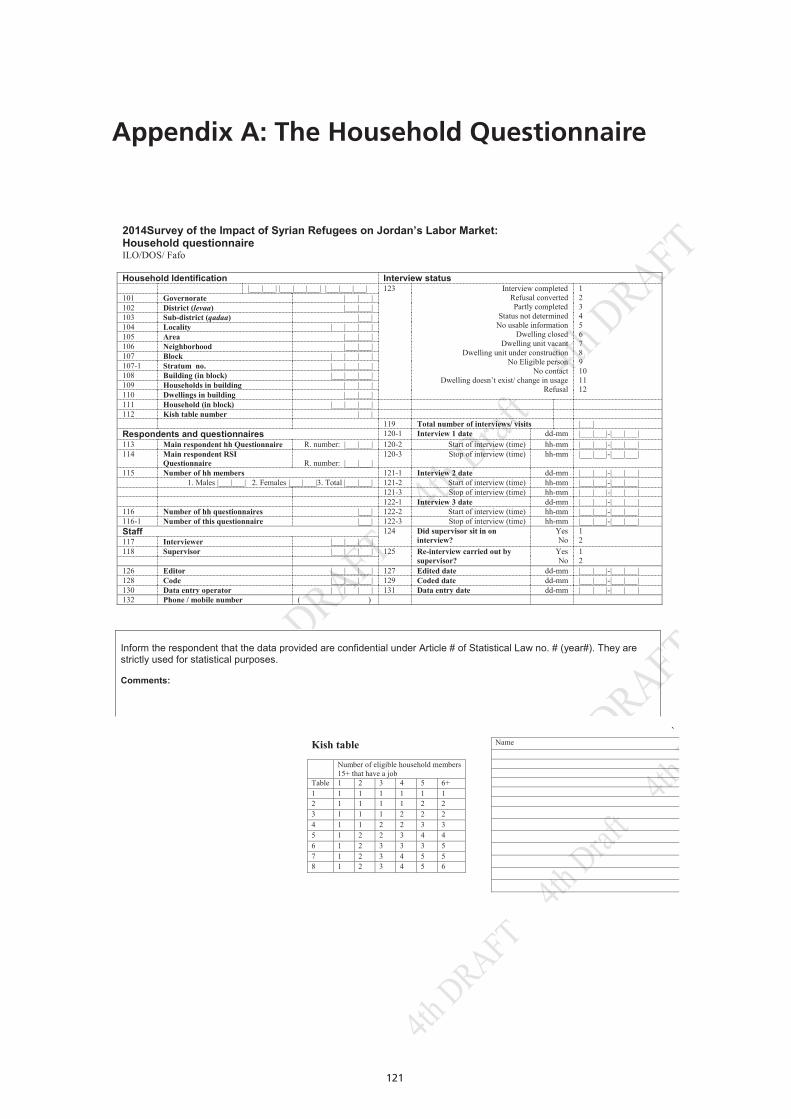
121
2014Survey of the Impact of Syrian Refugees on Jordan’s Labor Market:Household questionnaireILO/DOS/ Fafo
Household Identification Interview status|___|___| |___|___|___| |___|___|___| 123 Interview completed
Refusal convertedPartly completed
Status not determinedNo usable information
Dwelling closedDwelling unit vacant
Dwelling unit under constructionNo Eligible person
No contactDwelling doesn’t exist/ change in usage
Refusal
123456789101112
101 Governorate |___|___|102 District (levaa) |___|___|103 Sub-district (qadaa) |___|104 Locality |___|___|___|105 Area |___|___|106 Neighborhood |___|___|107 Block |___|___|___|107-1 Stratum no. |___|___|___|108 Building (in block) |___|___|___|109 Households in building |___|___|110 Dwellings in building |___|___|111 Household (in block) |___|___|___|112 Kish table number |___|
119 Total number of interviews/ visits |___|Respondents and questionnaires 120-1 Interview 1 date dd-mm |___|___|-|___|___|113 Main respondent hh Questionnaire R. number: |___|___| 120-2 Start of interview (time) hh-mm |___|___|-|___|___|114 Main respondent RSI
Questionnaire R. number: |___|___|120-3 Stop of interview (time) hh-mm |___|___|-|___|___|
115 Number of hh members 121-1 Interview 2 date dd-mm |___|___|-|___|___|1. Males |___|___| 2. Females |___|___|3. Total |___|___| 121-2 Start of interview (time) hh-mm |___|___|-|___|___|
121-3 Stop of interview (time) hh-mm |___|___|-|___|___|122-1 Interview 3 date dd-mm |___|___|-|___|___|
116 Number of hh questionnaires |___| 122-2 Start of interview (time) hh-mm |___|___|-|___|___|116-1 Number of this questionnaire |___| 122-3 Stop of interview (time) hh-mm |___|___|-|___|___|Staff 124 Did supervisor sit in on
interview?YesNo
12117 Interviewer |___|___|___|
118 Supervisor |___|___|___| 125 Re-interview carried out by supervisor?
YesNo
12
126 Editor |___|___|___| 127 Edited date dd-mm |___|___|-|___|___|128 Code |___|___|___| 129 Coded date dd-mm |___|___|-|___|___|130 Data entry operator |___|___|___| 131 Data entry date dd-mm |___|___|-|___|___|132 Phone / mobile number ( )
1Version: 22 August 2013
Appendix A: The Household Questionnaire
Inform the respondent that the data provided are confidential under Article # of Statistical Law no. # (year#). They are strictly used for statistical purposes.
Comments:
2Version: 22 August 2013
RSI selection form: Household members (aged 15+) that currently have a job
Kish table
Number of eligible household members 15+ that have a job
Table 1 2 3 4 5 6+1 1 1 1 1 1 12 1 1 1 1 2 23 1 1 1 2 2 24 1 1 2 2 3 35 1 2 2 3 4 46 1 2 3 3 3 57 1 2 3 4 5 58 1 2 3 4 5 6
Name Gender Age Selected
3Version: 22 August 2013
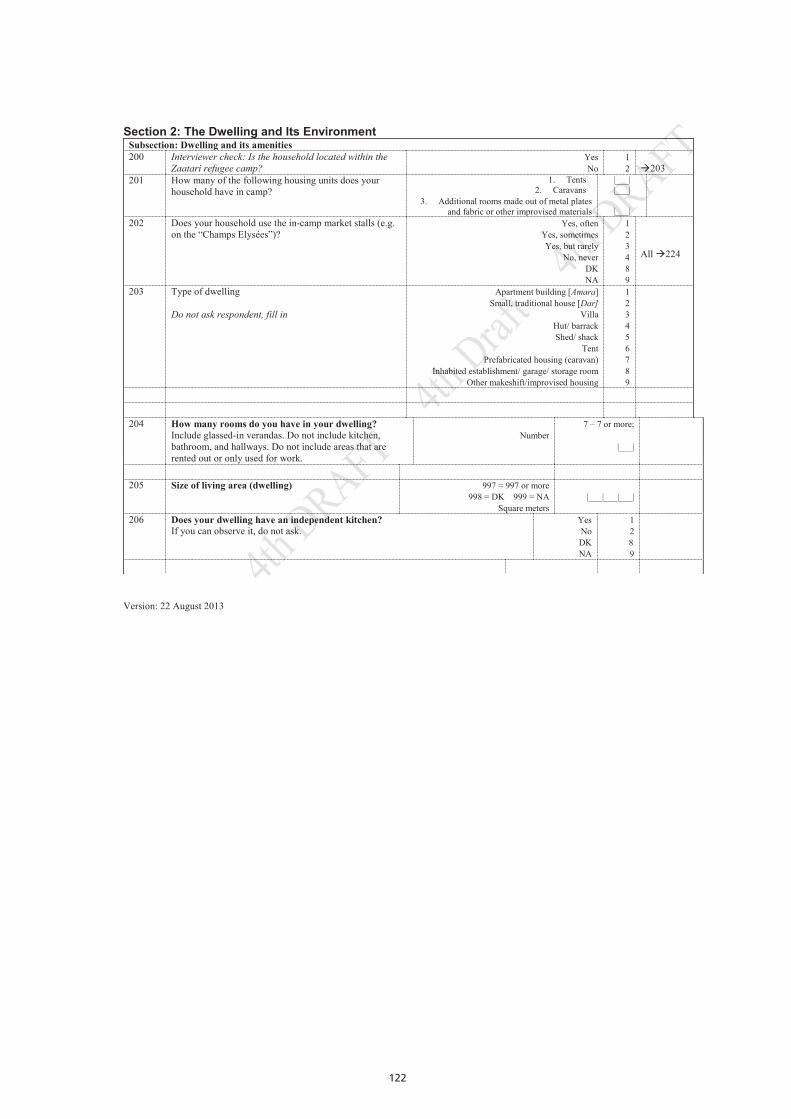
122
Section 2: The Dwelling and Its Environment Subsection: Dwelling and its amenities200 Interviewer check: Is the household located within the
Zaatari refugee camp?YesNo
12 203
201 How many of the following housing units does your household have in camp?
1. Tents2. Caravans
3. Additional rooms made out of metal plates and fabric or other improvised materials
|___||___|
|___|202 Does your household use the in-camp market stalls (e.g.
on the “Champs Elysées”)?Yes, often
Yes, sometimesYes, but rarely
No, neverDKNA
123489
All 224
203 Type of dwelling
Do not ask respondent, fill in
Apartment building [Amara]Small, traditional house [Dar]
VillaHut/ barrackShed/ shack
TentPrefabricated housing (caravan)
Inhabited establishment/ garage/ storage roomOther makeshift/improvised housing
123456789
204 How many rooms do you have in your dwelling?Include glassed-in verandas. Do not include kitchen, bathroom, and hallways. Do not include areas that are rented out or only used for work.
Number7 – 7 or more;
|___|
205 Size of living area (dwelling) 997 = 997 or more998 = DK 999 = NA
Square meters|___|___|___|
206 Does your dwelling have an independent kitchen?If you can observe it, do not ask.
YesNoDKNA
1289
4Version: 22 August 2013
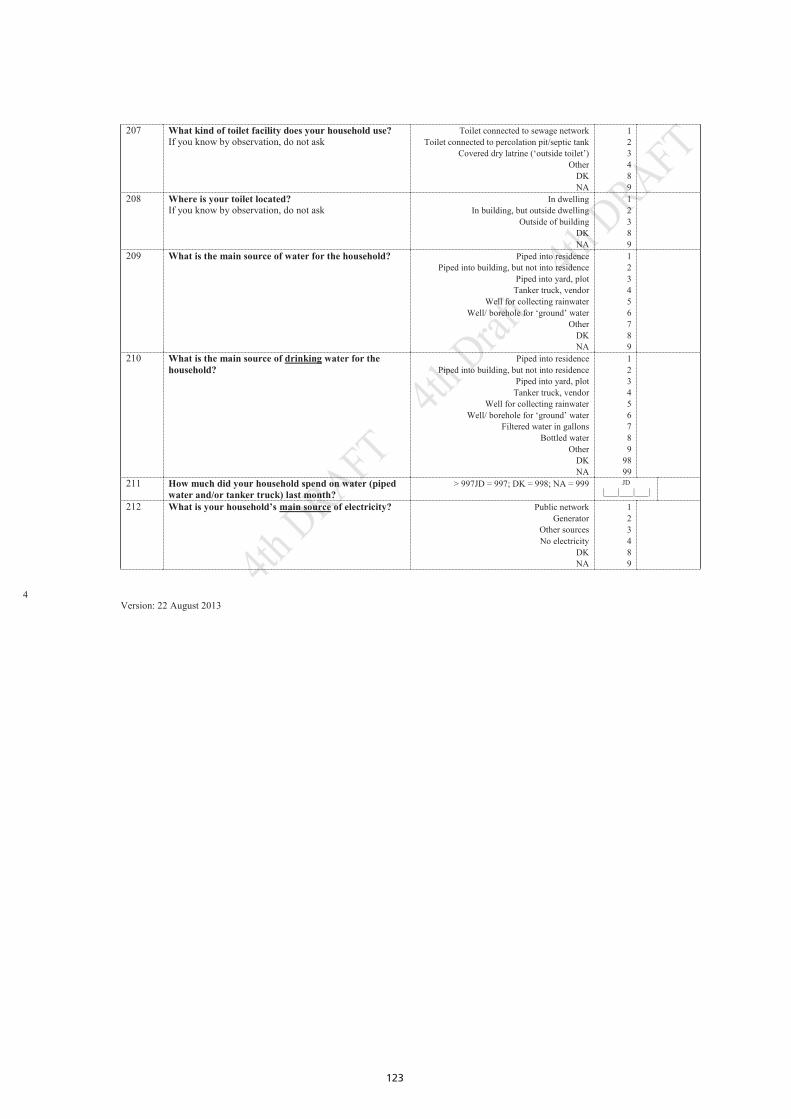
123
207 What kind of toilet facility does your household use?If you know by observation, do not ask
Toilet connected to sewage networkToilet connected to percolation pit/septic tank
Covered dry latrine (‘outside toilet’)Other
DKNA
123489
208 Where is your toilet located?If you know by observation, do not ask
In dwellingIn building, but outside dwelling
Outside of buildingDKNA
12389
209 What is the main source of water for the household? Piped into residencePiped into building, but not into residence
Piped into yard, plotTanker truck, vendor
Well for collecting rainwaterWell/ borehole for ‘ground’ water
OtherDKNA
123456789
210 What is the main source of drinking water for the household?
Piped into residencePiped into building, but not into residence
Piped into yard, plotTanker truck, vendor
Well for collecting rainwaterWell/ borehole for ‘ground’ water
Filtered water in gallonsBottled water
OtherDKNA
123456789
9899
211 How much did your household spend on water (piped water and/or tanker truck) last month?
> 997JD = 997; DK = 998; NA = 999 JD |___|___|___|
212 What is your household’s main source of electricity? Public networkGenerator
Other sourcesNo electricity
DKNA
123489
5Version: 22 August 2013
Section 2: The Dwelling and Its Environment Subsection: Dwelling and its amenities200 Interviewer check: Is the household located within the
Zaatari refugee camp?YesNo
12 203
201 How many of the following housing units does your household have in camp?
1. Tents2. Caravans
3. Additional rooms made out of metal plates and fabric or other improvised materials
|___||___|
|___|202 Does your household use the in-camp market stalls (e.g.
on the “Champs Elysées”)?Yes, often
Yes, sometimesYes, but rarely
No, neverDKNA
123489
All 224
203 Type of dwelling
Do not ask respondent, fill in
Apartment building [Amara]Small, traditional house [Dar]
VillaHut/ barrackShed/ shack
TentPrefabricated housing (caravan)
Inhabited establishment/ garage/ storage roomOther makeshift/improvised housing
123456789
204 How many rooms do you have in your dwelling?Include glassed-in verandas. Do not include kitchen, bathroom, and hallways. Do not include areas that are rented out or only used for work.
Number7 – 7 or more;
|___|
205 Size of living area (dwelling) 997 = 997 or more998 = DK 999 = NA
Square meters|___|___|___|
206 Does your dwelling have an independent kitchen?If you can observe it, do not ask.
YesNoDKNA
1289
4Version: 22 August 2013
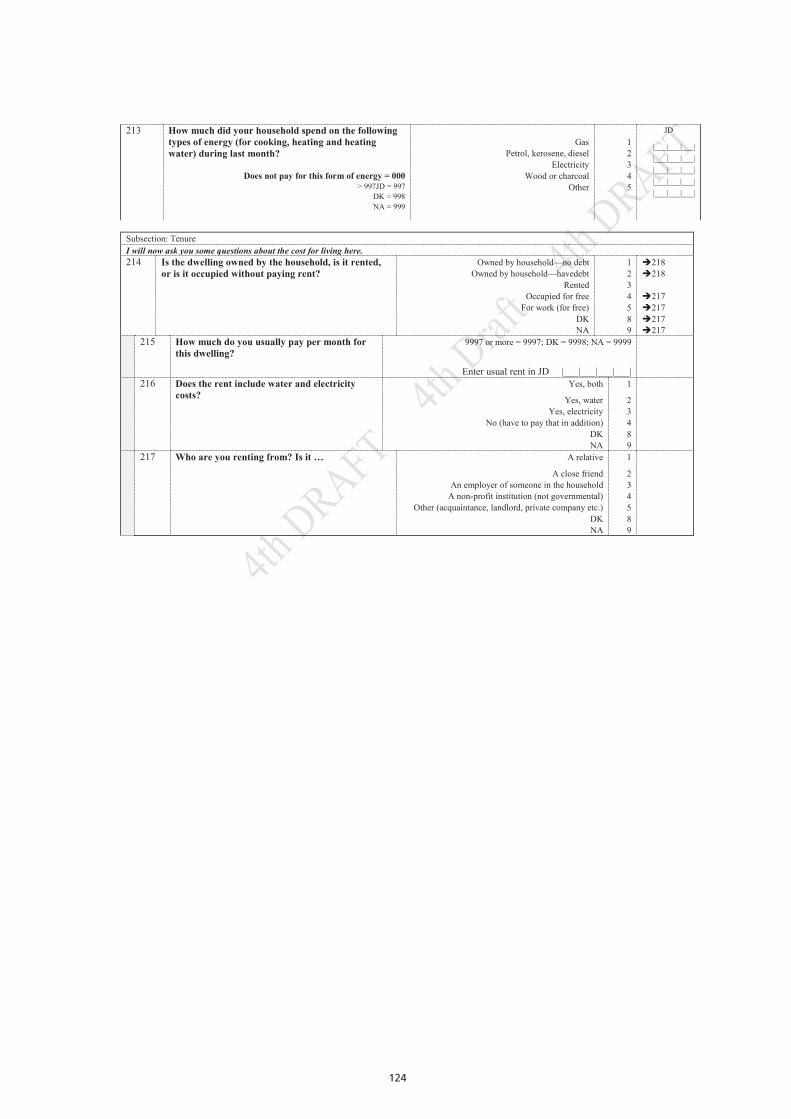
124
213 How much did your household spend on the following types of energy (for cooking, heating and heating water) during last month?
Does not pay for this form of energy = 000> 997JD = 997
DK = 998 NA = 999
GasPetrol, kerosene, diesel
ElectricityWood or charcoal
Other
12345
JD
|___|___|___||___|___|___||___|___|___||___|___|___||___|___|___|
Subsection: TenureI will now ask you some questions about the cost for living here. 214 Is the dwelling owned by the household, is it rented,
or is it occupied without paying rent?Owned by household—no debt
Owned by household—havedebt Rented
Occupied for freeFor work (for free)
DKNA
1234589
218218
217217217217
215 How much do you usually pay per month for this dwelling?
9997 or more = 9997; DK = 9998; NA = 9999
Enter usual rent in JD |___|___|___|___|216 Does the rent include water and electricity
costs?Yes, both
Yes, waterYes, electricity
No (have to pay that in addition)DKNA
1
23489
217 Who are you renting from? Is it … A relative
A close friendAn employer of someone in the household
A non-profit institution (not governmental)Other (acquaintance, landlord, private company etc.)
DKNA
1
234589
6Version: 22 August 2013
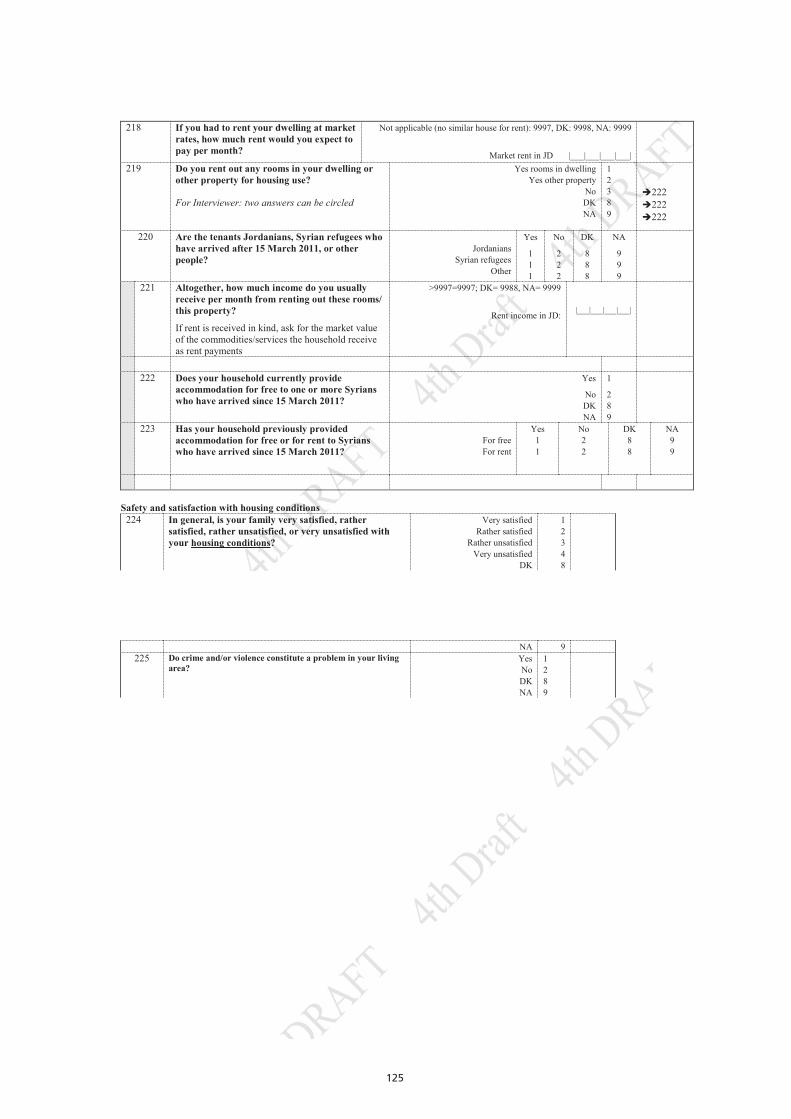
125
218 If you had to rent your dwelling at market rates, how much rent would you expect to pay per month?
Not applicable (no similar house for rent): 9997, DK: 9998, NA: 9999
Market rent in JD |___|___|___|___|219 Do you rent out any rooms in your dwelling or
other property for housing use?
For Interviewer: two answers can be circled
Yes rooms in dwellingYes other property
NoDKNA
12389
222222222
220 Are the tenants Jordanians, Syrian refugees who have arrived after 15 March 2011, or other people?
JordaniansSyrian refugees
Other
Yes
111
No
222
DK
888
NA
999
221 Altogether, how much income do you usually receive per month from renting out these rooms/ this property?
If rent is received in kind, ask for the market value of the commodities/services the household receive as rent payments
>9997=9997; DK= 9988, NA= 9999
Rent income in JD: |___|___|___|___|
222 Does your household currently provide accommodation for free to one or more Syrians who have arrived since 15 March 2011?
Yes
NoDKNA
1
289
223 Has your household previously provided accommodation for free or for rent to Syrians who have arrived since 15 March 2011?
For freeFor rent
Yes11
No22
DK88
NA99
Safety and satisfaction with housing conditions224 In general, is your family very satisfied, rather
satisfied, rather unsatisfied, or very unsatisfied with your housing conditions?
Very satisfiedRather satisfied
Rather unsatisfiedVery unsatisfied
DK
12348
7Version: 22 August 2013
NA 9225 Do crime and/or violence constitute a problem in your living
area?YesNoDKNA
1289
8Version: 22 August 2013
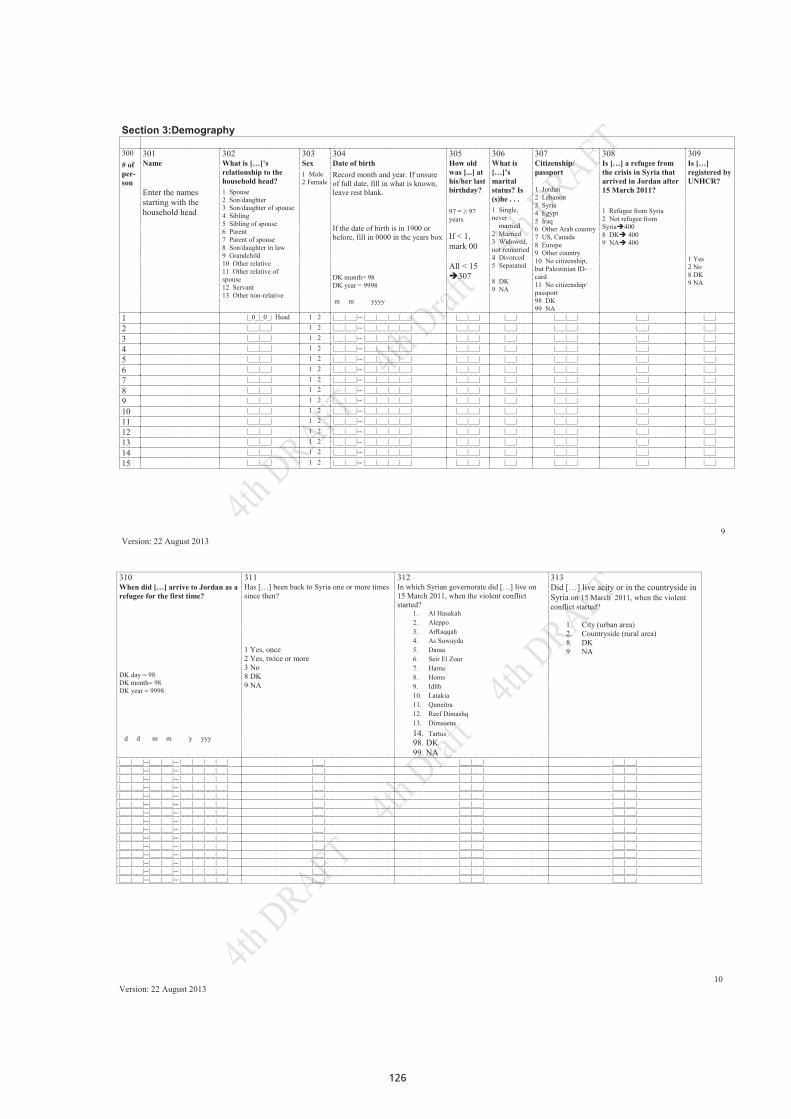
126
Section 3:Demography
300# of per-son
301Name
Enter the names starting with the household head
302What is […]’s relationship to the household head?1 Spouse2 Son/daughter3 Son/daughter of spouse4 Sibling5 Sibling of spouse6 Parent7 Parent of spouse8 Son/daughter in law9 Grandchild10 Other relative11 Other relative of spouse12 Servant13 Other non-relative
303Sex1 Male2 Female
304Date of birthRecord month and year. If unsure of full date, fill in what is known, leave rest blank.
If the date of birth is in 1900 or before, fill in 0000 in the years box
DK month= 98DK year = 9998
m m yyyy
305How old was [...] at his/her last birthday?
97 = ≥ 97 years
If < 1, mark 00
All < 15307
306What is […]’s marital status? Is (s)he . . .1 Single, never
married 2 Married3 Widowed, not remarried4 Divorced5 Separated
8 DK 9 NA
307Citizenship/ passport
1 Jordan2 Lebanon3 Syria 4 Egypt5 Iraq6 Other Arab country7 US, Canada8 Europe9 Other country10 No citizenship, but Palestinian ID-card 11 No citizenship/ passport 98 DK99 NA
308Is […] a refugee from the crisis in Syria that arrived in Jordan after 15 March 2011?
1 Refugee from Syria2 Not refugee from Syria4008 DK 4009 NA 400
309Is […] registered by UNHCR?
1 Yes2 No8 DK9 NA
1 |_0_|_0_| Head 1 2 |___|___|-- |___|___|___|___| |___|___| |___| |___|___| |___| |___|
2 |___|___| 1 2 |___|___|-- |___|___|___|___| |___|___| |___| |___|___| |___| |___|
3 |___|___| 1 2 |___|___|-- |___|___|___|___| |___|___| |___| |___|___| |___| |___|
4 |___|___| 1 2 |___|___|-- |___|___|___|___| |___|___| |___| |___|___| |___| |___|
5 |___|___| 1 2 |___|___|-- |___|___|___|___| |___|___| |___| |___|___| |___| |___|
6 |___|___| 1 2 |___|___|-- |___|___|___|___| |___|___| |___| |___|___| |___| |___|
7 |___|___| 1 2 |___|___|-- |___|___|___|___| |___|___| |___| |___|___| |___| |___|
8 |___|___| 1 2 |___|___|-- |___|___|___|___| |___|___| |___| |___|___| |___| |___|
9 |___|___| 1 2 |___|___|-- |___|___|___|___| |___|___| |___| |___|___| |___| |___|
10 |___|___| 1 2 |___|___|-- |___|___|___|___| |___|___| |___| |___|___| |___| |___|
11 |___|___| 1 2 |___|___|-- |___|___|___|___| |___|___| |___| |___|___| |___| |___|
12 |___|___| 1 2 |___|___|-- |___|___|___|___| |___|___| |___| |___|___| |___| |___|
13 |___|___| 1 2 |___|___|-- |___|___|___|___| |___|___| |___| |___|___| |___| |___|
14 |___|___| 1 2 |___|___|-- |___|___|___|___| |___|___| |___| |___|___| |___| |___|
15 |___|___| 1 2 |___|___|-- |___|___|___|___| |___|___| |___| |___|___| |___| |___|
9Version: 22 August 2013
310When did […] arrive to Jordan as a refugee for the first time?
DK day = 98DK month= 98DK year = 9998
d d m m y yyy
311Has […] been back to Syria one or more times since then?
1 Yes, once2 Yes, twice or more3 No8 DK9 NA
312In which Syrian governorate did […] live on 15 March 2011, when the violent conflict started?
1. Al Hasakah2. Aleppo3. ArRaqqah4. As Suwayda5. Daraa6. Seir El Zour7. Hama8. Homs9. Idlib10. Latakia11. Quneitra12. Reef Dimashq13. Dimascus14. Tartus98. DK99. NA
313Did […] live acity or in the countryside in Syria on 15 March 2011, when the violent conflict started?
1. City (urban area)2. Countryside (rural area)8 DK9 NA
|___|___|--|___|___|-- |___|___|___|___| |___| |___|___| |___|___||___|___|--|___|___|-- |___|___|___|___| |___| |___|___| |___|___||___|___|--|___|___|-- |___|___|___|___| |___| |___|___| |___|___||___|___|--|___|___|-- |___|___|___|___| |___| |___|___| |___|___||___|___|--|___|___|-- |___|___|___|___| |___| |___|___| |___|___||___|___|--|___|___|-- |___|___|___|___| |___| |___|___| |___|___||___|___|--|___|___|-- |___|___|___|___| |___| |___|___| |___|___||___|___|--|___|___|-- |___|___|___|___| |___| |___|___| |___|___||___|___|--|___|___|-- |___|___|___|___| |___| |___|___| |___|___||___|___|--|___|___|-- |___|___|___|___| |___| |___|___| |___|___||___|___|--|___|___|-- |___|___|___|___| |___| |___|___| |___|___||___|___|--|___|___|-- |___|___|___|___| |___| |___|___| |___|___||___|___|--|___|___|-- |___|___|___|___| |___| |___|___| |___|___||___|___|--|___|___|-- |___|___|___|___| |___| |___|___| |___|___||___|___|--|___|___|-- |___|___|___|___| |___| |___|___| |___|___|
10Version: 22 August 2013
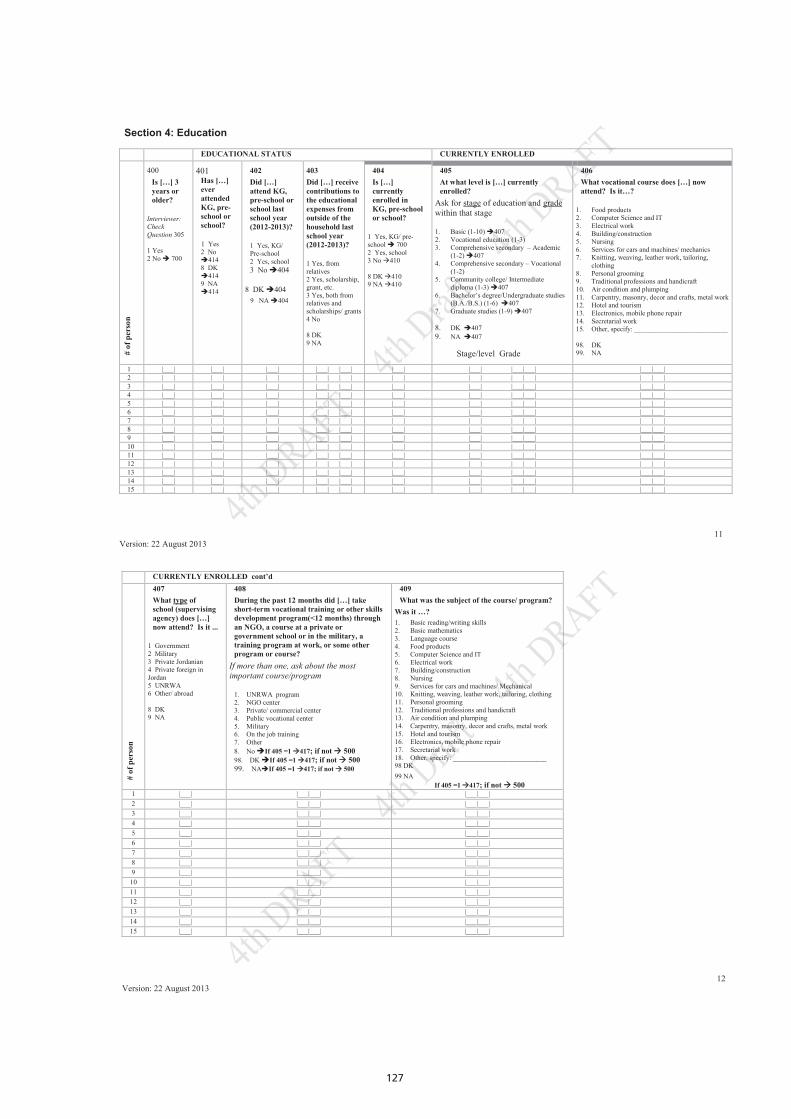
127
Section 4: Education
EDUCATIONAL STATUS CURRENTLY ENROLLED
# of
per
son
400Is […] 3 years or older?
Interviewer: Check Question 305
1 Yes2 No 700
401Has […] ever attended KG, pre-school or school?
1 Yes2 No 4148 DK 4149 NA 414
402Did […] attend KG, pre-school or school last school year (2012-2013)?
1 Yes, KG/ Pre-school 2 Yes, school3 No 404
8 DK 4049 NA 404
403Did […] receive contributions to the educational expenses from outside of the household last school year (2012-2013)?
1 Yes, from relatives2 Yes, scholarship, grant, etc.3 Yes, both from relatives and scholarships/ grants4 No
8 DK9 NA
404Is […] currently enrolled in KG, pre-school or school?
1 Yes, KG/ pre-school 7002 Yes, school 3 No 410
8 DK 4109 NA 410
405At what level is […] currently enrolled?
Ask for stage of education and gradewithin that stage
1. Basic (1-10) 4072. Vocational education (1-3)3. Comprehensive secondary – Academic
(1-2) 4074. Comprehensive secondary – Vocational
(1-2) 5. Community college/ Intermediate
diploma (1-3) 4076. Bachelor’s degree/Undergraduate studies
(B.A./B.S.) (1-6) 4077. Graduate studies (1-9) 407
8. DK 4079. NA 407
Stage/level Grade
406What vocational course does […] now attend? Is it…?
1. Food products2. Computer Science and IT3. Electrical work4. Building/construction5. Nursing6. Services for cars and machines/ mechanics7. Knitting, weaving, leather work, tailoring,
clothing8. Personal grooming9. Traditional professions and handicraft10. Air condition and plumping11. Carpentry, masonry, decor and crafts, metal work12. Hotel and tourism13. Electronics, mobile phone repair 14. Secretarial work 15. Other, specify: ___________________________
98. DK99. NA
1 |___| |___| |___| |___| |___| |___| |___| |___|___| |___|___|2 |___| |___| |___| |___| |___| |___| |___| |___|___| |___|___|3 |___| |___| |___| |___| |___| |___| |___| |___|___| |___|___|4 |___| |___| |___| |___| |___| |___| |___| |___|___| |___|___|5 |___| |___| |___| |___| |___| |___| |___| |___|___| |___|___|6 |___| |___| |___| |___| |___| |___| |___| |___|___| |___|___|7 |___| |___| |___| |___| |___| |___| |___| |___|___| |___|___|8 |___| |___| |___| |___| |___| |___| |___| |___|___| |___|___|9 |___| |___| |___| |___| |___| |___| |___| |___|___| |___|___|10 |___| |___| |___| |___| |___| |___| |___| |___|___| |___|___|11 |___| |___| |___| |___| |___| |___| |___| |___|___| |___|___|12 |___| |___| |___| |___| |___| |___| |___| |___|___| |___|___|13 |___| |___| |___| |___| |___| |___| |___| |___|___| |___|___|14 |___| |___| |___| |___| |___| |___| |___| |___|___| |___|___|15 |___| |___| |___| |___| |___| |___| |___| |___|___| |___|___|
11Version: 22 August 2013
CURRENTLY ENROLLED cont’d
# of
per
son
407What type of school (supervising agency) does […] now attend? Is it ...
1 Government2 Military3 Private Jordanian4 Private foreign in Jordan5 UNRWA 6 Other/ abroad
8 DK9 NA
408During the past 12 months did […] take short-term vocational training or other skills development program(<12 months) through an NGO, a course at a private or government school or in the military, a training program at work, or some other program or course?
If more than one, ask about the most important course/program
1. UNRWA program2. NGO center 3. Private/ commercial center4. Public vocational center5. Military6. On the job training7. Other8. No If 405 =1 417; if not 50098. DK If 405 =1 417; if not 50099. NAIf 405 =1 417; if not 500
409What was the subject of the course/ program?
Was it …?1. Basic reading/writing skills2. Basic mathematics3. Language course 4. Food products5. Computer Science and IT6. Electrical work7. Building/construction8. Nursing9. Services for cars and machines/ Mechanical10. Knitting, weaving, leather work, tailoring, clothing11. Personal grooming12. Traditional professions and handicraft13. Air condition and plumping14. Carpentry, masonry, decor and crafts, metal work15. Hotel and tourism16. Electronics, mobile phone repair 17. Secretarial work18. Other, specify: ___________________________98 DK99 NA If 405 =1 417; if not 500
1 |___| |___|___| |___|___|2 |___| |___|___| |___|___|3 |___| |___|___| |___|___|4 |___| |___|___| |___|___|5 |___| |___|___| |___|___|6 |___| |___|___| |___|___|7 |___| |___|___| |___|___|8 |___| |___|___| |___|___|9 |___| |___|___| |___|___|
10 |___| |___|___| |___|___|11 |___| |___|___| |___|___|12 |___| |___|___| |___|___|13 |___| |___|___| |___|___|14 |___| |___|___| |___|___|15 |___| |___|___| |___|___|
12Version: 22 August 2013
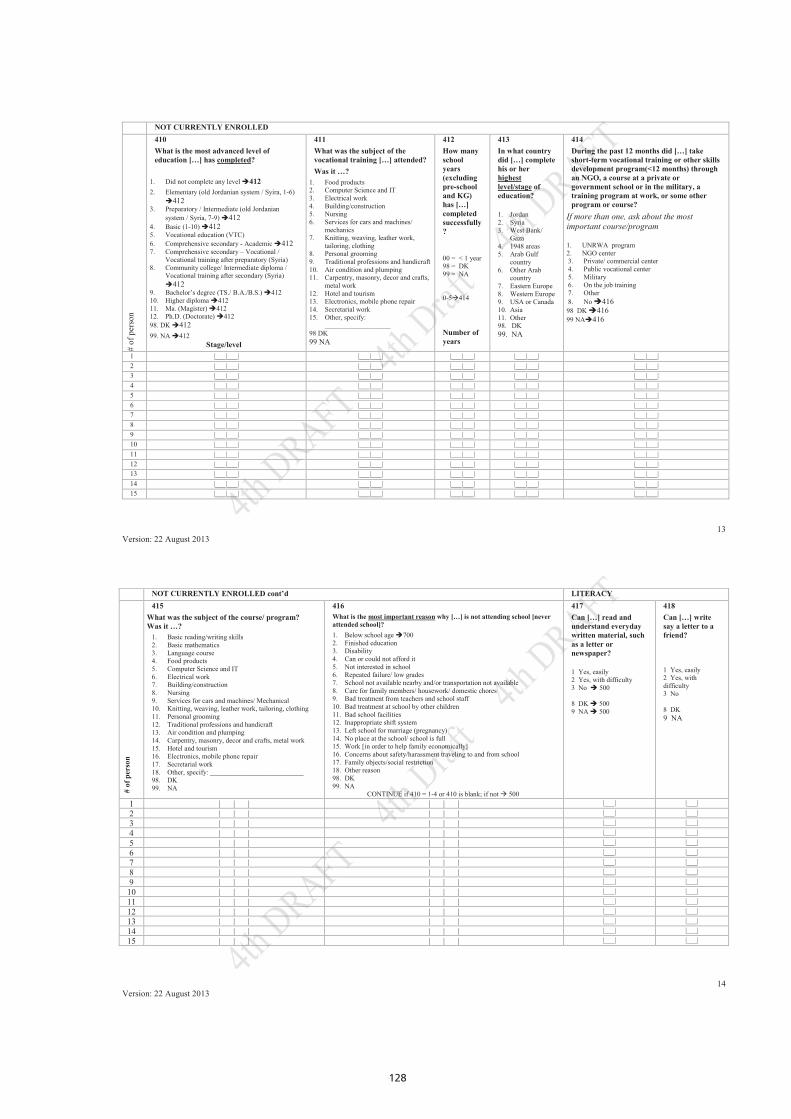
128
NOT CURRENTLY ENROLLED #
of p
erso
n410What is the most advanced level of education […] has completed?
1. Did not complete any level 4122. Elementary (old Jordanian system / Syira, 1-6)
4123. Preparatory / Intermediate (old Jordanian
system / Syria, 7-9) 4124. Basic (1-10) 4125. Vocational education (VTC)6. Comprehensive secondary - Academic 4127. Comprehensive secondary – Vocational /
Vocational training after preparatory (Syria)8. Community college/ Intermediate diploma /
Vocational training after secondary (Syria) 412
9. Bachelor’s degree (TS./ B.A./B.S.) 41210. Higher diploma 41211. Ma. (Magister) 41212. Ph.D. (Doctorate) 41298. DK 41299. NA 412
Stage/level
411What was the subject of the vocational training […] attended?Was it …?
1. Food products2. Computer Science and IT3. Electrical work4. Building/construction5. Nursing6. Services for cars and machines/
mechanics7. Knitting, weaving, leather work,
tailoring, clothing8. Personal grooming9. Traditional professions and handicraft10. Air condition and plumping11. Carpentry, masonry, decor and crafts,
metal work12. Hotel and tourism13. Electronics, mobile phone repair 14. Secretarial work15. Other, specify:
___________________98 DK99 NA
412How many school years (excluding pre-school and KG) has […] completed successfully?
00 = < 1 year98 = DK99 = NA
0-5414
Number of years
413In what country did […] complete his or her highest level/stage of education?
1. Jordan2. Syria3. West Bank/
Gaza4. 1948 areas5. Arab Gulf
country6. Other Arab
country7. Eastern Europe8. Western Europe9. USA or Canada10. Asia 11. Other98. DK99. NA
414During the past 12 months did […] take short-term vocational training or other skills development program(<12 months) through an NGO, a course at a private or government school or in the military, a training program at work, or some other program or course?
If more than one, ask about the most important course/program
1. UNRWA program2. NGO center 3. Private/ commercial center4. Public vocational center5. Military6. On the job training7. Other8. No 41698 DK 41699 NA416
1 |___|___| |___|___| |___|___| |___|___| |___|___|2 |___|___| |___|___| |___|___| |___|___| |___|___|3 |___|___| |___|___| |___|___| |___|___| |___|___|4 |___|___| |___|___| |___|___| |___|___| |___|___|5 |___|___| |___|___| |___|___| |___|___| |___|___|6 |___|___| |___|___| |___|___| |___|___| |___|___|7 |___|___| |___|___| |___|___| |___|___| |___|___|8 |___|___| |___|___| |___|___| |___|___| |___|___|9 |___|___| |___|___| |___|___| |___|___| |___|___|10 |___|___| |___|___| |___|___| |___|___| |___|___|11 |___|___| |___|___| |___|___| |___|___| |___|___|12 |___|___| |___|___| |___|___| |___|___| |___|___|13 |___|___| |___|___| |___|___| |___|___| |___|___|14 |___|___| |___|___| |___|___| |___|___| |___|___|15 |___|___| |___|___| |___|___| |___|___| |___|___|
13Version: 22 August 2013
NOT CURRENTLY ENROLLED cont’d LITERACY
# of
per
son
415What was the subject of the course/ program?Was it …?
1. Basic reading/writing skills2. Basic mathematics3. Language course 4. Food products5. Computer Science and IT6. Electrical work7. Building/construction8. Nursing9. Services for cars and machines/ Mechanical10. Knitting, weaving, leather work, tailoring, clothing11. Personal grooming12. Traditional professions and handicraft13. Air condition and plumping14. Carpentry, masonry, decor and crafts, metal work15. Hotel and tourism16. Electronics, mobile phone repair 17. Secretarial work18. Other, specify: ___________________________98. DK99. NA
416What is the most important reason why […] is not attending school [never attended school]?1. Below school age 7002. Finished education3. Disability4. Can or could not afford it5. Not interested in school6. Repeated failure/ low grades7. School not available nearby and/or transportation not available8. Care for family members/ housework/ domestic chores9. Bad treatment from teachers and school staff10. Bad treatment at school by other children11. Bad school facilities12. Inappropriate shift system13. Left school for marriage (pregnancy)14. No place at the school/ school is full15. Work [in order to help family economically]16. Concerns about safety/harassment traveling to and from school17. Family objects/social restriction18. Other reason98. DK99. NA CONTINUE if 410 = 1-4 or 410 is blank; if not 500
417Can […] read and understand everyday written material, such as a letter or newspaper?
1 Yes, easily2 Yes, with difficulty3 No 500
8 DK 5009 NA 500
418Can […] write say a letter to a friend?
1 Yes, easily 2 Yes, with difficulty3 No
8 DK9 NA
1 |___|___| |___|___| |___| |___|2 | | | | | | |___| |___|3 |___|___| |___|___| |___| |___|4 | | | | | | |___| |___|5 | | | | | | |___| |___|6 | | | | | | |___| |___|7 | | | | | | |___| |___|8 | | | | | | |___| |___|9 | | | | | | |___| |___|
10 | | | | | | |___| |___|11 | | | | | | |___| |___|12 | | | | | | |___| |___|13 |___|___| |___|___| |___| |___|14 | | | | | | |___| |___|15 |___|___| |___|___| |___| |___|
14Version: 22 August 2013
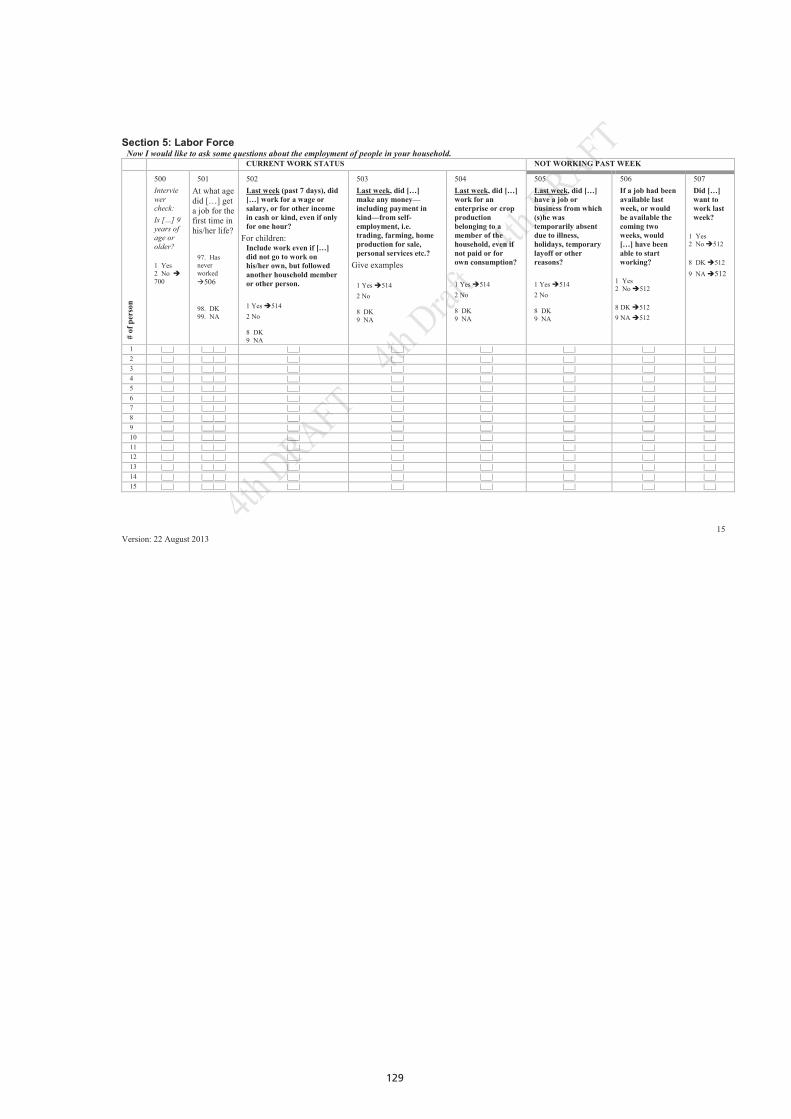
129
Section 5: Labor ForceNow I would like to ask some questions about the employment of people in your household.
CURRENT WORK STATUS NOT WORKING PAST WEEK
# of
per
son
500Interviewer check:Is […] 9 years of age or older?
1 Yes 2 No 700
501At what age did […] get a job for the first time in his/her life?
97. Has never worked 506
98. DK99. NA
502Last week (past 7 days), did […] work for a wage or salary, or for other income in cash or kind, even if only for one hour?
For children:Include work even if […]did not go to work on his/her own, but followed another household member or other person.
1 Yes 5142 No
8 DK9 NA
503Last week, did […] make any money—including payment in kind—from self-employment, i.e. trading, farming, home production for sale, personal services etc.?
Give examples
1 Yes 5142 No
8 DK9 NA
504Last week, did […] work for an enterprise or crop production belonging to a member of the household, even if not paid or for own consumption?
1 Yes 5142 No
8 DK9 NA
505Last week, did […]have a job or business from which (s)he was temporarily absent due to illness, holidays, temporary layoff or other reasons?
1 Yes 5142 No
8 DK 9 NA
506If a job had been available last week, or would be available the coming two weeks, would […] have been able to start working?
1 Yes2 No 512
8 DK 5129 NA 512
507Did […] want to work last week?
1 Yes2 No 512
8 DK 512
9 NA 512
1 |___| |___|___| |___| |___| |___| |___| |___| |___|2 |___| |___|___| |___| |___| |___| |___| |___| |___|3 |___| |___|___| |___| |___| |___| |___| |___| |___|4 |___| |___|___| |___| |___| |___| |___| |___| |___|5 |___| |___|___| |___| |___| |___| |___| |___| |___|6 |___| |___|___| |___| |___| |___| |___| |___| |___|7 |___| |___|___| |___| |___| |___| |___| |___| |___|8 |___| |___|___| |___| |___| |___| |___| |___| |___|9 |___| |___|___| |___| |___| |___| |___| |___| |___|10 |___| |___|___| |___| |___| |___| |___| |___| |___|11 |___| |___|___| |___| |___| |___| |___| |___| |___|12 |___| |___|___| |___| |___| |___| |___| |___| |___|13 |___| |___|___| |___| |___| |___| |___| |___| |___|14 |___| |___|___| |___| |___| |___| |___| |___| |___|15 |___| |___|___| |___| |___| |___| |___| |___| |___|
15Version: 22 August 2013
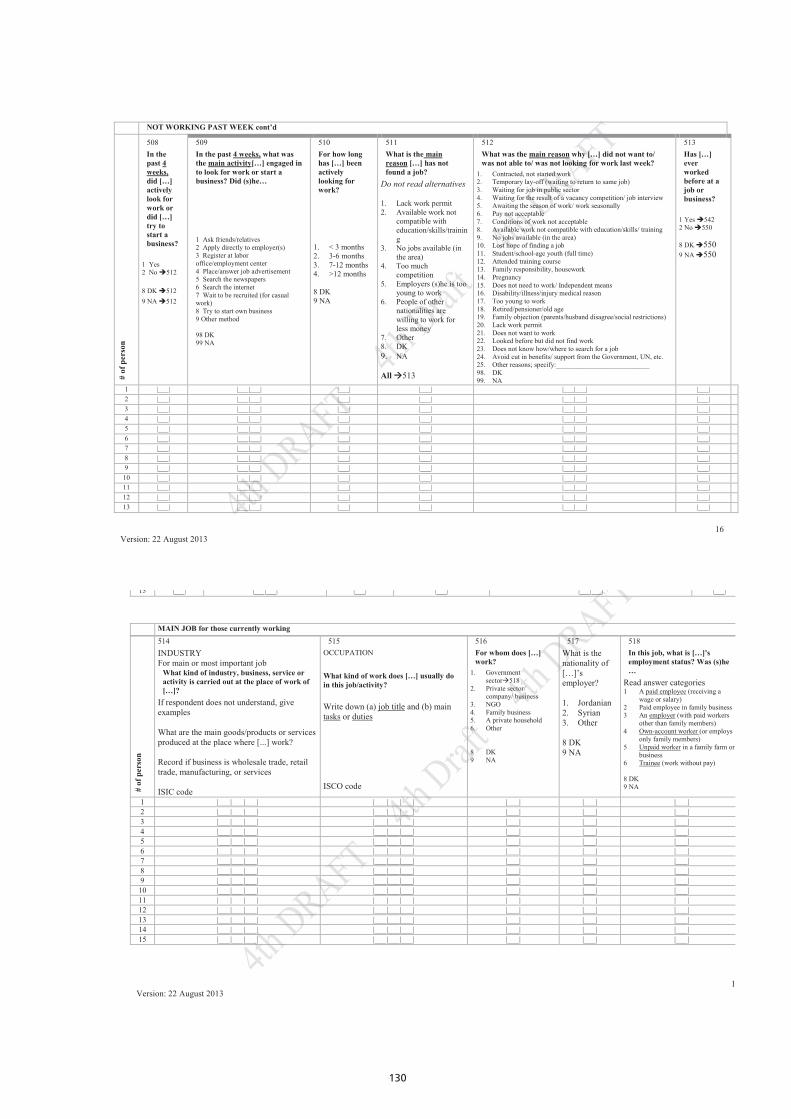
130
14 |___| |___|___| |___| |___| |___|___| |___|15 |___| |___|___| |___| |___| |___|___| |___|
# of
per
son
514INDUSTRYFor main or most important job
What kind of industry, business, service or activity is carried out at the place of work of […]?
If respondent does not understand, give examples
What are the main goods/products or services produced at the place where [...] work?
Record if business is wholesale trade, retail trade, manufacturing, or services
ISIC code
515OCCUPATION
What kind of work does […] usually do in this job/activity?
Write down (a) job title and (b) main tasks or duties
ISCO code
516For whom does […] work?
1. Government sector518
2. Private sector/ company/ business
3. NGO4. Family business5. A private household6. Other
8 DK9 NA
517What is the nationality of […]’s employer?
1. Jordanian2. Syrian3. Other
8 DK9 NA
518In this job, what is […]'s employment status? Was (s)he …
Read answer categories1 A paid employee (receiving a
wage or salary)2 Paid employee in family business3 An employer (with paid workers
other than family members)4 Own-account worker (or employs
only family members)5 Unpaid worker in a family farm or
business6 Trainee (work without pay)
8 DK 9 NA
1 |___|___|___| |___|___|___| |___| |___| |___|2 |___|___|___| |___|___|___| |___| |___| |___|3 |___|___|___| |___|___|___| |___| |___| |___|4 |___|___|___| |___|___|___| |___| |___| |___|5 |___|___|___| |___|___|___| |___| |___| |___|6 |___|___|___| |___|___|___| |___| |___| |___|7 |___|___|___| |___|___|___| |___| |___| |___|8 |___|___|___| |___|___|___| |___| |___| |___|9 |___|___|___| |___|___|___| |___| |___| |___|10 |___|___|___| |___|___|___| |___| |___| |___|11 |___|___|___| |___|___|___| |___| |___| |___|12 |___|___|___| |___|___|___| |___| |___| |___|13 |___|___|___| |___|___|___| |___| |___| |___|14 |___|___|___| |___|___|___| |___| |___| |___|15 |___|___|___| |___|___|___| |___| |___| |___|
MAIN JOB for those currently working
17Version: 22 August 2013
NOT WORKING PAST WEEK cont’d#
of p
erso
n
508In the past 4weeks,did […] actively look for work or did […] try to start a business?
1 Yes2 No 512
8 DK 5129 NA 512
509In the past 4 weeks, what wasthe main activity[…] engaged in to look for work or start a business? Did (s)he…
1 Ask friends/relatives2 Apply directly to employer(s)3 Register at labor office/employment center4 Place/answer job advertisement5 Search the newspapers6 Search the internet7 Wait to be recruited (for casual work)8 Try to start own business9 Other method
98 DK99 NA
510For how long has […] been activelylooking for work?
1. < 3 months2. 3-6 months3. 7-12 months4. >12 months
8 DK9 NA
511What is the main reason […] has not found a job?
Do not read alternatives
1. Lack work permit2. Available work not
compatible with education/skills/training
3. No jobs available (in the area)
4. Too much competition
5. Employers (s)he is too young to work
6. People of other nationalities are willing to work for less money
7. Other8. DK9. NA
All 513
512What was the main reason why […] did not want to/ was not able to/ was not looking for work last week?
1. Contracted, not started work2. Temporary lay-off (waiting to return to same job)3. Waiting for job in public sector4. Waiting for the result of a vacancy competition/ job interview5. Awaiting the season of work/ work seasonally6. Pay not acceptable7. Conditions of work not acceptable8. Available work not compatible with education/skills/ training9. No jobs available (in the area)10. Lost hope of finding a job11. Student/school-age youth (full time)12. Attended training course13. Family responsibility, housework14. Pregnancy 15. Does not need to work/ Independent means16. Disability/illness/injury medical reason17. Too young to work18. Retired/pensioner/old age19. Family objection (parents/husband disagree/social restrictions)20. Lack work permit21. Does not want to work22. Looked before but did not find work23. Does not know how/where to search for a job24. Avoid cut in benefits/ support from the Government, UN, etc.25. Other reasons; specify:___________________________98. DK 99. NA
513Has […] ever worked before at a job or business?
1 Yes 5422 No 550
8 DK 5509 NA 550
1 |___| |___|___| |___| |___| |___|___| |___|2 |___| |___|___| |___| |___| |___|___| |___|3 |___| |___|___| |___| |___| |___|___| |___|4 |___| |___|___| |___| |___| |___|___| |___|5 |___| |___|___| |___| |___| |___|___| |___|6 |___| |___|___| |___| |___| |___|___| |___|7 |___| |___|___| |___| |___| |___|___| |___|8 |___| |___|___| |___| |___| |___|___| |___|9 |___| |___|___| |___| |___| |___|___| |___|
10 |___| |___|___| |___| |___| |___|___| |___|11 |___| |___|___| |___| |___| |___|___| |___|12 |___| |___|___| |___| |___| |___|___| |___|13 |___| |___|___| |___| |___| |___|___| |___|
16Version: 22 August 2013
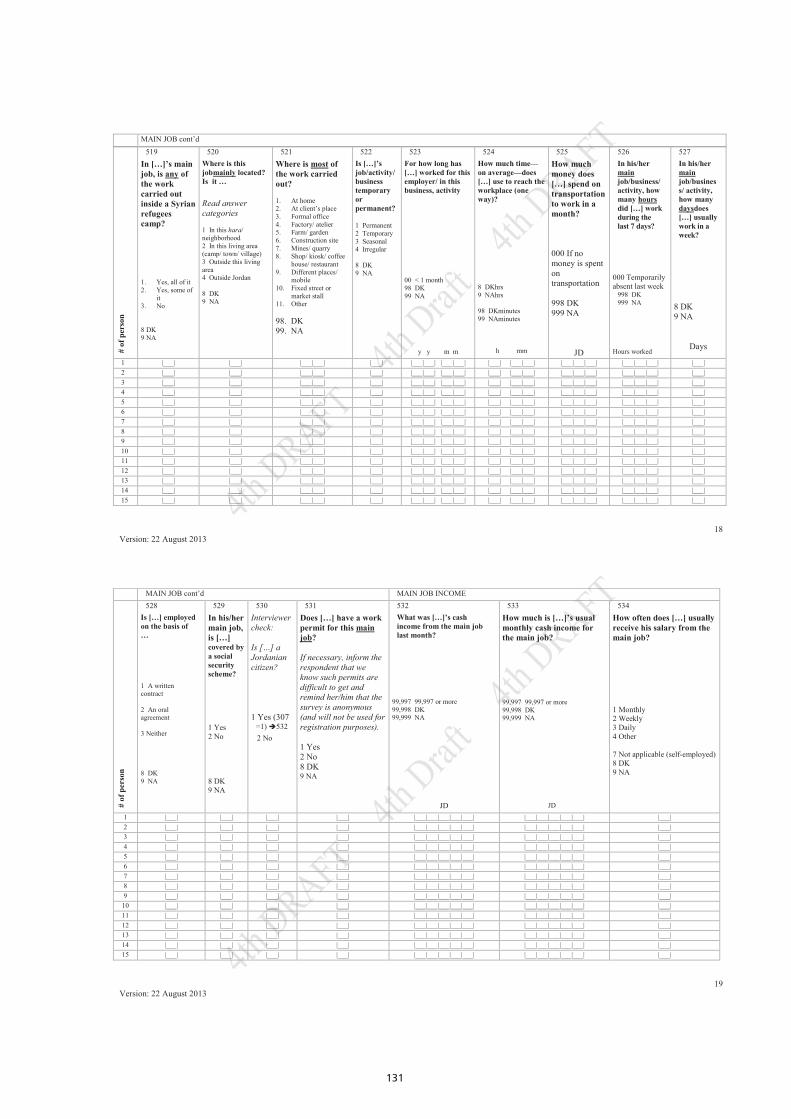
131
# of
per
son
519In […]’s main job, is any of the work carried out inside a Syrian refugees camp?
1. Yes, all of it2. Yes, some of
it3. No
8 DK9 NA
520Where is this jobmainly located? Is it …
Read answer categories
1 In this hara/neighborhood2 In this living area (camp/ town/ village)3 Outside this living area4 Outside Jordan
8 DK9 NA
521Where is most of the work carried out?
1. At home2. At client’s place3. Formal office4. Factory/ atelier5. Farm/ garden6. Construction site7. Mines/ quarry8. Shop/ kiosk/ coffee
house/ restaurant9. Different places/
mobile10. Fixed street or
market stall11. Other
98. DK99. NA
522Is […]’s job/activity/ business temporary or permanent?
1 Permanent2 Temporary3 Seasonal4 Irregular
8 DK9 NA
523For how long has […] worked for this employer/ in this business, activity
00 < 1 month98 DK99 NA
y y m m
524How much time—on average—does […] use to reach the workplace (one way)?
8 DKhrs9 NAhrs
98 DKminutes99 NAminutes
h mm
525How much money does […] spend on transportation to work in a month?
000 If no money is spent on transportation
998 DK999 NA
JD
526In his/her mainjob/business/ activity, how many hoursdid […] work during the last 7 days?
000 Temporarily absent last week
998 DK 999 NA
Hours worked
527In his/her mainjob/business/ activity, how many daysdoes […] usually work in a week?
8 DK9 NA
Days
1 |___| |___| |___|___| |___| |___|___| |___|___| |___| |___|___| |___|___|___| |___|___|___| |___|2 |___| |___| |___|___| |___| |___|___| |___|___| |___| |___|___| |___|___|___| |___|___|___| |___|3 |___| |___| |___|___| |___| |___|___| |___|___| |___| |___|___| |___|___|___| |___|___|___| |___|4 |___| |___| |___|___| |___| |___|___| |___|___| |___| |___|___| |___|___|___| |___|___|___| |___|5 |___| |___| |___|___| |___| |___|___| |___|___| |___| |___|___| |___|___|___| |___|___|___| |___|6 |___| |___| |___|___| |___| |___|___| |___|___| |___| |___|___| |___|___|___| |___|___|___| |___|7 |___| |___| |___|___| |___| |___|___| |___|___| |___| |___|___| |___|___|___| |___|___|___| |___|8 |___| |___| |___|___| |___| |___|___| |___|___| |___| |___|___| |___|___|___| |___|___|___| |___|9 |___| |___| |___|___| |___| |___|___| |___|___| |___| |___|___| |___|___|___| |___|___|___| |___|10 |___| |___| |___|___| |___| |___|___| |___|___| |___| |___|___| |___|___|___| |___|___|___| |___|11 |___| |___| |___|___| |___| |___|___| |___|___| |___| |___|___| |___|___|___| |___|___|___| |___|12 |___| |___| |___|___| |___| |___|___| |___|___| |___| |___|___| |___|___|___| |___|___|___| |___|13 |___| |___| |___|___| |___| |___|___| |___|___| |___| |___|___| |___|___|___| |___|___|___| |___|14 |___| |___| |___|___| |___| |___|___| |___|___| |___| |___|___| |___|___|___| |___|___|___| |___|15 |___| |___| |___|___| |___| |___|___| |___|___| |___| |___|___| |___|___|___| |___|___|___| |___|
MAIN JOB cont’d
18Version: 22 August 2013
MAIN JOB cont’d MAIN JOB INCOME
# of
per
son
528Is […] employed on the basis of …
1 A written contract
2 An oral agreement
3 Neither
8 DK9 NA
529In his/her main job, is […] covered by a social security scheme?
1 Yes2 No
8 DK9 NA
530Interviewer check:
Is […] a Jordanian citizen?
1 Yes (307=1) 5322 No
531Does […] have a work permit for this main job?
If necessary, inform the respondent that we know such permits are difficult to get and remind her/him that the survey is anonymous (and will not be used for registration purposes).
1 Yes2 No8 DK9 NA
532What was […]’s cash income from the main job last month?
99,997 99,997 or more99,998 DK99,999 NA
JD
533How much is […]’s usual monthly cash income for the main job?
99,997 99,997 or more99,998 DK99,999 NA
JD
534How often does […] usually receive his salary from the main job?
1 Monthly2 Weekly3 Daily4 Other
7 Not applicable (self-employed)8 DK9 NA
1 |___| |___| |___| |___| |___|___|___|___|___| |___|___|___|___|___| |___|2 |___| |___| |___| |___| |___|___|___|___|___| |___|___|___|___|___| |___|3 |___| |___| |___| |___| |___|___|___|___|___| |___|___|___|___|___| |___|4 |___| |___| |___| |___| |___|___|___|___|___| |___|___|___|___|___| |___|5 |___| |___| |___| |___| |___|___|___|___|___| |___|___|___|___|___| |___|6 |___| |___| |___| |___| |___|___|___|___|___| |___|___|___|___|___| |___|7 |___| |___| |___| |___| |___|___|___|___|___| |___|___|___|___|___| |___|8 |___| |___| |___| |___| |___|___|___|___|___| |___|___|___|___|___| |___|9 |___| |___| |___| |___| |___|___|___|___|___| |___|___|___|___|___| |___|
10 |___| |___| |___| |___| |___|___|___|___|___| |___|___|___|___|___| |___|11 |___| |___| |___| |___| |___|___|___|___|___| |___|___|___|___|___| |___|12 |___| |___| |___| |___| |___|___|___|___|___| |___|___|___|___|___| |___|13 |___| |___| |___| |___| |___|___|___|___|___| |___|___|___|___|___| |___|14 |___| |___| |___| |___| |___|___|___|___|___| |___|___|___|___|___| |___|15 |___| |___| |___| |___| |___|___|___|___|___| |___|___|___|___|___| |___|
19Version: 22 August 2013
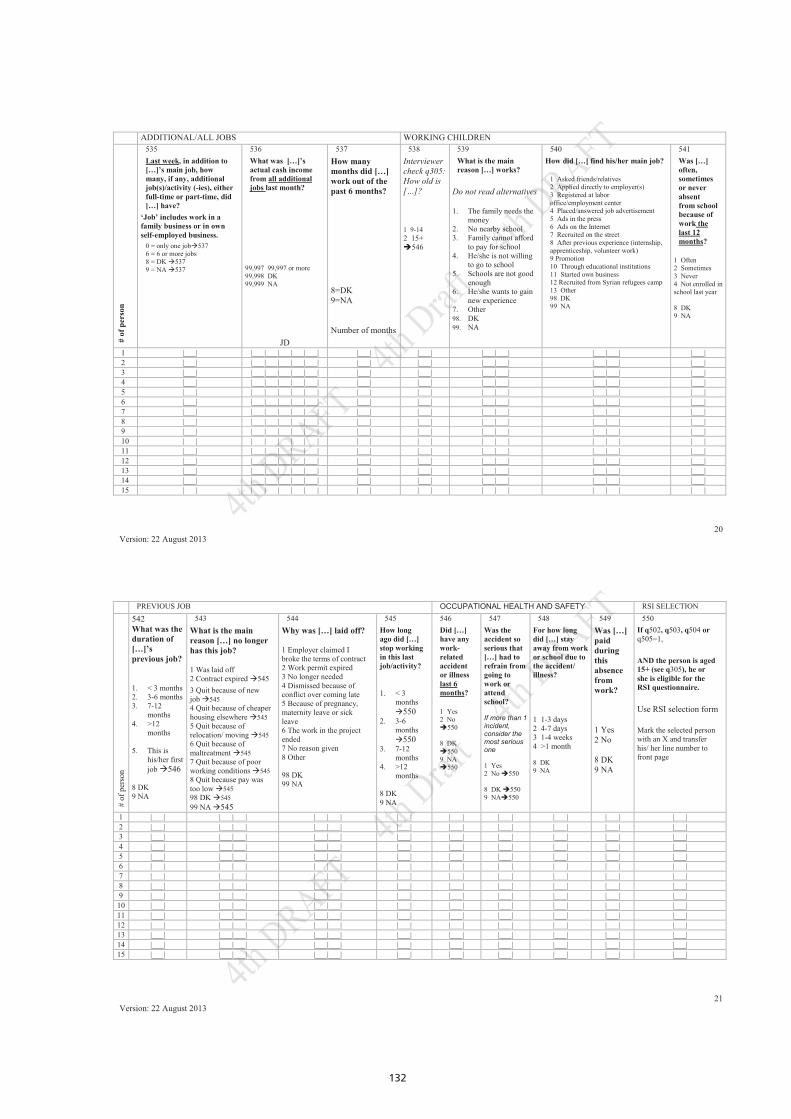
132
ADDITIONAL/ALL JOBS WORKING CHILDREN
# of
per
son
535Last week, in addition to […]’s main job, how many, if any, additional job(s)/activity (-ies), either full-time or part-time, did […] have?
‘Job’ includes work in a family business or in own self-employed business.
0 = only one job5376 = 6 or more jobs 8 = DK 5379 = NA 537
536What was […]’s actual cash income from all additional jobs last month?
99,997 99,997 or more99,998 DK99,999 NA
JD
537How many months did […] work out of the past 6 months?
8=DK9=NA
Number of months
538Interviewer check q305:How old is […]?
1 9-142 15+ 546
539What is the main reason […] works?
Do not read alternatives
1. The family needs the money
2. No nearby school3. Family cannot afford
to pay for school4. He/she is not willing
to go to school5. Schools are not good
enough6. He/she wants to gain
new experience7. Other98. DK99. NA
540How did […] find his/her main job?
1 Asked friends/relatives2 Applied directly to employer(s)3 Registered at labor office/employment center4 Placed/answered job advertisement5 Ads in the press6 Ads on the Internet7 Recruited on the street8 After previous experience (internship, apprenticeship, volunteer work)9 Promotion10 Through educational institutions11 Started own business12 Recruited from Syrian refugees camp 13 Other98 DK99 NA
541Was […] often, sometimes or never absent from school because of work the last 12 months?
1 Often2 Sometimes3 Never4 Not enrolled in school last year
8 DK9 NA
1 |___| |___|___|___|___|___| |___| |___| |___|___| |___|___| |___|2 |___| |___|___|___|___|___| |___| |___| |___|___| |___|___| |___|3 |___| |___|___|___|___|___| |___| |___| |___|___| |___|___| |___|4 |___| |___|___|___|___|___| |___| |___| |___|___| |___|___| |___|5 |___| |___|___|___|___|___| |___| |___| |___|___| |___|___| |___|6 |___| |___|___|___|___|___| |___| |___| |___|___| |___|___| |___|7 |___| |___|___|___|___|___| |___| |___| |___|___| |___|___| |___|8 |___| |___|___|___|___|___| |___| |___| |___|___| |___|___| |___|9 |___| |___|___|___|___|___| |___| |___| |___|___| |___|___| |___|10 |___| |___|___|___|___|___| |___| |___| |___|___| |___|___| |___|11 |___| |___|___|___|___|___| |___| |___| |___|___| |___|___| |___|12 |___| |___|___|___|___|___| |___| |___| |___|___| |___|___| |___|13 |___| |___|___|___|___|___| |___| |___| |___|___| |___|___| |___|14 |___| |___|___|___|___|___| |___| |___| |___|___| |___|___| |___|15 |___| |___|___|___|___|___| |___| |___| |___|___| |___|___| |___|
20Version: 22 August 2013
PREVIOUS JOB OCCUPATIONAL HEALTH AND SAFETY RSI SELECTION
# of
per
son
542What was the duration of […]’s previous job?
1. < 3 months2. 3-6 months3. 7-12
months4. >12
months
5. This is his/her first job 546
8 DK9 NA
543What is the main reason […] no longer has this job?
1 Was laid off2 Contract expired 5453 Quit because of new job 5454 Quit because of cheaper housing elsewhere 5455 Quit because of relocation/ moving 5456 Quit because of maltreatment 5457 Quit because of poor working conditions 5458 Quit because pay was too low 54598 DK 54599 NA 545
544Why was […] laid off?
1 Employer claimed I broke the terms of contract2 Work permit expired3 No longer needed4 Dismissed because of conflict over coming late5 Because of pregnancy, maternity leave or sick leave6 The work in the project ended7 No reason given8 Other
98 DK99 NA
545How long ago did […] stop working in this last job/activity?
1. < 3 months 550
2. 3-6months 550
3. 7-12 months
4. >12 months
8 DK9 NA
546Did […] have any work-related accident or illness last 6 months?
1 Yes2 No 550
8 DK 5509 NA 550
547Was the accident so serious that […] had to refrain from going to work or attend school?
If more than 1 incident, consider the most serious one
1 Yes2 No 550
8 DK 5509 NA550
548For how long did […] stay away from work or school due to the accident/ illness?
1 1-3 days2 4-7 days3 1-4 weeks4 >1 month
8 DK9 NA
549Was […] paid during this absence from work?
1 Yes2 No
8 DK9 NA
550If q502, q503, q504 orq505=1,
AND the person is aged 15+ (see q305), he or she is eligible for the RSI questionnaire.
Use RSI selection form
Mark the selected person with an X and transfer his/ her line number to front page
1 |___| |___|___| |___|___| |___| |___| |___| |___| |___| |___|2 |___| |___|___| |___|___| |___| |___| |___| |___| |___| |___|3 |___| |___|___| |___|___| |___| |___| |___| |___| |___| |___|4 |___| |___|___| |___|___| |___| |___| |___| |___| |___| |___|5 |___| |___|___| |___|___| |___| |___| |___| |___| |___| |___|6 |___| |___|___| |___|___| |___| |___| |___| |___| |___| |___|7 |___| |___|___| |___|___| |___| |___| |___| |___| |___| |___|8 |___| |___|___| |___|___| |___| |___| |___| |___| |___| |___|9 |___| |___|___| |___|___| |___| |___| |___| |___| |___| |___|10 |___| |___|___| |___|___| |___| |___| |___| |___| |___| |___|11 |___| |___|___| |___|___| |___| |___| |___| |___| |___| |___|12 |___| |___|___| |___|___| |___| |___| |___| |___| |___| |___|13 |___| |___|___| |___|___| |___| |___| |___| |___| |___| |___|14 |___| |___|___| |___|___| |___| |___| |___| |___| |___| |___|15 |___| |___|___| |___|___| |___| |___| |___| |___| |___| |___|
21Version: 22 August 2013

133
Section 6: Work around 15 March 2011 (for ALL respondents)WORK STATUS 15 March 2011 NOT WORKING 15 March 2011
# of
per
son
600 Interviewer check:Is […] 11years of age or older?
1 Yes 2 No 700
601Please think back about two and a half years. On (or around) 15 March 2011, when the violent conflict in Syria began, did […] work for a wage or salary, or for other income in cash or kind, even if only for one hour a week?
For children:Include work even if […] did not go to work on his/her own, but followed another household member or other person.
1 Yes 6092 No
8 DK9 NA
602On (or around) 15 March 2011, when the violent conflict in Syria began, did […] make any money—including payment in kind—from self-employment, i.e. trading, farming, home production for sale, personal services etc.?
1 Yes 6092 No
8 DK 9 NA
603On (or around) 15 March 2011, when the violent conflict in Syria began, did […] work for an enterprise or crop production belonging to a member of the household, even if not paid or for own consumption?
1 Yes 6092 No
8 DK 9 NA
604On (or around) 15 March 2011, when the violent conflict in Syria began, did […] have a job or business from which (s)he was temporarily absent due to illness, holidays, temporary layoff or other reasons?
1 Yes 6092 No
8 DK 9 NA
605If a job had been available on (or around) 15 March 2011, would […] have been able to start working?
1 Yes2 No 6118 DK 6119 NA 611
606Did […] want to work on (or around) 15 March 2011?
1 Yes2 No 6118 DK 6119 NA 611
607On (or around) 15 March 2011, did […] actively look for work or did […] try to start a business?
1 Yes2 No 6118 DK 6119 NA611
1 |___| |___| |___| |___| |___| |___| |___| |___|2 |___| |___| |___| |___| |___| |___| |___| |___|3 |___| |___| |___| |___| |___| |___| |___| |___|4 |___| |___| |___| |___| |___| |___| |___| |___|5 |___| |___| |___| |___| |___| |___| |___| |___|6 |___| |___| |___| |___| |___| |___| |___| |___|7 |___| |___| |___| |___| |___| |___| |___| |___|8 |___| |___| |___| |___| |___| |___| |___| |___|9 |___| |___| |___| |___| |___| |___| |___| |___|10 |___| |___| |___| |___| |___| |___| |___| |___|11 |___| |___| |___| |___| |___| |___| |___| |___|12 |___| |___| |___| |___| |___| |___| |___| |___|13 |___| |___| |___| |___| |___| |___| |___| |___|14 |___| |___| |___| |___| |___| |___| |___| |___|15 |___| |___| |___| |___| |___| |___| |___| |___|
22Version: 22 August 2013
# of
per
son
608On (or around) 15 March 2011, for how long had […] been actively looking for work?
1. < 3 months2. 3-6 months3. 7-12 months4. >12 months
8 DK9 NA
All 611
609INDUSTRY
For main or most important job
What kind of industry, business, service or activity was carried out at the place of work of […]?
If respondent does not understand, give examples
What were the main goods/products or services produced at the place where [...] worked?
Record if business was wholesale trade, retail trade, manufacturing, or services
ISIC code
610OCCUPATION
What kind of work did […] usually do in this job/activity?
Write down (a) job titleand (b) main tasks or duties
ISCO code
611Please think back about two and a half years. On (or around) 15 March 2011, when the violent conflict in Syria began, what was […]’s main activity?
1 Employed (including temporarily absent) 2 Unemployed (actively seeking work) 7003 Student 7004 Housewife 7005 Retired 7006 Have means (need not work) 7007 Other 700
8 DK 7009 NA 700
612In his/ her main job at the time, what was […]'s employment status? Was (s)he …
Read answer categories1 A paid employee (receiving a
wage or salary)2 Paid employee in family
business3 An employer (with paid
workers other than family members)
4 Own-account worker (or employs only family members)
5 Unpaid worker in a family farm or business
6 Trainee (work without pay)
8 DK 9 NA
1 |___| |___|___|___| |___|___|___| |___| |___|2 |___| |___|___|___| |___|___|___| |___| |___|3 |___| |___|___|___| |___|___|___| |___| |___|4 |___| |___|___|___| |___|___|___| |___| |___|5 |___| |___|___|___| |___|___|___| |___| |___|6 |___| |___|___|___| |___|___|___| |___| |___|7 |___| |___|___|___| |___|___|___| |___| |___|8 |___| |___|___|___| |___|___|___| |___| |___|9 |___| |___|___|___| |___|___|___| |___| |___|
10 |___| |___|___|___| |___|___|___| |___| |___|11 |___| |___|___|___| |___|___|___| |___| |___|12 |___| |___|___|___| |___|___|___| |___| |___|13 |___| |___|___|___| |___|___|___| |___| |___|14 |___| |___|___|___| |___|___|___| |___| |___|15 |___| |___|___|___| |___|___|___| |___| |___|
MAIN JOB 15 March 2011
23Version: 22 August 2013
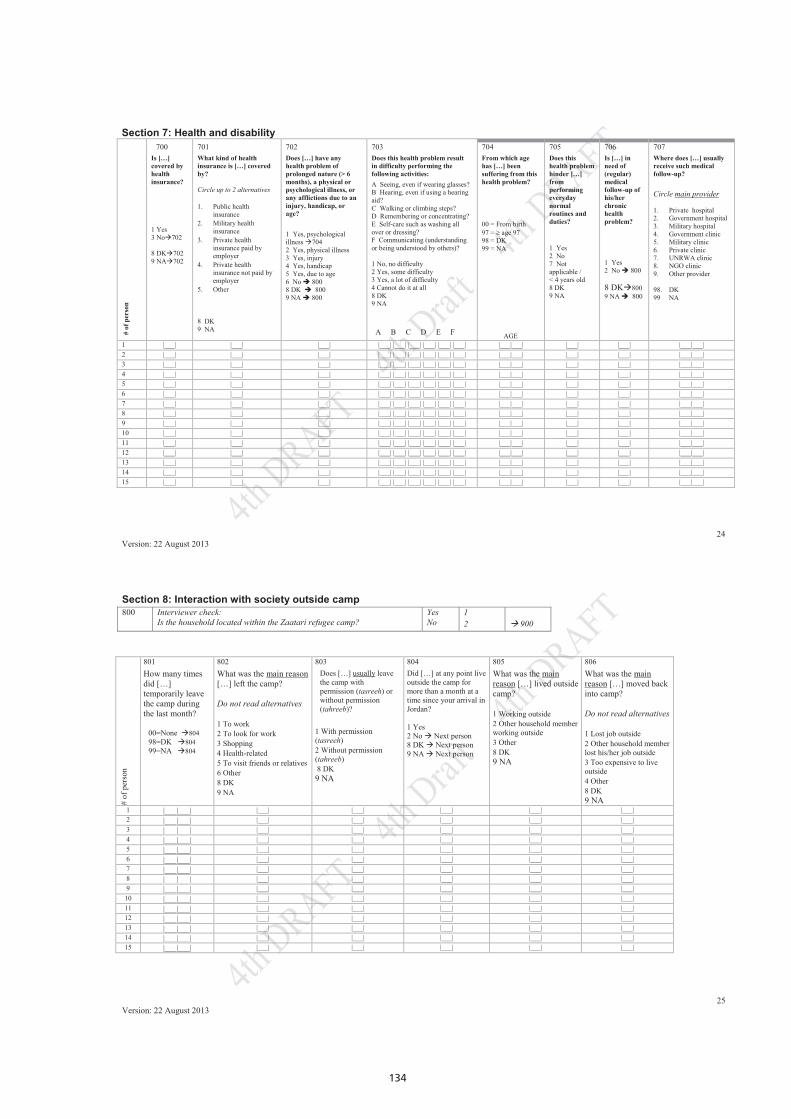
134
Section 7: Health and disability#
of p
erso
n
700Is […] covered by health insurance?
1 Yes3 No702
8 DK7029 NA702
701What kind of health insurance is […] covered by?
Circle up to 2 alternatives
1. Public health insurance
2. Military health insurance
3. Private health insurance paid by employer
4. Private health insurance not paid by employer
5. Other
8 DK 9 NA
702Does […] have any health problem of prolonged nature (> 6 months), a physical or psychological illness, or any afflictions due to an injury, handicap, or age?
1 Yes, psychological illness 7042 Yes, physical illness3 Yes, injury4 Yes, handicap5 Yes, due to age6 No 8008 DK 8009 NA 800
703Does this health problem result in difficulty performing the following activities:A Seeing, even if wearing glasses?B Hearing, even if using a hearing aid?C Walking or climbing steps?D Remembering or concentrating?E Self-care such as washing all over or dressing?F Communicating (understanding or being understood by others)?
1 No, no difficulty2 Yes, some difficulty3 Yes, a lot of difficulty4 Cannot do it at all8 DK 9 NA
A B C D E F
704From which agehas […] been suffering from this health problem?
00 = From birth97 = ≥ age 97 98 = DK99 = NA
AGE
705Does this health problem hinder […] from performing everyday normal routines and duties?
1 Yes 2 No7 Not applicable / < 4 years old 8 DK 9 NA
706Is […] in need of (regular) medical follow-up of his/her chronic health problem?
1 Yes2 No 800
8 DK8009 NA 800
707Where does […] usually receive such medical follow-up?
Circle main provider
1. Private hospital 2. Government hospital3. Military hospital4. Government clinic 5. Military clinic6. Private clinic7. UNRWA clinic8. NGO clinic9. Other provider
98. DK99 NA
1 |___| |___| |___| |___| |___| |___| |___| |___| |___| |___|___| |___| |___| |___|___|2 |___| |___| |___| |___| |___| |___| |___| |___| |___| |___|___| |___| |___| |___|___|3 |___| |___| |___| |___| |___| |___| |___| |___| |___| |___|___| |___| |___| |___|___|4 |___| |___| |___| |___| |___| |___| |___| |___| |___| |___|___| |___| |___| |___|___|5 |___| |___| |___| |___| |___| |___| |___| |___| |___| |___|___| |___| |___| |___|___|6 |___| |___| |___| |___| |___| |___| |___| |___| |___| |___|___| |___| |___| |___|___|7 |___| |___| |___| |___| |___| |___| |___| |___| |___| |___|___| |___| |___| |___|___|8 |___| |___| |___| |___| |___| |___| |___| |___| |___| |___|___| |___| |___| |___|___|9 |___| |___| |___| |___| |___| |___| |___| |___| |___| |___|___| |___| |___| |___|___|10 |___| |___| |___| |___| |___| |___| |___| |___| |___| |___|___| |___| |___| |___|___|11 |___| |___| |___| |___| |___| |___| |___| |___| |___| |___|___| |___| |___| |___|___|12 |___| |___| |___| |___| |___| |___| |___| |___| |___| |___|___| |___| |___| |___|___|13 |___| |___| |___| |___| |___| |___| |___| |___| |___| |___|___| |___| |___| |___|___|14 |___| |___| |___| |___| |___| |___| |___| |___| |___| |___|___| |___| |___| |___|___|15 |___| |___| |___| |___| |___| |___| |___| |___| |___| |___|___| |___| |___| |___|___|
24Version: 22 August 2013
Section 8: Interaction with society outside camp800 Interviewer check:
Is the household located within the Zaatari refugee camp?YesNo
12 900
# of
per
son
801How many times did […] temporarily leave the camp during the last month?
00=None 80498=DK 80499=NA 804
802What was the main reason[…] left the camp?
Do not read alternatives
1 To work2 To look for work3 Shopping4 Health-related5 To visit friends or relatives6 Other8 DK9 NA
803Does […] usually leave the camp with permission (tasreeh) or without permission (tahreeb)?
1 With permission (tasreeh)2 Without permission (tahreeb)8 DK9 NA
804Did […] at any point live outside the camp for more than a month at a time since your arrival in Jordan?
1 Yes2 No Next person8 DK Next person9 NA Next person
805What was the main reason […] lived outside camp?
1 Working outside2 Other household member working outside3 Other8 DK9 NA
806What was the main reason […] moved back into camp?
Do not read alternatives
1 Lost job outside2 Other household member lost his/her job outside3 Too expensive to live outside4 Other8 DK9 NA
1 |___|___| |___| |___| |___| |___| |___|2 |___|___| |___| |___| |___| |___| |___|3 |___|___| |___| |___| |___| |___| |___|4 |___|___| |___| |___| |___| |___| |___|5 |___|___| |___| |___| |___| |___| |___|6 |___|___| |___| |___| |___| |___| |___|7 |___|___| |___| |___| |___| |___| |___|8 |___|___| |___| |___| |___| |___| |___|9 |___|___| |___| |___| |___| |___| |___|
10 |___|___| |___| |___| |___| |___| |___|11 |___|___| |___| |___| |___| |___| |___|12 |___|___| |___| |___| |___| |___| |___|13 |___|___| |___| |___| |___| |___| |___|14 |___|___| |___| |___| |___| |___| |___|15 |___|___| |___| |___| |___| |___| |___|
25Version: 22 August 2013
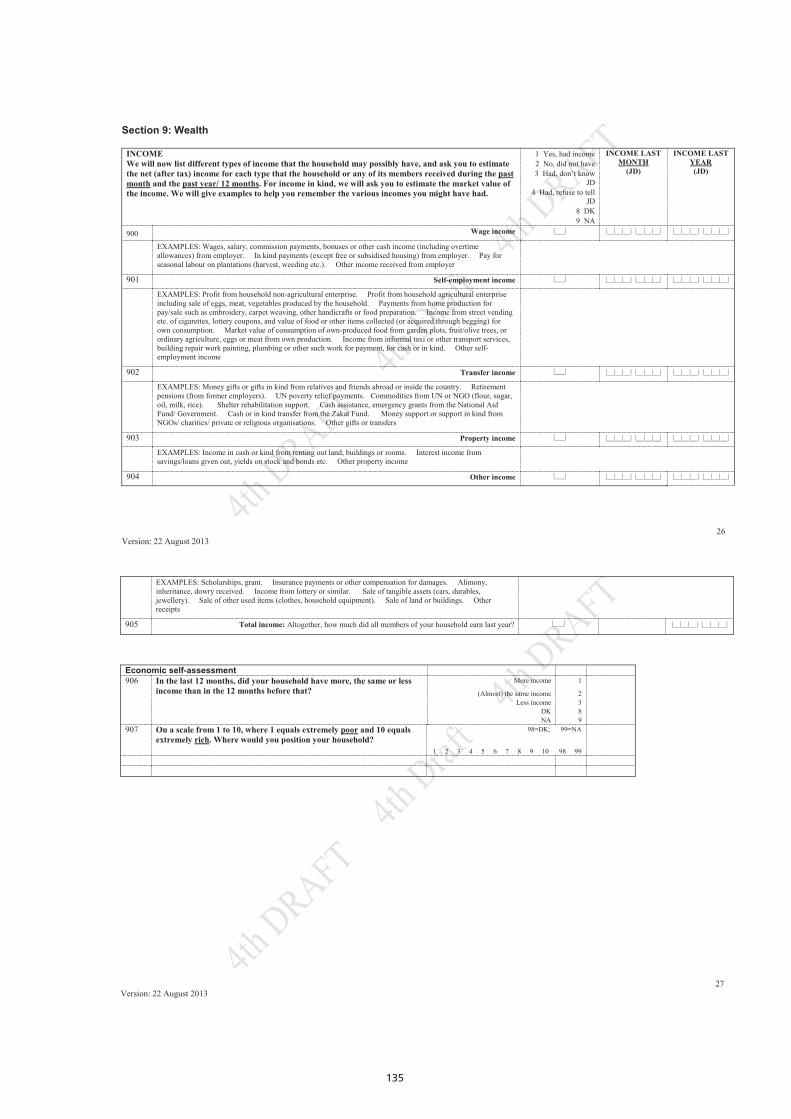
135
Section 9: Wealth
INCOMEWe will now list different types of income that the household may possibly have, and ask you to estimate the net (after tax) income for each type that the household or any of its members received during the past month and the past year/ 12 months. For income in kind, we will ask you to estimate the market value of the income. We will give examples to help you remember the various incomes you might have had.
1 Yes, had income2 No, did not have3 Had, don’t know
JD4 Had, refuse to tell
JD8 DK9 NA
INCOME LAST MONTH
(JD)
INCOME LAST YEAR(JD)
900 Wage income |___| |__|__|__| |__|__|__| |__|__|__| |__|__|__|
EXAMPLES: Wages, salary, commission payments, bonuses or other cash income (including overtime allowances) from employer. In kind payments (except free or subsidised housing) from employer. Pay for seasonal labour on plantations (harvest, weeding etc.). Other income received from employer
901 Self-employment income |___| |__|__|__| |__|__|__| |__|__|__| |__|__|__|
EXAMPLES: Profit from household non-agricultural enterprise. Profit from household agricultural enterprise including sale of eggs, meat, vegetables produced by the household. Payments from home production for pay/sale such as embroidery, carpet weaving, other handicrafts or food preparation. Income from street vending etc. of cigarettes, lottery coupons, and value of food or other items collected (or acquired through begging) for own consumption. Market value of consumption of own-produced food from garden plots, fruit/olive trees, or ordinary agriculture, eggs or meat from own production. Income from informal taxi or other transport services, building repair work painting, plumbing or other such work for payment, for cash or in kind. Other self-employment income
902 Transfer income |___| |__|__|__| |__|__|__| |__|__|__| |__|__|__|
EXAMPLES: Money gifts or gifts in kind from relatives and friends abroad or inside the country. Retirement pensions (from former employers). UN poverty relief payments. Commodities from UN or NGO (flour, sugar, oil, milk, rice). Shelter rehabilitation support. Cash assistance, emergency grants from the National Aid Fund/ Government. Cash or in kind transfer from the Zakat Fund. Money support or support in kind from NGOs/ charities/ private or religious organisations. Other gifts or transfers
903 Property income |___| |__|__|__| |__|__|__| |__|__|__| |__|__|__|
EXAMPLES: Income in cash or kind from renting out land, buildings or rooms. Interest income from savings/loans given out, yields on stock and bonds etc. Other property income
904 Other income |___| |__|__|__| |__|__|__| |__|__|__| |__|__|__|
26Version: 22 August 2013
EXAMPLES: Scholarships, grant. Insurance payments or other compensation for damages. Alimony, inheritance, dowry received. Income from lottery or similar. Sale of tangible assets (cars, durables, jewellery). Sale of other used items (clothes, household equipment). Sale of land or buildings. Other receipts
905 Total income: Altogether, how much did all members of your household earn last year? |___| |__|__|__| |__|__|__|
Economic self-assessment906 In the last 12 months, did your household have more, the same or less
income than in the 12 months before that?More income
(Almost) the same incomeLess income
DKNA
1
2389
907 On a scale from 1 to 10, where 1 equals extremely poor and 10 equals extremely rich. Where would you position your household?
98=DK; 99=NA
1 2 3 4 5 6 7 8 9 10 98 99
27Version: 22 August 2013
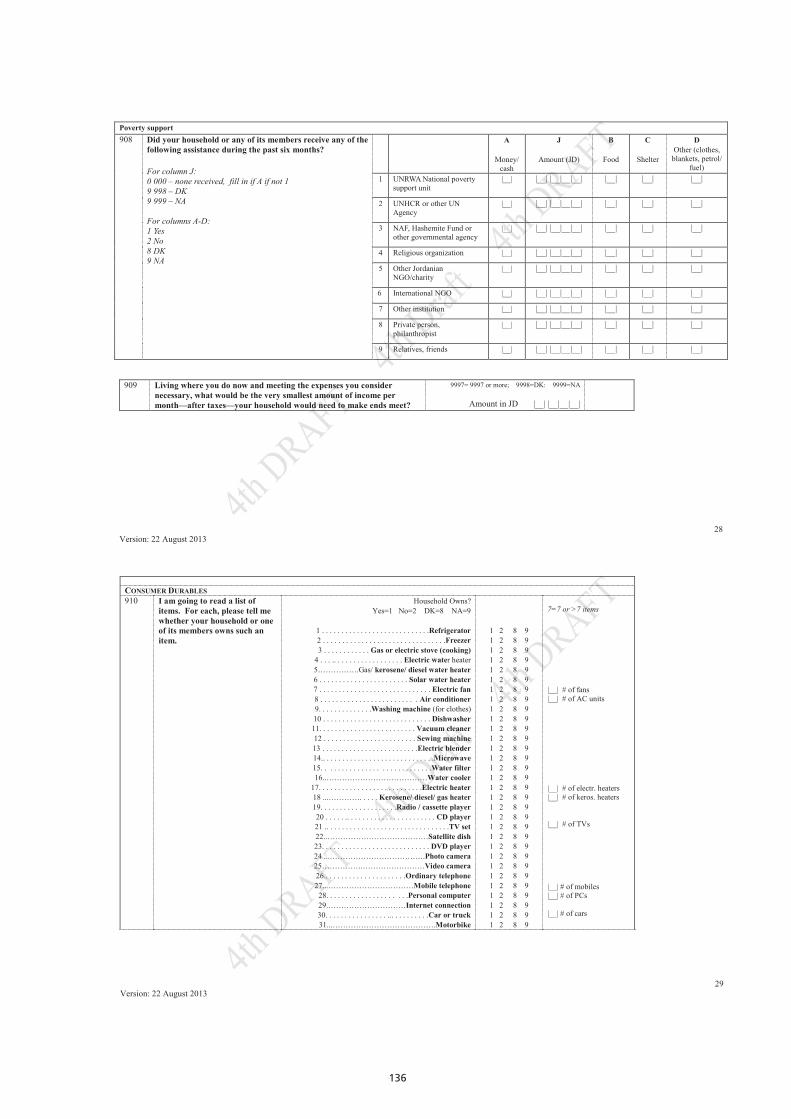
136
909 Living where you do now and meeting the expenses you consider necessary, what would be the very smallest amount of income per month—after taxes—your household would need to make ends meet?
9997= 9997 or more; 9998=DK: 9999=NA
Amount in JD |__| |__|__|__|
Poverty support908 Did your household or any of its members receive any of the
following assistance during the past six months?
For column J: 0 000 – none received, fill in if A if not 19 998 – DK9 999 – NA
For columns A-D:1 Yes2 No8 DK9 NA
A
Money/ cash
J
Amount (JD)
B
Food
C
Shelter
DOther (clothes,
blankets, petrol/ fuel)
1 UNRWA National poverty support unit
|__| |__| |__|__|__| |__| |__| |__|
2 UNHCR or other UN Agency
|__| |__| |__|__|__| |__| |__| |__|
3 NAF, Hashemite Fund or other governmental agency
|__| |__| |__|__|__| |__| |__| |__|
4 Religious organization |__| |__| |__|__|__| |__| |__| |__|
5 Other Jordanian NGO/charity
|__| |__| |__|__|__| |__| |__| |__|
6 International NGO |__| |__| |__|__|__| |__| |__| |__|
7 Other institution |__| |__| |__|__|__| |__| |__| |__|
8 Private person, philanthropist
|__| |__| |__|__|__| |__| |__| |__|
9 Relatives, friends |__| |__| |__|__|__| |__| |__| |__|
28Version: 22 August 2013
CONSUMER DURABLES910 I am going to read a list of
items. For each, please tell me whether your household or oneof its members owns such an item.
Household Owns?Yes=1 No=2 DK=8 NA=9
1 . . . . . . . . . . . . . . . . . . . . . . . . . . . .Refrigerator2 . . . . . . . . . . . . . . . . . . . . . . . . . . . . . . . .Freezer3 . . . . . . . . . . . . Gas or electric stove (cooking)
4 . . . .. . . . . . . . . . . . . . . . . . Electric water heater5…………….Gas/ kerosene/ diesel water heater6 . . . . . . . . . . . . . . . . . . . . . . . Solar water heater7 . . . . . . . . . . . . . . . . . . . . . . . . . . . . . Electric fan8 . . . . . . . . . . . . . . . . . . . . . . . . . Air conditioner9. . . . . . . . . . . . . .Washing machine (for clothes)10 . . . . . . . . . . . . . . . . . . . . . . . . . . . . Dishwasher11. . . . . . . . . . . . . . . . . . . . . . . . . Vacuum cleaner12 . . . . . . . . . . . . . . . . . . . . . . . . Sewing machine13 . . . . . . . . . . . . . . . . . . . . . . . . .Electric blender14.. . . . . . . . . . . . . . . . . . . . . . . . . . . . .Microwave15. . . . . . . . . . . . . . . . . . . . . . . . . . . .Water filter16..…………………………………Water cooler
17. . . . . . . . . . . . . . . . . . . . . . . . . . .Electric heater18 ...…………. . . . . Kerosene/ diesel/ gas heater19. . . . . . . . . . . . . . . . . . . .Radio / cassette player20 . . . . . .. . . . . . . . . . . . . . . . . . . . . . . CD player21 .. . . . . . . . . . . . . . . . . . . . . . . . . . . . . . . .TV set22..…………………………………Satellite dish23. . . . . . . . . . . . . . . . . . . . . . . . . . . . DVD player24 ...……………………………….Photo camera25…………….……………………Video camera26.. . . . . . . . . . . . . . . . . . . . .Ordinary telephone27...……………………………Mobile telephone
28. . . . . . . . . . . . . . . . . . . . .Personal computer29.…………………………Internet connection30. . . . . . . . . . . . . . . . ... . . . . . . . . .Car or truck31...………………………………….Motorbike
1 2 8 91 2 8 91 2 8 91 2 8 91 2 8 91 2 8 91 2 8 91 2 8 91 2 8 91 2 8 91 2 8 91 2 8 91 2 8 91 2 8 91 2 8 91 2 8 91 2 8 91 2 8 91 2 8 91 2 8 91 2 8 91 2 8 91 2 8 91 2 8 91 2 8 91 2 8 91 2 8 91 2 8 91 2 8 91 2 8 91 2 8 9
7=7 or >7 items
|__| # of fans|__| # of AC units
|__| # of electr. heaters|__| # of keros. heaters
|__| # of TVs
|__| # of mobiles|__| # of PCs
|__| # of cars
29Version: 22 August 2013
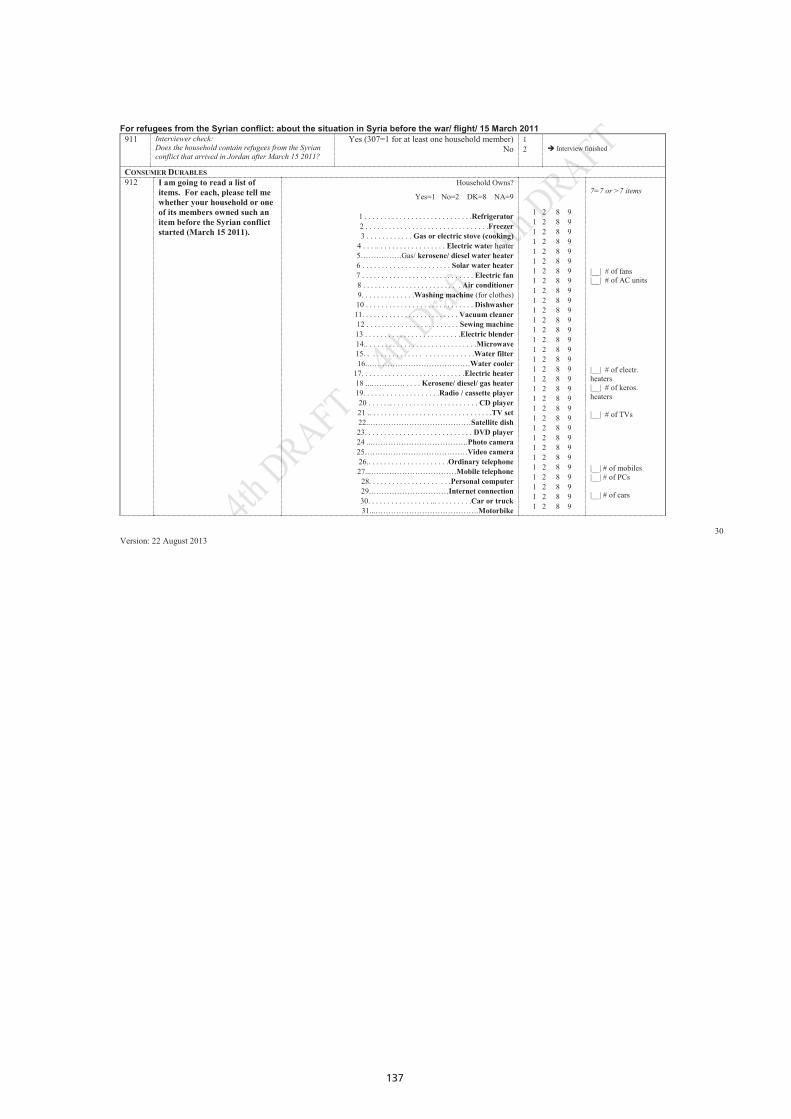
137
For refugees from the Syrian conflict: about the situation in Syria before the war/ flight/ 15 March 2011911 Interviewer check:
Does the household contain refugees from the Syrian conflict that arrived in Jordan after March 15 2011?
Yes (307=1 for at least one household member)No
12 Interview finished
CONSUMER DURABLES912 I am going to read a list of
items. For each, please tell me whether your household or oneof its members owned such an item before the Syrian conflict started (March 15 2011).
Household Owns?
Yes=1 No=2 DK=8 NA=9
1 . . . . . . . . . . . . . . . . . . . . . . . . . . . .Refrigerator2 . . . . . . . . . . . . . . . . . . . . . . . . . . . . . . . .Freezer3 . . . . . . . . . . . . Gas or electric stove (cooking)
4 . . . .. . . . . . . . . . . . . . . . . . Electric water heater5…………….Gas/ kerosene/ diesel water heater6 . . . . . . . . . . . . . . . . . . . . . . . Solar water heater7 . . . . . . . . . . . . . . . . . . . . . . . . . . . . . Electric fan8 . . . . . . . . . . . . . . . . . . . . . . . . . Air conditioner9. . . . . . . . . . . . . .Washing machine (for clothes)10 . . . . . . . . . . . . . . . . . . . . . . . . . . . . Dishwasher11. . . . . . . . . . . . . . . . . . . . . . . . . Vacuum cleaner12 . . . . . . . . . . . . . . . . . . . . . . . . Sewing machine13 . . . . . . . . . . . . . . . . . . . . . . . . .Electric blender14.. . . . . . . . . . . . . . . . . . . . . . . . . . . . .Microwave15. . . . . . . . . . . . . . . . . . . . . . . . . . . .Water filter16..…………………………………Water cooler
17. . . . . . . . . . . . . . . . . . . . . . . . . . .Electric heater18 ...…………. . . . . Kerosene/ diesel/ gas heater19. . . . . . . . . . . . . . . . . . . .Radio / cassette player20 . . . . . .. . . . . . . . . . . . . . . . . . . . . . . CD player21 .. . . . . . . . . . . . . . . . . . . . . . . . . . . . . . . .TV set22..…………………………………Satellite dish23. . . . . . . . . . . . . . . . . . . . . . . . . . . . DVD player24 ...……………………………….Photo camera25…………….……………………Video camera26.. . . . . . . . . . . . . . . . . . . . .Ordinary telephone27...……………………………Mobile telephone
28. . . . . . . . . . . . . . . . . . . . .Personal computer29.…………………………Internet connection30. . . . . . . . . . . . . . . . ... . . . . . . . . .Car or truck31...………………………………….Motorbike
1 2 8 91 2 8 91 2 8 91 2 8 91 2 8 91 2 8 91 2 8 91 2 8 91 2 8 91 2 8 91 2 8 91 2 8 91 2 8 91 2 8 91 2 8 91 2 8 91 2 8 91 2 8 91 2 8 91 2 8 91 2 8 91 2 8 91 2 8 91 2 8 91 2 8 91 2 8 91 2 8 91 2 8 91 2 8 91 2 8 91 2 8 9
7=7 or >7 items
|__| # of fans|__| # of AC units
|__| # of electr. heaters|__| # of keros. heaters
|__| # of TVs
|__| # of mobiles|__| # of PCs
|__| # of cars
30Version: 22 August 2013
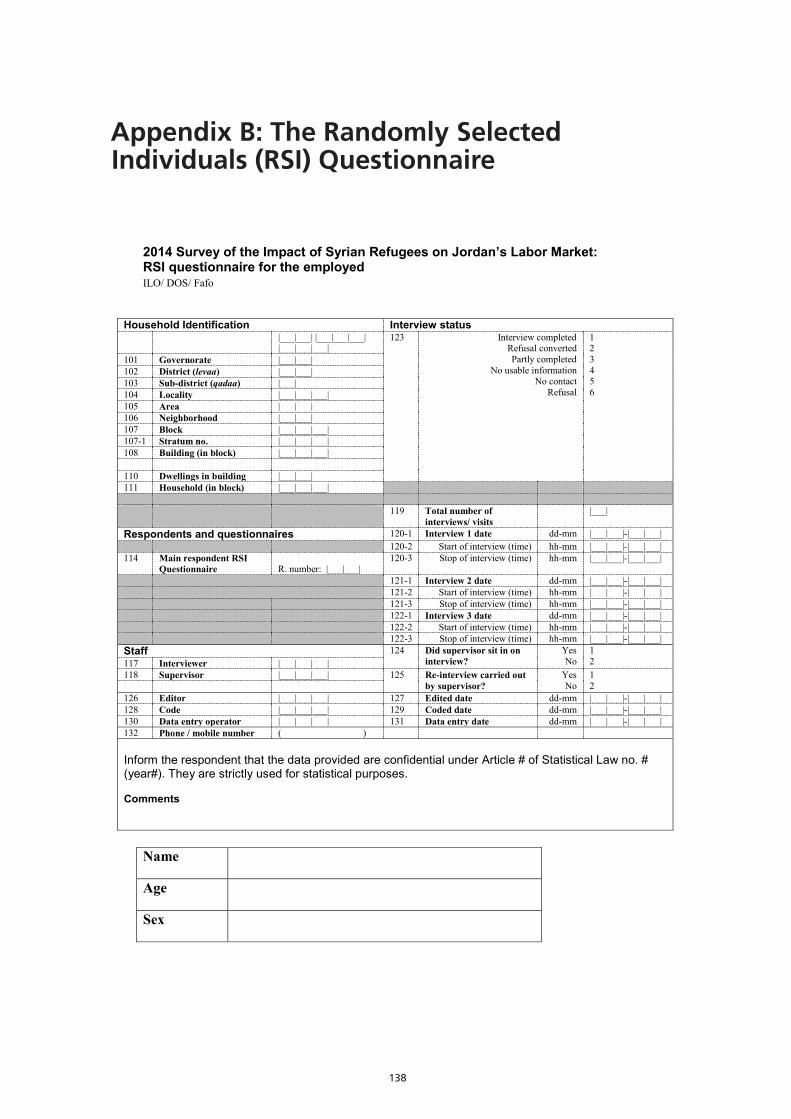
138
Appendix B: The Randomly Selected Individuals (RSI) Questionnaire
2014 Survey of the Impact of Syrian Refugees on Jordan’s Labor Market: RSI questionnaire for the employedILO/ DOS/ Fafo
Name
Age
Sex
Household Identification Interview status|___|___| |___|___|___| |___|___|___|
123 Interview completedRefusal convertedPartly completed
No usable informationNo contact
Refusal
123456
101 Governorate |___|___|102 District (levaa) |___|___|103 Sub-district (qadaa) |___|104 Locality |___|___|___|105 Area |___|___|106 Neighborhood |___|___|107 Block |___|___|___|107-1 Stratum no. |___|___|___|108 Building (in block) |___|___|___|
110 Dwellings in building |___|___|111 Household (in block) |___|___|___|
119 Total number of interviews/ visits
|___|
Respondents and questionnaires 120-1 Interview 1 date dd-mm |___|___|-|___|___|120-2 Start of interview (time) hh-mm |___|___|-|___|___|
114 Main respondent RSI Questionnaire R. number: |___|___|
120-3 Stop of interview (time) hh-mm |___|___|-|___|___|
121-1 Interview 2 date dd-mm |___|___|-|___|___|121-2 Start of interview (time) hh-mm |___|___|-|___|___|121-3 Stop of interview (time) hh-mm |___|___|-|___|___|122-1 Interview 3 date dd-mm |___|___|-|___|___|122-2 Start of interview (time) hh-mm |___|___|-|___|___|122-3 Stop of interview (time) hh-mm |___|___|-|___|___|
Staff 124 Did supervisor sit in on interview?
YesNo
12117 Interviewer |___|___|___|
118 Supervisor |___|___|___| 125 Re-interview carried out by supervisor?
YesNo
12
126 Editor |___|___|___| 127 Edited date dd-mm |___|___|-|___|___|128 Code |___|___|___| 129 Coded date dd-mm |___|___|-|___|___|130 Data entry operator |___|___|___| 131 Data entry date dd-mm |___|___|-|___|___|132 Phone / mobile number ( )
Inform the respondent that the data provided are confidential under Article # of Statistical Law no. # (year#). They are strictly used for statistical purposes.
Comments
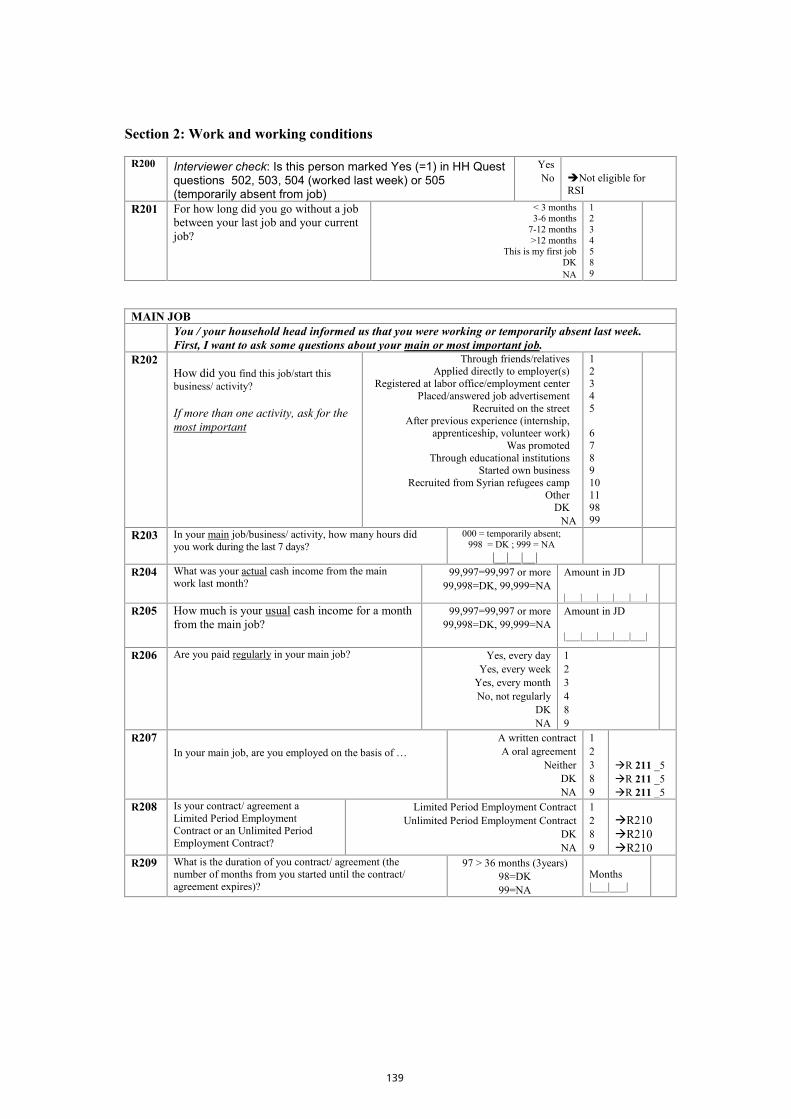
139
Section 2: Work and working conditions
R200 Interviewer check: Is this person marked Yes (=1) in HH Quest questions 502, 503, 504 (worked last week) or 505(temporarily absent from job)
YesNo Not eligible for
RSI
R201 For how long did you go without a job between your last job and your current job?
< 3 months3-6 months
7-12 months>12 months
This is my first jobDKNA
1234589
MAIN JOBYou / your household head informed us that you were working or temporarily absent last week. First, I want to ask some questions about your main or most important job.
R202How did you find this job/start this business/ activity?
If more than one activity, ask for the most important
Through friends/relativesApplied directly to employer(s)
Registered at labor office/employment centerPlaced/answered job advertisement
Recruited on the streetAfter previous experience (internship,
apprenticeship, volunteer work)Was promoted
Through educational institutionsStarted own business
Recruited from Syrian refugees camp Other
DKNA
12345
678910119899
R203 In your main job/business/ activity, how many hours did you work during the last 7 days?
000 = temporarily absent; 998 = DK ; 999 = NA
|__|__|__|R204 What was your actual cash income from the main
work last month?99,997=99,997 or more
99,998=DK, 99,999=NAAmount in JD
|___|___|___|___|___|R205 How much is your usual cash income for a month
from the main job?99,997=99,997 or more
99,998=DK, 99,999=NAAmount in JD
|___|___|___|___|___|
R206 Are you paid regularly in your main job? Yes, every dayYes, every week
Yes, every monthNo, not regularly
DKNA
123489
R207In your main job, are you employed on the basis of …
A written contractA oral agreement
NeitherDKNA
12389
R 211 _5R 211 _5R 211 _5
R208 Is your contract/ agreement a Limited Period Employment Contract or an Unlimited Period Employment Contract?
Limited Period Employment ContractUnlimited Period Employment Contract
DKNA
1289
R210R210R210
R209 What is the duration of you contract/ agreement (the number of months from you started until the contract/ agreement expires)?
97 > 36 months (3years) 98=DK 99=NA
Months|___|___|
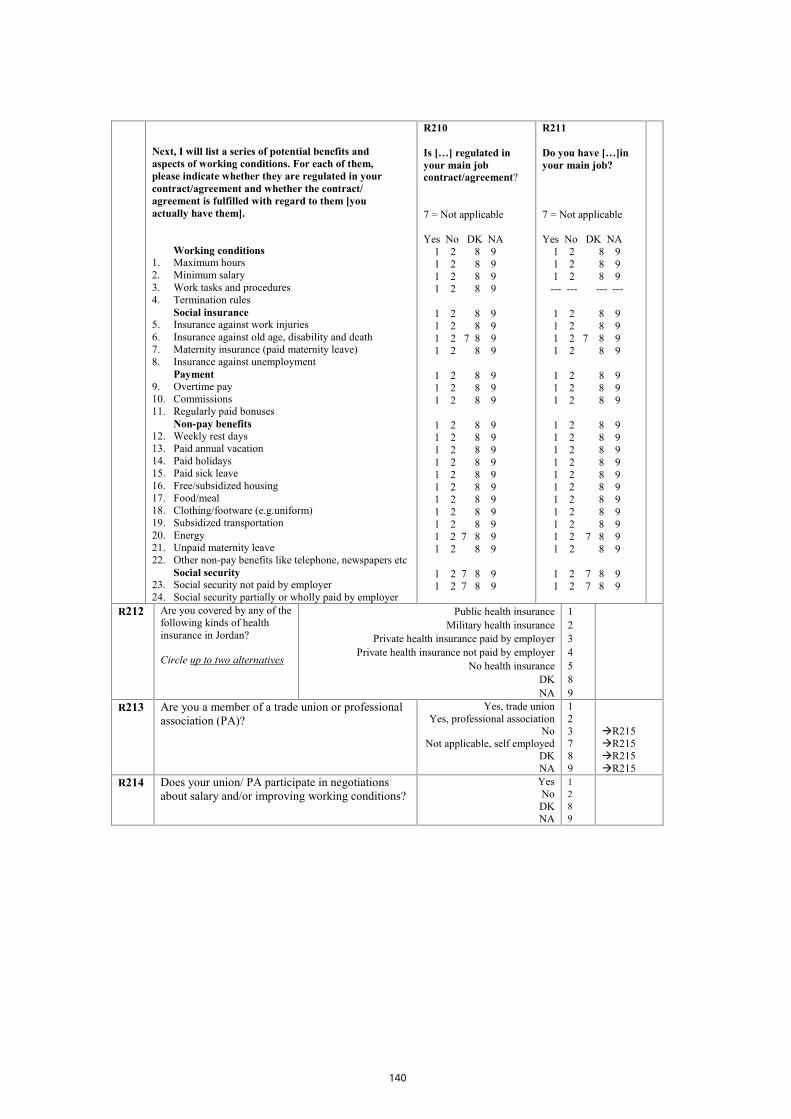
140
Next, I will list a series of potential benefits andaspects of working conditions. For each of them, please indicate whether they are regulated in your contract/agreement and whether the contract/agreement is fulfilled with regard to them [you actually have them].
Working conditions1. Maximum hours2. Minimum salary3. Work tasks and procedures4. Termination rules
Social insurance5. Insurance against work injuries6. Insurance against old age, disability and death7. Maternity insurance (paid maternity leave)8. Insurance against unemployment
Payment9. Overtime pay10. Commissions11. Regularly paid bonuses
Non-pay benefits12. Weekly rest days13. Paid annual vacation14. Paid holidays15. Paid sick leave16. Free/subsidized housing 17. Food/meal18. Clothing/footware (e.g.uniform)19. Subsidized transportation 20. Energy21. Unpaid maternity leave22. Other non-pay benefits like telephone, newspapers etc
Social security23. Social security not paid by employer24. Social security partially or wholly paid by employer
R210
Is […] regulated in your main job contract/agreement?
7 = Not applicable
Yes No DK NA1 2 8 91 2 8 91 2 8 91 2 8 9
1 2 8 91 2 8 91 2 7 8 91 2 8 9
1 2 8 91 2 8 91 2 8 9
1 2 8 91 2 8 91 2 8 91 2 8 91 2 8 91 2 8 91 2 8 91 2 8 91 2 8 91 2 7 8 91 2 8 9
1 2 7 8 91 2 7 8 9
R211
Do you have […]in your main job?
7 = Not applicable
Yes No DK NA1 2 8 91 2 8 91 2 8 9
--- --- --- ---
1 2 8 91 2 8 91 2 7 8 91 2 8 9
1 2 8 91 2 8 91 2 8 9
1 2 8 91 2 8 91 2 8 91 2 8 91 2 8 91 2 8 91 2 8 91 2 8 91 2 8 91 2 7 8 91 2 8 9
1 2 7 8 91 2 7 8 9
R212 Are you covered by any of the following kinds of health insurance in Jordan?
Circle up to two alternatives
Public health insuranceMilitary health insurance
Private health insurance paid by employerPrivate health insurance not paid by employer
No health insuranceDKNA
1234589
R213 Are you a member of a trade union or professional association (PA)?
Yes, trade unionYes, professional association
NoNot applicable, self employed
DKNA
123789
R215R215R215R215
R214 Does your union/ PA participate in negotiations about salary and/or improving working conditions?
YesNoDKNA
1289
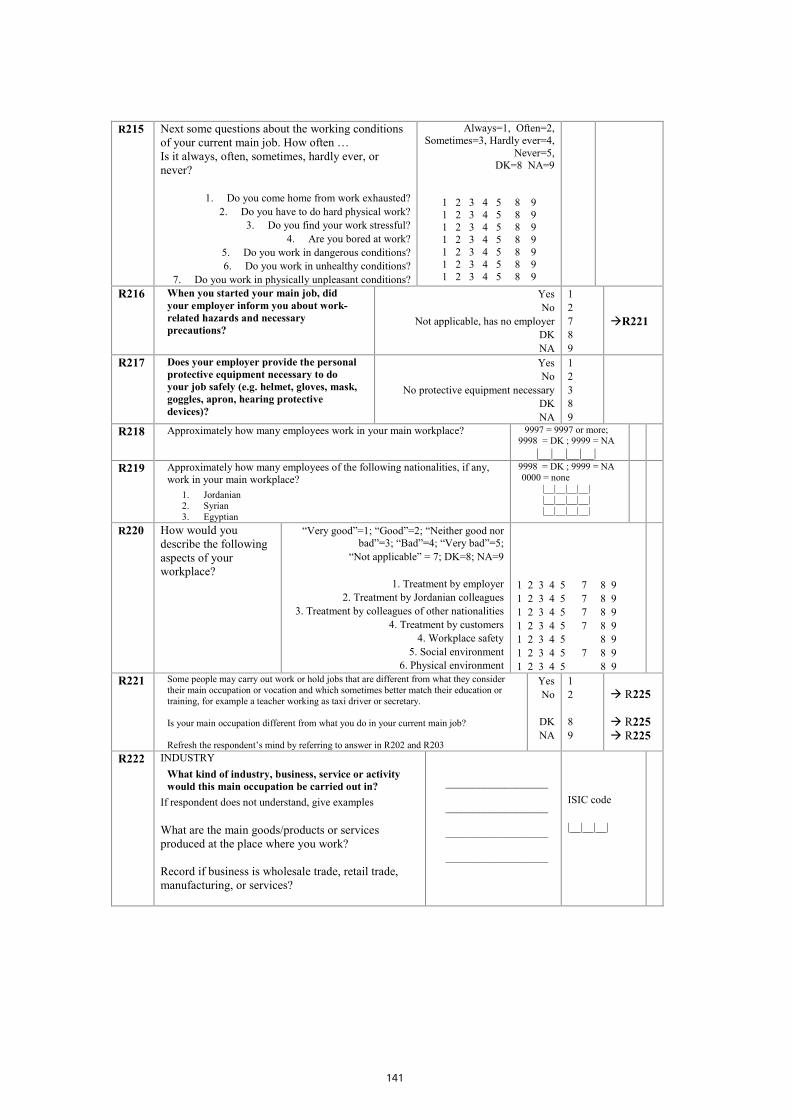
141
R215 Next some questions about the working conditions of your current main job. How often … Is it always, often, sometimes, hardly ever, or never?
1. Do you come home from work exhausted? 2. Do you have to do hard physical work?
3. Do you find your work stressful?4. Are you bored at work?
5. Do you work in dangerous conditions?6. Do you work in unhealthy conditions?
7. Do you work in physically unpleasant conditions?
Always=1, Often=2, Sometimes=3, Hardly ever=4,
Never=5, DK=8 NA=9
1 2 3 4 5 8 91 2 3 4 5 8 91 2 3 4 5 8 91 2 3 4 5 8 91 2 3 4 5 8 91 2 3 4 5 8 91 2 3 4 5 8 9
R216 When you started your main job, did your employer inform you about work-related hazards and necessary precautions?
YesNo
Not applicable, has no employerDKNA
12789
R221
R217 Does your employer provide the personal protective equipment necessary to do your job safely (e.g. helmet, gloves, mask, goggles, apron, hearing protective devices)?
YesNo
No protective equipment necessaryDKNA
12389
R218 Approximately how many employees work in your main workplace? 9997 = 9997 or more; 9998 = DK ; 9999 = NA
|__|__|__|__|R219 Approximately how many employees of the following nationalities, if any,
work in your main workplace?1. Jordanian2. Syrian3. Egyptian
9998 = DK ; 9999 = NA0000 = none
|__|__|__|__||__|__|__|__||__|__|__|__|
R220 How would you describe the following aspects of your workplace?
“Very good”=1; “Good”=2; “Neither good norbad”=3; “Bad”=4; “Very bad”=5;
“Not applicable” = 7; DK=8; NA=9
1. Treatment by employer2. Treatment by Jordanian colleagues
3. Treatment by colleagues of other nationalities4. Treatment by customers
4. Workplace safety5. Social environment
6. Physical environment
1 2 3 4 5 7 8 91 2 3 4 5 7 8 91 2 3 4 5 7 8 91 2 3 4 5 7 8 91 2 3 4 5 8 91 2 3 4 5 7 8 91 2 3 4 5 8 9
R221 Some people may carry out work or hold jobs that are different from what they consider their main occupation or vocation and which sometimes better match their education or training, for example a teacher working as taxi driver or secretary.
Is your main occupation different from what you do in your current main job?
Refresh the respondent’s mind by referring to answer in R202 and R203
YesNo
DKNA
12
89
R225
R225 R225
R222 INDUSTRYWhat kind of industry, business, service or activity would this main occupation be carried out in?
If respondent does not understand, give examples
What are the main goods/products or services produced at the place where you work?
Record if business is wholesale trade, retail trade, manufacturing, or services?
___________________
___________________
___________________
___________________
ISIC code
|__|__|__|
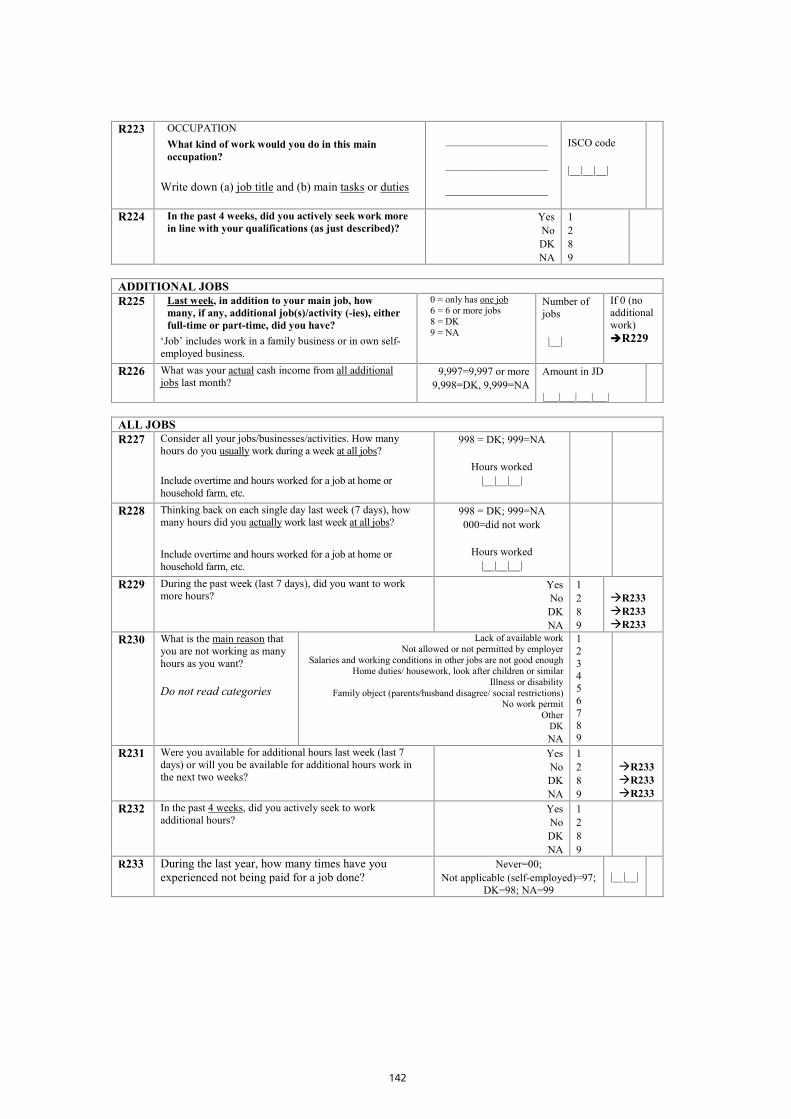
142
R223 OCCUPATIONWhat kind of work would you do in this main occupation?
Write down (a) job title and (b) main tasks or duties
___________________
___________________
___________________
ISCO code
|__|__|__|
R224 In the past 4 weeks, did you actively seek work more in line with your qualifications (as just described)?
YesNoDKNA
1289
ADDITIONAL JOBSR225 Last week, in addition to your main job, how
many, if any, additional job(s)/activity (-ies), either full-time or part-time, did you have?
‘Job’ includes work in a family business or in own self-employed business.
0 = only has one job6 = 6 or more jobs 8 = DK 9 = NA
Number of jobs
|__|
If 0 (no additional work) R229
R226 What was your actual cash income from all additional jobs last month?
9,997=9,997 or more9,998=DK, 9,999=NA
Amount in JD
|___|___|___|___|
ALL JOBSR227 Consider all your jobs/businesses/activities. How many
hours do you usually work during a week at all jobs?
Include overtime and hours worked for a job at home or household farm, etc.
998 = DK; 999=NA
Hours worked|__|__|__|
R228 Thinking back on each single day last week (7 days), how many hours did you actually work last week at all jobs?
Include overtime and hours worked for a job at home or household farm, etc.
998 = DK; 999=NA000=did not work
Hours worked|__|__|__|
R229 During the past week (last 7 days), did you want to work more hours?
YesNoDKNA
1289
R233R233R233
R230 What is the main reason that you are not working as many hours as you want?
Do not read categories
Lack of available workNot allowed or not permitted by employer
Salaries and working conditions in other jobs are not good enoughHome duties/ housework, look after children or similar
Illness or disabilityFamily object (parents/husband disagree/ social restrictions)
No work permitOther
DKNA
123456789
R231 Were you available for additional hours last week (last 7 days) or will you be available for additional hours work in the next two weeks?
YesNoDKNA
1289
R233R233R233
R232 In the past 4 weeks, did you actively seek to work additional hours?
YesNoDKNA
1289
R233 During the last year, how many times have you experienced not being paid for a job done?
Never=00; Not applicable (self-employed)=97;
DK=98; NA=99|__|__|
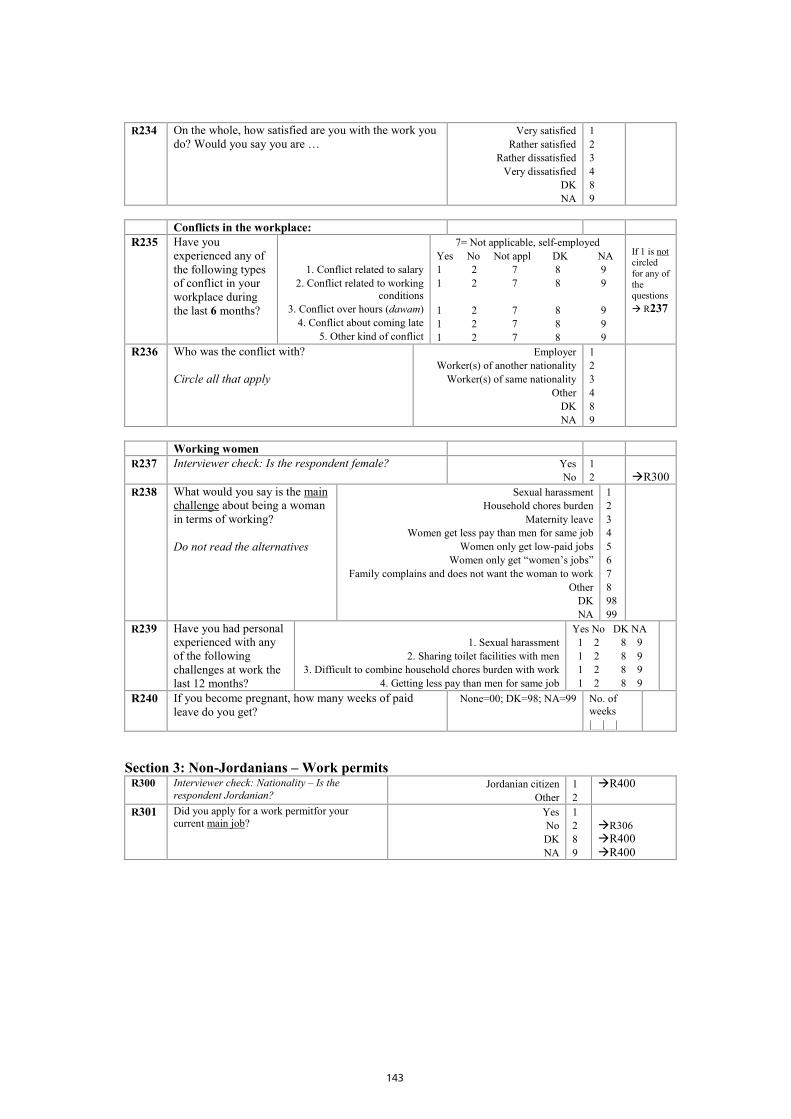
143
R234 On the whole, how satisfied are you with the work you do? Would you say you are …
Very satisfiedRather satisfied
Rather dissatisfiedVery dissatisfied
DKNA
123489
Conflicts in the workplace:R235 Have you
experienced any of the following types of conflict in your workplace during the last 6 months?
1. Conflict related to salary2. Conflict related to working
conditions3. Conflict over hours (dawam)
4. Conflict about coming late5. Other kind of conflict
7= Not applicable, self-employedYes No Not appl DK NA1 2 7 8 91 2 7 8 9
1 2 7 8 91 2 7 8 91 2 7 8 9
If 1 is notcircled for any of the questions R237
R236 Who was the conflict with?
Circle all that apply
EmployerWorker(s) of another nationality
Worker(s) of same nationalityOther
DKNA
123489
Working womenR237 Interviewer check: Is the respondent female? Yes
No12 R300
R238 What would you say is the main challenge about being a woman in terms of working?
Do not read the alternatives
Sexual harassmentHousehold chores burden
Maternity leaveWomen get less pay than men for same job
Women only get low-paid jobsWomen only get “women’s jobs”
Family complains and does not want the woman to workOther
DKNA
123456789899
R239 Have you had personal experienced with any of the following challenges at work the last 12 months?
1. Sexual harassment2. Sharing toilet facilities with men
3. Difficult to combine household chores burden with work4. Getting less pay than men for same job
Yes No DK NA1 2 8 91 2 8 91 2 8 91 2 8 9
R240 If you become pregnant, how many weeks of paid leave do you get?
None=00; DK=98; NA=99 No. of weeks|__|__|
Section 3: Non-Jordanians – Work permitsR300 Interviewer check: Nationality – Is the
respondent Jordanian?Jordanian citizen
Other12
R400
R301 Did you apply for a work permitfor your current main job?
YesNoDKNA
1289
R306R400R400
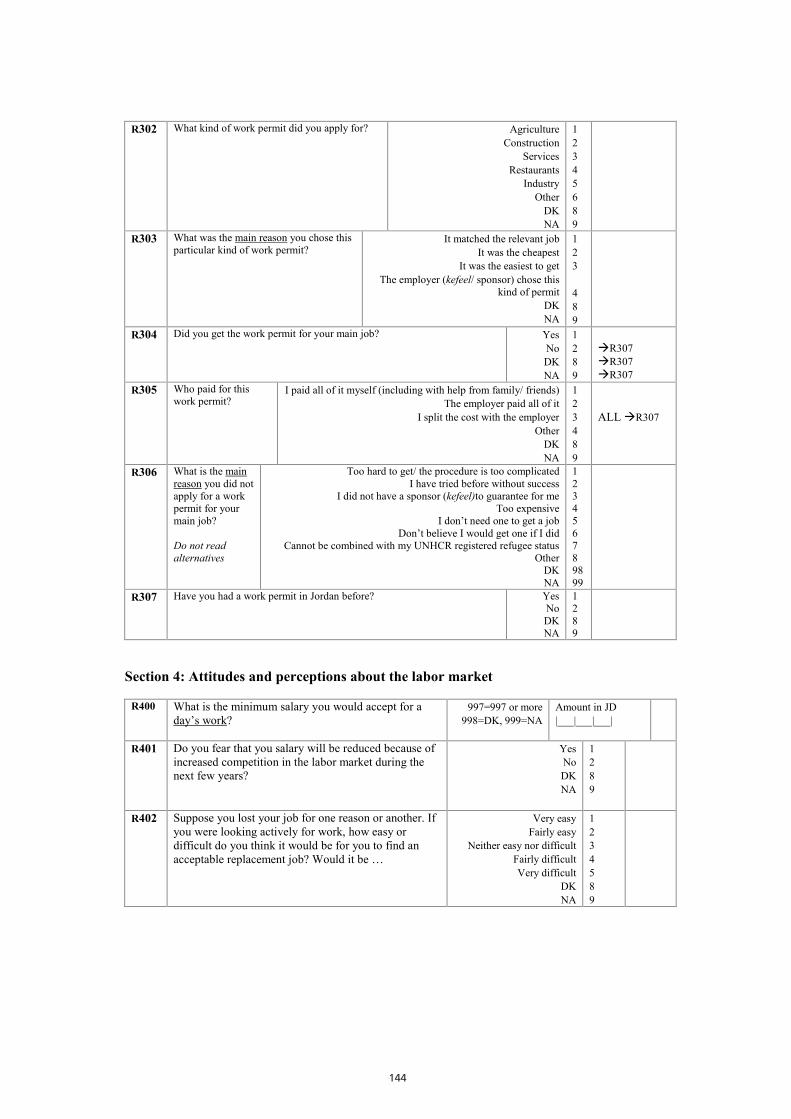
144
R302 What kind of work permit did you apply for? AgricultureConstruction
ServicesRestaurants
IndustryOther
DKNA
12345689
R303 What was the main reason you chose this particular kind of work permit?
It matched the relevant jobIt was the cheapest
It was the easiest to getThe employer (kefeel/ sponsor) chose this
kind of permitDKNA
123
489
R304 Did you get the work permit for your main job? YesNoDKNA
1289
R307R307R307
R305 Who paid for thiswork permit?
I paid all of it myself (including with help from family/ friends)The employer paid all of it
I split the cost with the employerOther
DKNA
123489
ALL R307
R306 What is the main reason you did not apply for a work permit for your main job?
Do not read alternatives
Too hard to get/ the procedure is too complicatedI have tried before without success
I did not have a sponsor (kefeel)to guarantee for meToo expensive
I don’t need one to get a jobDon’t believe I would get one if I did
Cannot be combined with my UNHCR registered refugee statusOther
DKNA
123456789899
R307 Have you had a work permit in Jordan before? YesNoDKNA
1289
Section 4: Attitudes and perceptions about the labor market
R400 What is the minimum salary you would accept for a day’s work?
997=997 or more998=DK, 999=NA
Amount in JD|___|___|___|
R401 Do you fear that you salary will be reduced because of increased competition in the labor market during the next few years?
YesNoDKNA
1289
R402 Suppose you lost your job for one reason or another. If you were looking actively for work, how easy or difficult do you think it would be for you to find an acceptable replacement job? Would it be …
Very easyFairly easy
Neither easy nor difficultFairly difficult Very difficult
DKNA
1234589
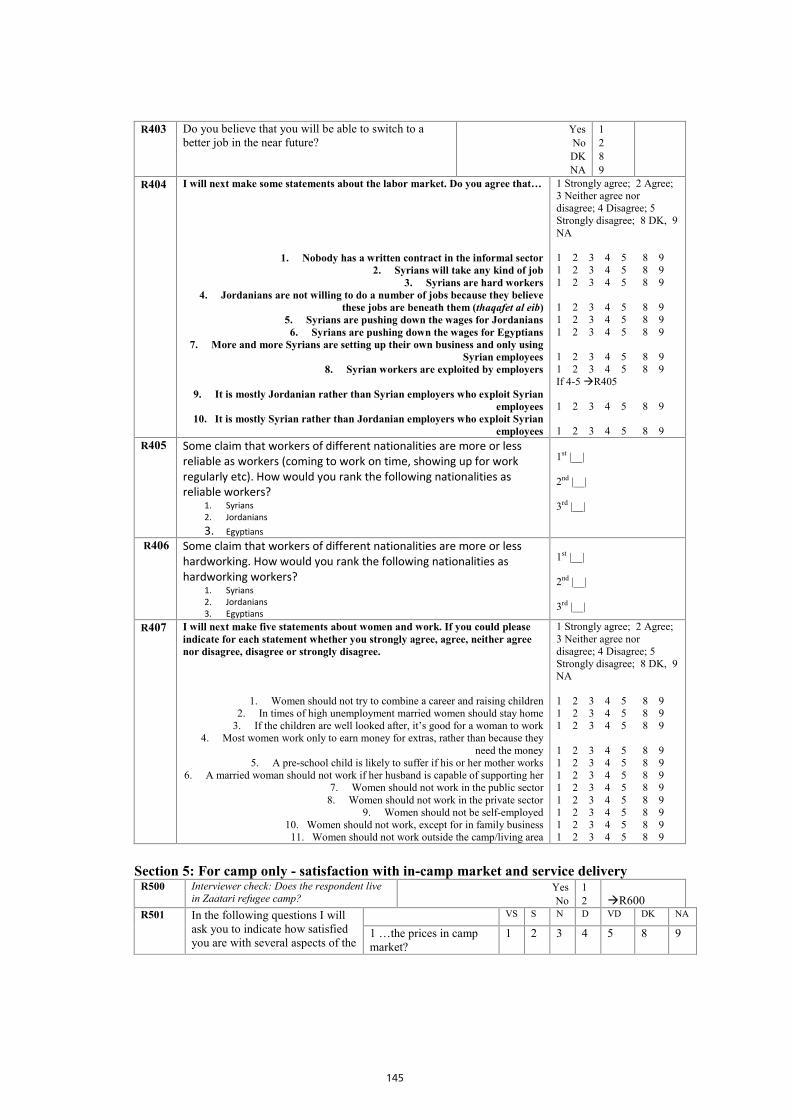
145
R403 Do you believe that you will be able to switch to a better job in the near future?
YesNoDKNA
1289
R404 I will next make some statements about the labor market. Do you agree that…
1. Nobody has a written contract in the informal sector2. Syrians will take any kind of job
3. Syrians are hard workers 4. Jordanians are not willing to do a number of jobs because they believe
these jobs are beneath them (thaqafet al eib)5. Syrians are pushing down the wages for Jordanians6. Syrians are pushing down the wages for Egyptians
7. More and more Syrians are setting up their own business and only using Syrian employees
8. Syrian workers are exploited by employers
9. It is mostly Jordanian rather than Syrian employers who exploit Syrian employees
10. It is mostly Syrian rather than Jordanian employers who exploit Syrian employees
1 Strongly agree; 2 Agree; 3 Neither agree nor disagree; 4 Disagree; 5 Strongly disagree; 8 DK, 9 NA
1 2 3 4 5 8 91 2 3 4 5 8 91 2 3 4 5 8 9
1 2 3 4 5 8 91 2 3 4 5 8 91 2 3 4 5 8 9
1 2 3 4 5 8 91 2 3 4 5 8 9If 4-5R405
1 2 3 4 5 8 9
1 2 3 4 5 8 9R405 Some claim that workers of different nationalities are more or less
reliable as workers (coming to work on time, showing up for work regularly etc). How would you rank the following nationalities as reliable workers?
1. Syrians 2. Jordanians 3. Egyptians
1st |__|
2nd |__|
3rd |__|
R406 Some claim that workers of different nationalities are more or less hardworking. How would you rank the following nationalities as hardworking workers?
1. Syrians 2. Jordanians 3. Egyptians
1st |__|
2nd |__|
3rd |__|
R407 I will next make five statements about women and work. If you could please indicate for each statement whether you strongly agree, agree, neither agree nor disagree, disagree or strongly disagree.
1. Women should not try to combine a career and raising children2. In times of high unemployment married women should stay home
3. If the children are well looked after, it’s good for a woman to work4. Most women work only to earn money for extras, rather than because they
need the money5. A pre-school child is likely to suffer if his or her mother works
6. A married woman should not work if her husband is capable of supporting her7. Women should not work in the public sector
8. Women should not work in the private sector9. Women should not be self-employed
10. Women should not work, except for in family business11. Women should not work outside the camp/living area
1 Strongly agree; 2 Agree; 3 Neither agree nor disagree; 4 Disagree; 5 Strongly disagree; 8 DK, 9 NA
1 2 3 4 5 8 91 2 3 4 5 8 91 2 3 4 5 8 9
1 2 3 4 5 8 91 2 3 4 5 8 91 2 3 4 5 8 91 2 3 4 5 8 91 2 3 4 5 8 91 2 3 4 5 8 91 2 3 4 5 8 91 2 3 4 5 8 9
Section 5: For camp only - satisfaction with in-camp market and service delivery
R500 Interviewer check: Does the respondent live in Zaatari refugee camp?
YesNo
12 R600
R501 In the following questions I will ask you to indicate how satisfied you are with several aspects of the
VS S N D VD DK NA
1 …the prices in camp market?
1 2 3 4 5 8 9
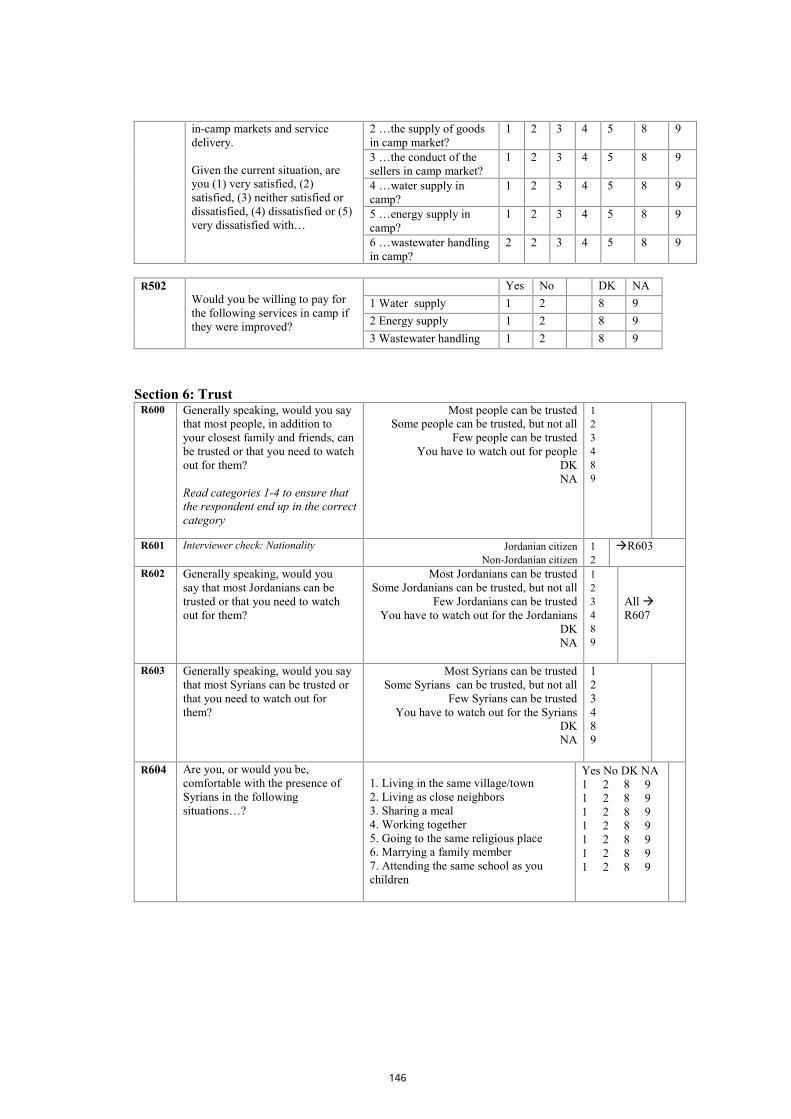
146
in-camp markets and service delivery.
Given the current situation, are you (1) very satisfied, (2) satisfied, (3) neither satisfied or dissatisfied, (4) dissatisfied or (5) very dissatisfied with…
2 …the supply of goods in camp market?
1 2 3 4 5 8 9
3 …the conduct of the sellers in camp market?
1 2 3 4 5 8 9
4 …water supply in camp?
1 2 3 4 5 8 9
5 …energy supply in camp?
1 2 3 4 5 8 9
6 …wastewater handling in camp?
2 2 3 4 5 8 9
R502Would you be willing to pay for the following services in camp if they were improved?
Yes No DK NA1 Water supply 1 2 8 92 Energy supply 1 2 8 93 Wastewater handling 1 2 8 9
Section 6: Trust
R600 Generally speaking, would you say that most people, in addition to your closest family and friends, can be trusted or that you need to watch out for them?
Read categories 1-4 to ensure that the respondent end up in the correct category
Most people can be trustedSome people can be trusted, but not all
Few people can be trustedYou have to watch out for people
DKNA
123489
R601 Interviewer check: Nationality Jordanian citizenNon-Jordanian citizen
12
R603
R602 Generally speaking, would you say that most Jordanians can be trusted or that you need to watch out for them?
Most Jordanians can be trustedSome Jordanians can be trusted, but not all
Few Jordanians can be trustedYou have to watch out for the Jordanians
DKNA
123489
All R607
R603 Generally speaking, would you say that most Syrians can be trusted or that you need to watch out for them?
Most Syrians can be trustedSome Syrians can be trusted, but not all
Few Syrians can be trustedYou have to watch out for the Syrians
DKNA
123489
R604 Are you, or would you be, comfortable with the presence of Syrians in the following situations…?
1. Living in the same village/town2. Living as close neighbors3. Sharing a meal4. Working together5. Going to the same religious place6. Marrying a family member7. Attending the same school as you children
Yes No DK NA1 2 8 91 2 8 91 2 8 91 2 8 91 2 8 91 2 8 91 2 8 9
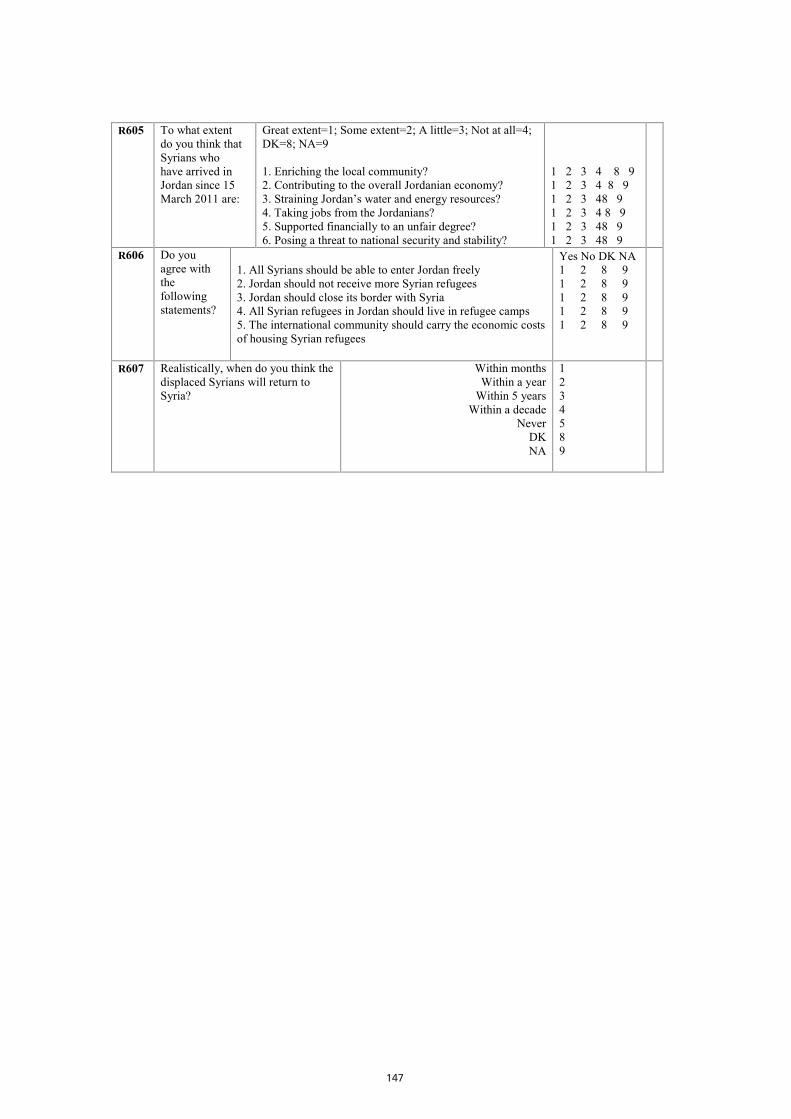
147
R605 To what extent do you think that Syrians who have arrived in Jordan since 15 March 2011 are:
Great extent=1; Some extent=2; A little=3; Not at all=4;DK=8; NA=9
1. Enriching the local community?2. Contributing to the overall Jordanian economy?3. Straining Jordan’s water and energy resources?4. Taking jobs from the Jordanians?5. Supported financially to an unfair degree?6. Posing a threat to national security and stability?
1 2 3 4 8 91 2 3 4 8 91 2 3 48 91 2 3 4 8 91 2 3 48 91 2 3 48 9
R606 Do you agree with the following statements?
1. All Syrians should be able to enter Jordan freely2. Jordan should not receive more Syrian refugees3. Jordan should close its border with Syria4. All Syrian refugees in Jordan should live in refugee camps5. The international community should carry the economic costs of housing Syrian refugees
Yes No DK NA1 2 8 91 2 8 91 2 8 91 2 8 91 2 8 9
R607 Realistically, when do you think the displaced Syrians will return to Syria?
Within monthsWithin a year
Within 5 yearsWithin a decade
NeverDKNA
1234589
Appendix C: Sampling procedures for the survey conducted outside refugee camps
1. Introduction
This document describes the sample of the population survey conducted in the Jordanian governorates Amman, Irbid and Mafraq in February 2014, as part of the Assessment of the Implications of the Influx of Syrian Refugees on the Jordanian Labour Market project. Its main aim is to document the sampling procedures and the procedures for calculating the weight in the survey. The sampling procedure for the survey simultaneously carried out in the Za’atri refugee camp is documented in appendix C.
2. Requirements of the sample
The design of the sample was – like any other sample – subject to a number of constraints. The main design characteristics for the sample were the following:
1. The target population for the survey was all households in Amman, Irbid and Mafraq governorates in Jordan.
2. The budget allowed for a sample of around 3 000 households. Due to frame imperfections, non-response and refusal, a total of 3 070 household interviews successfully completed.
3. The sampling frame
The sampling frame is based on the frame provided by the data of the General Population and Housing Census, 2004, supplied by the Jordanian Department of Statistics (DoS).
4. Sampling design
The sample is designed to cover Amman, Irbid and Mafraq governorates. The sample design (outside the Za’atri refugee camp) is a stratified two-stage adaptive cluster design. The PSUs are enumeration areas, based on the frame provided by the data of the General Population and Housing Census, 2004.
In the first stage of sampling, a first set of PSUs is selected with PPS sampling. Then, in order to assure a sufficient number of Syrian refugee households in the sample, a second set of PSUs is selected, consisting of PSUs bordering the PSUs in the first set that contain a sufficiently high number of households with at least one Syrian.
148
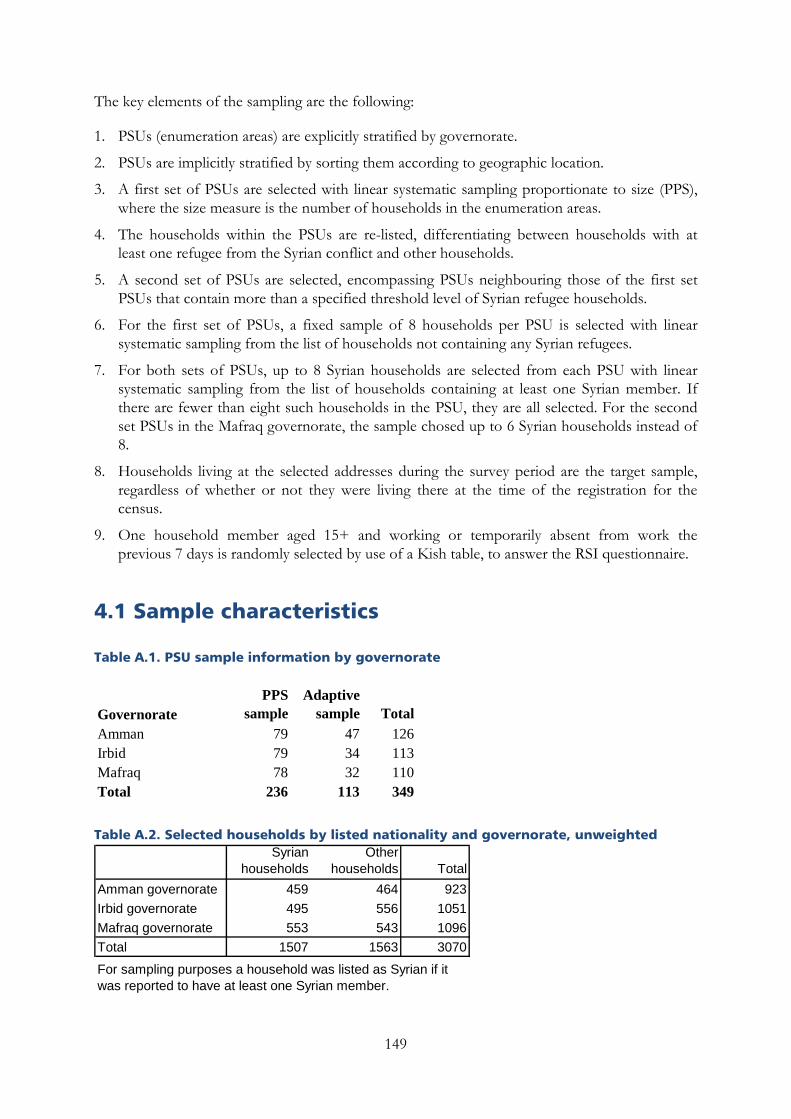
The key elements of the sampling are the following:
1. PSUs (enumeration areas) are explicitly stratified by governorate.
2. PSUs are implicitly stratified by sorting them according to geographic location.
3. A first set of PSUs are selected with linear systematic sampling proportionate to size (PPS), where the size measure is the number of households in the enumeration areas.
4. The households within the PSUs are re-listed, differentiating between households with at least one refugee from the Syrian conflict and other households.
5. A second set of PSUs are selected, encompassing PSUs neighbouring those of the first set PSUs that contain more than a specified threshold level of Syrian refugee households.
6. For the first set of PSUs, a fixed sample of 8 households per PSU is selected with linear systematic sampling from the list of households not containing any Syrian refugees.
7. For both sets of PSUs, up to 8 Syrian households are selected from each PSU with linear systematic sampling from the list of households containing at least one Syrian member. If there are fewer than eight such households in the PSU, they are all selected. For the second set PSUs in the Mafraq governorate, the sample chosed up to 6 Syrian households instead of 8.
8. Households living at the selected addresses during the survey period are the target sample, regardless of whether or not they were living there at the time of the registration for the census.
9. One household member aged 15+ and working or temporarily absent from work the previous 7 days is randomly selected by use of a Kish table, to answer the RSI questionnaire.
4.1 Sample characteristics
Table A.1. PSU sample information by governorate
Table A.2. Selected households by listed nationality and governorate, unweighted
GovernoratePPS
sampleAdaptive
sample TotalAmman 79 47 126Irbid 79 34 113Mafraq 78 32 110Total 236 113 349
Syrian households
Other households Total
Amman governorate 459 464 923Irbid governorate 495 556 1051Mafraq governorate 553 543 1096Total 1507 1563 3070
For sampling purposes a household was listed as Syrian if it was reported to have at least one Syrian member.
149
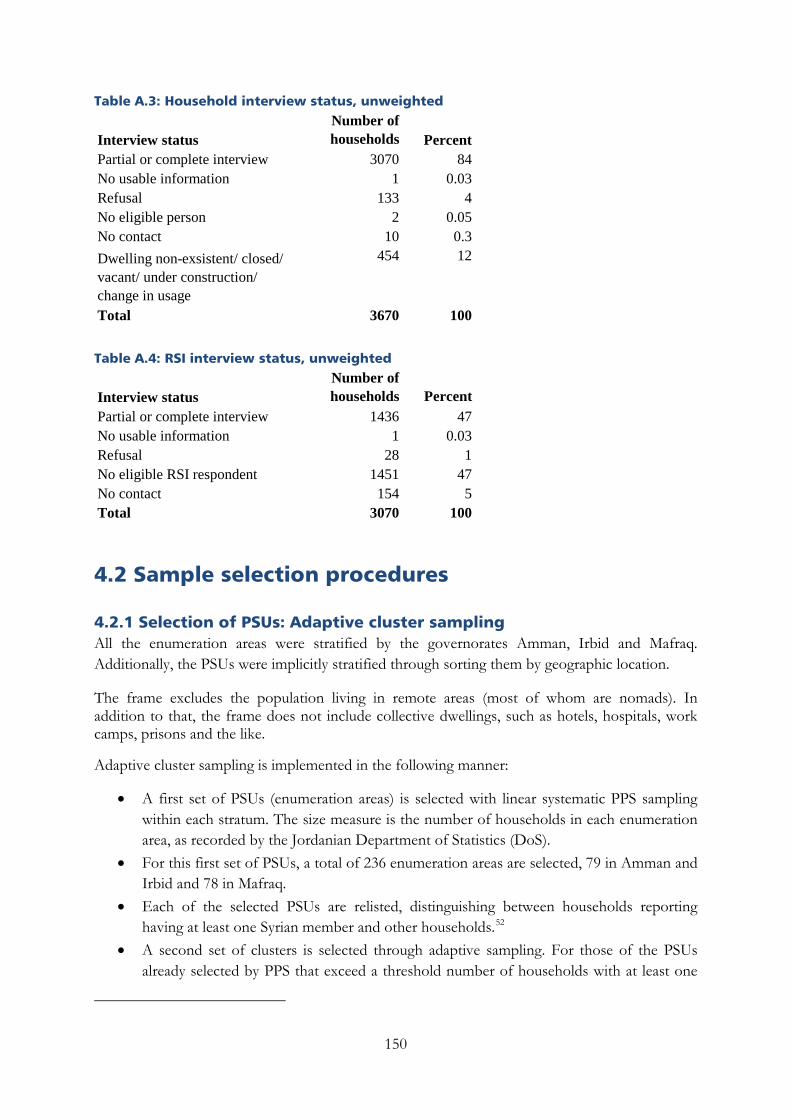
Table A.3: Household interview status, unweighted
Table A.4: RSI interview status, unweighted
4.2 Sample selection procedures
4.2.1 Selection of PSUs: Adaptive cluster sampling All the enumeration areas were stratified by the governorates Amman, Irbid and Mafraq. Additionally, the PSUs were implicitly stratified through sorting them by geographic location.
The frame excludes the population living in remote areas (most of whom are nomads). In addition to that, the frame does not include collective dwellings, such as hotels, hospitals, work camps, prisons and the like.
Adaptive cluster sampling is implemented in the following manner:
• A first set of PSUs (enumeration areas) is selected with linear systematic PPS sampling within each stratum. The size measure is the number of households in each enumeration area, as recorded by the Jordanian Department of Statistics (DoS).
• For this first set of PSUs, a total of 236 enumeration areas are selected, 79 in Amman and Irbid and 78 in Mafraq.
• Each of the selected PSUs are relisted, distinguishing between households reporting having at least one Syrian member and other households.52
• A second set of clusters is selected through adaptive sampling. For those of the PSUs already selected by PPS that exceed a threshold number of households with at least one
Interview statusNumber of households Percent
Partial or complete interview 3070 84No usable information 1 0.03Refusal 133 4No eligible person 2 0.05No contact 10 0.3Dwelling non-exsistent/ closed/ vacant/ under construction/ change in usage
454 12
Total 3670 100
Interview statusNumber of households Percent
Partial or complete interview 1436 47No usable information 1 0.03Refusal 28 1No eligible RSI respondent 1451 47No contact 154 5Total 3070 100
150
Syrian, all neighbouring PSUs selected. 53 In this case the threshold number is 10 households and above in Amman, 14 households and above in Irbid, and 25 households and above in Mafraq.54 The procedure results in an additional 113 PSUs being selected.
In total, this first stage of sampling results in a sample of 350 PSUs.
4.2.2 Selection of households The re-listing implemented in connection with the adaptive cluster sampling results in a list distinguishing between households with at least one Syrian member and households with no Syrian members. Linear systematic sampling is then used to select households from each of the two lists. For the first set of PSUs, both Syrian households and other households are targeted. For the second set of PSUs, only Syrian households are targeted.
For both sets of PSUs, up to 8 Syrian refugee households are selected from each PSU with linear systematic sampling, using the list of households containing at least one Syrian member. If there are fewer than eight such households in a PSU, they are all selected. For the second set PSUs in Mafraq governorate, the sample chosed up to 6 Syrian households instead of 8.55 For the first set of PSUs, an additional fixed sample of 8 households listed as containing no Syrian members is selected from each PSU with linear systematic sampling from the list of households containing no Syrians.
4.2.3 Random selection of a working individual aged 15+ within the household The RSI selection is from a subset of the household members – those, if any, aged 15 or above who were working or temporarily absent from work the previous 7 days. One eligible member was randomly selected using Kish tables.
4.2.4 Substitution No substitution of selected PSUs or households is to take place.
53 Note that neighboring cluster is any cluster that shares a boundary with a selected cluster. If two clusters share a corner, but have no common boundary, they are not considered neighbors. 54 The governorate-specific threshold was set at a level expected to result in sampling of approximately 150-300 additional Syrian refugee households from each governorate. 55 By mistake only five households were selected for one of these PSUs. In weighting 5 households is considered the intended sample take for this cluster.
151

Appendix D: Sampling procedures for the survey conducted in the Za’atri camp
1. Introduction
This part describes the sampling procedure of the survey conducted in the Za’atri refugee camp in the Mafraq governorate during March 2014, as part of the Assessment of the Implications of the Influx of Syrian Refugees on the Jordanian Labour Market project. Its main aim is to document the sampling procedures and the procedures for calculating the weight in the survey. The sampling procedure for the survey simultaneously carried out outside the Za’atri refugee camp is documented in a separated part.
2. Requirements of the sample
The design of the sample was – like any other sample – subject to a number of constraints. The main design characteristics for the sample were the following:
3. The target population for the survey was all households in the Za’atri refugee camp in Mafraq governorate.
4. The budget allowed for a sample of around 800 households. Due to frame imperfections, non-response and refusal, a total of 790 household interviews successfully completed.
3. The sampling frame
The sampling frame is based on a list of streets and the approximate number of households per street, provided by the UNHCR in February 2014.
4. Sampling design
The sample design for the Za’atri refugee camp is a two-stage cluster design. The PSUs are the streets (administrative division) in the camp, based on the list provided by the UNHCR.
In the first stage, 80 clusters are drawn using PPS sampling. Second, the sampled clusters are relisted using satellite images and households drawn from each of them using linear systematic sampling with a specified systematic walking pattern. The sample is implicitly stratified by sorting streets according to their geographic location prior to the first stage of sampling.56
56 The UNHCR listing is sorted geographically to preserve the advantage of implicit stratification by location. In district 3 and 4 both “B” and “extension” were used to separate clusters with the same street number, before sorting so that the “B” street comes before the “extension” street.
152
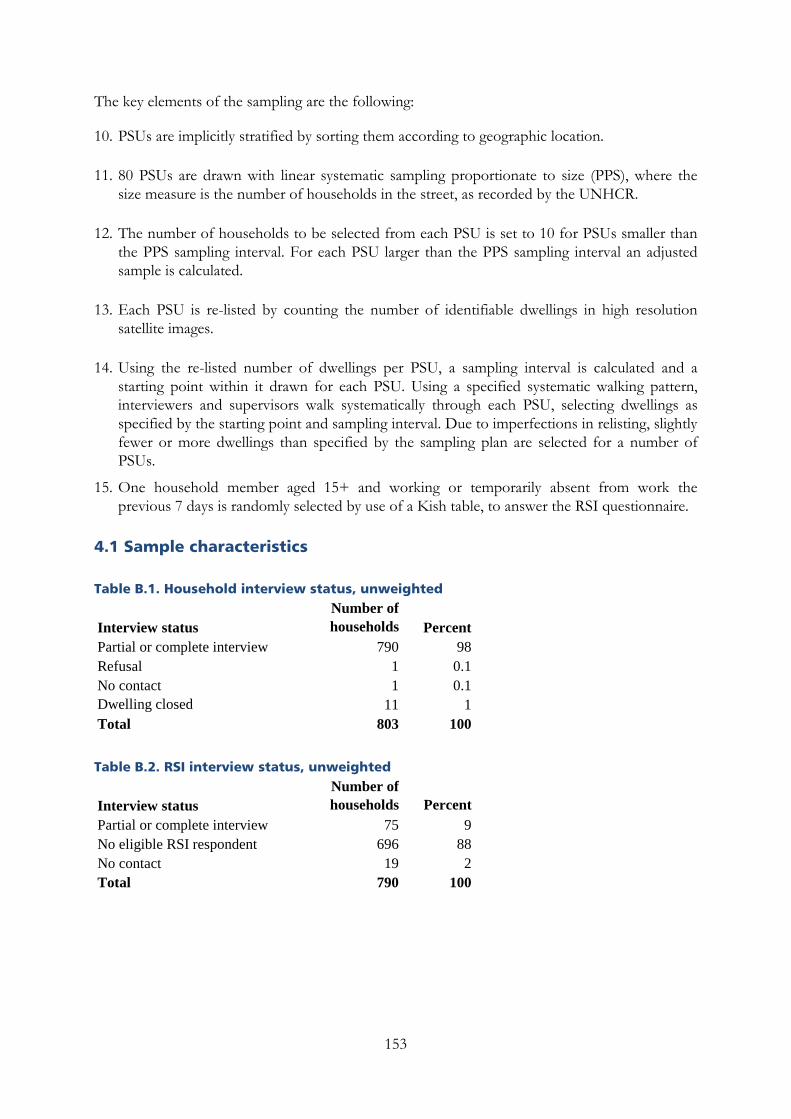
The key elements of the sampling are the following:
10. PSUs are implicitly stratified by sorting them according to geographic location.
11. 80 PSUs are drawn with linear systematic sampling proportionate to size (PPS), where the size measure is the number of households in the street, as recorded by the UNHCR.
12. The number of households to be selected from each PSU is set to 10 for PSUs smaller than the PPS sampling interval. For each PSU larger than the PPS sampling interval an adjusted sample is calculated.
13. Each PSU is re-listed by counting the number of identifiable dwellings in high resolution satellite images.
14. Using the re-listed number of dwellings per PSU, a sampling interval is calculated and a starting point within it drawn for each PSU. Using a specified systematic walking pattern, interviewers and supervisors walk systematically through each PSU, selecting dwellings as specified by the starting point and sampling interval. Due to imperfections in relisting, slightly fewer or more dwellings than specified by the sampling plan are selected for a number of PSUs.
15. One household member aged 15+ and working or temporarily absent from work the previous 7 days is randomly selected by use of a Kish table, to answer the RSI questionnaire.
4.1 Sample characteristics
Table B.1. Household interview status, unweighted
Table B.2. RSI interview status, unweighted
Interview statusNumber of households Percent
Partial or complete interview 790 98Refusal 1 0.1No contact 1 0.1Dwelling closed 11 1Total 803 100
Interview statusNumber of households Percent
Partial or complete interview 75 9No eligible RSI respondent 696 88No contact 19 2Total 790 100
153
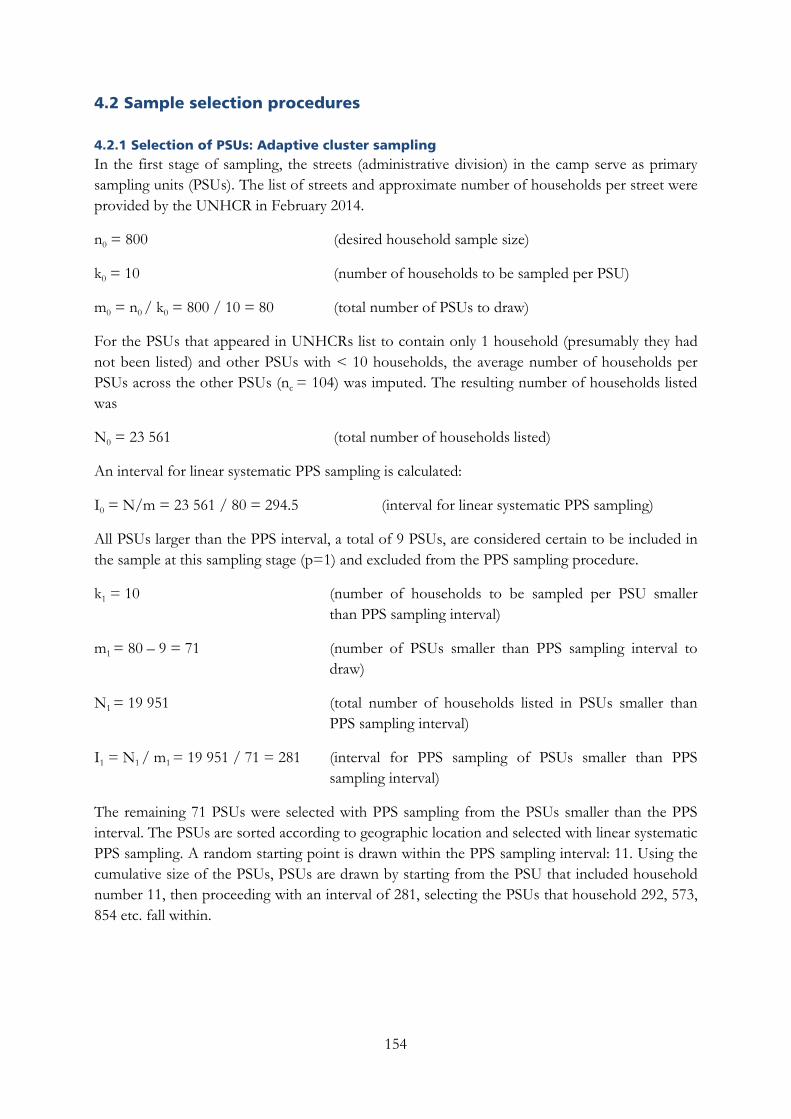
4.2 Sample selection procedures
4.2.1 Selection of PSUs: Adaptive cluster sampling In the first stage of sampling, the streets (administrative division) in the camp serve as primary sampling units (PSUs). The list of streets and approximate number of households per street were provided by the UNHCR in February 2014.
n0 = 800 (desired household sample size)
k0 = 10 (number of households to be sampled per PSU)
m0 = n0 / k0 = 800 / 10 = 80 (total number of PSUs to draw)
For the PSUs that appeared in UNHCRs list to contain only 1 household (presumably they had not been listed) and other PSUs with < 10 households, the average number of households per PSUs across the other PSUs (nc = 104) was imputed. The resulting number of households listed was
N0 = 23 561 (total number of households listed)
An interval for linear systematic PPS sampling is calculated:
I0 = N/m = 23 561 / 80 = 294.5 (interval for linear systematic PPS sampling)
All PSUs larger than the PPS interval, a total of 9 PSUs, are considered certain to be included in the sample at this sampling stage (p=1) and excluded from the PPS sampling procedure.
k1 = 10 (number of households to be sampled per PSU smaller than PPS sampling interval)
m1 = 80 – 9 = 71 (number of PSUs smaller than PPS sampling interval to draw)
N1 = 19 951 (total number of households listed in PSUs smaller than PPS sampling interval)
I1 = N1 / m1 = 19 951 / 71 = 281 (interval for PPS sampling of PSUs smaller than PPS sampling interval)
The remaining 71 PSUs were selected with PPS sampling from the PSUs smaller than the PPS interval. The PSUs are sorted according to geographic location and selected with linear systematic PPS sampling. A random starting point is drawn within the PPS sampling interval: 11. Using the cumulative size of the PSUs, PSUs are drawn by starting from the PSU that included household number 11, then proceeding with an interval of 281, selecting the PSUs that household 292, 573, 854 etc. fall within.
154
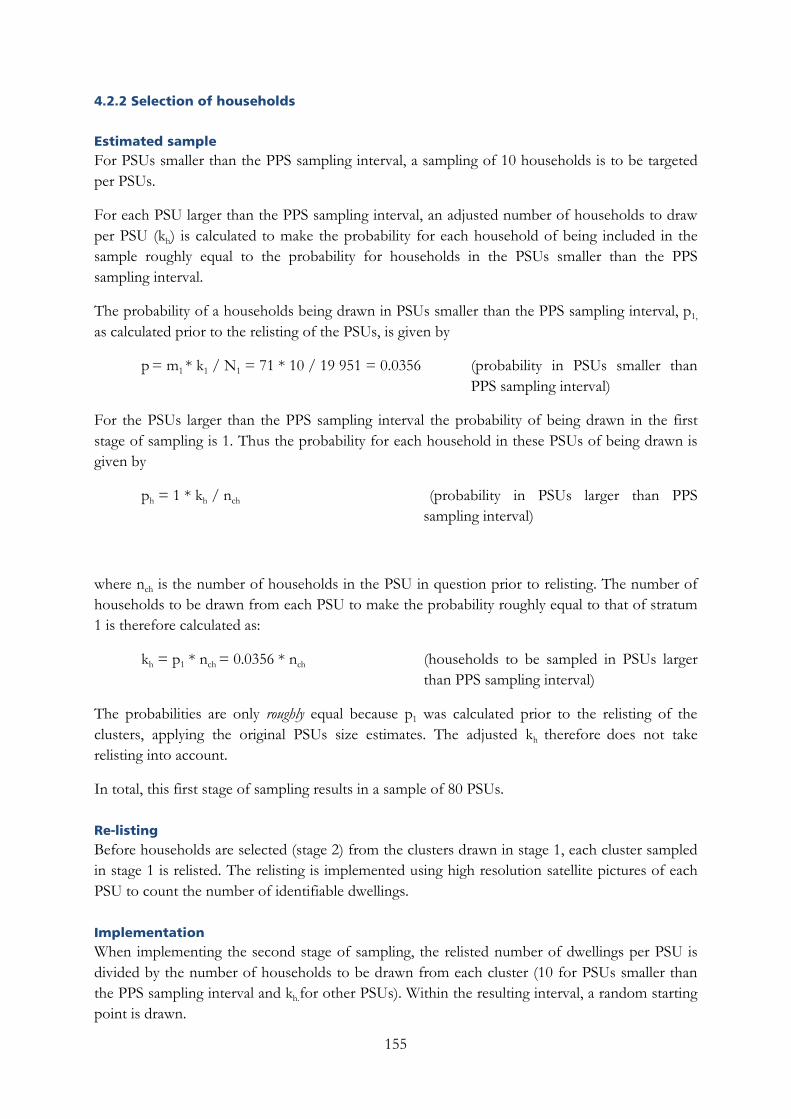
4.2.2 Selection of households
Estimated sample For PSUs smaller than the PPS sampling interval, a sampling of 10 households is to be targeted per PSUs.
For each PSU larger than the PPS sampling interval, an adjusted number of households to draw per PSU (kh) is calculated to make the probability for each household of being included in the sample roughly equal to the probability for households in the PSUs smaller than the PPS sampling interval.
The probability of a households being drawn in PSUs smaller than the PPS sampling interval, p1, as calculated prior to the relisting of the PSUs, is given by
p = m1 * k1 / N1 = 71 * 10 / 19 951 = 0.0356 (probability in PSUs smaller than PPS sampling interval)
For the PSUs larger than the PPS sampling interval the probability of being drawn in the first stage of sampling is 1. Thus the probability for each household in these PSUs of being drawn is given by
ph = 1 * kh / nch (probability in PSUs larger than PPS sampling interval)
where nch is the number of households in the PSU in question prior to relisting. The number of households to be drawn from each PSU to make the probability roughly equal to that of stratum 1 is therefore calculated as:
kh = p1 * nch = 0.0356 * nch (households to be sampled in PSUs larger than PPS sampling interval)
The probabilities are only roughly equal because p1 was calculated prior to the relisting of the clusters, applying the original PSUs size estimates. The adjusted kh therefore does not take relisting into account.
In total, this first stage of sampling results in a sample of 80 PSUs.
Re-listing Before households are selected (stage 2) from the clusters drawn in stage 1, each cluster sampled in stage 1 is relisted. The relisting is implemented using high resolution satellite pictures of each PSU to count the number of identifiable dwellings.
Implementation When implementing the second stage of sampling, the relisted number of dwellings per PSU is divided by the number of households to be drawn from each cluster (10 for PSUs smaller than the PPS sampling interval and kh.for other PSUs). Within the resulting interval, a random starting point is drawn.
155
A satellite map of each PSU, its sampling interval and starting point, and instructions on how to systematically walk through a cluster is provided to the interviewers. Interviewers and supervisors then walk systematically through each PSUs, according to the specified pattern, selecting dwellings as specified by the starting point and interval provided for the PSUs in question.
Due to the lack of precision that relisting by satellite picture entails, some PSUs are found to include fewer or more dwellings than the relisting indicated. Since the sampling interval was calculated based on the relisted number of identifiable dwellings, this leads to two kinds of deviation from the original sampling plan: First, in PSUs that turn out to contain fewer dwellings than recorded in relisting, sampling with the specified interval, starting point and walking pattern leads to fewer than dwellings being selected than the number specified by the sampling plan. Second, in PSUs that turn out to contain more dwellings than recorded in relisting, sampling with the specified interval, starting point and walking pattern leads to more dwellings being selected than the number specified by the sampling plan.
As a result of this imprecision in re-listing, a total of 803 households are selected, instead of the 826 that the original sampling design targeted. 790 of these household interviews are completed.
4.2.3 Random selection of a working individual aged 15+ within the household The RSI selection is from a subset of the household members – those, if any, aged 15 or above who were working or temporarily absent from work the previous 7 days. One eligible member was randomly selected using Kish tables.
4.2.4 Substitution No substitution of selected PSUs or households is to take place.
156

International Labour OrganizationRegional Office for the Arab StatesAresco Center, Justinien Street, Kantari P.O.Box 11-4088 Riad El Solh 1107-2150 Beirut – LebanonTel: +961-1-752400Fax: +961-1-752405Email: [email protected]: www.ilo.org/arabstatesFollow ILO in Arab States on Twitter: @iloarabic
ISBN 9789221295839 ISBN 9789221295846 (web pdf)
Fafo Borggata 2B/P.O.Box 2947 TøyenNO-0608 Oslowww.fafo.no
Fafo-report 2015:16ISBN 978-82-324-0198-7ISSN 0801-6143
Impact of Syrian refugees on the Jordanian labour marketBy Svein Erik Stave and Solveig Hillesund
20421-cover.indd 1 23.04.2015 15:36:58