impact of nuclear data uncertainties on transmutation of ... documents/worksh… · impact of...
TRANSCRIPT
Impact of Nuclear Data Uncertainties on Transmutation of Actinidesin Accelerator-Driven Assemblies
G. Aliberti, G. Palmiotti, M. Salvatores,*† and C. G. Stenberg
Argonne National LaboratoryNuclear Engineering Division, Building 208
9700 South Cass AvenueArgonne, Illinois 60439
Received October 15, 2002Accepted May 8, 2003
Abstract –The potential impact of nuclear data uncertainties on a large number of performance param-eters of reactor cores dedicated to the transmutation of radioactive wastes is discussed. An uncertaintyanalysis has been performed based on sensitivity theory, which underlines the cross sections, the energyrange, and the isotopes that are responsible for the most significant uncertainties.
To provide guidelines on priorities for new evaluations or validation experiments, required accura-cies on specific nuclear data have been derived, accounting for target accuracies on major design param-eters. The required accuracies (mostly in the energy region below 20 MeV), in particular for minoractinide data, are of the same order of magnitude of the achieved accuracies on major actinides. Specificrequirements also concern the improvement of minor actinide data related to decay heat and effectivedelayed-neutron fraction assessment.
I. INTRODUCTION
Among the strategies for radioactive waste manage-ment, the so-called partitioning and transmutation~P0T!strategy has attracted considerable interest in the lastdecade, and relevant studies have been performed in sev-eral leading laboratories, sometimes under the coordina-tion of international organizations~see, for example,Ref. 1!. Most of the studies have pointed out the role ofminor actinide~MA ! transmutation to reduce the sourceof potential radiotoxicity in deep geological storage andof long-lived fission product transmutation in order toeventually reduce the so-called residual risk.1 In bothcases, the transmutation should be performed in a neu-tron field, preferably with a fast neutron spectrum.2
Among the different scenarios of implementation of theP0T strategy, there has been a remarkable convergenceon two major options,3,4 namely, the use of standard crit-ical fast reactors, where, for example, MAs are mixed
to the standard fuel components, or the use of reactorcores dedicated to transmutation in a separate stratum ofthe fuel cycle.3,4 In the latter case, the dedicated reactorcore should be loaded with MA-dominated fuel, and bothcritical and [email protected]., accelerator-driven system~ADS!# versions of such cores have been the subject ofseveral studies.5
Although the major challenges of the dedicated coresare to be found in the appropriate fuel development andin the demonstration of the viability of the ADS concept,one aspect of particular relevance is the uncertainty as-sessment of the nominal predicted characteristics of suchcores. A first partial intercomparison exercise was per-formed under the auspices of the Nuclear Energy Agency~NEA! of the Organization for Economic Cooperationand Development6 ~OECD!. The published results didshow large discrepancies among the different param-eters, most probably to be attributed to nuclear data un-certainties. Some other studies7–9 have been performedthat examine specific aspects, but no comprehensive analy-sis has been performed until now. Also, these studiesonly partially address the issue of the impact of high-energy~E . 20 MeV! data on ADS core performance
*E-mail: [email protected]†Present address: DEN0DIR Building 101, CEA0
Cadarache, F. 13108 St.-Paul-Lez-Durance Cedex, France
NUCLEAR SCIENCE AND ENGINEERING:146, 13–50~2004!
13
assessment. The impact of uncertainties can be very sig-nificant, both on the safety assessment and the economicevaluation of a dedicated core. In fact, as an example,uncertainties on the subcriticality level of an ADS dedi-cated to transmutation induce the need to define designmargins, which in turn can result in a proton beam-power requirement that calls for an accelerator able todeliver up to twice as much current of what is neededaccording to the nominal design value of the subcritical-ity. Moreover, a sound uncertainty analysis can help todefine new priority measurements of specific cross sec-tions in well-defined energy domains, together with tar-get accuracies. In this work, we have performed such ananalysis for a representative ADS-dedicated core withU-free, MA-dominated fuel. We have addressed both stan-dard core-related parameters~which will be applicableboth to critical or subcritical versions of the core! andhigh-energy-related parameters~like damages and gasproduction in the structures! potentially sensitive to dataat energiesE . 20 MeV. An attempt has also been madeto define target accuracies and to point out major dataneeds.
II. UNCERTAINTY ANALYSIS
II.A. Theoretical Background
The principles of uncertainty analysis and its appli-cations to the fission reactor field are well document-ed.10 We will simply recall here that we can represent ageneric integral reactor parameterQ ~such askeff, or areactivity coefficient, or even a reaction rate like theneutron-induced damage in the structures! as a functionof cross sections:
Q 5 f ~s1,s2, . . . ,sJ ! , ~1!
wheres1, s2, . . . ,sJ represent cross sections by isotope,type of reaction, and energy range~or energy group, in amultigroup representation!. The uncertainties associatedwith the cross section can be represented in the form of avariance-covariance matrix:
Cs 5 1c11 c12 J c1J
c12 c22 J c2J
J J J J
c1J c2J J cJJ
2 , ~2!
where the elementscij represent the expected values re-lated to the parameterssj andsi .
The variations of the integral parameterQ due tovariations ofs can be expressed using perturbation theo-ries11 to evaluate sensitivity coefficientsS:
dQ0Q 5 (j
Sj
dsj
sj
, ~3!
where the sensitivity coefficientsSj are formally givenby
Sj 5]Q
]sj
{sj
Q. ~4!
The variance ofQ can then be obtained as
var~Q! 5 (j :i
J
Sj Si cij . ~5!
To exploit Eq.~5! one needs to obtain explicitly theSj coefficients and to establish an appropriate variance-covariance matrix. For a set of integral parametersQn
~n51 . . .N!, the assessment of the variances as given byEq. ~5! is of course relevant, but it is also relevant toassess the inverse problem, i.e., what are the requireddata uncertainties to meet specific target accuracies ontheQn parameter.
The unknown uncertainty data requirementsdi
can be obtained solving the following minimizationproblem12:
(i
l i 0di2 5 min , i 5 1 . . .I ~6!
with the following constraints:
(i
Sni2 di
2 , QnT , n 5 1 . . .N , ~7!
whereSni are the sensitivity coefficients for the integralparameterQn, andQn
T are the target accuracies on theNintegral parameters. The cost parametersl i are related toeachsi and should give a relative figure of merit of thedifficulty of improving that parameter~e.g., reducing un-certainties with an appropriate experiment!.
II.B. Sensitivity Coefficients andPerturbation Theories
For practical purposes, we will distinguish the ex-plicit dependence from some cross sections~e.g., si
e!and the implicit dependence from some other cross sec-tions~e.g.,sj
im! in the general expression of any integralparameterQ:
Q 5 f ~sjim,si
e! . ~8!
As an example, we consider a reaction rate
R 5 ^ tse, uF& ~9!
where brackets , & indicate integration over the phasespace. Note that in the present analysis,uF is the inho-mogeneous flux driven by the external source. It wouldbe the homogeneous flux in the case of critical core stud-ies. Instead, the adjoint flux that appears later in thepaper corresponds to the homogeneous calculation in allcases. In Eq.~9!, tse can be an energy-dependent detec-tor cross section;R is explicitly dependent on thetse and
14 ALIBERTI et al.
NUCLEAR SCIENCE AND ENGINEERING VOL. 146 JAN. 2004
implicitly dependent on the cross sections that character-ize the system, described by the fluxuF. In other terms,Rdepends on the system cross sections viauF. Equation~3!can be rewritten as follows:
dQ0Q 5 (j
Sj
dsjim
sjim 1 S ]Q
]se{se
QD{
dse
se , ~10!
where we have the hypothesis of an explicit dependenceof Q on only onese. If we drop the indexim,
dQ0Q 5 (j
Sj
dsj
sj
1 S ]Q
]se{se
QD{
dse
se 5 I 1 D ,
~11!
where the termI is generally called the indirect effect,and the termD is called the direct effect. While the di-rect effects can be obtained with explicit expressions ofthe derivatives ofQ, the indirect effect~i.e., the sensitiv-ity coefficientsS! can be obtained with perturbation ex-pression, most frequently at the first order.11
In what follows, we will recall in a simplified waythe formulations of the sensitivity coefficients at the firstorder for the indirect effects related to reactivity coeffi-cients,13 reaction rates,11 and nuclide transmutation~i.e.,evolution in time14!. Reactivity loss during irradiationwill also be treated as well as the cases of effective frac-tion of delayed neutrons and of the decay heat.
II.B.1. Reactivity Coefficients
A reactivity coefficient~like the Doppler effect! canbe expressed as a variation of the reactivity of the unper-turbed system~characterized by a valueK of the multi-plication factor, a Boltzmann operatorM, a flux uF, andan adjoint flux uF* !:
Dr 5 S121
KpD2 S12
1
K D51
K2
1
Kp
, ~12!
whereKp corresponds to a variation of the Boltzmannoperator such that
M r Mp~5 M 1 dMp! uF r uFp~5 uF 1 d uFp!
uF* r uFp*~5 uF* 1 d uFp
*! K r Kp~5K 1 dKp! .
~13!
The sensitivity coefficients~at first order! for Dr tovariations of thesj are given as in Ref. 13:
SjRO 5
]~Dr!
]sj
{sj
Dr5 H 1
Ifp ^ uFp
* ,sj uFp& 21
If
^ uF*,sj uF&J ,
~14!
where If 5 ^ uF*, F uF& and Ifp 5 ^ uFp
* , F uFp&, F being theneutron fission production part of theM ~5 F 2 A!operator.
II.B.2. Reaction Rates
The classical formulations found in Ref. 11, for ex-ample, can be applied to the case of damage rate or Heproduction in the structures or to the power peak factorin the core:
R 5 ^ uF, uSR& . ~15!
The sensitivity coefficients are given by
SjR 5 ^ tCR
* ,sj uF& , ~16!
where uF is as defined previously,tCR* is the solution of
M * tCR* 5 uSR , ~17!
andM * is the adjoint of the operatorM.
II.B.3. Nuclide Transmutation
The generic nuclideK transmutation during irradia-tion can be represented as the nuclide density variationbetween timet0 andtF . If we denotenF
K the final density,the appropriate sensitivity coefficient is given by
SjK 5
]nFK
]sj
{sj
nFK 5
1
nFK E
t0
tF
tn*sj tn dt , ~18!
where the time-dependent equations to obtaintn* and tn,together with their boundary conditions, are defined inRef. 14.
The method previously described does not take intoaccount the coupling with the flux field,15,16 neglectingin this way the feedback from flux and spectrum changesduring irradiation time. We show in Sec. IV.F that thisapproximation is acceptable in the cases under studyand that the time dependence of the flux spectrum isnegligible.
II.B.4. Reactivity Loss DuringIrradiation,Drcycle
At the first order, and neglecting the cross-sectionvariation during irradiation~which is a good approxima-tion for fast neutron systems!, we can write
Drcycle 5 (K
DnKrK , ~19!
where
DnK 5 nFK 2 n0
K ~20!
and rK is the reactivity per unit mass associated withisotopeK.
NUCLEAR DATA UNCERTAINTIES IN ACCELERATOR-DRIVEN ASSEMBLIES 15
NUCLEAR SCIENCE AND ENGINEERING VOL. 146 JAN. 2004
The related sensitivity coefficientsSjcycle associated
with the variation of ansj are given by
Sjcycle5
sj
Drcycle
]Drcycle
]sj
5sj
DrcycleS(K
]nK
]sj
{rK 1 (K
DnK]rK
]sjD . ~21!
Using the formulations of Secs. II.B.1 and II.B.3,we obtain
Sjcycle5 (
K
rK
DrcycleEt0
tF
tn*sj tn dt
1 H 1
Ifp ^ uFp
* ,sj uFp& 21
If
^ uF*,sj uF&J , ~22!
where the indexp refers to the core state att 5 tF .Also in this case, the time-dependent variation of
the flux spectrum during irradiation is supposed to be ofnegligible impact on the sensitivity coefficients forDrcycle ~see Sec. IV.F!.
II.B.5. Thew* Parameter
Thew* parameter is defined for an external source-driven system as the ratio of the average external sourceimportance to averaged fission neutron importance:
w* 5^ uF*S&
^S&Y ^ uF*, F uF&
^F uF&5 S 1
keff
2 1DYS 1
KS
2 1D ,
~23!
where
keff 5^ uF*, F uF&
^ uF*, A uF&
KS 5^F uF&
^A uF&
uF 5 solution of the inhomogeneous equation withexternal sourceS:
A uF 5 F uF 1 S . ~24!
Equation~23! is a special case of a real and adjointflux functional ratioIS for which a generalized perturba-tion theory~GPT! has also been established.9
For that case, the sensitivity coefficients are givenby
Sjw* 5
]w*
]sj
sj
w*5
sj
w*$^ tC*,sj uF& 1 ^ tC,sj uF* &% , ~25!
where tC* and tC ~generalized importance functions! arethe solution of the following equations:
M * tC* 5 2nSf ~r, E!^ uF*, ox&
^ uF*, F uF&1
nSf ~r, E!
^F uF&~26!
and
M tC 5S~r, E!
^ uF*S&2
x~E!^n uSf uF&
^ uF*, F uF&, ~27!
where we have explicitly introduced the energy- andspace-dependent form of the fission operator, andnSf ~E, r ! ~component of the vectorn uSf ! is the macro-scopic fission cross section multiplied by the prompt neu-tron fraction at energyE and space pointr, andx~E!~component of the vectorox! is the fraction of the fissionspectrum at energyE; the brackets , & indicate integra-tion over energy and space.
II.B.6. Decay Heat
The decay heat is defined as
H~t ! 5 (K
lK QK nK~t ! , ~28!
where for each isotopeK, lK are the decay constants,QK
is the heat released in decay reaction, andnK ~t ! are thenuclide densities at timet. The equations fornK ~t ! arethe classical ones:
dnK~t !
dt5 (
F
gK, f tf 1 (j
nKj ~t !tj bjrK
1 (i
ni ~t !l i birK 2 tK nK~t ! 2 lK nK~t ! ,
~29!
or in a more compact form,
dnk~t !
dt5 bk 1 (
j51
K21
Ckj n j~t ! 2 Ckknk~t ! , ~30!
where
gK, f 5 fission yields for fissionable isotopef
t 5 microscopic reaction rates
bjrk 5 branching ratios.
This is an inhomogeneous Bateman-type equation thatdefines the appropriate nuclide field. The uncertainty onH~t ! is obtained by combining the appropriate deriva-tives ofH with respect tol, Q, andn and accounting forpossible correlations. As far as variations of thenK terms,they can be evaluated using the perturbation techniquesindicated in Sec. II.B.3. A specific feature is representedby the variation of the fission yieldsg, i.e., by the vari-ation of the source termbK in Eq. ~30!.
16 ALIBERTI et al.
NUCLEAR SCIENCE AND ENGINEERING VOL. 146 JAN. 2004
The relative sensitivity coefficients correspondingto the decay heat att 5 tx are given by
SK, fg 5 tf
]nt5txK
]gK, f
{gK, f
nt5txK 5
tf
nt5txK E
0
tx
tn*gK, f dt . ~31!
II.B.7. The Effective Fractionof Delayed Neutrons
The effective fraction of delayed neutrons,Zbeff, isdefined by the following equation:
Zbeff 5 (m
Zbeffm , ~32!
where Zbeffm is the effective delayed-neutron fraction of
fissile materialm. For each fissile materialm, Zbeff 5
(i Zbi , where Zbi , the effective fraction for the precursorgroup i , is expressed as follows:
Zbi 5^xi
d uF*, bi ndSf uF&
^ uF*, F uF&
5biE@xi
d~E! uF*~r, E,V!# @nd~E ' !Sf ~r, E ' ! uF~r, E ',V' !# dr
^ uF*, F uF&,
~33!
where
nd 5 number of delayed neutrons emitted by fission
xid 5 delayed-neutron spectrum for the groupi
bi 5 fraction of delayed neutrons from the groupi .
Using the GPT, the sensitivity coefficients forZbeff,including both the direct~i.e., related to the delayed-neutron parameters! and the indirect effect, are given by
SjZb 5
] Zbeff
]bi
bi
Zbeff
1] Zbeff
]xid
xid
Zbeff
1] Zbeff
]sj
sj
Zbeff
5] Zbeff
]bi
bi
Zbeff
1] Zbeff
]xid
xid
Zbeff
1sj
Zbeff
3 $^ tC*,sj uF& 1 ^ tC,sj uF* &% , ~34!
where tC* and tC ~generalized importance functions! arethe solutions of the following equations:
~A* 2 F * ! tC* 5bi @ uF*xi
d#ndSf ~r, E!
^xid uF*, bi n
dSf uF&
2@ uF*x#nSf ~r, E!
^F*, F uF&~35!
and
SA 21
KFD tC 5
@bi ndSf uF#xi
d~E!
^xid uF*, bi n
dSf uF&2
@nSf uF#x
^ uF*, F uF&.
~36!
II.C. Calculational Tools andBasic Data Library
All the sensitivity calculations have been performedwith the ERANOS code system,17 which allows us tocalculate homogeneous and inhomogeneous solutions ofthe Boltzmann equation, generalized importance func-tions, and to perform perturbation and uncertainty analy-sis. The discrete ordinate module BISTRO~Ref. 18! hasbeen used to perform flux and generalized importancefunction calculations. AnS4 P1 approximation inRZge-ometry has been proved accurate enough for this type ofcalculation.
Decay heat calculations have been performed withthe ORIGEN code.19
Cross-section data have been processed to the re-quired multigroup structure, starting from the JEF-2.2data files.20 Homogeneous cross sections have been cal-culated because heterogeneity effects on the cross sec-tions are rather small in these hard neutron spectra.Delayed-neutron data were also taken from the JEF-2.2files.
The basic multigroup structure~33 energy groups,see, for example, Table XI! has an upper energy limit at19.64 MeV.
To investigate high-energy~E . 20 MeV! effects ina subcritical system driven by a spallation neutron sourceinduced by high-energy protons~Ep'1 GeV!, the multi-group data have been extended up to 150 MeV using thedata provided in Ref. 21. For that purpose, ten energygroups with a lethargy width of 0.2 have been added tothe basic 33-energy-group structure to cover the energyrange from 19.64 to 150 MeV.
III. THE REFERENCE DEDICATED SYSTEMFOR THE UNCERTAINTY ANALYSIS
III.A. The Reference System
The methodology outlined in Sec. II has been ap-plied to a dedicated system that has some general fea-tures~e.g., the mass ratio between plutonium and MA,the americium-to-curium ratio, etc.! that are representa-tive of the class of MA transmuters with a fast neutronspectrum and a fertile-free fuel, as proposed, for exam-ple, in the framework of the OMEGA project in Japan, asstudied at Commissariat à l’Energie Atomique, France,or examined in the United States.
The target and the coolant material of the core arethe Pb-Bi eutectic. This is a more specific choice, in
NUCLEAR DATA UNCERTAINTIES IN ACCELERATOR-DRIVEN ASSEMBLIES 17
NUCLEAR SCIENCE AND ENGINEERING VOL. 146 JAN. 2004
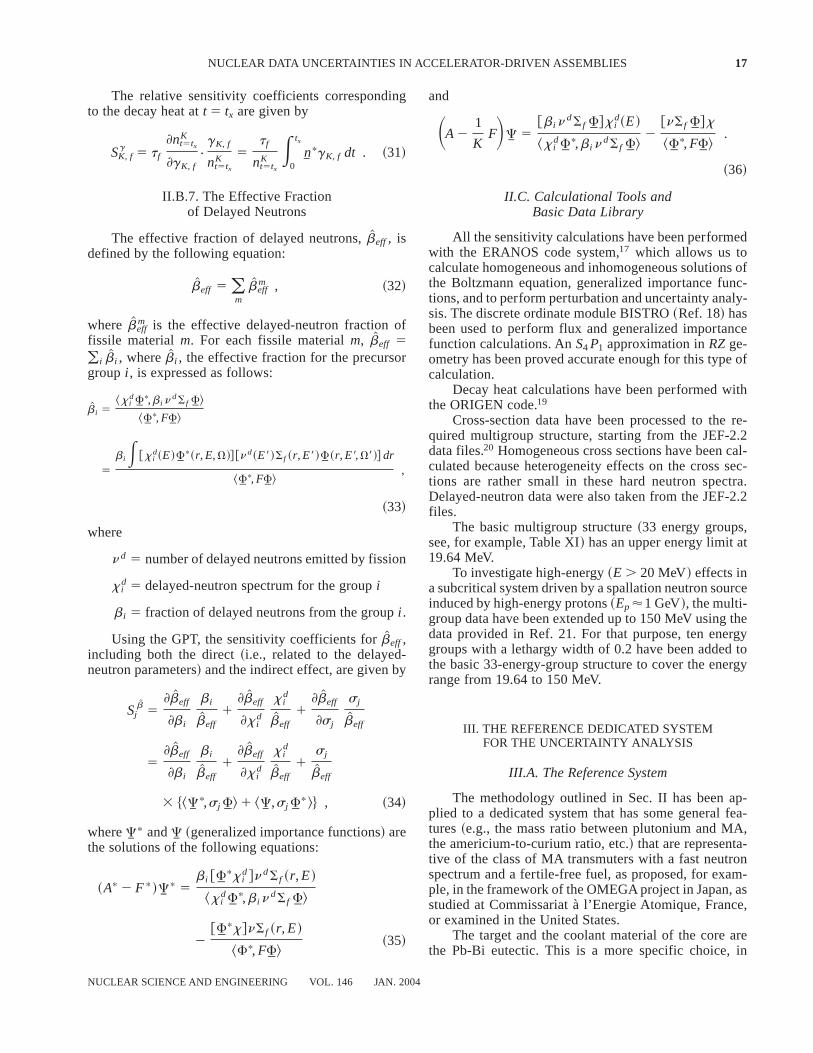
particular in terms of coolant, which in principle, how-ever, does not affect much the overall uncertainty analy-sis features because these are more related to the type ofneutron spectrum~i.e., fast versus thermal neutron spec-trum!. Finally, the system that we have chosen is veryclose to the subcritical core, which has been analyzed inthe framework of an OECD-NEA benchmark.6 The geo-metric model and compositions are given in Fig. 1 andTable I, respectively.
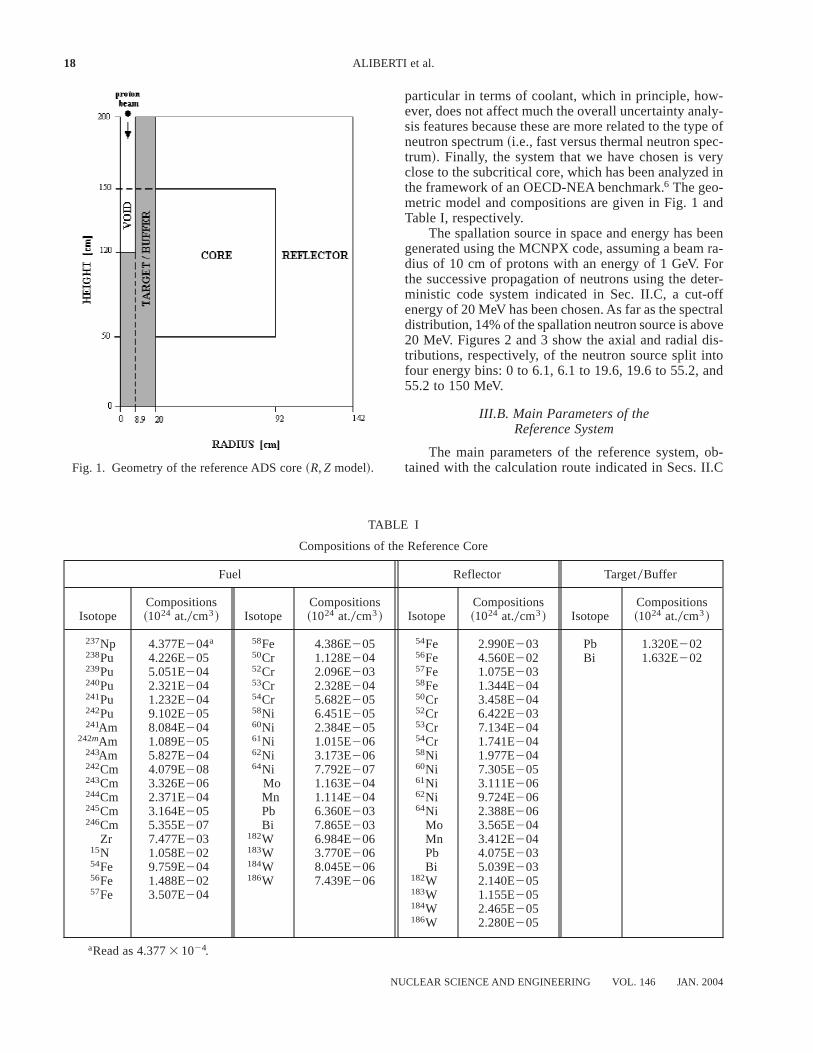
The spallation source in space and energy has beengenerated using the MCNPX code, assuming a beam ra-dius of 10 cm of protons with an energy of 1 GeV. Forthe successive propagation of neutrons using the deter-ministic code system indicated in Sec. II.C, a cut-offenergy of 20 MeV has been chosen. As far as the spectraldistribution, 14% of the spallation neutron source is above20 MeV. Figures 2 and 3 show the axial and radial dis-tributions, respectively, of the neutron source split intofour energy bins: 0 to 6.1, 6.1 to 19.6, 19.6 to 55.2, and55.2 to 150 MeV.
III.B. Main Parameters of theReference System
The main parameters of the reference system, ob-tained with the calculation route indicated in Secs. II.CFig. 1. Geometry of the reference ADS core~R, Z model!.
TABLE I
Compositions of the Reference Core
Fuel Reflector Target0Buffer
IsotopeCompositions~1024 at.0cm3! Isotope
Compositions~1024 at.0cm3! Isotope
Compositions~1024 at.0cm3! Isotope
Compositions~1024 at.0cm3!
237Np 4.377E204a 58Fe 4.386E205 54Fe 2.990E203 Pb 1.320E202238Pu 4.226E205 50Cr 1.128E204 56Fe 4.560E202 Bi 1.632E202239Pu 5.051E204 52Cr 2.096E203 57Fe 1.075E203240Pu 2.321E204 53Cr 2.328E204 58Fe 1.344E204241Pu 1.232E204 54Cr 5.682E205 50Cr 3.458E204242Pu 9.102E205 58Ni 6.451E205 52Cr 6.422E203241Am 8.084E204 60Ni 2.384E205 53Cr 7.134E204
242mAm 1.089E205 61Ni 1.015E206 54Cr 1.741E204243Am 5.827E204 62Ni 3.173E206 58Ni 1.977E204242Cm 4.079E208 64Ni 7.792E207 60Ni 7.305E205243Cm 3.326E206 Mo 1.163E204 61Ni 3.111E206244Cm 2.371E204 Mn 1.114E204 62Ni 9.724E206245Cm 3.164E205 Pb 6.360E203 64Ni 2.388E206246Cm 5.355E207 Bi 7.865E203 Mo 3.565E204
Zr 7.477E203 182W 6.984E206 Mn 3.412E20415N 1.058E202 183W 3.770E206 Pb 4.075E20354Fe 9.759E204 184W 8.045E206 Bi 5.039E20356Fe 1.488E202 186W 7.439E206 182W 2.140E20557Fe 3.507E204 183W 1.155E205
184W 2.465E205186W 2.280E205
aRead as 4.3773 1024.
18 ALIBERTI et al.
NUCLEAR SCIENCE AND ENGINEERING VOL. 146 JAN. 2004
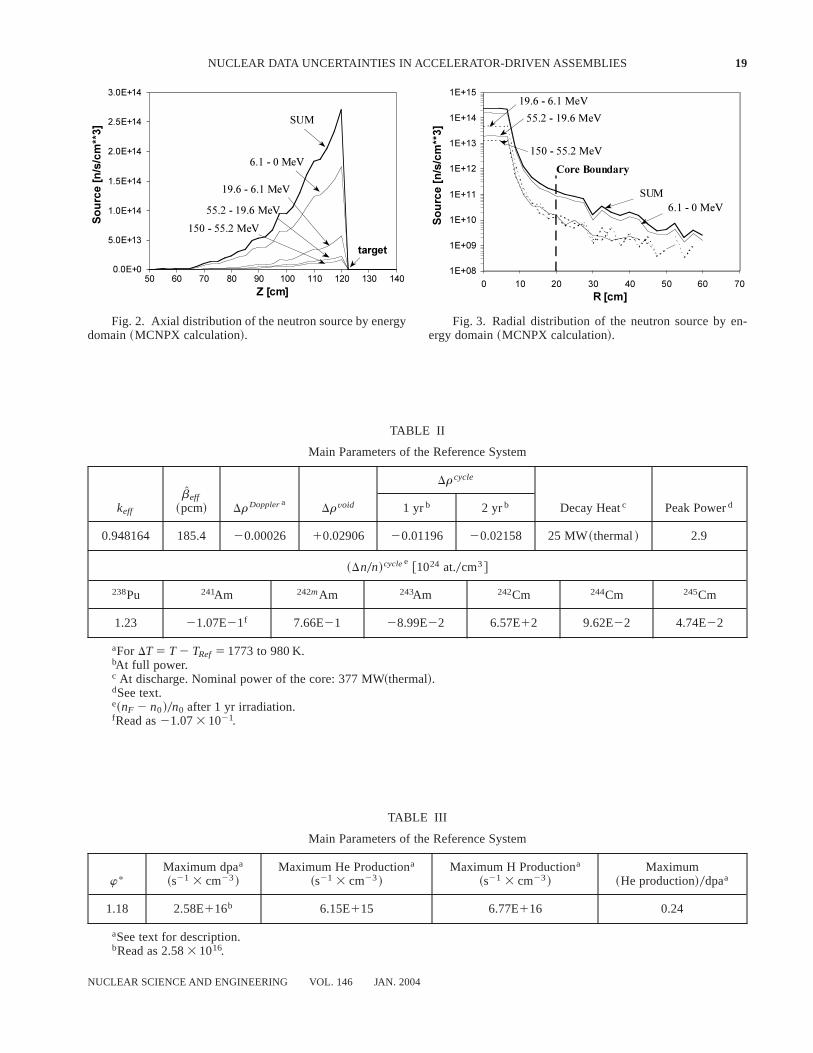
TABLE II
Main Parameters of the Reference System
Drcycle
keff
Zbeff
~pcm! DrDopplera Drvoid 1 yrb 2 yrb Decay Heatc Peak Powerd
0.948164 185.4 20.00026 10.02906 20.01196 20.02158 25 MW~thermal! 2.9
~Dn0n!cyclee@1024 at.0cm3#
238Pu 241Am 242mAm 243Am 242Cm 244Cm 245Cm
1.23 21.07E21f 7.66E21 28.99E22 6.57E12 9.62E22 4.74E22
aFor DT 5 T 2 TRef 5 1773 to 980 K.bAt full power.c At discharge. Nominal power of the core: 377 MW~thermal!.dSee text.e~nF 2 n0!0n0 after 1 yr irradiation.fRead as21.073 1021.
TABLE III
Main Parameters of the Reference System
w*Maximum dpaa
~s21 3 cm23!Maximum He Productiona
~s21 3 cm23!Maximum H Productiona
~s21 3 cm23!Maximum
~He production!0dpaa
1.18 2.58E116b 6.15E115 6.77E116 0.24
aSee text for description.bRead as 2.583 1016.
Fig. 2. Axial distribution of the neutron source by energydomain~MCNPX calculation!.
Fig. 3. Radial distribution of the neutron source by en-ergy domain~MCNPX calculation!.
NUCLEAR DATA UNCERTAINTIES IN ACCELERATOR-DRIVEN ASSEMBLIES 19
NUCLEAR SCIENCE AND ENGINEERING VOL. 146 JAN. 2004
and III.A using the 33-energy-group structure, with up-per energy boundary at 19.64 MeV, are given in Tables IIand III.
In Table III, w* is the ratio of the average externalsource importance to average fission neutron impor-tance introduced previously.
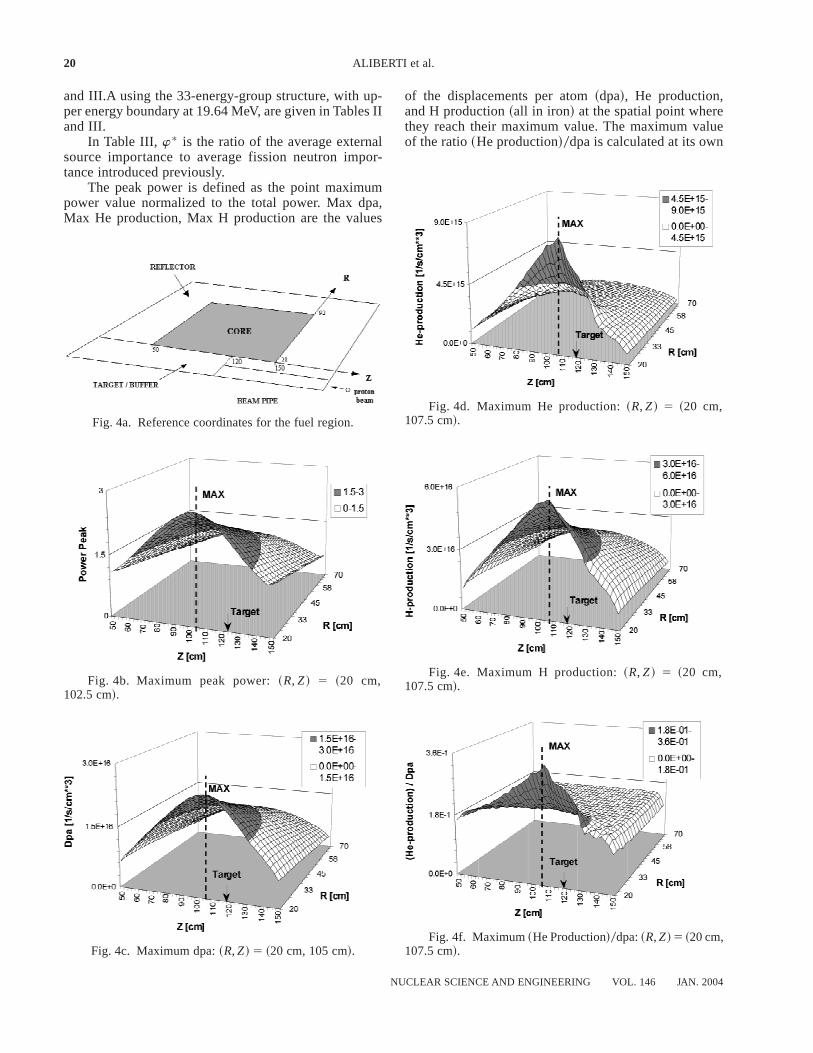
The peak power is defined as the point maximumpower value normalized to the total power. Max dpa,Max He production, Max H production are the values
of the displacements per atom~dpa!, He production,and H production~all in iron! at the spatial point wherethey reach their maximum value. The maximum valueof the ratio~He production!0dpa is calculated at its own
Fig. 4a. Reference coordinates for the fuel region.
Fig. 4b. Maximum peak power:~R, Z! 5 ~20 cm,102.5 cm!.
Fig. 4c. Maximum dpa:~R, Z! 5 ~20 cm, 105 cm!.
Fig. 4d. Maximum He production:~R, Z! 5 ~20 cm,107.5 cm!.
Fig. 4e. Maximum H production:~R, Z! 5 ~20 cm,107.5 cm!.
Fig. 4f. Maximum~He Production!0dpa:~R, Z! 5 ~20 cm,107.5 cm!.
20 ALIBERTI et al.
NUCLEAR SCIENCE AND ENGINEERING VOL. 146 JAN. 2004
maximum value position. In Figs. 4b through 4f, thespatial distributions of the peak power, Max dpa, MaxHe production, Max H production, and Max~Heproduction!0dpa are shown~Fig. 4a allows visualiza-tion of the reference coordinate system!.
One can observe that the power peak is obtainedapproximately at core midplane, where the flux reachesits highest value. The Max dpa, He-, and H productionare located a few centimetres above the core midplane,the location of the maximum of the higher energy neu-trons coming from spallation. The He- and H-productionspatial distribution are peaked at the core0buffer inter-face, while the dpa and power are more evenly distrib-uted in the core.
In Table II, DrDoppler corresponds to the reactivityinduced by a jump in temperature between 980 and1773 K. TheDrcycle is the reactivity variation resultingfrom a 1- or 2-yr irradiation. A more detailed analysis ofthese parameters is given later in this paper.
Finally, the~Dn0n!cycle, i.e., the relative variation ofa few selected major isotope nuclear densities~238Pu,241Am, 242mAm, 243Am, 242Cm, 244Cm, and245Cm!, isa measure of the effectiveness of the transmutationprocess.
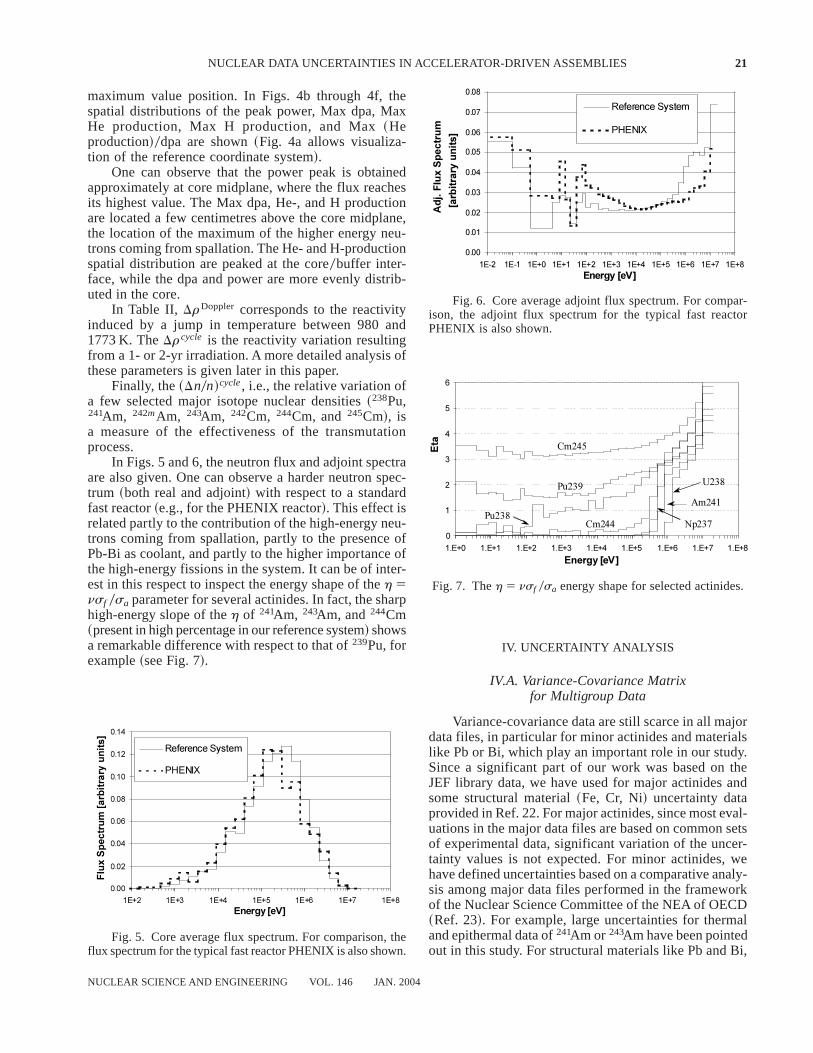
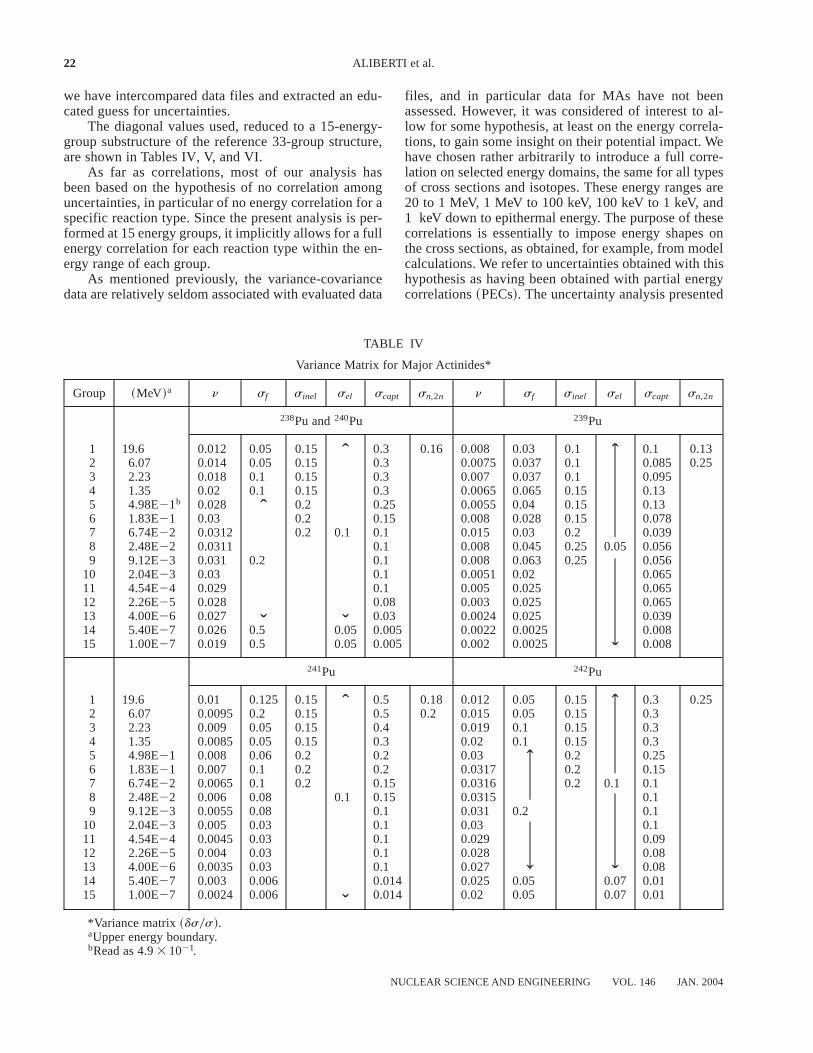
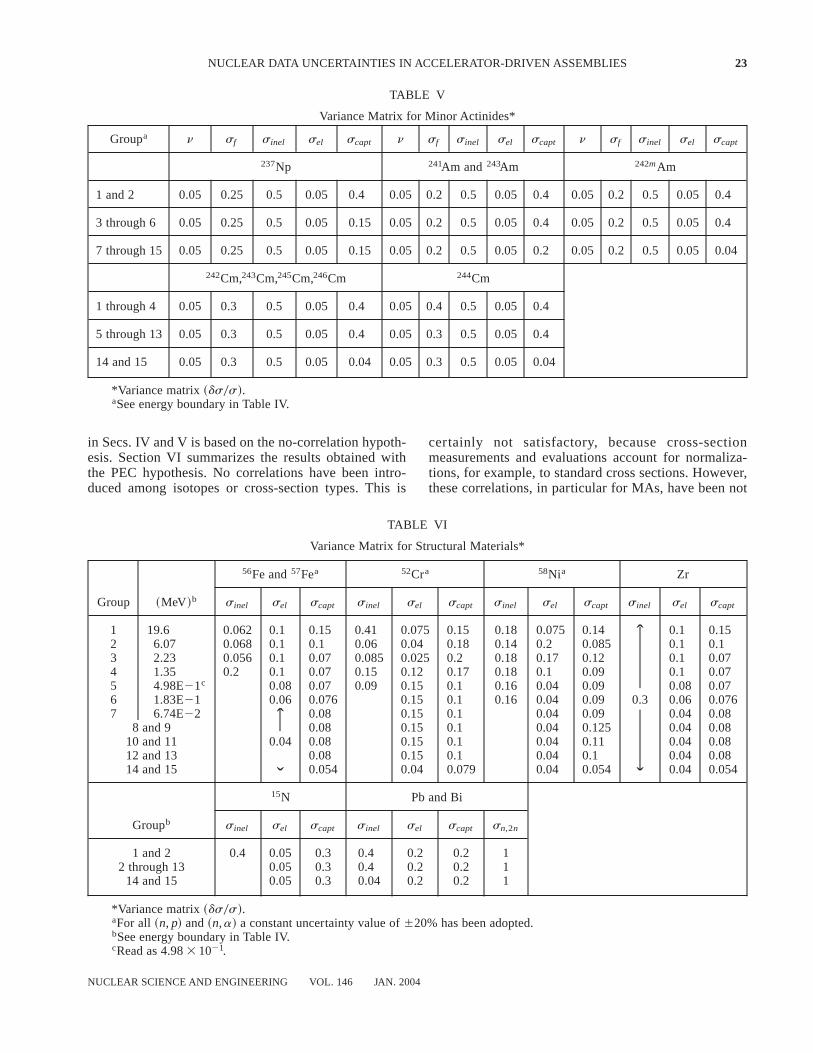
In Figs. 5 and 6, the neutron flux and adjoint spectraare also given. One can observe a harder neutron spec-trum ~both real and adjoint! with respect to a standardfast reactor~e.g., for the PHENIX reactor!. This effect isrelated partly to the contribution of the high-energy neu-trons coming from spallation, partly to the presence ofPb-Bi as coolant, and partly to the higher importance ofthe high-energy fissions in the system. It can be of inter-est in this respect to inspect the energy shape of theh 5nsf 0sa parameter for several actinides. In fact, the sharphigh-energy slope of theh of 241Am, 243Am, and244Cm~present in high percentage in our reference system! showsa remarkable difference with respect to that of239Pu, forexample~see Fig. 7!.
IV. UNCERTAINTY ANALYSIS
IV.A. Variance-Covariance Matrixfor Multigroup Data
Variance-covariance data are still scarce in all majordata files, in particular for minor actinides and materialslike Pb or Bi, which play an important role in our study.Since a significant part of our work was based on theJEF library data, we have used for major actinides andsome structural material~Fe, Cr, Ni! uncertainty dataprovided in Ref. 22. For major actinides, since most eval-uations in the major data files are based on common setsof experimental data, significant variation of the uncer-tainty values is not expected. For minor actinides, wehave defined uncertainties based on a comparative analy-sis among major data files performed in the frameworkof the Nuclear Science Committee of the NEA of OECD~Ref. 23!. For example, large uncertainties for thermaland epithermal data of241Am or 243Am have been pointedout in this study. For structural materials like Pb and Bi,
Fig. 5. Core average flux spectrum. For comparison, theflux spectrum for the typical fast reactor PHENIX is also shown.
Fig. 6. Core average adjoint flux spectrum. For compar-ison, the adjoint flux spectrum for the typical fast reactorPHENIX is also shown.
Fig. 7. Theh 5 nsf 0sa energy shape for selected actinides.
NUCLEAR DATA UNCERTAINTIES IN ACCELERATOR-DRIVEN ASSEMBLIES 21
NUCLEAR SCIENCE AND ENGINEERING VOL. 146 JAN. 2004
we have intercompared data files and extracted an edu-cated guess for uncertainties.
The diagonal values used, reduced to a 15-energy-group substructure of the reference 33-group structure,are shown in Tables IV, V, and VI.
As far as correlations, most of our analysis hasbeen based on the hypothesis of no correlation amonguncertainties, in particular of no energy correlation for aspecific reaction type. Since the present analysis is per-formed at 15 energy groups, it implicitly allows for a fullenergy correlation for each reaction type within the en-ergy range of each group.
As mentioned previously, the variance-covariancedata are relatively seldom associated with evaluated data
files, and in particular data for MAs have not beenassessed. However, it was considered of interest to al-low for some hypothesis, at least on the energy correla-tions, to gain some insight on their potential impact. Wehave chosen rather arbitrarily to introduce a full corre-lation on selected energy domains, the same for all typesof cross sections and isotopes. These energy ranges are20 to 1 MeV, 1 MeV to 100 keV, 100 keV to 1 keV, and1 keV down to epithermal energy. The purpose of thesecorrelations is essentially to impose energy shapes onthe cross sections, as obtained, for example, from modelcalculations. We refer to uncertainties obtained with thishypothesis as having been obtained with partial energycorrelations~PECs!. The uncertainty analysis presented
TABLE IV
Variance Matrix for Major Actinides*
Group ~MeV!a n sf sinel sel scapt sn,2n n sf sinel sel scapt sn,2n
238Pu and240Pu 239Pu
1 19.6 0.012 0.05 0.15 ˆ 0.3 0.16 0.008 0.03 0.1 ˆ 0.1 0.132 6.07 0.014 0.05 0.15 0.3 0.0075 0.037 0.1 0.085 0.253 2.23 0.018 0.1 0.15 0.3 0.007 0.037 0.1 0.0954 1.35 0.02 0.1 0.15 0.3 0.0065 0.065 0.15 0.135 4.98E21b 0.028 ˆ 0.2 0.25 0.0055 0.04 0.15 0.136 1.83E21 0.03 0.2 0.15 0.008 0.028 0.15 0.0787 6.74E22 0.0312 0.2 0.1 0.1 0.015 0.03 0.2 0.0398 2.48E22 0.0311 0.1 0.008 0.045 0.25 0.05 0.0569 9.12E23 0.031 0.2 0.1 0.008 0.063 0.25 0.056
10 2.04E23 0.03 0.1 0.0051 0.02 0.06511 4.54E24 0.029 0.1 0.005 0.025 0.06512 2.26E25 0.028 0.08 0.003 0.025 0.06513 4.00E26 0.027 ˇ ˇ 0.03 0.0024 0.025 0.03914 5.40E27 0.026 0.5 0.05 0.005 0.0022 0.0025 0.00815 1.00E27 0.019 0.5 0.05 0.005 0.002 0.0025 ˇ 0.008
241Pu 242Pu
1 19.6 0.01 0.125 0.15 ˆ 0.5 0.18 0.012 0.05 0.15 ˆ 0.3 0.252 6.07 0.0095 0.2 0.15 0.5 0.2 0.015 0.05 0.15 0.33 2.23 0.009 0.05 0.15 0.4 0.019 0.1 0.15 0.34 1.35 0.0085 0.05 0.15 0.3 0.02 0.1 0.15 0.35 4.98E21 0.008 0.06 0.2 0.2 0.03 ˆ 0.2 0.256 1.83E21 0.007 0.1 0.2 0.2 0.0317 0.2 0.157 6.74E22 0.0065 0.1 0.2 0.15 0.0316 0.2 0.1 0.18 2.48E22 0.006 0.08 0.1 0.15 0.0315 0.19 9.12E23 0.0055 0.08 0.1 0.031 0.2 0.1
10 2.04E23 0.005 0.03 0.1 0.03 0.111 4.54E24 0.0045 0.03 0.1 0.029 0.0912 2.26E25 0.004 0.03 0.1 0.028 0.0813 4.00E26 0.0035 0.03 0.1 0.027 ˇ ˇ 0.0814 5.40E27 0.003 0.006 0.014 0.025 0.05 0.07 0.0115 1.00E27 0.0024 0.006 ˇ 0.014 0.02 0.05 0.07 0.01
*Variance matrix~ds0s!.aUpper energy boundary.bRead as 4.93 1021.
22 ALIBERTI et al.
NUCLEAR SCIENCE AND ENGINEERING VOL. 146 JAN. 2004
in Secs. IV and V is based on the no-correlation hypoth-esis. Section VI summarizes the results obtained withthe PEC hypothesis. No correlations have been intro-duced among isotopes or cross-section types. This is
certainly not satisfactory, because cross-sectionmeasurements and evaluations account for normaliza-tions, for example, to standard cross sections. However,these correlations, in particular for MAs, have been not
TABLE VI
Variance Matrix for Structural Materials*
56Fe and57Fea 52Cra 58Nia Zr
Group ~MeV!b sinel sel scapt sinel sel scapt sinel sel scapt sinel sel scapt
1 19.6 0.062 0.1 0.15 0.41 0.075 0.15 0.18 0.075 0.14 ˆ 0.1 0.152 6.07 0.068 0.1 0.1 0.06 0.04 0.18 0.14 0.2 0.085 0.1 0.13 2.23 0.056 0.1 0.07 0.085 0.025 0.2 0.18 0.17 0.12 0.1 0.074 1.35 0.2 0.1 0.07 0.15 0.12 0.17 0.18 0.1 0.09 0.1 0.075 4.98E21c 0.08 0.07 0.09 0.15 0.1 0.16 0.04 0.09 0.08 0.076 1.83E21 0.06 0.076 0.15 0.1 0.16 0.04 0.09 0.3 0.06 0.0767 6.74E22 ˆ 0.08 0.15 0.1 0.04 0.09 0.04 0.08
8 and 9 0.08 0.15 0.1 0.04 0.125 0.04 0.0810 and 11 0.04 0.08 0.15 0.1 0.04 0.11 0.04 0.0812 and 13 0.08 0.15 0.1 0.04 0.1 0.04 0.0814 and 15 ˇ 0.054 0.04 0.079 0.04 0.054 ˇ 0.04 0.054
15N Pb and Bi
Groupb sinel sel scapt sinel sel scapt sn,2n
1 and 2 0.4 0.05 0.3 0.4 0.2 0.2 12 through 13 0.05 0.3 0.4 0.2 0.2 1
14 and 15 0.05 0.3 0.04 0.2 0.2 1
*Variance matrix~ds0s!.aFor all ~n, p! and~n,a! a constant uncertainty value of620% has been adopted.bSee energy boundary in Table IV.cRead as 4.983 1021.
TABLE V
Variance Matrix for Minor Actinides*
Groupa n sf sinel sel scapt n sf sinel sel scapt n sf sinel sel scapt
237Np 241Am and243Am 242mAm
1 and 2 0.05 0.25 0.5 0.05 0.4 0.05 0.2 0.5 0.05 0.4 0.05 0.2 0.5 0.05 0.4
3 through 6 0.05 0.25 0.5 0.05 0.15 0.05 0.2 0.5 0.05 0.4 0.05 0.2 0.5 0.05 0.4
7 through 15 0.05 0.25 0.5 0.05 0.15 0.05 0.2 0.5 0.05 0.2 0.05 0.2 0.5 0.05 0.04
242Cm,243Cm,245Cm,246Cm 244Cm
1 through 4 0.05 0.3 0.5 0.05 0.4 0.05 0.4 0.5 0.05 0.4
5 through 13 0.05 0.3 0.5 0.05 0.4 0.05 0.3 0.5 0.05 0.4
14 and 15 0.05 0.3 0.5 0.05 0.04 0.05 0.3 0.5 0.05 0.04
*Variance matrix~ds0s!.aSee energy boundary in Table IV.
NUCLEAR DATA UNCERTAINTIES IN ACCELERATOR-DRIVEN ASSEMBLIES 23
NUCLEAR SCIENCE AND ENGINEERING VOL. 146 JAN. 2004
established in formal covariance data, and future stud-ies should certainly address these issues to consolidatethe results obtained in the present study. In summary,the uncertainty values used in this study are prelimi-nary but allow reasonable and quantitative indicationsof their impact. In fact, to point out outstanding prob-lems and areas of concern, an exact answer is not themajor requirement but rather a physics insight on a verylarge number of data with different sensitivities.
IV.B. Uncertainty on theMultiplication Factor
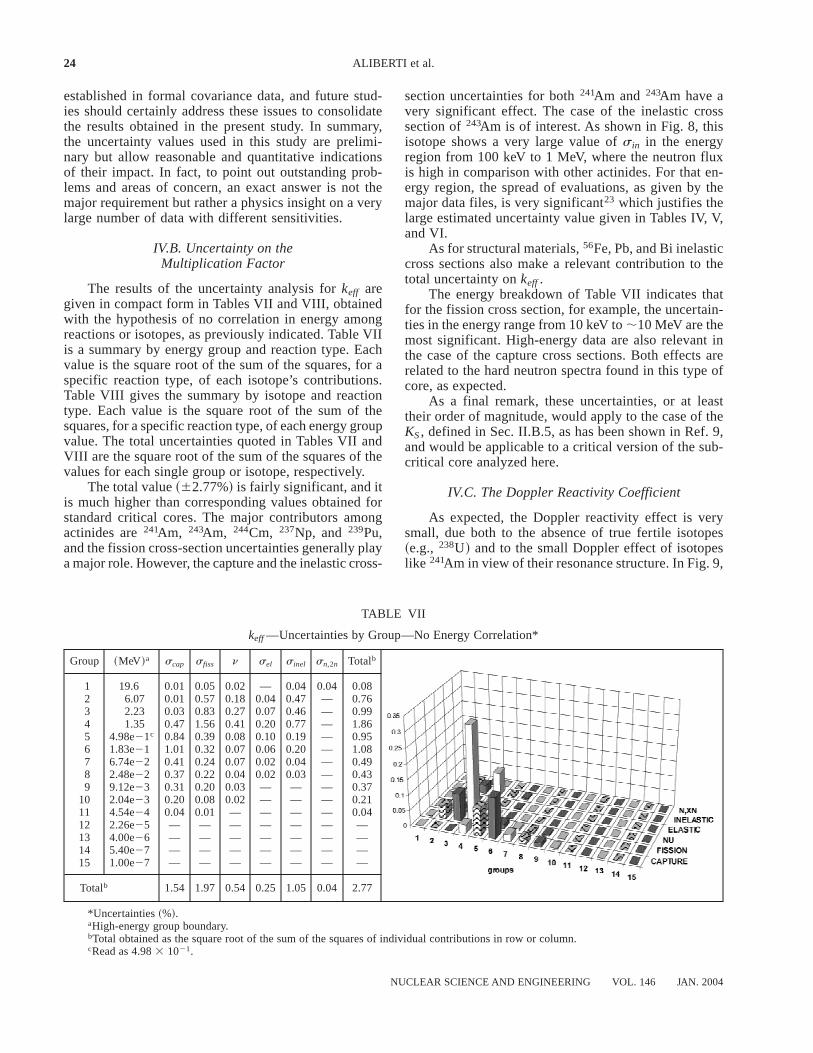
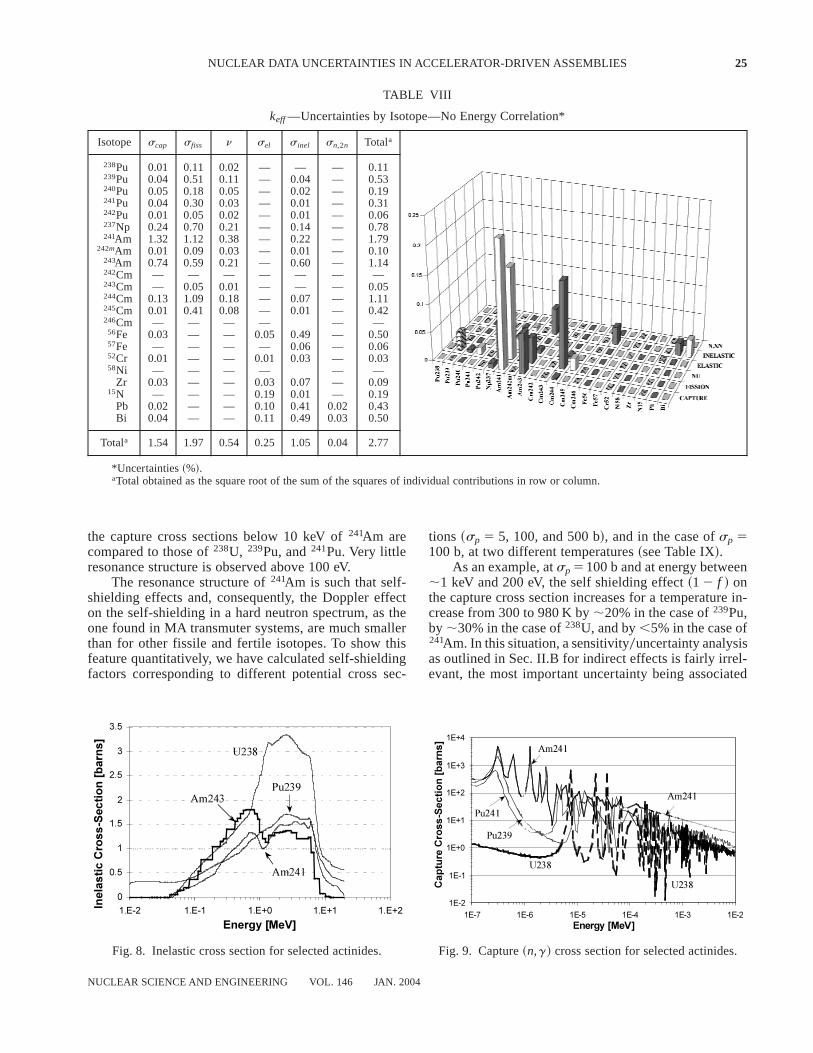
The results of the uncertainty analysis forkeff aregiven in compact form in Tables VII and VIII, obtainedwith the hypothesis of no correlation in energy amongreactions or isotopes, as previously indicated. Table VIIis a summary by energy group and reaction type. Eachvalue is the square root of the sum of the squares, for aspecific reaction type, of each isotope’s contributions.Table VIII gives the summary by isotope and reactiontype. Each value is the square root of the sum of thesquares, for a specific reaction type, of each energy groupvalue. The total uncertainties quoted in Tables VII andVIII are the square root of the sum of the squares of thevalues for each single group or isotope, respectively.
The total value~62.77%! is fairly significant, and itis much higher than corresponding values obtained forstandard critical cores. The major contributors amongactinides are241Am, 243Am, 244Cm, 237Np, and 239Pu,and the fission cross-section uncertainties generally playa major role. However, the capture and the inelastic cross-
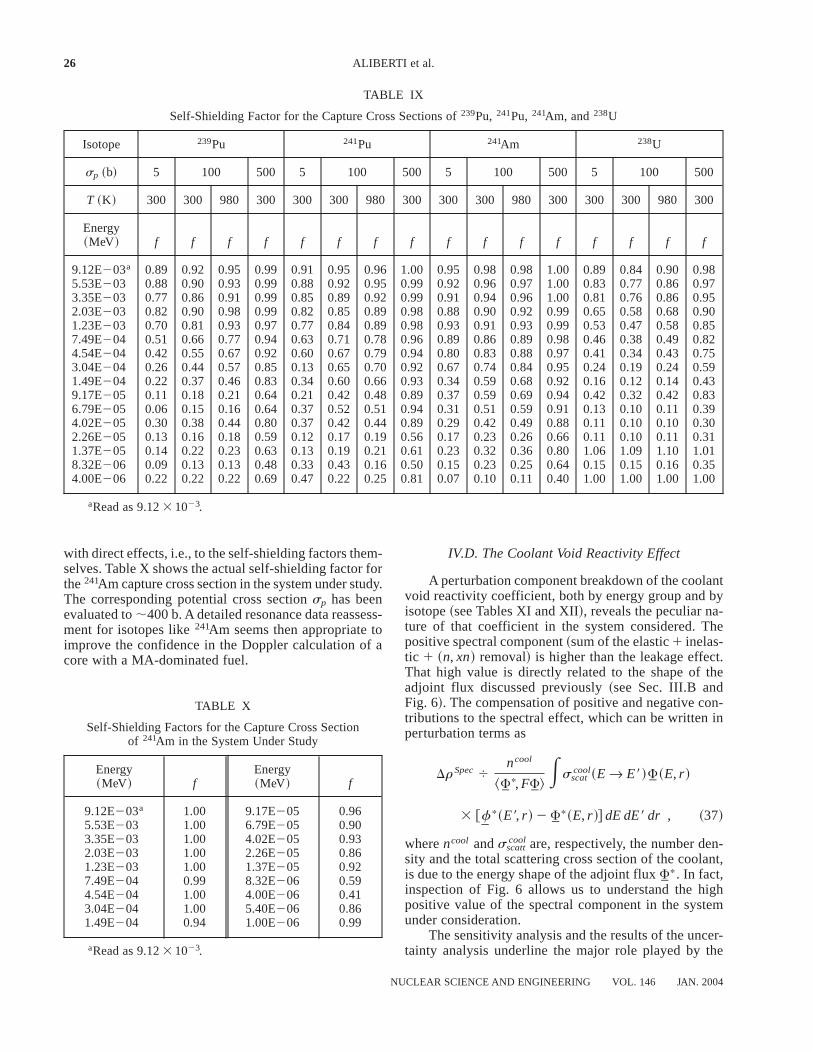
section uncertainties for both241Am and 243Am have avery significant effect. The case of the inelastic crosssection of243Am is of interest. As shown in Fig. 8, thisisotope shows a very large value ofsin in the energyregion from 100 keV to 1 MeV, where the neutron fluxis high in comparison with other actinides. For that en-ergy region, the spread of evaluations, as given by themajor data files, is very significant23 which justifies thelarge estimated uncertainty value given in Tables IV, V,and VI.
As for structural materials,56Fe, Pb, and Bi inelasticcross sections also make a relevant contribution to thetotal uncertainty onkeff.
The energy breakdown of Table VII indicates thatfor the fission cross section, for example, the uncertain-ties in the energy range from 10 keV to;10 MeV are themost significant. High-energy data are also relevant inthe case of the capture cross sections. Both effects arerelated to the hard neutron spectra found in this type ofcore, as expected.
As a final remark, these uncertainties, or at leasttheir order of magnitude, would apply to the case of theKS, defined in Sec. II.B.5, as has been shown in Ref. 9,and would be applicable to a critical version of the sub-critical core analyzed here.
IV.C. The Doppler Reactivity Coefficient
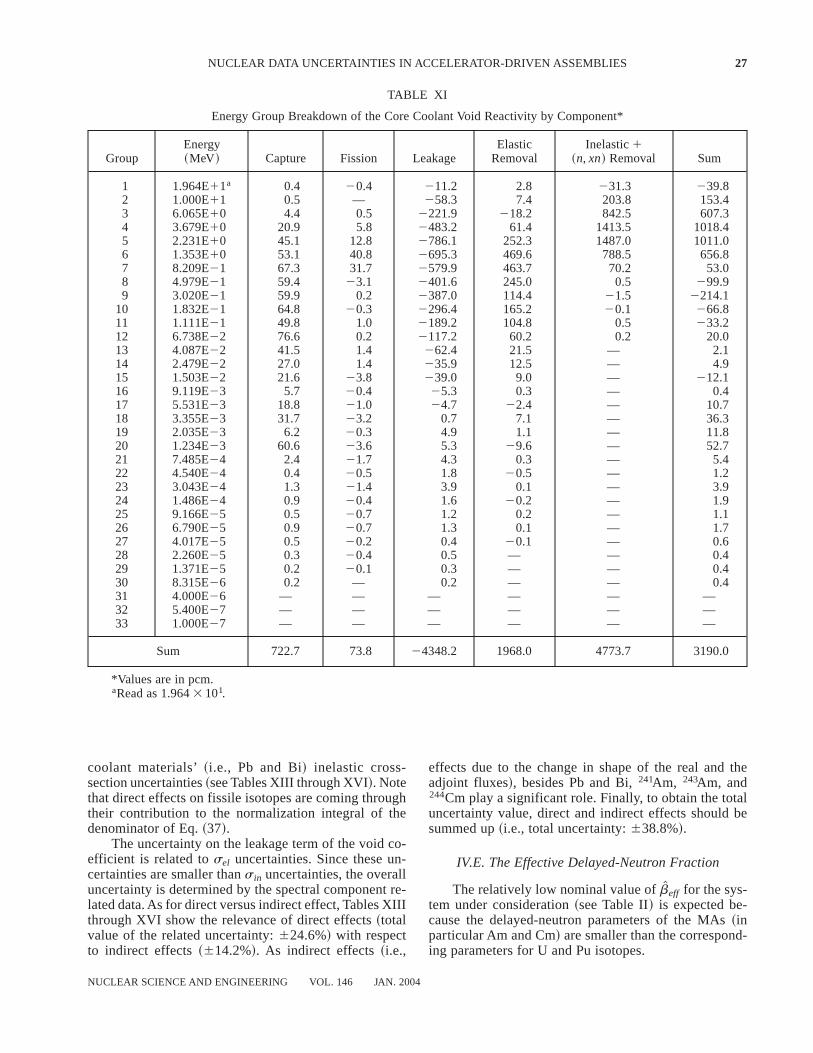
As expected, the Doppler reactivity effect is verysmall, due both to the absence of true fertile isotopes~e.g., 238U! and to the small Doppler effect of isotopeslike 241Am in view of their resonance structure. In Fig. 9,
TABLE VII
keff—Uncertainties by Group—No Energy Correlation*
Group ~MeV!a scap sfiss n sel sinel sn,2n Totalb
1 19.6 0.01 0.05 0.02 — 0.04 0.04 0.082 6.07 0.01 0.57 0.18 0.04 0.47 — 0.763 2.23 0.03 0.83 0.27 0.07 0.46 — 0.994 1.35 0.47 1.56 0.41 0.20 0.77 — 1.865 4.98e21c 0.84 0.39 0.08 0.10 0.19 — 0.956 1.83e21 1.01 0.32 0.07 0.06 0.20 — 1.087 6.74e22 0.41 0.24 0.07 0.02 0.04 — 0.498 2.48e22 0.37 0.22 0.04 0.02 0.03 — 0.439 9.12e23 0.31 0.20 0.03 — — — 0.37
10 2.04e23 0.20 0.08 0.02 — — — 0.2111 4.54e24 0.04 0.01 — — — — 0.0412 2.26e25 — — — — — — —13 4.00e26 — — — — — — —14 5.40e27 — — — — — — —15 1.00e27 — — — — — — —
Totalb 1.54 1.97 0.54 0.25 1.05 0.04 2.77
*Uncertainties~%!.aHigh-energy group boundary.bTotal obtained as the square root of the sum of the squares of individual contributions in row or column.cRead as 4.983 1021.
24 ALIBERTI et al.
NUCLEAR SCIENCE AND ENGINEERING VOL. 146 JAN. 2004
the capture cross sections below 10 keV of241Am arecompared to those of238U, 239Pu, and241Pu. Very littleresonance structure is observed above 100 eV.
The resonance structure of241Am is such that self-shielding effects and, consequently, the Doppler effecton the self-shielding in a hard neutron spectrum, as theone found in MA transmuter systems, are much smallerthan for other fissile and fertile isotopes. To show thisfeature quantitatively, we have calculated self-shieldingfactors corresponding to different potential cross sec-
tions ~sp 5 5, 100, and 500 b!, and in the case ofsp 5100 b, at two different temperatures~see Table IX!.
As an example, atsp 5100 b and at energy between;1 keV and 200 eV, the self shielding effect~1 2 f ! onthe capture cross section increases for a temperature in-crease from 300 to 980 K by;20% in the case of239Pu,by ;30% in the case of238U, and by,5% in the case of241Am. In this situation, a sensitivity0uncertainty analysisas outlined in Sec. II.B for indirect effects is fairly irrel-evant, the most important uncertainty being associated
TABLE VIII
keff—Uncertainties by Isotope—No Energy Correlation*
Isotope scap sfiss n sel sinel sn,2n Totala
238Pu 0.01 0.11 0.02 — — — 0.11239Pu 0.04 0.51 0.11 — 0.04 — 0.53240Pu 0.05 0.18 0.05 — 0.02 — 0.19241Pu 0.04 0.30 0.03 — 0.01 — 0.31242Pu 0.01 0.05 0.02 — 0.01 — 0.06237Np 0.24 0.70 0.21 — 0.14 — 0.78241Am 1.32 1.12 0.38 — 0.22 — 1.79
242mAm 0.01 0.09 0.03 — 0.01 — 0.10243Am 0.74 0.59 0.21 — 0.60 — 1.14242Cm — — — — — — —243Cm — 0.05 0.01 — — — 0.05244Cm 0.13 1.09 0.18 — 0.07 — 1.11245Cm 0.01 0.41 0.08 — 0.01 — 0.42246Cm — — — — — —56Fe 0.03 — — 0.05 0.49 — 0.5057Fe — — — — 0.06 — 0.0652Cr 0.01 — — 0.01 0.03 — 0.0358Ni — — — — — —
Zr 0.03 — — 0.03 0.07 — 0.0915N — — — 0.19 0.01 — 0.19
Pb 0.02 — — 0.10 0.41 0.02 0.43Bi 0.04 — — 0.11 0.49 0.03 0.50
Totala 1.54 1.97 0.54 0.25 1.05 0.04 2.77
*Uncertainties~%!.aTotal obtained as the square root of the sum of the squares of individual contributions in row or column.
Fig. 8. Inelastic cross section for selected actinides. Fig. 9. Capture~n,g! cross section for selected actinides.
NUCLEAR DATA UNCERTAINTIES IN ACCELERATOR-DRIVEN ASSEMBLIES 25
NUCLEAR SCIENCE AND ENGINEERING VOL. 146 JAN. 2004
with direct effects, i.e., to the self-shielding factors them-selves. Table X shows the actual self-shielding factor forthe241Am capture cross section in the system under study.The corresponding potential cross sectionsp has beenevaluated to;400 b. A detailed resonance data reassess-ment for isotopes like241Am seems then appropriate toimprove the confidence in the Doppler calculation of acore with a MA-dominated fuel.
IV.D. The Coolant Void Reactivity Effect
A perturbation component breakdown of the coolantvoid reactivity coefficient, both by energy group and byisotope~see Tables XI and XII!, reveals the peculiar na-ture of that coefficient in the system considered. Thepositive spectral component~sum of the elastic1 inelas-tic 1 ~n, xn! removal! is higher than the leakage effect.That high value is directly related to the shape of theadjoint flux discussed previously~see Sec. III.B andFig. 6!. The compensation of positive and negative con-tributions to the spectral effect, which can be written inperturbation terms as
DrSpec4ncool
^ uF*, F uF&Esscat
cool~E r E ' ! uF~E, r !
3 @ of*~E ', r ! 2 uF*~E, r !# dE dE' dr , ~37!
wherencool andsscattcool are, respectively, the number den-
sity and the total scattering cross section of the coolant,is due to the energy shape of the adjoint fluxuF* . In fact,inspection of Fig. 6 allows us to understand the highpositive value of the spectral component in the systemunder consideration.
The sensitivity analysis and the results of the uncer-tainty analysis underline the major role played by the
TABLE IX
Self-Shielding Factor for the Capture Cross Sections of239Pu, 241Pu, 241Am, and238U
Isotope 239Pu 241Pu 241Am 238U
sp ~b! 5 100 500 5 100 500 5 100 500 5 100 500
T ~K ! 300 300 980 300 300 300 980 300 300 300 980 300 300 300 980 300
Energy~MeV! f f f f f f f f f f f f f f f f
9.12E203a 0.89 0.92 0.95 0.99 0.91 0.95 0.96 1.00 0.95 0.98 0.98 1.00 0.89 0.84 0.90 0.985.53E203 0.88 0.90 0.93 0.99 0.88 0.92 0.95 0.99 0.92 0.96 0.97 1.00 0.83 0.77 0.86 0.973.35E203 0.77 0.86 0.91 0.99 0.85 0.89 0.92 0.99 0.91 0.94 0.96 1.00 0.81 0.76 0.86 0.952.03E203 0.82 0.90 0.98 0.99 0.82 0.85 0.89 0.98 0.88 0.90 0.92 0.99 0.65 0.58 0.68 0.901.23E203 0.70 0.81 0.93 0.97 0.77 0.84 0.89 0.98 0.93 0.91 0.93 0.99 0.53 0.47 0.58 0.857.49E204 0.51 0.66 0.77 0.94 0.63 0.71 0.78 0.96 0.89 0.86 0.89 0.98 0.46 0.38 0.49 0.824.54E204 0.42 0.55 0.67 0.92 0.60 0.67 0.79 0.94 0.80 0.83 0.88 0.97 0.41 0.34 0.43 0.753.04E204 0.26 0.44 0.57 0.85 0.13 0.65 0.70 0.92 0.67 0.74 0.84 0.95 0.24 0.19 0.24 0.591.49E204 0.22 0.37 0.46 0.83 0.34 0.60 0.66 0.93 0.34 0.59 0.68 0.92 0.16 0.12 0.14 0.439.17E205 0.11 0.18 0.21 0.64 0.21 0.42 0.48 0.89 0.37 0.59 0.69 0.94 0.42 0.32 0.42 0.836.79E205 0.06 0.15 0.16 0.64 0.37 0.52 0.51 0.94 0.31 0.51 0.59 0.91 0.13 0.10 0.11 0.394.02E205 0.30 0.38 0.44 0.80 0.37 0.42 0.44 0.89 0.29 0.42 0.49 0.88 0.11 0.10 0.10 0.302.26E205 0.13 0.16 0.18 0.59 0.12 0.17 0.19 0.56 0.17 0.23 0.26 0.66 0.11 0.10 0.11 0.311.37E205 0.14 0.22 0.23 0.63 0.13 0.19 0.21 0.61 0.23 0.32 0.36 0.80 1.06 1.09 1.10 1.018.32E206 0.09 0.13 0.13 0.48 0.33 0.43 0.16 0.50 0.15 0.23 0.25 0.64 0.15 0.15 0.16 0.354.00E206 0.22 0.22 0.22 0.69 0.47 0.22 0.25 0.81 0.07 0.10 0.11 0.40 1.00 1.00 1.00 1.00
aRead as 9.123 1023.
TABLE X
Self-Shielding Factors for the Capture Cross Sectionof 241Am in the System Under Study
Energy~MeV! f
Energy~MeV! f
9.12E203a 1.00 9.17E205 0.965.53E203 1.00 6.79E205 0.903.35E203 1.00 4.02E205 0.932.03E203 1.00 2.26E205 0.861.23E203 1.00 1.37E205 0.927.49E204 0.99 8.32E206 0.594.54E204 1.00 4.00E206 0.413.04E204 1.00 5.40E206 0.861.49E204 0.94 1.00E206 0.99
aRead as 9.123 1023.
26 ALIBERTI et al.
NUCLEAR SCIENCE AND ENGINEERING VOL. 146 JAN. 2004
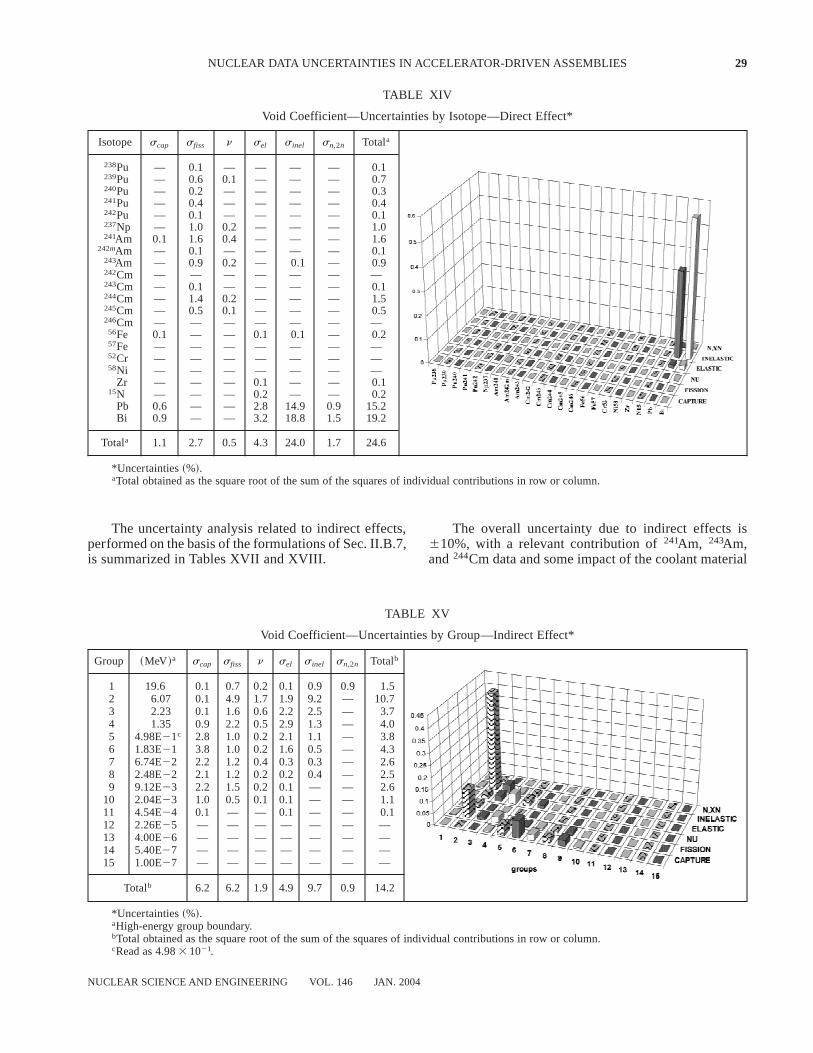
coolant materials’~i.e., Pb and Bi! inelastic cross-section uncertainties~see Tables XIII through XVI!. Notethat direct effects on fissile isotopes are coming throughtheir contribution to the normalization integral of thedenominator of Eq.~37!.
The uncertainty on the leakage term of the void co-efficient is related tosel uncertainties. Since these un-certainties are smaller thansin uncertainties, the overalluncertainty is determined by the spectral component re-lated data. As for direct versus indirect effect, Tables XIIIthrough XVI show the relevance of direct effects~totalvalue of the related uncertainty:624.6%! with respectto indirect effects~614.2%!. As indirect effects~i.e.,
effects due to the change in shape of the real and theadjoint fluxes!, besides Pb and Bi,241Am, 243Am, and244Cm play a significant role. Finally, to obtain the totaluncertainty value, direct and indirect effects should besummed up~i.e., total uncertainty:638.8%!.
IV.E. The Effective Delayed-Neutron Fraction
The relatively low nominal value ofZbeff for the sys-tem under consideration~see Table II! is expected be-cause the delayed-neutron parameters of the MAs~inparticular Am and Cm! are smaller than the correspond-ing parameters for U and Pu isotopes.
TABLE XI
Energy Group Breakdown of the Core Coolant Void Reactivity by Component*
GroupEnergy~MeV! Capture Fission Leakage
ElasticRemoval
Inelastic1~n, xn! Removal Sum
1 1.964E11a 0.4 20.4 211.2 2.8 231.3 239.82 1.000E11 0.5 — 258.3 7.4 203.8 153.43 6.065E10 4.4 0.5 2221.9 218.2 842.5 607.34 3.679E10 20.9 5.8 2483.2 61.4 1413.5 1018.45 2.231E10 45.1 12.8 2786.1 252.3 1487.0 1011.06 1.353E10 53.1 40.8 2695.3 469.6 788.5 656.87 8.209E21 67.3 31.7 2579.9 463.7 70.2 53.08 4.979E21 59.4 23.1 2401.6 245.0 0.5 299.99 3.020E21 59.9 0.2 2387.0 114.4 21.5 2214.1
10 1.832E21 64.8 20.3 2296.4 165.2 20.1 266.811 1.111E21 49.8 1.0 2189.2 104.8 0.5 233.212 6.738E22 76.6 0.2 2117.2 60.2 0.2 20.013 4.087E22 41.5 1.4 262.4 21.5 — 2.114 2.479E22 27.0 1.4 235.9 12.5 — 4.915 1.503E22 21.6 23.8 239.0 9.0 — 212.116 9.119E23 5.7 20.4 25.3 0.3 — 0.417 5.531E23 18.8 21.0 24.7 22.4 — 10.718 3.355E23 31.7 23.2 0.7 7.1 — 36.319 2.035E23 6.2 20.3 4.9 1.1 — 11.820 1.234E23 60.6 23.6 5.3 29.6 — 52.721 7.485E24 2.4 21.7 4.3 0.3 — 5.422 4.540E24 0.4 20.5 1.8 20.5 — 1.223 3.043E24 1.3 21.4 3.9 0.1 — 3.924 1.486E24 0.9 20.4 1.6 20.2 — 1.925 9.166E25 0.5 20.7 1.2 0.2 — 1.126 6.790E25 0.9 20.7 1.3 0.1 — 1.727 4.017E25 0.5 20.2 0.4 20.1 — 0.628 2.260E25 0.3 20.4 0.5 — — 0.429 1.371E25 0.2 20.1 0.3 — — 0.430 8.315E26 0.2 — 0.2 — — 0.431 4.000E26 — — — — — —32 5.400E27 — — — — — —33 1.000E27 — — — — — —
Sum 722.7 73.8 24348.2 1968.0 4773.7 3190.0
*Values are in pcm.aRead as 1.9643 101.
NUCLEAR DATA UNCERTAINTIES IN ACCELERATOR-DRIVEN ASSEMBLIES 27
NUCLEAR SCIENCE AND ENGINEERING VOL. 146 JAN. 2004
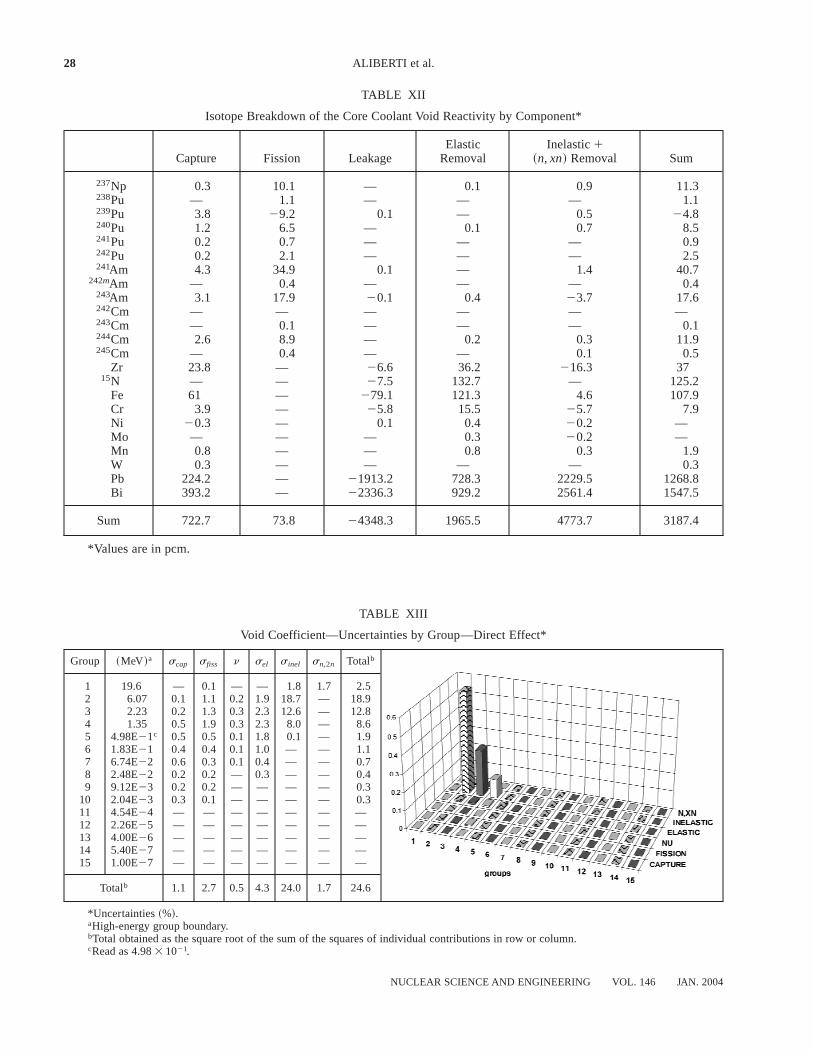
TABLE XII
Isotope Breakdown of the Core Coolant Void Reactivity by Component*
Capture Fission LeakageElastic
RemovalInelastic1
~n, xn! Removal Sum
237Np 0.3 10.1 — 0.1 0.9 11.3238Pu — 1.1 — — — 1.1239Pu 3.8 29.2 0.1 — 0.5 24.8240Pu 1.2 6.5 — 0.1 0.7 8.5241Pu 0.2 0.7 — — — 0.9242Pu 0.2 2.1 — — — 2.5241Am 4.3 34.9 0.1 — 1.4 40.7
242mAm — 0.4 — — — 0.4243Am 3.1 17.9 20.1 0.4 23.7 17.6242Cm — — — — — —243Cm — 0.1 — — — 0.1244Cm 2.6 8.9 — 0.2 0.3 11.9245Cm — 0.4 — — 0.1 0.5
Zr 23.8 — 26.6 36.2 216.3 3715N — — 27.5 132.7 — 125.2
Fe 61 — 279.1 121.3 4.6 107.9Cr 3.9 — 25.8 15.5 25.7 7.9Ni 20.3 — 0.1 0.4 20.2 —Mo — — — 0.3 20.2 —Mn 0.8 — — 0.8 0.3 1.9W 0.3 — — — — 0.3Pb 224.2 — 21913.2 728.3 2229.5 1268.8Bi 393.2 — 22336.3 929.2 2561.4 1547.5
Sum 722.7 73.8 24348.3 1965.5 4773.7 3187.4
*Values are in pcm.
TABLE XIII
Void Coefficient—Uncertainties by Group—Direct Effect*
Group ~MeV!a scap sfiss n sel sinel sn,2n Totalb
1 19.6 — 0.1 — — 1.8 1.7 2.52 6.07 0.1 1.1 0.2 1.9 18.7 — 18.93 2.23 0.2 1.3 0.3 2.3 12.6 — 12.84 1.35 0.5 1.9 0.3 2.3 8.0 — 8.65 4.98E21c 0.5 0.5 0.1 1.8 0.1 — 1.96 1.83E21 0.4 0.4 0.1 1.0 — — 1.17 6.74E22 0.6 0.3 0.1 0.4 — — 0.78 2.48E22 0.2 0.2 — 0.3 — — 0.49 9.12E23 0.2 0.2 — — — — 0.3
10 2.04E23 0.3 0.1 — — — — 0.311 4.54E24 — — — — — — —12 2.26E25 — — — — — — —13 4.00E26 — — — — — — —14 5.40E27 — — — — — — —15 1.00E27 — — — — — — —
Totalb 1.1 2.7 0.5 4.3 24.0 1.7 24.6
*Uncertainties~%!.aHigh-energy group boundary.bTotal obtained as the square root of the sum of the squares of individual contributions in row or column.cRead as 4.983 1021.
28 ALIBERTI et al.
NUCLEAR SCIENCE AND ENGINEERING VOL. 146 JAN. 2004
The uncertainty analysis related to indirect effects,performed on the basis of the formulations of Sec. II.B.7,is summarized in Tables XVII and XVIII.
The overall uncertainty due to indirect effects is610%, with a relevant contribution of241Am, 243Am,and244Cm data and some impact of the coolant material
TABLE XIV
Void Coefficient—Uncertainties by Isotope—Direct Effect*
Isotope scap sfiss n sel sinel sn,2n Totala
238Pu — 0.1 — — — — 0.1239Pu — 0.6 0.1 — — — 0.7240Pu — 0.2 — — — — 0.3241Pu — 0.4 — — — — 0.4242Pu — 0.1 — — — — 0.1237Np — 1.0 0.2 — — — 1.0241Am 0.1 1.6 0.4 — — — 1.6
242mAm — 0.1 — — — — 0.1243Am — 0.9 0.2 — 0.1 — 0.9242Cm — — — — — — —243Cm — 0.1 — — — — 0.1244Cm — 1.4 0.2 — — — 1.5245Cm — 0.5 0.1 — — — 0.5246Cm — — — — — — —56Fe 0.1 — — 0.1 0.1 — 0.257Fe — — — — — — —52Cr — — — — — — —58Ni — — — — — — —
Zr — — — 0.1 — — 0.115N — — — 0.2 — — 0.2
Pb 0.6 — — 2.8 14.9 0.9 15.2Bi 0.9 — — 3.2 18.8 1.5 19.2
Totala 1.1 2.7 0.5 4.3 24.0 1.7 24.6
*Uncertainties~%!.aTotal obtained as the square root of the sum of the squares of individual contributions in row or column.
TABLE XV
Void Coefficient—Uncertainties by Group—Indirect Effect*
Group ~MeV!a scap sfiss n sel sinel sn,2n Totalb
1 19.6 0.1 0.7 0.2 0.1 0.9 0.9 1.52 6.07 0.1 4.9 1.7 1.9 9.2 — 10.73 2.23 0.1 1.6 0.6 2.2 2.5 — 3.74 1.35 0.9 2.2 0.5 2.9 1.3 — 4.05 4.98E21c 2.8 1.0 0.2 2.1 1.1 — 3.86 1.83E21 3.8 1.0 0.2 1.6 0.5 — 4.37 6.74E22 2.2 1.2 0.4 0.3 0.3 — 2.68 2.48E22 2.1 1.2 0.2 0.2 0.4 — 2.59 9.12E23 2.2 1.5 0.2 0.1 — — 2.6
10 2.04E23 1.0 0.5 0.1 0.1 — — 1.111 4.54E24 0.1 — — 0.1 — — 0.112 2.26E25 — — — — — — —13 4.00E26 — — — — — — —14 5.40E27 — — — — — — —15 1.00E27 — — — — — — —
Totalb 6.2 6.2 1.9 4.9 9.7 0.9 14.2
*Uncertainties~%!.aHigh-energy group boundary.bTotal obtained as the square root of the sum of the squares of individual contributions in row or column.cRead as 4.983 1021.
NUCLEAR DATA UNCERTAINTIES IN ACCELERATOR-DRIVEN ASSEMBLIES 29
NUCLEAR SCIENCE AND ENGINEERING VOL. 146 JAN. 2004
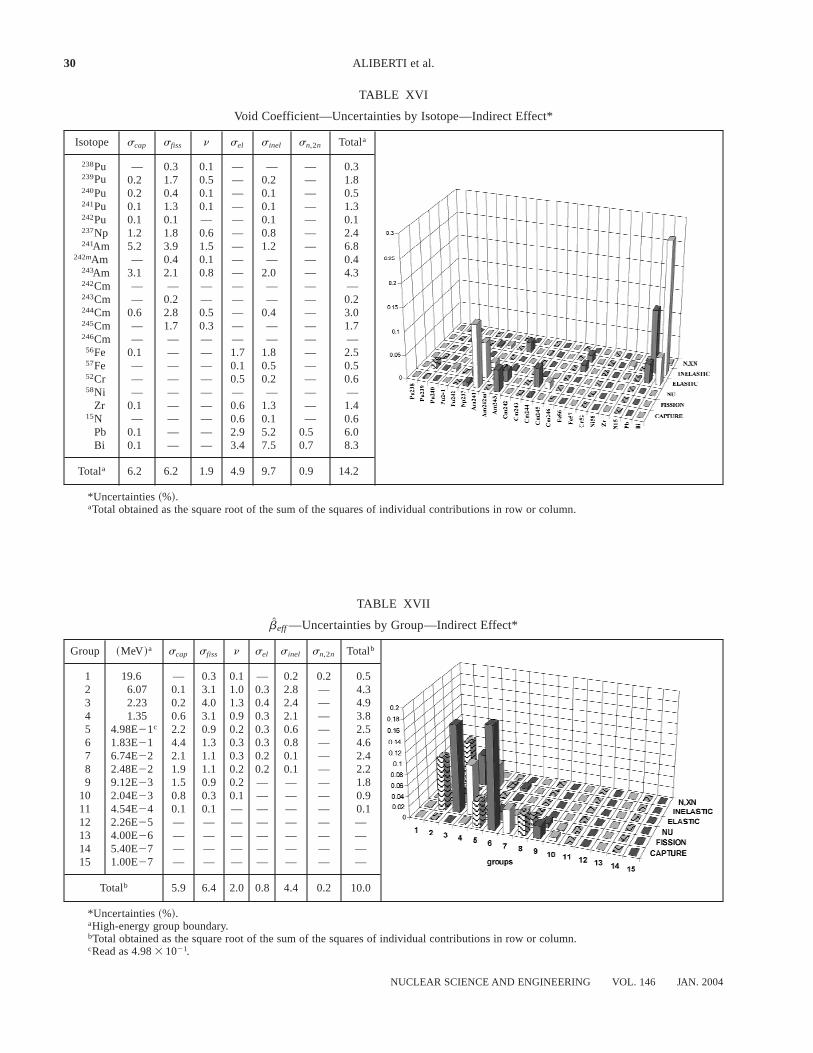
TABLE XVI
Void Coefficient—Uncertainties by Isotope—Indirect Effect*
Isotope scap sfiss n sel sinel sn,2n Totala
238Pu — 0.3 0.1 — — — 0.3239Pu 0.2 1.7 0.5 — 0.2 — 1.8240Pu 0.2 0.4 0.1 — 0.1 — 0.5241Pu 0.1 1.3 0.1 — 0.1 — 1.3242Pu 0.1 0.1 — — 0.1 — 0.1237Np 1.2 1.8 0.6 — 0.8 — 2.4241Am 5.2 3.9 1.5 — 1.2 — 6.8
242mAm — 0.4 0.1 — — — 0.4243Am 3.1 2.1 0.8 — 2.0 — 4.3242Cm — — — — — — —243Cm — 0.2 — — — — 0.2244Cm 0.6 2.8 0.5 — 0.4 — 3.0245Cm — 1.7 0.3 — — — 1.7246Cm — — — — — — —56Fe 0.1 — — 1.7 1.8 — 2.557Fe — — — 0.1 0.5 — 0.552Cr — — — 0.5 0.2 — 0.658Ni — — — — — — —
Zr 0.1 — — 0.6 1.3 — 1.415N — — — 0.6 0.1 — 0.6
Pb 0.1 — — 2.9 5.2 0.5 6.0Bi 0.1 — — 3.4 7.5 0.7 8.3
Totala 6.2 6.2 1.9 4.9 9.7 0.9 14.2
*Uncertainties~%!.aTotal obtained as the square root of the sum of the squares of individual contributions in row or column.
TABLE XVII
Zbeff—Uncertainties by Group—Indirect Effect*
Group ~MeV!a scap sfiss n sel sinel sn,2n Totalb
1 19.6 — 0.3 0.1 — 0.2 0.2 0.52 6.07 0.1 3.1 1.0 0.3 2.8 — 4.33 2.23 0.2 4.0 1.3 0.4 2.4 — 4.94 1.35 0.6 3.1 0.9 0.3 2.1 — 3.85 4.98E21c 2.2 0.9 0.2 0.3 0.6 — 2.56 1.83E21 4.4 1.3 0.3 0.3 0.8 — 4.67 6.74E22 2.1 1.1 0.3 0.2 0.1 — 2.48 2.48E22 1.9 1.1 0.2 0.2 0.1 — 2.29 9.12E23 1.5 0.9 0.2 — — — 1.8
10 2.04E23 0.8 0.3 0.1 — — — 0.911 4.54E24 0.1 0.1 — — — — 0.112 2.26E25 — — — — — — —13 4.00E26 — — — — — — —14 5.40E27 — — — — — — —15 1.00E27 — — — — — — —
Totalb 5.9 6.4 2.0 0.8 4.4 0.2 10.0
*Uncertainties~%!.aHigh-energy group boundary.bTotal obtained as the square root of the sum of the squares of individual contributions in row or column.cRead as 4.983 1021.
30 ALIBERTI et al.
NUCLEAR SCIENCE AND ENGINEERING VOL. 146 JAN. 2004
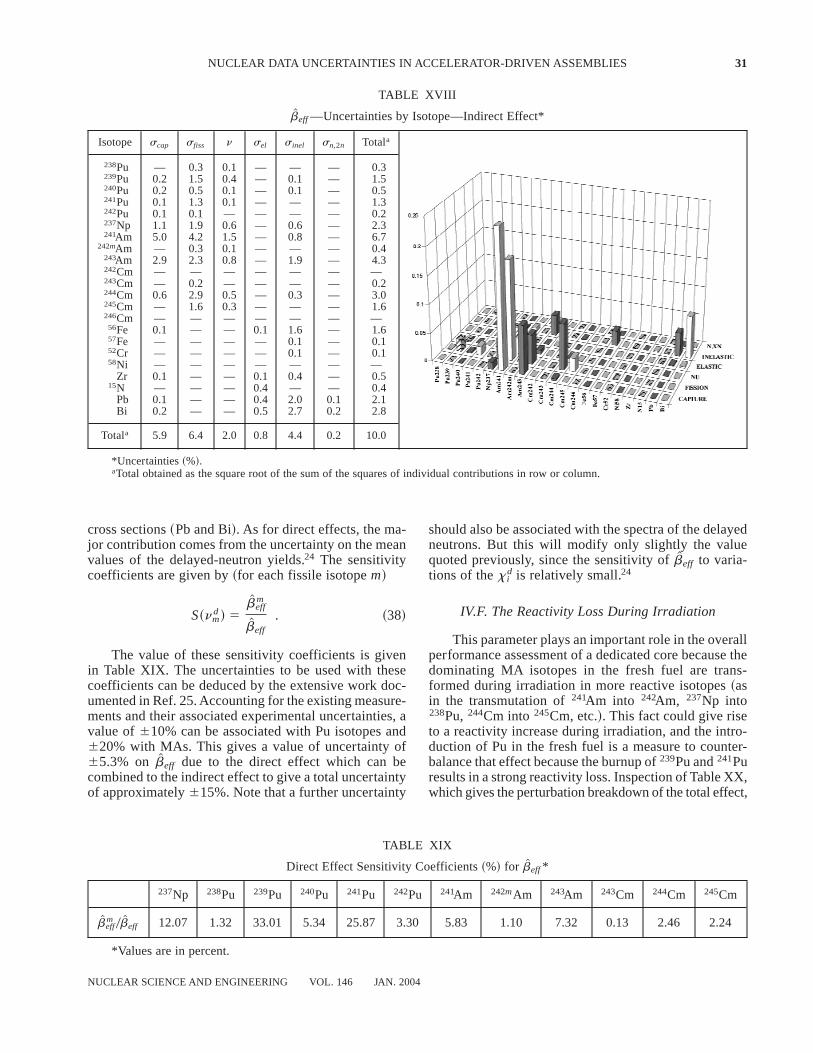
cross sections~Pb and Bi!. As for direct effects, the ma-jor contribution comes from the uncertainty on the meanvalues of the delayed-neutron yields.24 The sensitivitycoefficients are given by~for each fissile isotopem!
S~nmd ! 5
Zbeffm
Zbeff
. ~38!
The value of these sensitivity coefficients is givenin Table XIX. The uncertainties to be used with thesecoefficients can be deduced by the extensive work doc-umented in Ref. 25. Accounting for the existing measure-ments and their associated experimental uncertainties, avalue of610% can be associated with Pu isotopes and620% with MAs. This gives a value of uncertainty of65.3% on Zbeff due to the direct effect which can becombined to the indirect effect to give a total uncertaintyof approximately615%. Note that a further uncertainty
should also be associated with the spectra of the delayedneutrons. But this will modify only slightly the valuequoted previously, since the sensitivity ofZbeff to varia-tions of thexi
d is relatively small.24
IV.F. The Reactivity Loss During Irradiation
This parameter plays an important role in the overallperformance assessment of a dedicated core because thedominating MA isotopes in the fresh fuel are trans-formed during irradiation in more reactive isotopes~asin the transmutation of241Am into 242Am, 237Np into238Pu, 244Cm into 245Cm, etc.!. This fact could give riseto a reactivity increase during irradiation, and the intro-duction of Pu in the fresh fuel is a measure to counter-balance that effect because the burnup of239Pu and241Puresults in a strong reactivity loss. Inspection of Table XX,which gives the perturbation breakdown of the total effect,
TABLE XVIII
Zbeff—Uncertainties by Isotope—Indirect Effect*
Isotope scap sfiss n sel sinel sn,2n Totala
238Pu — 0.3 0.1 — — — 0.3239Pu 0.2 1.5 0.4 — 0.1 — 1.5240Pu 0.2 0.5 0.1 — 0.1 — 0.5241Pu 0.1 1.3 0.1 — — — 1.3242Pu 0.1 0.1 — — — — 0.2237Np 1.1 1.9 0.6 — 0.6 — 2.3241Am 5.0 4.2 1.5 — 0.8 — 6.7
242mAm — 0.3 0.1 — — — 0.4243Am 2.9 2.3 0.8 — 1.9 — 4.3242Cm — — — — — — —243Cm — 0.2 — — — — 0.2244Cm 0.6 2.9 0.5 — 0.3 — 3.0245Cm — 1.6 0.3 — — — 1.6246Cm — — — — — — —56Fe 0.1 — — 0.1 1.6 — 1.657Fe — — — — 0.1 — 0.152Cr — — — — 0.1 — 0.158Ni — — — — — — —
Zr 0.1 — — 0.1 0.4 — 0.515N — — — 0.4 — — 0.4
Pb 0.1 — — 0.4 2.0 0.1 2.1Bi 0.2 — — 0.5 2.7 0.2 2.8
Totala 5.9 6.4 2.0 0.8 4.4 0.2 10.0
*Uncertainties~%!.aTotal obtained as the square root of the sum of the squares of individual contributions in row or column.
TABLE XIX
Direct Effect Sensitivity Coefficients~%! for Zbeff*
237Np 238Pu 239Pu 240Pu 241Pu 242Pu 241Am 242mAm 243Am 243Cm 244Cm 245Cm
Zbeffm 0 Zbeff 12.07 1.32 33.01 5.34 25.87 3.30 5.83 1.10 7.32 0.13 2.46 2.24
*Values are in percent.
NUCLEAR DATA UNCERTAINTIES IN ACCELERATOR-DRIVEN ASSEMBLIES 31
NUCLEAR SCIENCE AND ENGINEERING VOL. 146 JAN. 2004
allows us to see clearly the different effects and theirorder of magnitude. The totalDrcycle value is then theresult of the compensation of large positive and negativecontributions. This situation can give rise to large directeffects @both due todnK and DrK , see Eq.~22! inSec. II.B.4# , and indirect effects will play a lesser role.This is confirmed by the results of the uncertainty analy-sis summarized in Tables XXI through XXIV. Thetotal uncertainty value is large, as expected~'650%,;600 pcm! and can have significant effects. For exam-ple, in the case of an ADS and for a compensation of thereactivity loss by a change of the proton beam current,one should allow a relevant margin on the maximumcurrent required from the accelerator to allow for uncer-tainties on the nominal value ofDrcycle.
As expected,241Am, 243Am, 242mAm, and244Cm cap-ture and fission data uncertainties play a major role.
As anticipated in Sec. II.B.3, in this analysis we ne-glected the coupling between the nuclide density varia-tion and flux field because it is assumed to be of negligibleimpact. In fact, Fig. 10 shows the comparison of the fluxspectrum calculated at beginning of life~BOL! and atend of life ~EOL!. The difference is practically insigni-ficant, which is confirmed by inspection of one-groupcross sections calculated at BOL and at EOL~seeTable XXV!.
Finally, sensitivity coefficients for nuclide densityvariation obtained with the cross sections determined atBOL do not change significantly if calculated at EOL.Even the average flux level in the core changes just from1.94431015 n0s{cm22 at BOL to 2.01831015 n0s{cm22
at EOL.
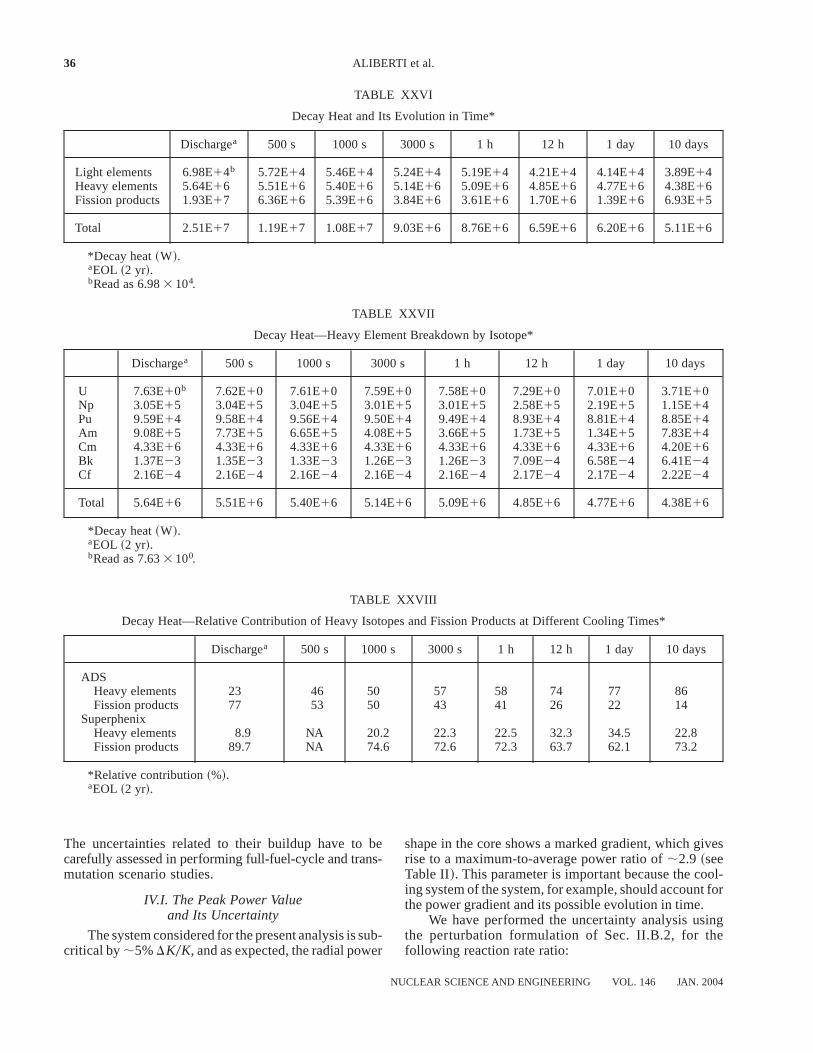
IV.G. The Decay Heat
The value quoted in Table II was obtained using thedata of the ORIGEN code.19 The breakdown of the con-tribution of heavy isotopes, fission products, and lightisotopes is given in Table XXVI. The contribution ofseparated heavy isotopes is given in Table XXVII. As faras the relative contributions of heavy elements, light ele-ments, and fission product and their evolution in time, acomparison~see Table XXVIII! with the values obtainedfor the typical fast reactor SUPERPHENIX~Ref. 26!indicates that the presence of MAs in the fuel increasesthe contribution of heavy isotopes with respect to thefission product component already at short cooling times,in particular due to the presence of Cm.
We have not attempted a full uncertainty analysis ofthe decay heat data, such as the one documented inRef. 27. However, partial but significant informationcan be obtained using the uncertainties on the nuclide
TABLE XX
Drcycle ~1 yr!—Perturbation Breakdown by Isotope*
Isotope Capture FissionElastic
RemovalInelastic1
~n, xn! Removal Sum
234U 22.5 6.0 — 20.9 2.6235U 20.1 1.2 — 0 1.1236U 20.1 0.1 — 0 20.1237Np 616.6 2659.9 21.7 74.8 29.8238Pu 2264.5 3060.5 — 255.4 2740.6239Pu 277.2 25389.0 22.2 82.2 25031.8240Pu 228.6 108.6 0.8 27.5 73.3241Pu 100.9 22032.1 20.9 19 21913.2242Pu 243.2 139.5 0.6 211.6 85.2241Am 1712.8 21620.4 22.6 127.3 217.0
242mAm 239.3 1354.4 20.2 221 1293.9242fAm 21.1 29.3 — 20.3 28.0243Am 870.9 2700.3 20.9 199.1 368.8242Cm 2119.2 986.2 20.1 245.1 821.9243Cm 20.1 14.1 — 20.1 13.9244Cm 2135.6 735.6 20.2 236.6 563.1245Cm 25.6 327.0 0.1 22.4 319.1246Cm 21.2 10.8 — 20.7 8.8247Cm — 1.3 — 0 1.3
Fission products 2574 0 241.1 2286.3 2901.3
Sum 2363.2 23627.3 248.6 34.6 21278.2
*Values in pcm.
32 ALIBERTI et al.
NUCLEAR SCIENCE AND ENGINEERING VOL. 146 JAN. 2004
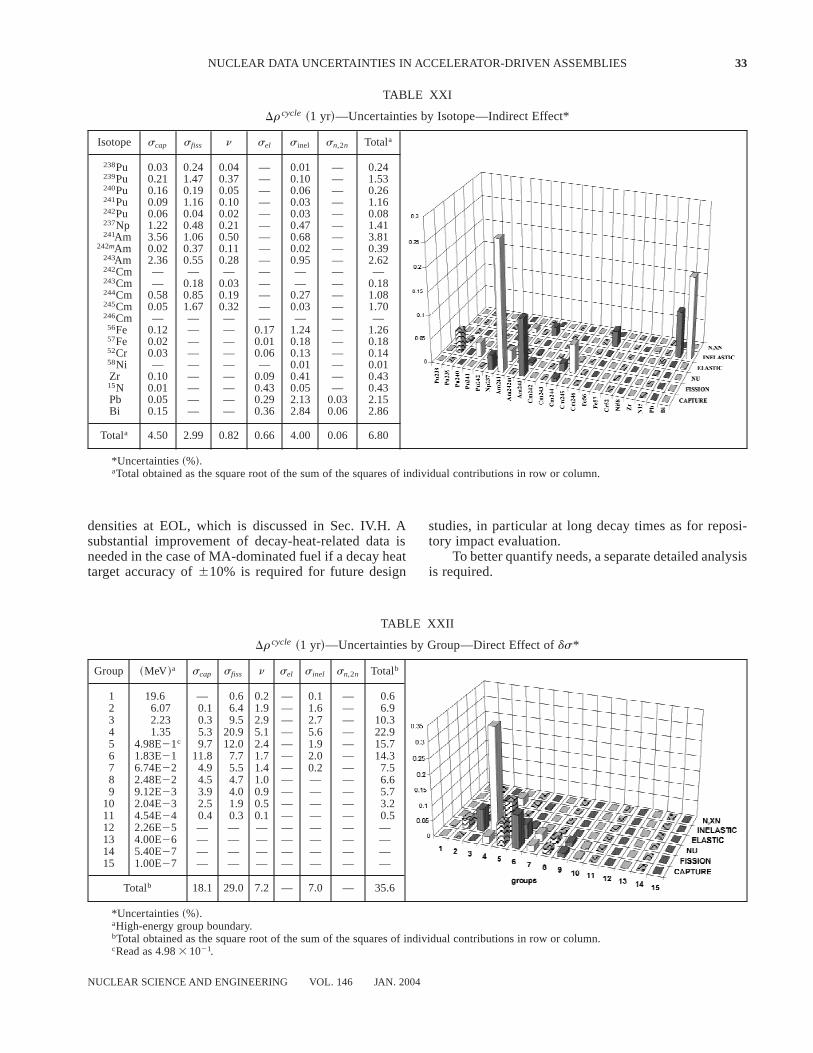
densities at EOL, which is discussed in Sec. IV.H. Asubstantial improvement of decay-heat-related data isneeded in the case of MA-dominated fuel if a decay heattarget accuracy of610% is required for future design
studies, in particular at long decay times as for reposi-tory impact evaluation.
To better quantify needs, a separate detailed analysisis required.
TABLE XXI
Drcycle ~1 yr!—Uncertainties by Isotope—Indirect Effect*
Isotope scap sfiss n sel sinel sn,2n Totala
238Pu 0.03 0.24 0.04 — 0.01 — 0.24239Pu 0.21 1.47 0.37 — 0.10 — 1.53240Pu 0.16 0.19 0.05 — 0.06 — 0.26241Pu 0.09 1.16 0.10 — 0.03 — 1.16242Pu 0.06 0.04 0.02 — 0.03 — 0.08237Np 1.22 0.48 0.21 — 0.47 — 1.41241Am 3.56 1.06 0.50 — 0.68 — 3.81
242mAm 0.02 0.37 0.11 — 0.02 — 0.39243Am 2.36 0.55 0.28 — 0.95 — 2.62242Cm — — — — — — —243Cm — 0.18 0.03 — — — 0.18244Cm 0.58 0.85 0.19 — 0.27 — 1.08245Cm 0.05 1.67 0.32 — 0.03 — 1.70246Cm — — — — — — —56Fe 0.12 — — 0.17 1.24 — 1.2657Fe 0.02 — — 0.01 0.18 — 0.1852Cr 0.03 — — 0.06 0.13 — 0.1458Ni — — — — 0.01 — 0.01Zr 0.10 — — 0.09 0.41 — 0.4315N 0.01 — — 0.43 0.05 — 0.43Pb 0.05 — — 0.29 2.13 0.03 2.15Bi 0.15 — — 0.36 2.84 0.06 2.86
Totala 4.50 2.99 0.82 0.66 4.00 0.06 6.80
*Uncertainties~%!.aTotal obtained as the square root of the sum of the squares of individual contributions in row or column.
TABLE XXII
Drcycle ~1 yr!—Uncertainties by Group—Direct Effect ofds*
Group ~MeV!a scap sfiss n sel sinel sn,2n Totalb
1 19.6 — 0.6 0.2 — 0.1 — 0.62 6.07 0.1 6.4 1.9 — 1.6 — 6.93 2.23 0.3 9.5 2.9 — 2.7 — 10.34 1.35 5.3 20.9 5.1 — 5.6 — 22.95 4.98E21c 9.7 12.0 2.4 — 1.9 — 15.76 1.83E21 11.8 7.7 1.7 — 2.0 — 14.37 6.74E22 4.9 5.5 1.4 — 0.2 — 7.58 2.48E22 4.5 4.7 1.0 — — — 6.69 9.12E23 3.9 4.0 0.9 — — — 5.7
10 2.04E23 2.5 1.9 0.5 — — — 3.211 4.54E24 0.4 0.3 0.1 — — — 0.512 2.26E25 — — — — — — —13 4.00E26 — — — — — — —14 5.40E27 — — — — — — —15 1.00E27 — — — — — — —
Totalb 18.1 29.0 7.2 — 7.0 — 35.6
*Uncertainties~%!.aHigh-energy group boundary.bTotal obtained as the square root of the sum of the squares of individual contributions in row or column.cRead as 4.983 1021.
NUCLEAR DATA UNCERTAINTIES IN ACCELERATOR-DRIVEN ASSEMBLIES 33
NUCLEAR SCIENCE AND ENGINEERING VOL. 146 JAN. 2004
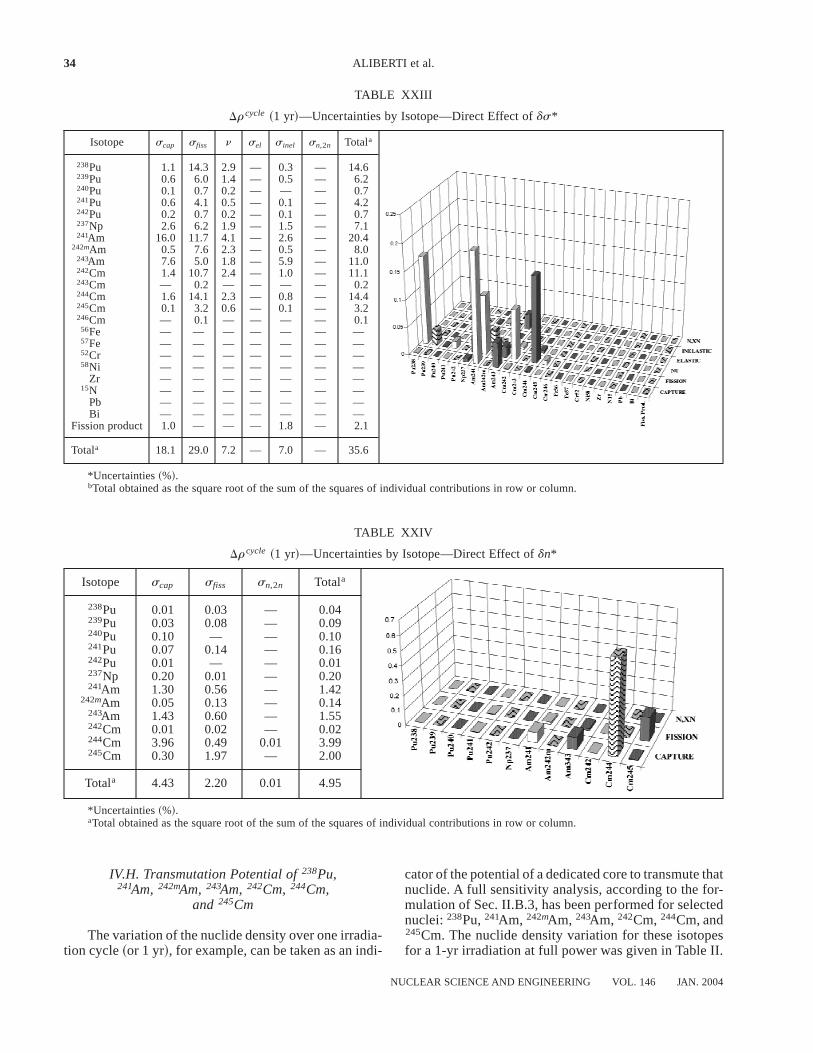
IV.H. Transmutation Potential of238Pu,241Am, 242mAm, 243Am, 242Cm, 244Cm,
and 245Cm
The variation of the nuclide density over one irradia-tion cycle~or 1 yr!, for example, can be taken as an indi-
cator of the potential of a dedicated core to transmute thatnuclide. A full sensitivity analysis, according to the for-mulation of Sec. II.B.3, has been performed for selectednuclei:238Pu,241Am, 242mAm, 243Am, 242Cm,244Cm, and245Cm. The nuclide density variation for these isotopesfor a 1-yr irradiation at full power was given in Table II.
TABLE XXIII
Drcycle ~1 yr!—Uncertainties by Isotope—Direct Effect ofds*
Isotope scap sfiss n sel sinel sn,2n Totala
238Pu 1.1 14.3 2.9 — 0.3 — 14.6239Pu 0.6 6.0 1.4 — 0.5 — 6.2240Pu 0.1 0.7 0.2 — — — 0.7241Pu 0.6 4.1 0.5 — 0.1 — 4.2242Pu 0.2 0.7 0.2 — 0.1 — 0.7237Np 2.6 6.2 1.9 — 1.5 — 7.1241Am 16.0 11.7 4.1 — 2.6 — 20.4
242mAm 0.5 7.6 2.3 — 0.5 — 8.0243Am 7.6 5.0 1.8 — 5.9 — 11.0242Cm 1.4 10.7 2.4 — 1.0 — 11.1243Cm — 0.2 — — — — 0.2244Cm 1.6 14.1 2.3 — 0.8 — 14.4245Cm 0.1 3.2 0.6 — 0.1 — 3.2246Cm — 0.1 — — — — 0.156Fe — — — — — — —57Fe — — — — — — —52Cr — — — — — — —58Ni — — — — — — —
Zr — — — — — — —15N — — — — — — —
Pb — — — — — — —Bi — — — — — — —
Fission product 1.0 — — — 1.8 — 2.1
Totala 18.1 29.0 7.2 — 7.0 — 35.6
*Uncertainties~%!.bTotal obtained as the square root of the sum of the squares of individual contributions in row or column.
TABLE XXIV
Drcycle ~1 yr!—Uncertainties by Isotope—Direct Effect ofdn*
Isotope scap sfiss sn,2n Totala
238Pu 0.01 0.03 — 0.04239Pu 0.03 0.08 — 0.09240Pu 0.10 — — 0.10241Pu 0.07 0.14 — 0.16242Pu 0.01 — — 0.01237Np 0.20 0.01 — 0.20241Am 1.30 0.56 — 1.42
242mAm 0.05 0.13 — 0.14243Am 1.43 0.60 — 1.55242Cm 0.01 0.02 — 0.02244Cm 3.96 0.49 0.01 3.99245Cm 0.30 1.97 — 2.00
Totala 4.43 2.20 0.01 4.95
*Uncertainties~%!.aTotal obtained as the square root of the sum of the squares of individual contributions in row or column.
34 ALIBERTI et al.
NUCLEAR SCIENCE AND ENGINEERING VOL. 146 JAN. 2004
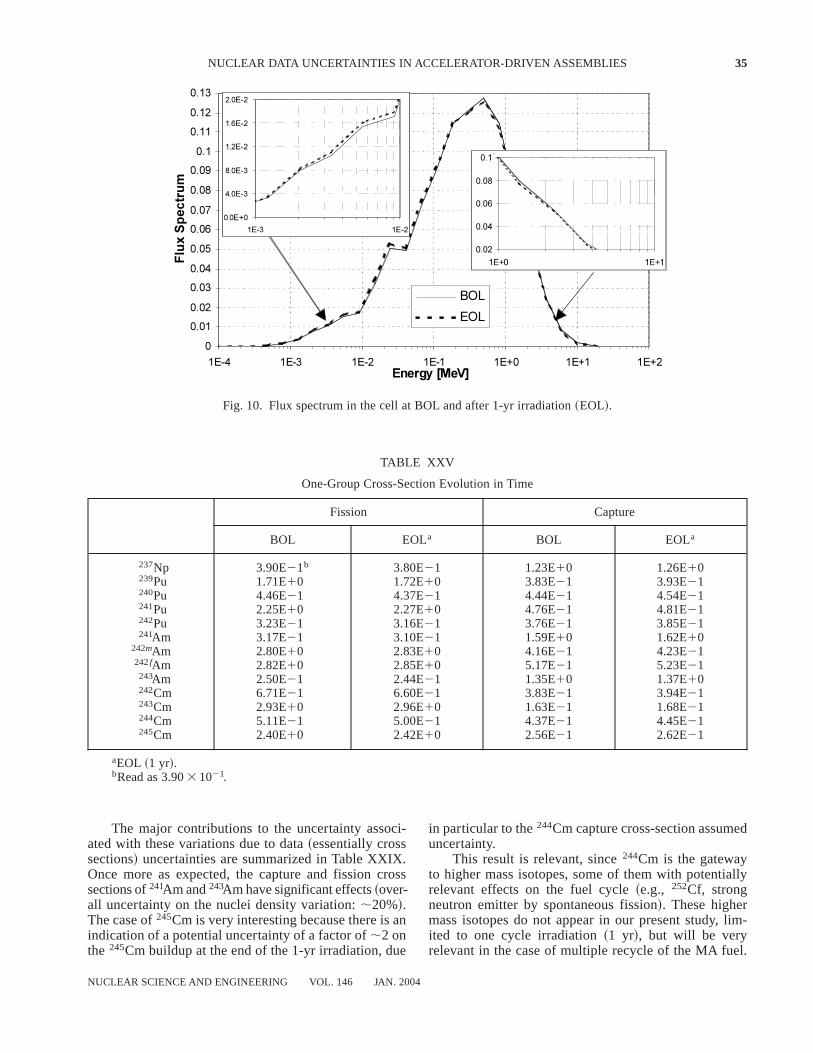
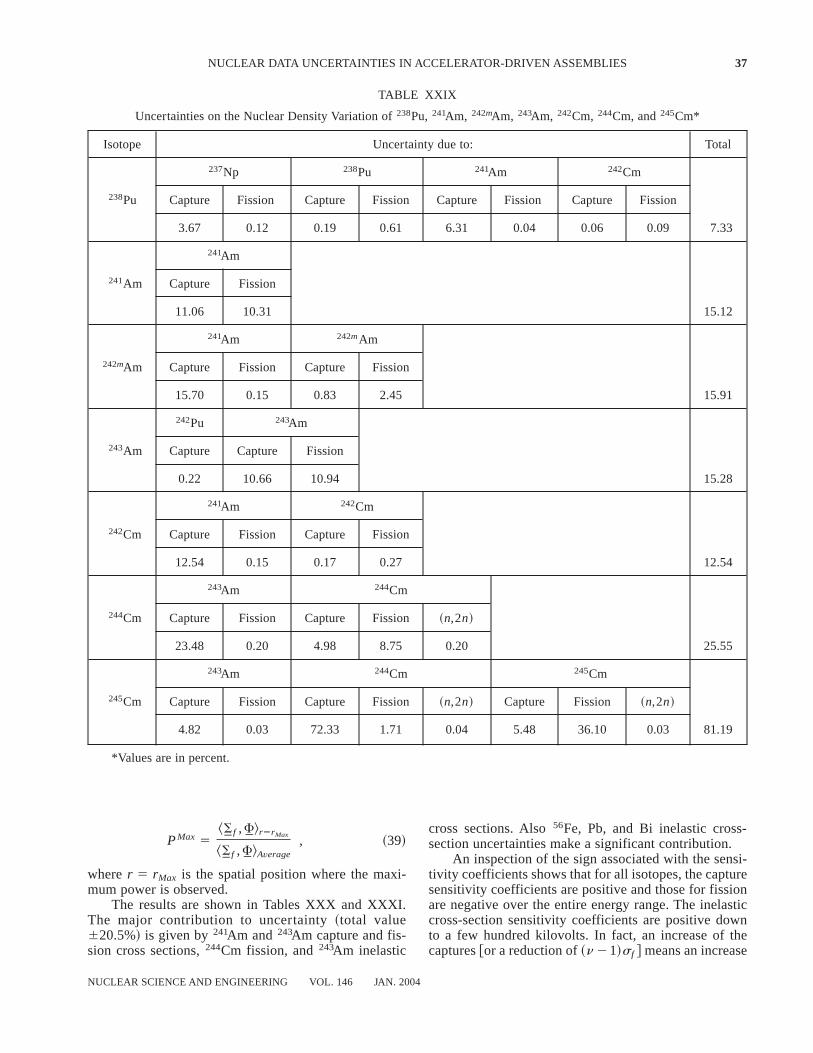
The major contributions to the uncertainty associ-ated with these variations due to data~essentially crosssections! uncertainties are summarized in Table XXIX.Once more as expected, the capture and fission crosssections of241Am and243Am have significant effects~over-all uncertainty on the nuclei density variation:;20%!.The case of245Cm is very interesting because there is anindication of a potential uncertainty of a factor of;2 onthe 245Cm buildup at the end of the 1-yr irradiation, due
in particular to the244Cm capture cross-section assumeduncertainty.
This result is relevant, since244Cm is the gatewayto higher mass isotopes, some of them with potentiallyrelevant effects on the fuel cycle~e.g., 252Cf, strongneutron emitter by spontaneous fission!. These highermass isotopes do not appear in our present study, lim-ited to one cycle irradiation~1 yr!, but will be veryrelevant in the case of multiple recycle of the MA fuel.
Fig. 10. Flux spectrum in the cell at BOL and after 1-yr irradiation~EOL!.
TABLE XXV
One-Group Cross-Section Evolution in Time
Fission Capture
BOL EOLa BOL EOLa
237Np 3.90E21b 3.80E21 1.23E10 1.26E10239Pu 1.71E10 1.72E10 3.83E21 3.93E21240Pu 4.46E21 4.37E21 4.44E21 4.54E21241Pu 2.25E10 2.27E10 4.76E21 4.81E21242Pu 3.23E21 3.16E21 3.76E21 3.85E21241Am 3.17E21 3.10E21 1.59E10 1.62E10
242mAm 2.80E10 2.83E10 4.16E21 4.23E21242fAm 2.82E10 2.85E10 5.17E21 5.23E21243Am 2.50E21 2.44E21 1.35E10 1.37E10242Cm 6.71E21 6.60E21 3.83E21 3.94E21243Cm 2.93E10 2.96E10 1.63E21 1.68E21244Cm 5.11E21 5.00E21 4.37E21 4.45E21245Cm 2.40E10 2.42E10 2.56E21 2.62E21
aEOL ~1 yr!.bRead as 3.903 1021.
NUCLEAR DATA UNCERTAINTIES IN ACCELERATOR-DRIVEN ASSEMBLIES 35
NUCLEAR SCIENCE AND ENGINEERING VOL. 146 JAN. 2004
The uncertainties related to their buildup have to becarefully assessed in performing full-fuel-cycle and trans-mutation scenario studies.
IV.I. The Peak Power Valueand Its Uncertainty
The system considered for the present analysis is sub-critical by;5%DK0K, and as expected, the radial power
shape in the core shows a marked gradient, which givesrise to a maximum-to-average power ratio of;2.9 ~seeTable II!. This parameter is important because the cool-ing system of the system, for example, should account forthe power gradient and its possible evolution in time.
We have performed the uncertainty analysis usingthe perturbation formulation of Sec. II.B.2, for thefollowing reaction rate ratio:
TABLE XXVI
Decay Heat and Its Evolution in Time*
Dischargea 500 s 1000 s 3000 s 1 h 12 h 1 day 10 days
Light elements 6.98E14b 5.72E14 5.46E14 5.24E14 5.19E14 4.21E14 4.14E14 3.89E14Heavy elements 5.64E16 5.51E16 5.40E16 5.14E16 5.09E16 4.85E16 4.77E16 4.38E16Fission products 1.93E17 6.36E16 5.39E16 3.84E16 3.61E16 1.70E16 1.39E16 6.93E15
Total 2.51E17 1.19E17 1.08E17 9.03E16 8.76E16 6.59E16 6.20E16 5.11E16
*Decay heat~W!.aEOL ~2 yr!.bRead as 6.983 104.
TABLE XXVII
Decay Heat—Heavy Element Breakdown by Isotope*
Dischargea 500 s 1000 s 3000 s 1 h 12 h 1 day 10 days
U 7.63E10b 7.62E10 7.61E10 7.59E10 7.58E10 7.29E10 7.01E10 3.71E10Np 3.05E15 3.04E15 3.04E15 3.01E15 3.01E15 2.58E15 2.19E15 1.15E14Pu 9.59E14 9.58E14 9.56E14 9.50E14 9.49E14 8.93E14 8.81E14 8.85E14Am 9.08E15 7.73E15 6.65E15 4.08E15 3.66E15 1.73E15 1.34E15 7.83E14Cm 4.33E16 4.33E16 4.33E16 4.33E16 4.33E16 4.33E16 4.33E16 4.20E16Bk 1.37E23 1.35E23 1.33E23 1.26E23 1.26E23 7.09E24 6.58E24 6.41E24Cf 2.16E24 2.16E24 2.16E24 2.16E24 2.16E24 2.17E24 2.17E24 2.22E24
Total 5.64E16 5.51E16 5.40E16 5.14E16 5.09E16 4.85E16 4.77E16 4.38E16
*Decay heat~W!.aEOL ~2 yr!.bRead as 7.633 100.
TABLE XXVIII
Decay Heat—Relative Contribution of Heavy Isotopes and Fission Products at Different Cooling Times*
Dischargea 500 s 1000 s 3000 s 1 h 12 h 1 day 10 days
ADSHeavy elements 23 46 50 57 58 74 77 86Fission products 77 53 50 43 41 26 22 14
SuperphenixHeavy elements 8.9 NA 20.2 22.3 22.5 32.3 34.5 22.8Fission products 89.7 NA 74.6 72.6 72.3 63.7 62.1 73.2
*Relative contribution~%!.aEOL ~2 yr!.
36 ALIBERTI et al.
NUCLEAR SCIENCE AND ENGINEERING VOL. 146 JAN. 2004
PMax 5^ uSf , uF&r5rMax
^ uSf , uF&Average
, ~39!
wherer 5 rMax is the spatial position where the maxi-mum power is observed.
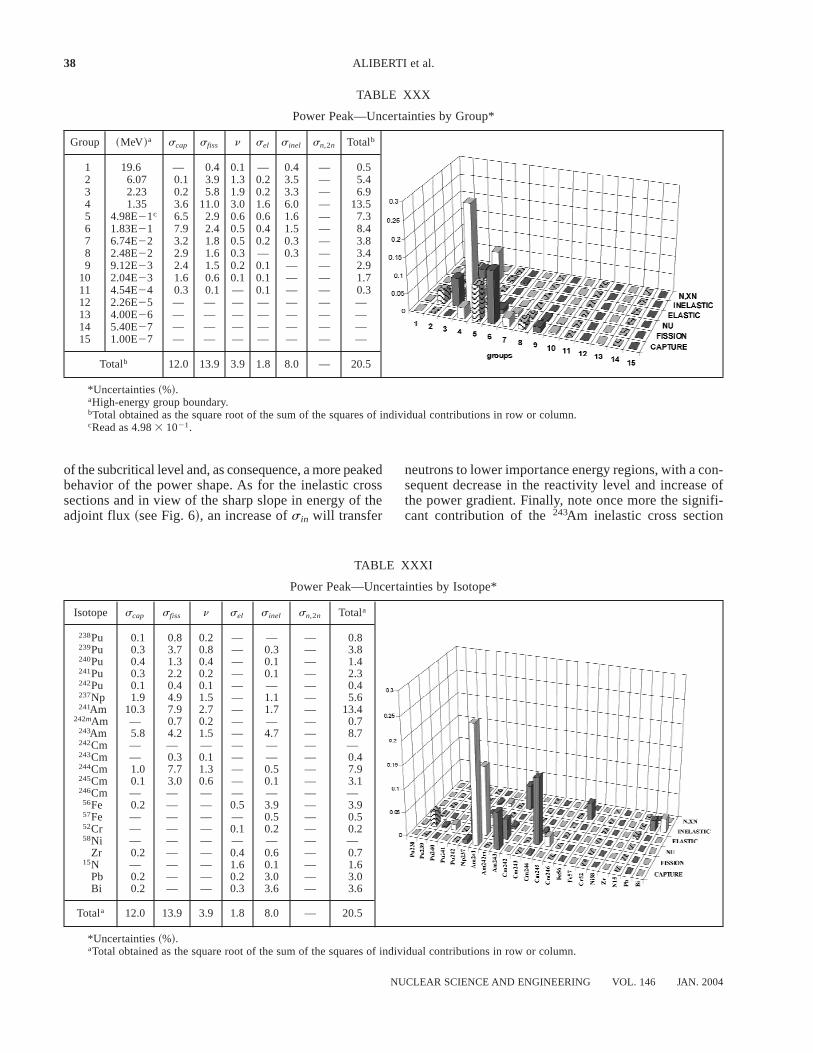
The results are shown in Tables XXX and XXXI.The major contribution to uncertainty~total value620.5%! is given by241Am and 243Am capture and fis-sion cross sections,244Cm fission, and243Am inelastic
cross sections. Also56Fe, Pb, and Bi inelastic cross-section uncertainties make a significant contribution.
An inspection of the sign associated with the sensi-tivity coefficients shows that for all isotopes, the capturesensitivity coefficients are positive and those for fissionare negative over the entire energy range. The inelasticcross-section sensitivity coefficients are positive downto a few hundred kilovolts. In fact, an increase of thecaptures@or a reduction of~n 21!sf # means an increase
TABLE XXIX
Uncertainties on the Nuclear Density Variation of238Pu, 241Am, 242mAm, 243Am, 242Cm, 244Cm, and245Cm*
Isotope Uncertainty due to: Total
237Np 238Pu 241Am 242Cm
238Pu Capture Fission Capture Fission Capture Fission Capture Fission
3.67 0.12 0.19 0.61 6.31 0.04 0.06 0.09 7.33
241Am
241Am Capture Fission
11.06 10.31 15.12
241Am 242mAm
242mAm Capture Fission Capture Fission
15.70 0.15 0.83 2.45 15.91
242Pu 243Am
243Am Capture Capture Fission
0.22 10.66 10.94 15.28
241Am 242Cm
242Cm Capture Fission Capture Fission
12.54 0.15 0.17 0.27 12.54
243Am 244Cm
244Cm Capture Fission Capture Fission ~n,2n!
23.48 0.20 4.98 8.75 0.20 25.55
243Am 244Cm 245Cm
245Cm Capture Fission Capture Fission ~n,2n! Capture Fission ~n,2n!
4.82 0.03 72.33 1.71 0.04 5.48 36.10 0.03 81.19
*Values are in percent.
NUCLEAR DATA UNCERTAINTIES IN ACCELERATOR-DRIVEN ASSEMBLIES 37
NUCLEAR SCIENCE AND ENGINEERING VOL. 146 JAN. 2004
of the subcritical level and, as consequence, a more peakedbehavior of the power shape. As for the inelastic crosssections and in view of the sharp slope in energy of theadjoint flux ~see Fig. 6!, an increase ofsin will transfer
neutrons to lower importance energy regions, with a con-sequent decrease in the reactivity level and increase ofthe power gradient. Finally, note once more the signifi-cant contribution of the243Am inelastic cross section
TABLE XXX
Power Peak—Uncertainties by Group*
Group ~MeV!a scap sfiss n sel sinel sn,2n Totalb
1 19.6 — 0.4 0.1 — 0.4 — 0.52 6.07 0.1 3.9 1.3 0.2 3.5 — 5.43 2.23 0.2 5.8 1.9 0.2 3.3 — 6.94 1.35 3.6 11.0 3.0 1.6 6.0 — 13.55 4.98E21c 6.5 2.9 0.6 0.6 1.6 — 7.36 1.83E21 7.9 2.4 0.5 0.4 1.5 — 8.47 6.74E22 3.2 1.8 0.5 0.2 0.3 — 3.88 2.48E22 2.9 1.6 0.3 — 0.3 — 3.49 9.12E23 2.4 1.5 0.2 0.1 — — 2.9
10 2.04E23 1.6 0.6 0.1 0.1 — — 1.711 4.54E24 0.3 0.1 — 0.1 — — 0.312 2.26E25 — — — — — — —13 4.00E26 — — — — — — —14 5.40E27 — — — — — — —15 1.00E27 — — — — — — —
Totalb 12.0 13.9 3.9 1.8 8.0 — 20.5
*Uncertainties~%!.aHigh-energy group boundary.bTotal obtained as the square root of the sum of the squares of individual contributions in row or column.cRead as 4.983 1021.
TABLE XXXI
Power Peak—Uncertainties by Isotope*
Isotope scap sfiss n sel sinel sn,2n Totala
238Pu 0.1 0.8 0.2 — — — 0.8239Pu 0.3 3.7 0.8 — 0.3 — 3.8240Pu 0.4 1.3 0.4 — 0.1 — 1.4241Pu 0.3 2.2 0.2 — 0.1 — 2.3242Pu 0.1 0.4 0.1 — — — 0.4237Np 1.9 4.9 1.5 — 1.1 — 5.6241Am 10.3 7.9 2.7 — 1.7 — 13.4
242mAm — 0.7 0.2 — — — 0.7243Am 5.8 4.2 1.5 — 4.7 — 8.7242Cm — — — — — — —243Cm — 0.3 0.1 — — — 0.4244Cm 1.0 7.7 1.3 — 0.5 — 7.9245Cm 0.1 3.0 0.6 — 0.1 — 3.1246Cm — — — — — — —56Fe 0.2 — — 0.5 3.9 — 3.957Fe — — — — 0.5 — 0.552Cr — — — 0.1 0.2 — 0.258Ni — — — — — — —
Zr 0.2 — — 0.4 0.6 — 0.715N — — — 1.6 0.1 — 1.6
Pb 0.2 — — 0.2 3.0 — 3.0Bi 0.2 — — 0.3 3.6 — 3.6
Totala 12.0 13.9 3.9 1.8 8.0 — 20.5
*Uncertainties~%!.aTotal obtained as the square root of the sum of the squares of individual contributions in row or column.
38 ALIBERTI et al.
NUCLEAR SCIENCE AND ENGINEERING VOL. 146 JAN. 2004
already indicated previously in the case of other integralparameters~keff, etc.!.
V. PARAMETERS WITH HIGH-ENERGY~E . 20 MeV! DATA DEPENDENCE
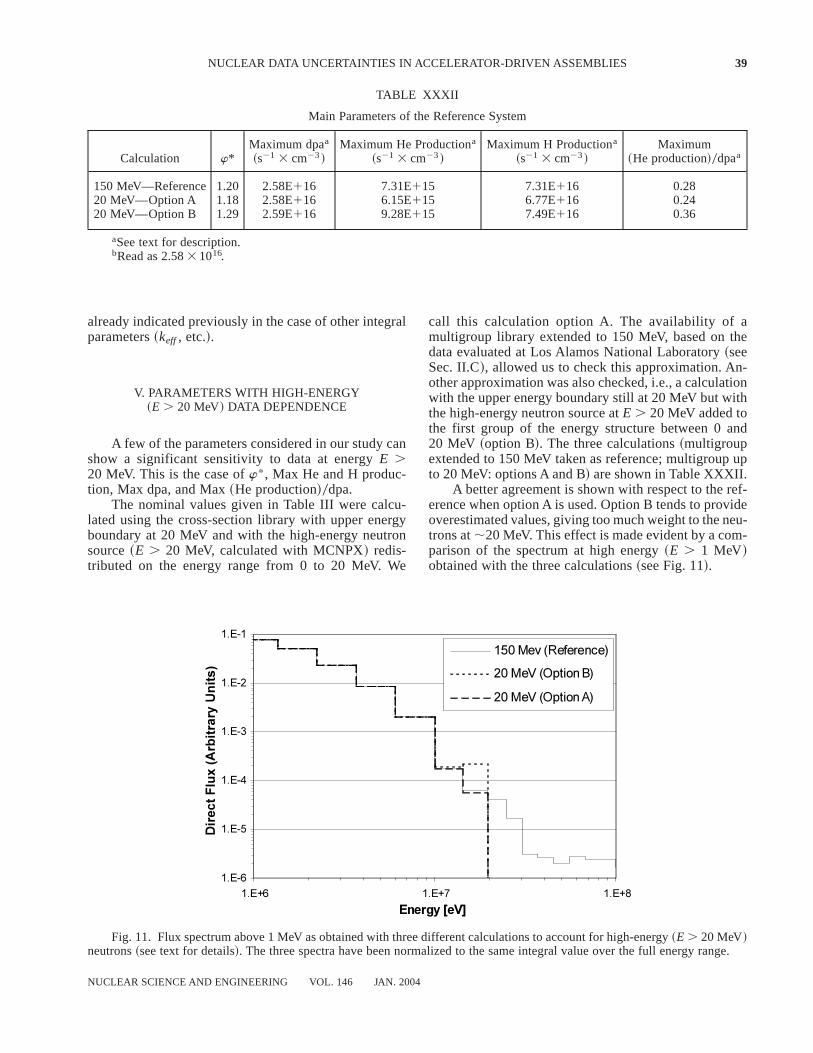
A few of the parameters considered in our study canshow a significant sensitivity to data at energyE .20 MeV. This is the case ofw* , Max He and H produc-tion, Max dpa, and Max~He production!0dpa.
The nominal values given in Table III were calcu-lated using the cross-section library with upper energyboundary at 20 MeV and with the high-energy neutronsource~E . 20 MeV, calculated with MCNPX! redis-tributed on the energy range from 0 to 20 MeV. We
call this calculation option A. The availability of amultigroup library extended to 150 MeV, based on thedata evaluated at Los Alamos National Laboratory~seeSec. II.C!, allowed us to check this approximation. An-other approximation was also checked, i.e., a calculationwith the upper energy boundary still at 20 MeV but withthe high-energy neutron source atE . 20 MeV added tothe first group of the energy structure between 0 and20 MeV ~option B!. The three calculations~multigroupextended to 150 MeV taken as reference; multigroup upto 20 MeV: options A and B! are shown in Table XXXII.
A better agreement is shown with respect to the ref-erence when option A is used. Option B tends to provideoverestimated values, giving too much weight to the neu-trons at;20 MeV. This effect is made evident by a com-parison of the spectrum at high energy~E . 1 MeV!obtained with the three calculations~see Fig. 11!.
TABLE XXXII
Main Parameters of the Reference System
Calculation w*Maximum dpaa
~s21 3 cm23!Maximum He Productiona
~s21 3 cm23!Maximum H Productiona
~s21 3 cm23!Maximum
~He production!0dpaa
150 MeV—Reference 1.20 2.58E116 7.31E115 7.31E116 0.2820 MeV—Option A 1.18 2.58E116 6.15E115 6.77E116 0.2420 MeV—Option B 1.29 2.59E116 9.28E115 7.49E116 0.36
aSee text for description.bRead as 2.583 1016.
Fig. 11. Flux spectrum above 1 MeV as obtained with three different calculations to account for high-energy~E . 20 MeV!neutrons~see text for details!. The three spectra have been normalized to the same integral value over the full energy range.
NUCLEAR DATA UNCERTAINTIES IN ACCELERATOR-DRIVEN ASSEMBLIES 39
NUCLEAR SCIENCE AND ENGINEERING VOL. 146 JAN. 2004
The extension of the multigroup cross-section li-brary up to 150 MeV has a significant impact on someparameters like the Max He production and, conse-quently, on the Max~He production!0dpa in the structures.
On the other hand, the multigroup library extensionup to 150 MeV has been shown to have a negligibleimpact on parameters likekeff, reactivity coefficients,reactivity loss during irradiation, power peak, etc.
Finally, for the sensitivity0uncertainty analysis forw* , Max He and H production, Max dpa, and Max~Heproduction!0dpa, the reference library~i.e., multigroupextended to 150 MeV! has been adopted.
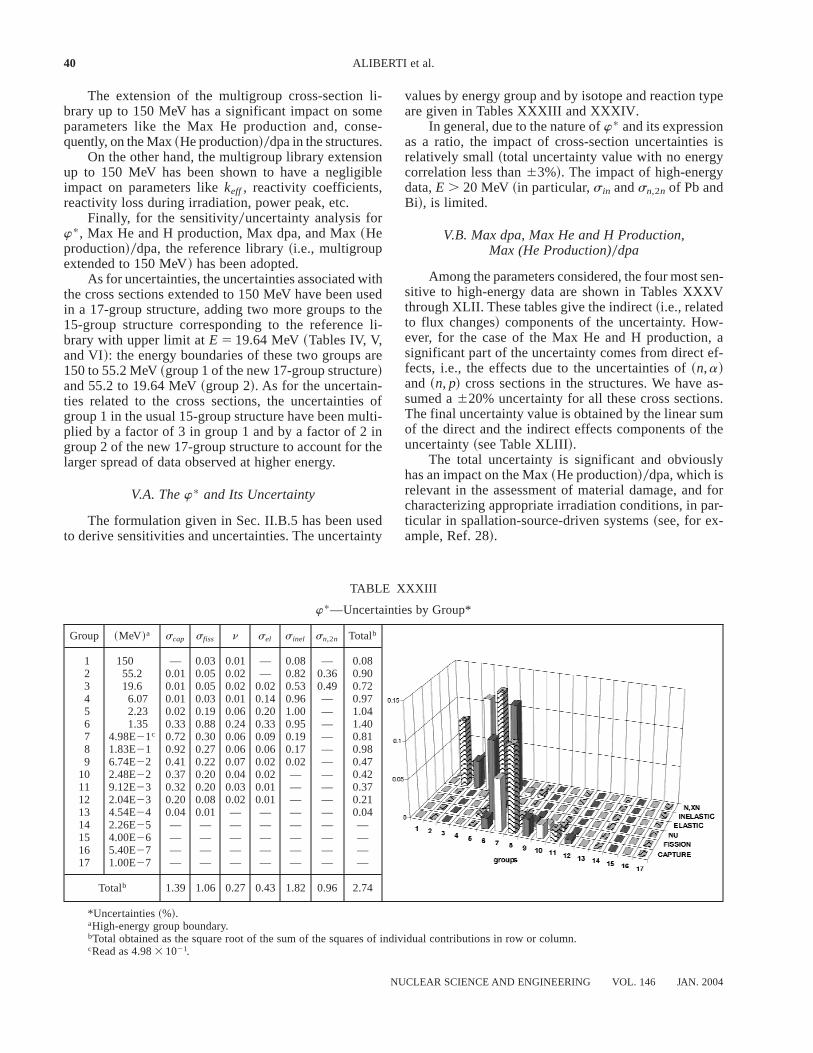
As for uncertainties, the uncertainties associated withthe cross sections extended to 150 MeV have been usedin a 17-group structure, adding two more groups to the15-group structure corresponding to the reference li-brary with upper limit atE 5 19.64 MeV~Tables IV, V,and VI!: the energy boundaries of these two groups are150 to 55.2 MeV~group 1 of the new 17-group structure!and 55.2 to 19.64 MeV~group 2!. As for the uncertain-ties related to the cross sections, the uncertainties ofgroup 1 in the usual 15-group structure have been multi-plied by a factor of 3 in group 1 and by a factor of 2 ingroup 2 of the new 17-group structure to account for thelarger spread of data observed at higher energy.
V.A. Thew* and Its Uncertainty
The formulation given in Sec. II.B.5 has been usedto derive sensitivities and uncertainties. The uncertainty
values by energy group and by isotope and reaction typeare given in Tables XXXIII and XXXIV.
In general, due to the nature ofw* and its expressionas a ratio, the impact of cross-section uncertainties isrelatively small~total uncertainty value with no energycorrelation less than63%!. The impact of high-energydata,E . 20 MeV ~in particular,sin andsn,2n of Pb andBi!, is limited.
V.B. Max dpa, Max He and H Production,Max (He Production)0dpa
Among the parameters considered, the four most sen-sitive to high-energy data are shown in Tables XXXVthrough XLII. These tables give the indirect~i.e., relatedto flux changes! components of the uncertainty. How-ever, for the case of the Max He and H production, asignificant part of the uncertainty comes from direct ef-fects, i.e., the effects due to the uncertainties of~n,a!and ~n, p! cross sections in the structures. We have as-sumed a620% uncertainty for all these cross sections.The final uncertainty value is obtained by the linear sumof the direct and the indirect effects components of theuncertainty~see Table XLIII!.
The total uncertainty is significant and obviouslyhas an impact on the Max~He production!0dpa, which isrelevant in the assessment of material damage, and forcharacterizing appropriate irradiation conditions, in par-ticular in spallation-source-driven systems~see, for ex-ample, Ref. 28!.
TABLE XXXIII
w*—Uncertainties by Group*
Group ~MeV!a scap sfiss n sel sinel sn,2n Totalb
1 150 — 0.03 0.01 — 0.08 — 0.082 55.2 0.01 0.05 0.02 — 0.82 0.36 0.903 19.6 0.01 0.05 0.02 0.02 0.53 0.49 0.724 6.07 0.01 0.03 0.01 0.14 0.96 — 0.975 2.23 0.02 0.19 0.06 0.20 1.00 — 1.046 1.35 0.33 0.88 0.24 0.33 0.95 — 1.407 4.98E21c 0.72 0.30 0.06 0.09 0.19 — 0.818 1.83E21 0.92 0.27 0.06 0.06 0.17 — 0.989 6.74E22 0.41 0.22 0.07 0.02 0.02 — 0.47
10 2.48E22 0.37 0.20 0.04 0.02 — — 0.4211 9.12E23 0.32 0.20 0.03 0.01 — — 0.3712 2.04E23 0.20 0.08 0.02 0.01 — — 0.2113 4.54E24 0.04 0.01 — — — — 0.0414 2.26E25 — — — — — — —15 4.00E26 — — — — — — —16 5.40E27 — — — — — — —17 1.00E27 — — — — — — —
Totalb 1.39 1.06 0.27 0.43 1.82 0.96 2.74
*Uncertainties~%!.aHigh-energy group boundary.bTotal obtained as the square root of the sum of the squares of individual contributions in row or column.cRead as 4.983 1021.
40 ALIBERTI et al.
NUCLEAR SCIENCE AND ENGINEERING VOL. 146 JAN. 2004
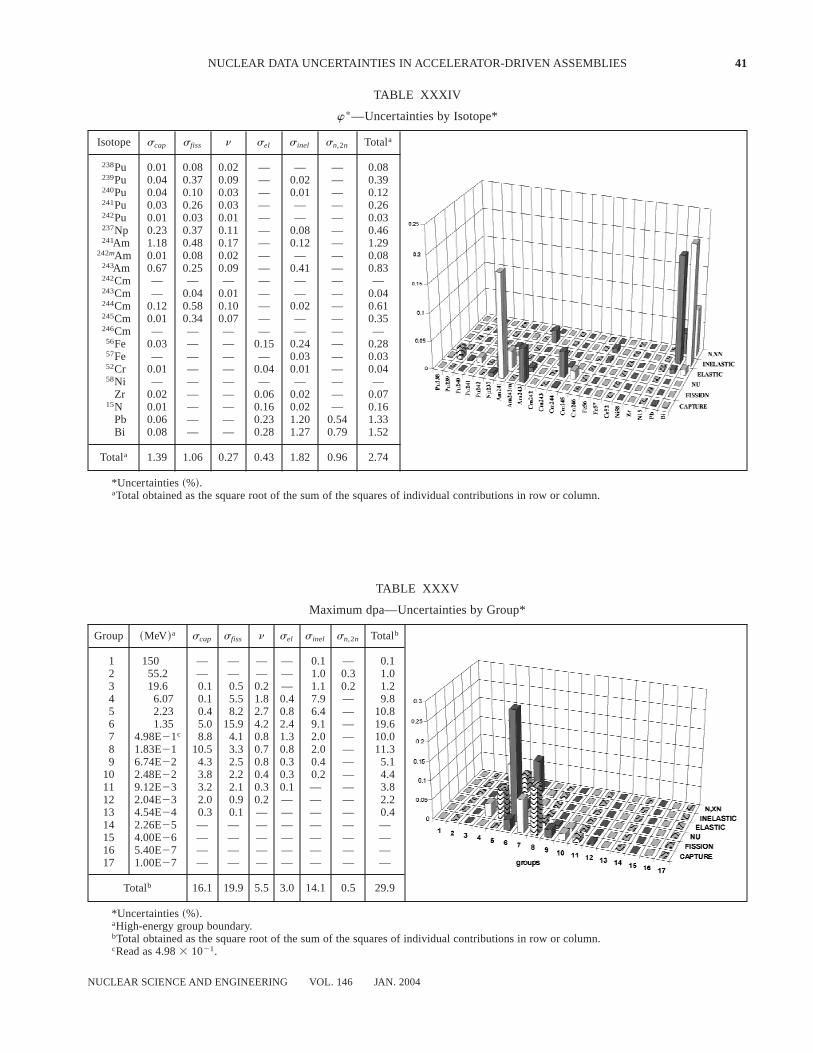
TABLE XXXIV
w*—Uncertainties by Isotope*
Isotope scap sfiss n sel sinel sn,2n Totala
238Pu 0.01 0.08 0.02 — — — 0.08239Pu 0.04 0.37 0.09 — 0.02 — 0.39240Pu 0.04 0.10 0.03 — 0.01 — 0.12241Pu 0.03 0.26 0.03 — — — 0.26242Pu 0.01 0.03 0.01 — — — 0.03237Np 0.23 0.37 0.11 — 0.08 — 0.46241Am 1.18 0.48 0.17 — 0.12 — 1.29
242mAm 0.01 0.08 0.02 — — — 0.08243Am 0.67 0.25 0.09 — 0.41 — 0.83242Cm — — — — — — —243Cm — 0.04 0.01 — — — 0.04244Cm 0.12 0.58 0.10 — 0.02 — 0.61245Cm 0.01 0.34 0.07 — — — 0.35246Cm — — — — — — —56Fe 0.03 — — 0.15 0.24 — 0.2857Fe — — — — 0.03 — 0.0352Cr 0.01 — — 0.04 0.01 — 0.0458Ni — — — — — — —
Zr 0.02 — — 0.06 0.02 — 0.0715N 0.01 — — 0.16 0.02 — 0.16
Pb 0.06 — — 0.23 1.20 0.54 1.33Bi 0.08 — — 0.28 1.27 0.79 1.52
Totala 1.39 1.06 0.27 0.43 1.82 0.96 2.74
*Uncertainties~%!.aTotal obtained as the square root of the sum of the squares of individual contributions in row or column.
TABLE XXXV
Maximum dpa—Uncertainties by Group*
Group ~MeV!a scap sfiss n sel sinel sn,2n Totalb
1 150 — — — — 0.1 — 0.12 55.2 — — — — 1.0 0.3 1.03 19.6 0.1 0.5 0.2 — 1.1 0.2 1.24 6.07 0.1 5.5 1.8 0.4 7.9 — 9.85 2.23 0.4 8.2 2.7 0.8 6.4 — 10.86 1.35 5.0 15.9 4.2 2.4 9.1 — 19.67 4.98E21c 8.8 4.1 0.8 1.3 2.0 — 10.08 1.83E21 10.5 3.3 0.7 0.8 2.0 — 11.39 6.74E22 4.3 2.5 0.8 0.3 0.4 — 5.1
10 2.48E22 3.8 2.2 0.4 0.3 0.2 — 4.411 9.12E23 3.2 2.1 0.3 0.1 — — 3.812 2.04E23 2.0 0.9 0.2 — — — 2.213 4.54E24 0.3 0.1 — — — — 0.414 2.26E25 — — — — — — —15 4.00E26 — — — — — — —16 5.40E27 — — — — — — —17 1.00E27 — — — — — — —
Totalb 16.1 19.9 5.5 3.0 14.1 0.5 29.9
*Uncertainties~%!.aHigh-energy group boundary.bTotal obtained as the square root of the sum of the squares of individual contributions in row or column.cRead as 4.983 1021.
NUCLEAR DATA UNCERTAINTIES IN ACCELERATOR-DRIVEN ASSEMBLIES 41
NUCLEAR SCIENCE AND ENGINEERING VOL. 146 JAN. 2004
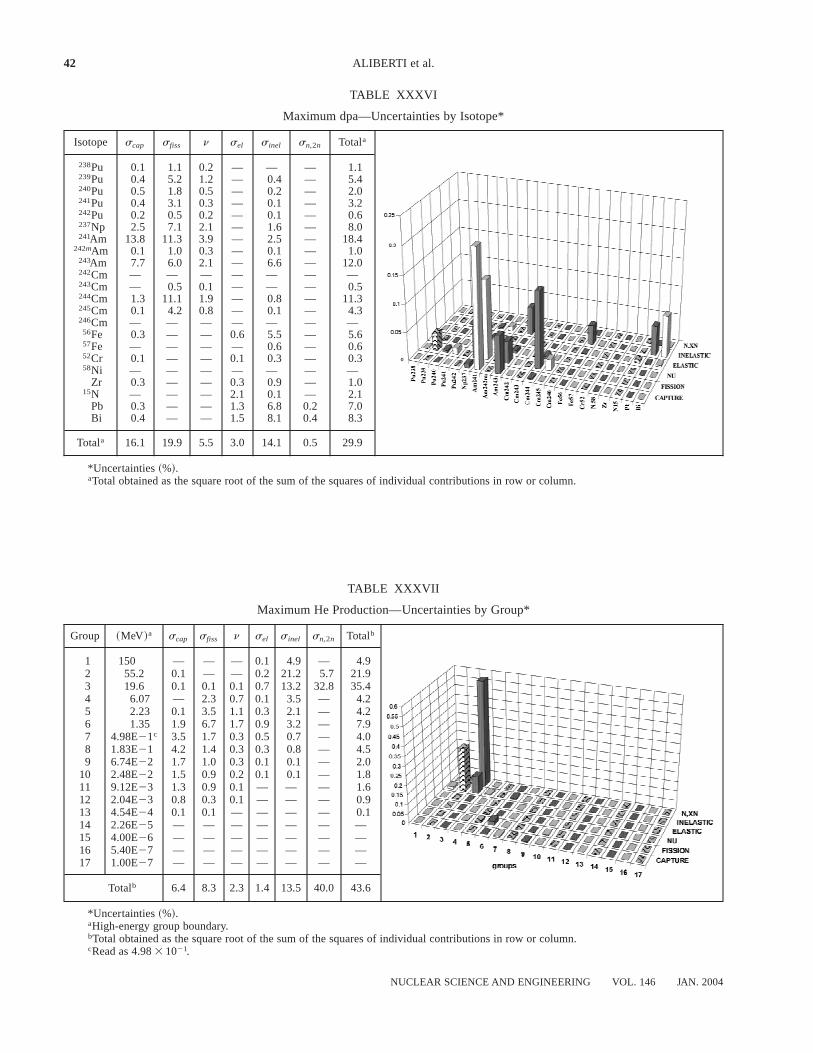
TABLE XXXVI
Maximum dpa—Uncertainties by Isotope*
Isotope scap sfiss n sel sinel sn,2n Totala
238Pu 0.1 1.1 0.2 — — — 1.1239Pu 0.4 5.2 1.2 — 0.4 — 5.4240Pu 0.5 1.8 0.5 — 0.2 — 2.0241Pu 0.4 3.1 0.3 — 0.1 — 3.2242Pu 0.2 0.5 0.2 — 0.1 — 0.6237Np 2.5 7.1 2.1 — 1.6 — 8.0241Am 13.8 11.3 3.9 — 2.5 — 18.4
242mAm 0.1 1.0 0.3 — 0.1 — 1.0243Am 7.7 6.0 2.1 — 6.6 — 12.0242Cm — — — — — — —243Cm — 0.5 0.1 — — — 0.5244Cm 1.3 11.1 1.9 — 0.8 — 11.3245Cm 0.1 4.2 0.8 — 0.1 — 4.3246Cm — — — — — — —56Fe 0.3 — — 0.6 5.5 — 5.657Fe — — — — 0.6 — 0.652Cr 0.1 — — 0.1 0.3 — 0.358Ni — — — — — — —
Zr 0.3 — — 0.3 0.9 — 1.015N — — — 2.1 0.1 — 2.1
Pb 0.3 — — 1.3 6.8 0.2 7.0Bi 0.4 — — 1.5 8.1 0.4 8.3
Totala 16.1 19.9 5.5 3.0 14.1 0.5 29.9
*Uncertainties~%!.aTotal obtained as the square root of the sum of the squares of individual contributions in row or column.
TABLE XXXVII
Maximum He Production—Uncertainties by Group*
Group ~MeV!a scap sfiss n sel sinel sn,2n Totalb
1 150 — — — 0.1 4.9 — 4.92 55.2 0.1 — — 0.2 21.2 5.7 21.93 19.6 0.1 0.1 0.1 0.7 13.2 32.8 35.44 6.07 — 2.3 0.7 0.1 3.5 — 4.25 2.23 0.1 3.5 1.1 0.3 2.1 — 4.26 1.35 1.9 6.7 1.7 0.9 3.2 — 7.97 4.98E21c 3.5 1.7 0.3 0.5 0.7 — 4.08 1.83E21 4.2 1.4 0.3 0.3 0.8 — 4.59 6.74E22 1.7 1.0 0.3 0.1 0.1 — 2.0
10 2.48E22 1.5 0.9 0.2 0.1 0.1 — 1.811 9.12E23 1.3 0.9 0.1 — — — 1.612 2.04E23 0.8 0.3 0.1 — — — 0.913 4.54E24 0.1 0.1 — — — — 0.114 2.26E25 — — — — — — —15 4.00E26 — — — — — — —16 5.40E27 — — — — — — —17 1.00E27 — — — — — — —
Totalb 6.4 8.3 2.3 1.4 13.5 40.0 43.6
*Uncertainties~%!.aHigh-energy group boundary.bTotal obtained as the square root of the sum of the squares of individual contributions in row or column.cRead as 4.983 1021.
42 ALIBERTI et al.
NUCLEAR SCIENCE AND ENGINEERING VOL. 146 JAN. 2004
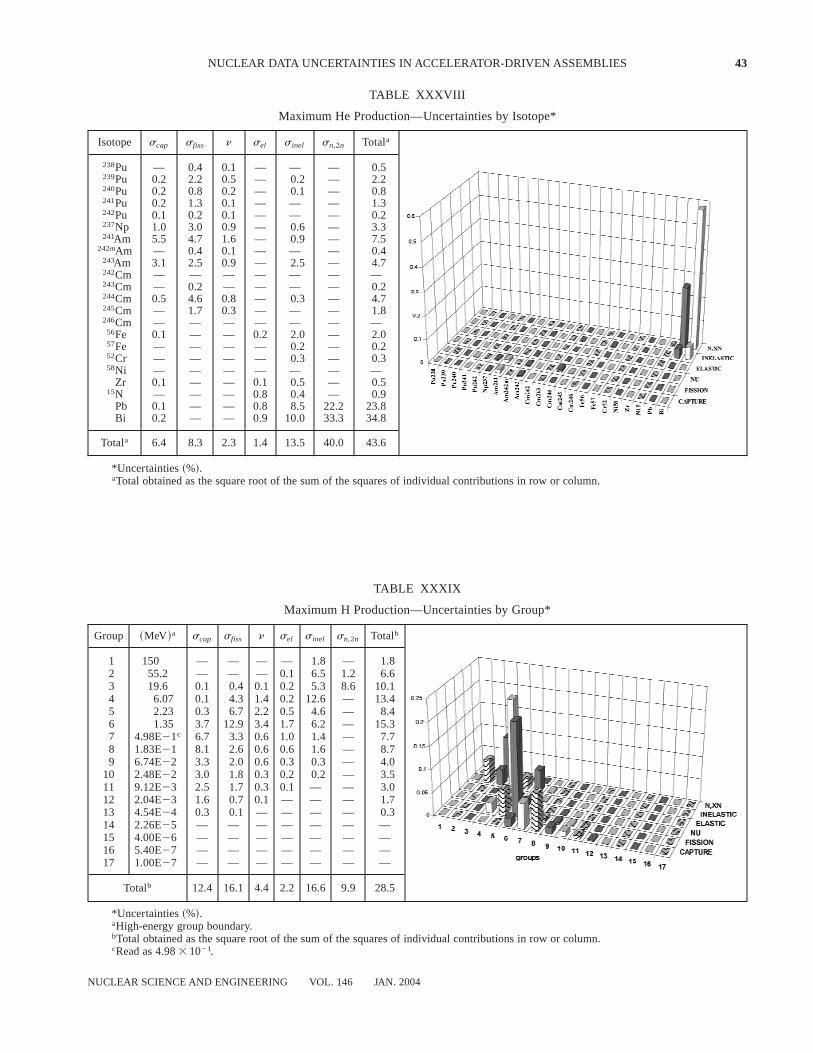
TABLE XXXVIII
Maximum He Production—Uncertainties by Isotope*
Isotope scap sfiss n sel sinel sn,2n Totala
238Pu — 0.4 0.1 — — — 0.5239Pu 0.2 2.2 0.5 — 0.2 — 2.2240Pu 0.2 0.8 0.2 — 0.1 — 0.8241Pu 0.2 1.3 0.1 — — — 1.3242Pu 0.1 0.2 0.1 — — — 0.2237Np 1.0 3.0 0.9 — 0.6 — 3.3241Am 5.5 4.7 1.6 — 0.9 — 7.5
242mAm — 0.4 0.1 — — — 0.4243Am 3.1 2.5 0.9 — 2.5 — 4.7242Cm — — — — — — —243Cm — 0.2 — — — — 0.2244Cm 0.5 4.6 0.8 — 0.3 — 4.7245Cm — 1.7 0.3 — — — 1.8246Cm — — — — — — —56Fe 0.1 — — 0.2 2.0 — 2.057Fe — — — — 0.2 — 0.252Cr — — — — 0.3 — 0.358Ni — — — — — — —
Zr 0.1 — — 0.1 0.5 — 0.515N — — — 0.8 0.4 — 0.9
Pb 0.1 — — 0.8 8.5 22.2 23.8Bi 0.2 — — 0.9 10.0 33.3 34.8
Totala 6.4 8.3 2.3 1.4 13.5 40.0 43.6
*Uncertainties~%!.aTotal obtained as the square root of the sum of the squares of individual contributions in row or column.
TABLE XXXIX
Maximum H Production—Uncertainties by Group*
Group ~MeV!a scap sfiss n sel sinel sn,2n Totalb
1 150 — — — — 1.8 — 1.82 55.2 — — — 0.1 6.5 1.2 6.63 19.6 0.1 0.4 0.1 0.2 5.3 8.6 10.14 6.07 0.1 4.3 1.4 0.2 12.6 — 13.45 2.23 0.3 6.7 2.2 0.5 4.6 — 8.46 1.35 3.7 12.9 3.4 1.7 6.2 — 15.37 4.98E21c 6.7 3.3 0.6 1.0 1.4 — 7.78 1.83E21 8.1 2.6 0.6 0.6 1.6 — 8.79 6.74E22 3.3 2.0 0.6 0.3 0.3 — 4.0
10 2.48E22 3.0 1.8 0.3 0.2 0.2 — 3.511 9.12E23 2.5 1.7 0.3 0.1 — — 3.012 2.04E23 1.6 0.7 0.1 — — — 1.713 4.54E24 0.3 0.1 — — — — 0.314 2.26E25 — — — — — — —15 4.00E26 — — — — — — —16 5.40E27 — — — — — — —17 1.00E27 — — — — — — —
Totalb 12.4 16.1 4.4 2.2 16.6 9.9 28.5
*Uncertainties~%!.aHigh-energy group boundary.bTotal obtained as the square root of the sum of the squares of individual contributions in row or column.cRead as 4.983 1021.
NUCLEAR DATA UNCERTAINTIES IN ACCELERATOR-DRIVEN ASSEMBLIES 43
NUCLEAR SCIENCE AND ENGINEERING VOL. 146 JAN. 2004
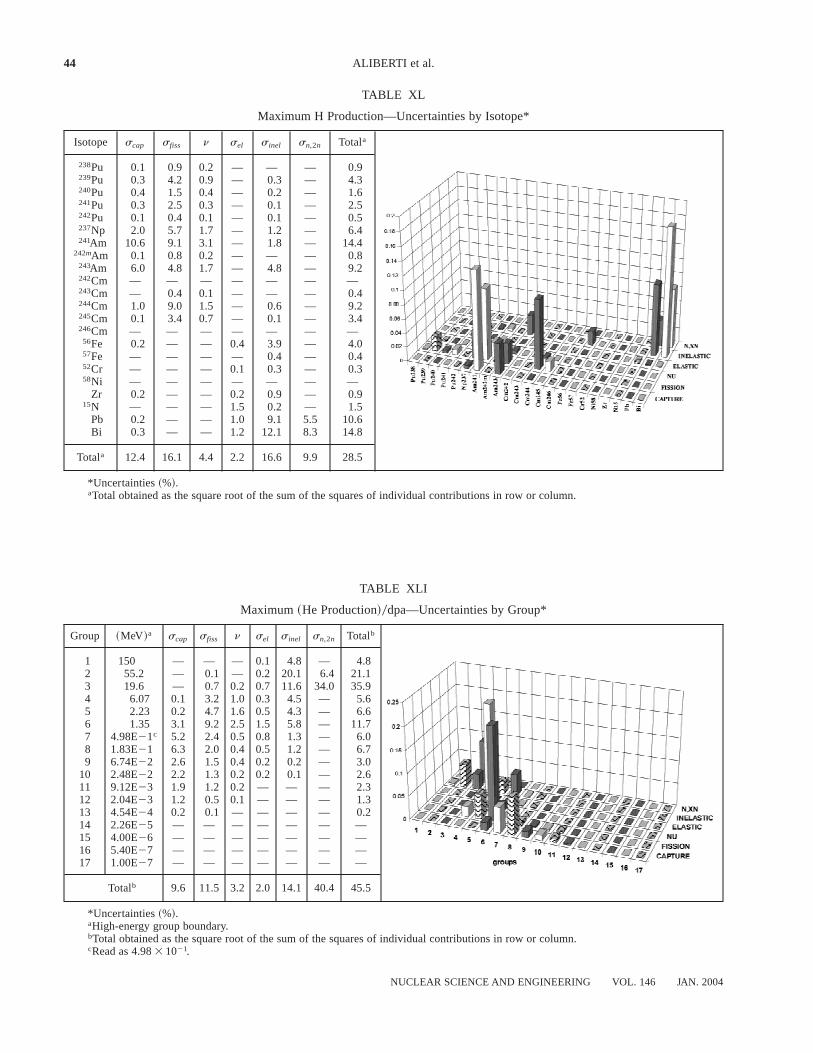
TABLE XL
Maximum H Production—Uncertainties by Isotope*
Isotope scap sfiss n sel sinel sn,2n Totala
238Pu 0.1 0.9 0.2 — — — 0.9239Pu 0.3 4.2 0.9 — 0.3 — 4.3240Pu 0.4 1.5 0.4 — 0.2 — 1.6241Pu 0.3 2.5 0.3 — 0.1 — 2.5242Pu 0.1 0.4 0.1 — 0.1 — 0.5237Np 2.0 5.7 1.7 — 1.2 — 6.4241Am 10.6 9.1 3.1 — 1.8 — 14.4
242mAm 0.1 0.8 0.2 — — — 0.8243Am 6.0 4.8 1.7 — 4.8 — 9.2242Cm — — — — — — —243Cm — 0.4 0.1 — — — 0.4244Cm 1.0 9.0 1.5 — 0.6 — 9.2245Cm 0.1 3.4 0.7 — 0.1 — 3.4246Cm — — — — — — —56Fe 0.2 — — 0.4 3.9 — 4.057Fe — — — — 0.4 — 0.452Cr — — — 0.1 0.3 — 0.358Ni — — — — — — —
Zr 0.2 — — 0.2 0.9 — 0.915N — — — 1.5 0.2 — 1.5
Pb 0.2 — — 1.0 9.1 5.5 10.6Bi 0.3 — — 1.2 12.1 8.3 14.8
Totala 12.4 16.1 4.4 2.2 16.6 9.9 28.5
*Uncertainties~%!.aTotal obtained as the square root of the sum of the squares of individual contributions in row or column.
TABLE XLI
Maximum ~He Production!0dpa—Uncertainties by Group*
Group ~MeV!a scap sfiss n sel sinel sn,2n Totalb
1 150 — — — 0.1 4.8 — 4.82 55.2 — 0.1 — 0.2 20.1 6.4 21.13 19.6 — 0.7 0.2 0.7 11.6 34.0 35.94 6.07 0.1 3.2 1.0 0.3 4.5 — 5.65 2.23 0.2 4.7 1.6 0.5 4.3 — 6.66 1.35 3.1 9.2 2.5 1.5 5.8 — 11.77 4.98E21c 5.2 2.4 0.5 0.8 1.3 — 6.08 1.83E21 6.3 2.0 0.4 0.5 1.2 — 6.79 6.74E22 2.6 1.5 0.4 0.2 0.2 — 3.0
10 2.48E22 2.2 1.3 0.2 0.2 0.1 — 2.611 9.12E23 1.9 1.2 0.2 — — — 2.312 2.04E23 1.2 0.5 0.1 — — — 1.313 4.54E24 0.2 0.1 — — — — 0.214 2.26E25 — — — — — — —15 4.00E26 — — — — — — —16 5.40E27 — — — — — — —17 1.00E27 — — — — — — —
Totalb 9.6 11.5 3.2 2.0 14.1 40.4 45.5
*Uncertainties~%!.aHigh-energy group boundary.bTotal obtained as the square root of the sum of the squares of individual contributions in row or column.cRead as 4.983 1021.
44 ALIBERTI et al.
NUCLEAR SCIENCE AND ENGINEERING VOL. 146 JAN. 2004
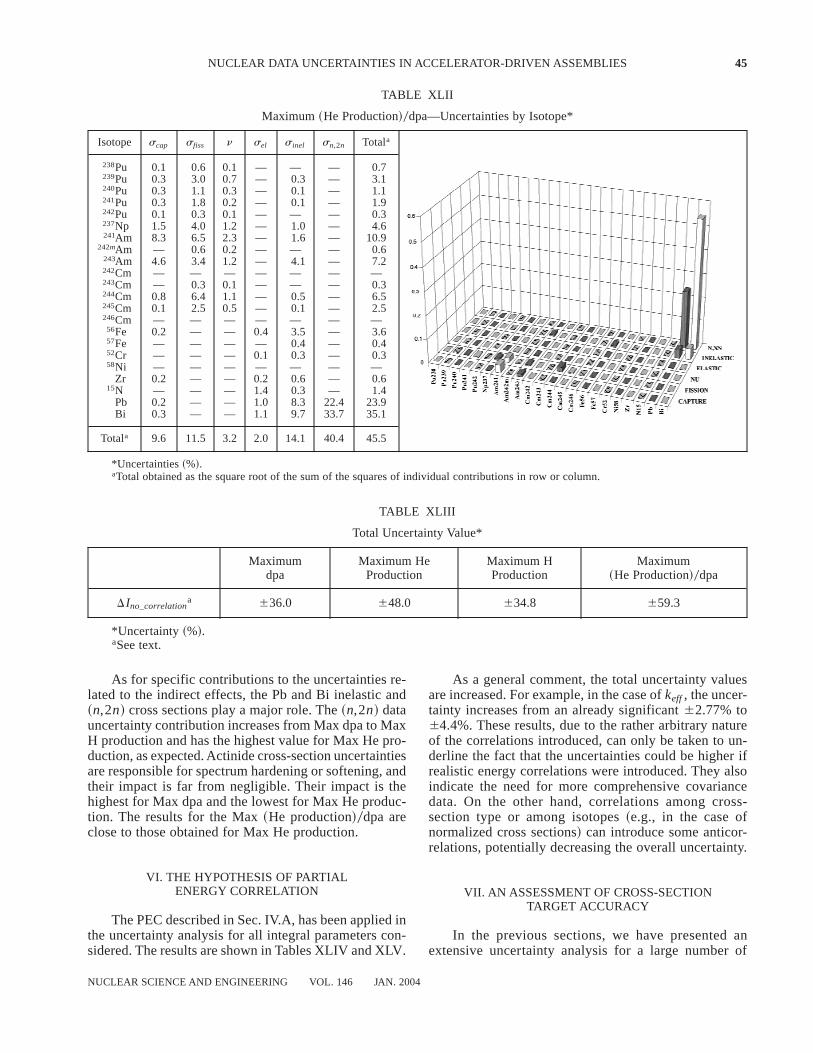
As for specific contributions to the uncertainties re-lated to the indirect effects, the Pb and Bi inelastic and~n,2n! cross sections play a major role. The~n,2n! datauncertainty contribution increases from Max dpa to MaxH production and has the highest value for Max He pro-duction, as expected. Actinide cross-section uncertaintiesare responsible for spectrum hardening or softening, andtheir impact is far from negligible. Their impact is thehighest for Max dpa and the lowest for Max He produc-tion. The results for the Max~He production!0dpa areclose to those obtained for Max He production.
VI. THE HYPOTHESIS OF PARTIALENERGY CORRELATION
The PEC described in Sec. IV.A, has been applied inthe uncertainty analysis for all integral parameters con-sidered. The results are shown in Tables XLIV and XLV.
As a general comment, the total uncertainty valuesare increased. For example, in the case ofkeff, the uncer-tainty increases from an already significant62.77% to64.4%. These results, due to the rather arbitrary natureof the correlations introduced, can only be taken to un-derline the fact that the uncertainties could be higher ifrealistic energy correlations were introduced. They alsoindicate the need for more comprehensive covariancedata. On the other hand, correlations among cross-section type or among isotopes~e.g., in the case ofnormalized cross sections! can introduce some anticor-relations, potentially decreasing the overall uncertainty.
VII. AN ASSESSMENT OF CROSS-SECTIONTARGET ACCURACY
In the previous sections, we have presented anextensive uncertainty analysis for a large number of
TABLE XLII
Maximum ~He Production!0dpa—Uncertainties by Isotope*
Isotope scap sfiss n sel sinel sn,2n Totala
238Pu 0.1 0.6 0.1 — — — 0.7239Pu 0.3 3.0 0.7 — 0.3 — 3.1240Pu 0.3 1.1 0.3 — 0.1 — 1.1241Pu 0.3 1.8 0.2 — 0.1 — 1.9242Pu 0.1 0.3 0.1 — — — 0.3237Np 1.5 4.0 1.2 — 1.0 — 4.6241Am 8.3 6.5 2.3 — 1.6 — 10.9
242mAm — 0.6 0.2 — — — 0.6243Am 4.6 3.4 1.2 — 4.1 — 7.2242Cm — — — — — — —243Cm — 0.3 0.1 — — — 0.3244Cm 0.8 6.4 1.1 — 0.5 — 6.5245Cm 0.1 2.5 0.5 — 0.1 — 2.5246Cm — — — — — — —56Fe 0.2 — — 0.4 3.5 — 3.657Fe — — — — 0.4 — 0.452Cr — — — 0.1 0.3 — 0.358Ni — — — — — — —
Zr 0.2 — — 0.2 0.6 — 0.615N — — — 1.4 0.3 — 1.4
Pb 0.2 — — 1.0 8.3 22.4 23.9Bi 0.3 — — 1.1 9.7 33.7 35.1
Totala 9.6 11.5 3.2 2.0 14.1 40.4 45.5
*Uncertainties~%!.aTotal obtained as the square root of the sum of the squares of individual contributions in row or column.
TABLE XLIII
Total Uncertainty Value*
Maximumdpa
Maximum HeProduction
Maximum HProduction
Maximum~He Production!0dpa
D Ino_correlationa 636.0 648.0 634.8 659.3
*Uncertainty~%!.aSee text.
NUCLEAR DATA UNCERTAINTIES IN ACCELERATOR-DRIVEN ASSEMBLIES 45
NUCLEAR SCIENCE AND ENGINEERING VOL. 146 JAN. 2004
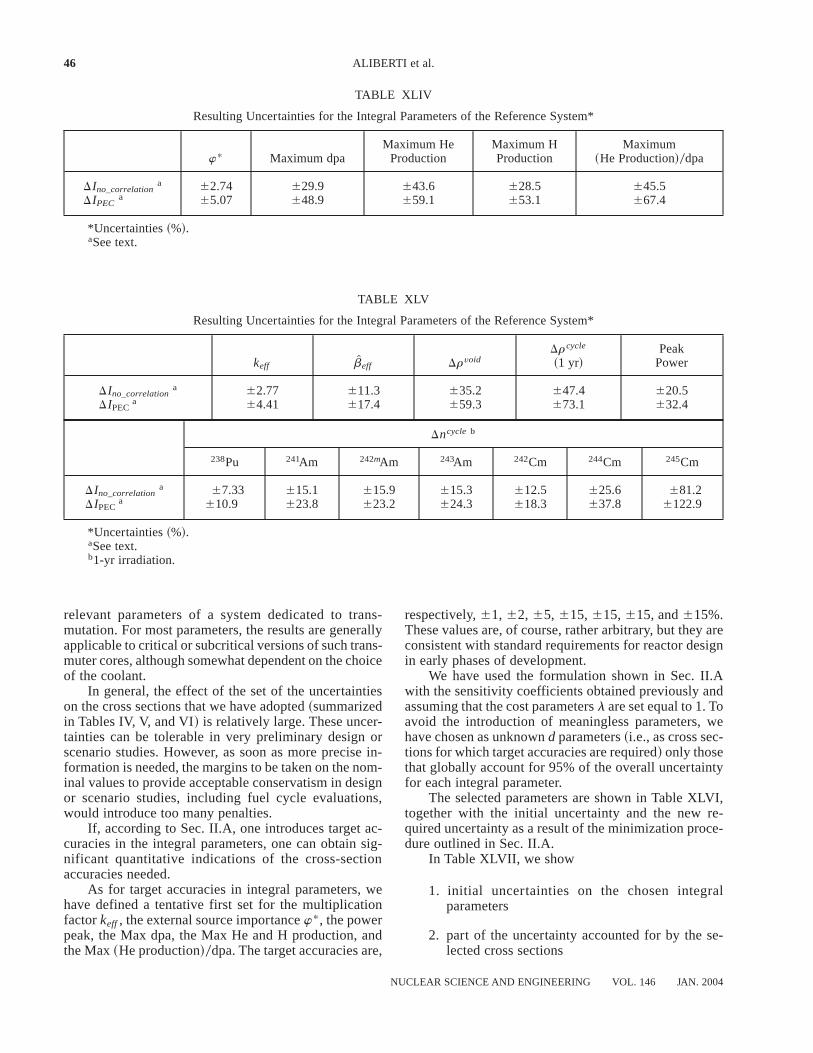
relevant parameters of a system dedicated to trans-mutation. For most parameters, the results are generallyapplicable to critical or subcritical versions of such trans-muter cores, although somewhat dependent on the choiceof the coolant.
In general, the effect of the set of the uncertaintieson the cross sections that we have adopted~summarizedin Tables IV, V, and VI! is relatively large. These uncer-tainties can be tolerable in very preliminary design orscenario studies. However, as soon as more precise in-formation is needed, the margins to be taken on the nom-inal values to provide acceptable conservatism in designor scenario studies, including fuel cycle evaluations,would introduce too many penalties.
If, according to Sec. II.A, one introduces target ac-curacies in the integral parameters, one can obtain sig-nificant quantitative indications of the cross-sectionaccuracies needed.
As for target accuracies in integral parameters, wehave defined a tentative first set for the multiplicationfactorkeff, the external source importancew* , the powerpeak, the Max dpa, the Max He and H production, andthe Max~He production!0dpa. The target accuracies are,
respectively,61, 62, 65, 615,615,615, and615%.These values are, of course, rather arbitrary, but they areconsistent with standard requirements for reactor designin early phases of development.
We have used the formulation shown in Sec. II.Awith the sensitivity coefficients obtained previously andassuming that the cost parametersl are set equal to 1. Toavoid the introduction of meaningless parameters, wehave chosen as unknownd parameters~i.e., as cross sec-tions for which target accuracies are required! only thosethat globally account for 95% of the overall uncertaintyfor each integral parameter.
The selected parameters are shown in Table XLVI,together with the initial uncertainty and the new re-quired uncertainty as a result of the minimization proce-dure outlined in Sec. II.A.
In Table XLVII, we show
1. initial uncertainties on the chosen integralparameters
2. part of the uncertainty accounted for by the se-lected cross sections
TABLE XLIV
Resulting Uncertainties for the Integral Parameters of the Reference System*
w* Maximum dpaMaximum He
ProductionMaximum HProduction
Maximum~He Production!0dpa
D Ino_correlationa 62.74 629.9 643.6 628.5 645.5
D IPECa 65.07 648.9 659.1 653.1 667.4
*Uncertainties~%!.aSee text.
TABLE XLV
Resulting Uncertainties for the Integral Parameters of the Reference System*
keff Zbeff DrvoidDrcycle
~1 yr!Peak
Power
D Ino_correlationa 62.77 611.3 635.2 647.4 620.5
D IPECa 64.41 617.4 659.3 673.1 632.4
Dncycle b
238Pu 241Am 242mAm 243Am 242Cm 244Cm 245Cm
D Ino_correlationa 67.33 615.1 615.9 615.3 612.5 625.6 681.2
D IPECa 610.9 623.8 623.2 624.3 618.3 637.8 6122.9
*Uncertainties~%!.aSee text.b1-yr irradiation.
46 ALIBERTI et al.
NUCLEAR SCIENCE AND ENGINEERING VOL. 146 JAN. 2004
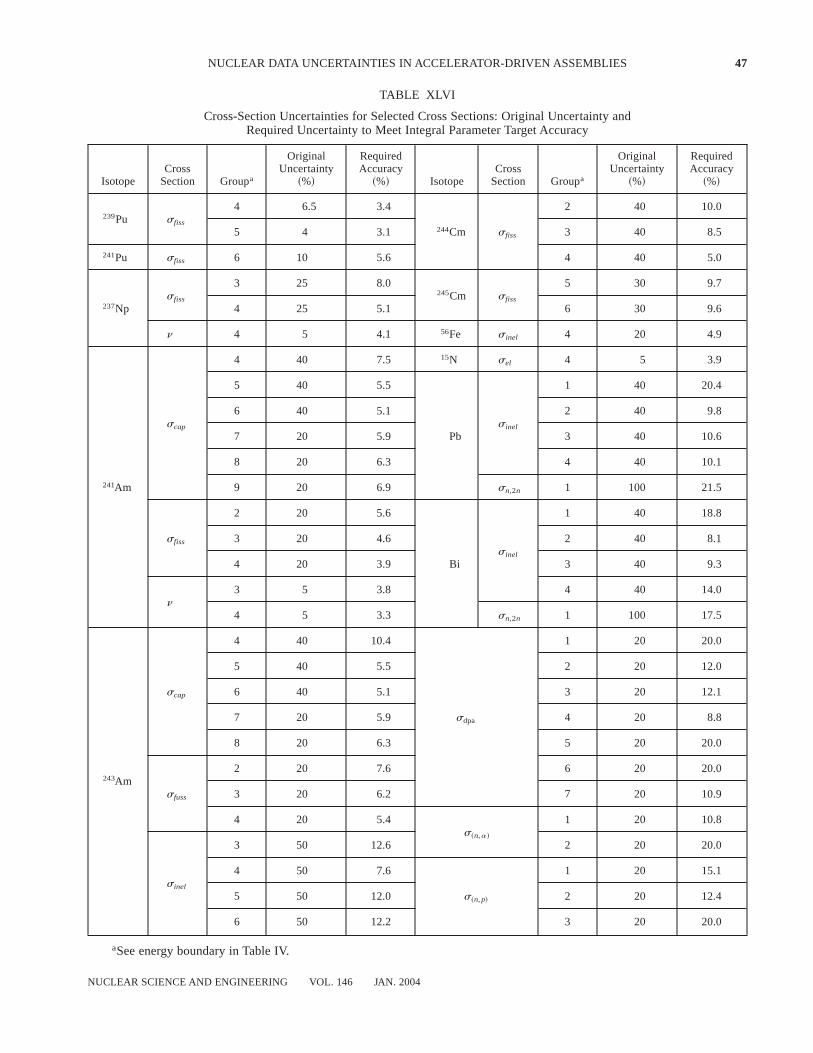
TABLE XLVI
Cross-Section Uncertainties for Selected Cross Sections: Original Uncertainty andRequired Uncertainty to Meet Integral Parameter Target Accuracy
IsotopeCross
Section Groupa
OriginalUncertainty
~%!
RequiredAccuracy
~%! IsotopeCross
Section Groupa
OriginalUncertainty
~%!
RequiredAccuracy
~%!
239Pu sfiss
4 6.5 3.4 2 40 10.0
5 4 3.1 244Cm sfiss 3 40 8.5
241Pu sfiss 6 10 5.6 4 40 5.0
sfiss
3 25 8.0245Cm sfiss
5 30 9.7
237Np 4 25 5.1 6 30 9.6
n 4 5 4.1 56Fe sinel 4 20 4.9
4 40 7.5 15N sel 4 5 3.9
5 40 5.5 1 40 20.4
scap
6 40 5.1sinel
2 40 9.8
7 20 5.9 Pb 3 40 10.6
8 20 6.3 4 40 10.1
241Am 9 20 6.9 sn,2n 1 100 21.5
2 20 5.6 1 40 18.8
sfiss 3 20 4.6sinel
2 40 8.1
4 20 3.9 Bi 3 40 9.3
n3 5 3.8 4 40 14.0
4 5 3.3 sn,2n 1 100 17.5
4 40 10.4 1 20 20.0
5 40 5.5 2 20 12.0
scap 6 40 5.1 3 20 12.1
7 20 5.9 sdpa 4 20 8.8
8 20 6.3 5 20 20.0
243Am2 20 7.6 6 20 20.0
sfuss 3 20 6.2 7 20 10.9
4 20 5.4s~n,a!
1 20 10.8
3 50 12.6 2 20 20.0
sinel
4 50 7.6 1 20 15.1
5 50 12.0 s~n,p! 2 20 12.4
6 50 12.2 3 20 20.0
aSee energy boundary in Table IV.
NUCLEAR DATA UNCERTAINTIES IN ACCELERATOR-DRIVEN ASSEMBLIES 47
NUCLEAR SCIENCE AND ENGINEERING VOL. 146 JAN. 2004
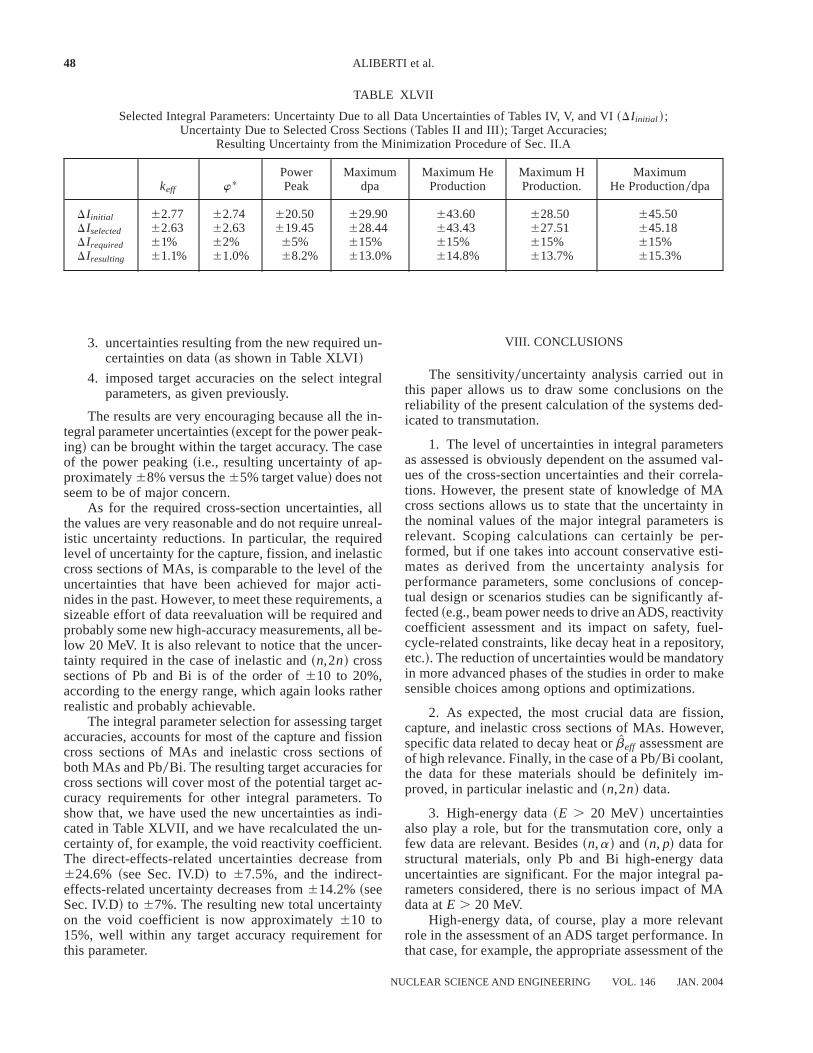
3. uncertainties resulting from the new required un-certainties on data~as shown in Table XLVI!
4. imposed target accuracies on the select integralparameters, as given previously.
The results are very encouraging because all the in-tegral parameter uncertainties~except for the power peak-ing! can be brought within the target accuracy. The caseof the power peaking~i.e., resulting uncertainty of ap-proximately68% versus the65% target value! does notseem to be of major concern.
As for the required cross-section uncertainties, allthe values are very reasonable and do not require unreal-istic uncertainty reductions. In particular, the requiredlevel of uncertainty for the capture, fission, and inelasticcross sections of MAs, is comparable to the level of theuncertainties that have been achieved for major acti-nides in the past. However, to meet these requirements, asizeable effort of data reevaluation will be required andprobably some new high-accuracy measurements, all be-low 20 MeV. It is also relevant to notice that the uncer-tainty required in the case of inelastic and~n,2n! crosssections of Pb and Bi is of the order of610 to 20%,according to the energy range, which again looks ratherrealistic and probably achievable.
The integral parameter selection for assessing targetaccuracies, accounts for most of the capture and fissioncross sections of MAs and inelastic cross sections ofboth MAs and Pb0Bi. The resulting target accuracies forcross sections will cover most of the potential target ac-curacy requirements for other integral parameters. Toshow that, we have used the new uncertainties as indi-cated in Table XLVII, and we have recalculated the un-certainty of, for example, the void reactivity coefficient.The direct-effects-related uncertainties decrease from624.6% ~see Sec. IV.D! to 67.5%, and the indirect-effects-related uncertainty decreases from614.2%~seeSec. IV.D! to 67%. The resulting new total uncertaintyon the void coefficient is now approximately610 to15%, well within any target accuracy requirement forthis parameter.
VIII. CONCLUSIONS
The sensitivity0uncertainty analysis carried out inthis paper allows us to draw some conclusions on thereliability of the present calculation of the systems ded-icated to transmutation.
1. The level of uncertainties in integral parametersas assessed is obviously dependent on the assumed val-ues of the cross-section uncertainties and their correla-tions. However, the present state of knowledge of MAcross sections allows us to state that the uncertainty inthe nominal values of the major integral parameters isrelevant. Scoping calculations can certainly be per-formed, but if one takes into account conservative esti-mates as derived from the uncertainty analysis forperformance parameters, some conclusions of concep-tual design or scenarios studies can be significantly af-fected~e.g., beam power needs to drive an ADS, reactivitycoefficient assessment and its impact on safety, fuel-cycle-related constraints, like decay heat in a repository,etc.!. The reduction of uncertainties would be mandatoryin more advanced phases of the studies in order to makesensible choices among options and optimizations.
2. As expected, the most crucial data are fission,capture, and inelastic cross sections of MAs. However,specific data related to decay heat orZbeff assessment areof high relevance. Finally, in the case of a Pb0Bi coolant,the data for these materials should be definitely im-proved, in particular inelastic and~n,2n! data.
3. High-energy data~E . 20 MeV! uncertaintiesalso play a role, but for the transmutation core, only afew data are relevant. Besides~n,a! and ~n, p! data forstructural materials, only Pb and Bi high-energy datauncertainties are significant. For the major integral pa-rameters considered, there is no serious impact of MAdata atE . 20 MeV.
High-energy data, of course, play a more relevantrole in the assessment of an ADS target performance. Inthat case, for example, the appropriate assessment of the
TABLE XLVII
Selected Integral Parameters: Uncertainty Due to all Data Uncertainties of Tables IV, V, and VI~D Iinitial !;Uncertainty Due to Selected Cross Sections~Tables II and III!; Target Accuracies;
Resulting Uncertainty from the Minimization Procedure of Sec. II.A
keff w*PowerPeak
Maximumdpa
Maximum HeProduction
Maximum HProduction.
MaximumHe Production0dpa
D Iinitial 62.77 62.74 620.50 629.90 643.60 628.50 645.50D Iselected 62.63 62.63 619.45 628.44 643.43 627.51 645.18D Irequired 61% 62% 65% 615% 615% 615% 615%D Iresulting 61.1% 61.0% 68.2% 613.0% 614.8% 613.7% 615.3%
48 ALIBERTI et al.
NUCLEAR SCIENCE AND ENGINEERING VOL. 146 JAN. 2004
activity generated by spallation products will be impor-tant, but again the relevant materials will be the potentialtarget material candidates~Pb, Bi, W, etc.!.
4. If one defines target accuracies for the integralparameters to allow for more reliable engineering de-signs, the reduction of the uncertainties, in particular ofMA data, which are needed to meet these target accura-cies, is significant because one should reach uncertain-ties of the same order of magnitude of those currentlyassociated with the major actinide data.
5. In this respect, if the nuclear data are reevalu-ated, one should include not only new differential mea-surements but, and mostly, integral experiments~like MAsample irradiation in power reactors with variable spec-tra; see, for example, Ref. 29! because they provide amost powerful tool for global data validation or for dataimprovement via statistical adjustments. Some of theseintegral experiments have already been performed in thepast but only partially used for nuclear data file updat-ing, and efforts should be devoted to their full exploita-tion. For very high mass nuclei, some new techniqueslike accelerator mass spectrometry, applied to tiny quan-tities of irradiated fuels at relatively high burnup, couldprovide relevant information with high accuracy.
Finally, future studies related to the impact of nucleardata uncertainties, in particular in the detailed designassessment phase, should rely on variance-covariancedata established in a much more rigorous manner, evenif adapted~in terms of format and complexity! to userneeds.
ACKNOWLEDGMENTS
The authors thank A. d’Angelo for useful suggestions onbeff-related issues. Part of this work was supported by the U.S.Department of Energy, Nuclear Energy Programs, under con-tract W-31-109-ENG-38
REFERENCES
1. “Actinides and Fission Product Partitioning and Trans-mutation. Status Assessment Report,” OECD Nuclear EnergyAgency~1999!.
2. M. SALVATORES, I. SLESSAREV, and M. UEMATSU,“A Global Physics Approach to Transmutation of RadioactiveNuclei,” Nucl. Sci. Eng., 116, 1 ~1994!.
3. T. MUKAYAMA et al., “R and D Strategy for Partitioningand Transmutation under OMEGA Program and Neutron Sci-ence Project at JAERI,”Proc. 5th Int. Information ExchangeMtg. Actinides and Fission Product Partitioning and Trans-mutation, Mol, Belgium, November 25–27, 1998, EUR 18898EN, p. 65, OECD0NEA ~1999!.
4. “A European Roadmap for Developing Accelerator-DrivenSystems~ADS! for Nuclear Waste Incineration,” Report of theEuropean Technical Working Group on ADS~Apr. 2001!.
5. “Accelerator-Driven Systems~ADS! and Fast Reactor~FR!in Advanced Nuclear Fuel Cycles. A Comparative Study,”OECD Nuclear Energy Agency~2002!.
6. “Comparison Calculations for an Accelerator-Driven MinorActinides Burner,” OECD Nuclear Energy Agency~2002!.
7. G. PALMIOTTI, M. SALVATORES, and R. N. HILL, “Sen-sitivity, Uncertainty Assessment, and Target Accuracies Re-lated to Radiotoxicity Evaluation,”Nucl. Sci. Eng., 117, 239~1994!.
8. G. ALIBERTI, G. PALMIOTTI, M. SALVATORES, andC. G. STENBERG, “Impact of High Energy Data on Uncer-tainty Assessment of ADS Neutronic Design,”Trans. Am. Nucl.Soc., 87, 525~2002!.
9. G. PALMIOTTI, P. J. FINCK, I. GOMES, B. MICKLICH,and M. SALVATORES, “Uncertainty Assessment forAccelerator-Driven-System,” presented at Int. Conf. Global’99: Future Nuclear Systems, Jackson, Wyoming, August 29–September 3, 1999.
10. Uncertainty Analysis, Y. RONEN, Ed., CRC Press, BocaRaton, Florida~1988!; see also J. H. MARABLE et al.,Ad-vances in Nuclear Science and Technology, Vol. 14, J. LEWINSand A. BECKER, Eds., Plenum Press, New York~1982!.
11. A. GANDINI, Uncertainty Analysis, Y. RONEN, Ed., CRCPress, Boca Raton, Florida~1988!; see also E. GREENSPAN,Advances in Nuclear Science and Technology, Vol. 14, J.LEWINS and A. BECKER, Eds., Plenum Press, New York~1982!.
12. L. N. USACHEV and Y. BOBKOV, “Planning an Opti-mum Set of Microscopic Experiments and Evaluations to Ob-tain a Given Accuracy in Reactor Parameter Calculations,”INDC CCP-19U, International Atomic Energy Agency~1972!.
13. A. GANDINI, G. PALMIOTTI, and M. SALVATORES,“Equivalent Generalized Perturbation Theory~EGPT!,” Ann.Nucl. Energy, 13, 3, 109~1986!.
14. J. M. KALLFELZ, G. B. BRUNA, G. PALMIOTTI, andM. SALVATORES, “Burnup Calculations with Time-DependentGeneralized Perturbation Theory,”Nucl. Sci. Eng., 62, 304~1977!.
15. M. L. WILLIAMS, “Development of Depletion Perturba-tion Theory for Coupled Neutron0Nuclide Fields,”Nucl. Sci.Eng., 70, 20 ~1979!.
16. J. R. WHITE, “The DEPTH-CHARGE Static and Time-Dependent Perturbation0Sensitivity System for Nuclear Reac-tor Core Analysis,” ORNL0CSD-78, Oak Ridge NationalLaboratory~1981!.
NUCLEAR DATA UNCERTAINTIES IN ACCELERATOR-DRIVEN ASSEMBLIES 49
NUCLEAR SCIENCE AND ENGINEERING VOL. 146 JAN. 2004
17. G. PALMIOTTI, R. F. BURSTALL, E. KIEFHABER, W.GEBHARDT, and J. M. RIEUNIER, “New Methods Develop-ments and Rationalization of Tools for LMFBR Design in theFrame of the European Collaboration,” presented at FR’91 Int.Conf. Fast Reactors and Related Fuel Cycles, Kyoto, Japan,October 28–November 1, 1991.
18. G. PALMIOTTI, J. M. RIEUNIER, C. GHO, and M.SALVATORES, “Optimized Two-DimensionalSn Transport~BISTRO!,” Nucl. Sci. Eng., 104, 26 ~1990!.
19. M. J. BELL, “The ORNL Isotope Generation and Deple-tion Code,” Oak Ridge National Laboratory~May 1973!.
20. “The JEF-2.2 Nuclear Data Library,” Report 17, OECD0NEA ~Apr. 2000!.
21. M. B. CHADWICK, P. G. YOUNG, S. CHIBA, S. C.FRANKLE, G. M. HALE, H. G. HUGHES, A. J. KONING,R. C. LITTLE, R. E. MacFARLANE, R. E. PRAEL, and L. S.WATERS, “Cross-Section Evaluations to 150 MeV forAccelerator-Driven Systems and Implementation in MCNPX,”Nucl. Sci. Eng., 131, 293~1999!.
22. E. FORT, Private Communication~2001!.
23. “Present Status of Minor Actinide Data,” NEA0WPEC-8,OECD0NEA ~1999!.
24. A. D’ANGELO, “A Total Delayed Neutron Yields Ad-justment Using Integral Measurements,”Proc. Int. Conf.PHYSOR’90, Marseille, France, April 23–27, 1990.
25. R. W. MILLS, “Fission Product Yield Evaluation,” PhDThesis, University of Birmingham, United Kingdom~1995!.
26. G. P. GROUILLER, Private Communication~1990!.
27. J. REBAH, PhD Thesis, University of Paris~1998!.
28. D. G. NABEREJNEV and M. SALVATORES, “Irradia-tion of Structural Materials in Spallation Neutron Sources,”Trans. Am. Nucl. Soc., 86, 425~2002!.
29. M. SALVATORES, “Future Nuclear Power Systems andNuclear Data Needs,” presented at Int. Conf. on Nuclear Datafor Science and Technology, Tsukuba, Japan, October 7–12,2001.
50 ALIBERTI et al.
NUCLEAR SCIENCE AND ENGINEERING VOL. 146 JAN. 2004