impact of fukushima-derived radiocesium in the western north pacific ocean about ten months after...
DESCRIPTION
Impact of Fukushima-derived radiocesium in the western North Pacific Ocean about ten months after the Fukushima Dai-ichi nuclear power plant accidentTRANSCRIPT
lable at ScienceDirect
Journal of Environmental Radioactivity 140 (2015) 114e122
Contents lists avai
Journal of Environmental Radioactivity
journal homepage: www.elsevier .com/locate / jenvrad
Impact of Fukushima-derived radiocesium in the western NorthPacific Ocean about ten months after the Fukushima Dai-ichi nuclearpower plant accident
Yuichiro Kumamoto a, *, Michio Aoyama b, Yasunori Hamajima c, Akihiko Murata a,Takeshi Kawano a
a Research and Development Center for Global Change, Japan Agency for Marine-Earth Science and Technology, 2-15 Natushima-cho, Yokosuka, Kanagawa237-0061, Japanb Institute of Environmental Radioactivity, Fukushima University, 1-1 Kanayagawa, Fukushima 960-1296, Japanc Low Level Radioactivity Laboratory, Kanazawa University, Wake, Nomi, Ishikawa 923-1224, Japan
a r t i c l e i n f o
Article history:Received 3 July 2014Received in revised form7 November 2014Accepted 14 November 2014Available online
Keywords:Fukushima Dai-ichi nuclear power plantaccidentRadiocesiumSeawaterWestern North Pacific OceanNuclear weapons testing
* Corresponding author. Tel.: þ81 46 867 9505; faxE-mail address: [email protected] (Y. Kum
http://dx.doi.org/10.1016/j.jenvrad.2014.11.0100265-931X/© 2014 The Authors. Published by Elsevie
a b s t r a c t
We measured vertical distributions of radiocesium (134Cs and 137Cs) at stations along the 149�E meridianin the western North Pacific during winter 2012, about ten months after the Fukushima Dai-ichi NuclearPower Plant (FNPP1) accident. The Fukushima-derived 134Cs activity concentration and water-columninventory were largest in the transition region between 35 and 40�N approximately due to thedirected discharge of the contaminated water from the FNPP1. The bomb-derived 137Cs activity con-centration just before the FNPP1 accident was derived from the excess 137Cs activity concentrationrelative to the 134Cs activity concentration. The water-column inventory of the bomb-derived 137Cs waslargest in the subtropical region south of 35�N, which implies that the Fukushima-derived 134Cs will alsobe transported from the transition region to the subtropical region in the coming decades. Mean values ofthe water-column inventories decay-corrected for the Fukushima-derived 134Cs and the bomb-derived137Cs were estimated to be 1020 ± 80 and 820 ± 120 Bq m�2, respectively, suggesting that in winter2012 the impact of the FNPP1 accident in the western North Pacific Ocean was nearly the same as that ofnuclear weapons testing. Relationship between the water-column inventory and the activity concen-tration in surface water for the radiocesium is essential information for future evaluation of the totalamount of Fukushima-derived radiocesium released into the North Pacific Ocean.© 2014 The Authors. Published by Elsevier Ltd. This is an open access article under the CC BY license
(http://creativecommons.org/licenses/by/3.0/).
1. Introduction
The massive Tohoku earthquake and consequent giant tsunamison 11March 2011 resulted in serious damage to the Fukushima Dai-ichi Nuclear Power Plant (FNPP1) in eastern Japan (Prime Ministerof Japan and His Cabinet, 2011). Radiocesium (134Cs and 137Cs)derived from the damaged FNPP1 caused radioactive contamina-tion of the islands of Japan and the North Pacific Ocean (Yoshidaand Kanda, 2012). Most of the Fukushima-derived radiocesiumdeposited on the Japanese islands has remained in the soil, andmeasurement of radiocesium activity in the soil (NuclearRegulation Authority, 2012) has revealed that the radioactivities
: þ81 46 867 9835.amoto).
r Ltd. This is an open access articl
of 134Cs and 137Cs released from the FNPP1 were approximatelyequivalent. The estimated total amount of 137Cs (or 134Cs) activity inthe islands of Japan is 2.4 PBq (1015 Bq), based on soil measure-ments and the air dose rate derived from airborne monitoring(Morino et al., 2013). In contrast, radiocesium released into theNorth Pacific Ocean was immediately diluted by water advectionand diffusion. As a result, it has been difficult to collect enoughseawater samples for a quantitative discussion of the total amountof Fukushima-derived radiocesium in the vast ocean.
The Fukushima-derived radiocesium were released into theNorth Pacific, mostly in March and April 2011, through two majorpathways: direct discharge of radioactive water and atmosphericdeposition. In late March 2011, the Tokyo Electric Power Companyand the Japanese Government began marine monitoring in thecoastal area within a radius of about 30 km from the FNPP1(Nuclear Regulation Authority, 2011; Oikawa et al., 2013; Tokyo
e under the CC BY license (http://creativecommons.org/licenses/by/3.0/).
Y. Kumamoto et al. / Journal of Environmental Radioactivity 140 (2015) 114e122 115
Electric Power Company, 2011). The decay-corrected 134Cs/137Csratio in those monitoring data was almost 1 and in agreement withthe ratio in standing water in the damaged FNPP1 (Nishihara et al.,2012). Thus, the activity concentrations of 134Cs and 137Cs in theradioactive water directly discharged from the FNPP1 were alsoapproximately equivalent. These measurements have facilitatedevaluation of the total amount of 137Cs (or 134Cs) derived from thedirectly discharged radioactive water. Many estimations were inthe range between 2 and 6 PBq (Estournel et al., 2012; Kawamuraet al., 2011; Miyazawa et al., 2013; Nair et al., 2014; PrimeMinister of Japan and His Cabinet, 2011; Tsumune et al., 2012).However, temporal or spatial extrapolating in the calculationresulted in a larger amount ranged from 11 to 27 PBq (Bailly du Boiset al., 2012; Charette et al., 2013; Rypina et al., 2013).
Efforts to obtain data of Fukushima-derived radiocesium in theopenoceanhave continued, and radiocesiummeasurementsmade inboth surface water (Aoyama et al., 2013; Honda et al., 2012;Kaeriyama et al., 2013; Kameník et al., 2013; Karasev, 2012) and theocean interior (Buesseler et al., 2012; Kaeriyama et al., 2014;Kumamoto et al., 2014; Povinec et al., 2013; Ramzaev et al., 2014)have been reported. These data obtained in the open ocean haverevealed that the Fukushima-derived radiocesium released into theNorth Pacific Ocean has been transported eastward by surface cur-rents andconveyed southward across theKuroshioExtensioncurrentin subsurface layers. However, the available data are still insufficientfor evaluationof the total amountof radiocesium, including that fromatmospheric deposition, in the vastNorthPacificOcean. Atmosphericdeposition has been estimated by using atmospheric model simu-lations (Estournel et al., 2012; Kawamura et al., 2011; Kobayashi et al.,2013; Miyazawa et al., 2013; Morino et al., 2011, 2013; Stohl et al.,2012). The results of these model simulations consistently showthat a large portion of the radiocesium released to the atmospherefrom the FNPP1 was subsequently deposited on the North PacificOcean. However, the simulated total amount of 137Cs (or 134Cs)deposited on the ocean ranges widely, from 5 to 30 PBq.
The two major isotopes in the Fukushima-derived radiocesiumare 134Cs and 137Cs. These radiocesium isotopes were also releasedinto the environment before the FNPP1 accident by atmosphericnuclear weapons testing, mainly in the 1950s and 1960s; nuclearfuel reprocessing, mainly in the 1980s; and the Chernobyl accidentin 1986. In the North Pacific Ocean the major source of radiocesiumwas atmospheric deposition due to the nuclear weapons testing(Aoyama et al., 2006). The bomb-derived 137Cs released into theNorth Pacific was still there just before the accident because itshalf-life is long, 30.04 y. In the 2000s, 137Cs activity concentration of1.0e2.5 Bq m�3 was widely observed in surface seawaters of theNorth Pacific Ocean (Aoyama et al., 2012a). After the FNPP1 acci-dent, the Fukushima-derived 137Cs was of course added to thebomb-derived 137Cs. In contrast, the 134Cs released before the ac-cident had disappeared, because its half-life is only 2.07 y, whichindicates that 134Cs can be used as a tracer of radiocesium from theFNPP1 accident. The Fukushima-derived radiocesium measure-ments in the past suggested that the activities of 134Cs and 137Csreleased from the FNPP1 were equivalent. Thereby, after the decay-correction, the excess 137Cs activity concentration relative to the134Cs activity concentration in seawaters collected after the FNPP1accident represents the bomb-derived 137Cs activity concentration.By measuring both 134Cs and 137Cs activity concentrations, both theFukushima-derived and the bomb-derived 137Cs activity concen-trations can be determined simultaneously. A few studies havealready calculated the bomb-derived 137Cs activity concentrationsin seawaters of the North Pacific Ocean in this way (Inoue et al.,2012; Kameník et al., 2013; Ramzaev et al., 2014). However, theydid not compare the activity concentrations and inventories of theFukushima-derived and bomb-derived 137Cs quantitatively.
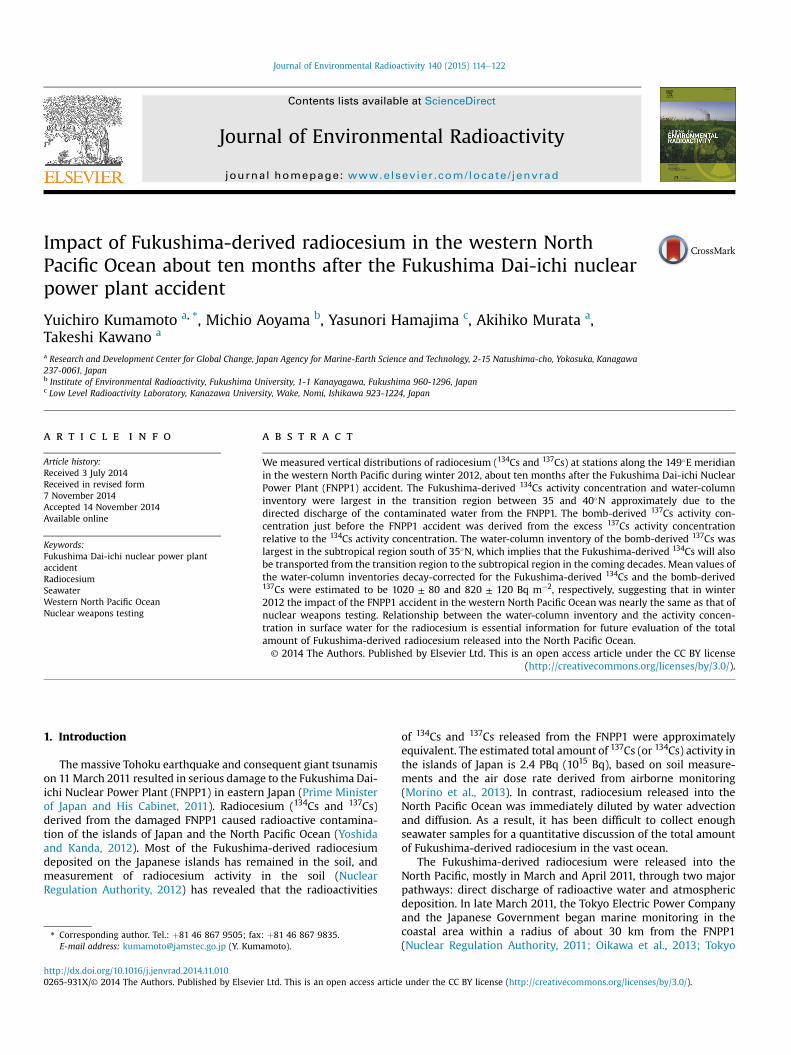
Here we report the vertical distributions of 134Cs and 137Cs ac-tivity concentrations at stations along 149 �E between approxi-mately 42 �N and 4 �S in winter 2012, about ten months after theFNPP1 accident. We preliminarily reported the distribution andbehavior of the Fukushima-derived 134Cs only prior to the bomb-derived 137Cs along this meridional line between 42 �N and 10 �N(Kumamoto et al., 2014). In the preliminary report, we found thatactivity concentration of the Fukushima-derived 134Cs in surfacewater was highest in the transition region between the subarcticand Kuroshio Extension fronts (approximately 35e40 �N), wherethe FNPP1 is situated (Fig. 1). In addition, a subsurface maximum ofthe Fukushima-derived 134Cs was found in the subtropical regionsouth of the Kuroshio Extension Current, and southward trans-portation of the Fukushima-derived 134Cs was evaluated. In thisreport, we (1) additionally publish 134Cs and 137Cs activity con-centrations observed between 10 �N and 4 �S, which was notpublished in the previous report, (2) compare them between 42 �Nand 4 �S to estimate the bomb-derived 137Cs, which was notcalculated in the previous report, and (3) discuss the impact of theFukushima-derived radiocesium on the bomb-derived radio-cesium, which had existed since before the FNPP1 accident, in thewestern North Pacific in winter 2012. In addition, we evaluated therelationship between the activity concentration in surface waterand the water-column inventory of the radiocesium. These resultswill contribute to the eventual determination of the total amount ofthe Fukushima-derived radiocesium in the North Pacific Ocean.
2. Samples and experimental procedures
Seawater samples for radiocesium measurements (about20 dm3 each) were collected during cruise MR11-08 of the ResearchVesselMirai from December 2011 to February 2012. This cruise alsoperformed repeat hydrography along one of the observation lines ofthe World Ocean Circulation Experiment (WOCE) in the westernPacific Ocean (the WOCE-P10/P10N line), which approximatelyfollows the 149 �E meridian. We collected surface seawater using abucket at 38 stations along the line between 42 �N and 4 �S (Fig. 1).Along this line, the area north of the subarctic front (approximately40 �N) is defined as the subarctic region, that south of the KuroshioExtension front (approximately 35 �N) is defined as the subarctic,and the area between the two fronts, in which the FNPP1 is alsosituated, is designated the transition region (Fig. 1) (Kumamotoet al., 2014). Although the boundary between the subtropical andtropical regions is not clear, the area south of the North Equatorialcurrent (approximately 12 �N) is provisionally regarded as thetropical region. At 18 of the 38 stations, seawater samples from thesurface to 800 m depth were collected using 12-Liter polyvinylchloride bottles (Model 1010X NISKIN-X, General Oceanics Inc.).The seawater was filtered through a 0.45 mm pore size membranefilter (HAWP14250, Millipore) and acidified on board ship by add-ing 40 cm3 of concentrated nitric acid (Nitric Acid 70% AR, RCILabscan, Ltd.) within 24 h after sampling. After the cruise, radio-cesium in the seawater sample was concentrated on ammoniumphosphomolybdate (Aoyama and Hirose, 2008) in onshore labo-ratories for measurement of gamma-ray activity.
The radiocesium activity of the ammonium phosphomolybdatewas measured in a laboratory of the Mutsu Oceanographic Instituteat the Japan Agency for Marine-Earth Science and Technology(MIO/JAMSTEC) or the Low Level Radioactivity Laboratory atKanazawa University (LLRL/KU). In the MIO/JAMSTEC laboratory,the radiocesium was measured with low-background Ge-detectors(Well-type GCW2022-7915-30-ULB, Canberra Industries, Inc.) thatwere calibrated with gamma-ray volume sources (Eckert & ZieglerIsotope Products) certified by Deutscher Kalibrierdienst. The aver-ages of the analytical uncertainties (standard deviations) for the
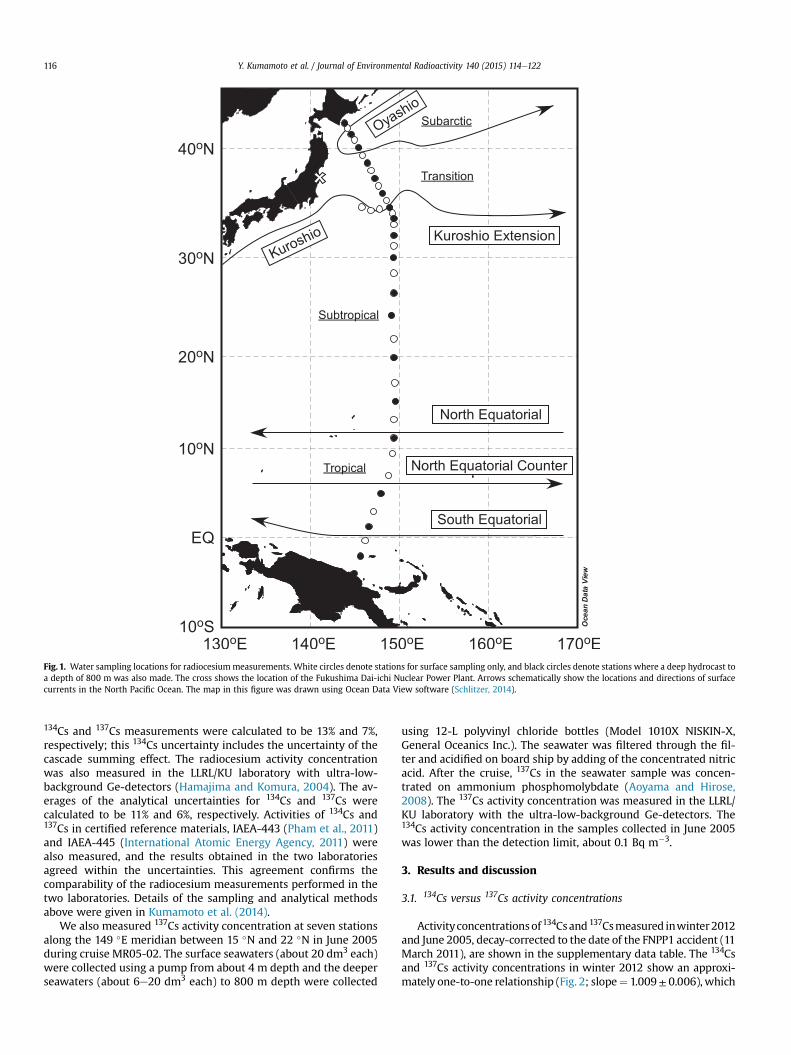
Fig. 1. Water sampling locations for radiocesiummeasurements. White circles denote stations for surface sampling only, and black circles denote stations where a deep hydrocast toa depth of 800 m was also made. The cross shows the location of the Fukushima Dai-ichi Nuclear Power Plant. Arrows schematically show the locations and directions of surfacecurrents in the North Pacific Ocean. The map in this figure was drawn using Ocean Data View software (Schlitzer, 2014).
Y. Kumamoto et al. / Journal of Environmental Radioactivity 140 (2015) 114e122116
134Cs and 137Cs measurements were calculated to be 13% and 7%,respectively; this 134Cs uncertainty includes the uncertainty of thecascade summing effect. The radiocesium activity concentrationwas also measured in the LLRL/KU laboratory with ultra-low-background Ge-detectors (Hamajima and Komura, 2004). The av-erages of the analytical uncertainties for 134Cs and 137Cs werecalculated to be 11% and 6%, respectively. Activities of 134Cs and137Cs in certified reference materials, IAEA-443 (Pham et al., 2011)and IAEA-445 (International Atomic Energy Agency, 2011) werealso measured, and the results obtained in the two laboratoriesagreed within the uncertainties. This agreement confirms thecomparability of the radiocesium measurements performed in thetwo laboratories. Details of the sampling and analytical methodsabove were given in Kumamoto et al. (2014).
We also measured 137Cs activity concentration at seven stationsalong the 149 �E meridian between 15 �N and 22 �N in June 2005during cruise MR05-02. The surface seawaters (about 20 dm3 each)were collected using a pump from about 4 m depth and the deeperseawaters (about 6e20 dm3 each) to 800 m depth were collected
using 12-L polyvinyl chloride bottles (Model 1010X NISKIN-X,General Oceanics Inc.). The seawater was filtered through the fil-ter and acidified on board ship by adding of the concentrated nitricacid. After the cruise, 137Cs in the seawater sample was concen-trated on ammonium phosphomolybdate (Aoyama and Hirose,2008). The 137Cs activity concentration was measured in the LLRL/KU laboratory with the ultra-low-background Ge-detectors. The134Cs activity concentration in the samples collected in June 2005was lower than the detection limit, about 0.1 Bq m�3.
3. Results and discussion
3.1. 134Cs versus 137Cs activity concentrations
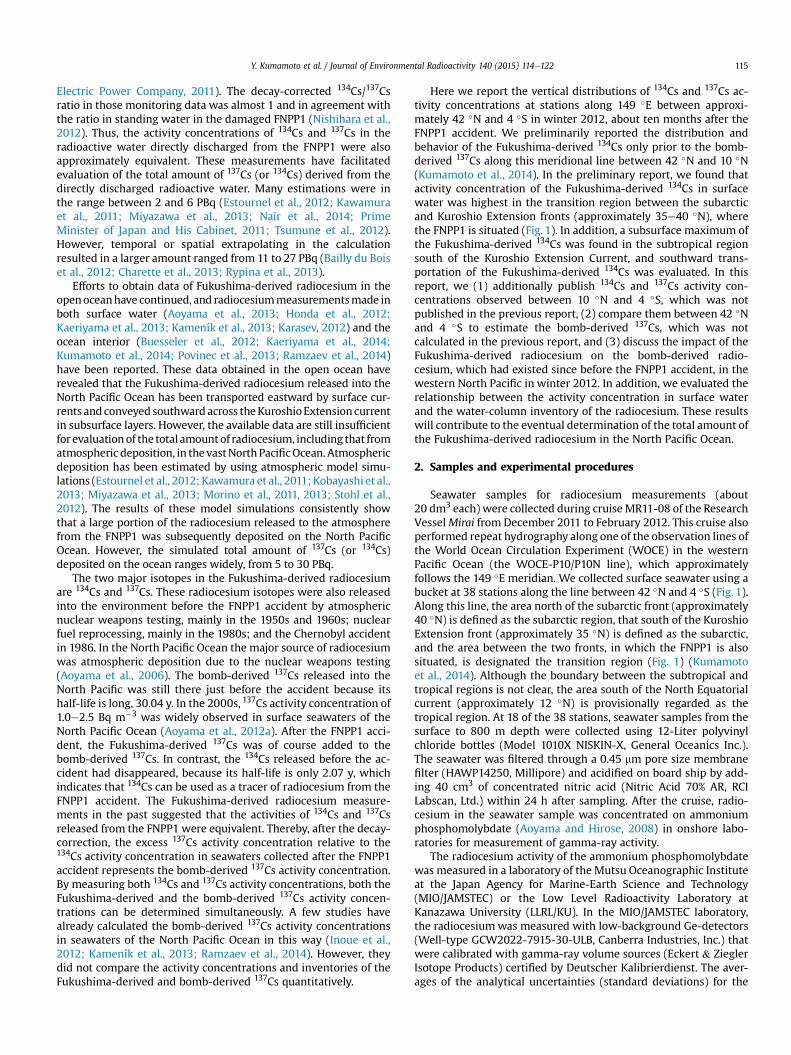
Activityconcentrationsof 134Csand 137Csmeasured inwinter2012and June 2005, decay-corrected to the date of the FNPP1 accident (11March 2011), are shown in the supplementary data table. The 134Csand 137Cs activity concentrations in winter 2012 show an approxi-mately one-to-one relationship (Fig. 2; slope¼ 1.009± 0.006), which
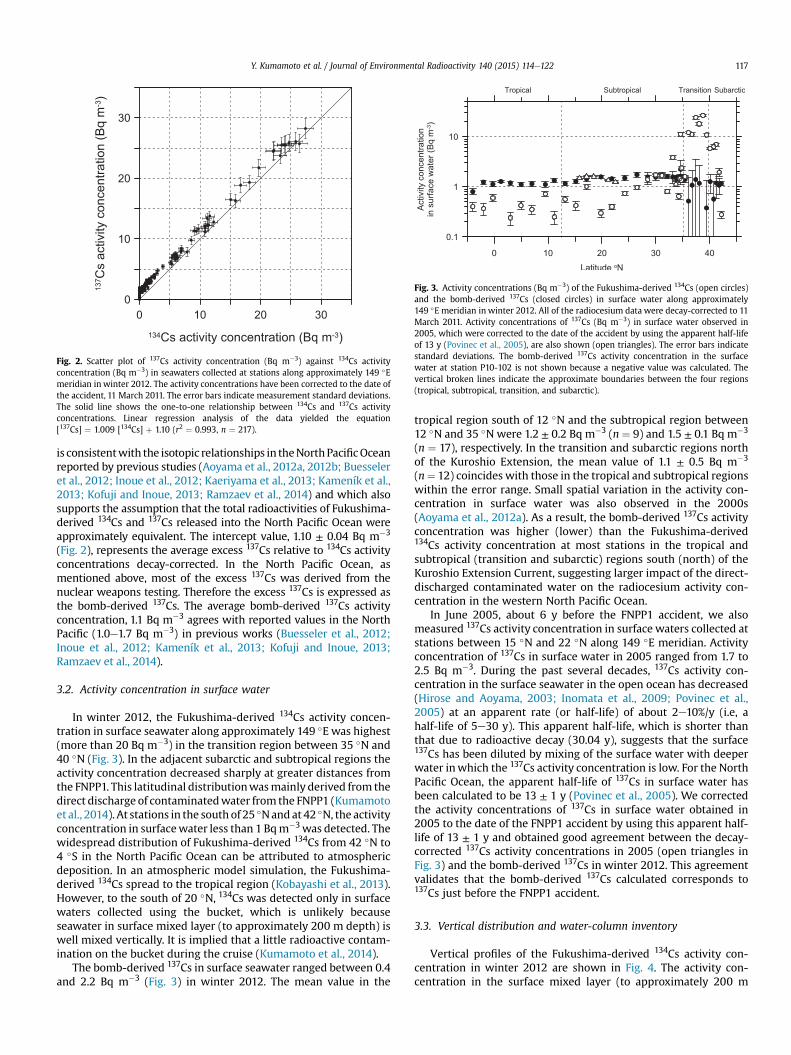
Fig. 2. Scatter plot of 137Cs activity concentration (Bq m�3) against 134Cs activityconcentration (Bq m�3) in seawaters collected at stations along approximately 149 �Emeridian in winter 2012. The activity concentrations have been corrected to the date ofthe accident, 11 March 2011. The error bars indicate measurement standard deviations.The solid line shows the one-to-one relationship between 134Cs and 137Cs activityconcentrations. Linear regression analysis of the data yielded the equation[137Cs] ¼ 1.009 [134Cs] þ 1.10 (r2 ¼ 0.993, n ¼ 217).
Fig. 3. Activity concentrations (Bq m�3) of the Fukushima-derived 134Cs (open circles)and the bomb-derived 137Cs (closed circles) in surface water along approximately149 �E meridian in winter 2012. All of the radiocesium data were decay-corrected to 11March 2011. Activity concentrations of 137Cs (Bq m�3) in surface water observed in2005, which were corrected to the date of the accident by using the apparent half-lifeof 13 y (Povinec et al., 2005), are also shown (open triangles). The error bars indicatestandard deviations. The bomb-derived 137Cs activity concentration in the surfacewater at station P10-102 is not shown because a negative value was calculated. Thevertical broken lines indicate the approximate boundaries between the four regions(tropical, subtropical, transition, and subarctic).
Y. Kumamoto et al. / Journal of Environmental Radioactivity 140 (2015) 114e122 117
is consistentwith the isotopic relationships in theNorthPacificOceanreported by previous studies (Aoyama et al., 2012a, 2012b; Buesseleret al., 2012; Inoue et al., 2012; Kaeriyama et al., 2013; Kameník et al.,2013; Kofuji and Inoue, 2013; Ramzaev et al., 2014) and which alsosupports the assumption that the total radioactivities of Fukushima-derived 134Cs and 137Cs released into the North Pacific Ocean wereapproximately equivalent. The intercept value, 1.10 ± 0.04 Bq m�3
(Fig. 2), represents the average excess 137Cs relative to 134Cs activityconcentrations decay-corrected. In the North Pacific Ocean, asmentioned above, most of the excess 137Cs was derived from thenuclear weapons testing. Therefore the excess 137Cs is expressed asthe bomb-derived 137Cs. The average bomb-derived 137Cs activityconcentration, 1.1 Bq m�3 agrees with reported values in the NorthPacific (1.0e1.7 Bq m�3) in previous works (Buesseler et al., 2012;Inoue et al., 2012; Kameník et al., 2013; Kofuji and Inoue, 2013;Ramzaev et al., 2014).
3.2. Activity concentration in surface water
In winter 2012, the Fukushima-derived 134Cs activity concen-tration in surface seawater along approximately 149 �E was highest(more than 20 Bq m�3) in the transition region between 35 �N and40 �N (Fig. 3). In the adjacent subarctic and subtropical regions theactivity concentration decreased sharply at greater distances fromthe FNPP1. This latitudinal distributionwasmainly derived from thedirect discharge of contaminatedwater from the FNPP1 (Kumamotoet al., 2014). At stations in the south of 25 �Nand at 42 �N, the activityconcentration in surfacewater less than 1 Bqm�3was detected. Thewidespread distribution of Fukushima-derived 134Cs from 42 �N to4 �S in the North Pacific Ocean can be attributed to atmosphericdeposition. In an atmospheric model simulation, the Fukushima-derived 134Cs spread to the tropical region (Kobayashi et al., 2013).However, to the south of 20 �N, 134Cs was detected only in surfacewaters collected using the bucket, which is unlikely becauseseawater in surface mixed layer (to approximately 200 m depth) iswell mixed vertically. It is implied that a little radioactive contam-ination on the bucket during the cruise (Kumamoto et al., 2014).
The bomb-derived 137Cs in surface seawater ranged between 0.4and 2.2 Bq m�3 (Fig. 3) in winter 2012. The mean value in the
tropical region south of 12 �N and the subtropical region between12 �N and 35 �N were 1.2 ± 0.2 Bq m�3 (n ¼ 9) and 1.5 ± 0.1 Bq m�3
(n ¼ 17), respectively. In the transition and subarctic regions northof the Kuroshio Extension, the mean value of 1.1 ± 0.5 Bq m�3
(n¼ 12) coincides with those in the tropical and subtropical regionswithin the error range. Small spatial variation in the activity con-centration in surface water was also observed in the 2000s(Aoyama et al., 2012a). As a result, the bomb-derived 137Cs activityconcentration was higher (lower) than the Fukushima-derived134Cs activity concentration at most stations in the tropical andsubtropical (transition and subarctic) regions south (north) of theKuroshio Extension Current, suggesting larger impact of the direct-discharged contaminated water on the radiocesium activity con-centration in the western North Pacific Ocean.
In June 2005, about 6 y before the FNPP1 accident, we alsomeasured 137Cs activity concentration in surface waters collected atstations between 15 �N and 22 �N along 149 �E meridian. Activityconcentration of 137Cs in surface water in 2005 ranged from 1.7 to2.5 Bq m�3. During the past several decades, 137Cs activity con-centration in the surface seawater in the open ocean has decreased(Hirose and Aoyama, 2003; Inomata et al., 2009; Povinec et al.,2005) at an apparent rate (or half-life) of about 2e10%/y (i.e, ahalf-life of 5e30 y). This apparent half-life, which is shorter thanthat due to radioactive decay (30.04 y), suggests that the surface137Cs has been diluted by mixing of the surface water with deeperwater inwhich the 137Cs activity concentration is low. For the NorthPacific Ocean, the apparent half-life of 137Cs in surface water hasbeen calculated to be 13 ± 1 y (Povinec et al., 2005). We correctedthe activity concentrations of 137Cs in surface water obtained in2005 to the date of the FNPP1 accident by using this apparent half-life of 13 ± 1 y and obtained good agreement between the decay-corrected 137Cs activity concentrations in 2005 (open triangles inFig. 3) and the bomb-derived 137Cs in winter 2012. This agreementvalidates that the bomb-derived 137Cs calculated corresponds to137Cs just before the FNPP1 accident.
3.3. Vertical distribution and water-column inventory
Vertical profiles of the Fukushima-derived 134Cs activity con-centration in winter 2012 are shown in Fig. 4. The activity con-centration in the surface mixed layer (to approximately 200 m
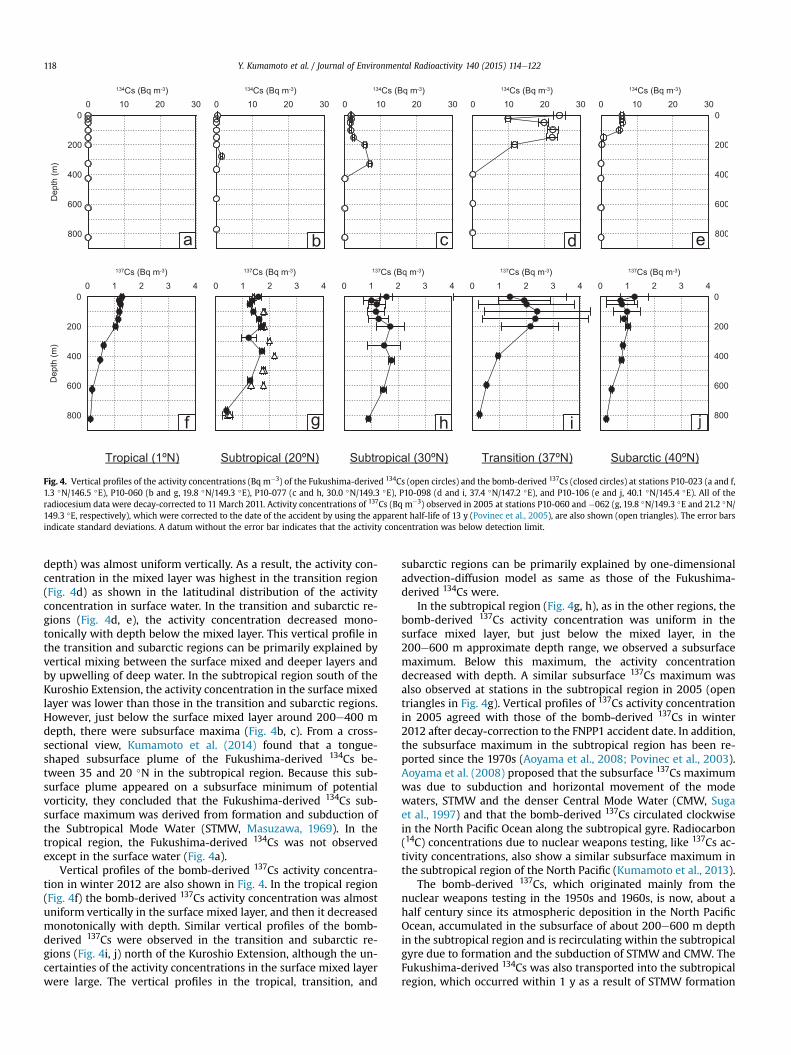
Fig. 4. Vertical profiles of the activity concentrations (Bq m�3) of the Fukushima-derived 134Cs (open circles) and the bomb-derived 137Cs (closed circles) at stations P10-023 (a and f,1.3 �N/146.5 �E), P10-060 (b and g, 19.8 �N/149.3 �E), P10-077 (c and h, 30.0 �N/149.3 �E), P10-098 (d and i, 37.4 �N/147.2 �E), and P10-106 (e and j, 40.1 �N/145.4 �E). All of theradiocesium data were decay-corrected to 11 March 2011. Activity concentrations of 137Cs (Bq m�3) observed in 2005 at stations P10-060 and �062 (g, 19.8 �N/149.3 �E and 21.2 �N/149.3 �E, respectively), which were corrected to the date of the accident by using the apparent half-life of 13 y (Povinec et al., 2005), are also shown (open triangles). The error barsindicate standard deviations. A datum without the error bar indicates that the activity concentration was below detection limit.
Y. Kumamoto et al. / Journal of Environmental Radioactivity 140 (2015) 114e122118
depth) was almost uniform vertically. As a result, the activity con-centration in the mixed layer was highest in the transition region(Fig. 4d) as shown in the latitudinal distribution of the activityconcentration in surface water. In the transition and subarctic re-gions (Fig. 4d, e), the activity concentration decreased mono-tonically with depth below the mixed layer. This vertical profile inthe transition and subarctic regions can be primarily explained byvertical mixing between the surface mixed and deeper layers andby upwelling of deep water. In the subtropical region south of theKuroshio Extension, the activity concentration in the surface mixedlayer was lower than those in the transition and subarctic regions.However, just below the surface mixed layer around 200e400 mdepth, there were subsurface maxima (Fig. 4b, c). From a cross-sectional view, Kumamoto et al. (2014) found that a tongue-shaped subsurface plume of the Fukushima-derived 134Cs be-tween 35 and 20 �N in the subtropical region. Because this sub-surface plume appeared on a subsurface minimum of potentialvorticity, they concluded that the Fukushima-derived 134Cs sub-surface maximum was derived from formation and subduction ofthe Subtropical Mode Water (STMW, Masuzawa, 1969). In thetropical region, the Fukushima-derived 134Cs was not observedexcept in the surface water (Fig. 4a).
Vertical profiles of the bomb-derived 137Cs activity concentra-tion in winter 2012 are also shown in Fig. 4. In the tropical region(Fig. 4f) the bomb-derived 137Cs activity concentration was almostuniform vertically in the surface mixed layer, and then it decreasedmonotonically with depth. Similar vertical profiles of the bomb-derived 137Cs were observed in the transition and subarctic re-gions (Fig. 4i, j) north of the Kuroshio Extension, although the un-certainties of the activity concentrations in the surface mixed layerwere large. The vertical profiles in the tropical, transition, and
subarctic regions can be primarily explained by one-dimensionaladvection-diffusion model as same as those of the Fukushima-derived 134Cs were.
In the subtropical region (Fig. 4g, h), as in the other regions, thebomb-derived 137Cs activity concentration was uniform in thesurface mixed layer, but just below the mixed layer, in the200e600 m approximate depth range, we observed a subsurfacemaximum. Below this maximum, the activity concentrationdecreased with depth. A similar subsurface 137Cs maximum wasalso observed at stations in the subtropical region in 2005 (opentriangles in Fig. 4g). Vertical profiles of 137Cs activity concentrationin 2005 agreed with those of the bomb-derived 137Cs in winter2012 after decay-correction to the FNPP1 accident date. In addition,the subsurface maximum in the subtropical region has been re-ported since the 1970s (Aoyama et al., 2008; Povinec et al., 2003).Aoyama et al. (2008) proposed that the subsurface 137Cs maximumwas due to subduction and horizontal movement of the modewaters, STMW and the denser Central Mode Water (CMW, Sugaet al., 1997) and that the bomb-derived 137Cs circulated clockwisein the North Pacific Ocean along the subtropical gyre. Radiocarbon(14C) concentrations due to nuclear weapons testing, like 137Cs ac-tivity concentrations, also show a similar subsurface maximum inthe subtropical region of the North Pacific (Kumamoto et al., 2013).
The bomb-derived 137Cs, which originated mainly from thenuclear weapons testing in the 1950s and 1960s, is now, about ahalf century since its atmospheric deposition in the North PacificOcean, accumulated in the subsurface of about 200e600 m depthin the subtropical region and is recirculating within the subtropicalgyre due to formation and the subduction of STMW and CMW. TheFukushima-derived 134Cs was also transported into the subtropicalregion, which occurred within 1 y as a result of STMW formation
Y. Kumamoto et al. / Journal of Environmental Radioactivity 140 (2015) 114e122 119
and subduction around 200e400 m depth (Kaeriyama et al., 2014;Kumamoto et al., 2014). The shallower penetration of theFukushima-derived 134Cs than the bomb-derived 137Cs was derivedfrom slower advection speed of denser CMW. The Fukushima-derived 134Cs activity concentration was still high in the transi-tion region than in other regions because of the direct discharge ofcontaminated water from the FNPP1, which is located at 37.4 �N(Fig. 1). The behavior of the bomb-derived 137Cs in past decadessuggests that the Fukushima-derived 134Cs will become concen-trated in the subtropical region due to formation of the mode wa-ters (Kumamoto et al., 2014).
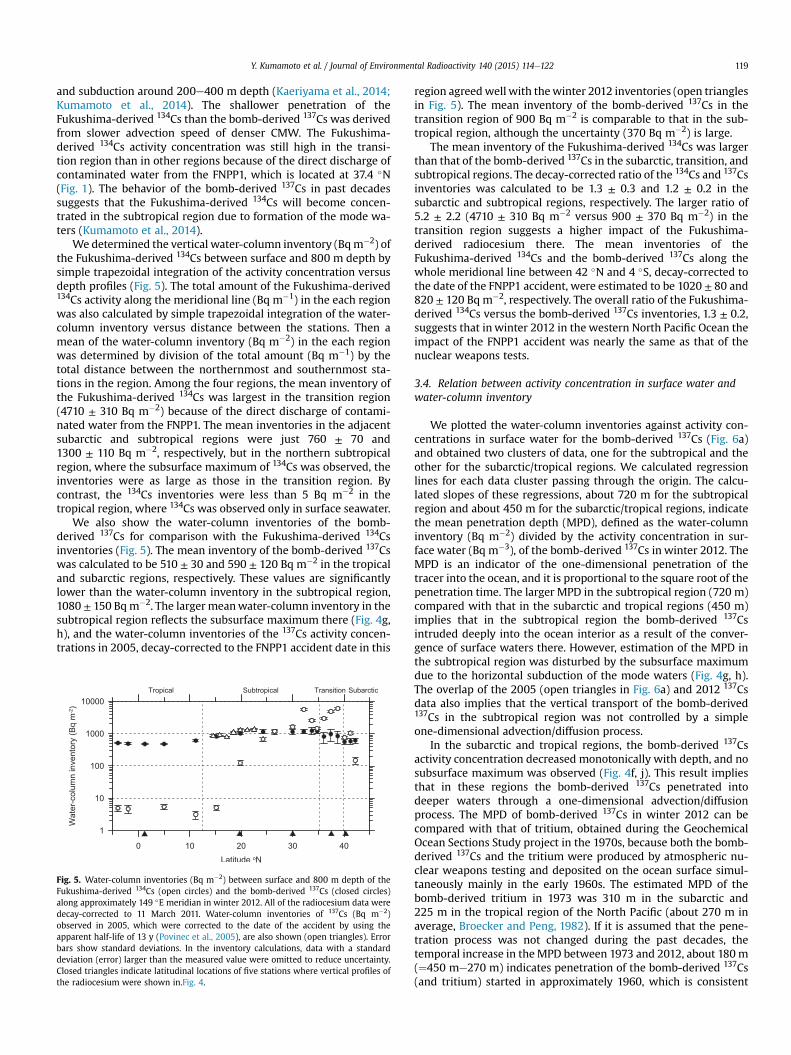
We determined the vertical water-column inventory (Bqm�2) ofthe Fukushima-derived 134Cs between surface and 800 m depth bysimple trapezoidal integration of the activity concentration versusdepth profiles (Fig. 5). The total amount of the Fukushima-derived134Cs activity along the meridional line (Bq m�1) in the each regionwas also calculated by simple trapezoidal integration of the water-column inventory versus distance between the stations. Then amean of the water-column inventory (Bq m�2) in the each regionwas determined by division of the total amount (Bq m�1) by thetotal distance between the northernmost and southernmost sta-tions in the region. Among the four regions, the mean inventory ofthe Fukushima-derived 134Cs was largest in the transition region(4710 ± 310 Bq m�2) because of the direct discharge of contami-nated water from the FNPP1. The mean inventories in the adjacentsubarctic and subtropical regions were just 760 ± 70 and1300 ± 110 Bq m�2, respectively, but in the northern subtropicalregion, where the subsurface maximum of 134Cs was observed, theinventories were as large as those in the transition region. Bycontrast, the 134Cs inventories were less than 5 Bq m�2 in thetropical region, where 134Cs was observed only in surface seawater.
We also show the water-column inventories of the bomb-derived 137Cs for comparison with the Fukushima-derived 134Csinventories (Fig. 5). The mean inventory of the bomb-derived 137Cswas calculated to be 510 ± 30 and 590 ± 120 Bq m�2 in the tropicaland subarctic regions, respectively. These values are significantlylower than the water-column inventory in the subtropical region,1080 ± 150 Bqm�2. The larger meanwater-column inventory in thesubtropical region reflects the subsurface maximum there (Fig. 4g,h), and the water-column inventories of the 137Cs activity concen-trations in 2005, decay-corrected to the FNPP1 accident date in this
Fig. 5. Water-column inventories (Bq m�2) between surface and 800 m depth of theFukushima-derived 134Cs (open circles) and the bomb-derived 137Cs (closed circles)along approximately 149 �E meridian in winter 2012. All of the radiocesium data weredecay-corrected to 11 March 2011. Water-column inventories of 137Cs (Bq m�2)observed in 2005, which were corrected to the date of the accident by using theapparent half-life of 13 y (Povinec et al., 2005), are also shown (open triangles). Errorbars show standard deviations. In the inventory calculations, data with a standarddeviation (error) larger than the measured value were omitted to reduce uncertainty.Closed triangles indicate latitudinal locations of five stations where vertical profiles ofthe radiocesium were shown in.Fig. 4.
region agreedwell with thewinter 2012 inventories (open trianglesin Fig. 5). The mean inventory of the bomb-derived 137Cs in thetransition region of 900 Bq m�2 is comparable to that in the sub-tropical region, although the uncertainty (370 Bq m�2) is large.
The mean inventory of the Fukushima-derived 134Cs was largerthan that of the bomb-derived 137Cs in the subarctic, transition, andsubtropical regions. The decay-corrected ratio of the 134Cs and 137Csinventories was calculated to be 1.3 ± 0.3 and 1.2 ± 0.2 in thesubarctic and subtropical regions, respectively. The larger ratio of5.2 ± 2.2 (4710 ± 310 Bq m�2 versus 900 ± 370 Bq m�2) in thetransition region suggests a higher impact of the Fukushima-derived radiocesium there. The mean inventories of theFukushima-derived 134Cs and the bomb-derived 137Cs along thewhole meridional line between 42 �N and 4 �S, decay-corrected tothe date of the FNPP1 accident, were estimated to be 1020 ± 80 and820 ± 120 Bq m�2, respectively. The overall ratio of the Fukushima-derived 134Cs versus the bomb-derived 137Cs inventories, 1.3 ± 0.2,suggests that inwinter 2012 in the western North Pacific Ocean theimpact of the FNPP1 accident was nearly the same as that of thenuclear weapons tests.
3.4. Relation between activity concentration in surface water andwater-column inventory
We plotted the water-column inventories against activity con-centrations in surface water for the bomb-derived 137Cs (Fig. 6a)and obtained two clusters of data, one for the subtropical and theother for the subarctic/tropical regions. We calculated regressionlines for each data cluster passing through the origin. The calcu-lated slopes of these regressions, about 720 m for the subtropicalregion and about 450 m for the subarctic/tropical regions, indicatethe mean penetration depth (MPD), defined as the water-columninventory (Bq m�2) divided by the activity concentration in sur-face water (Bq m�3), of the bomb-derived 137Cs in winter 2012. TheMPD is an indicator of the one-dimensional penetration of thetracer into the ocean, and it is proportional to the square root of thepenetration time. The larger MPD in the subtropical region (720 m)compared with that in the subarctic and tropical regions (450 m)implies that in the subtropical region the bomb-derived 137Csintruded deeply into the ocean interior as a result of the conver-gence of surface waters there. However, estimation of the MPD inthe subtropical region was disturbed by the subsurface maximumdue to the horizontal subduction of the mode waters (Fig. 4g, h).The overlap of the 2005 (open triangles in Fig. 6a) and 2012 137Csdata also implies that the vertical transport of the bomb-derived137Cs in the subtropical region was not controlled by a simpleone-dimensional advection/diffusion process.
In the subarctic and tropical regions, the bomb-derived 137Csactivity concentration decreased monotonically with depth, and nosubsurface maximum was observed (Fig. 4f, j). This result impliesthat in these regions the bomb-derived 137Cs penetrated intodeeper waters through a one-dimensional advection/diffusionprocess. The MPD of bomb-derived 137Cs in winter 2012 can becompared with that of tritium, obtained during the GeochemicalOcean Sections Study project in the 1970s, because both the bomb-derived 137Cs and the tritium were produced by atmospheric nu-clear weapons testing and deposited on the ocean surface simul-taneously mainly in the early 1960s. The estimated MPD of thebomb-derived tritium in 1973 was 310 m in the subarctic and225 m in the tropical region of the North Pacific (about 270 m inaverage, Broecker and Peng, 1982). If it is assumed that the pene-tration process was not changed during the past decades, thetemporal increase in theMPD between 1973 and 2012, about 180m(¼450 me270 m) indicates penetration of the bomb-derived 137Cs(and tritium) started in approximately 1960, which is consistent
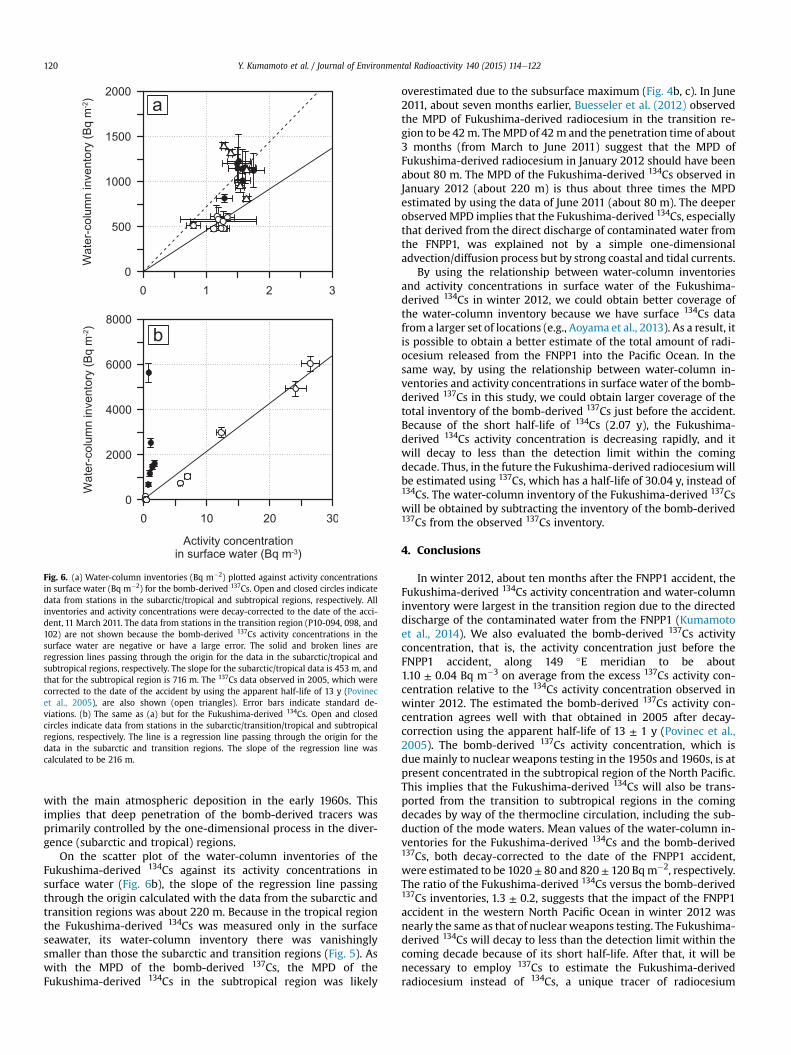
Fig. 6. (a) Water-column inventories (Bq m�2) plotted against activity concentrationsin surface water (Bq m�2) for the bomb-derived 137Cs. Open and closed circles indicatedata from stations in the subarctic/tropical and subtropical regions, respectively. Allinventories and activity concentrations were decay-corrected to the date of the acci-dent, 11 March 2011. The data from stations in the transition region (P10-094, 098, and102) are not shown because the bomb-derived 137Cs activity concentrations in thesurface water are negative or have a large error. The solid and broken lines areregression lines passing through the origin for the data in the subarctic/tropical andsubtropical regions, respectively. The slope for the subarctic/tropical data is 453 m, andthat for the subtropical region is 716 m. The 137Cs data observed in 2005, which werecorrected to the date of the accident by using the apparent half-life of 13 y (Povinecet al., 2005), are also shown (open triangles). Error bars indicate standard de-viations. (b) The same as (a) but for the Fukushima-derived 134Cs. Open and closedcircles indicate data from stations in the subarctic/transition/tropical and subtropicalregions, respectively. The line is a regression line passing through the origin for thedata in the subarctic and transition regions. The slope of the regression line wascalculated to be 216 m.
Y. Kumamoto et al. / Journal of Environmental Radioactivity 140 (2015) 114e122120
with the main atmospheric deposition in the early 1960s. Thisimplies that deep penetration of the bomb-derived tracers wasprimarily controlled by the one-dimensional process in the diver-gence (subarctic and tropical) regions.
On the scatter plot of the water-column inventories of theFukushima-derived 134Cs against its activity concentrations insurface water (Fig. 6b), the slope of the regression line passingthrough the origin calculated with the data from the subarctic andtransition regions was about 220 m. Because in the tropical regionthe Fukushima-derived 134Cs was measured only in the surfaceseawater, its water-column inventory there was vanishinglysmaller than those the subarctic and transition regions (Fig. 5). Aswith the MPD of the bomb-derived 137Cs, the MPD of theFukushima-derived 134Cs in the subtropical region was likely
overestimated due to the subsurface maximum (Fig. 4b, c). In June2011, about seven months earlier, Buesseler et al. (2012) observedthe MPD of Fukushima-derived radiocesium in the transition re-gion to be 42m. TheMPD of 42m and the penetration time of about3 months (from March to June 2011) suggest that the MPD ofFukushima-derived radiocesium in January 2012 should have beenabout 80 m. The MPD of the Fukushima-derived 134Cs observed inJanuary 2012 (about 220 m) is thus about three times the MPDestimated by using the data of June 2011 (about 80 m). The deeperobservedMPD implies that the Fukushima-derived 134Cs, especiallythat derived from the direct discharge of contaminated water fromthe FNPP1, was explained not by a simple one-dimensionaladvection/diffusion process but by strong coastal and tidal currents.
By using the relationship between water-column inventoriesand activity concentrations in surface water of the Fukushima-derived 134Cs in winter 2012, we could obtain better coverage ofthe water-column inventory because we have surface 134Cs datafrom a larger set of locations (e.g., Aoyama et al., 2013). As a result, itis possible to obtain a better estimate of the total amount of radi-ocesium released from the FNPP1 into the Pacific Ocean. In thesame way, by using the relationship between water-column in-ventories and activity concentrations in surface water of the bomb-derived 137Cs in this study, we could obtain larger coverage of thetotal inventory of the bomb-derived 137Cs just before the accident.Because of the short half-life of 134Cs (2.07 y), the Fukushima-derived 134Cs activity concentration is decreasing rapidly, and itwill decay to less than the detection limit within the comingdecade. Thus, in the future the Fukushima-derived radiocesiumwillbe estimated using 137Cs, which has a half-life of 30.04 y, instead of134Cs. The water-column inventory of the Fukushima-derived 137Cswill be obtained by subtracting the inventory of the bomb-derived137Cs from the observed 137Cs inventory.
4. Conclusions
In winter 2012, about ten months after the FNPP1 accident, theFukushima-derived 134Cs activity concentration and water-columninventory were largest in the transition region due to the directeddischarge of the contaminated water from the FNPP1 (Kumamotoet al., 2014). We also evaluated the bomb-derived 137Cs activityconcentration, that is, the activity concentration just before theFNPP1 accident, along 149 �E meridian to be about1.10 ± 0.04 Bq m�3 on average from the excess 137Cs activity con-centration relative to the 134Cs activity concentration observed inwinter 2012. The estimated the bomb-derived 137Cs activity con-centration agrees well with that obtained in 2005 after decay-correction using the apparent half-life of 13 ± 1 y (Povinec et al.,2005). The bomb-derived 137Cs activity concentration, which isdue mainly to nuclear weapons testing in the 1950s and 1960s, is atpresent concentrated in the subtropical region of the North Pacific.This implies that the Fukushima-derived 134Cs will also be trans-ported from the transition to subtropical regions in the comingdecades by way of the thermocline circulation, including the sub-duction of the mode waters. Mean values of the water-column in-ventories for the Fukushima-derived 134Cs and the bomb-derived137Cs, both decay-corrected to the date of the FNPP1 accident,were estimated to be 1020 ± 80 and 820 ± 120 Bqm�2, respectively.The ratio of the Fukushima-derived 134Cs versus the bomb-derived137Cs inventories, 1.3 ± 0.2, suggests that the impact of the FNPP1accident in the western North Pacific Ocean in winter 2012 wasnearly the same as that of nuclear weapons testing. The Fukushima-derived 134Cs will decay to less than the detection limit within thecoming decade because of its short half-life. After that, it will benecessary to employ 137Cs to estimate the Fukushima-derivedradiocesium instead of 134Cs, a unique tracer of radiocesium
Y. Kumamoto et al. / Journal of Environmental Radioactivity 140 (2015) 114e122 121
released by the FNPP1 accident. Knowledge of the bomb-derived137Cs activity concentration will be essential to evaluation of thetotal amount of Fukushima-derived 137Cs activity concentration.
Acknowledgments
We thank the crew of the R/V Mirai and the staff of MarineWorks Japan, Ltd. for their help during onboard sample collection.This work was partially supported by a Grant-in-Aid for ScientificResearch on Innovative Areas from the Ministry of Education, Cul-ture, Sports, Science and Technology of Japan (KAKENHI), Inter-disciplinary Study on Environmental Transfer of Radionuclidesfrom the Fukushima Dai-ichi NPP Accident (#24110005).
Appendix A. Supplementary data
Supplementary data related to this article can be found at http://dx.doi.org/10.1016/j.jenvrad.2014.11.010.
References
Aoyama, M., Hirose, K., 2008. Radiometric determination of anthropogenic radio-nuclides in seawater. In: Povinec, P.P. (Ed.), Analysis of Environmental Radio-nuclides, Radioactivity in the Environment, vol. 2. Elsevier, Amsterdam, London,pp. 137e162.
Aoyama, M., Hirose, K., Igarashi, Y., 2006. Re-construction and updating our un-derstanding on the global weapons tests 137Cs fallout. J. Environ. Monit. 8,431e438.
Aoyama, M., Hirose, K., Nemoto, K., Takatsuki, Y., Tsumune, D., 2008. Water masseslabeled with global fallout 137Cs formed by subduction in the North Pacific.Geophys. Res. Lett. 35, L01604. http://dx.doi.org/10.1029/2007GL031964.
Aoyama, M., Tsumune, D., Hamajima, Y., 2012a. Distribution of 137Cs and 134Cs in theNorth Pacific Ocean: impacts of the TEPCO Fukushima-Daiichi NPP accident.J. Radioanal. Nucl. Chem. 296, 535e539.
Aoyama, M., Tsumune, D., Uematsu, M., Kondo, F., Hamajima, Y., 2012b. Temporalvariation of 134Cs and 137Cs activities in surface water at stations along thecoastline near the Fukushima Dai-ichi nuclear power plant accident site. Jpn.Geochem. J. 46, 321e325.
Aoyama, M., Uematsu, M., Tsumune, D., Hamajima, Y., 2013. Surface pathway ofradioactive plume of TEPCO Fukushima NPP1 released 134Cs and 137Cs. Bio-geosciences 10, 3067e3078.
Bailly du Bois, P., Laguionie, P., Boust, D., Korsakissok, I., Didier, D., Fi�evet, B., 2012.Estimation of marine source-term following Fukushima Dai-ichi accident.J. Environ. Radioact. 114, 2e9.
Broecker, W.S., Peng, T.-H., 1982. Tracers in the Sea. Lamont-Doherty GeologicalObservatory Palisades, New York.
Buesseler, K.O., Jayne, S.R., Fisher, N.S., Rypina, I.I., Baumann, H., Baumann, Z.,Breier, C.F., Douglass, E.M., George, J., Macdonald, A.M., Miyamoto, H.,Nishikawa, J., Pike, S.M., Yoshida, S., 2012. Fukushima-derived radionuclides inthe ocean and biota off Japan. Proc. Natl. Acad. Sci. U. S. A. 109, 5984e5988.
Charette, M.A., Breier, C.F., Henderson, P.B., Pike, S.M., Rypina, I.I., Jayne, S.R.,Buesseler, K.O., 2013. Radium-based estimates of cesium isotope transport andtotal direct ocean discharges from the Fukushima nuclear power plant accident.Biogeosciences 10, 2159e2167.
Estournel, C., Bosc, E., Bocquet, M., Ulses, C., Marsaleix, P., Winiarek, V., Osvath, I.,Nguyen, C., Duhaut, T., Lyard, F., Michaud, H., Auclair, F., 2012. Assessment of theamount of Cesium-137 released into the Pacific Ocean after the Fukushimaaccident and analysis of its dispersion in Japanese coastal waters. J. Geophys.Res. 117, C11014. http://dx.doi.org/10.1029/2012JC007933.
Hamajima, Y., Komura, K., 2004. Background components of Ge detectors in Ogoyaunderground laboratory. Appl. Radiat. Isot. 61, 179e183.
Hirose, K., Aoyama, M., 2003. Analysis of 137Cs and239,240Pu concentrations in sur-
face waters of the Pacific Ocean. Deep-Sea Res. II 50, 2675e2700.Honda, C.M., Aono, T., Aoyama, M., Hamajima, Y., Kawakami, H., Kitamura, M.,
Masumoto, Y., Miyazawa, Y., Takigawa, M., Saino, T., 2012. Dispersion of artificialcaesium-134 and -137 in the western North Pacific one month after theFukushima accident. Geochem. J. 46, e1ee9.
Inomata, Y., Aoyama, M., Hirose, K., 2009. Analysis of 50-y record of surface 137Csconcentrations in the global ocean using the HAM-global database. J. Environ.Monit. 11, 116e125.
Inoue, M., Kofuji, H., Hamajima, Y., Nagao, S., Yoshida, K., Yamamoto, M., 2012. 134Csand 137Cs activities in coastal seawater along Northern Sanriku and TsugaruStrait, northeastern Japan, after Fukushima Dai-ichi nuclear power plant acci-dent. J. Environ. Radioact. 111, 116e119.
International Atomic Energy Agency, 2011. Certified Reference Materials forRadioactivity Measurements in Environmental Samples of Soil and Water: N-444 and IAEA-445, IAEA Analytical Quality in Nuclear Applications Series No. 21(IAEA/AQ/21). IAEA, Vienna, p. 19.
Kaeriyama, H., Ambe, D., Shimizu, Y., Fujimoto, K., Ono, T., Yonezaki, S., Kato, Y.,Matsunaga, H., Minami, H., Nakatsuka, S., Watanabe, T., 2013. Direct observationof 134Cs and 137Cs in surface seawater in the western and central North Pacificafter the Fukushima Dai-ichi nuclear power plant accident. Biogeosciences 10,4287e4295.
Kaeriyama, H., Shimizu, Y., Ambe, D., Masujima, M., Shigenobu, Y., Fujimoto, K.,Ono, T., Nishiuchi, K., Taneda, T., Kurogi, H., Setou, T., Sugisaki, H., Ichikawa, T.,Hidaka, K., Hiroe, Y., Kusaka, A., Kodama, T., Kuriyama, M., Morita, H., Nakata, K.,Morinaga, K., Morita, T., Watanabe, T., 2014. Southwest intrusion of 134Cs and137Cs derived from the Fukushima Dai-ichi nuclear power plant accident in thewestern North Pacific. Environ. Sci. Technol. 48, 3120e3127.
Kameník, J., Dulaiova, H., Buesseler, K.O., Pike, S.M., �St’astn�a, K., 2013. Cesium-134and 137 activities in the central North Pacific Ocean after the Fukushima Dai-ichi nuclear power plant accident. Biogeosciences 10, 6045e6052.
Karasev, E.V., 2012. Monitoring of ecological conditions of the Far East Seas. In:Amur-Okhotsk Consortium (Ed.), Proceedings of the 2nd International Meetingof Amur-Okhotsk Consortium. Amur-Okhotsk Consortium, Sapporo, pp. 75e80.
Kawamura, H., Kobayashi, T., Furuno, A., In, T., Ishikawa, Y., Nakayama, T., Shima, S.,Awaji, T., 2011. Preliminary numerical experiments on oceanic dispersion of 131Iand 137Cs discharged into the ocean because of the Fukushima Daiichi nuclearpower plant disaster. J. Nucl. Sci. Technol. 48, 1349e1356.
Kobayashi, T., Nagai, H., Chino, M., Kawamura, H., 2013. Source term estimation ofatmospheric release due to the Fukushima Dai-ichi nuclear power plant accidentby atmospheric and oceanic dispersion simulations. J. Nucl. Sci. Tech. 50, 255e264.
Kofuji, H., Inoue, M., 2013. Temporal variations in 134Cs and 137Cs concentrations inseawater along the Shimokita Peninsula and the northern Sanriku coast innortheastern Japan, one year after the Fukushima Dai-ichi nuclear power plantaccident. J. Environ. Radioact. 124, 239e245.
Kumamoto, Y., Murata, A., Kawano, T., Watanabe, S., Fukasawa, M., 2013. Decadalchanges in bomb-produced radiocarbon in the Pacific Ocean from the 1990s to2000s. Radiocarbon 55, 1641e1650.
Kumamoto, Y., Aoyama, M., Hamajima, Y., Aono, T., Kouketsu, S., Murata, A.,Kawano, T., 2014. Southward spreading of the Fukushima-derived radiocesiumacross the Kuroshio extension in the North Pacific. Sci. Rep. 4, 4276. http://dx.doi.org/10.1038/srep04276.
Masuzawa, J., 1969. Subtropical mode water. Deep-Sea Res. 16, 463e472.Miyazawa, Y., Masumoto, Y., Varlamov, S.M., Miyama, T., Takigawa, M., Honda, M.,
Saino, T., 2013. Inverse estimation of source parameters of oceanic radioactivitydispersion models associated with the Fukushima accident. Biogeosciences 10,2349e2363.
Morino, Y., Ohara, T., Nishizawa, M., 2011. Atmospheric behavior, deposition, andbudget of radioactive materials from the Fukushima Daiichi nuclear powerplant in March 2011. Geophys. Res. Lett. 38, L00G11. http://dx.doi.org/10.1029/2011GL048689.
Morino, Y., Ohara, T., Watanabe, M., Hayashi, S., Nishizawa, M., 2013. Episodeanalysis of deposition of radiocesium from the Fukushima Daiichi nuclear po-wer plant accident. Environ. Sci. Technol. 47, 2314e2322.
Nair, R.N., Sunny, F., Chopra, M., Sharma, L.K., Puranik, V.D., Ghosh, A.K., 2014.Estimation of radioactive leakages into the Pacific Ocean due to Fukushimanuclear accident. Environ. Earth Sci. 71, 1007e1019.
Nishihara, K., Yamagishi, I., Yasuda, K., Ishimori, K., Tanaka, K., Kuno, T., Inada, S.,Gotoh, Y., 2012. Radionuclide release to stagnant water in Fukushima-1 nuclearpower plant. Trans. Atomic Energy Soc. Jpn. 11, 13e19 (in Japanese).
Nuclear Regulation Authority, 2011. Monitoring Information of EnvironmentalRadioactivity Level_Readings of Sea Area Monitoring. http://radioactivity.nsr.go.jp/en/list/205/list-1.html (accessed 01.07.14.).
Nuclear Regulation Authority, 2012. Establishment of the Base for Taking Measuresfor Environmental Impact of Radioactive Substancesdstudy of the Distributionof Radioactive Substances, Supported by the Strategic Funds for the Promotionof Science and Technology (in Japanese, accessed 01.07.14.). http://radioactivity.nsr.go.jp/ja/contents/6000/5235/view.html.
Oikawa, S., Takata, H., Watabe, T., Misonoo, J., Kusakabe, M., 2013. Distribution of theFukushima-derived radionuclides in seawater in the Pacific off the coast ofMiyagi,Fukushima, and Ibaraki Prefectures, Japan. Biogeosciences 10, 5031e5047.
Pham, M.K., Betti, M., Povinec, P.P., Benmansour, M., Bünger, V., Drefvelin, J.,Engeler, C., Flemal, J.M., Gasc�o, C., Guillevic, J., Gurriaran, R., Groening, M.,Happel, D.J., Herrmann, J., Klemola, S., Kloster, M., Kanisch, G., Leonard, K.,Long, S., Nielsen, Oh, J.-S., Rieth, P.U., €Ostergren, I., Pettersson, H., Pinhao, N.,Pujol, L., Sato, K., Schikowski, J., Varga, Z., Vartti, V.P., Zheng, J., 2011. A certifiedreference material for radionuclides in the water sample from Irish Sea (IAEA-443). J. Radioanal. Nucl. Chem. 288, 603e611.
Povinec, P.P., Livingston, H.D., Shima, S., Aoyama, M., Gastaud, J., Goroncy, I.,Hirose, K., Huynh-Ngoc, L., Ikeuchi, Y., Ito, T., Rosa, J.L., Kwong, L.L.W., Lee, S.-H.,Moriya, H., Mulsow, S., Oregioni, B., Pettersson, H., Togawa, O., 2003. IAEA'97expedition to the NW Pacific Oceandresults of oceanographic and radionuclideinvestigations of the water column. Deep-Sea Res. II 50, 2607e2637.
Povinec, P.P., Aarkrog, A., Buesseler, K.O., Delfanti, R., Hirose, K., Hong, G.H., Ito, T.,Livingston, H.D., Nies, H., Noshkin, V.E., Shima, S., Togawa, O., 2005. 90Sr, 137Csand
239,240Pu concentration surface water time series in the Pacific and Indian
Oceans e WOMARS results. J. Environ. Radioact. 81, 63e87.Povinec, P.P., Aoyama, M., Biddulph, D., Breier, R., Buesseler, K., Chang, C.C.,
Golser, R., Hou, X.L., Je�skovsky, M., Jull, A.J.T., Kaizer, J., Nakano, M., Nies, H.,Palcsu, L., Papp, L., Pham, M.K., Steier, P., Zhang, L.Y., 2013. Cesium, iodine andtritium in NW Pacific waters e a comparison of the Fukushima impact withglobal fallout. Biogeosciences 10, 5481e5496.

Y. Kumamoto et al. / Journal of Environmental Radioactivity 140 (2015) 114e122122
Prime Minister of Japan and His Cabinet, 2011. Report of Japanese Government tothe IAEA Ministerial Conference on Nuclear Safety e the Accident at TEPCO'sFukushima Nuclear Power Stations e. http://www.kantei.go.jp/foreign/kan/topics/201106/iaea_houkokusho_e.html (accessed 01.07.14.).
Ramzaev, V., Nikitin, A., Sevastyanov, A., Artemiev, G., Bruk, G., Ivanov, S., 2014.Shipboard determination of radiocesium in seawater after the Fukushima ac-cident: results from the 2011e2012 Russian expeditions to the Sea of Japan andwestern North Pacific Ocean. J. Environ. Radioact. 135, 13e24.
Rypina, I.I., Jayne, S.R., Yoshida, S., Macdonald, A.M., Douglass, E., Buesseler, K., 2013.Short-term dispersal of Fukushima-derived radionuclides off Japan: modelingefforts and model-data intercomparison. Biogeosciences 10, 4973e4990.
Schlitzer, R., 2014. Ocean Data View. http://odv.awi.de (accessed 01.07.14.).Stohl, A., Seibert, P., Wotawa, G., Arnold, D., Burkhart, J.F., Eckhardt, S., Tapia, C.,
Vargas, A., Yasunari, T.J., 2012. Xenon-133 and caesium-137 releases into the
atmosphere from the Fukushima Dai-ichi nuclear power plant: determinationof the source term, atmospheric dispersion, and deposition. Atmos. Chem. Phys.12, 2313e2343.
Suga, T., Takei, Y., Hanawa, K., 1997. Thermostad distribution in the North Pacificsubtropical gyre: the central mode water and the subtropical mode water.J. Phys. Oceanogr. 27, 140e152.
Tokyo Electric Power Company, 2011. Press Releases. http://www.tepco.co.jp/en/press/corp-com/release/index1103-e.html (accessed 01.07.14.).
Tsumune, D., Tsubono, T., Aoyama, M., Hirose, K., 2012. Distribution of oceanic 137Csfrom the Fukushima Daiichi nuclear power plant simulated numerically by aregional ocean model. J. Environ. Radioact. 111, 100e108.
Yoshida, N., Kanda, J., 2012. Tracking the Fukushima radionuclides. Science 336,1115e1116.