impact of current occupant behaviour on potential carbon ... · 3.2 trnsys thermal modelling in...
TRANSCRIPT
CIBSE ASHRAE Technical Symposium, Dublin, Ireland, 3-4 April 2014
Page 1 of 12
Impact of current occupant behaviour on potential carbon savings in a council
owned tower block undergoing retrofit
T. Dimitriou1 MSc, D. Teli1* PhD, P.A.B. James1 PhD FCIBSE, A. Bahaj1 PhD CPhys MInstP FICE FRSA, L. Ellison2 BSc Sp Hons MA CMLI, A. Waggott2 BSc
1 Sustainable Energy Research Group, Faculty of Engineering and the Environment, University of Southampton, Southampton SO17 1BJ, United Kingdom
2Portsmouth City Council, Hampshire * Corresponding author. Tel: +44 (0)2380592174, E-mail: [email protected]
Abstract This paper investigates the impact of current user behaviour on the carbon savings from retrofit measures including Mechanical Ventilation with Heat Recovery (MVHR) in a council owned 107-flat tower block. Prior to the retrofit, temperature and relative humidity monitoring was undertaken in 18 flats for 35 days. The measurements were then used to develop occupant behaviour profiles and their relation to the heating system. Dynamic thermal simulation of the flats pre- and post-retrofit was performed using TRNSYS, with the identified user behaviour profiles as the key parameter. The results highlight that for these fuel poverty constrained flats the estimated carbon savings of retrofit will be typically half those predicted using standard rules for temperature in living spaces. Keywords MVHR, Occupant behaviour, retrofit, social housing, refurbishment 1. Introduction The UK government has set a target of an 80% reduction in carbon emissions by 2050 based on the 1990 levels, with an interim target of a 34% by 2020 [1]. The domestic sector currently accounts for approximately 29% of UK’s carbon emissions [2]. A large proportion of dwellings that will exist in 2050 are already built and therefore house retrofit has been recognised as an essential area for carbon reductions [3, 4]. This is further reinforced by the low replacement rate of UK housing stock, which is currently less than 1% per annum [5]. Retrofitting has become the focus of several UK Government financial schemes, such as the Green Deal [6] and ECO (Energy Company Obligation) [7] - which are replacing previous schemes: CERT (Carbon Emission Reduction Target) [8] and CESP (Community Energy Saving Program) [9]. Retrofitting involves interventions to the building with the aim of improving energy performance [10], ranging from changes to the building fabric to fixed appliances, controls and systems. Despite government support and recognition of the savings potential of such measures, uptake has not been as rapid as would be hoped [11]. Retrofitting of existing buildings is a complex process which needs to consider numerous parameters such as building size, age, social value, function and the occupants’ needs, behaviour and financial state [12, 13]. In the case of implemented retrofitting projects, there is often a gap between the theoretical designed and actual performance of retrofit measures [14, 15]. The gap
CIBSE ASHRAE Technical Symposium, Dublin, Ireland, 3-4 April 2014
Page 2 of 12
can reach up to 50% and there is often little information on the reasons why [16]. This ’performance gap’ could be attributed in part to occupant behaviour. This paper aims to investigate the potential impact of people’s current, pre-retrofit heating regimes on expected carbon savings from retrofitting of a council owned tower block. The main element of the retrofitting measures is the installation of mechanical ventilation with heat recovery (MVHR) to what is currently a naturally ventilated building. 1.1 Fuel poverty and social housing retrofit The UK social housing sector represents 18% of the UK building stock (4.7 million homes) and provides affordable housing for households with an average income equal or less than £11,000 a year [16]. Social housing provision is split equally between housing associations and the local authorities, in this case the city council. The main difference with other housing sectors is that it is regulated and heavily influenced by government policy and grants. Social housing has been identified as a leading sector for retrofitting [17] which could support large-scale development since it is not restricted by personal financial circumstances. This is very important with the implementation of the Green Deal, which is designed to support the development of sustainable retrofit for both the private and social stock [10]. According to the Communities and Local Government plan, a 29% reduction in the emissions from 2008 in the social housing sector is expected by 2020 [16]. However, the social housing stock appears to have better energy performance than the housing stock as a whole and therefore other sectors, such as older privately owned houses, might present better opportunities for deep carbon reductions [18]. Until recently, fuel poverty was defined as existing in households where 10% (or more) of its income was spent on energy bills [19]. Following an independent review and consultation, a new definition of fuel poverty was set out in July 2013, to ensure support is targeted to those who need it most. A household is now defined as ‘fuel poor’ if its total income is below the poverty line (taking into account the energy costs) and the energy costs are higher than typical [19]. Fuel poverty is measured using an algorithm, called BREDEM-12, which calculates the cost of heating a home by taking into account the current price of heating fuels, the household income and the energy efficiency of the building [20]. The adequate warmth for comfort, defining the ‘poverty line’ used in fuel poverty assessments, is 21oC for the living room and 18oC for all other rooms, as defined by the World Health Organization [21]. According to the annual report on fuel poverty statistics 2013 for the UK, the total number of fuel poor households in the UK for 2011 was estimated at around 4.5 million, accounting for around 17% of the UK households [19]. The efforts to improve the energy performance of buildings, and especially retrofit projects in social houses, resulted in a decrease in fuel poverty figures in 2010, the first decrease since 2003. 1.2 Passivhaus standard and MVHR in retrofit projects The changes made in Approved Documents L (Conservation of Fuel and Power) of the Building Regulation in 2006 [22] promoted the improvement of airtightness of new homes and introduced air permeability tests to ensure its delivery [23]. Improved airtightness in accordance with efforts to increase the energy efficiency of homes have encouraged the use of mechanical ventilation with heat recovery systems (MVHR), as a cost-effective approach to meet both requirements [23]. The use of this
CIBSE ASHRAE Technical Symposium, Dublin, Ireland, 3-4 April 2014
Page 3 of 12
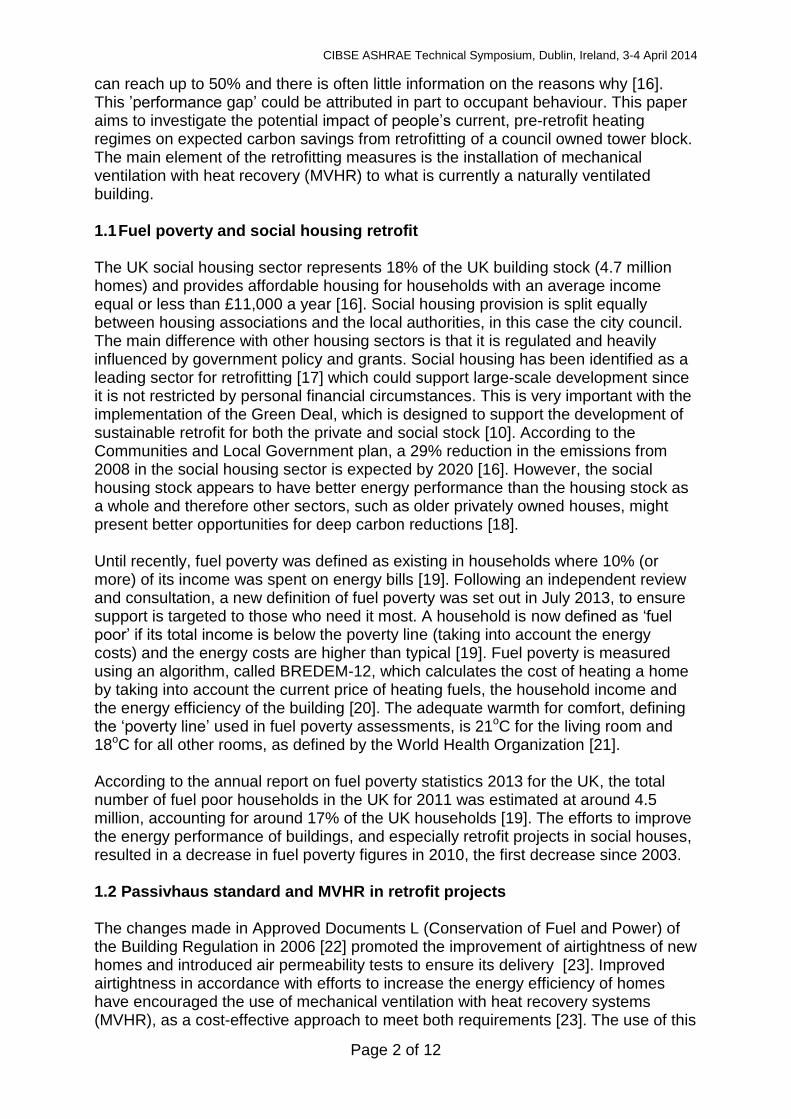
system is further strengthened by performance assessment methods, such as the Code of Sustainable Homes [24] and the Passivhaus Standard in particular [25]. The Passivhaus standard is used on an international scale to describe an established building standard which aims to achieve low building energy consumption (15 kWh/m2 annum space heating) and airtightness. Its criteria are often difficult to meet in refurbishment projects due to the existing building infrastructure, technical challenges such as thermal bridging, and cost. Therefore, the standard has been adjusted for retrofits, defined as the EnerPHit standard [25], which limits the annual space heating to 25 kWh/m2 annum. The retrofit scheme presented in this paper was designed to meet the EnerPHit criteria, as described below. 2. Case study tower block The council owned case study tower block is located in Portsmouth, UK and was constructed in 1968. The property is an 11-storey development of three linked blocks (Figure 1). It contains 107 properties and the dwelling format is that of stacked maisonettes accessed on alternate floors via a communal deck. A typical maisonette includes three bedrooms: two on the entrance level along with a kitchen-dining room and a third on the upper level coupled with a living room and a bathroom. The living rooms incorporate a ‘sunspace’ on a section above the access deck.
Figure 1 Infra-red image of the North façade of the tower block prior to retrofit. Heat loss through open windows and vents is evident.
A number of major elements of the building have reached the end of their serviceable life, which has led to a major refurbishment scheme being established. A pre-refurbishment evaluation assessed 21 out of 107 properties calculating an average SAP rating of 54 [26]. The measures proposed by the design team ECD Architects Ltd meet the stringent EnerPHit standards [25]. The strategies include:
External wall insulation render for the North/West elevation, with fabric upgrade to at least 0.15 W/m2K, and roof upgrade to 0.10 W/m2K.
South/West surface over-cladding, enclosing the living room sunspaces and the access decks.
At the roof level, high performance insulation with waterproof membrane solution.
Triple-glazing fenestration with a U-value of at least 0.8 W/m2K
Improvement of air tightness of the fabric to 1.0 m3/hr/m2 @ 50Pa
Installation of mechanical ventilation with heat recovery system (MVHR).
CIBSE ASHRAE Technical Symposium, Dublin, Ireland, 3-4 April 2014
Page 4 of 12
3. Methodology The study included prior to retrofit environmental monitoring during the heating season and thermal simulations using TRNSYS, as described below. 3.1 Environmental monitoring Eighteen flats were monitored for 34 days from 18 March 2013 to 22 April 2013. The monitoring was undertaken using MadgeTech 2.04 miniature data loggers which record air temperature and relative humidity. The accuracy of the reading for the temperature is ± 0.5 oC and the relative humidity calibrated accuracy is ± 3%. The sensor output integrity of the loggers was validated prior to installation by comparing readings in a controlled environment. Two loggers were placed in the lounge and the bedroom of each flat and were configured to take snapshot (single-value) readings every three minutes. The position of the data loggers in the rooms was chosen to minimise direct exposure to the heating system or any source of abnormal humidity and to avoid any disturbance to the residents 3.2 TRNSYS thermal modelling In order to assess the potential impact of user behaviour to projected performance of the mechanical ventilation with heat recovery system, a representative flat of the tower block was simulated in TRNSYS [27]. The flat is modelled as two zones; namely the lounge and bedroom, with areas of 22 m2 and 11.1 m2 respectively. The results of the bedroom zone are then used for the calculation of the heating demand of the remainder of the flat, since the same WHO criterion of 18oC applies and the space characteristics of the remainder of the flat are similar. On average, the internal gains of the rest of the flat were assessed to be similar to the bedroom. The total area of the flat is 89 m2.
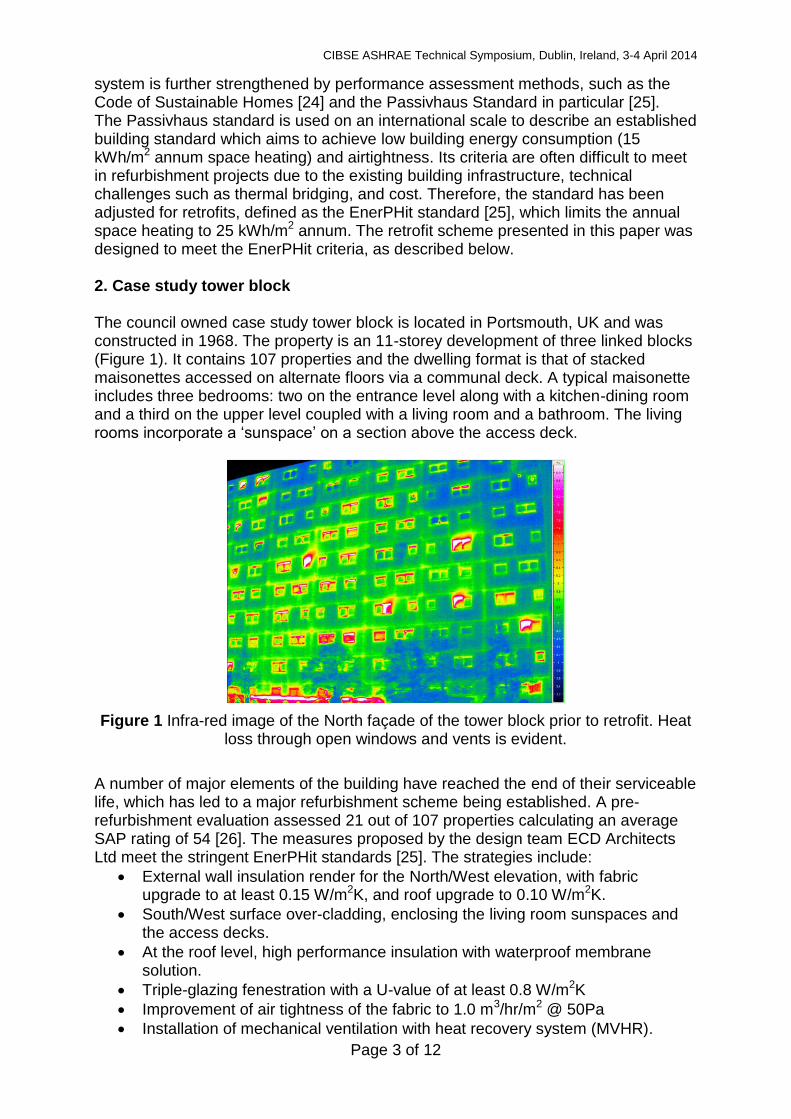
Figure 2 Schematic of the maisonette form pre- and post-retrofit (Access deck on the ‘South’ elevation)
CIBSE ASHRAE Technical Symposium, Dublin, Ireland, 3-4 April 2014
Page 5 of 12
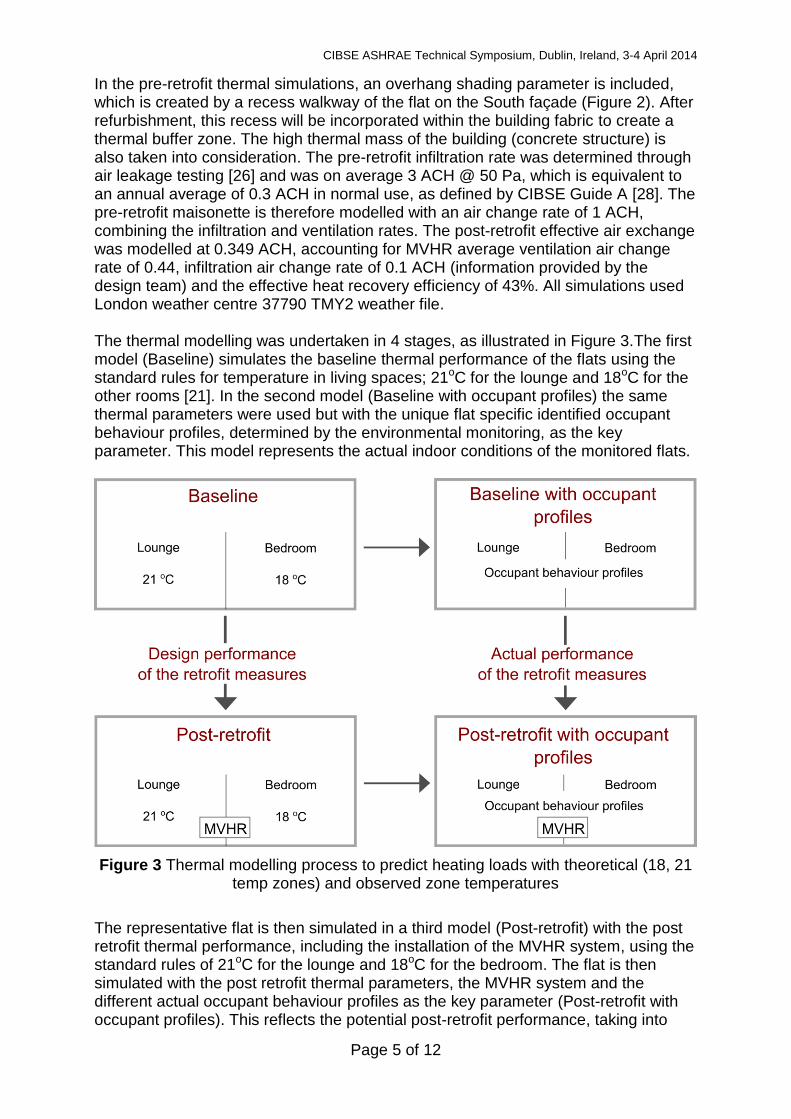
In the pre-retrofit thermal simulations, an overhang shading parameter is included, which is created by a recess walkway of the flat on the South façade (Figure 2). After refurbishment, this recess will be incorporated within the building fabric to create a thermal buffer zone. The high thermal mass of the building (concrete structure) is also taken into consideration. The pre-retrofit infiltration rate was determined through air leakage testing [26] and was on average 3 ACH @ 50 Pa, which is equivalent to an annual average of 0.3 ACH in normal use, as defined by CIBSE Guide A [28]. The pre-retrofit maisonette is therefore modelled with an air change rate of 1 ACH, combining the infiltration and ventilation rates. The post-retrofit effective air exchange was modelled at 0.349 ACH, accounting for MVHR average ventilation air change rate of 0.44, infiltration air change rate of 0.1 ACH (information provided by the design team) and the effective heat recovery efficiency of 43%. All simulations used London weather centre 37790 TMY2 weather file. The thermal modelling was undertaken in 4 stages, as illustrated in Figure 3.The first model (Baseline) simulates the baseline thermal performance of the flats using the standard rules for temperature in living spaces; 21oC for the lounge and 18oC for the other rooms [21]. In the second model (Baseline with occupant profiles) the same thermal parameters were used but with the unique flat specific identified occupant behaviour profiles, determined by the environmental monitoring, as the key parameter. This model represents the actual indoor conditions of the monitored flats.
Figure 3 Thermal modelling process to predict heating loads with theoretical (18, 21 temp zones) and observed zone temperatures
The representative flat is then simulated in a third model (Post-retrofit) with the post retrofit thermal performance, including the installation of the MVHR system, using the standard rules of 21oC for the lounge and 18oC for the bedroom. The flat is then simulated with the post retrofit thermal parameters, the MVHR system and the different actual occupant behaviour profiles as the key parameter (Post-retrofit with occupant profiles). This reflects the potential post-retrofit performance, taking into
CIBSE ASHRAE Technical Symposium, Dublin, Ireland, 3-4 April 2014
Page 6 of 12
account the currently observed thermal control behaviour of the tenants instead of standard rules for comfort. It is assumed that the MVHR is run to provide ventilation in all cases. The designed performance and energy / carbon savings of the proposed retrofit measures are identified by comparing the baseline and post-retrofit models, using the standard rules for temperatures in living spaces. The estimated ‘delivered’ performance of the proposed measures with the use of mechanical ventilation with heat recovery system is determined by comparing the ‘baseline with occupant behaviour profiles’ and ‘post-retrofit with occupant behaviour profiles’ models. Therefore, in this case, flats are assessed based on their unique occupant behaviour profile. Table 1 summarises the input parameters for each of the models produced.
Input Parameter Baseline Baseline/ occupant profiles
Post-retrofit Post-retrofit/ occupant profiles
Air change (ACH2)
1.0 1.0 0.349 0.349
Walls U-value (W/m2K)
1.0 1.0 0.15 0.15
Windows U-value (W/m2K)
2.8 2.8 0.8 0.8
Shading Overhang Overhang - -
Ventilation NV NV MVHR system3
MVHR system3
Set temperature L: 21oC B:18oC
Occupant behaviour profiles
L: 21oC B: 18oC
Occupant behaviour profiles
1 In all models typical values of internal gains were used
2 ACH: Air changes per hour
3 MVHR operation: 4200h running at 0.4W/m
3h = 4 kWh/m
2 (flat: 214 m
3)
Table 1 Input parameters for the TRNSYS thermal simulations pre and post retrofit of a representative flat.
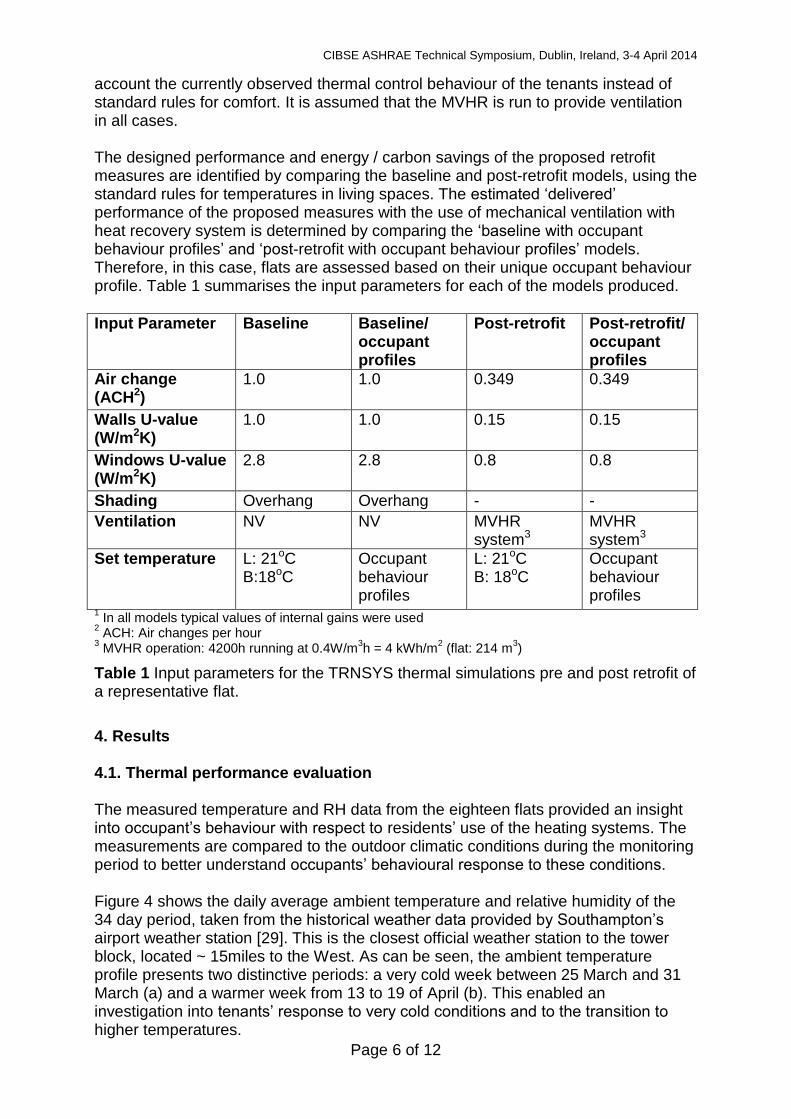
4. Results 4.1. Thermal performance evaluation The measured temperature and RH data from the eighteen flats provided an insight into occupant’s behaviour with respect to residents’ use of the heating systems. The measurements are compared to the outdoor climatic conditions during the monitoring period to better understand occupants’ behavioural response to these conditions. Figure 4 shows the daily average ambient temperature and relative humidity of the 34 day period, taken from the historical weather data provided by Southampton’s airport weather station [29]. This is the closest official weather station to the tower block, located ~ 15miles to the West. As can be seen, the ambient temperature profile presents two distinctive periods: a very cold week between 25 March and 31 March (a) and a warmer week from 13 to 19 of April (b). This enabled an investigation into tenants’ response to very cold conditions and to the transition to higher temperatures.
CIBSE ASHRAE Technical Symposium, Dublin, Ireland, 3-4 April 2014
Page 7 of 12
Figure 4 Daily average ambient temperature and relative humidity during the monitoring period (data from: Weather Underground-Southampton airport), (a)
Prolonged cold period, (b) warmest days of study.
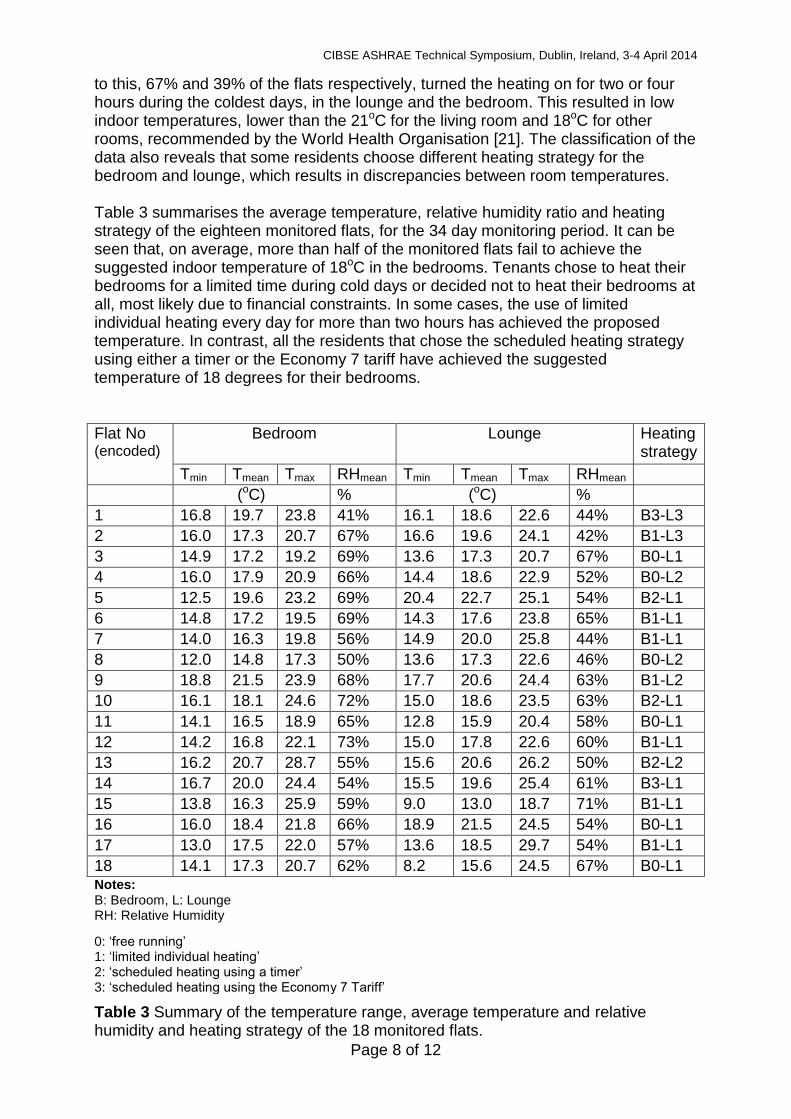
Analysis of the monitoring data in relation to response to the ambient conditions led to classification into four categories for each room type. These categories are: ‘0-free running’, ‘1-limited individual heating’, ‘2-scheduled heating using a timer’, and ‘3-scheduled heating using the Economy 7 Tariff’. The ‘0-free-running’ category corresponds to unheated rooms throughout the monitoring period and was observed only in bedrooms. Small temperature increases of less than 1oC occurred mainly during the night and can be attributed to internal and occupancy gains. The ‘1-limited individual heating category’ describes a strategy where the heating was on for just a few hours during the coldest days in March. The ‘2-scheduled heating using a timer’ represents a constant pattern of everyday use of heating for certain hours during the day, ranging from 1 h to 8 h. Finally, some tenants try to benefit from the Economy 7 Tariff system which offers lower electricity prices for the night time (midnight - 7 am). Table 2 provides the distribution of the monitored flats in the four categories for the bedroom and the lounge separately.
Category Bedroom Lounge
0: ‘free running’ 33% (6 flats) 0%
1: ‘limited individual heating’ 39% (7 flats) 67% (12 flats)
2: ‘scheduled heating using a timer’ 17% (3 flats) 22% (4 flats)
3: ‘scheduled heating using the Economy 7 Tariff’ 11% (2 flats) 11% (2 flats)
Table 2 Distribution of the flats across the four identified heating strategy categories, based on observed bedroom and lounge heating strategies.
The results indicate that 6 out of the 18 monitored flats choose not to heat their bedrooms at all (category ‘free running’), a result most probably related to fuel poverty as this happened even during the cold week in March (Figure 3). In addition
CIBSE ASHRAE Technical Symposium, Dublin, Ireland, 3-4 April 2014
Page 8 of 12
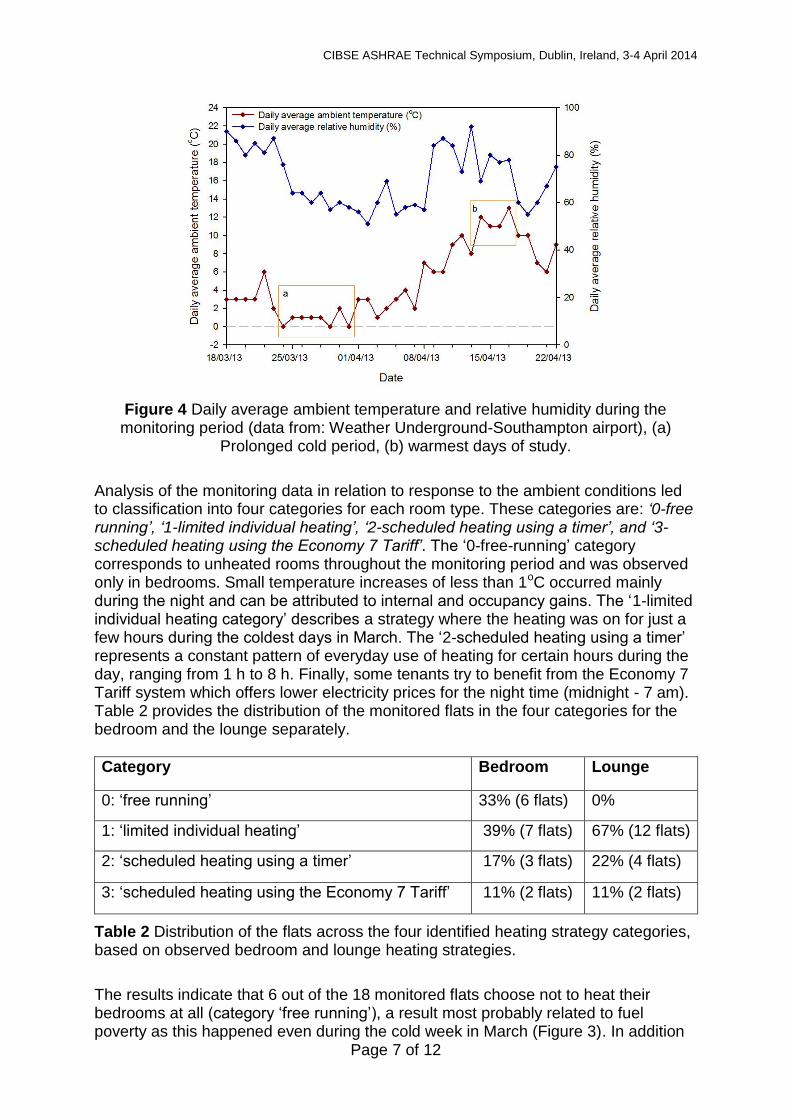
to this, 67% and 39% of the flats respectively, turned the heating on for two or four hours during the coldest days, in the lounge and the bedroom. This resulted in low indoor temperatures, lower than the 21oC for the living room and 18oC for other rooms, recommended by the World Health Organisation [21]. The classification of the data also reveals that some residents choose different heating strategy for the bedroom and lounge, which results in discrepancies between room temperatures. Table 3 summarises the average temperature, relative humidity ratio and heating strategy of the eighteen monitored flats, for the 34 day monitoring period. It can be seen that, on average, more than half of the monitored flats fail to achieve the suggested indoor temperature of 18oC in the bedrooms. Tenants chose to heat their bedrooms for a limited time during cold days or decided not to heat their bedrooms at all, most likely due to financial constraints. In some cases, the use of limited individual heating every day for more than two hours has achieved the proposed temperature. In contrast, all the residents that chose the scheduled heating strategy using either a timer or the Economy 7 tariff have achieved the suggested temperature of 18 degrees for their bedrooms.
Flat No (encoded)
Bedroom Lounge Heating strategy
Tmin Tmean Tmax RHmean Tmin Tmean Tmax RHmean
(oC) % (oC) %
1 16.8 19.7 23.8 41% 16.1 18.6 22.6 44% B3-L3
2 16.0 17.3 20.7 67% 16.6 19.6 24.1 42% B1-L3
3 14.9 17.2 19.2 69% 13.6 17.3 20.7 67% B0-L1
4 16.0 17.9 20.9 66% 14.4 18.6 22.9 52% B0-L2
5 12.5 19.6 23.2 69% 20.4 22.7 25.1 54% B2-L1
6 14.8 17.2 19.5 69% 14.3 17.6 23.8 65% B1-L1
7 14.0 16.3 19.8 56% 14.9 20.0 25.8 44% B1-L1
8 12.0 14.8 17.3 50% 13.6 17.3 22.6 46% B0-L2
9 18.8 21.5 23.9 68% 17.7 20.6 24.4 63% B1-L2
10 16.1 18.1 24.6 72% 15.0 18.6 23.5 63% B2-L1
11 14.1 16.5 18.9 65% 12.8 15.9 20.4 58% B0-L1
12 14.2 16.8 22.1 73% 15.0 17.8 22.6 60% B1-L1
13 16.2 20.7 28.7 55% 15.6 20.6 26.2 50% B2-L2
14 16.7 20.0 24.4 54% 15.5 19.6 25.4 61% B3-L1
15 13.8 16.3 25.9 59% 9.0 13.0 18.7 71% B1-L1
16 16.0 18.4 21.8 66% 18.9 21.5 24.5 54% B0-L1
17 13.0 17.5 22.0 57% 13.6 18.5 29.7 54% B1-L1
18 14.1 17.3 20.7 62% 8.2 15.6 24.5 67% B0-L1 Notes: B: Bedroom, L: Lounge RH: Relative Humidity
0: ‘free running’ 1: ‘limited individual heating’ 2: ‘scheduled heating using a timer’ 3: ‘scheduled heating using the Economy 7 Tariff’
Table 3 Summary of the temperature range, average temperature and relative humidity and heating strategy of the 18 monitored flats.
CIBSE ASHRAE Technical Symposium, Dublin, Ireland, 3-4 April 2014
Page 9 of 12
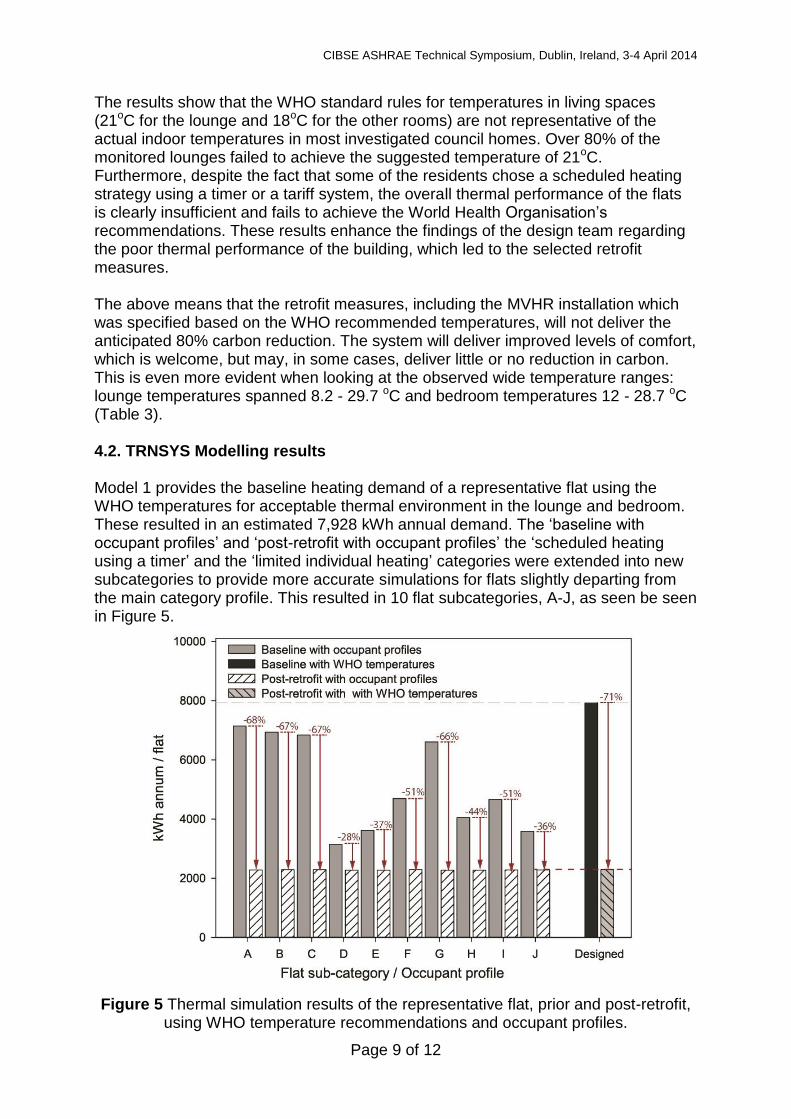
The results show that the WHO standard rules for temperatures in living spaces (21oC for the lounge and 18oC for the other rooms) are not representative of the actual indoor temperatures in most investigated council homes. Over 80% of the monitored lounges failed to achieve the suggested temperature of 21oC. Furthermore, despite the fact that some of the residents chose a scheduled heating strategy using a timer or a tariff system, the overall thermal performance of the flats is clearly insufficient and fails to achieve the World Health Organisation’s recommendations. These results enhance the findings of the design team regarding the poor thermal performance of the building, which led to the selected retrofit measures. The above means that the retrofit measures, including the MVHR installation which was specified based on the WHO recommended temperatures, will not deliver the anticipated 80% carbon reduction. The system will deliver improved levels of comfort, which is welcome, but may, in some cases, deliver little or no reduction in carbon. This is even more evident when looking at the observed wide temperature ranges: lounge temperatures spanned 8.2 - 29.7 oC and bedroom temperatures 12 - 28.7 oC (Table 3). 4.2. TRNSYS Modelling results Model 1 provides the baseline heating demand of a representative flat using the WHO temperatures for acceptable thermal environment in the lounge and bedroom. These resulted in an estimated 7,928 kWh annual demand. The ‘baseline with occupant profiles’ and ‘post-retrofit with occupant profiles’ the ‘scheduled heating using a timer’ and the ‘limited individual heating’ categories were extended into new subcategories to provide more accurate simulations for flats slightly departing from the main category profile. This resulted in 10 flat subcategories, A-J, as seen be seen in Figure 5.
Figure 5 Thermal simulation results of the representative flat, prior and post-retrofit, using WHO temperature recommendations and occupant profiles.
CIBSE ASHRAE Technical Symposium, Dublin, Ireland, 3-4 April 2014
Page 10 of 12
Figure 5 summarises the results of the TRNSYS thermal simulations. It can be seen that using the WHO temperatures instead of occupant based temperature profiles leads to overestimation of the amount of heat (kWh annum) delivered in the rooms. This overestimation ranges from 10% (flat subcategory A) to +150% (flat subcategory D). In the case of flat type D, the WHO annual demand would be 7,928 kWh compared to 3,150 kWh for the actual occupant profile. The difference between the WHO demand and the occupant profile value corresponds to 4,778 KWh, i.e. 150% of the occupant profile value. On average, the overestimation for all flat subcategories is 70%. This means that the actual energy / carbon savings from retrofit measures can be expected to be less than half that estimated for a WHO compliant flat.
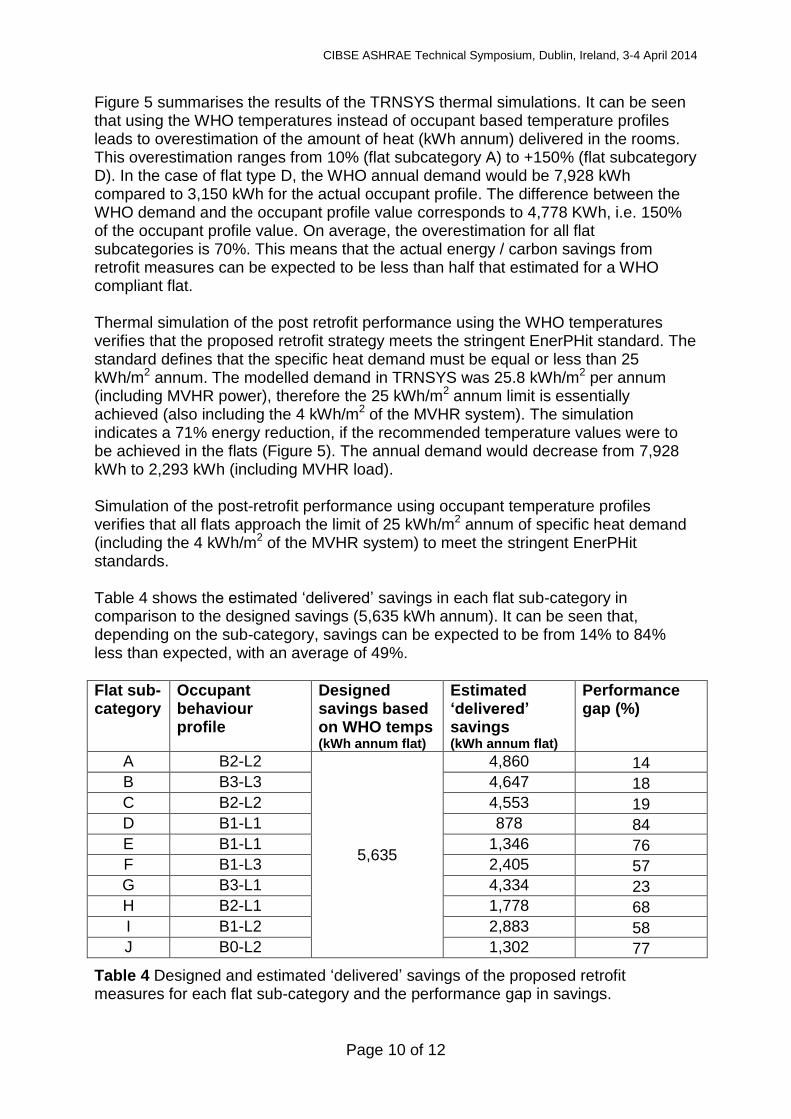
Thermal simulation of the post retrofit performance using the WHO temperatures verifies that the proposed retrofit strategy meets the stringent EnerPHit standard. The standard defines that the specific heat demand must be equal or less than 25 kWh/m2 annum. The modelled demand in TRNSYS was 25.8 kWh/m2 per annum (including MVHR power), therefore the 25 kWh/m2 annum limit is essentially achieved (also including the 4 kWh/m2 of the MVHR system). The simulation indicates a 71% energy reduction, if the recommended temperature values were to be achieved in the flats (Figure 5). The annual demand would decrease from 7,928 kWh to 2,293 kWh (including MVHR load). Simulation of the post-retrofit performance using occupant temperature profiles verifies that all flats approach the limit of 25 kWh/m2 annum of specific heat demand (including the 4 kWh/m2 of the MVHR system) to meet the stringent EnerPHit standards. Table 4 shows the estimated ‘delivered’ savings in each flat sub-category in comparison to the designed savings (5,635 kWh annum). It can be seen that, depending on the sub-category, savings can be expected to be from 14% to 84% less than expected, with an average of 49%.
Flat sub-category
Occupant behaviour profile
Designed savings based on WHO temps (kWh annum flat)
Estimated ‘delivered’ savings (kWh annum flat)
Performance gap (%)
A B2-L2
5,635
4,860 14
B B3-L3 4,647 18
C B2-L2 4,553 19
D B1-L1 878 84
E B1-L1 1,346 76
F B1-L3 2,405 57
G B3-L1 4,334 23
H B2-L1 1,778 68
I B1-L2 2,883 58
J B0-L2 1,302 77
Table 4 Designed and estimated ‘delivered’ savings of the proposed retrofit measures for each flat sub-category and the performance gap in savings.
CIBSE ASHRAE Technical Symposium, Dublin, Ireland, 3-4 April 2014
Page 11 of 12
5. Conclusions This paper presented results from environmental monitoring and thermal modelling of a council owned tower block which is undergoing refurbishment. The data analysis of the eighteen monitored flats revealed that more than half of the flats currently fail to achieve the recommended indoor temperatures for an acceptable thermal environment. This resulted in under-heated flats with lower heating demand compared to that predicted using standard rules for indoor temperatures. The most likely reason for this is fuel poverty, highlighting a contradiction in the perceived high potential of social housing for carbon reductions. The carbon emissions at present are clearly far lower than those that would be estimated from normal building physics – temperature guidelines. Thermal modelling of the post-retrofit conditions showed that the proposed measures meet the strict EnerPHit standard and will overall improve the indoor environmental conditions. However, using the observed occupant behaviour profiles, the results highlight that the actual energy / carbon savings will be less than those predicted using the standard rules for temperatures in living spaces, typically around a half. This performance gap can be attributed essentially to occupant behaviour as a response to financial constraints, which determined a low baseline heating demand and subsequently low carbon reductions. Clearly, meeting the carbon reduction targets requires good understanding of occupant usage, as the current approach leads to an overestimation of the carbon reduction potential of houses in fuel poverty. Furthermore, it appears necessary to value occupant comfort as well as carbon reduction in under-heated houses, and this makes the challenge even greater. Acknowledgements The authors would like to thank ECD Architects for providing valuable information and material for this research.
References 1. UK Parliament, Climate Change Act, chapter 27. 2008, The Stationery Office
Limited: London. 2. Department of Energy & Climate Change, Digest of United Kingdom Energy
Statistics 2013. 2013: London. 3. Boardman, B., et al., '40% House' Report. 2005: Oxford 4. EST, Towards a Long-term Strategy for Reducing Carbon Dioxide Emissions
from Our Housing Stock. 2008: London. 5. Smith, L. and W. Swan, Delivery of Retrofit at Scale: Developing a viable
delivery model in social housing, in Retrofit 2012. 2012: University of Salford, Salford, UK, .
6. Department of Energy and Climate Change, The Green Deal and Energy Company Obligation Impact Assessment. 2011, DECC: London.
7. Department of Energy and Climate Change, Extra help where it is needed: a new Energy Company Obligation. 2011, DECC: London.
8. OFGEM, The final report of the Carbon Emissions Reduction Target (CERT) 2008-2012 2013: London.
9. Department of Energy and Climate Change, Evaluation of the Community Energy Saving Programme. 2011, DECC: London.
10. Chahal, S., W. Swan, and P. Brown, Tenant Perceptions and Experiences of Retrofit, in Retrofit 2012. 2012: University of Salford, Salford, UK, .
CIBSE ASHRAE Technical Symposium, Dublin, Ireland, 3-4 April 2014
Page 12 of 12
11. Reeves, A., S. Taylor, and P. Fleming, Modelling the potential to achieve deep carbon emission cuts in existing UK social housing: The case of Peabody. Energy Policy, 2010. 38(8): p. 4241-4251.
12. Dowson, M., et al., Domestic UK retrofit challenge: Barriers, incentives and current performance leading into the Green Deal. Energy Policy, 2012. 50(0): p. 294-305.
13. Lowery, D.M., et al., Barriers to retrofit of domestic housing stock with low and zero carbon dioxide technologies. Proceedings of the Institution of Civil Engineers-Engineering Sustainability, 2012. 165(3): p. 191 –199.
14. Stafford, A., C. Gorse, and L. Shao, The Retrofit Challenge: Delivering Low Carbon Buildings. 2011.
15. Haas, R. and P. Biermayr, The rebound effect for space heating Empirical evidence from Austria. Energy Policy, 2000. 28(6–7): p. 403-410.
16. Sunikka-Blank, M., et al., Improving Energy Efficiency of Social Housing Areas: A Case Study of a Retrofit Achieving an “A” Energy Performance Rating in the UK. European Planning Studies, 2012. 20(1): p. 131-145.
17. HM Government, Warm Homes, Greener Homes: A Strategy for Household Energy Management. 2010, DECC: London.
18. Swan, W., et al., Adoption of sustainable retrofit in UK social housing. Structural Survey, 2013. 31(3): p. 181 - 193.
19. Department of Energy and Climate Change, Annual Report on Fuel Poverty Statistics 2013. 2013: London.
20. Liddell, C. and C. Morris, Fuel poverty and human health: A review of recent evidence. Energy Policy, 2010. 38(6): p. 2987-2997.
21. World Health Organization (WHO), Housing, Energy and Thermal Comfort. 2007: Copenhagen.
22. The Building Regulations Part L, Conservation of fuel and power. 2006, Office of the Deputy Prime Minister.
23. Zero Carbon Hub, Mechanical Ventilation with heat recovery in new homes. 2013: London.
24. BREEAM. Code for Sustainable Homes. (Accessed 2013; Available from: http://www.breeam.org/.
25. Passivhaus. (Accessed 2013; Available from: http://www.passivhaus.org.uk/. 26. ECD Architects, Wilmcote House External Cladding & Refurbishment:
Feasibility report - Rev A. 2012. 27. TRNSYS. Solar Energy Laboratory (SEL), The University of Wisconsin,
Madison, USA: http://sel.me.wisc.edu/. 28. CIBSE, Guide A-Environmental design. 2006, London: Chartered Institution of
Building Services Engineers. 29. Weather Underground. (Accessed September 2013; Available from:
http://www.wunderground.com.