impact of combined resistance and aerobic exercise ... · article impact of combined resistance and...
TRANSCRIPT

ARTICLE
Impact of combined resistance and aerobic exercise trainingon branched-chain amino acid turnover, glycine metabolismand insulin sensitivity in overweight humans
Erin L. Glynn1,2& Lucy W. Piner2 & Kim M. Huffman2
& Cris A. Slentz2,3,5 &
Lorraine Elliot-Penry2 & Hiba AbouAssi3,6 & Phillip J. White1,2 & James R. Bain1,2,3,6&
Michael J. Muehlbauer1,2 & Olga R. Ilkayeva1,2 & Robert D. Stevens1,2,3,6 &
Kathryn N. Porter Starr3 & Connie W. Bales3,7,8 & Elena Volpi9 & M. Julia Brosnan10&
Jeff K. Trimmer10 & Timothy P. Rolph10& Christopher B. Newgard1,2,3,4,6
&
William E. Kraus2,3,5
Received: 12 May 2015 /Accepted: 24 June 2015 /Published online: 9 August 2015# Springer-Verlag Berlin Heidelberg 2015
AbstractAims/hypotheses Obesity is associated with decreased insulinsensitivity (IS) and elevated plasma branched-chain aminoacids (BCAAs). The purpose of this study was to investigatethe relationship between BCAA metabolism and IS in over-weight (OW) individuals during exercise intervention.Methods Whole-body leucine turnover, IS by hyper-insulinaemic–euglycaemic clamp, and circulating andskeletal muscle amino acids, branched-chain α-keto acidsand acylcarnitines were measured in ten healthy controls(Control) and nine OW, untrained, insulin-resistant indi-viduals (OW-Untrained). OW-Untrained then underwent a6 month aerobic and resistance exercise programme andrepeated testing (OW-Trained).
Results IS was higher in Control vs OW-Untrained and in-creased significantly following exercise. IS was lower inOW-Trained vs Control expressed relative to body mass, butwas not different from Control when normalised to fat-freemass (FFM). Plasma BCAAs and leucine turnover (relativeto FFM) were higher in OW-Untrained vs Control, but did notchange on average with exercise. Despite this, within individ-uals, the decrease in molar sum of circulating BCAAs was thebest metabolic predictor of improvement in IS. Circulatingglycine levels were higher in Control and OW-Trained vsOW-Untrained, and urinary metabolic profiling suggests thatexercise induces more efficient elimination of excess acylgroups derived from BCAA and aromatic amino acid (AA)metabolism via formation of urinary glycine adducts.
Electronic supplementary material The online version of this article(doi:10.1007/s00125-015-3705-6) contains peer-reviewed but uneditedsupplementary material, which is available to authorised users.
* Christopher B. [email protected]
* William E. [email protected]
1 Sarah W. Stedman Nutrition & Metabolism Center, Duke UniversityMedical Center, Durham, NC, USA
2 Duke Molecular Physiology Institute, Duke University MedicalCenter, 300 North Duke Street, Durham, NC 27701, USA
3 Department of Medicine, Duke University Medical Center,Durham, NC, USA
4 Department of Pharmacology and Cancer Biology, Duke UniversityMedical Center, Durham, NC, USA
Diabetologia (2015) 58:2324–2335DOI 10.1007/s00125-015-3705-6
5 Department of Cardiology, Duke University Medical Center,Durham, NC, USA
6 Division of Endocrinology, Duke University Medical Center,Durham, NC, USA
7 Division of Geriatrics, Duke University Medical Center,Durham, NC, USA
8 GRECC, Durham VA Medical Center, Durham, NC, USA
9 Sealy Center on Aging, University of Texas Medical Branch,Galveston, TX, USA
10 The CVand Metabolic Diseases Research Unit, Pfizer,Cambridge, MA, USA

Conclusions/interpretation A mechanism involving more ef-ficient elimination of excess acyl groups derived from BCAAand aromatic AA metabolism via glycine conjugation in theliver, rather than increased BCAA disposal through oxidationand turnover, may mediate interactions between exercise,BCAA metabolism and IS.Trial registration: Clinicaltrials.gov NCT01786941
Keywords Branched-chain amino acids . Exercise . Insulinresistance .Metabolomics . Obesity . Protein
Abbreviationsα-KIC α-Keto-isocaproateα-KIV α-Keto-valerateα-KMV α-Keto-β-methylvalerateAAs Amino acidsBCAAs Branched-chain amino acidsBCKDH Branched-chain keto acid dehydrogenaseFFM Fat-free massFPG Fasting plasma glucoseFSR Fractional synthesis rateGIP Glucose-dependent insulinotropic peptideGIR Glucose infusion rateIR Insulin resistanceIS Insulin sensitivityMPS Muscle protein synthesisNOLD Non-oxidative leucine disposalOW OverweightPCA Principal components analysisRa Rate of appearanceRER Respiratory exchange ratioV�
O2peak Peak oxygen consumption
Introduction
Obesity is characterised by metabolic aberrations, includinginsulin resistance (IR) and impaired macronutrient metabo-lism. Traditionally, attention has focused on the interplay ofglucose and lipid metabolism in obesity-associated metabolicdiseases. More recently, studies involving comprehensivemetabolic profiling—or ‘metabolomics’—have highlightedthe importance of protein metabolism in the aetiology of suchdisorders [1]. Although obesity is associated with elevatedplasma levels of certain amino acids (AAs), including thebranched-chain AAs (BCAAs), phenylalanine and tyrosine[2–4], their source and contribution to the development ofIR remain unclear.
We previously identified a plasma signature composed ofthe BCAAs, their acylcarnitine metabolites (C3 and C5), andaromatic AAs phenylalanine and tyrosine that distinguisheslean from obese individuals, is strongly associated with IR
and implicates altered flux through BCAA catabolic pathwaysin obesity [5–7]. Further, a similar group of metabolites mea-sured at baseline predicts improvement of IR in response tomoderate weight loss [8] and is prognostic for future develop-ment of type 2 diabetes in normoglycaemic individuals [9]. Inmuscle, a commonly observed signature of obesity and IR is theaccumulation of a broad array of acylcarnitines, derived frommitochondrial oxidation of lipids, glucose and AAs [10, 11].One model proposes that diet-induced obesity leads to a com-pensatory increase in β-oxidation in skeletal muscle, but with-out a coordinate increase in capacity of the tricarboxylic acid(TCA) cycle and electron transport chain (ETC), resulting inaccumulation of incompletely oxidised lipid species (represent-ed by acylcarnitines) in muscle mitochondria [10, 11]. Further,accumulation of acylcarnitines is associated with mitochondrialstress and impaired insulin action [10, 11]. Consistent with thismodel, BCAA consumption potentiates high-fat diet-inducedaccumulation of acylcarnitines in rodent skeletal muscle [5].
Skeletal muscle is amajor site of insulin action [12], and thus,a practical target for therapeutic interventions to improve insulinsensitivity (IS). Exercise is a readily available and effectiveintervention for improving metabolic dysfunction in obesity[7, 13]. Both aerobic and resistance exercise have been shownto enhance oxidative potential by increasing mitochondrial den-sity and/or function [14, 15], and resistance exercise stimulatesmuscle protein turnover, generally improving net proteinbalance [16]. We designed a study to test the impact of a com-bined aerobic and resistance exercise regimen on BCAA andacylcarnitine homeostasis and IS in overweight (OW), insulin-resistant individuals. We hypothesised that the combined exer-cise programme would drive BCAAs into exercising muscle foroxidation in response to both components, and for protein syn-thesis in response to the resistance component, consumingexcess plasma AAs and improving plasma and muscle AAand acylcarnitine profiles, with associated improvements in IS.
Methods
ParticipantsWe studied 23 individuals who qualified as leancontrols (Control; BMI ≤24.9, no activity restrictions) or over-weight, insulin-resistant and untrained (OW; BMI 25–≤35.4,exercise <2 days/week). Experimental procedures were ap-proved by the Institutional Review Board at Duke UniversityMedical Center (which is in compliance with the Declarationof Helsinki, revised in 1983). All participants provided in-formed, written consent prior to enrolment. Participants com-pleted testing at baseline (Control, OW-Untrained), and OWrepeated testing following a 6-month exercise intervention(OW-Trained). Four OW participants (one man and threewomen) did not complete the exercise intervention and wereonly included in OW-Untrained. See Electronic Supplemen-tary Materials (ESM) Methods.
Diabetologia (2015) 58:2324–2335 2325
Experimental design Screening visits and study timeline areshown in ESM Fig. 1. Participants underwent an OGTT toqualify for the Control (BMI≤24.9, no activity restrictions,fasting plasma glucose [FPG] ≤5.5, 2 h plasma glucose≤7.72 mmol/l) or OW (BMI 25 to ≤35.4, exercise <2 days/week, FPG 5.83 to <7 mmol/l, 2 h glucose 7.8 to <11.1 mmol/l) groups. On separate days (≥13 days apart), whole-bodyleucine turnover was measured, and hyperinsulinaemic–euglycaemic clamps were used to assess IS.
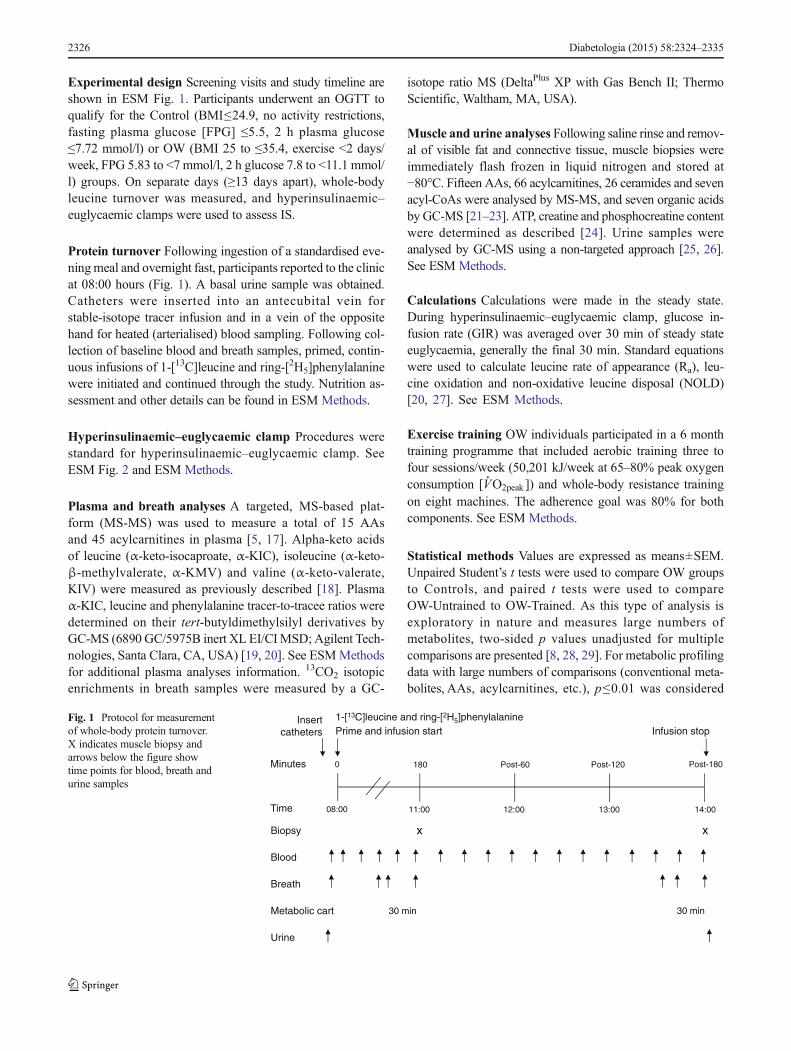
Protein turnover Following ingestion of a standardised eve-ningmeal and overnight fast, participants reported to the clinicat 08:00 hours (Fig. 1). A basal urine sample was obtained.Catheters were inserted into an antecubital vein forstable-isotope tracer infusion and in a vein of the oppositehand for heated (arterialised) blood sampling. Following col-lection of baseline blood and breath samples, primed, contin-uous infusions of 1-[13C]leucine and ring-[2H5]phenylalaninewere initiated and continued through the study. Nutrition as-sessment and other details can be found in ESM Methods.
Hyperinsulinaemic–euglycaemic clamp Procedures werestandard for hyperinsulinaemic–euglycaemic clamp. SeeESM Fig. 2 and ESM Methods.
Plasma and breath analyses A targeted, MS-based plat-form (MS-MS) was used to measure a total of 15 AAsand 45 acylcarnitines in plasma [5, 17]. Alpha-keto acidsof leucine (α-keto-isocaproate, α-KIC), isoleucine (α-keto-β-methylvalerate, α-KMV) and valine (α-keto-valerate,KIV) were measured as previously described [18]. Plasmaα-KIC, leucine and phenylalanine tracer-to-tracee ratios weredetermined on their tert-butyldimethylsilyl derivatives byGC-MS (6890 GC/5975B inert XL EI/CIMSD; Agilent Tech-nologies, Santa Clara, CA, USA) [19, 20]. See ESMMethodsfor additional plasma analyses information. 13CO2 isotopicenrichments in breath samples were measured by a GC-
isotope ratio MS (DeltaPlus XP with Gas Bench II; ThermoScientific, Waltham, MA, USA).
Muscle and urine analyses Following saline rinse and remov-al of visible fat and connective tissue, muscle biopsies wereimmediately flash frozen in liquid nitrogen and stored at−80°C. Fifteen AAs, 66 acylcarnitines, 26 ceramides and sevenacyl-CoAs were analysed by MS-MS, and seven organic acidsby GC-MS [21–23]. ATP, creatine and phosphocreatine contentwere determined as described [24]. Urine samples wereanalysed by GC-MS using a non-targeted approach [25, 26].See ESM Methods.
Calculations Calculations were made in the steady state.During hyperinsulinaemic–euglycaemic clamp, glucose in-fusion rate (GIR) was averaged over 30 min of steady stateeuglycaemia, generally the final 30 min. Standard equationswere used to calculate leucine rate of appearance (Ra), leu-cine oxidation and non-oxidative leucine disposal (NOLD)[20, 27]. See ESM Methods.
Exercise training OW individuals participated in a 6 monthtraining programme that included aerobic training three tofour sessions/week (50,201 kJ/week at 65–80% peak oxygenconsumption [V
�
O2peak ]) and whole-body resistance trainingon eight machines. The adherence goal was 80% for bothcomponents. See ESM Methods.
Statistical methods Values are expressed as means±SEM.Unpaired Student’s t tests were used to compare OW groupsto Controls, and paired t tests were used to compareOW-Untrained to OW-Trained. As this type of analysis isexploratory in nature and measures large numbers ofmetabolites, two-sided p values unadjusted for multiplecomparisons are presented [8, 28, 29]. For metabolic profilingdata with large numbers of comparisons (conventional meta-bolites, AAs, acylcarnitines, etc.), p≤0.01 was considered
Blood
Insert catheters
1-[13C]leucine and ring-[2H5]phenylalaninePrime and infusion start
Minutes 0 180 Post-60 Post-120
08:00 11:00 12:00 13:00
Post-180
14:00Time
Metabolic cart
Biopsy x x
Breath
30 min
Urine
Infusion stop
30 min
Fig. 1 Protocol for measurementof whole-body protein turnover.X indicates muscle biopsy andarrows below the figure showtime points for blood, breath andurine samples
2326 Diabetologia (2015) 58:2324–2335
significant. For statistical tests of other measures (pro-tein turnover, creatine, clamp, α-keto acids, etc.), p≤0.05 was considered significant. Alpha levels are indi-cated in table and figure legends.
Principal components analysis (PCA) was used to re-duce the large number of metabolites to a smaller num-ber of factors [5, 8, 29, 30]. Factors that were correlated(r2 > 0.3) with HOMA-IR and/or clamp GIR wereretained for further analysis. Pearson’s correlation coeffi-cients were used to assess the correlation betweenHOMA-IR and GIR with metabolic factors and groupsof metabolites. If a variable was not normally distributed,Spearman’s correlation test was used. Statistical analyses
were performed using SAS version 9.3 (SAS Institute,Cary, NC, USA). See ESM Methods.
Results
Physical characteristics and physiological measuresOW-Untrained participants were OW or class I obese(BMI 25.00–29.99 or 30.00–34.99 kg m−2) (Table 1). Otherphysical characteristics are reported in Table 1.
Exercise training Baseline and training outcomes are presentedin Table 1 and ESM Table 1.
Table 1 Physical characteristics, physiological measures, dietary intake and exercise training
Control OW-Untrained OW-Trained
Participant characteristics n=10 n=13 n=9
Age (years) 50±3 52±2 52±2
Women (%) 50 54 44
Body mass (kg) 65.3±2.7 87.3±3.7** 86.3±5.2**
BMI (kg/m2) 22.6±0.5 30.9±0.8** 30.3±0.8**
FFM (%) 78±3 61±2** 64±2**,††
Fat mass (%) 22±3 39±2** 36±2**,††
Physiological measures
FPG (mmol/l) 4.96±0.09 6.20±0.14** 5.97±0.25**
Fasting plasma insulin (pmol/l) 16±4 56±9** 41±9**,††
HOMA-IR 0.6±0.1 2.6±0.5** 1.9±0.5**,††
2 h glucose, OGTT (mmol/l) 5.51±0.33 9.24±0.45** 7.26±0.31**,††
Total cholesterol (mmol/l) 4.73±0.31 5.12±0.22 5.03±0.37
Triacylglycerol (mmol/l) 0.94±0.13 1.7±0.29** 1.93±0.27
REE/kg FFM (kJ/day) 120.6±3.8 127.3±4.6 124±5.0
RER 0.80±0.01 0.78±0.01 0.79±0.01
Dietary intake n=9 n=9 n=9
Total daily intake (kJ) 7,603±481 9,551±953 9,211±1,297
Protein (% of energy) 16.3±1.0 18.0±1.1 18.0±0.8
Fat (% of energy) 37.4±2.5 34.1±1.8 35.0±1.9
Exercise training
Adherence (resistance exercise, %) NA 82±5
Adherence (aerobic exercise, %) NA 87±5
V�
O2peak (ml O2 kg−1 min−1) ITTa 25.8±1.8 28.9±2.7b
PPc 26.7±1.8 30.0±2.2††
Time to exhaustion (s) ITTd 753±60 950±56††
PPe 769±62 969±52††
Leg press working weight (% change) 30±7
Chest press working weight (% change) 55±20
Values are expressed as means±SEM
Dietary intake values averaged from 3-day dietary records and 24 h food recallsa n=7, b p=0.07, c n=5, d n=9, e n=7
α=0.01. **p<0.01 vs Control; †† p<0.01 vs OW-Untrained
ITT, intent to treat population; PP, per protocol population; REE, resting energy expenditure
Diabetologia (2015) 58:2324–2335 2327
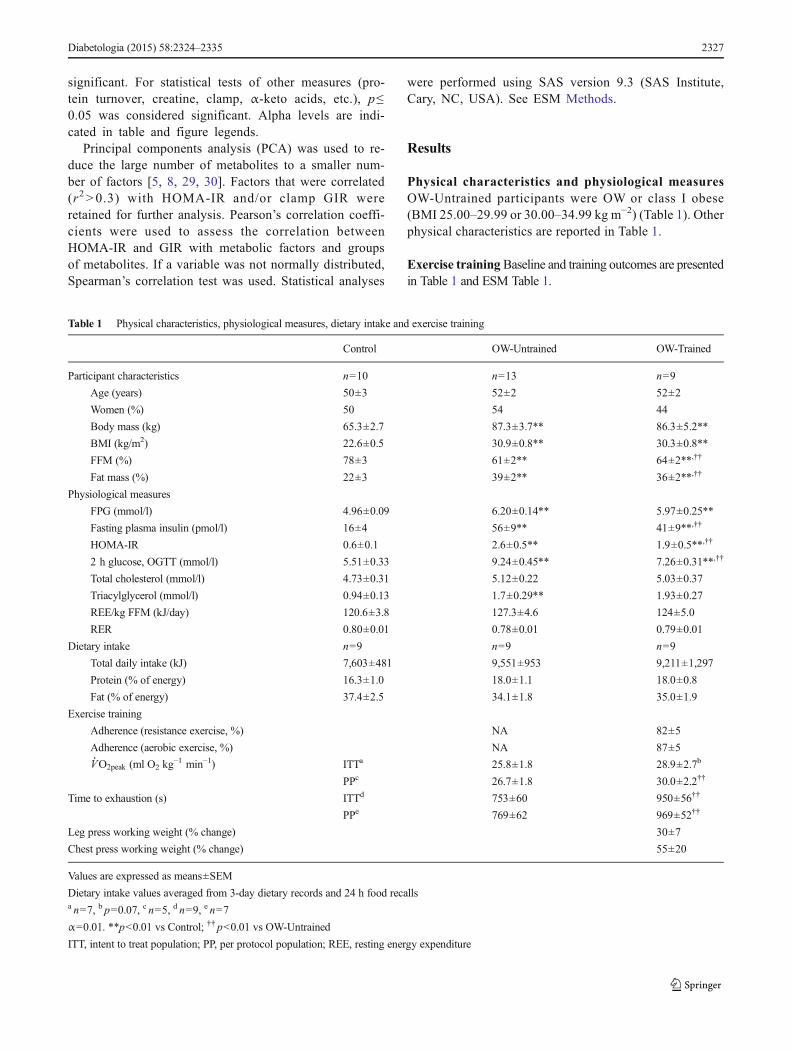
Glucose control OW-Untrained had higher FPG and insulin,HOMA-IR and 2 h OGTT glucose levels than Control(p<0.01, Table 1). Fasting insulin, HOMA-IR, and 2 h OGTTglucose were lowered by exercise (p<0.01), but remainedgreater than Control. FPG was not altered by exercise(p=0.14). OW-Untrained had greater glucose and insulin ex-cursions during OGTT than Control (Fig. 2a–c), which im-proved in OW-Trained, but remained greater than Control.Hyperinsulinaemic–euglycaemic clamp studies indicated amoderate degree of IR in OW-Untrained vs Control(p<0.01, Fig. 2d). IS (GIR) improved by an average of 54%in OW-Trained (p<0.01 vs OW-Untrained), but did not nor-malise completely vs Control when expressed relative to bodymass (p<0.01). However, expressed relative to fat-free mass(FFM), OW-Trained GIR was not different from Control(Fig. 2e).
BCAA and α-keto acid levels during hyperinsulinaemic–euglycaemic clamp BCAAs and their corresponding α-ketoacids are reported prior to insulin infusion, and at 90 and180 min of hyperinsulinaemic–euglycaemic clamp inFig. 2h, i. Expressed as % change from 0–180 min, all BCAAand α-keto acids except α-KIV were lowered to a greaterextent in Control vs OW groups, but there were no differencesbetween groups when expressed as absolute change. Absolutevalues of the OW groups were generally higher than Control.All three BCAAs were greater in OW-Untrained comparedwith Control at 90 and 180 min, and were not lowered onaverage by exercise. At Time 0, plasma levels of the BCAA-derived α-keto acids were greater in OW-Untrained vs Con-trol. Basal α-KIC and α-KMV were reduced following exer-cise. The molar sum of BCAAs was elevated in OW-Untrained and OW-Trained vs Control (Fig. 2j), whereas the
*
0
20
40
60
80
100
Pla
sma
sum
of α
-ket
oac
ids
(µm
ol/l)
§
0
100
200
300
400
500
600
Pla
sma
sum
of B
CA
As
(µm
ol/l)
j
**0
10
20
30
40
50
Cla
mp
plas
ma
α-ke
toac
idco
ncen
trat
ions
(µm
ol/l)
*
0
60
120
180
240
300
0 90 180 0 90 180 0 90 180 0 90 180 0 90 180 0 90 180
Cla
mp
plas
ma
BC
AA
conc
entr
atio
ns (
µmol
/l)
(min)Leu
(min)Ile
(min)Val
h k
†*
0
3
6
9
12
15
0 30 60 90 120 150 180
OG
TT
pla
sma
gluc
ose
(mm
o/l)
Time (min)0 30 60 90 120 150 180
Time (min)
a
0
300
600
900
1,200
1,500
OG
TT
pla
sma
insu
lin(p
mol
/l)
b
0
3
6
9
12
15
18
Glucose Insulin
OG
TT
AU
Ca
c* *
†*
*†
0
12
24
36
48
60
0 5 10 15 20 25 30
GIR
(µm
olkg
-1 m
in-1
)
Time (min)
d
*
*b†
(min)α-KIC
(min)α-KMV
(min)α-KIV
i
0
100
200
300
400
500
0 30 60 90 120 150 180
Cla
mp
plas
ma
insu
lin(p
mol
/l)
Time (min)
g
2
4
6
8
0 30 60 90 120 150 180
Cla
mp
plas
ma
gluc
ose
(mm
ol/l)
Time (min)
f
0
0
15
30
45
60
75
0 5 10 15 20 25 30GIR
(µm
ol [k
g F
FM
-1] m
in-1
)
Time (min)
e
*
c†
***
** *
*
**
**
*
*
**
* * **
*
*†
**† †
‡¶
Fig. 2 Glucose and BCAAhomeostasis. OW-Untrained(black bars/squares); OW-Trained(white bars/squares); Control(striped bars/black triangles).OGTT plasma glucose (a), insulin(b), glucose and insulin AUC (c).Steady state GIR duringhyperinsulinaemic–euglycaemicclamp relative to body weight (d)and FFM (e). Clamp glucose (f),insulin (g), BCAA (h) and BCAAα-keto acid (i) concentrations.Basal plasma molar sum ofBCAAs (j) and BCAA α-ketoacids (k). α=0.05. *p<0.05 vsControl; †p<0.05 vs OW-Untrained; ‡p=0.095 vs OW-Untrained at 0 min; §p=0.054,¶p=0.088 vs Control. Means±SEM. n=9, OW groups; n=10,Controls. aGlucose AUC as(mmol/l×min)/100, Insulin AUCas pmol/l×min (×10−3).bStatistical symbols apply to OW-Trained vs Control and OW-Untrained across all time points.cStatistical symbol applies to OW-Trained vs OW-Untrained acrossall time points
2328 Diabetologia (2015) 58:2324–2335

molar sum of the BCAA α-keto acids was elevated in OW-Untrained vs Control (p<0.05) and significantly reduced byexercise (Fig. 2k).
Hormones, cytokines and conventional metabolites Com-pared with Control, OW-Untrained had greater levels of me-tabolites shown in Table 2 and decreased levels ofadiponectin. C-peptide, leptin and glucose-dependentinsulinotropic peptide (GIP) were significantly lowered byexercise (p<0.01). Other metabolites are reported in ESMTable 2.
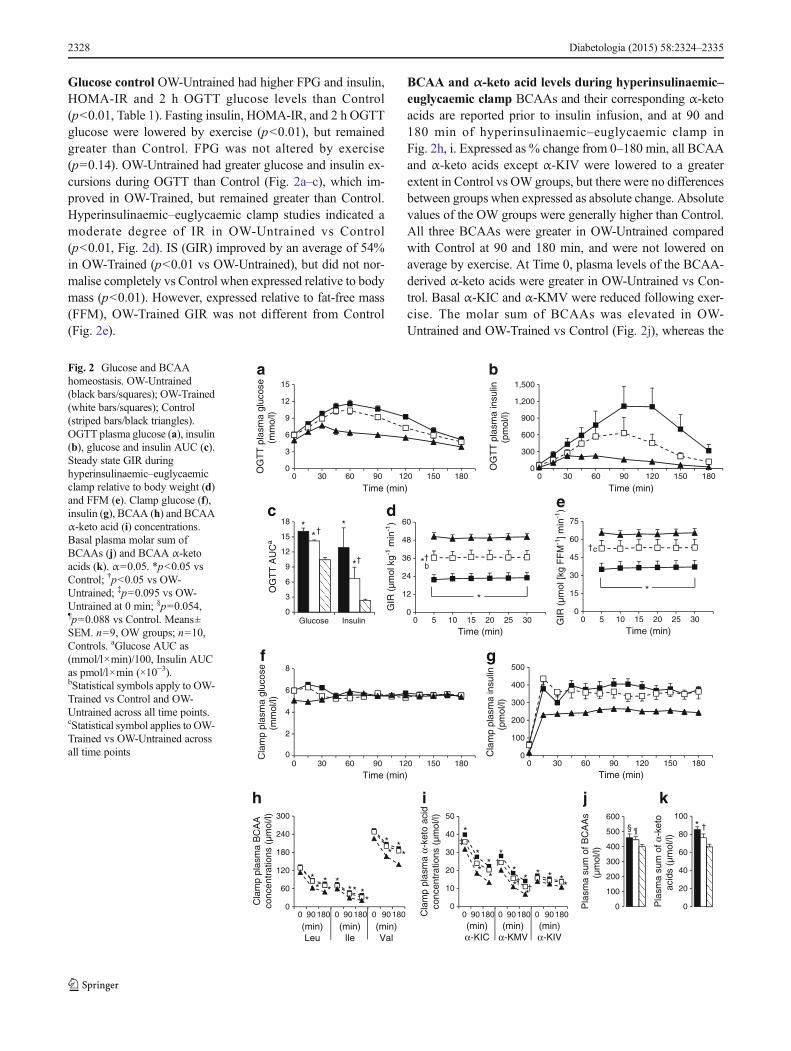
Protein turnover Relative to body mass, there were no dif-ferences between groups for endogenous whole-body leucineRa, oxidation or NOLD (Fig. 3a). Relative to FFM, leucine Ra,oxidation and NOLDwere greater in OW-Untrained and OW-Trained compared with Control, with no effect of exercise(Fig. 3b). In studies of mixed muscle, protein fractional syn-thesis rate (FSR), venous phenylalanine and leucine
concentrations reached steady state by 90 min and were notdifferent between groups (Fig. 3e, f). Phenylalanine incorpo-ration into total protein (FSR) was not different between OW-Untrained and Control (p>0.05), but increased significantlyfollowing exercise (p<0.05 OW-Trained vs Control; Fig. 3c,d).
Plasma metabolites Plasma AAs and acylcarnitines areshown in Figs 4a, d and 5a–d. Glycine and serine were signif-icantly lower, and BCAAs, phenylalanine, tyrosine andglutamate/glutamine significantly higher in OW-Untrainedvs Control. Glycine and citrulline increased in OW-Trained(p<0.05 vs OW-Untrained). The sum of BCAA was greaterin both OW groups compared with Controls (p<0.05).Among plasma acylcarnitines, only C8:1 was significantlygreater in OW-Untrained vs Control (p<0.01).
Muscle metabolites Muscle AAs and acylcarnitines areshown in Figs 4b, c, e and 5e–h. Arginine was significantly
Table 2 Hormones, cytokines and conventional metabolites
Control OW-Untrained OW-Trained
Hormones and cytokines in plasma n=10 n=13 n=9
C-peptide (nmol/l) 0.24±0.04 0.51±0.05** 0.37±0.05††
Glucagon (ng/l) 1.2±0.3 5.2±0.9** 4.1±1.0**
Leptin (μg/l) 6.3±3.1 31.6±7.4** 23.4±7.8††
Adiponectin (μg/ml) 20.5±3.0 11.8±1.4** 9.1±1.3**
GLP-1 (pg/ml) 6.7±0.8 8.9±0.9 8.9±2.0
GIP (pg/ml) 33±6 71±10** 56±12††
Growth hormone (μg/l) 2.5±1.0 0.2±0.1 0.9±0.5
Total IGF-1 (nmol/l) 16.2±0.6 18.1±1.6 16.01±1.4
TNF-α (pg/ml) 2.2±0.1 2.7±0.2 2.4±0.1
hsCRP (nmol/l) 10.6±3.3 32.5±5.2** 26.1±4.9
Conventional metabolites in plasma
Pyruvate (mmol/l) 0.04±0.01 0.07±0.01 0.06±0.01
Lactate (mmol/l) 1.03±0.05 1.21±0.09 1.14±0.13
Glycerol (mmol/l) 0.09±0.01 0.16±0.02** 0.14±0.02
NEFA (mmol/l) 0.47±0.03 0.65±0.05 0.64±0.06
Ketones (μmol/l) 77±13 100±23 113±46
β-Hydroxybutyrate (μmol/l) 69±12 91±21 98±42
ALT (μkat/l) 0.14±0.02 0.30±0.03** 0.24±0.02**
AST (μkat/l) 0.46±0.04 0.59±0.07 0.53±0.03
Muscle metabolites n=8 n=7 n=7
ATP (μmol l−1 g tissue−1) 10.9±1.5 10.0±0.7 10.2±1.4
Phosphocreatine (μmol/l l−1 g tissue−1) 16.8±2.0 24.5±2.0‡ 22.2±2.1
Total creatine (μmol/l l−1 g tissue−1) 33.1±3.1 45.0±4.1‡ 40.7±3.1
Values are expressed as means±SEM from fasting plasma sample or first muscle biopsy on protein turnover test day
Plasma α=0.01, muscle α=0.05
**p<0.01 vs Control; †† p<0.01 vs OW-Untrained. For muscle metabolites only, ‡ p<0.05 vs Control
ALT: alanine transaminase; AST: aspartate transaminase; GLP-1: glucagon-like peptide-1; hsCRP: high sensitivity C-reactive protein
Diabetologia (2015) 58:2324–2335 2329
lowered by exercise in OW (p<0.01). No individual muscleacylcarnitines were significantly different between groups(p>0.01), but the sum of C8-C18 even-chained, saturatedspecies was elevated in both OW groups compared with Con-trol (p<0.05).
Urinary metabolites BCAA-related urine metabolites areshown in Fig. 4f, g. Glycine conjugates of BCAA catabolites(isobutyrylglycine, isovalerylglycine, tiglylglycine) were sig-nificantly lower in OW-Untrained vs Control (p<0.05), andtended to increase or significantly increased following
exercise. Similarly, gentisic acid, 4-hydroxybenzoic acid(PHBA) and hydroquinone were lower in OW-Untrained vsControl and increased following exercise (p<0.05).
Baseline levels and training-induced changes in metabolitescorrelate with IS ESMTable 3 reports individual componentsof factors generated from PCA analyses. The plasma BCAA-related factor, conventional metabolite factor, sum ofisoleucine/phenylalanine/tyrosine and sum of the BCAA α-keto acids were most strongly associated with measures of IS(GIR, HOMA-IR) (ESM Fig. 3, ESM Table 4). At baseline,the sum of medium-long chain muscle acylcarnitines was thebest predictor of improvement in GIR by exercise, with lowerlevels being associated with the largest improvements(Fig. 6e). Baseline plasma BCAAs and α-keto acids werenot predictive of ΔGIR (Fig. 6a, c), but change in the sumof BCAAs showed a strong positive correlation (Fig. 6b).These analyses were performed on the basal blood samplecollected on the morning of the clamp procedure using liquidchromatography (LC)-MS/MS to separate leucine andisoleucine peaks (as opposed to a single leucine/isoleucinepeak when measured by flow-injection-MS/MS). In contrast,change in sum plasma BCAA α-keto acids was not correlatedwithΔGIR (Fig. 6d). The small changes that occurred in bodymass, fat mass or FFM were not correlated with ΔGIR ormetabolite levels reported in Fig. 6 (data not shown).
Discussion
In this study, we sought to understand the relationships betweenwhole-body leucine flux, muscle protein synthesis (MPS),small molecule metabolites and glucose homeostasis in lean,insulin sensitive and OW, insulin-resistant individuals, and tounderstand the effects of a combined aerobic and resistanceexercise intervention in the OW participants on these variables.We hypothesised that the combined exercise programme woulddrive BCAAs into exercising muscle for oxidation in responseto both components, and for protein synthesis in response to theresistance component, and that the resultant lowering of plasmaBCAAs in the OW individuals would be correlated with im-provements in glucose handling and homeostasis.
Our hypotheses were based on known adaptations that oc-cur in muscle during aerobic and resistance exercise. Indepen-dently, aerobic and resistance exercise training can improvethe oxidative potential (i.e. number and/or function) of musclemitochondria [14, 15]. Because significant portions of BCAAand fatty acid catabolism occur in mitochondria, improvementin mitochondrial oxidative capacity will likely impact theseprocesses. We did not directly assess mitochondrial density orfunction, but measures of aerobic fitness and endurance in-cludingV
�
O2peak and time to exhaustion (TTE) were improved,
OW-Trained
OW-Untrained
*
* **
**
* **
0.01
0.02
0.03
0.04
0.05
0.06
FS
R (
%/h
)
*
c d†
0.01
0.02
0.03
0.04
0.05
0.06
FS
R (
%/h
)
0 0
e
090 15
021
027
033
0
2
4
6
8
Leuc
ine
E, v
ein
(tra
cer/
trac
ee, %
)
Time (min)
90 150
210
270
330
Time (min)
f
0
2
4
6
8
10
Phe
nyla
lani
ne E
, vei
n(t
race
r/tr
acee
, %)
-0.4
0.4
0.8
1.2
1.6
2.0
Oxidation NOLD
WB
leuc
ine
turn
over
(µm
ol k
g-1 m
in-1
)
-0.5
0.5
1.0
1.5
2.0
2.5
3.0
WB
leuc
ine
turn
over
(µm
ol [k
g F
FM
-1] m
in-1
)
0
a
b
0
Net balanceLeu Ra
Oxidation NOLD Net balanceLeu Ra
***
Fig. 3 Whole-body (WB) leucine turnover and MPS. OW-Untrained(black bars/squares); OW-Trained (white bars/squares); Control (stripedbars/black triangles). Leucine turnover relative to bodymass (a) and FFM(b). Mixed muscle protein FSR group averages (c) and individual chang-es in OW groups (d). Steady state venous leucine (e) and phenylalanine(f) enrichment (E). α=0.05. *p<0.05, **p<0.01 vs Control; †p<0.05 vsOW-Untrained. Means±SEM, except in (d). n=9, OW groups (a, b);n=8, OW groups (c–f); n=10, Control
2330 Diabetologia (2015) 58:2324–2335

comparable with previous findings in participants completinga similar exercise programme [28]. Despite aerobic improve-ments, the rate of whole-body leucine oxidation was not al-tered following training. Instead, leucine oxidation relative toFFM was elevated at baseline in OW-Untrained vs Controls,suggesting that a compensatory increase in muscle BCAAoxidation may have been activated in the OW state [31]. Thisis consistent with an increase in BCAA-derived metabolites inobese compared with lean individuals that we have reportedpreviously [5], as well as other studies reporting increases inmitochondrial oxidation of substrates in obese states [10, 31].However, increases in V
�
O2peak following training in this co-hort were moderate, suggesting a more intense aerobic com-ponent may have elicited a larger change in aerobic capacitywith a more pronounced impact on substrate oxidation.
Resistance exercise is a potent stimulator of MPS [32,33]. We observed an increase in MPS (FSR) in OW-Trained,likely driven in part by the acute response to the last exercisesession. As might be predicted, increases in FSR were cor-related with increases in FFM (R=0.881, p=0.004). Howev-er, changes in body composition including body mass, fatmass and FFM did not correlate to changes in BCAA levelsor IS. This is most likely explained by the fact that changesin body composition measures were relatively small com-pared with changes in variables correlating with improvedIS, such as the change in molar sum of BCAAs. Participants
were asked not to change their diets, and dietary recordscollected throughout the study indicate caloric intake andmacronutrient distribution did not change, nor were any ofthese variables associated with changes in protein turnoveror IS. Nevertheless, we acknowledge the limitations of die-tary assessment methodologies, and we cannot rule out thatother factors, such as energy balance state and protein in-take, could affect adaptive responses to training [34]. Inparticular, energy deficit may be required to induce morefavourable metabolic outcomes. However, we note that esti-mated energy requirements vs actual intake (less estimatedenergy cost of exercise) in our participants were not corre-lated with protein turnover or IS measures (data not shown).
Although exercise did not affect fastingmeasures of whole-body leucine breakdown, synthesis or oxidation, it is possiblethat exercise could have resulted in an improved response ofproteolysis to insulin and/or better AA disposal in the post-prandial state. In terms of metabolic flexibility, exercise didnot significantly alter respiratory exchange ratio (RER),fasting glycerol or NEFA, or glycerol/NEFA responses(AUCs) during OGTT. However, glycerol and NEFA AUCsduring hyperinsulinaemic–euglycaemic clamp decreased inOW-Trained towards Control values (ESM Fig. 4), indicatinglipolysis is more responsive to the suppressive effects of insu-lin following exercise. While we cannot speculate on the re-sponse of protein metabolism to glucose and insulin, OW-
0
100
200
300
400
500
Pla
sma
sum
of
BC
AA
s (µ
mol
/l)
0
10
20
30
40
Mus
cle
sum
of
BC
AA
s (µ
mol
/l)
0
50
100
150
200
250
Glx0
15
30
45
60
75
90
Gly Ala Ser Pro Val Leu/Ile Met His Phe Tyr Asx Orn Cit Arg
Mus
cle
amin
o ac
ids
(µm
ol/l)
b
a
d
0
Isobutyrylglycine
Isovalerylglycine
Tiglylglycine
Gentisic acid
HydroquinonePHBA
0.7
1.4
2.1
2.8
3.5
Urin
ary
met
abol
ites
(pea
k ar
ea ×
10-5
)
†
e f
**
**
****
0
90
180
270
360
450
Gly Ala Ser Pro Val Leu/Ile Met His Phe Tyr Asx Glx Orn Cit Arg
Pla
sma
amin
o ac
ids
(µm
ol/l)
†
**
†
†
**
******
*
*
****
****
**** ****
†*
* * ***
0
4
8
12
16
*
c
g
††
† ††
Fig. 4 AAs and urinarymetabolites. OW-Untrained(black); OW-Trained (white);Control (striped). AAconcentrations (μmol/l) in plasma(a, d) and muscle (b, c, e).Relative abundance of urinarymetabolites (f, g). (a–c) α=0.01;(d–g) α=0.05. *p<0.05,**p<0.01 vs Control; †p<0.05,††p<0.01 vs OW-Untrained.Means±SEM. n=13, OW-Untrained; n=9, OW-Trained;n=10, Control
Diabetologia (2015) 58:2324–2335 2331
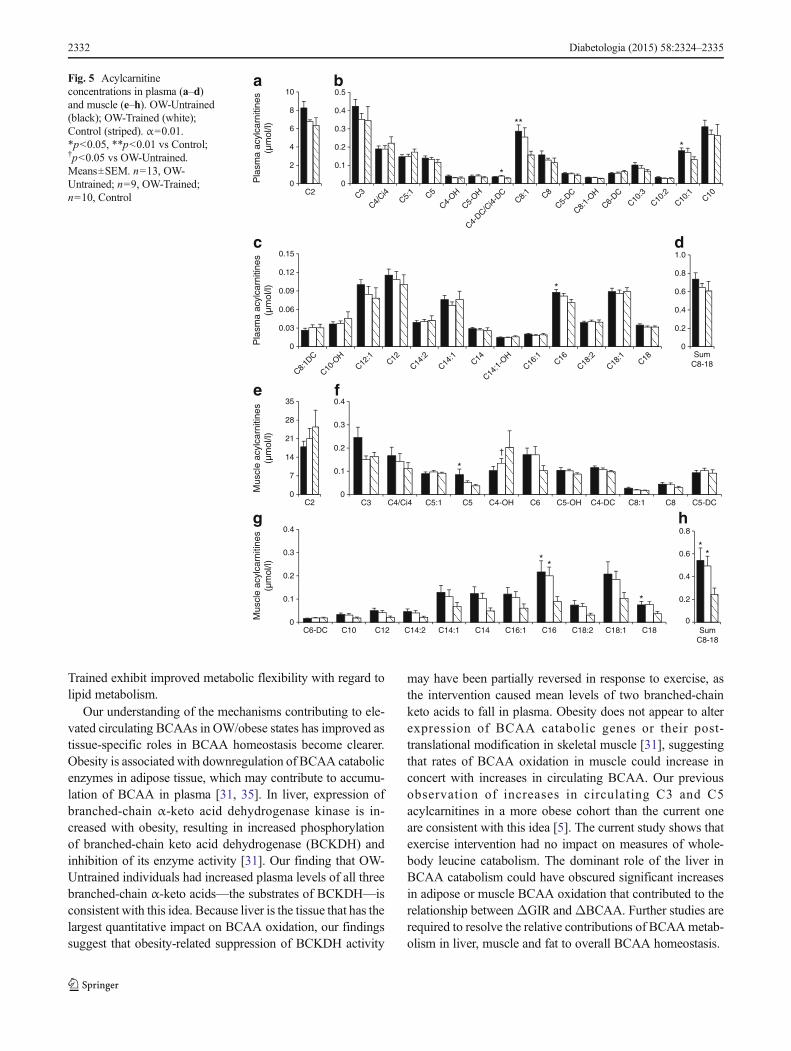
Trained exhibit improved metabolic flexibility with regard tolipid metabolism.
Our understanding of the mechanisms contributing to ele-vated circulating BCAAs in OW/obese states has improved astissue-specific roles in BCAA homeostasis become clearer.Obesity is associated with downregulation of BCAA catabolicenzymes in adipose tissue, which may contribute to accumu-lation of BCAA in plasma [31, 35]. In liver, expression ofbranched-chain α-keto acid dehydrogenase kinase is in-creased with obesity, resulting in increased phosphorylationof branched-chain keto acid dehydrogenase (BCKDH) andinhibition of its enzyme activity [31]. Our finding that OW-Untrained individuals had increased plasma levels of all threebranched-chain α-keto acids—the substrates of BCKDH—isconsistent with this idea. Because liver is the tissue that has thelargest quantitative impact on BCAA oxidation, our findingssuggest that obesity-related suppression of BCKDH activity
may have been partially reversed in response to exercise, asthe intervention caused mean levels of two branched-chainketo acids to fall in plasma. Obesity does not appear to alterexpression of BCAA catabolic genes or their post-translational modification in skeletal muscle [31], suggestingthat rates of BCAA oxidation in muscle could increase inconcert with increases in circulating BCAA. Our previousobservation of increases in circulating C3 and C5acylcarnitines in a more obese cohort than the current oneare consistent with this idea [5]. The current study shows thatexercise intervention had no impact on measures of whole-body leucine catabolism. The dominant role of the liver inBCAA catabolism could have obscured significant increasesin adipose or muscle BCAA oxidation that contributed to therelationship betweenΔGIR andΔBCAA. Further studies arerequired to resolve the relative contributions of BCAAmetab-olism in liver, muscle and fat to overall BCAA homeostasis.
a b
c d
e f
g h
0
0.1
0.2
0.3
0.4
0.5
0
2
4
6
8
10
C2
*
*
0
0.1
0.2
0.3
0.4
0
7
14
21
28
35
C2
**
*
0
0.2
0.4
0.6
0.8
1.0
SumC8-18
*
0
0.1
0.2
0.3
0.4
C3 C4/Ci4 C5:1 C5 C4-OH C6 C5-OH C4-DC C8:1 C8 C5-DC
C6-DC C10 C12 C14:2 C14:1 C14 C16:1 C16 C18:2 C18:1 C18
**
*
**
†
0.03
0.06
0.09
0.12
0.15
0
0.2
0.4
0.6
0.8
SumC8-18
0
Pla
sma
acyl
carn
itine
s(µ
mol
/l)M
uscl
e ac
ylca
rniti
nes
(µm
ol/l)
Mus
cle
acyl
carn
itine
s(µ
mol
/l)P
lasm
a ac
ylca
rniti
nes
(µm
ol/l)
C3
C4/Ci4
C5:1 C5
C4-OH
C5-OH
C4-DC/C
i4-DC
C8:1 C8
C5-DC
C8:1-
OH
C6-DC
C10:3
C10:2
C10:1
C10
C8:1D
C
C10-O
HC12
:1C12
C14:2
C14:1
C14
C14:1
-OH
C16:1
C16
C18:2
C18:1
C18
Fig. 5 Acylcarnitineconcentrations in plasma (a–d)and muscle (e–h). OW-Untrained(black); OW-Trained (white);Control (striped). α=0.01.*p<0.05, **p<0.01 vs Control;†p<0.05 vs OW-Untrained.Means±SEM. n=13, OW-Untrained; n=9, OW-Trained;n=10, Control
2332 Diabetologia (2015) 58:2324–2335

Acylcarnitines in metabolic profiles report on the pool ofmitochondrial CoA metabolites and the β-oxidative pathway,and skeletal muscle is thought to be a principal contributor tothe plasma acylcarnitine pool [10, 36]. A cluster of medium- tolong-chain acylcarnitines is elevated in the fed state in skeletalmuscle of obese and/or insulin-resistant animals and humans[10, 36, 37]. Rodent studies demonstrate that BCAA supple-mentation of high-fat diets exacerbates accumulation of theselipid metabolites in muscle [5]. In the current study, we ob-served trends for decreases in these metabolites in muscle andplasma of Control and OW-Trained participants compared withOW-Untrained, but no decrease in the average molar sum ofmuscle C8-18 species. Instead, there was a modest associationbetween increases in muscle sum of C8-18 acylcarnitines andimprovement in GIR. This is consistent with a recent report inwhich various exercise regimens produced increases in severaleven-chain muscle acylcarnitines, which positively correlatedwith increased expression of genes involved in uptake and
oxidation of fatty acids in muscle and improved IS [28]. Ele-vated levels of these by-products of β-oxidation in the fastedstate in OW-Trained suggest an improvement in metabolic flex-ibility [38]. Improvement of GIR with exercise was greater inthose with lower baseline C8-C18 levels in muscle, which mayindicate these individuals had the least constraint to increaseflux from C18 to C2 in response to exercise.
Consistent with previous reports, we found decreasedlevels of circulating glycine in the OW-Untrained group,which increased towards Control values following exercise[5, 39]. Glycine is important for Phase II detoxification inthe liver, where excess metabolites are conjugated to glycinefor excretion [40]. Consistent with this, several glycine con-jugates (products of BCAA catabolism: isobutyrylglycine,2-methylbutyryl-glycine/isovalerylglycine and tiglylglycine)were decreased in urine of OW-Untrained individuals com-pared with Controls, but not in OW-Trained. Levels of otherurinary metabolites were also decreased in OW-Untrained vs
0
5
10
15
20
25
0 0.4 0.8 1.2 1.6
0
5
10
15
20
25
0
5
10
15
20
25
-150 -100 -50 0 50 1000 150 300 450 600
0
5
10
15
20
25
0
5
10
15
20
25
-0.8 -0.4 0 0.4 0.8
0
5
10
15
20
25
0 40 80 120 160 -30 -20 -10 0 10 20
**
**
a b
c d
e f
ΔGIR
(µm
ol g
luco
se k
g-1
min
-1)
Muscle baseline sum C8-18 acylcarnitines(µmol/l)
ΔGIR
(µm
ol g
luco
se k
g-1
min
-1)
Plasma Δ sum BCAA(µmol/l)
ΔGIR
(µm
ol g
luco
se k
g-1
min
-1)
Plasma baseline sum BCAA(µmol/l)
ΔGIR
(µm
ol g
luco
se k
g-1
min
-1)
Plasma baseline sum α-keto acids(µmol/l)
ΔGIR
(µm
ol g
luco
se k
g-1
min
-1)
Muscle Δ sum C8-18 acylcarnitines(µmol/l)
ΔGIR
(µm
ol g
luco
se k
g-1
min
-1)
Plasma Δ sum α-keto acids(µmol/l)
Fig. 6 Plasma and musclemetabolite factor relationshipswith GIR. Scatter plots depictingplasma baseline sum of BCAAs(a), Δ sum of BCAAs (b),baseline sum of the BCAAα-ketoacids (c), Δ sum of α-keto acids(d) in plasma, and baseline sum ofeven-chain unsaturatedacylcarnitines C8-C18 (e), and Δsum of C8-18 acylcarnitines (f) inmuscle vs ΔGIR, OWparticipants. **p<0.01.Correlation matrices in ESMTable 4
Diabetologia (2015) 58:2324–2335 2333
Control, and increased following exercise. These changesmight reflect alterations in gut-microbial catabolism oftyrosine, phenylalanine and dietary polyphenolic compounds[41, 42]. A recent study supports an important role of the gutmicrobiota in regulation of BCAA and aromatic AAhomeostasis, demonstrating increases in these AAs and theirmetabolites in germ-free mice that received microbiota trans-plants from obese compared with lean human twins [43]. The-se data suggest an important role for glycine and themicrobiome in eliminating excess acyl groups derived fromBCAA and aromatic AA metabolism. Our data suggest thatthese processes are more efficient in Controls vsOW-Untrained, and that they improve following exercise.Thus, the main finding of our study is that rather than increas-ing BCAA disposal through oxidation and turnover, exercisemay mediate interactions between BCAA metabolism and ISvia more efficient elimination of BCAA- and aromatic AA-derived acyl groups through formation of glycine adducts.
We acknowledge several limitations of our study. Oursmall sample size may limit the power to detect certain differ-ences between groups, limiting extrapolation of our findingsto a wider population without confirmatory cohorts. We choseto assess post-training measures 24–36 h after the last bout ofexercise. While it is known that exercise has acute effects onmeasures of IS and protein turnover [32, 44], the participantswere exercising 3 days/week. Therefore, 24–36 h after anexercise session represents their ‘new normal’ metabolic stateon days they were not exercising and represents a combinationof chronic and acute exercise effects. With regard to nutrition,we acknowledge that diet could influence the individual re-sponse to training, and we also appreciate the limitations ofdietary assessment methodologies. It is possible that the ener-gy content and macronutrient composition of individual die-tary practices influenced study outcomes.
In summary, a decrease in the molar sum of circulatingBCAAs was the best predictor of improvement in IS inducedby a combined resistance and aerobic exercise intervention.High levels of circulating glycine in lean individuals andincreased glycine in the OW group with exercise training,along with altered levels of several urinary glycine adductsand other metabolites, suggest that exercise induces moreefficient elimination of excess acyl groups derived fromBCAA and aromatic AA metabolism by urinary excretion.These findings, coupled with other reports of strong negativeassociations between glycine and insulin-resistant states [5,45], suggest that stimulation of glycine adduct formationmay be responsible for part of the exercise-induced changesin whole-body insulin action. A better understanding of thecontributions of liver, muscle, adipose tissue and the gutmicrobiota to these processes during nutrient excess and withexercise will further our understanding of the systemicchanges that occur during the development of IR and mayhelp to identify novel targets for therapy.
Acknowledgements We thank the study participants, and undergradu-ate interns (of Duke Cardiology) who helped with exercise training; andM-Q. Zheng and S. Medina of the University of Texas Medical Branchfor technical assistance. We acknowledge funding support from the Na-tional Institutes of Health, the Claude D. Pepper Older Americans Inde-pendence Center and the CVand Metabolic Research Unit of Pfizer®.
Funding This work was supported by grant P01-DK58398 (NationalInstitutes of Health, National Institute of Diabetes and Digestive andKidney Diseases), a grant from the Claude D. Pepper Older AmericansIndependence Center (P30 AG024832) and a grant from the CV andMetabolic Research Unit of Pfizer®. KNPS was supported by NIH grant5T32 AG000029.
Duality of interest MJB, JKT and TPR are or were employees of theCVandMetabolic Research Unit, Pfizer. CBN is a paid consultant for theCVand Metabolic Research Unit of Pfizer. All other authors declare thatthere is no duality of interest associated with their contribution to thismanuscript.
Author contributions ELG participated in all aspects of the study andwrote the manuscript. CAS, HNA, EV, MJB, JKT, TPR, CWB, CBN andWEK participated in conceptual design. LWP, KMH, CAS, LEP, HNA,KPS and WEK participated in data collection. LWP, PJW, JRB, MJM,ORI, RDS, KNPS and EV participated in data analyses. KMH, CAS,JRB, MJM, MJB, JKT, TPR, CBN and WEK participated in data inter-pretation. JRB, RDS, MJB, CBN and WEK contributed to writing themanuscript; all authors revised the manuscript critically for importantintellectual content and approved the final version. ELG, CBN andWEK take full responsibility for the study design, access to data andthe decision to submit and publish the manuscript.
References
1. Newgard CB (2012) Interplay between lipids and branched-chainamino acids in development of insulin resistance. Cell Metab 15:606–614
2. Felig P, Marliss E, Cahill GF (1969) Plasma amino acid levels andinsulin secretion in obesity. N Engl J Med 281:811–816
3. Caballero B, Finer N, Wurtman RJ (1988) Plasma amino acids andinsulin levels in obesity: response to carbohydrate intake and tryp-tophan supplements. Metabolism 37:672–676
4. Solini A, Bonora E, Bonadonna R, Castellino P, DeFronzo RA(1997) Protein metabolism in human obesity: relationship with glu-cose and lipid metabolism and with visceral adipose tissue. J ClinEndocrinol Metab 82:2552–2558
5. Newgard CB, An J, Bain JR et al (2009) A branched-chain aminoacid-related metabolic signature that differentiates obese and leanhumans and contributes to insulin resistance. CellMetab 9:311–326
6. Tai ES, Tan ML, Stevens RD et al (2010) Insulin resistance isassociated with a metabolic profile of altered protein metabolismin Chinese and Asian-Indian men. Diabetologia 53:757–767
7. Huffman KM, Shah SH, Stevens RD et al (2009) Relationshipsbetween circulating metabolic intermediates and insulin action inoverweight to obese, inactive men and women. Diabetes Care 32:1678–1683
8. Shah SH, Crosslin DR, Haynes CS et al (2012) Branched-chainamino acid levels are associated with improvement in insulin resis-tance with weight loss. Diabetologia 55:321–330
9. Wang TJ, Larson MG, Vasan RS et al (2011) Metabolite profilesand the risk of developing diabetes. Nat Med 17:448–453
2334 Diabetologia (2015) 58:2324–2335
10. Koves TR, Ussher JR, Noland RC et al (2008) Mitochondrial over-load and incomplete fatty acid oxidation contribute to skeletal mus-cle insulin resistance. Cell Metab 7:45–56
11. Muoio DM, Newgard CB (2008) Molecular and metabolic mecha-nisms of insulin resistance and beta-cell failure in type 2 diabetes.Nat Rev Mol Cell Biol 9:193–205
12. Saltiel AR, Kahn CR (2001) Insulin signalling and the regulation ofglucose and lipid metabolism. Nature 414:799–806
13. Katzmarzyk PT, Leon AS, Wilmore JH et al (2003) Targeting themetabolic syndrome with exercise: evidence from the HERITAGEFamily Study. Med Sci Sports Exerc 35:1703–1709
14. Jacobs RA, Lundby C (2013)Mitochondria express enhanced qual-ity as well as quantity in association with aerobic fitness acrossrecreationally active individuals up to elite athletes. J ApplPhysiol 114:344–350
15. Sparks LM, Johannsen NM, Church TS et al (2013) Nine months ofcombined training improves ex vivo skeletal muscle metabolism inindividuals with type 2 diabetes. J Clin Endocrinol Metab 98:1694–1702
16. Atherton PJ, Smith K (2012) Muscle protein synthesis in responseto nutrition and exercise. J Physiol 590:1049–1057
17. Millington DS, Kodo N, Norwood DL, Roe CR (1990) Tandemmass spectrometry: a new method for acylcarnitine profiling withpotential for neonatal screening for inborn errors of metabolism. JInherit Metab Dis 13:321–324
18. Olson KC, Chen G, Lynch CJ (2013) Quantification of branched-chain keto acids in tissue by ultra fast liquid chromatography-massspectrometry. Anal Biochem 439:116–122
19. Patterson BW, Carraro F, Wolfe RR (1993) Measurement of 15Nenrichment in multiple amino acids and urea in a single analysis bygas chromatography/mass spectrometry. Biol Mass Spectrom 22:518–523
20. Wolfe RR, Chinkes DL (2005) Isotope tracers in metabolic researchprinciples and practice of kinetic analysis. Wiley-Liss, Hobokon
21. Magnes C, Sinner FM, Regittnig W, Pieber TR (2005) LC/MS/MSmethod for quantitative determination of long-chain fatty acyl-CoAs. Anal Chem 77:2889–2894
22. Ferrara CT, Wang P, Neto EC et al (2008) Genetic networks of livermetabolism revealed by integration of metabolic and transcriptionalprofiling. PLoS Genet 4:e1000034
23. Minkler PE, Kerner J, Ingalls ST, Hoppel CL (2008) Novel isola-tion procedure for short-, medium-, and long-chain acyl-coenzymeA esters from tissue. Anal Biochem 376:275–276
24. Harris RC, Hultman E, Nordesjo LO (1974) Glycogen, glycolyticintermediates and high-energy phosphates determined in biopsysamples of musculus quadriceps femoris of man at rest. Methodsand variance of values. Scand J Clin Lab Invest 33:109–120
25. Stein SE (1999) An integrated method for spectrum extraction andcompound identification from gas chromatography/mass spectrom-etry data. J Am Soc Mass Spectrom 10:770–781
26. Halket JM, Przyborowska A, Stein SE et al (1999) Deconvolutiongas chromatography/mass spectrometry of urinary organic acids–potential for pattern recognition and automated identification ofmetabolic disorders. Rapid Commun Mass Spectrom 13:279–284
27. Schwenk WF, Beaufrere B, Haymond MW (1985) Use of recipro-cal pool specific activities to model leucine metabolism in humans.Am J Physiol 249:E646–E650
28. Huffman KM, Koves TR, Hubal MJ et al (2014) Metabolite signa-tures of exercise training in human skeletal muscle relate to mito-chondrial remodelling and cardiometabolic fitness. Diabetologia57:2282–2295
29. Shah SH, Bain JR, Muehlbauer MJ et al (2010) Association of aperipheral blood metabolic profile with coronary artery disease andrisk of subsequent cardiovascular events. Circ Cardiovasc Genet 3:207–U233
30. Batch BC, Shah SH, Newgard CB et al (2013) Branched chainamino acids are novel biomarkers for discrimination of metabolicwellness. Metabolism 62:961–969
31. She P, Van Horn C, Reid T, Hutson SM, Cooney RN, Lynch CJ(2007) Obesity-related elevations in plasma leucine are associatedwith alterations in enzymes involved in branched-chain amino acidmetabolism. Am J Physiol Endocrinol Metab 293:E1552–E1563
32. Biolo G, Maggi SP, Williams BD, Tipton KD, Wolfe RR (1995)Increased rates of muscle protein turnover and amino acid transportafter resistance exercise in humans. Am J Physiol 268:E514–E520
33. Phillips SM, Parise G, Roy BD, Tipton KD, Wolfe RR,Tamopolsky MA (2002) Resistance-training-induced adaptationsin skeletal muscle protein turnover in the fed state. Can J PhysiolPharmacol 80:1045–1053
34. Pasiakos SM, Cao JJ, Margolis LM et al (2013) Effects of high-protein diets on fat-free mass and muscle protein synthesis follow-ing weight loss: a randomized controlled trial. FASEB J 27:3837–3847
35. Herman MA, She P, Peroni OD et al (2010) Adipose tissuebranched chain amino acid (BCAA) metabolism modulates circu-lating BCAA levels. J Biol Chem 285:11348–11356
36. Koves TR, Li P, An J et al (2005) Peroxisome proliferator-activatedreceptor-gamma co-activator 1 alpha-mediated metabolic remodel-ing of skeletal myocytes mimics exercise training and reverseslipid-induced mitochondrial inefficiency. J Biol Chem 280:33588–33598
37. Kien CL, Bunn JY, Poynter ME et al (2013) A lipidomics analysisof the relationship between dietary fatty acid composition and in-sulin sensitivity in young adults. Diabetes 62:1054–1063
38. Galgani JE, Moro C, Ravussin E (2008) Metabolic flexibility andinsulin resistance. Am J Physiol Endocrinol Metab 295:E1009–E1017
39. Huffman KM, Slentz CA, Bateman LA et al (2011) Exercise-induced changes in metabolic intermediates, hormones, and inflam-matory markers associated with improvements in insulin sensitivi-ty. Diabetes Care 34:174–176
40. Costa CG, Guerand WS, Struys EA et al (2000) Quantitativeanalysis of urinary acylglycines for the diagnosis of beta-oxidation defects using GC-NCI-MS. J Pharm Biomed Anal21:1215–1224
41. Zheng X, Xie G, Zhao A et al (2011) The footprints of gutmicrobial-mammalian co-metabolism. J Proteome Res 10:5512–5522
42. Moco S, Martin FP, Rezzi S (2012) Metabolomics view on gutmicrobiome modulation by polyphenol-rich foods. J ProteomeRes 11:4781–4790
43. Ridaura VK, Faith JJ, Rey FE et al (2013) Gut microbiota fromtwins discordant for obesity modulate metabolism in mice. Science341:1241214
44. Goodyear LJ, Kahn BB (1998) Exercise, glucose transport, andinsulin sensitivity. Annu Rev Med 49:235–261
45. Thalacker-Mercer AE, Ingram KH, Guo F, Ilkayeva O, NewgardCB, Garvey WT (2014) BMI, RQ, diabetes, and sex affect therelationships between amino acids and clamp measures of insulinaction in humans. Diabetes 63:791–800
Diabetologia (2015) 58:2324–2335 2335