impact of biochar on the water holding capacity of loamy sand soil
TRANSCRIPT
ORIGINAL RESEARCH Open Access
Impact of biochar on the water holding capacityof loamy sand soilOk-Youn Yu1*, Brian Raichle1 and Sam Sink2
Abstract
With the rise in global population and increased agricultural requirements comes an increasing need for freshwater.Currently, it is estimated that approximately 75% of fresh water consumption is for the growth of agricultural crops,and only 10% to 30% of this water is actually made available to plants. It is widely accepted that farming practiceswhich rely heavily on chemical fertilizers and unsustainable land management practices have led in many regionsto infertile sandy soils with reduced water holding capacity and insufficient amounts of organic matter. Combinedwith increasing global population, the need to better manage fresh water use, particularly agricultural usage, isparamount. The use of biochar as a soil amendment has been suggested as a way to increase water holdingcapacity, but only limited quantitative studies exist in terms of the effectiveness of biochar in increasing a soil'swater holding capacity. The main purpose of this study was to determine the effect of woody biochar amendment(yellow pine from pyrolysis at 400°C) on the water holding capacity of loamy sand soil with different mixture rates.Results show a doubling in water holding capacity by mass using a 9% mixture of biochar (equivalent to 195 metricton/ha), which is an agriculturally relevant concentration. High percentage mixtures of biochar increase waterholding capacity dramatically. These results suggest the use of biochar has potential to mitigate drought andincrease crop yields in loamy sand soil.
Keywords: Biochar; Water holding capacity; Loamy sand soil; Pyrolysis
BackgroundAgriculture is the single largest consumer of fresh waterand accounts for about 75% of anthropogenic freshwater use [1]. According to Wallace [1], on average 63%of fresh water applied to agricultural lands is lost toevaporation and runoff. Rainwater and irrigation waterthat is not absorbed by soils is capable of transportingfertilizers and pesticides into watersheds creating non-point pollution. Due to the increased use of chemical fer-tilizers and the highly inefficient use of water, there hasbeen an increase in non-point pollution in agriculturalareas around the world [2]. With the world's populationset to increase by 65% (i.e., 3.7 billion people) by 2050, theadditional food required to feed future generations willput further pressure on freshwater resources [1].The United States Department of Agriculture (USDA)
reported that 8.7 million tons of commercial nitrogenfertilizer and an additional 1.1 million tons of animal
manure were added to agricultural lands in the USA [3].Table 1 shows that over 500,000 tons of chemical nitrogenfertilizer and animal manure are annually distributed toagricultural lands in the southeastern USA, the highestareal rate in the country [3]. As seen in Table 2, nearly50% of nitrogen fertilizer was lost through runoff andleaching [3]. Agricultural land in the southeastern USA istypically comprised of loamy sand soil, whose inability tohold water makes it more prone to fertilizer loss [3].Biochar, or charcoal produced for agricultural usage, is
produced from thermal decomposition of organic materialunder reduced oxygen conditions at temperatures above700°C [4]. The microscopic structure of biochar is one ofthe primary determinants in its soil conditioning proper-ties; the surface area of the pre-charred source materialcan be increased several thousand fold [5]. This increasedsurface area is the result of thermal decomposition ofthe organic material through which volatiles are drivenoff and the remaining structure is comprised of highlyconcentrated carbon chains. These chains can take ondifferent organizational patterns based on the production
* Correspondence: [email protected] State University, Boone, NC 28608, USAFull list of author information is available at the end of the article
© Yu et al. This is an open access article distributed under the terms of the Creative Commons Attribution License (http://creativecommons.org/licenses/by/2.0), which permits unrestricted use, distribution, and reproduction in any medium, providedthe original work is properly cited.
Yu et al. International Journal of Energy and Environmental Engineering
2013
2013, 4:44http://www.journal-ijeee.com/content/4/1/44

temperature, with increased temperatures leading toincreased organization [4].The most famous example of agricultural biochar
usage is the pre-Columbian Terra Preta soils of theAmazon River basin. The ancient Amazonian peoplebuilt up the Terra Preta by adding large quantities ofcharcoal to the soil to amend the nutrient poor soils ofthe rainforest [6]. Terra Preta is found near large, well-established Amazon Indian villages, suggesting the causalrelationship between agricultural stability and populationexpansion [6].The practice of adding charcoal to degraded soils was
deemed obsolete after the industrialization of chemicalfertilizers. However, due to the negative effects of chemicalfertilizers on modern agricultural soils and the environ-ment, and the concern for increasing atmospheric carbon,there has been a renewed interest in charcoal-basedsoil amendment [7]. Much of this interest is focusedon biochar. The claims for biochar are many: largercrop yields, decreased fertilizer requirements, greatermicrobial activity, reductions in greenhouse gas emissions
from fields, greater soil water holding capacity, droughtmitigation, and increased soil organic carbon content(SOC), which can improve the physical properties of soil.Further, carbon sequestration benefits of biochar soilamendment have been heavily studied [8-11].Sohi et al. [12] showed that soils with a high water
holding capacity produce increased crop yields and a de-creased need for irrigation. Singh et al. [13] suggested thatthe increased porosity of biochar increases water retentionin soils, and the enhancement depends on biochar feed-stock, soil type, and mixture rates. Nutrients dissolved inthe water may also be retained in the soil so plants may bebetter able to access the nutrients [4]. To promote the useof biochar soil amendment, it is important to understandthe mechanism of biochar-amended water retention, tocharacterize the effects of feedstock, biochar production,soil types, and mixtures, and to quantify these effects onplant growth.The main objective of this research was to study how
different biochar mixture rates affect the water holdingcapacity of biochar-amended loamy sand soil. This sandy
Table 1 Sources of nitrogen inputs-by region and by crop [3]
Acres Commercialfertilizer
Manure Atmosphericdeposition
Bio-fixation Sum of inputs
1,000 s Percent Tons Percent Tons Percent Tons Percent Tons Percent Tons Percent
By region
Northeast 13,642 4.6 388,655 4.5 146,867 13.6 48,523 5.8 1,081,687 10.4 1,665,742 7.9
Northeast Great Plains 72,397 24.3 1,815,130 20.9 154,986 14.3 122,474 14.6 907,910 8.7 3,000,645 14.3
South Central 45,350 15.2 1,290,546 14.8 85,795 7.9 197,007 23.4 1,993,185 19.2 3,566,628 17.0
Southeast 13,394 4.5 423,992 4.9 82,103 7.6 55,854 6.6 468,580 4.5 1,030,529 4.9
Southern Great Plains 32,096 10.8 952,920 11.0 74,517 6.9 61,552 7.3 106,041 1.0 1,195,054 5.7
Upper Midwest 112,581 37.7 3,504,461 40.3 466,355 43.1 344,878 41.0 5,579,239 53.6 9,894,962 47.1
West 9,018 3.0 318,839 3.7 71,619 6.6 10,313 1.2 263,443 2.5 664,220 3.2
All regions 298,487 100.0 8,694,553 100.0 1,082,242 100.0 840,601 100.0 10,400,085 100.0 21,017,780 100
By crop
Barley 4,635 1.6 171,683 2.0 2,244 0.2 7,313 0.9 0 0.0 181,242 0.9
Bom 78,219 26.2 4,369,865 50.3 552,495 51.1 231,507 27.5 0 0.0 5,153,867 24.5
Corn silage 5,197 1.7 186,760 2.1 298,616 27.6 14,971 1.8 0 0.0 500,345 2.4
Cotton 16,858 5.6 560,237 6.4 12,369 1.1 51,108 6.1 0 0.0 623,746 3.0
Legume hay 24,776 8.3 444,358 5.1 18,299 1.7 65,268 7.8 4,512,759 43.4 5,040,690 24.0
Oats 3,772 1.3 43,934 0.5 852 0.1 9,303 1.1 0 0.0 54,096 0.3
Peanuts 1,843 0.6 17,372 0.2 1,629 0.2 7,207 0.9 63,490 0.6 89,699 0.4
Potatoes 987 0.3 72,952 0.8 1,315 0.1 2,268 0.3 0 0.0 76,535 0.4
Rice 3,637 1.2 190,001 2.2 7 <0.1 15,522 1.8 0 0.0 205,541 1.0
Spring wheat 20,503 6.9 423,081 4.9 4,206 0.4 32,545 3.9 0 0.0 459,961 2.2
Sorghum 10,897 3.7 444,695 5.1 16,465 1.5 27,978 3.3 0 0.0 489,144 2.3
Soybeans 67,543 22.6 143,954 1.7 59,224 5.5 221,487 26.3 5,823,836 56.0 6,248,524 29.7
Winter wheat 45,014 15.1 1,179,798 13.6 26,822 2.5 106,697 12.7 0 0.0 1,313,400 6.2
All crops 298,478 100.0 8,694,553 100.0 1,082,242 100.0 840,601 100.0 10,400,085 100.0 21,017,780 100.0
Yu et al. International Journal of Energy and Environmental Engineering Page 2 of 92013, 4:44http://www.journal-ijeee.com/content/4/1/44

Table 2 Nitrogen loss estimates-by region and by crop [3]
Acres Volatilized Dissolved in surfacewater runoff
Dissolved inleachate
Dissolved in lateralsubsurface flow
Lost with waterbomesediment
Lost with windbornesediment
Sum of all losspathways
Percent Tons Percent Tons Percent Tons Percent Tons Percent Tons Percent Tons Percent Tons Percent
By region
Northeast 4.6 78,711 2.9 45,275 7.9 46,457 4.7 4,604 7.0 91,141 7.2 1,060 0.4 267,281 4.5
Northern Great 24.3 596,583 21.6 64,928 11.4 36,852 3.7 11,222 17.0 164,394 12.9 131,371 49.4 1,005,360 17.0
Plains
South Central 15.2 398,622 14.5 174,590 30.6 304,219 30.5 11,747 17.8 247,942 19.5 9,657 3.6 1,146,779 19.3
Southeast 4.5 170,688 6.2 26,587 4.7 200,291 20.1 5,934 9.0 47,604 3.7 86 <0.1 451,191 7.6
Southern Great 10.8 438,673 15.9 27,384 4.8 61,394 6.1 4,089 6.2 41,002 3.2 103,221 38.8 675,785 11.4
Plains
Upper Midwest 37.7 996,009 36.1 159,552 28.0 339,126 34.0 27,060 41.0 665,135 52.4 19,473 7.3 2,206,378 37.2
West 3.0 76,795 2.8 72,026 12.6 10,298 1.0 1,399 2.1 12,301 1.0 1,047 0.4 173,956 2.9
All regions 100.0 2,756,079 100.0 570,341 100.0 998,637 100.0 66,055 100.0 1,269,517 100.0 265,924 100.0 5,926,729 100.0
By crop
Barley 1.6 52,993 1.9 12,562 2.2 1,765 0.2 1,235 1.9 11,585 0.9 6,659 2.5 86,798 1.5
Corn 26.2 956,074 34.7 124,161 21.8 389,473 39.0 25,796 39.1 562,179 44.3 92,247 34.7 2,149,929 36.3
Corn silage 1.7 46,467 1.7 15,244 2.7 20,805 2.1 2,448 .3.7 56,684 4.5 5,058 1.9 146,705 2.5
Cotton 5.6 101,326 3.7 55,777 9.8 114,922 11.5 2,574 3.9 51,654 4.1 48,920 18.4 375,172 6.3
Grass hay 4.9 59,044 2.1 66,011 11.6 4,287 0.4 1,660 2.5 13,986 1.1 34 <0.1 145,023 2.4
Legume hay 8.3 152,594 5.5 67,735 11.9 5,340 0.5 2,555 3.9 781 0.1 13 <0.1 229,193 3.9
Oats 1.3 18,264 0.7 3,289 0.6 4,435 0.45 512 0.8 14,784 1.2 2,515 0.9 43,797 0.7
Peanuts 0.6 16,915 0.6 3,124 0.5 40,268 4.0 1,637 2.5 3,957 0.3 2,455 0.9 68,355 1.2
Potatoes 0.3 20,253 0.7 8,181 1.4 21,245 2.1 785 1.2 4,006 0.3 0,710 0.6 56,178 0.9
Rice 1.2 11,869 0.4 60,612 10.6 39,659 4.0 177 0.3 13,268 1.0 60 <0.1 125,643 2.1
Spring wheat 6.9 129,671 4.7 21,068 3.7 1,248 0.1 1,666 2.5 48,548 3.8 29,990 11.3 232,189 3.9
Sorghum 3.7 147,017 5.3 10,851 1.9 30,979 3.1 2,495 3.8 36,176 2.8 34,269 12.9 261,785 4.4
Soybeans 22.6 581,091 21.1 90,757 15.9 282,995 28.3 17,786 26.9 352,233 27.7 24,865 9.4 1,349,726 22.8
Winter wheat 15.1 462,504 16.8 30,973 5.4 41,217 4.1 4,733 7.2 99,679 7.9 17,133 6.4 656,238 11.1
All crops 100.0 2,756,079 100.0 570,341 100.0 988,637 100.0 66,055 100.0 1,269,517 100.0 265,924 100.0 5,926,729 100.0
Yuet
al.InternationalJournalofEnergy
andEnvironm
entalEngineeringPage
3of
92013, 4:44
http://ww
w.journal-ijeee.com
/content/4/1/44
soil is the dominate soil type of the southeastern USAand is recognized as having poor water holding capacityand limited growth potential for crops [3]. More infor-mation pertaining to the water holding capacity of bio-char will allow for a better understanding of the otherattributes which biochar is stated to possess. The use ofbiochar as a soil amendment in areas prone to droughtmay increase by better understanding the water holdingcapacity characteristics of biochar.
Relevant previous work in biocharThe potential benefits of biochar soil amendment arewell identified in the literature. These include carbonsequestration, improved crop yields, and enhanced waterretention.The choices of feedstock for biochar production are
dependent upon the most readily available biomass as wellas the handling mechanism [6,14]. Any organic materialcan be used to make biochar, including wood, grass,leaves, and manure [4]. It was also suggested by Karhuet al. [15] that it may be possible to develop specializedbiochars to meet different needs of the end user. The mostimportant determining factor in regards to the actualaffect of these custom tailored biochars would be thefeedstock and the temperature used to produce thebiochar.The conversion of biomass carbon to biochar leads to
sequestration of about 50% of the initial carbon comparedto 3% sequestration from burning and less than 20% frombiological decomposition [16]. Biochar is resistant todecomposition and remains in the soil for centuries ormillennia. In summary, pyrolysis can transfer 50% of thecarbon stored in plant tissue from the active to aninactive carbon pool. The remaining 50% of plant carboncan be used to produce energy in the form of food andfuel. This enables carbon negative energy production ifrenewable resources are used. Pyrolysis would facilitatebio-energy production and carbon sequestration if thebiochar is redistributed to agricultural fields. Lehmannet al. [10] proposed biochar from farm wood-waste as apromising method for integrating carbon sequestrationand renewable energy generation with conventionalagricultural production. It is clear that biomass conversionsequestration projects have the potential to contributesignificantly to climate change mitigation, although theymay not be economically attractive at current outputproduction and carbon prices [17].Biochar has been also shown to reduce the amount of
methane (CH4) released from agricultural fields thatutilize cover crops as a nutrient supply [15]. In addition,biochar has been shown to improve the environmentalneeds of Mycorrhizal bacteria in the soil; these microbesare fundamental aspects of a healthy soil bed [18]. It iscurrently speculated that the increased microbial activity
is actually one of the largest determining factors in thepositive effects seen in plants after the introduction ofbiochar.Since the time of the Amazonian Terra Preta soils,
increased crop yield has been a recognized benefitfrom biochar soil amendment [6]. Biochar is capable ofincreasing the levels of calcium, potassium, and phos-phorus in loamy sand soil [19]. Biochar also proved anadequate medium for immobilization and retention ofsoluble cadmium and zinc as well as increased pHlevels in acidic soils [5]. Biochar's ability to manipulatedifferent nutrients at different rates, as well as raisepH at different intervals was also studied. The re-sults showed that different feedstocks at differenttemperatures could have these effects and that itmay be possible to create biochar to do a very spe-cific task [13].Chan et al. [20] investigated the effect of biochar pro-
duced from green waste on the yield of radish crops. Theyapplied three rates of biochar (10, 50, and 100 t/ha) withand without supplemental nitrogen application of 100 kg,N/ha. Biochar alone did not increase radish yield,but in the presence of supplemental nitrogen, higherrates of biochar application resulted in higher radishyields up to 266%. Major et al. [21] reviewed existingwork on the magnitude and dynamics of biochar'seffect on nutrient leaching and discussed possiblemechanism and processes by which this effect isobserved. They observed that nutrient leaching isgenerally greatest under fertilized row crops such ascorn or horticultural corps, and targeting these crop-ping systems may yield the best results for reducingleaching.While many articles report on carbon sequestration
potential and nutrient trapping, there have been only afew studies on the effect of biochar on water holdingcapacity. Novak et al. [14] reported an increase in thewater holding capacity of a loamy sand soil with 2%mixtures of biochar made from various switchgrassfeedstocks. They were interested in understanding thedifferent effects of temperature and feedstock on thewater holding capacity of biochar but all values werecalculated at a 2% mixture rate only. By varying retorttemperature from 250°C to 750°C, increases in waterholding capacity ranging from 7% to 16% were ob-served. Another finding was an 11% increase in waterholding capacity reported as an additional observationand was not validated through the use of control tech-niques [15]. The ability of biochar to increase waterholding capacity could have profound effects on areasprone to drought [15]. Sohi et al. [12] summarized thecurrent state of biochar knowledge and concluded thatsoil water holding capacity was an area of significancethat was lacking in research.
Yu et al. International Journal of Energy and Environmental Engineering Page 4 of 92013, 4:44http://www.journal-ijeee.com/content/4/1/44

MethodsMethodologyThe design of this experiment consists of sampling dif-ferent mixtures of biochar and loamy sand soil by massto see the effects on the water holding capacity at differ-ent mixture rates. Due to the thousands of soil combi-nations and the large discrepancy from one soil toanother, this study focuses on the most common agri-cultural soil in North Carolina and the southeasternUSA as a whole which is loamy sand. The defined nameof the soil to be used in this study is outlined by Novaket al. [14] as a loamy sand. This soil is characterized asless than 35% of clay (i.e., particle size is smaller than0.002 mm) and less than 50% of fine sand (i.e., particlesize is between 0.05 and 2 mm) [22]. Loamy sand haslimited water holding capacity resulting in increasedleaching of nutrients [22]. The use of poor farmingpractices and degradation from chemical fertilizers is aknown factor in the transformation of traditionallyfertile soils to the sandy textures commonly found inthe southeastern USA [7].The particle size of the biochar typically used in ex-
periments ranges from 0.25 to 20 mm uniformedsieved size [4,19]. It was also suggested by Lehmann[4] that 2 mm of biochar be the most suitable for appli-cation to the agricultural lands as well as transporta-tion. The actual percentages of biochar mixed withsample soils ranged from 0.5 to 91 metric ton/ha,which is approximately up to 4.5% of biochar amend-ment [14,23]. It was also reported by Jha et al. [23] thatnegative effects on plant development began to occurin mixtures, greater than 9% biochar to loamy sand bymass (e.g., 90 g/kg).In this study, the samples were prepared using an
unamended sample of loamy sand to establish abaseline measurement. The samples were first sub-jected to a characterization process where a sievewas used to insure a uniform size, less than 3 mmfor the biochar and less than 2 mm for the loamysand. Next, samples were mixed at different propor-tions between 0% and 100% of biochar to loamy sandby mass. In order to determine each sample weight,Howard's chart [24] was used. The use of Howard'schart will provide a relevant reference point for rep-lication of the study and add validity to the experi-ment. Based on Howard's chart, a particle size,smaller than 2 mm, requires 20 g of saturated samplespecimen [24].The American Society for Testing and Materials
(ASTM) standard D 2216-10, ‘Laboratory determin-ation of water (moisture) content of soil and rock bymass’ states that soil samples be dried at (110°C) atrelatively low humidity with a thermostatic controlcapable of maintaining 110°C ± 5°C. It also provides a
standard drying time of 12 to 16 h or until percentmoisture readings over 1-h periods are less than 0.1%.Drying times may be reduced to 4 h if a forced-draftoven is used [25]. In addition, saturation proceduresutilized by Péron et al. [26] present that a saturationperiod of 1 day will provide homogenization of watercontent throughout the sample.Each mixture used in this study was saturated with
water by following the procedure found in Péronet al. [26] to establish sample's water holding cap-acity. Water was slowly applied to each mixture con-tainer, while gently agitating, until excess water wasobserved. The mixtures were then allowed to sit for24 h to assure homogeneity of water content through-out the sample. After that, the mixtures were drainedby gravity for another 24 h through a coffee filter.Three 90-mL stainless steel containers were thentared, filled to two third full, and massed using a0.01-g digital balance to determine wet mass. Thesamples were then dried at 110°C for 24 h using aconvection oven and remassed to determine the drymass. The results yielded the amount of water beingheld by each mixture.
Sample preparationThe biochar used for this experiment was produced by theresearch using a propane-fueled retort (i.e., pyrolysis). Thevessel had an internal temperature sensor and the obser-ver recorded the temperature as the reaction took place.Uncombusted gasses were flared off and the temperaturereached 400°C toward the end of the reaction. The feed-stock was mostly untreated yellow pine scrap lumber. Thebiochar (pyrolysis in 400°C for 3 h, C%: 71.2, N%: 0.2, sur-face area: 0.19 m2/g) was air dried, crushed by hand, andsieved to a 3-mm particle size. Representative feedstockand raw biochar are shown in Figure 1.
Figure 1 Representative raw yellow pine and resulting biocharfrom pyrolysis at 400°C.
Yu et al. International Journal of Energy and Environmental Engineering Page 5 of 92013, 4:44http://www.journal-ijeee.com/content/4/1/44

The soil used in this study is loamy sand. A sample ofloamy sand was acquired from the USDA-AgriculturalResearch Service (ARS) coastal plain soils, water, andplant research center in Florence, South Carolina. TheUSDA-ARS is a small research laboratory located on ahistoric tobacco farm and is designated as a creditablesource for soil sampling [27]. The soil was air dried andsieved to a 2-mm particle size. Bulk mixtures with massratios between 0% and 100% biochar by mass wereprepared. Representative samples are shown in Figure 2.
Results and discussionData collection and analysisCollection of data occurred throughout the experiment.To determine the water holding capacity by mass, thefollowing equation was used [25]:
Waterholdingcapacity %ð Þ ¼ masswet−massdry� �
massdry� 100%
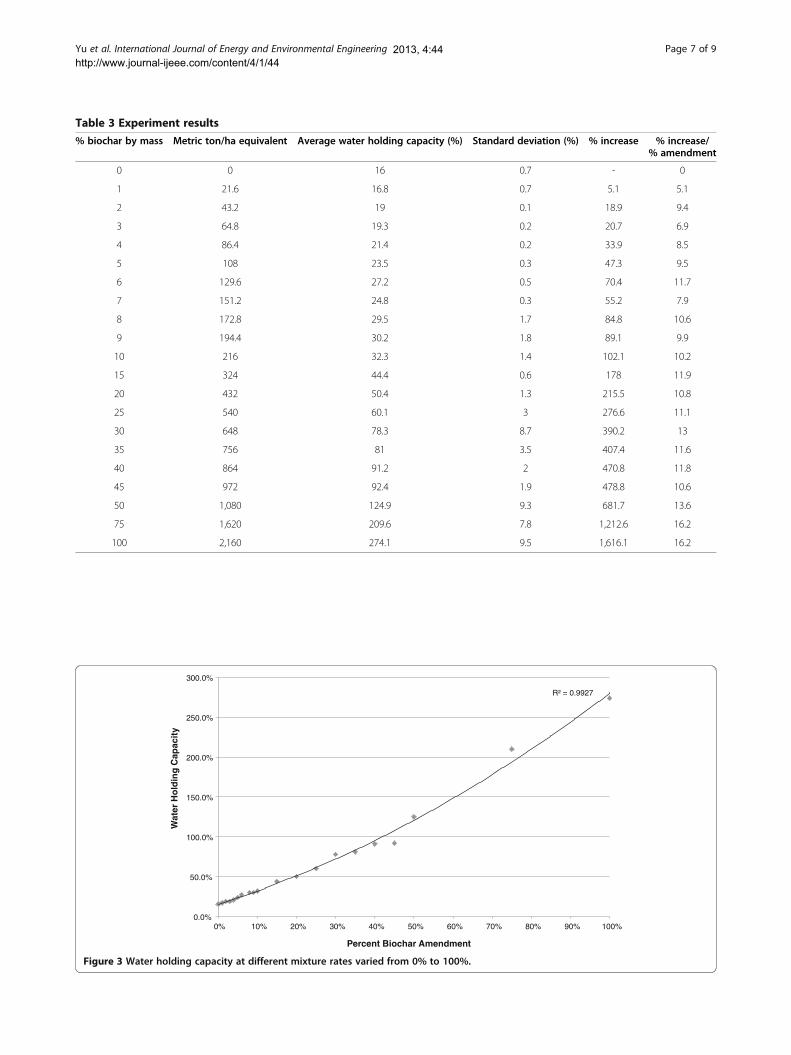
Statistical uncertainty (i.e., standard deviation) was de-termined in the way from the three replicate samples foreach mixture. The average water holding capacities as apercentage of dry mass are shown in Table 3. It is notedthat metric ton per hectare equivalent concentrations,calculated based on a soil density of 1,440 kg/m3 and a15-cm treatment depth, are listed for agricultural com-parison. Standard deviation at each proportion is alsocalculated, and it shows very low variance until 20% ofbiochar mixture. However, it is noticed that standarddeviation gradually increases (up to 9.5%) as the mix-ture rate increases. Percent increase in water holdingcapacity from unamended soil is reported, along withthe percent increase per percent biochar amendment.Note that unamended sandy loam soil has a water holding
capacity of 16%, while pure biochar can hold over 2.7times (= 270%) its mass of water as shown in Figure 3.Water holding capacities for biochar concentrations
below 10% are shown in Figure 4. Notice that the errorbar and the error ranges are also shown in the figure asthe measurements repeated three times for each mixture.It was reported by Jha et al. [23] that mixture rates of lessthan 10% were safe for agricultural purposes to loamysand soil (i.e., agriculturally meaningful biochar amend-ment). A clear positive correlation is shown in Figure 4with doubled water holding capacity with around 9% ofbiochar amendment. An agriculturally relevant biocharamendment of 5% biochar (around 100 metric ton/ha) re-sults in a water holding capacity of 24%, that is, a 50% in-crease over unamended soil. This is significant due to thetremendous amount of research, presenting that poorwater holding capacity plays a major role in nutrient lossin the southeastern USA [12,13,19,21].To quantify the value of biochar amendment, the in-
crease in water holding capacity per unit of biocharamendment is shown in Figure 5. For biochar concentra-tions below 10%, higher biochar concentrations providean increasingly greater enhancement of water holdingcapacity per unit amendment, suggesting a better valuefrom higher concentrations. Above 10% biochar concen-tration, however, the increase in water holding capacityper unit of biochar amendment remains constant ataround 12%, suggesting no further increase in valueabove 10% amendment. A possible interpretation is that10% amendment maximizes the water holding value ofbiochar.
ConclusionsWhile previous research suggests that biochar is wellsuited for increasing the water holding capacity of soils,there have been few quantitative studies on the effect of
Figure 2 Representative prepared samples after sieving and mixing.
Yu et al. International Journal of Energy and Environmental Engineering Page 6 of 92013, 4:44http://www.journal-ijeee.com/content/4/1/44
R² = 0.9927
0.0%
50.0%
100.0%
150.0%
200.0%
250.0%
300.0%
0% 10% 20% 30% 40% 50% 60% 70% 80% 90% 100%
Wat
er H
old
ing
Cap
acit
y
Percent Biochar Amendment
Figure 3 Water holding capacity at different mixture rates varied from 0% to 100%.
Table 3 Experiment results
% biochar by mass Metric ton/ha equivalent Average water holding capacity (%) Standard deviation (%) % increase % increase/% amendment
0 0 16 0.7 - 0
1 21.6 16.8 0.7 5.1 5.1
2 43.2 19 0.1 18.9 9.4
3 64.8 19.3 0.2 20.7 6.9
4 86.4 21.4 0.2 33.9 8.5
5 108 23.5 0.3 47.3 9.5
6 129.6 27.2 0.5 70.4 11.7
7 151.2 24.8 0.3 55.2 7.9
8 172.8 29.5 1.7 84.8 10.6
9 194.4 30.2 1.8 89.1 9.9
10 216 32.3 1.4 102.1 10.2
15 324 44.4 0.6 178 11.9
20 432 50.4 1.3 215.5 10.8
25 540 60.1 3 276.6 11.1
30 648 78.3 8.7 390.2 13
35 756 81 3.5 407.4 11.6
40 864 91.2 2 470.8 11.8
45 972 92.4 1.9 478.8 10.6
50 1,080 124.9 9.3 681.7 13.6
75 1,620 209.6 7.8 1,212.6 16.2
100 2,160 274.1 9.5 1,616.1 16.2
Yu et al. International Journal of Energy and Environmental Engineering Page 7 of 92013, 4:44http://www.journal-ijeee.com/content/4/1/44

biochar on water holding capacity. This research foundthat the biochar used in this study increases water hold-ing capacity of a loamy sand soil by around 1.7% bymass for each 1% of added biochar over the agricultur-ally relevant range up to 10% biochar concentrations.These lower end mixture values are representative of theallowable amounts of biochar that can be added withoutcausing damage to plants. Water holding capacity of un-amended sandy loam soil, 16%, is doubled by the additionof 9% by mass of biochar. This finding is importantbecause it establishes biochar as an effective mediumfor increasing irrigation effectiveness, runoff mitigation,and reducing non-point source agricultural pollution.Biochar's effects on water when mixed with soils are
important to understand because it may be the mostinfluential aspect of biochar in regards to microbialactivity, plant growth, and nutrient usage. The currentpractices of irrigation are awaiting a revolution inorder to more efficiently provide soils with water, butit will be important to understand the possible impact
of preparing soils with amendments such as biochar.The significance of such information may allow for ashift in the conventional wisdoms associated with irriga-tion as well as fertilization practices.This study only considered one type of biochar (yellow
pine from pyrolysis at 400°C) mixed with one type of soil(loamy sand), and thus further research is clearly indi-cated. Additional research should address the effects ofbiochar feedstock and production methods, soil types,particle size, and saturation/drying cycles. The creationof a water release curve for biochar-amended soils wouldbe a logical next step.To promote the practice of agricultural biochar soil
amendment, the full life cycle costs and benefits to biocharsoil amendment must be estimated. The effect of waterholding capacity on crop growth due to water holdingcapacity, nutrient retention, and microbial growth must beunderstood, in addition to the benefits of the likely re-duced need for irrigation and fertilizer and pesticide usage.Inclusion of traditionally externalized costs associated with
0%
2%
4%
6%
8%
10%
12%
14%
16%
18%
0% 5% 10% 15% 20% 25% 30% 35% 40% 45% 50%
Bio
char
%pe
r
WH
Cin
Incr
ease
Per
cent
Incr
emen
tal
Percent Biochar Amendment
Figure 5 Incremental increase in percent water holding capacity normalized to percent biochar amendment.
y = 1.6698x + 0.1528R² = 0.9644
15.0%
20.0%
25.0%
30.0%
35.0%
0% 1% 2% 3% 4% 5% 6% 7% 8% 9% 10%
Wat
er H
old
ing
Cap
acit
y
Percent Biochar Amendment
Figure 4 Water holding capacity at different mixture rates varied from 0% to 10%.
Yu et al. International Journal of Energy and Environmental Engineering Page 8 of 92013, 4:44http://www.journal-ijeee.com/content/4/1/44

carbon and environmental degradation, a side effect ofcurrent farming techniques, will further improve the cost/benefit analysis of agricultural biochar usage.
Competing interestsThe authors declare that they have no competing interests.
Authors’ contributionsOY supervised SS's Master of Science research regarding the biocharexperiment and drafted the manuscript. BR participated in the design of thestudy and drafted the manuscript. SS conducted the biochar experiment forthis research and helped to write the manuscript. All authors read andapproved the final manuscript.
AcknowledgementsThe authors would like to thank Drs. Jim Houser, Dave Domermuth, andMarie Hoepfl in the Department of Technology and Environmental Design atAppalachian State University for their involvement in this project. Theauthors also would like to acknowledge the US Environmental ProtectionAgency's P3 program for their partial funding support of this work.
Author details1Appalachian State University, Boone, NC 28608, USA. 2Strata Solar, ChapelHill, NC 27517, USA.
Received: 29 August 2013 Accepted: 25 November 2013Published:
References1. Wallace, J: Increasing agricultural water use efficiency to meet future food
production. Agr Ecosyst Environ 82(1–3), 105–119 (2000)2. EPA: Protecting Water Quality from Agricultural Runoff. U.S. Environmental
Protection Agency, Washington, DC (2005)3. USDA: Model Simulation of Soil Loss, Nutrient Loss, and Change in Soil
Organic Carbon Associated with Crop Production. United StatesDepartment of Agriculture, Washington, DC (2006)
4. Lehmann, J, Joseph, S: Biochar for Environmental Management: Science andTechnology. Earthscan/James & James, London (2009)
5. Beesley, L, Marmiroli, M: The immobilisation and retention of solublearsenic, cadmium and zinc by biochar. Environ Pollut 159(2), 474–480 (2011)
6. Taylor, P: The Biochar Revolution: Transforming Agriculture & Environment.Global Publishing Group Mt Evelyn, Victoria (2010)
7. Chia, CH, Munroe, P, Joseph, S, Lin, Y: Microscopic characterisation ofsynthetic Terra Preta. Soil Research 48(7), 593–605 (2010)
8. Gaunt, JL, Lehmann, J: Energy balance and emissions associated withbiochar sequestration and pyrolysis bioenergy production. Environ SciTechnol 42(11), 4152–4158 (2008)
9. Lal, R: Carbon sequestration. Philosophical Transactions of the Royal SocietyB: Biological Sciences 363(1492), 815–830 (2008)
10. Lehmann, J, Gaunt, J, Rondon, M: Bio-char sequestration in terrestrialecosystems - a review. Mitigation and adaptation strategies for globalchange. 11(2), 395–419 (2006)
11. McHenry, MP: Agricultural bio-char production, renewable energygeneration and farm carbon sequestration in Western Australia: certainty,uncertainty and risk. Agr Ecosyst Environ 129(1–3), 1–7 (2009)
12. Sohi, S, Lopez-Capel, E, Krull, E, Bol, R: Biochar, climate change and soil: areview to guide future research. CSIRO Land and Water Science Report5(09), 17–31 (2009)
13. Singh, B, Singh, BP, Cowie, AL: Characterisation and evaluation of biocharsfor their application as a soil amendment. Soil Research48(7), 516–525 (2010)
14. Novak, JM, Lima, I, Xing, B, Gaskin, JW, Steiner, C, Das, K, Ahmedna, M,Rehrah, D, Watts, DW, Busscher, WJ: Characterization of designer biocharproduced at different temperatures and their effects on a loamy sand.Annals of Environmental Science 3(1), 195–206 (2009)
15. Karhu, K, Mattila, T, Bergström, I, Regina, K: Biochar addition to agriculturalsoil increased CH4 uptake and water holding capacity - results from ashort-term pilot field study. Agr Ecosyst Environ 140(1), 309–313 (2011)
16. Steiner, C: Biochar Carbon Sequestration. University of Georgia, Biorefiningand Carbon Cycling Program, Athens, GA (2008)
17. Cacho, OJ, Wise, RM, MacDicken, KG: Carbon monitoring costs and theireffect on incentives to sequester carbon through forestry. Mitig Adapt StratGlob Chang 9(3), 273–293 (2004)
18. Warnock, DD, Lehmann, J, Kuyper, TW, Rillig, MC: Mycorrhizal responses tobiochar in soil - concepts and mechanisms. Plant Soil 300(1–2), 9–20 (2007)
19. Novak, JM, Busscher, WJ, Laird, DL, Ahmedna, M, Watts, DW, Niandou, MAS:Impact of biochar amendment on fertility of a southeastern Coastal Plainsoil. Soil Sci 174(2), 105–112 (2009)
20. Chan, K, Van Zwieten, L, Meszaros, I, Downie, A, Joseph, S: Agronomicvalues of greenwaste biochar as a soil amendment. Soil Research.45(8), 629–634 (2008)
21. Major, J, Steiner, C, Downie, A, Lehmann, J: Biochar effects on nutrientleaching. In: Biochar for environmental management: Science andtechnology, pp. 271–287. Earthscan, London (2009)
22. USDA: Keys to soil taxonomy. United States Department of Agriculture,Washington, DC (2006)
23. Jha, P, Biswas, A, Lakaria, B, Rao, AS: Biochar in agriculture - prospects andrelated implications. Curr Sci 99, 1218–1225 (2010)
24. Howard, A: Minimum Test Specimen Mass for Moisture ContentDetermination. ASTM Geotechnical Testing Journal 12(1), 39–44 (1989)
25. ASTM: Laboratory Determination of Water (Moisture) Content of Soil and Rockby Mass. In: D 2216 - 10ASTM International: West Conshohocken, PA. (2010)
26. Péron, H, Hueckel, T, Laloui, L: An improved volume measurement fordetermining soil water retention curves. Geotech Test J 30(1), 1–8 (2007)
27. USDA-ARS: Coastal Plains Soil, Water, and Plant Research Center. (2013).http://www.ars.usda.gov/Main/docs.htm?docid=3536
Cite this article as: Yu et al.: Impact of biochar on the water holdingcapacity of loamy sand soil. International Journal of Energy andEnvironmental Engineering
Submit your manuscript to a journal and benefi t from:
7 Convenient online submission
7 Rigorous peer review
7 Immediate publication on acceptance
7 Open access: articles freely available online
7 High visibility within the fi eld
7 Retaining the copyright to your article
Submit your next manuscript at 7 springeropen.com
Yu et al. International Journal of Energy and Environmental Engineering Page 9 of 9
17 Dec 2013 10.1186/2251-6832-4-44
2013, 4:44
2013, 4:44http://www.journal-ijeee.com/content/4/1/44