imes discussion paper series - bank of japan · imes discussion paper series 2002-e-3 april 2002...
TRANSCRIPT

IMES DISCUSSION PAPER SERIES
INSTITUTE FOR MONETARY AND ECONOMIC STUDIES
BANK OF JAPAN
C.P.O BOX 203 TOKYO
100-8630 JAPAN
One Year Under ‘Quantitative Easing’
Masaaki SHIRAKAWA
Discussion Paper No. 2002-E-3

NOTE: IMES Discussion Paper Series is circulated in
order to stimulate discussion and comments. Views
expressed in Discussion Paper Series are those of
authors and do not necessarily reflect those of
the Bank of Japan or the Institute for Monetary
and Economic Studies.

IMES Discussion Paper Series 2002-E-3April 2002
One Year Under ‘Quantitative Easing’
Masaaki SHIRAKAWA *
AbstractThe Bank of Japan adopted a new framework of monetary easing, so-called�quantitative easing,� in March 2001. Active debate continues with respect tothe effectiveness of monetary policy under zero interest rates but very fewarguments present a clear explanation about exactly through what kind oftransmission mechanism monetary policy can exert easing effects. Thispaper addresses this issue based on the standard theory of the transmissionmechanism of monetary policy by focusing on facts observed during the yearsince the adoption of the new framework, especially the observed facts infinancial markets and the behavior of financial institutions. The paper alsotakes up the effects of �unconventional monetary policy� as well as makes asimple comparison between the present situation in Japan and the experiencesof Japan, the US, and Sweden in the 1930s.
Key words: Quantitative Easing; Transmission Mechanism; Zero InterestRate Boundary
* Adviser to the Governor, Policy Planning Office, Bank of Japan (E-mail: masaaki.
This is an English translation of a Japanese paper included in a forthcoming book from
Nihon-Keizai Shinbunsha. It is the same as the original Japanese version except for some
editorial changes made for the benefit of foreign readers. Opinions expressed in this paper
are those of the author and not those of the Bank of Japan. The analysis in this paper was
made based on data available as of March 20, 2002.

1
1. Introduction: Current State of Debate on Japan’s Monetary Policy
The Bank of Japan adopted a new framework of monetary easing, so-called�quantitative easing�, in March 2001. Under this framework, short-term interest ratesdeclined to virtually zero and monetary base grew by almost 30 percent, year on year, asof March 2002. Despite this, nominal GDP growth continues to be negative andeconomic activity remains stagnant.
Against this background, active debate continues with respect to the effectiveness ofmonetary easing. Indeed, we have seen a considerable amount of literature on thesubject from scholars and economists at home and overseas, many of whom have calledfor further monetary easing. Very few, however, present a clear explanation aboutexactly through what kind of transmission mechanism monetary policy can exert easingeffects under the current environment.1 For example, some call for �aggressive easing�by the Bank of Japan on the grounds of high real interest rates or the low growth ofmoney supply. According to such arguments, once the Bank of Japan starts to conduct�aggressive monetary policy�, money supply growth will instantly increase andinflationary expectations will be generated. They assume an economy where moneysupply is determined exogenously by a central bank and the inflation rate responds to anincrease in money supply in a rather mechanical manner. I do not deny that there existsome cases in which such a convention could be useful in analyzing the effects ofmonetary policy. In today�s Japan, however, money supply and inflation rate do notrespond to the abundant provision of liquidity and zero interest rates. Given these hardfacts regarding Japan�s economy, it cannot be denied that the argument based on theaforementioned simple model ignores the main issues right at the start and has little todo with the situation and problems monetary policy makers are facing. Put anotherway, when evaluating the effectiveness of current monetary policy, it is indispensable tomake clear exactly what kind of transmission mechanism is assumed. 2
As it was in the case of the development of economics, analysis of the effects ofmonetary policy requires a feedback process whereby everything starts from facts uponwhich hypotheses and theories are constructed and the facts are then reinterpreted by thehypotheses and theories. Verification based on a standard economic theory and facts
1 Komiya [2002] and Ueda [2001] provide an analysis based on a standard theory with respectto the transmission mechanism of monetary policy.2 Kato [2001] is one of the few books which took due account of actual financial marketdevelopments.

2
is particularly important in thinking about the future conduct of monetary policy inJapan. This is because Japan is the first instance of an economy actually facing a zero-interest rate boundary, and, additionally, the size of non-performing loans the economyis shouldering is almost unprecedented. Indeed, an economy confronted with thesetwo factors simultaneously is the first experience in modern economic history.
Given such recognition, this paper, based on the standard theory of the transmissionmechanism of monetary policy, considers the effectiveness of monetary easing byfocusing on facts observed in the past one year, especially the observed facts in thefinancial markets and the behavior of financial institutions.3 The purpose of this paperis, by considering these issues, to provide materials for exploring the future conduct ofJapan�s monetary policy. There are obviously other important issues with respect topast monetary policy and policies other than monetary policy, but they are not taken upin this paper.
This paper is composed as follows. Section 2 describes the author�s understanding ofthe standard theory of the transmission mechanism of monetary policy. Section 3explains the framework of monetary easing measures adopted in March 2001 andsubsequent developments. Sections 4-7 examine whether monetary policy can exerteasing effects under zero interest rates when viewed from the standard theory of thetransmission mechanism, by breaking down the issue into four questions. Section 8takes up the effects of �unconventional monetary policy� which is defined as policy toaffect financial asset prices by altering the demand and supply balance of such assets,and thereby envisages the materialization of monetary easing effects. Section 9 makesa simple comparison between the present situation in Japan and the experiences ofJapan, the US, and Sweden in the 1930s which have been occasionally quoted assuccessful examples of countries escaping from deflation. Section 10 concludes thepaper with the author�s remarks.
3 This paper is of the nature of a follow-up to the author�s previous paper, �Zero-kinri seiyakutoB/S chouseikano kinyu seisaku � (�Monetary policy under a zero-interest rate boundary andbalance sheet adjustment,� Economics 5, pp.39-52, Summer 2001, Toyo-Keizai Shinpousha).An English translation of the previous paper is forthcoming in International Finance Vol. 4,Issue 3, 2002.

3
2. Transmission Mechanism of Monetary Policy: the Standard Theory
To begin, I will explain my understanding of the transmission mechanism of monetarypolicy. In this regard, what I consider to be the standard theory was conciselydescribed in �Purposes & Functions�, an official publication of the Federal ReserveBoard [1994]:4
� The initial link between monetary policy and the economy occurs in the market forreserves. The Federal Reserve’s policies influence the demand for, or supply of,reserves at banks and other depository institutions, and, through this market theeffects of monetary policy are transmitted to the rest of the economy (p.18).
� As preceding discussion illustrates, monetary policy works through the market forreserves and involves the federal funds rate. A change in the reserves marketwill trigger a chain of events that affect other short-term interest rates, foreignexchange rates, long-term interest rates, the amount of money and credit in theeconomy, and levels of employment, output, and prices (p.23).
As the above indicates, according to the standard theory, the starting point of thetransmission mechanism of monetary policy is a change in reserves and an associatedchange in short-term interest rates. The transmission mechanism of monetary policyconsists of at least the following four phases (Figure 1):
(i) short-term interest rates change according to a change in reserves;(ii) changes in short-term interest rates subsequently affect the prices of financial
assets such as medium- and long-term interest rates, foreign exchange rates, andstock prices;
(iii) then, the behavior of financial institutions changes; and(iv) lastly, the behavior of domestic private economic agents such as firms and
households and overseas economic agents change.
A change in reserves is itself a small ripple, and, in any country, the size of the centralbank balance sheet is small compared with that of GDP and money supply. Thereason why a change in reserves can affect economic activity, notwithstanding its
4 The same can also be found in the publications of other central banks such as �The MonetaryPolicy of the ECB� by the European Central Bank [2001, p.42], and �The TransmissionMechanism of Monetary Policy� by the Bank of England [1999, p.3].

4
limited size, is that reserves can only be provided by a central bank. Other economicagents cannot provide alternatives. Therefore, when a central bank increases itsprovision of reserves, short-term interest rates will certainly decline. It is indeedattributable to this simple fact that monetary policy can be effective. Put differently,when the level of short-term interest rates reaches zero, monetary policy cannot exertadditional easing effects as long as a textbook-type transmission mechanism is assumed.This situation was quite similar to that when the Bank of Japan embarked on a newmonetary easing framework in March 2001. No textbooks clearly explain whethermonetary policy can still exert easing effects under such a situation. The purpose ofthis paper is to give a tentative answer to this unsolved question. If we were to list thekind of arguments which support the effectiveness of monetary policy, withoutevaluating their validity, there would be three categories:
� The first type of argument stands on standard economic theory and expects that aminute decline in short-term interest rates will stimulate economic activity. InMarch 2001, the overnight call rate was 0.15%, and, even though there was littleroom for a further decline, it was possible to bring the overnight rate very close tozero. One can also think of an easing effect through another route, related to thatjust described, where a central bank can contain uncertainty with respect to futureliquidity financing on the part of market participants by exhibiting a posture toprovide ample liquidity and by making such commitment.5
� The second type of argument assumes that, by purchasing specific assets such aslong-term government bonds, foreign currency assets, and stocks in providingreserves, a central bank can alter the demand and supply balance and affect theprices of such assets, through which an easing effect will materialize. This idea,which is rarely discussed in the standard theory, infers that what is important isnot the increase in total amount of reserves nor the resultant decline in short-terminterest rates but types of assets to be purchased. Monetary policy having suchobjectives is often called unconventional monetary policy.
� The third type of argument assumes that a central bank could affect expectationsthrough routes other than interest rates. The importance of expectations is also
5 The aforementioned FRB [1994] refers to the role of a central bank in preventing turmoil infinancial markets and the economy by using monetary policy tools as follows: �Moreover, if athreatening disturbance develops, the central bank can cushion its effects on financial marketsand the economy by providing liquidity through its monetary policy tools.�

5
emphasized in the standard theory of the transmission mechanism, and monetarypolicy effects vary according to an increase in reserves and engenderedexpectations with regard to the future path of short-term interest rates. However,such expectation effects through a decline in short-term interest rates cannot beenvisaged once room for a further decline disappears. Therefore, the expectationeffect taken up here is not related to interest rate changes, rather it is the effectwhich can be expected when a central bank�s behavior for some reason gives ashock to economic agents� expectations and alters them exogenously, and perhapscould be called the independent expectation effect.
After explaining the monetary easing framework of March 2001 in Section 2, this paperanalyzes how monetary easing measures since March 2001 have affected economicactivity with the above theoretical understanding in mind. In this regard, the followingfour questions will be asked in Sections 4 to 7. Analysis will start by reviewing thefacts necessary to examine the four questions and, then, several hypotheses andunderstandings as well as newly raised issues with respect to the effect of monetarypolicy facing a zero interest rate boundary will be presented. Answers to thesequestions are �yes� when interest rates are not facing a zero interest rate boundary. Butthe issue here is whether answers are still �yes� even with zero short-term interest rates.
� Can a central bank increase reserves infinitely?� Does an increase in reserves affect financial asset prices?� Does an increase in reserves affect financial institutions� behavior?� Does an increase in reserves activate economic activity?
3. Monetary Easing Framework of March 2001
This section describes the monetary easing framework currently adopted by the Bank ofJapan. The framework adopted in March 2001 consists of the following four pillars(Figure 2).
� Bank of Japan current account deposits The main target of the Bank�s moneymarket operations was changed from the uncollateralized overnight call rate(hereafter, call rate) to the outstanding balance of current account deposits at the

6
Bank6 (hereafter �reserves� interchangeably). The target amount of currentaccount deposits (Figure 2) was set at a level of about 5 trillion yen in March,which exceeded the past average of about 4 trillion yen, and was raised to about 6trillion yen in August. On the day following the September terrorist attacks inthe US, the actual current account balance was raised to 8 trillion yen to ensurefinancial market stability. At the Monetary Policy Meeting immediately after,the target was set at a level above 6 trillion yen since demand for reserves wasunstable, and the actual balance became about 9 trillion yen during the reservemaintenance periods from September to November. In December, a new targetof about 10-15 trillion yen was set and the actual balance has since been around 15trillion yen. At the end-February 2002 Monetary Policy Meeting, the Bankconfirmed it would flexibly provide liquidity irrespective of the guideline above inlight of the expected substantial increase in liquidity demand toward the end of thefiscal year.
� Commitment to halt the decline in prices The Bank has committed tocontinuing the new framework of monetary easing until the year-on-year growthof CPI (excluding fresh food) becomes stable at or above zero percent. Thelatest CPI (excluding fresh food) growth rate figure available is -0.8% for January2002, and thus naturally the monetary easing framework adopted in March 2001has been maintained. With little room for a rate decline, the commitment basedon CPI could be understood that it tries to strengthen easing effects by clearlyindicating the path of monetary policy in the future. Such effect is called the�commitment effect.�
� Purchase of long-term government bonds The Bank announced it wouldincrease its purchase of long-term government bonds when necessary forproviding reserves smoothly while setting the outstanding balance of banknotesissued as an upper limit for such purchases.7 Subsequently, in August, when thetarget amount of current account deposits was raised to about 6 trillion yen, thesize of such purchases was increased from the previous 400 billion yen to 600billion yen per month, and thereafter to 800 billion yen in December, and furtherto 1 trillion yen in February 2002. Under the current monetary easing framework,
6 Different from the US, financial institutions not subject to the reserve requirement hold currentdeposit accounts at the Bank and actually keep some outstanding balances.7 As of February 2002, the outstanding balance of long-term government bonds held by theBank was 50 trillion yen and the outstanding balance of banknotes issued was 65 trillion yen.

7
the purchase of long-term government bonds is regarded as a means to providereserves smoothly and not as a means to affect the price of government bonds.
� Lombard-type lending facility In February 2001, the Bank introduced aLombard-type lending facility whereby financial institutions can borrow from theBank at their request at the official discount rate if certain conditions such aseligible collateral are met. The official discount rate was reduced twice: inFebruary 2001 from 0.5% to 0.25%, and further to 0.1% in September 2001.
4. Is It Possible to Infinitely Increase the Provision of Reserves?
This section examines the first question of the four raised in Section 2: Can a centralbank increase reserves infinitely? According to the standard theory, the starting pointof the transmission mechanism of monetary policy is an increase in reserves. While anincrease in reserves is a self-evident premise, under a situation where nominal short-term interest rates are almost zero, it becomes an issue whether it is possible for acentral bank to infinitely increase reserves.
Standard textbooks show a downward sloping demand curve whereby demand forreserves increases as nominal interest rates decline (Figure 3.1, upper panel). However,the shape of the demand curve in the territory of nominal interest rates infinitely close tozero is not known, or there has not been need to pay much attention to it.8 If one couldassume a friction-free economy where there is no cost for holding reserves other thaninterest rates as an opportunity cost, the demand curve for reserves is infinitely elasticvis-à-vis interest rates. Consequently, a central bank can infinitely increase theprovision of reserves along the demand curve and the nominal short-term interest ratecan infinitely decline to 0.01%, 0.001%, 0.0001%. However, in actual financialmarkets, there are some costs other than interest rates (hereafter �transaction costs�)which relate to certain transactions and the holding of reserves. Transaction costsinclude transaction charges accompanying the extension of call loans and the receipt ofcall money, charges for using settlement services, and staff expenses. Wheretransaction costs exist, the amount of reserves which a central bank can provide will beconstrained by them, and thus there will be an upper limit (Figure 3.1, lower panel).
8 Goodfriend [2000] deals with this issue.

8
While a central bank�s ability to provide reserves under zero interest rates cantheoretically be summarized as such, to what extent a central bank can provide reservesin practice should be judged in the light of actual experience. Hence, after explainingan outline of institutional aspects of the Bank�s monetary operations, we review ourexperiences about the provision of reserves through such operations since March 2001.
Monetary operations by the Bank Like other central banks, the Bank of Japanprovides reserves (or monetary base) by purchasing financial assets from the market9.Since fluctuations in banknotes in circulation and fiscal position are quite large in Japan,the Bank conducts short-term monetary operations10 to adjust the reserve level morefrequently than the FRB and the ECB. Looking at the outstanding balance of assetswhich have been purchased in exchange for market operations (monetary base), long-term government bonds account for the highest proportion of about 60% (Figure 4).The counterparts of Bank monetary operations are selected according to pre-announcedcriteria, and banks as well as securities firms participate.11
Insufficient bids in the first half of May 2001 When the monetary easing frameworkwas introduced in March 2001, the reserve level was raised from about 4 trillion yen toabout 5 trillion yen. As a result, the call rate declined to 0.01%, below the 0.02%during the zero-interest rate policy period (February 1999 to August 2000). Amongshort-term interest rates, those for longer terms, called term rates, declined due to theample provision of reserves as well as the commitment effect. For example, the 3-month TB rate declined in May to 0.010%, below the lowest level (0.015%) during thezero-interest rate policy period (Figure 5). From the beginning to the middle of May,when short-term interest rates substantially declined, the highest bid rate for theprovision of reserves by the Bank declined to the then lower limit (0.01%), and theBank experienced 16 occasions when there were insufficient bids for monetaryoperations using short-term instruments (Figure 6). The situation shown in the lowerpanel of Figure 3.1 emerged. In response, aiming at smoothly providing reserves, theBank decided to reduce the unit of interest rate for bidding from 1/100% to 1/1000%.Because of this measure, the highest rate could go down to as low as 0.001%, whichimproved the bidding situation and thus the situation of insufficient bids disappeared.
9 The money market operations by the Bank of Japan, the FRB, and the ECB are explained inBorio [2001] and Blenck, Hasko, Hilton, & Masaki [2001].10 Short-term operations include bill, short-term government bond, repo, and CP repooperations.11 For example, of the 40 counterparts in long-term government bond operations, 26 aresecurities firms.

9
Looking at the demand curve for reserves, this can be explained as a case where thelower limit of transaction costs is reduced (Figure 3.2, upper panel).
Experience of August-December 2001 As the reserve target was increased fromabout 5 trillion yen to about 6 trillion yen in August and the outstanding balance ofreserves actually increased, the ratio of competitive bids to offers gradually declined(Figure 6). Against such a backdrop, in early September, market participantsanticipated it was highly likely insufficient bids would be seen before long. However,following the September 11 terrorist attacks in the US, demand for reservesimmediately soared and the situation drastically changed. In response to the increaseddemand for reserves, the Bank provided ample liquidity beyond the then target and,subsequently, set a new target of �beyond 6 trillion yen� with no upper limit.Consequently, the amount of reserves from the September to November reservemaintenance periods was at the substantially increased level of about 9 trillion yen, andthe ratio of competitive bids to offers recovered. The sharp increase in demand forreserves after the terrorist attacks was observed not only in Japan but also in the US andEuropean countries. What deserves attention is that while demand for reserves wasrestored to normal in about one week in other countries, it has continued at a high levelin Japan. Several factors for this have been pointed out as reasons.
The first factor is the reduction in the interest rate unit for call market transactions from1/100% to 1/1000% at the beginning of September. Previously when ample reserveshad been provided, the call rate could only go down to 0.01% due to the interest rateunit constraint. But, with the reduction, it became possible for the call rate to decline toas low as 0.001%, and it actually declined to this level. Looking at the reserve demandcurve previously mentioned, this can be seen as new experience in the territory below0.01% (Figure 3.2, upper panel).
The second factor was an increase in domestic financial institutions� precautionarydemand for liquidity against the background of uncertainty with respect to liquidityconditions. There are various reasons for such uncertainty. Initially, the demandincrease stemming from the terrorist attacks in the US was one of them and increaseddemand for liquidity before the year-end and fiscal year-end another. However, whatwas more important was that, owing to more corporate bankruptcies and plunge in stockprices, especially in stock prices of financial institutions, uncertainty over financialsystem problems gradually intensified. Such uncertainty, combined with a recedingappetite on the part of financial institutions which used to lend funds in the short-term

10
money market, contributed to financial institutions� increasing demand for reserves.This can be expressed as a rightward shift of the demand curve for reserves (Figure 3.2,lower panel).
The third factor was increased demand for reserves at foreign banks which tookadvantage of the negative yen funding cost through yen-dollar swap transactions (Figure7). In raising dollars, financial institutions in Japan had become increasinglydependent on yen-dollar swap transactions, which combine yen-selling/dollar-buyingtransactions in the spot market with yen-buying/dollar-selling transactions in theforward exchange market. Against the backdrop of issues such as financial systemproblems, conditions for swap transactions became disadvantageous for Japanesefinancial institutions and advantageous for foreign banks. Foreign banks obtain yenfunds in exchange for providing dollar funds to Japanese financial institutions for acertain period, and, because of the cost to obtain yen funds (yen swap rate) becomingnegative, foreign banks were more or less guaranteed a profit margin even though theinterest rate on yen fund investment was virtually zero. In such a case, since the short-term interest rate is almost zero, there would be no incentive for foreign banks to investin the call market by shouldering certain credit risk, and thus they opted to invest incredit risk-free Bank of Japan current account deposits. By the end of December, theoutstanding amount of current accounts held by foreign banks reached 4 trillion yen,comprising the major portion of the excess reserves. Such increased demand forreserves on the part of foreign banks can also be expressed as a rightward shift of thedemand curve for reserves.
Experience since December 2001 Reflecting a rise in liquidity demand against thebackdrop of concern over the financial system and the year-end factor, TB rates onceexceeded 0.030% in mid-December. The reserve target was raised to 10-15 trillionyen in December to meet the demand. With reserves being increased in line with thenew target, TB rates gradually declined. Upon entering 2002, not only 3-month butalso 1-year TB rates were at the unprecedented low level of 0.001% (Figure 5).Looking at subsequent developments, demand for reserves increased further towards thelatter half of March given a temporary increase in precautionary demand before thetermination of the blanket guarantee of bank liabilities in April. Reflecting suchdevelopments, the level of reserves was maintained at around 15 trillion yen until mid-March and rose further towards the month-end. With respect to money marketoperations, abundant reserves have been provided and short-term interest rates havebeen maintained at a level close to zero. Consequently, competitive bidding rates have

11
fallen, resulting in insufficient bids almost every day since mid-January.
Tentative assessment In March 2001 when the new easing framework was adopted, itwas not certain by how much the Bank could increase reserves at zero interest rates, butit has in fact been able to increase them to a level which was originally thought to bedifficult to attain. It has thus become clear that a central bank can increase reserves ifthe demand curve shifts to the right. Put another way, it is not clear whether a centralbank can maintain an increased reserve level if the demand curve shifts to the left. Inany case, the increment represents an increase in excess reserves on the part of financialinstitutions subject to reserve requirements and also those not subject to requirements,and does not correspond to an increase in money supply and associated rise in requiredreserves (Figure 8). As stated, the increase also reflects factors such as concern overfinancial system stability and the diminishing function of the short-term money market.This is a situation similar to what Keynes described as a �liquidity trap�. The effects ofthe increased provision of reserves under a �liquidity trap� are discussed in the followingsections.
Some issues for discussion Since March last year, various interesting facts haveemerged, based on which I would like to take up the following two interesting questionswhich are important in considering the capacity of a central bank to provide reserves.
The first is, with the demand curve given, if the interest rate unit applied to call markettransactions were further reduced to 1/10000% from 1/1000%, could the Bank increasereserve provision infinitely? The lowest call rate at present is 1/1000%. At this rate,even though one invests 10 billion yen overnight, interest income would only be 274yen, which would not even cover brokerage and personnel expenses. Therefore, fromthe viewpoint of financial institutions holding excess reserves, even now there is littleincentive for them to invest their reserves in the short-term money market in the form ofcall loans. As such, while there is already little incentive for investing funds, theincentive would further diminish if the lowest call rate level became 0.0001%. In thissense, while further cutting the interest rate unit for transactions could contribute to thesupply of reserves, for individual financial institutions holding excess funds there wouldbe little incentive to obtain further funds through bidding for Bank operations.
On the other hand, even for financial institutions short of reserves, given that funds canbe obtained from the market at 0.001%, reducing the lowest rate to 0.0001% is notlikely to heighten the incentive to bid for Bank operations taking account of transaction

12
costs. However, as already discussed, if fund provision by financial institutions withexcess reserves decreases, precautionary demand on the part of financial institutionsshort of reserves might heighten, their having more concern for the funding of reservesin the short-term money market12. It is quite difficult to forecast with 100% accuracythe behavior of both lender and borrower financial institutions in such an extremesituation. Considering transaction costs, it is more appropriate to assume that thecapacity of a central bank to provide reserves depends not only on the total amount ofreserves but also how reserves are distributed among financial institutions. In anyevent, even if the Bank were to increase reserve provision, the resulting situation wouldnot be different from that similar to what Keynes called a �liquidity trap.�
The second question is whether a central bank can increase the total amount of reservesby changing the types of assets to be purchased through operations. In considering thisissue, it is necessary to distinguish between demand for the stock of reserves anddemand for the flow of reserves provided by market operations. Financial institutionsdecide their optimal reserve level by taking account of such factors as their ownfinancing prospects and opportunity cost resulting from holding assets in the form ofreserves. From the side of financial institutions, market operations can be regarded asan adjustment valve necessary for achieving a certain level of reserves which they judgeto be optimal. Put another way, it is financial institutions, not a central bank, thatdetermine the optimal level of reserves. More explanation should be given withrespect to �an adjustment valve� because it might give the impression that marketoperations are solely passive in nature. Needless to say, if interest rates have notreached zero, there is room for a central bank to actively adjust the level of reserves,and such room is the starting point for the effects of monetary policy to be exerted.
In addition, financial institutions decide which market operations to participate in, andto what extent, depending on their judgment about which operations are most profitable.Under zero interest rates, incentives for financial institutions to bid for marketoperations would be higher if operations were conducted for assets whosesubstitutability with reserves was lower. If a central bank purchases assets at betterprices, financial institutions will actively participate in market operations. In thisregard, compared to short-term government bills, it is easier to purchase long-termgovernment bonds at better prices because of the greater room for a rate decline. Inpractice, while insufficient bids for short-term operations have become of serious 12 Under zero interest rates, market operations of the Bank of Japan partly substitute for the

13
concern since entering 2002, such has not been the case with respect to operations usinglong-term government bonds.13 However, this does not necessarily mean that thereserve level can be increased if the Bank conducts more long-term government bondoperations. Since financial institutions decide their optimal level of reserve demand bytaking account of interest rates and their forecast of future financing, Bank operationsare nothing but one of the adjustment valves to achieve the reserve level which theinstitutions deem optimal. Therefore, if the central bank increases operations that uselong-term government bonds, it is highly likely that financial institutions would reducetheir bidding for short-term operations. It seems that, to some extent, the increase ininsufficient bids for short-term market operations since January 2002 is attributable tothe increase in market operations using long-term government bonds. Putmetaphorically, whether the Bank provides reserves from its right pocket (short-termoperations) or from its left pocket (long-term government bond operations), the amountindividual financial institutions intend to hold will not change. If a central bank offersto purchase assets on advantageous terms to financial institutions, financial institutionswould actively bid in order to obtain subsidies. And, if a central bank attachedsubsidies to all operations and expanded the size of operations, it could increase reserveprovision. However, this would in effect correspond to the central bank conductingfiscal policy (see Section 8). Even if a central can increase reserves in this way, it stillcannot avoid the problem of a liquidity trap.
5. Does an Increase in Reserves under Zero Interest Rates Affect Financial AssetPrices?
This section examines the second question related to the transmission mechanism ofmonetary easing under the constraint of zero interest rates: How has the increase inreserves affected financial asset prices?
Short-term money market In response to an increase in reserves, the call rate declinedto 0.001% which is below the level seen during the zero-interest rate policy period,February 1999 to August 2000, although the size of the decline was obviously verysmall (Figure 9). Similarly, longer-term interest rates all declined and the yield onone-year short-term government bonds declined to 0.001%. Looking at three-month
waning function of the short-term money market to adjust fund excesses and shortages.13 Maturity terms for short-term operations in January 2002: 18 days the shortest, 155 days thelongest, and 64.3 days the average.

14
euro-yen rates, they have declined in line with call rates and the yield on short-termgovernment bonds. But they picked up when book-closing approached or financialsystem uncertainty heightened. And, looking at expected short-term interest ratesbased on three-month euro-yen futures, those starting more than one year ahead arebelow those during the zero-interest rate policy period. This implies that marketparticipants are expecting an extremely low interest rate level to continue for anextended period of time, longer than during the zero-interest rate policy period. Assuch, the previously mentioned �commitment effect� is working strongly (Figure 10).
Government bond market As a general observation after adoption of the newmonetary easing framework in March 2001, long-term interest rates (yields ongovernment bonds), despite some ups and downs, have not declined in response to areserve increase nor an increase in the outright purchase of long-term government bonds.Looked from a longer perspective, long-term rates are slightly lower compared withthose during the zero-interest rate period and period after the lifting of the zero-interestrate policy (August 2000 to March 2001) but not lower than in 1998 (Figure 11).Upon closer examination of the term structure of the present yield curve, the extent ofdecline is slightly larger in the medium-term zone compared with the zero-interest ratepolicy period, implying that the commitment effect has been powerful. If we select thetop ten days since March 2001 when long-term interest rates showed substantial moves,regardless of ups and downs, and look at the reasons market participants gave for suchdevelopments (Figure 12), one can see that the rates sensitively responded to newsabout fiscal conditions and government bond issuance.
Credit market Since interest rates on CP and corporate bonds will also changeaccording to changes in risk-free interest rates, developments unique to the creditmarket can be confirmed by looking at the differential (credit spread) between interestrates on CP and corporate bonds and yields on risk-free government bonds. CP ratesdeclined substantially from around February 2001, before the adoption of the newmonetary easing framework, and credit spreads of high-grade CP (A1 or above) broadlymoved at about 0.02% (Figure 13, upper panel). Subsequently, credit spreads rose toabove 0.10% toward mid-December. While they somewhat declined after theannouncement of a reserve increase and the Bank�s active use of CP repo operations,they still significantly exceed the level experienced up to autumn 2001. On the otherhand, the spread for lower-grade CP had been rising and the issuance of CP rated A2 orlower has been decreasing significantly. Credit spreads on corporate bonds declinedmarginally after the announcement of the new monetary easing framework in March

15
2001. Since October, however, while the spreads on high-grade corporate bonds havegenerally been unchanged, those on low-grade corporate bonds have been rising sinceinvestors have become more cautious about credit risk, and thus the contrast hasbecome more evident (Figure 13, lower panel).
Stock market From March 2001, stock prices temporarily rose until around Maybecause of the anticipated favorable impact of structural reform, but turned to declinethereafter due to a deterioration in the economic outlook (Figure 14, upper panel).Looking at the broad picture, until September stock prices basically followed themovement of US stock prices. From September, however, stock prices plunged afterthe terrorist attacks in the US and, although there were some temporary recoveries,prices fell from November 2001 until February 2002 led by declines in banking andconstruction stocks (Figure 14, lower panel). Since March, stock prices have beenrallying, partly triggered by strengthened controls on short selling. As such, whilestock prices fluctuate reflecting various factors, the most important one is prospects foreconomic fundamentals, namely corporate profits, and it does not seem that an increasein reserves has pushed up stock prices.
Foreign exchange market From March 2001 the yen rate against the dollar mostlymoved in the lower 120s but temporarily rose to 116 in September and the Ministry ofFinance conducted yen-selling intervention. Subsequently, the yen depreciated rapidlyfrom November 2001 until February 2002 (Figure 15, upper panel), attributable not tomonetary easing but rather a change in economic outlook � while expectations forrecovery of the US economy strengthened, uncertainty about prospects for Japan�seconomy intensified, including financial system stability. In fact, while US stockprices recovered relatively quickly after the terrorist attacks, Japanese stock prices didnot follow suit and the difference became conspicuous from November (Figure 15,lower panel).
Tentative assessment Responses of financial markets since March 2001 and theirimplications can be summarized as follows. First, it was the call rate and short-terminterest rates with longer maturity which, relatively speaking, responded the most to theincrease in reserves. This is a natural result considering that a central bank has amonopoly on the provision of reserves and thus has control over the demand and supplybalance and prices (interest rates) in the short-term money market even though theinterest rate level had started from already quite close to zero and thus the extent ofdecline was not large. Second, in the credit market, we observed that spreads on high-

16
grade corporate bonds remained at a low level in general but the spreads of low-gradecorporate bonds and CP widened. This fact shows that confidence in the availabilityof liquidity has an effect, although limited, of reducing the liquidity premium on pricesof high-grade corporate bonds. On the other hand, with respect to low-grade corporatebonds and CP, the creditworthiness of corporations, a fundamental factor, is having adominant impact on pricing. Third, discernible effects of a reserve increase were notobserved in the long-term government bond market, stock market, or foreign exchangemarket. This is not surprising given that there was little room for a decline in short-term interest rates.
6. Does an Increase in Reserves under Zero Interest Rates Affect the Behavior ofFinancial Institutions?
This section examines the third question which concerns the transmission mechanismwhen faced with the constraint of zero interest rates: Does an increase in reserves affectfinancial institutions� behavior?
Developments in monetary aggregates To begin with, let us first look at thedevelopment of monetary figures closely related to the behavior of financial institutions.The year-on-year growth of reserves gradually increased to reach close to four times inFebruary 2002. With respect to banknotes, which constitute a major part of monetarybase, growth was around 12%, year on year, reflecting a shift from high-yield maturingfixed postal savings deposits and commercial banks� deposits due to a decline in depositinterest rates. As a result, the growth of monetary base gradually rose and marked27% compared with the previous year in February 2002, the highest figure since thefirst oil shock (Figure 16, middle panel). The year-on-year growth rate of moneysupply has been increasing somewhat, attributable to shifts from (i) high-yield maturingfixed postal savings set ten years ago and also from (ii) investment trusts which lostmany investors as a result of the default of corporate bonds14 (Figure 16, upper panel).In the meantime, the year-on-year growth of broadly-defined liquidity15 has been ratherdeclining which implies that an increase in money supply is a phenomenon reflecting
14The outstanding amount of bond investment trusts declined from 44 trillion yen in October2001 to 28 trillion yen in February 2002, mainly due to a decline in money market funds.15 A liquidity indicator which covers the wider scope of financial assets such as the deposits ofpost offices and credit cooperatives, investment trusts, repurchase agreements, and securitieslending with cash collateral, bank debentures, government bonds, and foreign bonds.

17
the aforementioned shifts among financial assets. In any case, 3% growth in moneysupply is relatively high in comparison with the real growth rate and inflation but muchlower compared with the growth of monetary base. The relationship betweenmonetary base and money supply is called the money multiplier, and there is a declinein the multiplier which just offsets the increase in monetary base (Figure 16, lowerpanel).
Behavior of financial institutions While the behavior of financial institutions can bebroadly traced by the growth of deposits, additional information regarding their risk-taking activity can be obtained by looking at developments on the corresponding assetside. To begin with, the total assets of financial institutions had declined (Figure 17).Looking at the components, lending and stocks decreased, while government bondsincreased. However, the risk shouldered by financial institutions cannot be accuratelymeasured from balance sheet figures alone. We should also look at the amount of riskassets used in calculating the capital adequacy ratio as a proxy variable for the totalamount of credit risk shouldered by financial institutions. Risk asset reduction atmajor banks slightly gained pace after entering fiscal 2001. Financial institutions as awhole curtailed their risk assets, becoming especially cautious about investing in stocksinvolving higher risk and lending to firms with low credit quality (Figure 18). As such,despite the significant increase in reserves, financial institutions are rather becomingmore cautious in their lending and investment.
How can these facts be interpreted in light of the transmission mechanism of monetarypolicy? The first route through which monetary easing affects financial institutions�behavior is widening margins. This basically reflects the fact that the average maturityof assets is longer than that of liabilities. But, once reaching zero short-term interestrates, widening of margins cannot be expected. As we have seen, once short-termrates reach zero, a reserve increase can no longer lower long-term interest rates. But ifit happens, margins will narrow. The second route is the so-called �credit channel�which is different from an interest rate channel. In discussing the credit channel,Bernanke and Gertler [1995] see the effect of monetary policy through improvements ina firm�s cash flow and increase in collateral asset value. Indeed, the author of thispaper also considers the credit channel to be an important transmission mechanism ofmonetary policy. However, such a credit channel can only be realized with a declinein short-term interest rates, and thus cannot be expected to materialize in a situationwhere there is little room for any further decline in short-term interest rates. The thirdroute is to reduce concern with respect to liquidity funding. In this regard, the

18
Lombard-type lending facility introduced in February 2001 and the determination by theBank of Japan to provide ample liquidity have contributed to diminishing concern overliquidity funding.
Do financial institutions have incentives to expand their balance sheets? Those whostress the effects of monetary easing often judge the degree of monetary easing by thegrowth rate of money supply. In the current situation characterized by zero interestrates and non-performing loans, do financial institutions have incentives to expand theirbalance sheets? To examine this issue, as a benchmark, let us suppose a case in whicha financial institution accepts deposits and invests in risk-free government bonds of thesame maturity. At present, the investment performance of accepting deposits andinvesting in government bonds under matched terms is back spread (Figure 19).Under such a situation, there are three theoretical options open to financial institutionsfor making profits.
The first is to make the deposit rate negative and refuse to accept deposits. In this case,as a result of shifting from deposits to cash on the part of households and firms,financial institutions would face difficulty in funding existing loans and securitiesinvestment. Since most of the credit intermediation function has been performed byprivate financial institutions, it would become necessary to have new financialinstitutions take it over, or have capital markets totally bear such function, in order tosupport sustainable economic growth. In this regard, when the US faced the non-performing loan problem in the early 1990s, a decline in bank lending was covered byan increase in corporate bonds and CP. This has not been the case in Japan (Figure20).
The second option is that financial institutions, with the present level of capital, makeprofits by actively taking risks. In addition to non-performing loans, financialinstitutions are facing price risks regarding their stock holdings and, resultantly, havebeen cautious in taking risks. On the other hand, Japanese firms as a whole still carryexcessive debt and, in the absence of attractive projects for investment, put priority onutilizing improved cash flow to repay debt. Against this background, financialinstitutions are reducing loans and stocks while increasing investment in bonds,especially government bonds. A substantial amount of the increased investment ingovernment bonds is in short-term government bonds. While an increase in short-termgovernment bond holding does not imply an increase in interest rate risk, it seems thatoverall interest rate risk borne, including that relating to off-balance sheet transactions,

19
has been on a growing trend. The swap interest rate, the interest rate of a privatefinancial institution�s obligation, is normally higher than the yield on government bonds.However, unlike in other major countries, swap interest rates have been lower thanyields on government bonds in present Japan (Figure 21). This implies that, in theform of �receiving fixed interest rate and paying flexible interest rate� swap transactions,Japanese financial institutions have been forming an interest rate risk position similar toinvestment in long-term government bonds. If the level of risk borne has beenexcessive in relation to the capital position of a financial institution, regardless of on-balance or off-balance, one cannot deny the possibility of a certain shock triggering atemporary rise in interest rates and destabilizing the financial system. Thinking thisway, in the current situation, it appears that the expansion of the balance sheets offinancial institutions and an associated increase in money supply may not be desirablefrom a macroeconomic standpoint or for the purpose of achieving sustainable growth.This point has nothing to do with how the composition of the assets held by financialinstitutions changes either the combination of an increase in securities investment and adecrease in lending or vice versa.
The third option is that financial institutions do not actively take risks but dispose ofnon-performing loans as much as their profits allows. Thus, when the economysomehow returns to a sustainable growth path, profits and net worth of financialinstitutions would improve, and, as a result, their investment stance becomes active. Ifthings do not develop in this way, financial institutions will see a deterioration in profitsdamaging their capital position and the economy would be adversely affected. In thissense, this third option is not desirable from a macroeconomic standpoint.
Tentative assessment As such, facing a zero interest rate boundary and sizable non-performing loans, it is difficult to expect monetary easing to result in activation offinancial institutions� behavior and an associated increase in money supply. Indeed,after the bursting of the bubble economy, monetary easing has yet led to active behavioron the part of financial institutions. We can point out two background factors whichshould be clearly distinguished: the zero interest rate boundary and non-performingloans. The non-performing loan problem, which had existed before the adoption of themonetary easing framework in March last year, can be understood as a factor makingfirms and financial institutions unresponsive to the stimulus of an interest rate decline.On the other hand, the zero interest rate boundary is qualitatively different as aconstraint because it prevents an interest rate decline itself.

20
7. Does an Increase in Reserves under Zero Interest Rates Activate EconomicActivity?
This section considers the fourth question regarding the transmission mechanism ofmonetary easing: Does an increase in reserves under zero interest rates activateeconomic activity? The answer to this question can be mostly derived from theanswers to the previous three questions but will also raise new issues.
Figure 22 shows changes during 1995-2000 and in the past one year with respect toBank of Japan current account deposits, monetary base, money supply, real GDP, andCPI. In the five years from 1995 to 2000, despite an increase in monetary base, thegrowth of money supply was far less, real GDP grew slightly, and CPI was almost flat.This situation remained much the same in the past one year, but because Bank of Japancurrent account deposits increased four times and monetary base increased by 27%, thelack of response of real GDP and CPI has become even more conspicuous.
In the previous two sections, we analyzed the effects of a reserve increase under zerointerest rates on financial asset prices and on the behavior of financial institutions, andconfirmed that no significant effects were observed on either. Based on this, it islogical to assume that the increase in reserves has had no effect in stimulating economicactivity. The same conclusion can be derived from the standard theory of thetransmission mechanism of monetary policy. Figure 23 illustrates the long-termdevelopment of monetary base, money supply, and nominal GDP since the 1990s. Asis shown, they moved reasonably in parallel until the first half of the 1990s, despite theproblem of non-performing loans. However, the relationship obviously collapsed fromthe mid-1990s when short-term interest rates reached 0.5%. Such a fact seems toimply that once an economy approaches a zero interest rate boundary, it becomes moredifficult to expect an increase in reserves to have easing effects which would otherwisebe the case.
Independent Expectation Effect Against such a conclusion, some argue that, evenwhen short-term interest rates reach a zero interest boundary, monetary policy couldstill exert stimulative effects if the central bank�s drastic easing alters the expectationsof economic agents. Obviously, expectations play an important role in thetransmission mechanism of monetary policy. First, a central bank�s actions andmessages change expectations with respect to the future path of short-term interest rates.If there are changes in expectations with respect to future short-term interest rates, then
21
long-term interest rates and prices of other financial assets will be affected. However,as we have already seen, under zero interest rates, there is no route to affect long-terminterest rates except the commitment effect. Second, to some extent, a central bankcan contain uncertainty with respect to future liquidity funding by sending a clearmessage. Even if future risk-free short-term interest rates (yields on short-termgovernment bonds) are expected to become zero, there is a possibility that individualeconomic agents, including financial institutions, might face difficulties in liquidityfunding due to changes in the market perception of their creditworthiness. In thisregard, as shown in the pricing of high-grade corporate bonds and CP, it would seemthat the determined posture of providing ample liquidity has the effect of containing, tosome extent, premiums due to uncertainty about liquidity funding. However, thiseffect of reducing liquidity premium derives from the central bank�s decision that ifdemand for liquidity increases it will immediately respond. Therefore, it should benoted that, once credibility has been gained with respect to the central bank�s posture interms of liquidity provision, it does not mean that an increase in the reserve amountwould proportionately resolve future liquidity uncertainty.
In contrast, those who emphasize the �expectation effect� of monetary easing seem toassume a situation such that drastic action on the part of the central bank will inducechanges in �a monetary policy regime�, and thus dramatically change the expectations ofeconomic agents16. We cannot completely rule out the possibility a priori that the�independent expectation effect� will emerge when we increase reserves and the outrightpurchase of long-term government bonds. So far, however, it is difficult to say that the�independent expectation effect� has been observed as a result of the switch to the newprocedures for money market operations with reserves as a major target or an increasein the purchase of long-term government bonds. The adoption of inflation targeting inthis present situation depends on whether such �independent expectation effects� exist ornot. The author believes that, in the absence of effective measures to realize priceincreases, it is difficult to assume that prices will stop declining merely by the Bank ofJapan announcing a target inflation rate.
Tentative assessment Sections 4 to 7 examined the effects of a reserve increaseunder zero interest rates by raising four questions. Although it is difficult to compare
16 For example, when one says the purchase of long-term government bonds has an�independent expectation effect,� it means that while the Bank might raise short-term interestrates despite its clear commitment, such concern is no longer necessary once the Bank increasesits purchase of long-term government bonds.

22
with the case where a reserve increase did not take place, as a tentative conclusion, it issafe to say that we have observed little stimulus arising from a reserve increase underzero interest rates. When one refers to a decline in the effectiveness of monetarypolicy based on such observation, the following two points should be borne in mind.First, although both are pointed out as factors constraining the effectiveness of monetarypolicy, effects stemming from the non-performing loan problem and those from the zerointerest rate boundary need to be clearly distinguished. While the non-performing loanproblem is indeed a factor which substantially reduces monetary policy effectiveness,an increase in reserves had nevertheless exerted easing effects until short-term interestrates reached zero. In contrast, the zero interest rate boundary is qualitatively differentin that it constrains increased reserves in order for easing effects to be produced. Sincethe 1990s, while there has been relatively active discussion as to whether the non-performing loan problem has reduced the effectiveness of monetary policy, the meaningof the zero interest rate boundary is still not thoroughly understood.17
Second, when saying that monetary policy lost effectiveness, one should clearlydistinguish between �additional monetary easing� and �easy monetary conditions�. Asstimulus to economic activity, additional monetary easing has been losing effectivenessafter reaching zero interest rates. On the other hand, once demand starts to rise due toany exogenous factor, easy monetary conditions are expected to support rising demandand strongly stimulate economic activity. The Bank of Japan is committed tomaintaining the current easing framework until CPI recovers a stable positive level.This commitment means that market interest rates will be maintained low for a whileeven when the �natural rate of interest rises� in Wicksellian terminology, which impliesthat it strongly stimulates economic activity.
8. Can Monetary Policy Realize Easing Effects Through the Purchase of SpecificFinancial Assets?
So far, we have discussed the effectiveness of conventional monetary policy. Asexperience since March 2001 shows, the effects of an increase in reserves in stimulating
17 In analyzing effects of increases in monetary base and money supply on Japan�s presenteconomy by using an econometric model, the zero interest rate boundary needs to be explicitlyincorporated. Occasionally, �simulations� are reported which treat past relationships betweenmonetary base and money supply and between money supply and nominal GDP as constant.To draw policy implications by using such simulations seems to carry a fatal flaw.

23
economic activity seem to be extremely limited under zero interest rates. Now, wemove to unconventional monetary policy because, based on actual experience, the focusof the argument of those calling for further monetary easing has gradually shifted fromthe effects of a reserve increase itself to the effects of purchasing long-term governmentbonds, corporate bonds, stocks, exchange traded funds (ETFs), and foreign currency-denominated assets. �Unconventional monetary policy� aims to work on riskpremiums by altering the demand and supply balance, thereby affecting economicactivity.18 While the total amount of reserves is important in �conventional monetarypolicy,� measures to provide reserves become important in �unconventional monetarypolicy�.
In the following, we will examine the effects of �unconventional monetary policy�which involves the purchase of long-term government bonds, corporate bonds, andforeign currency-denominated assets, all of which the Bank is permitted to purchaseunder the current Bank of Japan Law.
Long-term government bonds Reflecting forecasts of the future path of short-terminterest rates, arbitrage transactions take place among yields on long-, medium-, andshort-term government bonds. However, as long as the future path of short-terminterest rates cannot be accurately forecast, there remain certain risk premiums amongthem. In fact, the Bank of Japan, in the new monetary easing framework adopted inMarch 2001, committed to continue this framework until the year-on-year growth rateof CPI is stable at zero percent or above. The commitment adopted by the Bank is apowerful one to the extent that it committed monetary policy to the actual rate ofinflation in the future and is considered to have the effect of reducing risk premium.This can be confirmed by the fact that forward rates, especially those which start fromone year or more ahead, are below those observed during the zero-interest rate policyperiod (Figure 10).
Other than the reduction in risk premiums caused by the above-mentioned commitmenteffect, does an increase in the purchase of long-term government bonds reduce riskpremium by altering the demand and supply balance of such bonds? The outstanding
18 As a rationale for advocating central bank purchase of financial assets such as long-termgovernment bonds, corporate bonds, stocks, and foreign currency-denominated assets, somepoint out that such assets have low substitutability with reserves and are therefore not likely toexperience insufficient bids in market operations. Such a view still falls in the category of�conventional monetary policy,� since it is based on the idea that an increase in reserves canexert stimulative effects.

24
issue amount of long-term government bonds inclusive of medium-term ones was asmuch as 367 trillion yen as of end-September 2001 (Figure 24). There are also plentyof long-term bonds which are substitutable with long-term government bonds. If welimit assets which are substitutable with long-term government bonds to a narrow rangeand only add municipal bonds, government-guaranteed bonds, corporate bonds, samuraibonds, and asset-backed securities (ABS) to the balance of long-term government bonds,the total issue amount reaches 480 trillion yen. It has already been announced that thegross issuance of medium- to long-term government bonds for fiscal 2002 will be 74trillion yen. Against this, the purchase of long-term government bonds by the Bank ofJapan has increased three times since March 2001 to 1 trillion yen per month, or 12trillion yen per year. While the purchase amount has more than doubled comparedwith past practice, it is still natural to think that such operations will bring only marginalchange to the total outstanding amount in the market. In addition, there is an activemarket for interest-rate swaps which have the same economic effects as on-balanceassets. If the size of such a market is also taken into account, the effects of purchasinglong-term government bonds in reducing risk premium are considered to be minimal.In following such a line of reasoning, at least under the existence of a powerfulcommitment effect, it is quite natural to think that there would be almost no additionaleffect such that an increase in long-term government bonds reduces risk premium byaltering the demand and supply balance of such bonds. For reference, looking atmoves in long-term interest rates on the three occasions the Bank announced an increasein the purchase of long-term government bonds, they rose in two cases and declined inone (Figure 11). This seems to suggest that the demand and supply balance effect is oflittle significance, if any. If affecting the demand and supply balance of long-termgovernment bonds is important, as Komiya [2002] argues, the government can bringexactly the same effect through debt management policy by reducing the issuance oflong-term bonds and increasing that of short-term bonds. Given the current size ofissuance, the government�s debt management policy is more effective in changing thedemand and supply balance although the author is skeptical about the effect stemmingfrom the change.
Foreign exchange market According to the Bank of Japan Law, the Bank of Japancan purchase foreign currency-denominated assets as a means to provide reserves.However, the purchase of foreign currency-denominated assets aiming at guiding theforeign exchange rate comes under the jurisdiction of the government, and thus the

25
Bank cannot implement such action on its own judgment and own account.19 Puttingsuch a legal issue aside, if the Bank tries to affect risk premium through working on thesupply and demand balance, the necessary amount to be purchased would be enormous,much more than in the case of long-term interest rates.20 While there is a possibilitythat foreign exchange intervention might be to some extent effective when severalconditions are met, a recognition that its effect is limited is generally taken for grantedin an economy with active capital movements, and many empirical studies seem tosupport this.
Corporate bond market Major elements comprising the risk premium on corporatebonds, or spread against government bonds, are credit premium and liquidity premium.The size of credit premium depends on default probability, the recovery rate at time ofdefault, and investors� capacity to shoulder credit risk. Under normal conditions,monetary easing can affect these components related to credit spreads by improvingcash flow and raising asset prices, although such route would not be available underzero interest rates. With respect to liquidity premium, it seems to be reduced to acertain extent by way of ample liquidity provision, which can be seen from the slightdecline in the spread of high-grade corporate bonds since March 2001. The issue iswhether one can expect a further narrowing of the spread. In this regard, spreads ofhigh-grade corporate bonds are already at a low level. Comparing the curves depictingthe relationship between ratings and credit spreads in Japan and the US, the curve forJapan is located below that for the US (Figure 25). Keynes conceptualized theliquidity trap in which demand for not bonds but currency infinitely increases in theface of possible capital losses stemming from a future rise in long-term interest rates.Likewise, if corporate bond spreads narrow significantly, a situation could arise whereonly a rise in spreads is possible and thus capital losses become of concern. It is notcertain whether Japan is currently in such a situation, but we should bear in mind thatthere is a lower limit to a decline in credit spreads and once spreads reach such territoryinvestors would not increase corporate bond holdings, thus inducing a liquidity trapsituation where demand for liquidity becomes infinite.
Some issues for discussion As discussed above, it seems to be difficult to affect theprices of specific financial assets through the market operations of a central bank.Nevertheless, some might argue that if a central bank purchased a huge amount of
19 See Article 40 of the Bank of Japan Law.20 Foreign exchange interventions in the past three years were all yen-selling operations: 7.6trillion yen in 1999, 3.2 trillion yen in 2000, and 3.2 trillion yen in 2001.

26
specific financial assets, it might affect the prices of such assets. In response to suchargument, the author would like to point out the following three points.
The first point is that the purchase of assets with the aim of artificially boosting theirprice is in effect fiscal policy. If a central bank tried to affect financial asset prices bypurchasing corresponding assets, it would be required to continue purchases even if itresulted in short-term losses. Such aggressive purchase means providing a subsidy toa specific economic group, which is effectively fiscal policy. If such a subsidy to aspecific economic group is deemed effective as macroeconomic policy, the authorbelieves that it would be more appropriate, from the viewpoint of a democracy, thatsuch action should be taken not in the form of monetary policy, but as fiscal policyfollowing a decision by the legislature21.
The second point is that, if an agent were to aggressively purchase assets, which agentwould be the most effective? The extent to which aggressive purchases succeed or notwould depend on whether the market would believe that the purchasing agent was readyto purchase any amount. Since profits and losses of the Bank of Japan eventuallybelong to the government, the success of such operations ultimately depends on thecapacity and determination of the government to incur losses. In addition, even if acentral bank purchased certain assets, it is unlikely that any effects would materialize ifmarket participants judged that the central bank would not aggressively purchase suchassets, simply because it is the central bank. If one seriously pursues the effectivenessof aggressively purchasing specific financial assets in changing the demand and supplybalance, it would seem more effective for the government to set up a special fund forthat purpose.22
The third point is that, when the government purchases specific assets by setting up aspecial fund, it should incur financing costs in normal cases but such costs areextremely low at present. For example, suppose the government finances the purchaseof specific assets by issuing one-year government bonds, the issuance cost is only0.001% at present. 23 In fact, looking at bids for the issuance of short-term government
21 Although changes in interest rates also affect income distribution between debtors andcreditors, the degree of arbitrary intervention in resource allocation and income distribution issmaller than the purchase of specific assets such as stocks and corporate bonds.22 Komiya [2002] denies the effectiveness of stock and corporate bond purchases by the centralbank and refers to the idea that the government, if it so wishes, could establish a specialpurchasing framework.23 If purchase by a government fund could have any meaning, it would be in the situation where

27
bonds, despite some seasonal changes, overheating (bid-to-cover ratio of over 200times) has been the case since January 2001 (Figure 5). If upward pressure is put onshort-term interest rates because of the issuance of short-term government bonds, a risein short-term interest rates will be contained because of the aforementionedcommitment of the Bank of Japan under the current monetary policy framework.
As the previous considerations suggest, the effectiveness of aggressive monetary policyto affect prices of specific financial assets is, after all, attributable to a large extent tothe issue of whether fiscal policy is effective and feasible under the present situation.Debate with respect to further monetary easing has been somewhat twisted, since,despite starting from the recognition that the feasibility and effectiveness of fiscalpolicy is limited, it suggests that the effectiveness of monetary easing can be ensured ifmonetary policy shoulders the function of fiscal policy.
9. What Can We Learn from the Inter-war Period?
In this section we take up the oft-quoted experience of Japan, the US, and Sweden in the1930s, namely the central bank�s underwriting of long-term government bonds led toeconomic recovery in Japan, the Fed�s government bond purchasing operations resultedin economic recovery in the US, and price-level targeting had beneficial effects inSweden. In all cases a �regime shift of monetary policy� was said to have led toeconomic recovery according to the proponents of this view.
Economic policy under Finance Minister Takahashi Junnosuke Inoue who becameFinance Minister upon inauguration of the Hamaguchi Cabinet in July 1929 adoptedausterity measures including lifting of the gold embargo (January 1930). Withadditional effects stemming from the world depression, prices and industrial productionsubstantially declined in 1930-31. In December 1931, the Inukai Cabinet wasestablished, and Finance Minister Takahashi immediately re-imposed the gold embargoand adopted an expansionary policy, leading to economic recovery beginning in 1932.So-called �Takahashi�s economic policy� refers not only to fiscal policy but alsoconsisted of the three pillars of (i) non-interference in the yen�s depreciation, (ii)
the price of the assets to be purchased is undershooting due to excessive pessimism amongprivate economic agents. In such a case, it could be anticipated that the price will be restoredto �a normal level� as a result of government purchase. If the purpose of the fund is understoodin this way, the period for holding the purchased assets should be short.

28
issuance of government bonds underwritten by the Bank of Japan and expansion offiscal expenditure, and (iii) a low-interest rate policy. If we examine the mechanism ofhow economic recovery was brought about, it critically differed from Japan�s currentsituation in four respects (Figure 26).
� Room for substantial decline in interest rates The Bank reduced the officialdiscount rate on four occasions from March 1932. The Bank also sold a massiveamount of government bonds (which it had underwritten) to the market on the onehand, and promoted monetary easing by reducing interest rates on the other. Thecall rate was 5.5% in November 1931, right before the beginning of �Takahashi�seconomic policy,� and subsequently went down to 2.4% in February 1936.Similarly, the yield on government bonds was 5.9% in November 1931 anddeclined to 4.0% in February 1936. As such, the biggest difference comparedwith the present situation in Japan was that the standard transmission mechanismof monetary policy worked in the form of a decline in interest rates at the time.In the meantime, monetary base during the period had been growing at a relativelymoderate pace while in the recent period it has been growing much more sharply(Figure 26).
� Depreciation of the yen Upon entering the �Takahashi�s economic policy�period, the gold embargo was immediately re-imposed, and, under thegovernment�s policy of non-interference in the foreign exchange rate, theyen/dollar rate, which was initially 100 yen to about 50 dollars (Figure 27, lowerpanel), sharply depreciated to 100 yen to about 35 dollars during the short periodof December 1931 to January 1932. Thereafter, the yen further depreciated tothe level of 100 yen to about 20 dollars in December 1932. According to Ito,Okina, and Teranishi [1993] which examined daily developments in exchangerates, of the 60% depreciation of the yen against the dollar, half of suchdepreciation occurred immediately after withdrawal from the gold standard(reimposition of the gold embargo) which aimed at maintaining a foreignexchange rate which was beyond a level consistent with Japan�s economicfundamentals, the remaining half coming from perception of a weaker yen againstthe backdrop of military operations and international isolation such as theShanghai Incident, establishment of Manchuria, and report of the LyttonCommission among others. In addition, it is pointed out that the drain of foreignreserves upon lifting of the gold embargo during the period of Finance Minister

29
Inoue also contributed to the yen�s depreciation.24
� Regime shift due to military expansion and establishment of yen bloceconomies Finance Minister Takahashi shifted to an expansionary fiscal policycentering on expenditure for military expenses and public works for localauthorities. Consequently, fiscal expenditures in 1932 and 1933 recorded adouble-digit nominal increase for two consecutive years (Figure 28, upper panel).In addition, from late 1933, an increase in exports accompanied by directinvestment in yen-bloc economies such as Manchuria, Korea, and Taiwan proppedup demand. During the same period, the trade balance improved against the yenbloc and deteriorated against other areas (Figure 28, lower panel). It could besaid that a regime shift in establishing a yen-bloc economy due to militaryadvances in other countries and colonial rule led the public to expect increases infiscal expenditure and exports, thus inducing private investment and triggering amove toward economic recovery. However, it goes without saying that such ascenario is not an appropriate option today.
� Progress of consolidation and market selection of firms and financialinstitutions in the preceding period Corporate bankruptcies peaked in 1930under Finance Minister Inoue and had started to decline, although still at a highlevel, when �Takahashi�s economic policy� started. Apart from the issue of howto evaluate the quite deflationary austere fiscal policy of Finance Minister Inoue,some argue that a foundation was made whereby fiscal and monetary easingmeasures could be effective because consolidation and market selection of firmsand financial institutions had progressed to some extent (Shima [1983]).
The US experience in the 1930s As a reason for US economic recovery from 1933,when Roosevelt became president, some point out the purchase of government bonds bythe Federal Reserve. However, the following two points deserve attention in makingcomparison with current monetary policy in Japan. � The US economy did recover to some extent from 1933 but it was a recovery from
a level where economic activity had plunged by almost one-third of the peak, and
24 At the time, about 20% of government bonds were foreign currency-denominated bonds, andnet foreign reserves (excluding such foreign currency-denominated bonds) had been negative.In contrast, the present level of Japan�s foreign reserves is about 10% of GDP and there are noforeign currency-denominated government bonds.
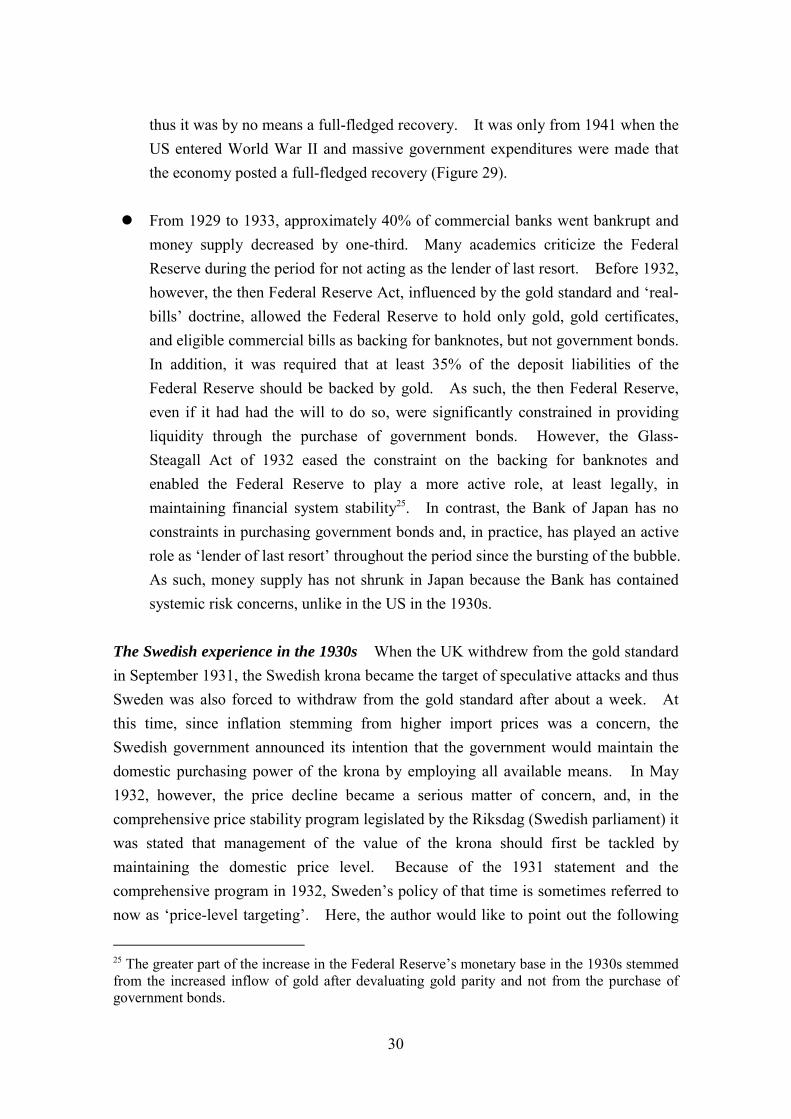
30
thus it was by no means a full-fledged recovery. It was only from 1941 when theUS entered World War II and massive government expenditures were made thatthe economy posted a full-fledged recovery (Figure 29).
� From 1929 to 1933, approximately 40% of commercial banks went bankrupt andmoney supply decreased by one-third. Many academics criticize the FederalReserve during the period for not acting as the lender of last resort. Before 1932,however, the then Federal Reserve Act, influenced by the gold standard and �real-bills� doctrine, allowed the Federal Reserve to hold only gold, gold certificates,and eligible commercial bills as backing for banknotes, but not government bonds.In addition, it was required that at least 35% of the deposit liabilities of theFederal Reserve should be backed by gold. As such, the then Federal Reserve,even if it had had the will to do so, were significantly constrained in providingliquidity through the purchase of government bonds. However, the Glass-Steagall Act of 1932 eased the constraint on the backing for banknotes andenabled the Federal Reserve to play a more active role, at least legally, inmaintaining financial system stability25. In contrast, the Bank of Japan has noconstraints in purchasing government bonds and, in practice, has played an activerole as �lender of last resort� throughout the period since the bursting of the bubble.As such, money supply has not shrunk in Japan because the Bank has containedsystemic risk concerns, unlike in the US in the 1930s.
The Swedish experience in the 1930s When the UK withdrew from the gold standardin September 1931, the Swedish krona became the target of speculative attacks and thusSweden was also forced to withdraw from the gold standard after about a week. Atthis time, since inflation stemming from higher import prices was a concern, theSwedish government announced its intention that the government would maintain thedomestic purchasing power of the krona by employing all available means. In May1932, however, the price decline became a serious matter of concern, and, in thecomprehensive price stability program legislated by the Riksdag (Swedish parliament) itwas stated that management of the value of the krona should first be tackled bymaintaining the domestic price level. Because of the 1931 statement and thecomprehensive program in 1932, Sweden�s policy of that time is sometimes referred tonow as �price-level targeting�. Here, the author would like to point out the following
25 The greater part of the increase in the Federal Reserve�s monetary base in the 1930s stemmedfrom the increased inflow of gold after devaluating gold parity and not from the purchase ofgovernment bonds.

31
points in considering current monetary policy in Japan.
� Nature of policy to target domestic price stability In September 1931,Sweden withdrew from the gold standard in order to escape from a deflationarysituation and the government announced its target of domestic price stability.After that, the krona initially faced sharp depreciation, and thus not deflation butrather inflation was a matter of concern due to rising import prices which wouldlikely permeate nationwide. Therefore, immediately after withdrawal from thegold standard, the official discount rate was raised to 8% from 6% (Kjellstrom[1934] pp.53-54). Subsequently, upward pressure on prices was not as strong asinitially envisaged, and, because of stagnant exports and domestic demand, thesituation changed after 1932 so that the price decline gradually became a concern.Accordingly, the intent of price stabilizing policy changed promptly. It wasrecognized that, in the language used today, neither inflation nor deflation wasdesirable and that price stability was important as a goal of monetary policy.Neither the September 1931 government statement nor the May 1932comprehensive program legislated by the Riksdag set a numerical target for theprice level. Rather, it was considered that monetary policy should not be linkedto a specific price index figure, and it was emphasized that in the conduct ofmonetary policy a central bank should not depend on simple rules but take intoaccount all factors affecting the economic welfare of the nation as a whole (Bergand Jonung [1999]). This is similar to the present situation at the Bank of Japanwhich has announced its determination to prevent price declines, while notadopting a targeting framework with specific numerical numbers.
� Room for interest rate decline At the time of withdrawing from the goldstandard, the official discount rate was 6% and the yield on long-term governmentbonds was about 5%, and thus there was plenty of room for rates to decline.While the official discount rate was raised immediately after withdrawing fromthe gold standard and yields on long-term government bonds rose accordingly,subsequently the central bank implemented monetary easing by way of utilizingthe room for a rate decline. Thereafter, the official discount rate was reduced onseveral occasions to reach 2.5% at end-1933 and yields on long-term governmentbonds gradually declined to the 3% level in late 1933.
� Depreciation of the currency Sweden withdrew from the gold standard atalmost the same time as the UK. As a result, while the rate of depreciation of the

32
krona against the sterling pound was contained at about 10%, it substantiallydepreciated by 40-50% against the dollar as the US maintained the gold standarduntil April 1933.
Implication derived from the history of the 1930s While economic recovery in Japan,the US, and Sweden in the 1930s was not achieved through identical mechanisms, wecan point out some big differences between the experiences of the 1930s and present-day Japan, the following being important from the viewpoint of the transmissionmechanism of monetary policy.
The first point is that, in the 1930s, there was room for short-term interest rates todecline, and monetary easing had been conducted by utilizing such room. In contrast,today there is no room for short-term interest rates to decline in Japan. The secondpoint is the depreciation of the domestic currency in the foreign exchange market in theform of withdrawal from a fixed foreign exchange rate regime. In contrast, Japanpresently adopts a floating foreign exchange rate system under free capital movements,and thus it cannot artificially guide the exchange rate of the yen. The third point is thatthe credit intermediation function of financial institutions performed in the 1930s.With respect to Japan, some point out the fact that the progress of consolidation andmarket selection of firms and financial institutions under Finance Minister Inoue hadenhanced the effectiveness of �Takahashi�s economic policy.� Sweden, which did nothave serious financial system problems, realized a relatively prompt economic recovery.In contrast, the non-performing loan problem in Japan today has yet to be resolved.The fourth point is that government expenditure increased in the 1930s.
Some point to the effects of a �regime shift of monetary policy.� However, the regimeshift of monetary policy in the 1930s proved to be effective because there was room forshort-term interest rates to decline, and, for both Japan and Sweden, the depreciation oftheir currencies was possible upon withdrawing from the gold standard since exchangerates were pegged at a level beyond that consistent with economic fundamentals underthe gold standard. In addition, at the time of �Takahashi�s economic policy�, thereason the public expected a demand increase as a result of fiscal policy and exportswas, apart from its appropriateness, due to a regime shift to military expansion andestablishment of the yen bloc. In other words, in order to induce changes in theformation of public expectations it is necessary that there exists a route through which aregime shift can actually affect the economy.

33
10. Concluding Remarks
The Bank of Japan adopted a new monetary easing framework in March 2001. It isstill too early to draw definite conclusions on the effects of the framework, and, in thisregard, conclusions in this paper are still tentative. As mentioned at the outset, thecurrent state of Japan�s economy is unprecedented in that it confronts both a zerointerest rate boundary and sizable non-performing loans, and thus the author willcontinue to examine the tentative conclusions in this paper by cross-checking them inlight of facts and theories.
Instead of summarizing the wide-ranging issues examined in the paper, the authorwould like to again emphasize the importance of the fact that Japan�s economy isconfronting zero interest rates. As reiterated, in the standard theory of the transmissionmechanism of monetary policy, the starting point from which monetary easing exertseffects is an increase in reserves and a subsequent decline in short-term interest rates.Based on this, in a situation where there is little room for a further decline in short-terminterest rates, the effects of monetary easing will necessarily be limited. The fact thateconomic activity has not been stimulated despite an aggressive increase in reservessince March 2001 seems to be consistent with what such standard theory predicts.This kind of conclusion may frustrate readers who seek to find a monetary policysolution. Some may argue that, without other options, the Bank of Japan should tryunconventional monetary policy even if the effects are not certain. However, given thedifficulty of the problems facing Japan�s economy, before jumping to such conclusion,economists are expected to present sober analysis of the situation fully utilizing all theinformation and knowledge available. In discussing monetary policy ormacroeconomic policy, the author believes it necessary to more seriously accept the factthat the economy is already confronting a zero interest rate boundary and discuss whatkind of remedies are available to handle the situation based on such recognition.Looking at past experiences and orthodox textbooks of economics gives us, at least,some tips for considering what kind of policy could be more effective.
Reference
Japanese:
Kato, Izuru, Nichigin ha shindanoka? – Chou kinyuu kanwa no kouzai, Nihon Keizai

34
Shinbunsha, 2001.
Komiya, Ryutaro, �Kinyuu seisaku rongi ni kansuru jakkan no oboegaki,� mimeo,2002.
Shima, Kinzo, �Iwayuru �Takahashi Zaisei� ni tsuite,� Kin’yu Kenkyu, Vol.2, No.2,1983, pp.83-124.
Shirakawa, Masaaki, �Zero kinri seiyaku to baransu shiito chousei ka no kinyu seisaku,�Economics, No. 5, 2001, pp. 39-52, Toyo-keizai Shinpousha. An English translationof this article is forthcoming in International Finance Vol. 4, Issue 3, 2002.
Ueda, Kazuo, �Ryudousei no wana to kinyu seisaku,� special lecture at the AutumnMeeting of the Japan Society of Monetary Economics in 2001,http://www.boj.or.jp/press/press_f.htm, 2001.
Ueki, Nobuyasu, �Ryutsuu Shijou ni okeru shasai supureddo ni tsuite,� FinancialMarkets Department Working Paper 99-J-5, 1999.
English:
Bank of England, The Monetary Policy Committee, �The Transmission Mechanism ofMonetary Policy,� 1999.
Berg, C. and L. Jonung, �Pioneering Price Level Targeting: The Swedish Experience1931-1937,� Journal of Monetary Economics, Vol. 43, 1999.
Bernanke, B.S. and M. Gertler, �Inside the Black Box: The Credit Channel of MonetaryPolicy Transmission,� Journal of Economic Perspectives, Vol. 9, No. 4, 1995.
Blenck, D., H. Hasko, S. Hilton and K. Masaki, �The Main Features of the MonetaryPolicy Frameworks of the Bank of Japan, the Federal Reserve and the Eurosystem,�BIS Papers, No. 9, 2001.
Borio, C.E.V., �A Hundred Ways to Skin a Cat: Comparing Monetary Policy OperatingProcedures in the United States, Japan and the Euro Area,� BIS Papers, No. 9, 2001.
European Central Bank, The Monetary Policy of the ECB, 2001.
Federal Reserve Board, Purposes & Functions, 1994.
Goodfriend, M., �Overcoming the Zero Bound on Interest Rate Policy,� Journal ofMoney, Credit and Banking, 32(4) Part 2, November 2000.
Ito, T., K. Okina and J. Teranishi, �News and the Dollar/Yen Exchange Rate, 1931-33:The End of the Gold Standard, Imperialism, and the Great Depression,� Journal of theJapanese and International Economies, Vol. 7, No. 2, June 1993.
Kjellstrom, E., Managed Money: The Experience of Sweden, Columbia University Press,New York, 1934.

35
Figure 1
The Standard Transmission Mechanism of Monetary Policy
Change in reserves
Change in short-term interest rates
Change in the prices of financial assets (i.e.medium- and long-term interest rates, foreignexchange rates, stock prices, etc.)
Change in the behavior offinancial institutions
Change in the behavior of domestic private economicagents such as firms and households and also overseaseconomic agents.

36
BOJ 's Current Monetary Easing Framework
1. New Procedures for Money Market Operations: Outstanding Balance of CurrentAccount Deposits at BOJ as the Main Operating Target
· Adopted in March 2001.
· Money Market Operation Guideline (Target amount of current account deposits)
around 4 trillion yen
March 2001 around 5 trillion yen
August 2001 around 6 trillion yen
Should there be a risk of financial market instability such as asurge in liquidity demand, the Bank will provide more liquidityirrespective of the guideline above. (*)
September 2001 above 6 trillion yen
December 2001 around 10-15 trillion yen The same as (*).
February 2002 around 10-15 trillion yenFor the time being, to secure the financial market stabilitytowards the end of a fiscal year, the Bank will provide moreliquidity irrespective of the guideline above.
2. Strong Commitment in Terms of Policy Duration
· The current monetary easing framework will continue in place until CPI registers stably at0% or an increase year on year.
3. Outright Purchase of Long-term Government Bonds
· The Bank will increase the outright purchase of long-term government bonds, if it considers itnecessary for the smooth provision of liquidity.
· Outright purchase of long-term government bonds(400 billion yen per month)
August 2001 600 billion yen per month
December 2001 800 billion yen per month
February 2002 1 trillion yen per month
4. �Lombard-type� Lending FacilityA standby lending facility through which financial institutions can borrow from the Bankat the official discount rate if conditions pre-specified by the Bank are met.
· Introduced in February 2001.
· Official discount rate, which is applied to �Lombard-type� lending.(0.5%)
February 9, 2001 0.35%
February 28, 2001 0.25%
September 18, 2001 0.1%
Figure 2

37
Reserve Demand and Supply
Figure 3.1
Interest rate
Reserve demand curve
Reserve supply curve
Reserve amount
Enlarged
Interest rate
Reserve demand curve
Reserve supply curve
Lower bound of�transaction costs�
Upper limit of reservesupply by the Bank
Under-subscriptionReserve amount

38
Reserve Demand and Supply
Figure 3.2
Interest rate
Reserve amount
Reserve amount
Shift of the reserve demand curve
Interest rate
Reduction in thelower bound of�transaction costs�

39
Monetary Base and Bank of Japan Transactions
0
10
20
30
40
50
60
70
80
90
100
1 2 3 4 5 6 7 8 9 10 11 12 1 2
Other assets
Outright purchases of long-term JGBs
Monetarybase
end-month; yen trillion
2001 2002
Figure 4

40
TBs and FBs
(1) Yields on TBs/FBs in the Secondary Market
0
0.05
0.1
0.15
0.2
0.25
0.3
0.35
0.4
0.45
0.5
3-month FBs1-year TBs
%
(2) Ratio of Competitive Bids to Amount Offered, Newly Issued TBs/FBs
0
100
200
300
400
500
600
700
800
900
1000
FBsTBs
Competitive bids/Amount offered
1 2 3 4 5 6 7 8 9 10 11 12 1 2 32001 2002
Figure 5

41
Short-term Monetary Operations for Reserve Provision
(1) Average Ratio of Competitive Bids to Amount Offered in Short-term MonetaryOperations for Reserve Provision
0.0
0.5
1.0
1.5
2.0
2.5
3.0
3.5
4.0
4.5
1 2 3 4 5 6 7 8 9 10 11 12 1 2 3
Under-subscription occurred frequently(103 times during Jan. 11-Mar. 20, 2002)
Weighted average, ratio
Under-subscription occurred frequently(16 times in May 2001)
2001 2002
Call rate0.25% 0.15%
Outstanding balanceof current accounts
5 trillion yen
Outstanding balanceof current accounts5 6 trillion yen
Outstanding balanceof current accounts
6 above 6 trillion yen
Outstanding balanceof current accounts
above 6 10-15 trillion yen
(2) Under-subscription in Short-term Monetary Operations for Reserve Provision
0
2
4
6
8
10
12
14
16
3 5 7 9 11 1 3 5 7 9 11 1 3 5 7 9 11 1 3
Yen trillion
(2) (1) (3) (2)(7)
(1)
(10)(3) (1) (1)
(16)
(20)
(48)
CY1999 2000 2001 2002
(35)
Notes: 1. Figures in parentheses indicate number of times under-subscription occurred.
2. Data for March 2002 is up to March 20.
Figure 6

42
Yen Funding Cost of Foreign Banksand Current Account Balances at the Bank of Japan
(1) Yen Funding Cost of Foreign Banks Through the Yen-Dollar Swap Transaction
-0.08
-0.06
-0.04
-0.02
0.00
0.02
0.04
0.06%
8 9 10 11 12 1 2 32001 2002
(2) Current Account Balances of Foreign Banks at the Bank of Japan
0
0.5
1
1.5
2
2.5
3
3.5
4
4.5
Q1 Q2 Q3 Q4 Q1 Q2 Q3 Q4
end-quarter; yen trillion
CY2000 2001
Figure 7

43
Current Account Deposits at the Bank of Japan
0
2
4
6
8
10
12
14
16
1 2 3 4 5 6 7 8 9 10 11 12 1 2
Current account balances of financial institutions notsubject to reserve requirementsExcess reserves
Required reserves
2001Reserve maintenance period
2002
Average, yen trillion
Figure 8

44
Short-term Interest Rates
0.0
0.1
0.2
0.3
0.4
0.5
0.6
Call rate (O/N, uncollateralized)Euro-yen rate (3-month)
%
Reserve maintenance period
1 2 3 4 5 6 7 8 9 10 11 12 1 2 32001 2002
Figure 9

45
Three-month Euro-Yen Futures
0.0
0.1
0.2
0.3
0.4
0.5
0.6
0.7
0.8
Spot 1 periodahead
2 periodsahead
3 periodsahead
4 periodsahead
5 periodsahead
6 periodsahead
7 periodsahead
8 periodsahead
9 periodsahead
0.0
0.1
0.2
0.3
0.4
0.5
0.6
0.7
0.8
March 20, 2002
May 17, 1999
% %
Note: On May 17, 1999, the yield on 10-year JGBs declined to its lowest level (1.23%) in the zero-
interest rate policy period (February 12, 1999-August 11, 2000).
Figure 10

46
Yields on Government Bonds(1) Yields on Government Bonds
0.0
0.2
0.4
0.6
0.8
1.0
1.2
1.4
1.6
1.8
2.0
2.2
2.4
2.6
2.8
1 4 7 10 1 4 7 10 1 4 7 10 1 4 7 10 1
10-year
5-year
%
Zero-interest rate policy period Period afterlifting of thezero-interestrate policy
Reserve target period
400 bil. --> 600 bil.yen per month
600 bil. --> 800 bil.yen per month
1998
800 bil. --> 1tril.yen per month
2000 2001
Outright purchase of long-termgovernment bonds
1999 2002
(2) Outright Purchase of Long-term Government Bonds by BOJ (Amounts offered)
0
2
4
6
8
10
12
1 4 7 10 1 4 7 10 1 4 7 10 1 4 7 10 1
Yen 100 billion
1998 1999 2000 2001 2002
(3) Average Yields During each PeriodAverage yields (%)
5-year 10-year
Zero-interest rate policy period 0.99 1.74
Period after lifting of the zero-interest rate policy 0.98 1.65
Reserve target period 0.51 1.35
Figure 11

47
Top Ten Days when Long-term Interest RatesShowed Substantial Moves
(March 19, 2001 - March 20, 2002)
Date Change(% points)
Background
March 23, 2001 0.120 The 10 trillion yen tax reduction plan proposed bythe Liberal Democratic Party (LDP) was reported.The competitive auction of newly issued 10-yearJGBs was substantially underbid.
April 12, 2001 0.120 All LDP presidential election candidates exceptKoizumi proposed the expansion of fiscalexpenditures.
July 9, 2001 0.100 Stock prices dropped sharply and the expectation ofthe expansion of fiscal expenditures spread.
March 21, 2001 -0.095 Monetary easing by BOJ.
March 28, 2001 0.095 The competitive auction of newly issued 10-yearJGBs was substantially underbid.
July 2, 2001 0.085 The subject of the Japanese economy came up at theJapan-US summit. Leading coalition ruling partyand opposition party figures show flexible attitudetowards a supplementary budget.
March 30, 2001 -0.080 More than expected competitive bids in the auctionof newly issued 5-year JGBs.
April 2, 2001 0.080 Investors hesitated to buy JGBs before thecompetitive auction of 20-year JGBs and the releaseof an emergency economic package.
September 17, 2001 -0.075 Expectations of additional monetary easing rose. "Aflight to quality" was observed after the terroristattacks in the US.
August 8, 2001 -0.070 The Council on Economic and Fiscal Policy releasedan outline of austere guidelines concerning budgetrequests.
Figure 12

48
Credit Spreads
(1) CP Spreads (A-1 or higher, 1-month, yields on newly issued CP - GC repo rates)
-0.05
0.00
0.05
0.10
0.15
0.20%
Call rate0.25% 0.15%
Outstanding balanceof current accounts
5 trillion yen
Outstanding balanceof current accounts5 6 trillion yen
Outstanding balanceof current accounts
6 above 6 trillion yen
Outstanding balanceof current accounts
above 6 10-15 trillion yen
1 2 3 4 5 6 7 8 9 10 11 12 1 2 32001 2002
(2) Credit Spreads between JGBs and Corporate Bonds by Rating
0.0
0.2
0.4
0.6
0.8
1.0
1.2
1.4
1.6
Aa
A
Baa
%
Call rate0.25% 0.15%
Outstanding balanceof current accounts
5 trillion yen
Outstanding balanceof current accounts5 6 trillion yen
Outstanding balanceof current accounts
6 above 6 trillion yen
Outstanding balanceof current accounts
above 6 10-15 trillion yen
1 2 3 4 5 6 7 8 9 10 11 12 1 2 32001 2002
Notes: 1. Yields on bonds with 5-year maturity.
2. Yields on corporate bonds by Japan Securities Dealers Association, "Over-the-Counter
Standard Bond Quotations."
3. Moody's ratings.
Figure 13

49
Stock Prices
(1) Nikkei 225 Stock Average and TOPIX
8,0008,500
9,0009,500
10,00010,500
11,00011,500
12,00012,50013,00013,500
14,00014,500
15,000
900
1,000
1,100
1,200
1,300
1,400
1,500Yen
TOPIX (Right)
Nikkei 225 Stock Average(Left)
Points
Call rate0.25% 0.15%
Outstanding balanceof current accounts
5 trillion yen
Outstanding balanceof current accounts5 6 trillion yen
Outstanding balanceof current accounts
6 above 6 trillion yen
Outstanding balanceof current accounts
above 6 10-15 trillion yen
1 2 3 4 5 6 7 8 9 10 11 12 1 2 32001 2002
(2) Stock Price Indices by Industry
60
70
80
90
100
110
120
130
140
150
160
170
180
190
60
70
80
90
100
110
120
130
140
150
160
170
180
190Oct. 1, 2001 =100
Electric appliances
Oct. 1, 2001 =100
Banks Transportation equipment
Construction
Real estate
1 2 3 4 5 6 7 8 9 10 11 12 1 2 32001 2002
Figure 14

50
Exchange Rates and Stock Prices
(1) Exchange Rates (Yen/US$)
110
115
120
125
130
135Tokyo market, as of 5pm
Call rate0.25% 0.15%
Outstanding balanceof current accounts
5 trillion yen
Outstanding balanceof current accounts5 6 trillion yen
Outstanding balanceof current accounts
6 above 6 trillion yen
Outstanding balanceof current accounts
above 6 10-15 trillion yen
1 2 3 4 5 6 7 8 9 10 11 12 1 2 32001 2002
(2) Stock Prices in Japan and the US
8,000
8,500
9,000
9,500
10,000
10,500
11,000
11,500
12,000
900
1,000
1,100
1,200
1,300
1,400
1,500US$ Points
TOPIX (Right)
Dow Jones (Left)
1 2 3 4 5 6 7 8 9 10 11 12 1 2 32001 2002
Figure 15
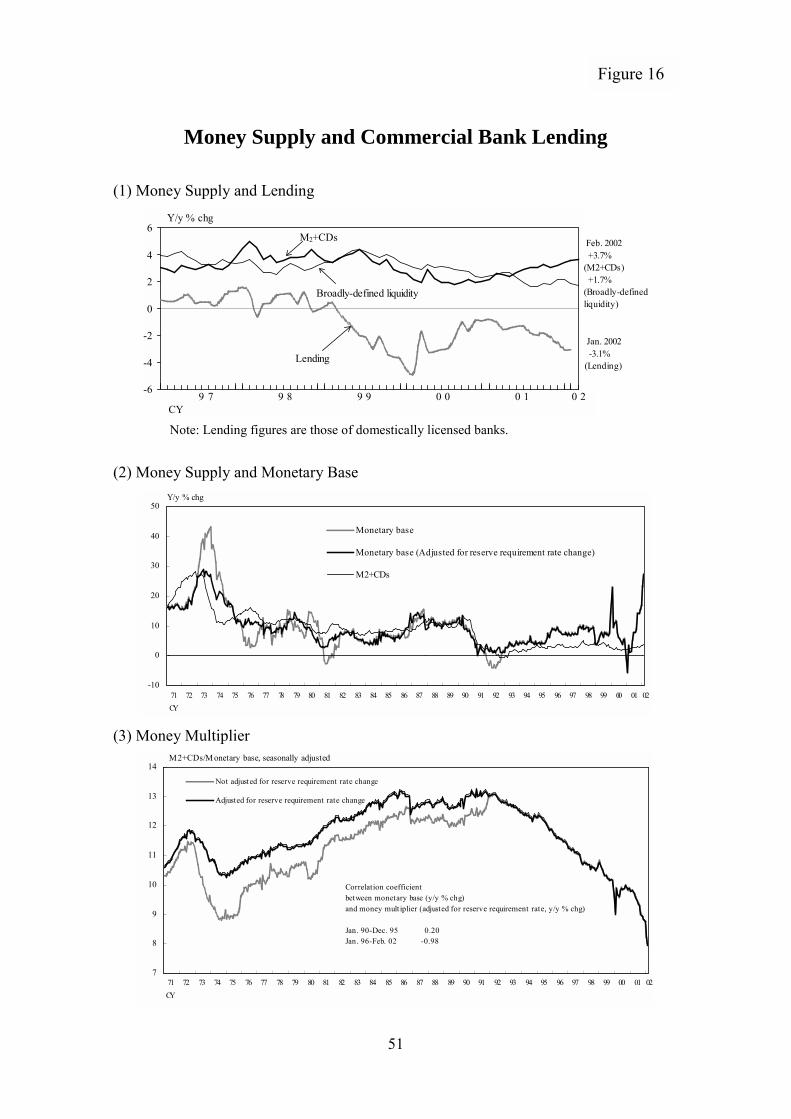
51
Money Supply and Commercial Bank Lending
(1) Money Supply and Lending
-6
-4
-2
0
2
4
6
Broadly-defined liquidity
M2+CDs
Y/y % chg
Lending
Feb. 2002 +3.7%(M2+CDs) +1.7%(Broadly-definedliquidity)
Jan. 2002 -3.1%(Lending)
9 7 9 8 9 9 0 0 0 1 0 2CY
Note: Lending figures are those of domestically licensed banks.
(2) Money Supply and Monetary Base
-10
0
10
20
30
40
50
Monetary base
Monetary base (Adjusted for reserve requirement rate change)
M2+CDs
Y/y % chg
71 72 73 74 75 76 77 78 79 80 81 82 83 84 85 86 87 88 89 90 91 92 93 94 95 96 97 98 99 00 01 02CY
(3) Money Multiplier
7
8
9
10
11
12
13
14
Not adjusted for reserve requirement rate change
Adjusted for reserve requirement rate change
Correlation coefficientbetween monetary base (y/y % chg)and money mult iplier (adjusted for reserve requirement rate, y/y % chg)
Jan. 90-Dec. 95 0.20Jan. 96-Feb. 02 -0.98
M2+CDs/Monetary base, seasonally adjusted
71 72 73 74 75 76 77 78 79 80 81 82 83 84 85 86 87 88 89 90 91 92 93 94 95 96 97 98 99 00 01 02CY
Figure 16

52
Commercial Banks' Assets
80
90
100
110
120
130
140
94 95 96 97 98 99 00 010
50
100
150
200
250
300
Total assets (Left)
Risk assets (Left)
Government bonds (Right)
FY
First half FY94=100 First half FY94=100
Notes: 1. Risk assets are those of internationally active major Japanese banks.
2. Total assets and government bonds are those of domestically licensed banks.
Figure 17

Capital and Risks of Major Japanese Banks
Capital of Major Japanese Banks Subject to the International Standard (as of end-September 2001)
Pr
D
Capital outstanding
Capital adequacy ratiosice Volati
Market
22.
Note: Assum
isposal of
FY
8
53
8 trillion yen
24.9 trillion yen
lity Risk in Holding Stocks (as of end-September 200
value Percent change in TOPIX
-1% -5% -10%
8 0.2 1.1 2.3
ing that the value of stocks held by banks is perfectly correlated with TOP
Non-performing Loans
98 FY99 FY00(P
.8 3.7 3.7
10.58%
32.9
8.00%
Figure 18
1)(Yen trillion)
-20%
4.6
IX (β=1).
(Yen trillion)FY01
rojection)
5.6
trillion yen

54
Figure 19
Commercial Banks’ Profitability
(As of March 2002; %)
Ordinary deposits Time deposits (1 yr.)
Deposit rate (A) 0.020 0.040
Deposit insurance premium(B) 0.084 0.084
Short-term money marketrate (C) 0.001* 0.001**
(C)-(A)-(B) -0.103 -0.123
* The short-term money market rate corresponding to ordinary deposits is the overnight call rate.
** The short-term money market rate corresponding to time deposits is the yield on 1-year TBs.

55
Fund Raising by Non-financial Corporations
(1) Japan
-25
-20
-15
-10
-5
0
5
10
15
95 96 97 98 99 00 01
Bank loansCPCorporate bondsStocksTotal
yen trillion
FY
Note: 2001 figures are CY basis.
(2) US
-1.5
-1.0
-0.5
0.0
0.5
1.0
1.5
2.0
2.5
89 90 91 92 93 94 95
Bank loansCPCorporate bondsStocksTotal
100 billion dollars
CY
Figure 20

56
Swap Spreads
(1) Maturity Structure of Swap Spreads
-0.2
-0.1
0
0.1
0.2
0.3
0.4
0.5
0.6
3-month 1-year 3-year 5-year 7-year 10-year 30-year
US
Euro
Japan
% points
(2) 10-year Swap Spreads (Japan)
-0.1
0
0.1
0.2
0.3
0.4
0.5
0.6% points
CY
Note: Swap spread = Swap rate - Government bond yield
Figure 21

57
Monetary Aggregates and Economic Activity
(1) Average Annual Change During 1995-2000
12.3
7.9
3.3
-0.4
1.4
0.1
-2
0
2
4
6
8
10
12
14
Current accounts Monetary base M2+CDs Commercialbank lending
Real GDP Consumer prices
%
(2) Changes in the Last One Year
255.1
27.53.7
-3.1 -2.2
-0.8
-50
0
50
100
150
200
250
300
Current accounts Monetary base M2+CDs Commercial banklending
Real GDP Consumer prices
(Feb. 2002)
Y/y % chg
(Feb. 2002) (Feb. 2002) (4Q/01) (Jan. 2002)(Jan. 2002)
Note: Consumer prices are the Consumer Price Index excluding fresh food for Japan.
Figure 22

58
Monetary Aggregates and Nominal GDP
(1) Monetary Figures and Nominal GDP
0.8
1
1.2
1.4
1.6
1.8
2
2.2
2.4
90 91 92 93 94 95 96 97 98 99 00 01
1Q90=1
CY
Monetary base
M2+CDs
Nominal GDP
02
Notes: 1. The monetary base figure is adjusted for changes in reserve requirement rate.
2. Shaded area indicates period under very low interest rates.
3. The figure for 1Q02 is the Jan.-Feb. average.
(2) Short-term Interest Rates (Uncollateralized Call Rate, O/N)
0.0
1.0
2.0
3.0
4.0
5.0
6.0
7.0
8.0
9.0
90 91 92 93 94 95 96 97 98 99 00 01
%
CY 02
Note: The figure for 1Q02 covers the period through March 20.
Figure 23
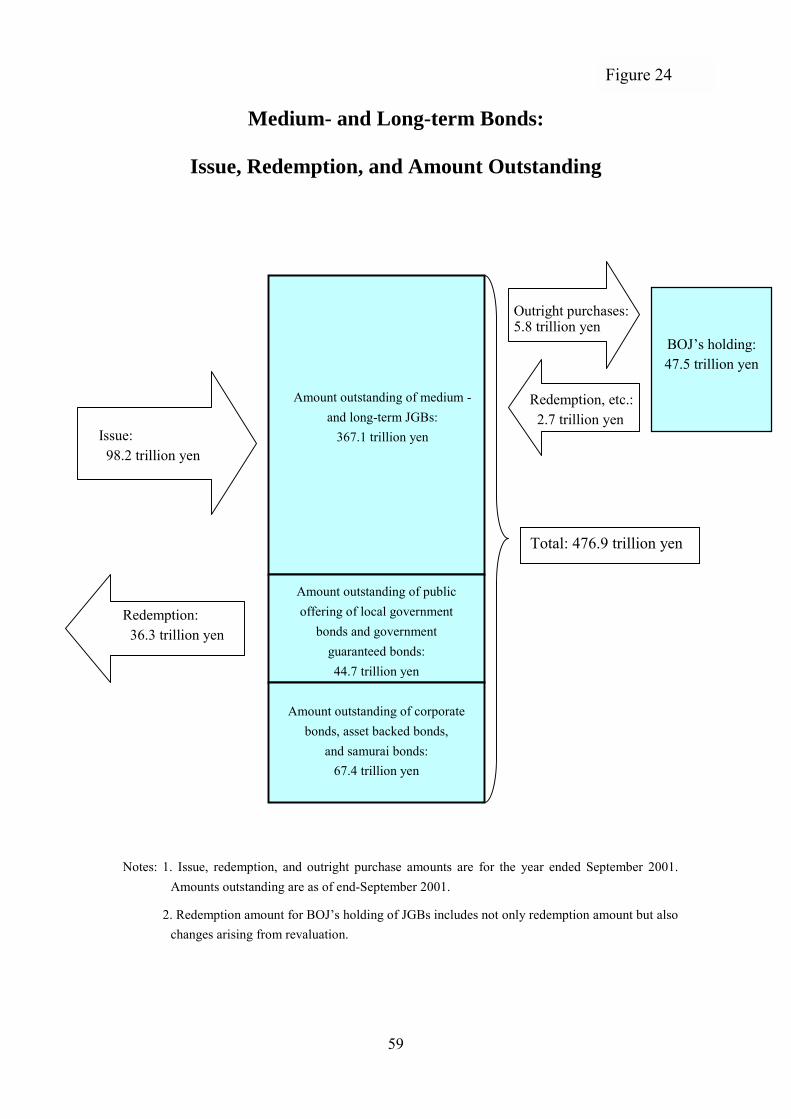
Medium- and Long-term Bonds:
Issue, Redemption, and Amount Outstanding
Amount outstanding of medium -and long-term JGBs:
367.1 trillion yen
BOJ�s holding:47.5 trillion yen
Outright purchases:5.8 trillion yen
Notes: 1. Issue, redemption, aAmounts outstanding
2. Redemption amount changes arising from r
Figure 24
Amount outstanding of publicoffering of local government
bonds and governmentguaranteed bonds:44.7 trillion yen
Issue: 98.2 trillion yen
59
nd outright purchase amounts are for the yare as of end-September 2001.
for BOJ�s holding of JGBs includes not onlyevaluation.
Amount outstanding of corporatebonds, asset backed bonds,
and samurai bonds:67.4 trillion yen
Total: 476.9 trillion yen
Redemption: 36.3 trillion yen
Redemption, etc.: 2.7 trillion yen
ear ended September 2001.
redemption amount but also

60
Credit Spreads in Japan and the US(5-year, as of March 20, 2002)
0
20
40
60
80
100
120
AAA AA+/AA1 AA/AA2 AA-/AA3 A+/A1 A/A2 A-/A3
(Japan/US)
US
Japan
Spreads between yields on corporate bonds and government bonds, bps
Notes: 1. Figures for Japan are estimated in the same way as Ueki [1999]. 2. US figures based on Bloomberg data.
Figure 25

61
Figure 26
Comparison Between the Period of “Takahashi’sEconomic Policy” (Dec. 1931-Feb. 1936) and the Present
Under Takahashi�s policy Present (the last one year)Amount outstanding of JGBs
held by BOJ(Including FBs)
260 million yen → 730 million yen (end -CY1931) (end-CY1935)
+30% annually
50.3 trillion yen → 75.4 trillion yen (end-CY2000) (end-CY2001)
+50%
BOJ�s holdingsAmount outstanding of JGBs
4.1% → 7.3% (end-CY1931) (end-CY1935)
12.6% → 16.4% (end-CY2000) (end-CY2001)
Monetary base 1.09 billion yen→1.39 billion yen (Nov. 1931) (Feb. 1936)
+6% annually
64.8 trillion yen → 82.6 trillion yen (Feb. 2001) (Feb. 2002)
+27.5%
Call rate 5.5% → 2.6%(Nov. 1931) (Feb. 1936)
0.26% → 0.001%(end-Feb. 2001) (Mar. 20, 2002)
Yield on long-term governmentbonds
5.9% → 4.1%(Nov. 1931) (Feb. 1936)
1.35% → 1.43%(end-Feb. 2001) (Mar. 20, 2002)
Nominal fiscal expenditures(based on National Accounts)
+34%(CY1931 → CY1935)
-0.5%(FY00 → First half FY01)
Foreign exchange rate(Yen/US$)
2.0 yen → 3.4 yen(Nov. 1931) (Feb. 1936)
116.44 yen → 132.21 yen (end-Feb. 2001) (Mar. 20, 2002)
Notes: 1. Yield figures for long-term government bonds are for interest-bearing government bonds(issue number 1, due 1969) in the period of �Takahashi�s economic policy� and recent 10-year JGBs.
2. Monetary base in the period of �Takahashi�s economic policy� is the sum of banknotesand general deposits at BOJ, which include private sector deposits, but not those of thegovernment.

62
Monetary Aggregates and Exchange RatesUnder "Takahashi's Economic Policy"
(1) Monetary Base and M1
-20
-10
0
10
20
30
40
50
26 27 28 29 30 31 32 33 34 35 36
Monetary base (Banknotes + General deposits at BOJ) M1 (Estimated by Fujino)
Under Inoue'spolicy
3-month moving average; y/y % chg
Under Takahashi'spolicy
CY
Fina
ncia
l cris
is
(2) Exchange Rates
0
10
20
30
40
50
60
26 27 28 29 30 31 32 33 34 35 360
2
4
6
8
10
12
US$/Yen (Left) Pound/Yen (Right)
Fina
ncia
l cris
is
US$/100yen Pound/100yenUnder Inoue's
policyUnder Takahashi's
policy
Engl
and
aban
done
dth
e go
ld s
tand
ard
Japa
n ab
ando
ned
the
gold
sta
ndar
d
U.S
. aba
ndon
edth
e go
ld s
tand
ard
CY
Figure 27

63
Nominal Government Expenditures and Exports
(1) Nominal Government Expenditures
-16
-12
-8
-4
0
4
8
12
16
26 27 28 29 30 31 32 33 34 35 36
Non-military investments Military investmentsOrdinary expenditures Nominal government expenditures
Y/y % chg
Under Inoue'spolicy
Under Takahashi'spolicy
Note: Based on GNP (estimated by Ohkawa).
(2) Contribution of Yen-bloc Economies to Nominal Exports
-40
-20
0
20
40
60
26 27 28 29 30 31 32 33 34 35 36
Contribution ofthe Yen-bloc
economies
Total exports (including
exports to yen-bloc economies)
Fina
ncia
l cris
is
Under Inoue'spolicy
Under Takahashi'spolicy
Man
chur
ia e
stab
lishe
d
3-month moving average; y/y % chg
Note: Yen-bloc economies include Korea and Taiwan before February 1932, and Korea, Taiwan,Manchuria and Kwantung leased territory after March 1932.
Figure 28

64
US Economy after the Great Depression
(1) Major Economic Indicators
60
80
100
120
140
160
180
200
29 30 31 32 33 34 35 36 37 38 39 40 41 42 43
Real GNP
Money supply
CPI
CY1929=100
CY
(2) Real GNP
-20
-15
-10
-5
0
5
10
15
20
25
30
29 30 31 32 33 34 35 36 37 38 39 40 41 42 43 44 45
Contribution of public demand
Contribution of private demand
Real GNP
Y/y % chg
CY
Figure 29