illinois strategic highway safety plan 2017 · and reliable transportation system helps to keep our...
TRANSCRIPT
Illinois Strategic Highway
Safety Plan 2017
ENGINEERING
ENFORCEMENT
EDUCATION
EMS
07.28.2017
Contents
Executive Summary
17
24
5
31
37
44
50
Unrestrained Occupants
Intersection Related
Impaired Driver
Speeding/Aggressive Driver
Roadway Departure
Older Driver
2Illinois Strategic Highway Safety Plan 2017
73
79
66
86
93
101
108
58
116
121
Pedalcyclist
Work Zone
Pedestrian
Distracted/Fatigued/Drowsy Driver
Highway-Railroad Grade Crossings
Traffic Incident Management
Information Systems
Heavy Vehicle
Motorcycle
Young Driver
3Illinois Strategic Highway Safety Plan 2017
Greetings:
As Secretary of Transportation for the State of Illinois, I want our roadways to be safe for everyone. A safe
and reliable transportation system helps to keep our economy moving and helps ensure the quality of life
we enjoy in Illinois.
I am pleased to present the Illinois Strategic Highway Safety Plan (ILSHSP). This collaborative plan was
created through the work of many safety advocates. Stakeholders included those involved in planning,
designing, constructing, operating and maintaining the roadway infrastructure; modifying road-user
behavior and preventing injury (education and enforcement); and controlling injury (emergency medical
services). This ILSHSP outlines a clear set of actions and proposed strategies to be taken to save lives on
our roadways.
Our progress in roadway safety has been impressive. Traffic fatalities in Illinois have fallen from 1,454 in
2003 to just under 1,000 in 2015. Still, far too many people are being killed or seriously injured on Illinois
roadways. With that in mind, the SHSP is targeting a goal of “Zero Fatalities,” which envisions reducing
fatalities on Illinois roadways to zero in the long term.
Our shared vision of eliminating roadway fatalities can become tomorrow’s reality. Achieving that vision
requires continued collaboration, cooperation, and the sharing of knowledge and resources throughout
the implementation of this plan. We must all do our part in keeping our roadways safe. Whether you drive,
walk, ride, or bike, remember safety doesn’t happen by accident. Together we can make a positive differ-
ence in the lives of our citizens and visitors to our state and “Drive Zero Fatalities to Reality.”
Sincerely,
Randall S. Blankenhorn
Secretary of Transportation
Letter from the Secretary
4Illinois Strategic Highway Safety Plan 2017
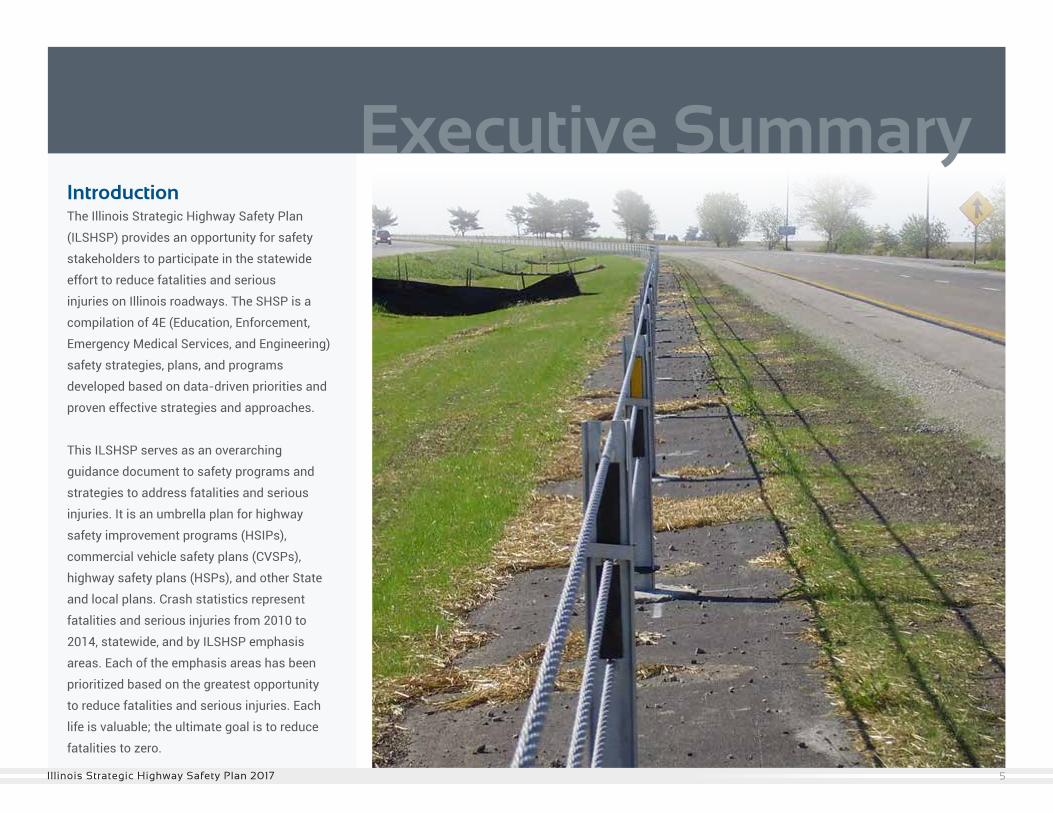
IntroductionThe Illinois Strategic Highway Safety Plan
(ILSHSP) provides an opportunity for safety
stakeholders to participate in the statewide
effort to reduce fatalities and serious
injuries on Illinois roadways. The SHSP is a
compilation of 4E (Education, Enforcement,
Emergency Medical Services, and Engineering)
safety strategies, plans, and programs
developed based on data-driven priorities and
proven effective strategies and approaches.
This ILSHSP serves as an overarching
guidance document to safety programs and
strategies to address fatalities and serious
injuries. It is an umbrella plan for highway
safety improvement programs (HSIPs),
commercial vehicle safety plans (CVSPs),
highway safety plans (HSPs), and other State
and local plans. Crash statistics represent
fatalities and serious injuries from 2010 to
2014, statewide, and by ILSHSP emphasis
areas. Each of the emphasis areas has been
prioritized based on the greatest opportunity
to reduce fatalities and serious injuries. Each
life is valuable; the ultimate goal is to reduce
fatalities to zero.
Executive Summary
5Illinois Strategic Highway Safety Plan 2017
SHSP MissionThe ILSHSP mission is to develop, implement, and manage a data-driven, integrated, multi-stakeholder
process to improve the attributes of roads, behavior of users, and performance of vehicles to reduce
traffic-related deaths and life-altering injuries on all public roads in Illinois.
SHSP Goal – Zero FatalitiesThe ILSHSP “Zero Fatalities” goal, established at the 2008 Illinois Safety Summit, envisions reducing
fatalities on Illinois roads to zero in the long term. Safety Stakeholders agreed that immediate and
aggressive actions must be taken to continue to significantly reduce the number of traffic-related deaths
and life-altering injuries in Illinois.
The ILSHSP is the tool to achieve this Zero Fatalities goal. Annual targeted fatality reductions of 5 to 10
percent overall were agreed to by all stakeholders in 2008. With new performance measures and targets
being required to be established by states, these numbers will be reconsidered. Implementation teams
will consider these as they develop their implementation plans and strategies. Significant investments
were made in strategies designed to reduce fatalities in specific crash areas.
SHSP PartnersAmerican Automobile Association (AAA) Chicago
American Association of Retired Persons (AARP)
Chicago Metropolitan Agency Planning
Chicago Police Department
Federal Highway Administration (FHWA)
Federal Motor Carrier Safety Administration (FMCSA)
Illinois Department of Transportation
Illinois American Traffic Safety Services Association
Illinois Association of County Engineers
Illinois Association of Chiefs of Police
Illinois Broadcasters Association
Illinois Commerce Commission
Illinois Department of Public Health
Illinois Municipal League Public Works
Illinois Road and Transportation Builders Association
Illinois Secretary of State
Illinois Sheriffs’ Association
Illinois Tollway
Illinois State Police
Illinois Trucking Association
Metropolitan Planning Organizations
Mid-West Truckers Association
National Highway Safety Transportation Administration (NHTSA)
Township Highways Commissioners
6Illinois Strategic Highway Safety Plan 2017
The 2015 federal bill reauthorizing surface transportation funding, titled Fixing America’s SurfaceTransportation Act (FAST), re-emphasizes key safety elements of MAP-21 (Moving Ahead for Progress in the 21st Century) and SAFETEA-LU by continuing to require each state to develop, implement, and update a Strategic Highway Safety Plan (SHSP). An SHSP is a statewide coordinated safety plan that provides a comprehensive framework for reducing fatalities and serious injuries on all public roads. The SHSP identifies effective strategies to improve roadway safety by addressing areas of greatest need. The SHSP remains a statewide coordinated plan developed in cooperation with a broad range of multidisciplinary stakeholders.
The first Illinois Comprehensive Highway Safety Plan (ICHSP) was developed in 2005 and the first Highway Safety Plan (HSP) was developed in 2006. Although recent years have been safer for roadway traffic, too many people are dying on Illinois roadways from traffic crashes. With that in mind, the 2009 Illinois Strategic Highway Safety Plan (ILSHSP) set a new goal of Zero Fatalities, which envisioned reducing fatalities on Illinois roadways to zero in the long term.
In this version of the ILSHSP, the Zero Fatalities goal is the guiding principle. Through integrating the efforts and resources of multidisciplinary safety stakeholders, this SHSP defines a system, organization, and process for managing the attributes of the road, driver, and vehicle to achieve the highest level of roadway safety. The ILSHSP uses a performance based approach and data-driven process for emphasis area prioritization and strategy selection.
ProcessAnalyses are performed based on safety data collected by the Illinois Department of Transportation (IDOT) for the number of traffic-related fatalities and serious injuries. To identify trends, other sources are considered including, but are not limited to, National Highway Traffic Safety Administration (NHTSA) Fatality Analysis Reporting System (FARS) data, Federal Railroad Administration (FRA) Highway-Rail Crossing Inventory Data, vehicle licensing data, and roadway traffic volume data. This plan was developed using the most recent data available (2010-2014) at the time of plan development, unless otherwise noted.
A data-driven method is used to analyze trends and prioritize emphasis areas. Strategies are aimed ataddressing the areas and contributing factors associated with high frequencies of fatalities and seriousinjuries. FHWA’s Crash Modification Factor (CMF) Clearinghouse (FHWA, 2014) studies and project-levelevaluations are consulted to select efficient strategies; and benefit-cost analyses are considered to define low cost and systemic strategies.
STRATEGIC HIGHWAY SAFETY PLAN OVERVIEW
7Illinois Strategic Highway Safety Plan 2017
The state of Illinois is firmly committed to achieving a safer transportation system for the public. Discussions with stakeholders captured the impacts of emerging technologies, the role of state and local agencies, and several specific safety issues.
Stakeholder OutreachThe state is committed to achieving a safer transportation system for the public, stakeholder involvement and commitment is crucial. Over 140 stakeholders participated in 16 emphasis areas working groups. Stakeholders represent the 4E areas – engineering, enforcement, education, and emergency medical services and include multi-modal federal and state agencies, regional safety coalitions, and local agencies.
Working sessions with coalition stakeholders at executive meetings, forums, and workshops have captured the impacts of emerging technologies, the role of state and local agencies, and several safety issues and have provided input on the emphasis-area crash trends and strategies based on their knowledge and current initiatives.
IDOT coordinated with the Metropolitan Planning Organizations (MPOs) and counties to identify and address issues on non-state owned roadways. Targeted workshops were conducted through the MPO targetsetting effort and the county strategic highway safety plan program to discuss goals, priorities, and strategies. In addition, IDOT is working with each county to develop county-specific SHSPs. These plans are datadriven, with a goal to reduce severe crashes (those involving fatalities and serious injuries) by documenting at-risk locations, identifying effective safety improvement strategies, and better positioning respective counties to compete for available safety funds. Plans include a description of the connection to safety-planning efforts at the national level, state level (through the ILSHSP and the HSIP), and MPO level.
The Illinois executive transportation safety committee presented the mission, vision, and Zero Fatalities goal. The SHSP was developed to provide collaboration with and guidance to stakeholder agencies to maximize the impact of investments to achieve safety goals. The SHSP has multiyear objectives for each emphasis area along individual implementation plans.
8Illinois Strategic Highway Safety Plan 2017
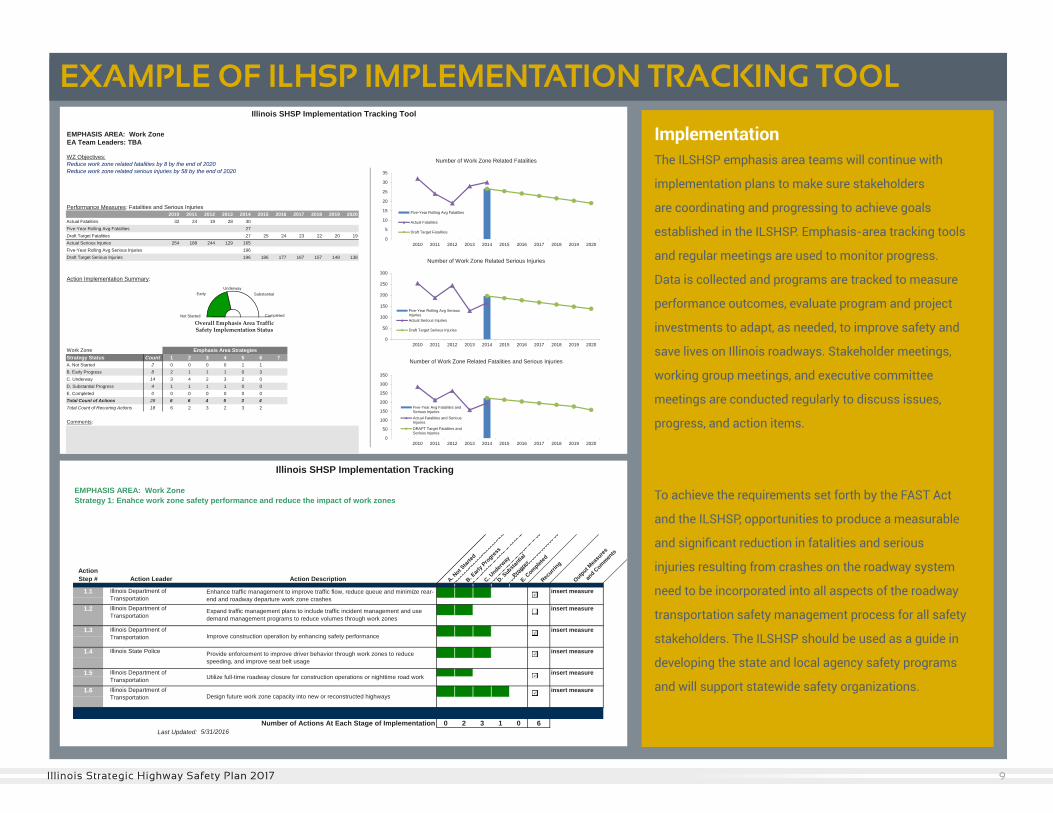
Illinois SHSP Implementation Tracking Tool
EMPHASIS AREA: Work ZoneEA Team Leaders: TBA
WZ Objectives:Reduce work zone related fatalities by 8 by the end of 2020Reduce work zone related serious injuries by 58 by the end of 2020
Performance Measures: Fatalities and Serious Injuries2010 2011 2012 2013 2014 2015 2016 2017 2018 2019 2020
Actual Fatalities 32 24 19 28 30Five-Year Rolling Avg Fatalities 27Draft Target Fatalities 27 25 24 23 22 20 19Actual Serious Injuries 254 188 244 129 165Five-Year Rolling Avg Serious Injuries 196Draft Target Serious Injuries 196 186 177 167 157 148 138
Action Implementation Summary:
0360
1260540
077 283
#REF! #REF!
Work ZoneStrategy Status Count 1 2 3 4 5 6 7A. Not Started 2 0 0 0 0 1 1B. Early Progress 8 2 1 1 1 0 3C. Underway 14 3 4 2 3 2 0D. Substantial Progress 4 1 1 1 1 0 0E. Completed 0 0 0 0 0 0 0Total Count of Actions 28 6 6 4 5 3 4Total Count of Recurring Actions 18 6 2 3 2 3 2
Comments:
Emphasis Area Strategies
Overall Emphasis Area Traffic Safety Implementation Status
Not Started
Early Underway
Substantial
Completed
0
50
100
150
200
250
300
350
2010 2011 2012 2013 2014 2015 2016 2017 2018 2019 2020
Number of Work Zone Related Fatalities and Serious Injuries
Five-Year Avg Fatalities andSerious InjuriesActual Fatalities and SeriousInjuriesDRAFT Target Fatalities andSerious Injuries
0
50
100
150
200
250
300
2010 2011 2012 2013 2014 2015 2016 2017 2018 2019 2020
Number of Work Zone Related Serious Injuries
Five-Year Rolling Avg SeriousInjuriesActual Serious Injuries
Draft Target Serious Injuries
0
5
10
15
20
25
30
35
2010 2011 2012 2013 2014 2015 2016 2017 2018 2019 2020
Number of Work Zone Related Fatalities
Five-Year Rolling Avg Fatalities
Actual Fatalities
Draft Target Fatalities
DRAFT for Discussion Purposes Only 1 of 8
Illinois SHSP Implementation Tracking
EMPHASIS AREA: Work ZoneStrategy 1: Enahce work zone safety performance and reduce the impact of work zones
ActionStep # Action Leader Action Description A. N
ot Started
B. Earl
y Progres
s
C. Unde
rway
D. Sub
stanti
al
Progres
s
E. Com
pleted
Recurri
ng
Output Measu
res
and C
ommen
ts
TRUE1
FALSE
1
TRUE
1
TRUE
1
TRUE
1 TRUE
TRUE
1
Number of Actions At Each Stage of Implementation 0 2 3 1 0 6Last Updated: 5/31/2016
1.6 Illinois Department of Transportation Design future work zone capacity into new or reconstructed highways
1.5 Illinois Department of Transportation Utilize full-time roadway closure for construction operations or nighttime road work
Illinois Department of Transportation Improve construction operation by enhancing safety performance
1.4 Illinois State Police Provide enforcement to improve driver behavior through work zones to reduce speeding, and improve seat belt usage
1.1 Illinois Department of Transportation
Enhance traffic management to improve traffic flow, reduce queue and minimize rear-end and roadway departure work zone crashes
insert measure
insert measure
insert measure
insert measure
insert measure
insert measure
1.2 Illinois Department of Transportation
Expand traffic management plans to include traffic incident management and use demand management programs to reduce volumes through work zones
1.3
EXAMPLE OF ILHSP IMPLEMENTATION TRACKING TOOL
ImplementationThe ILSHSP emphasis area teams will continue with
implementation plans to make sure stakeholders
are coordinating and progressing to achieve goals
established in the ILSHSP. Emphasis-area tracking tools
and regular meetings are used to monitor progress.
Data is collected and programs are tracked to measure
performance outcomes, evaluate program and project
investments to adapt, as needed, to improve safety and
save lives on Illinois roadways. Stakeholder meetings,
working group meetings, and executive committee
meetings are conducted regularly to discuss issues,
progress, and action items.
To achieve the requirements set forth by the FAST Act
and the ILSHSP, opportunities to produce a measurable
and significant reduction in fatalities and serious
injuries resulting from crashes on the roadway system
need to be incorporated into all aspects of the roadway
transportation safety management process for all safety
stakeholders. The ILSHSP should be used as a guide in
developing the state and local agency safety programs
and will support statewide safety organizations.
9Illinois Strategic Highway Safety Plan 2017
1,363
1,254
1,2481,043
911
927
918956
991924
0
200
400
600
800
1,000
1,200
1,400
1,600
ActualFatalities Linear(Last10Yr) Linear(Last5Yr) 5%AnnualReductionGoal (From5-YrRolling Avg) 5-YrRolling Avg
18,325
17,751
15,864
13,401 13,006
12,631
11,939 12,398
12,300
11,748
0
2,000
4,000
6,000
8,000
10,000
12,000
14,000
16,000
18,000
20,000
ActualA-Injuries Linear(Last10Yr) Linear(Last5Yr) 5%AnnualReductionGoal (From5-YrRolling Avg) 5-YrRolling Avg
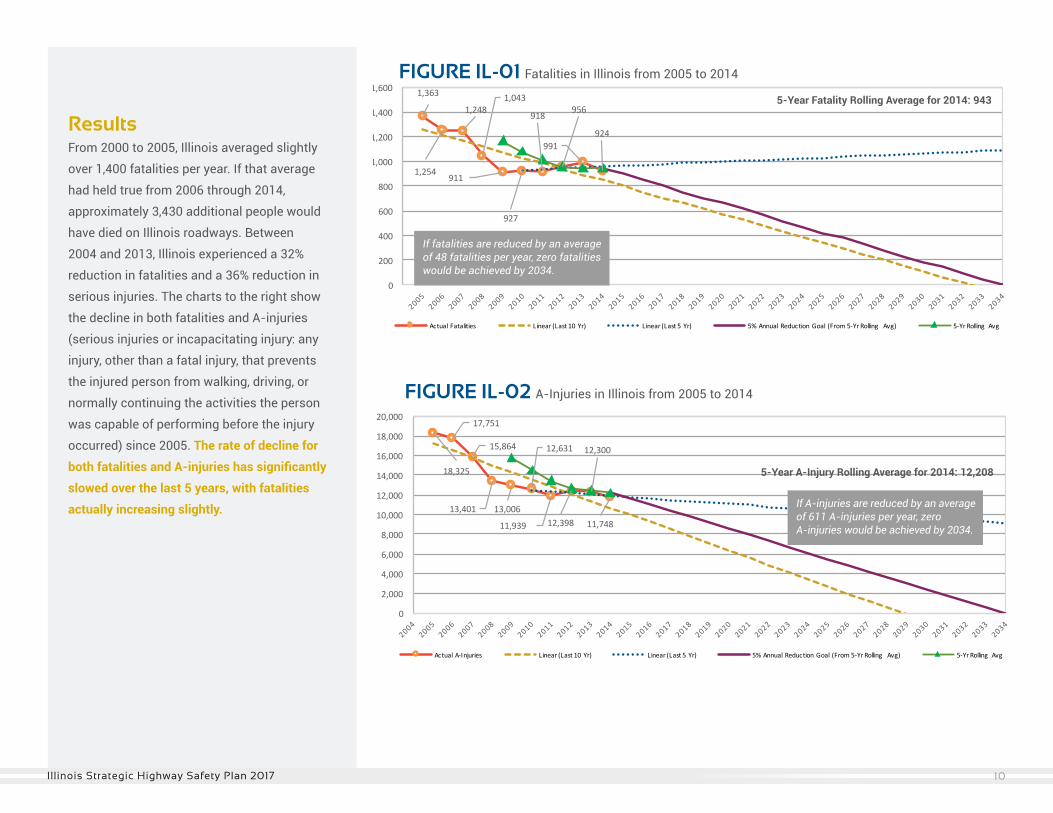
FIGURE IL-01 Fatalities in Illinois from 2005 to 2014
If fatalities are reduced by an average of 48 fatalities per year, zero fatalities would be achieved by 2034.
FIGURE IL-02 A-Injuries in Illinois from 2005 to 2014
If A-injuries are reduced by an average of 611 A-injuries per year, zero A-injuries would be achieved by 2034.
5-Year Fatality Rolling Average for 2014: 943
5-Year A-Injury Rolling Average for 2014: 12,208
ResultsFrom 2000 to 2005, Illinois averaged slightly
over 1,400 fatalities per year. If that average
had held true from 2006 through 2014,
approximately 3,430 additional people would
have died on Illinois roadways. Between
2004 and 2013, Illinois experienced a 32%
reduction in fatalities and a 36% reduction in
serious injuries. The charts to the right show
the decline in both fatalities and A-injuries
(serious injuries or incapacitating injury: any
injury, other than a fatal injury, that prevents
the injured person from walking, driving, or
normally continuing the activities the person
was capable of performing before the injury
occurred) since 2005. The rate of decline for
both fatalities and A-injuries has significantly
slowed over the last 5 years, with fatalities
actually increasing slightly.
10Illinois Strategic Highway Safety Plan 2017
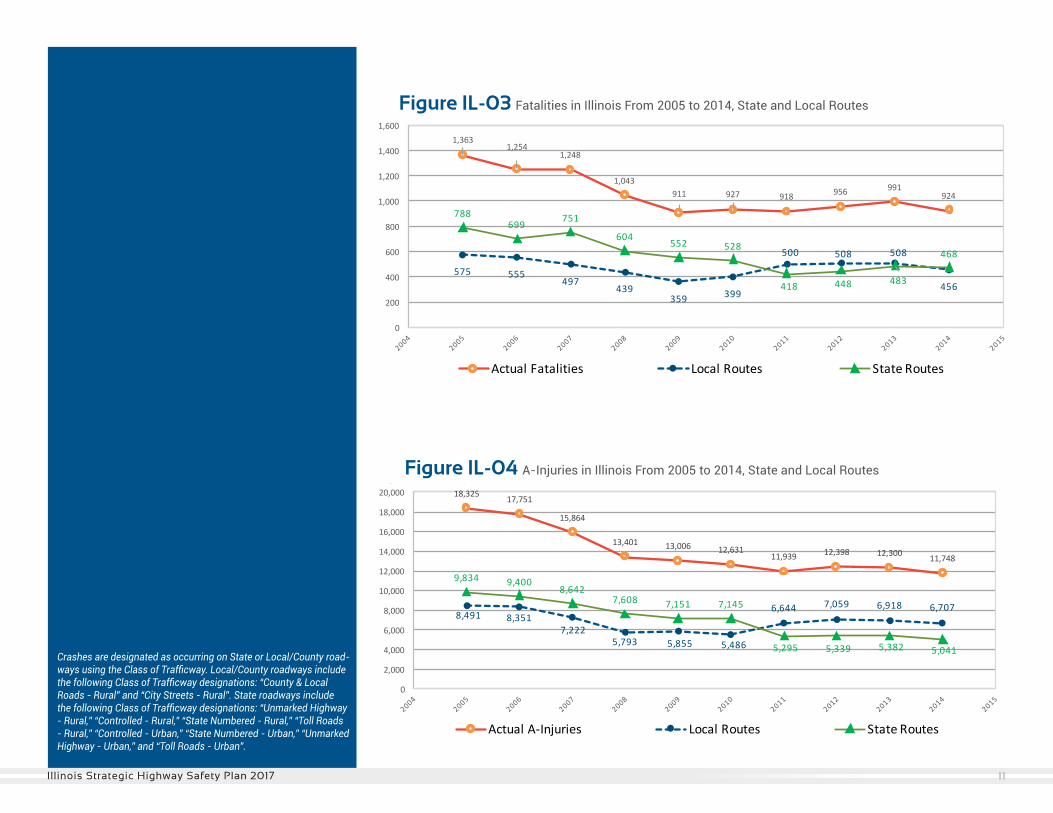
Figure IL-03 Fatalities in Illinois From 2005 to 2014, State and Local Routes
Figure IL-04 A-Injuries in Illinois From 2005 to 2014, State and Local Routes
2012 956 448 508 2012 12,398 5,339 7,0592013 991 483 508 2013 12,300 5,382 6,9182014 924 468 456 2014 11,748 5,041 6,7072015 2015
FigureIL-04A-InjuriesinIllinoisFrom2005to2014,StateandLocalRoutes
FigureIL-03FatalitiesinIllinoisFrom2005to2014,StateandLocalRoutes
18,325 17,751
15,864
13,401 13,006 12,63111,939 12,398 12,300 11,748
8,491 8,3517,222
5,793 5,855 5,486
6,644 7,059 6,918 6,707
9,834 9,4008,642
7,608 7,151 7,145
5,295 5,339 5,382 5,041
0
2,000
4,000
6,000
8,000
10,000
12,000
14,000
16,000
18,000
20,000
ActualA-Injuries LocalRoutes StateRoutes
1,3631,254
1,248
1,043911 927 918 956 991
924
575 555497
439359 399
500 508 508
456
788699 751
604 552 528
418 448 483
468
0
200
400
600
800
1,000
1,200
1,400
1,600
ActualFatalities LocalRoutes StateRoutes
Crashes are designated as occurring on State or Local/County road-ways using the Class of Trafficway. Local/County roadways include the following Class of Trafficway designations: “County & Local Roads - Rural” and “City Streets - Rural”. State roadways include the following Class of Trafficway designations: “Unmarked Highway - Rural,” “Controlled - Rural,” “State Numbered - Rural,” “Toll Roads - Rural,” “Controlled - Urban,” “State Numbered - Urban,” “Unmarked Highway - Urban,” and “Toll Roads - Urban”.
11Illinois Strategic Highway Safety Plan 2017
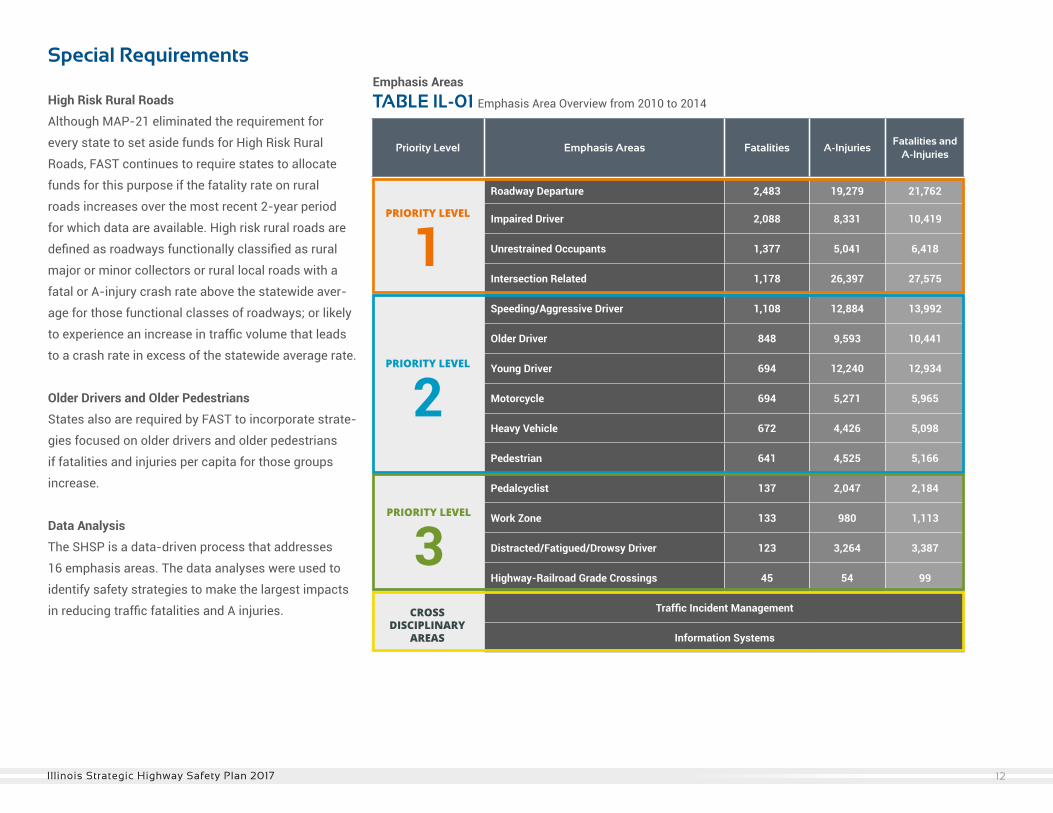
Special Requirements
High Risk Rural Roads
Although MAP-21 eliminated the requirement for
every state to set aside funds for High Risk Rural
Roads, FAST continues to require states to allocate
funds for this purpose if the fatality rate on rural
roads increases over the most recent 2-year period
for which data are available. High risk rural roads are
defined as roadways functionally classified as rural
major or minor collectors or rural local roads with a
fatal or A-injury crash rate above the statewide aver-
age for those functional classes of roadways; or likely
to experience an increase in traffic volume that leads
to a crash rate in excess of the statewide average rate.
Older Drivers and Older Pedestrians
States also are required by FAST to incorporate strate-
gies focused on older drivers and older pedestrians
if fatalities and injuries per capita for those groups
increase.
Data Analysis
The SHSP is a data-driven process that addresses
16 emphasis areas. The data analyses were used to
identify safety strategies to make the largest impacts
in reducing traffic fatalities and A injuries.
Priority Level Emphasis Areas Fatalities A-InjuriesFatalities and
A-Injuries
Roadway Departure 2,483 19,279 21,762
Impaired Driver 2,088 8,331 10,419
Unrestrained Occupants 1,377 5,041 6,418
Intersection Related 1,178 26,397 27,575
Speeding/Aggressive Driver 1,108 12,884 13,992
Older Driver 848 9,593 10,441
Young Driver 694 12,240 12,934
Motorcycle 694 5,271 5,965
Heavy Vehicle 672 4,426 5,098
Pedestrian 641 4,525 5,166
Pedalcyclist 137 2,047 2,184
Work Zone 133 980 1,113
Distracted/Fatigued/Drowsy Driver 123 3,264 3,387
Highway-Railroad Grade Crossings 45 54 99
Traffic Incident Management
Information Systems
3PRIORITY LEVEL
2PRIORITY LEVEL
1PRIORITY LEVEL
CROSS DISCIPLINARY
AREAS
TABLE IL-01 Emphasis Area Overview from 2010 to 2014
Emphasis Areas
12Illinois Strategic Highway Safety Plan 2017
3PRIORITY LEVEL
2PRIORITYLEVEL
1PRIORITYLEVEL
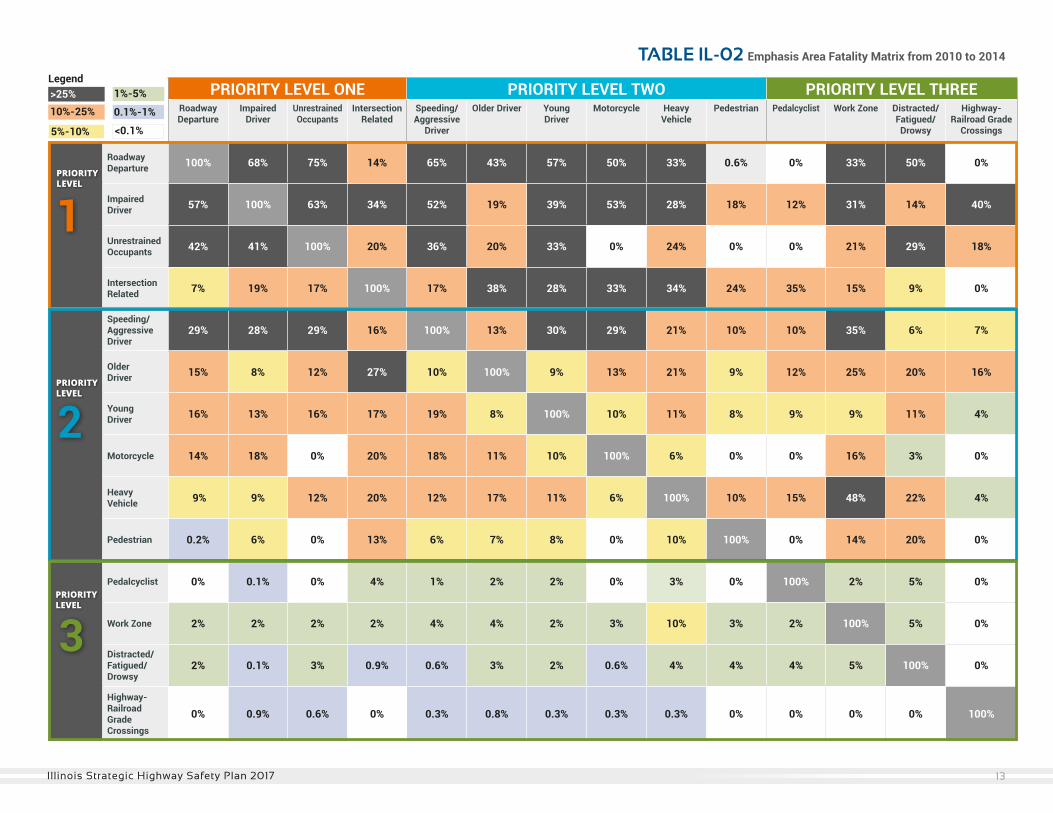
TABLE IL-02 Emphasis Area Fatality Matrix from 2010 to 2014
PRIORITY LEVEL ONE PRIORITY LEVEL TWO PRIORITY LEVEL THREERoadway Departure
Impaired Driver
Unrestrained Occupants
Intersection Related
Speeding/ Aggressive
Driver
Older Driver Young Driver
Motorcycle Heavy Vehicle
Pedestrian Pedalcyclist Work Zone Distracted/ Fatigued/ Drowsy
Highway-Railroad Grade
Crossings
Roadway Departure 100% 68% 75% 14% 65% 43% 57% 50% 33% 0.6% 0% 33% 50% 0%
Impaired Driver 57% 100% 63% 34% 52% 19% 39% 53% 28% 18% 12% 31% 14% 40%
Unrestrained Occupants 42% 41% 100% 20% 36% 20% 33% 0% 24% 0% 0% 21% 29% 18%
Intersection Related 7% 19% 17% 100% 17% 38% 28% 33% 34% 24% 35% 15% 9% 0%
Speeding/ Aggressive Driver
29% 28% 29% 16% 100% 13% 30% 29% 21% 10% 10% 35% 6% 7%
Older Driver 15% 8% 12% 27% 10% 100% 9% 13% 21% 9% 12% 25% 20% 16%
Young Driver 16% 13% 16% 17% 19% 8% 100% 10% 11% 8% 9% 9% 11% 4%
Motorcycle 14% 18% 0% 20% 18% 11% 10% 100% 6% 0% 0% 16% 3% 0%
Heavy Vehicle 9% 9% 12% 20% 12% 17% 11% 6% 100% 10% 15% 48% 22% 4%
Pedestrian 0.2% 6% 0% 13% 6% 7% 8% 0% 10% 100% 0% 14% 20% 0%
Pedalcyclist 0% 0.1% 0% 4% 1% 2% 2% 0% 3% 0% 100% 2% 5% 0%
Work Zone 2% 2% 2% 2% 4% 4% 2% 3% 10% 3% 2% 100% 5% 0%
Distracted/ Fatigued/ Drowsy
2% 0.1% 3% 0.9% 0.6% 3% 2% 0.6% 4% 4% 4% 5% 100% 0%
Highway-Railroad Grade Crossings
0% 0.9% 0.6% 0% 0.3% 0.8% 0.3% 0.3% 0.3% 0% 0% 0% 0% 100%
>25%10%-25%
5%-10%
1%-5%
0.1%-1%
<0.1%
Legend
3PRIORITY LEVEL
2PRIORITYLEVEL
1PRIORITYLEVEL
13Illinois Strategic Highway Safety Plan 2017
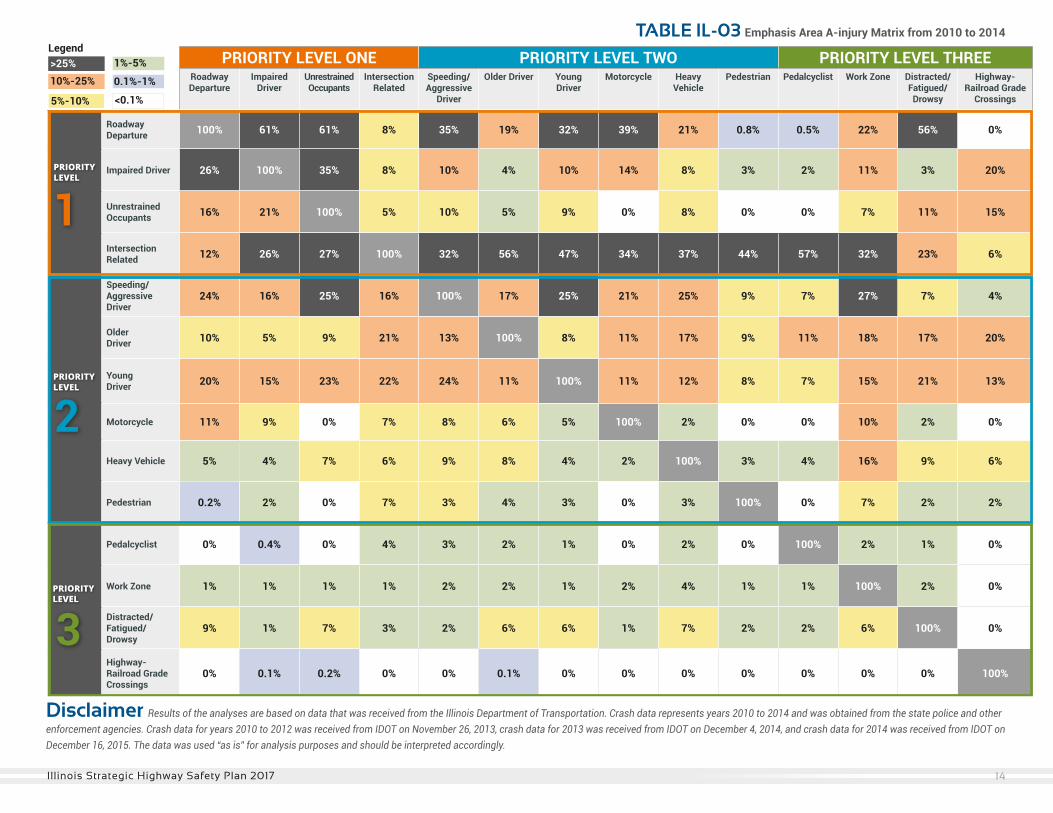
TABLE IL-03 Emphasis Area A-injury Matrix from 2010 to 2014
PRIORITY LEVEL ONE PRIORITY LEVEL TWO PRIORITY LEVEL THREERoadway Departure
Impaired Driver
Unrestrained Occupants
Intersection Related
Speeding/ Aggressive
Driver
Older Driver Young Driver
Motorcycle Heavy Vehicle
Pedestrian Pedalcyclist Work Zone Distracted/ Fatigued/ Drowsy
Highway-Railroad Grade
Crossings
Roadway Departure 100% 61% 61% 8% 35% 19% 32% 39% 21% 0.8% 0.5% 22% 56% 0%
Impaired Driver 26% 100% 35% 8% 10% 4% 10% 14% 8% 3% 2% 11% 3% 20%
Unrestrained Occupants 16% 21% 100% 5% 10% 5% 9% 0% 8% 0% 0% 7% 11% 15%
Intersection Related 12% 26% 27% 100% 32% 56% 47% 34% 37% 44% 57% 32% 23% 6%
Speeding/Aggressive Driver
24% 16% 25% 16% 100% 17% 25% 21% 25% 9% 7% 27% 7% 4%
Older Driver 10% 5% 9% 21% 13% 100% 8% 11% 17% 9% 11% 18% 17% 20%
Young Driver 20% 15% 23% 22% 24% 11% 100% 11% 12% 8% 7% 15% 21% 13%
Motorcycle 11% 9% 0% 7% 8% 6% 5% 100% 2% 0% 0% 10% 2% 0%
Heavy Vehicle 5% 4% 7% 6% 9% 8% 4% 2% 100% 3% 4% 16% 9% 6%
Pedestrian 0.2% 2% 0% 7% 3% 4% 3% 0% 3% 100% 0% 7% 2% 2%
Pedalcyclist 0% 0.4% 0% 4% 3% 2% 1% 0% 2% 0% 100% 2% 1% 0%
Work Zone 1% 1% 1% 1% 2% 2% 1% 2% 4% 1% 1% 100% 2% 0%
Distracted/ Fatigued/ Drowsy
9% 1% 7% 3% 2% 6% 6% 1% 7% 2% 2% 6% 100% 0%
Highway-Railroad Grade Crossings
0% 0.1% 0.2% 0% 0% 0.1% 0% 0% 0% 0% 0% 0% 0% 100%
3PRIORITY LEVEL
2PRIORITYLEVEL
1PRIORITYLEVEL
>25%10%-25%
5%-10%
1%-5%
0.1%-1%
<0.1%
Legend
Disclaimer Results of the analyses are based on data that was received from the Illinois Department of Transportation. Crash data represents years 2010 to 2014 and was obtained from the state police and other enforcement agencies. Crash data for years 2010 to 2012 was received from IDOT on November 26, 2013, crash data for 2013 was received from IDOT on December 4, 2014, and crash data for 2014 was received from IDOT on December 16, 2015. The data was used “as is” for analysis purposes and should be interpreted accordingly.
14Illinois Strategic Highway Safety Plan 2017
PRIORITY LEVEL ONE PRIORITY LEVEL TWO PRIORITY LEVEL THREERoadway Departure
Impaired Driver
Unrestrained Occupants
Intersection Related
Speeding/ Aggressive
Driver
Older Driver Young Driver
Motorcycle Heavy Vehicle
Pedestrian Pedalcyclist Work Zone Distracted/ Fatigued/ Drowsy
Highway-Railroad Grade
Crossings
Roadway Departure 100% 68% 75% 14% 65% 43% 57% 50% 33% 0.6% 0% 33% 50% 0%
Impaired Driver 57% 100% 63% 34% 52% 19% 39% 53% 28% 18% 12% 31% 14% 40%
Unrestrained Occupants 42% 41% 100% 20% 36% 20% 33% 0% 24% 0% 0% 21% 29% 18%
Intersection Related 7% 19% 17% 100% 17% 38% 28% 33% 34% 24% 35% 15% 9% 0%
Speeding/ Aggressive Driver
29% 28% 29% 16% 100% 13% 30% 29% 21% 10% 10% 35% 6% 7%
Older Driver 15% 8% 12% 27% 10% 100% 9% 13% 21% 9% 12% 25% 20% 16%
Young Driver 16% 13% 16% 17% 19% 8% 100% 10% 11% 8% 9% 9% 11% 4%
Motorcycle 14% 18% 0% 20% 18% 11% 10% 100% 6% 0% 0% 16% 3% 0%
Heavy Vehicle 9% 9% 12% 20% 12% 17% 11% 6% 100% 10% 15% 48% 22% 4%
Pedestrian 0.2% 6% 0% 13% 6% 7% 8% 0% 10% 100% 0% 14% 20% 0%
Pedalcyclist 0% 0.1% 0% 4% 1% 2% 2% 0% 3% 0% 100% 2% 5% 0%
Work Zone 2% 2% 2% 2% 4% 4% 2% 3% 10% 3% 2% 100% 5% 0%
Distracted/ Fatigued/ Drowsy
2% 0.1% 3% 0.9% 0.6% 3% 2% 0.6% 4% 4% 4% 5% 100% 0%
Highway-Railroad Grade Crossings
0% 0.9% 0.6% 0% 0.3% 0.8% 0.3% 0.3% 0.3% 0% 0% 0% 0% 100%
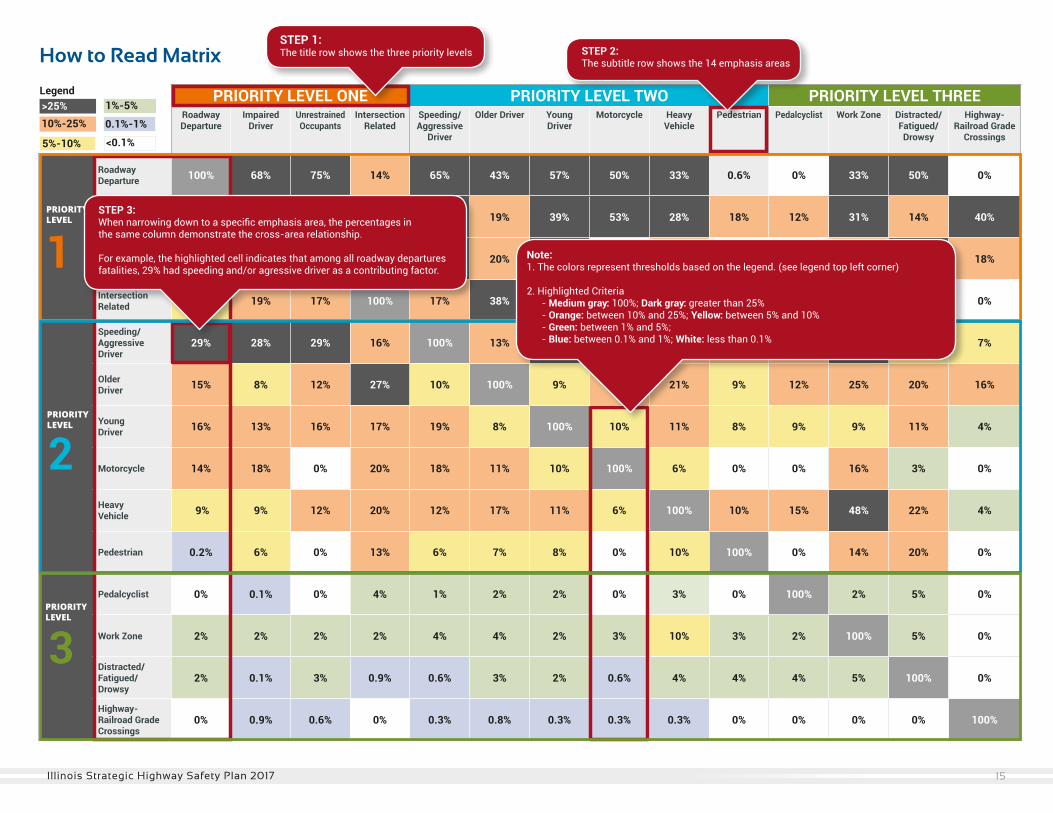
How to Read Matrix
3PRIORITY LEVEL
2PRIORITYLEVEL
1PRIORITYLEVEL
STEP 1: The title row shows the three priority levels STEP 2:
The subtitle row shows the 14 emphasis areas
Note:1. The colors represent thresholds based on the legend. (see legend top left corner)
2. Highlighted Criteria - Medium gray: 100%; Dark gray: greater than 25% - Orange: between 10% and 25%; Yellow: between 5% and 10% - Green: between 1% and 5%; - Blue: between 0.1% and 1%; White: less than 0.1%
STEP 3: When narrowing down to a specific emphasis area, the percentages in the same column demonstrate the cross-area relationship.
For example, the highlighted cell indicates that among all roadway departures fatalities, 29% had speeding and/or agressive driver as a contributing factor.
>25%10%-25%
5%-10%
1%-5%
0.1%-1%
<0.1%
Legend
15Illinois Strategic Highway Safety Plan 2017
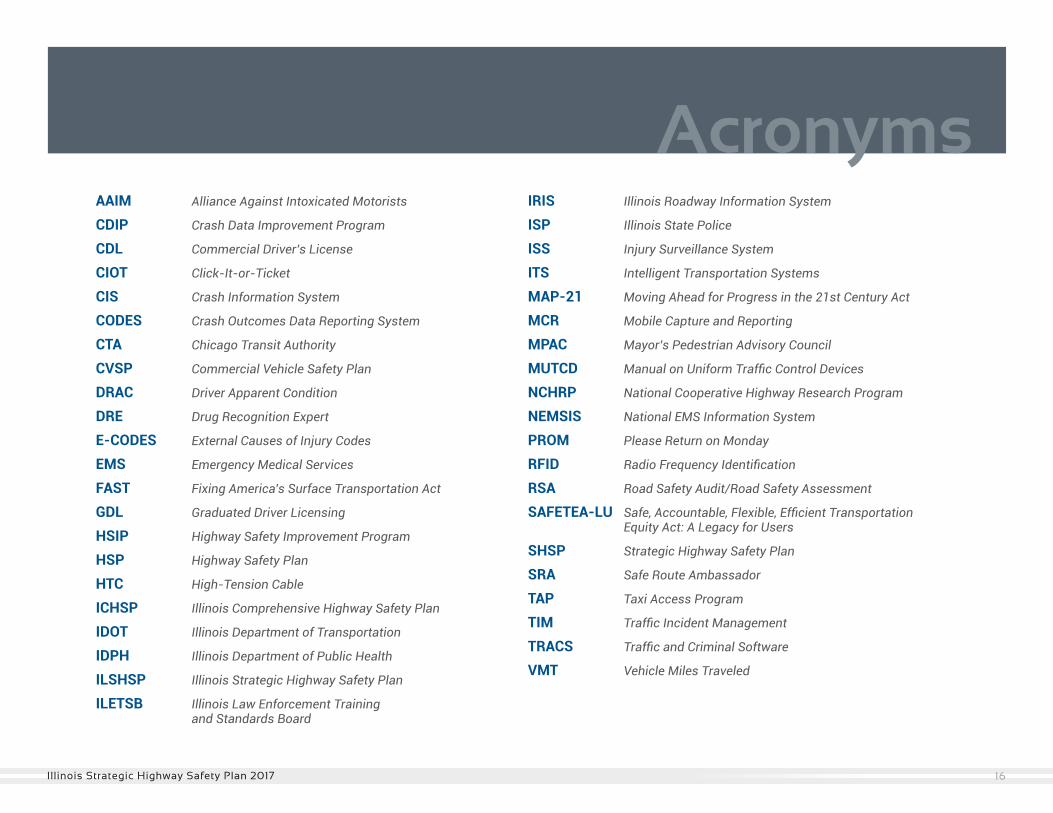
AAIM Alliance Against Intoxicated Motorists
CDIP Crash Data Improvement Program
CDL Commercial Driver’s License
CIOT Click-It-or-Ticket
CIS Crash Information System
CODES Crash Outcomes Data Reporting System
CTA Chicago Transit Authority
CVSP Commercial Vehicle Safety Plan
DRAC Driver Apparent Condition
DRE Drug Recognition Expert
E-CODES External Causes of Injury Codes
EMS Emergency Medical Services
FAST Fixing America’s Surface Transportation Act
GDL Graduated Driver Licensing
HSIP Highway Safety Improvement Program
HSP Highway Safety Plan
HTC High-Tension Cable
ICHSP Illinois Comprehensive Highway Safety Plan
IDOT Illinois Department of Transportation
IDPH Illinois Department of Public Health
ILSHSP Illinois Strategic Highway Safety Plan
ILETSB Illinois Law Enforcement Training and Standards Board
IRIS Illinois Roadway Information System
ISP Illinois State Police
ISS Injury Surveillance System
ITS Intelligent Transportation Systems
MAP-21 Moving Ahead for Progress in the 21st Century Act
MCR Mobile Capture and Reporting
MPAC Mayor’s Pedestrian Advisory Council
MUTCD Manual on Uniform Traffic Control Devices
NCHRP National Cooperative Highway Research Program
NEMSIS National EMS Information System
PROM Please Return on Monday
RFID Radio Frequency Identification
RSA Road Safety Audit/Road Safety Assessment
SAFETEA-LU Safe, Accountable, Flexible, Efficient Transportation Equity Act: A Legacy for Users
SHSP Strategic Highway Safety Plan
SRA Safe Route Ambassador
TAP Taxi Access Program
TIM Traffic Incident Management
TRACS Traffic and Criminal Software
VMT Vehicle Miles Traveled
AcronymsAcronyms
16Illinois Strategic Highway Safety Plan 2017
Roadway Departure
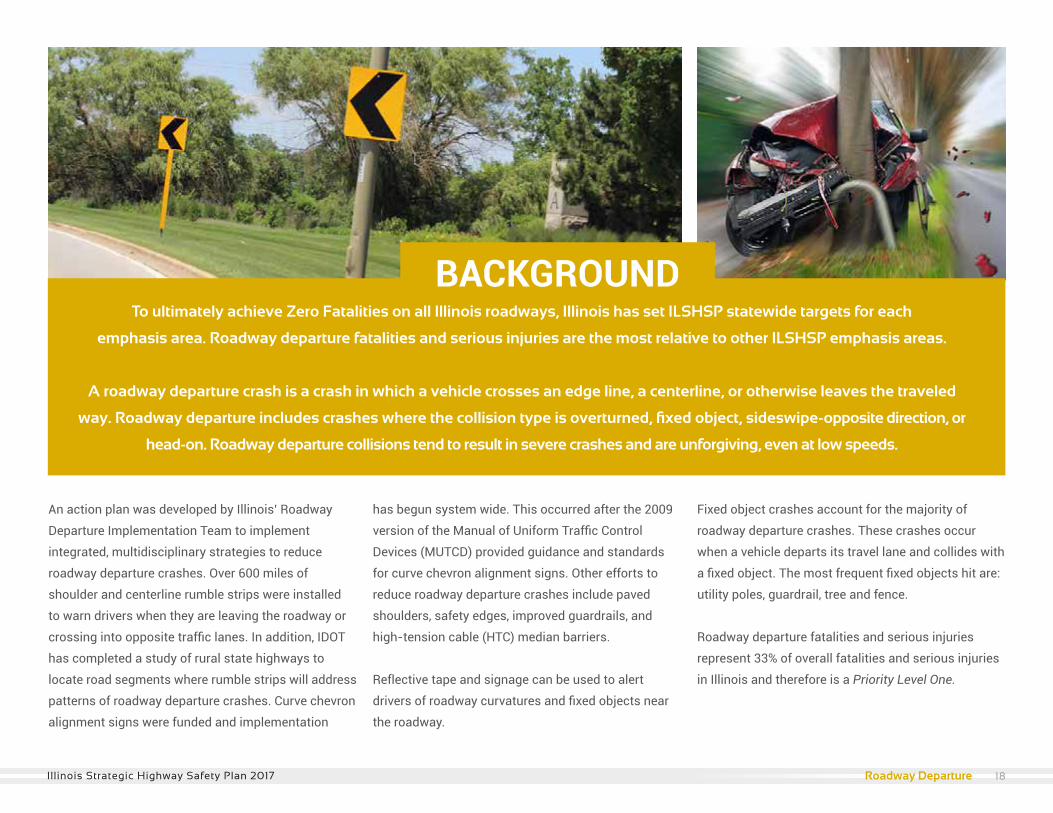
An action plan was developed by Illinois’ Roadway
Departure Implementation Team to implement
integrated, multidisciplinary strategies to reduce
roadway departure crashes. Over 600 miles of
shoulder and centerline rumble strips were installed
to warn drivers when they are leaving the roadway or
crossing into opposite traffic lanes. In addition, IDOT
has completed a study of rural state highways to
locate road segments where rumble strips will address
patterns of roadway departure crashes. Curve chevron
alignment signs were funded and implementation
has begun system wide. This occurred after the 2009
version of the Manual of Uniform Traffic Control
Devices (MUTCD) provided guidance and standards
for curve chevron alignment signs. Other efforts to
reduce roadway departure crashes include paved
shoulders, safety edges, improved guardrails, and
high-tension cable (HTC) median barriers.
Reflective tape and signage can be used to alert
drivers of roadway curvatures and fixed objects near
the roadway.
Fixed object crashes account for the majority of
roadway departure crashes. These crashes occur
when a vehicle departs its travel lane and collides with
a fixed object. The most frequent fixed objects hit are:
utility poles, guardrail, tree and fence.
Roadway departure fatalities and serious injuries
represent 33% of overall fatalities and serious injuries
in Illinois and therefore is a Priority Level One.
To ultimately achieve Zero Fatalities on all Illinois roadways, Illinois has set ILSHSP statewide targets for each
emphasis area. Roadway departure fatalities and serious injuries are the most relative to other ILSHSP emphasis areas.
A roadway departure crash is a crash in which a vehicle crosses an edge line, a centerline, or otherwise leaves the traveled
way. Roadway departure includes crashes where the collision type is overturned, fixed object, sideswipe-opposite direction, or
head-on. Roadway departure collisions tend to result in severe crashes and are unforgiving, even at low speeds.
BACKGROUND
18Illinois Strategic Highway Safety Plan 2017 Roadway Departure
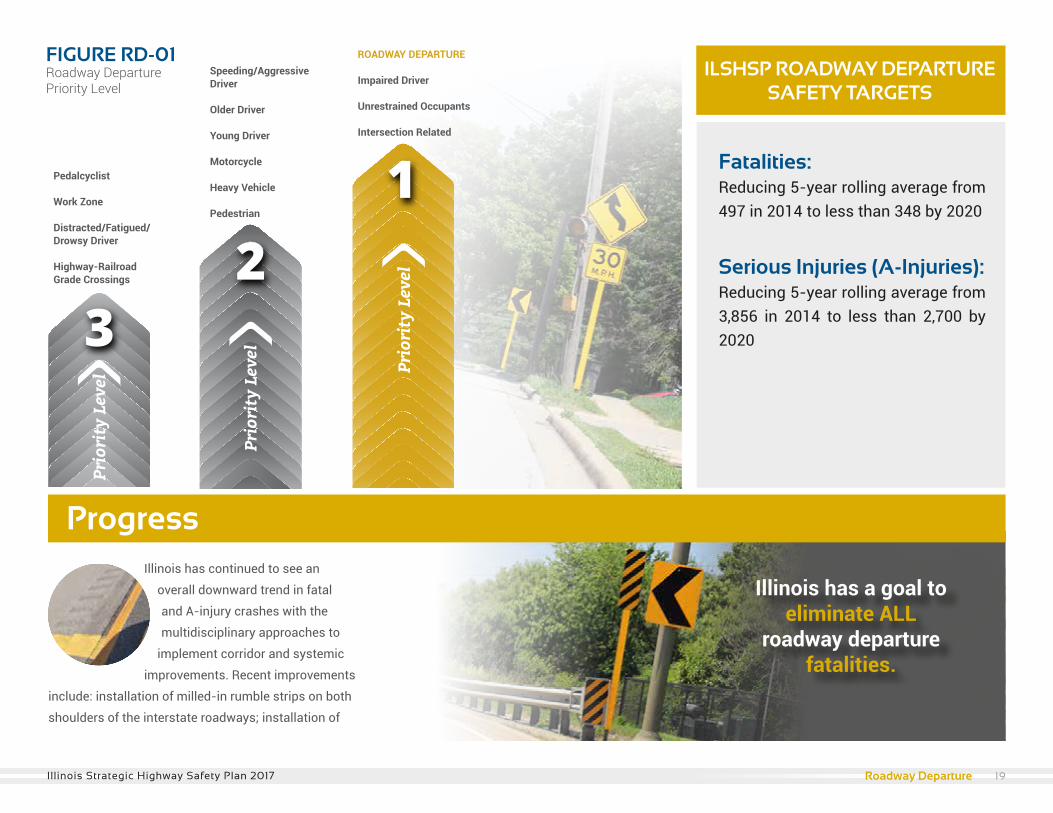
Fatalities: Reducing 5-year rolling average from 497 in 2014 to less than 348 by 2020
Serious Injuries (A-Injuries): Reducing 5-year rolling average from 3,856 in 2014 to less than 2,700 by 2020
Prio
rity
Lev
el
Pedalcyclist
Work Zone
Distracted/Fatigued/Drowsy Driver
Highway-RailroadGrade Crossings
Speeding/Aggressive Driver
Older Driver
Young Driver
Motorcycle
Heavy Vehicle
Pedestrian
ROADWAY DEPARTURE
Impaired Driver
Unrestrained Occupants
Intersection Related
FIGURE RD-01Roadway Departure Priority Level
ProgressIllinois has continued to see an
overall downward trend in fatal
and A-injury crashes with the
multidisciplinary approaches to
implement corridor and systemic
improvements. Recent improvements
include: installation of milled-in rumble strips on both
shoulders of the interstate roadways; installation of
ILSHSP ROADWAY DEPARTURE SAFETY TARGETS
Illinois has a goal to eliminate ALL
roadway departure fatalities.
19Illinois Strategic Highway Safety Plan 2017 Roadway Departure
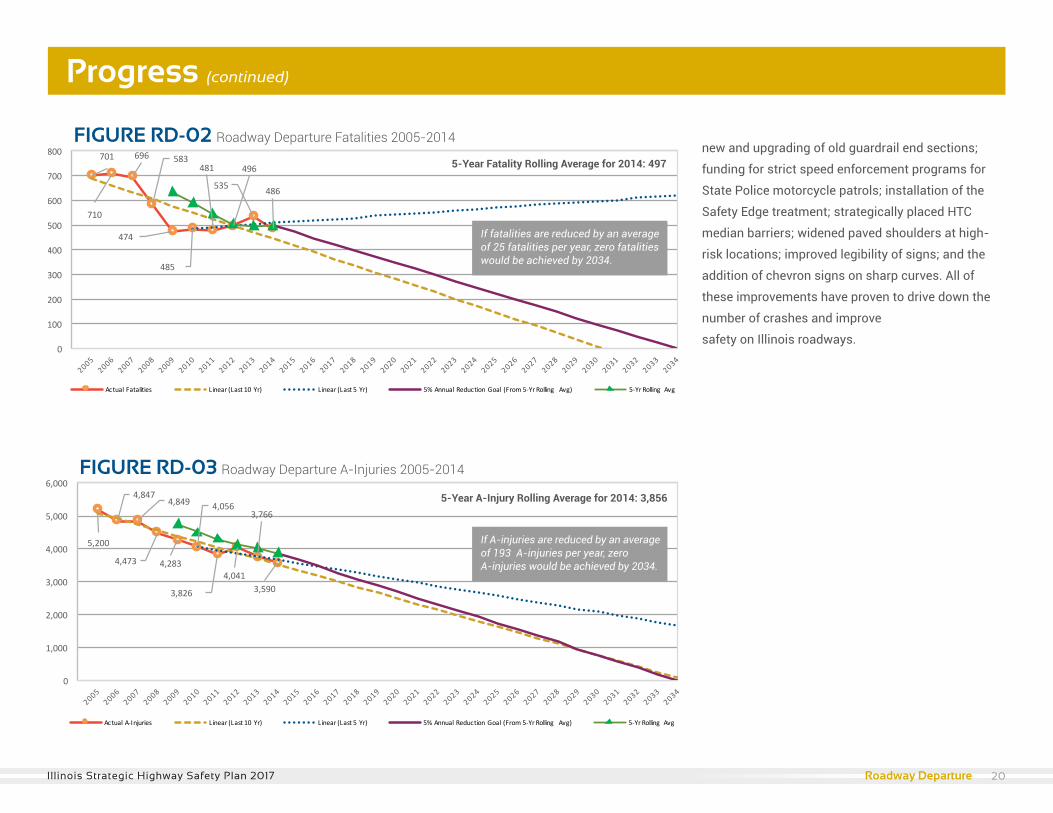
701
710
696 583
474
485
481 496
535 486
0
100
200
300
400
500
600
700
800
ActualFatalities Linear(Last10Yr) Linear(Last5Yr) 5%AnnualReductionGoal (From5-YrRolling Avg) 5-YrRolling Avg
5,200
4,8474,849
4,473 4,283
4,056
3,826
4,041
3,766
3,590
0
1,000
2,000
3,000
4,000
5,000
6,000
ActualA-Injuries Linear(Last10Yr) Linear(Last5Yr) 5%AnnualReductionGoal (From5-YrRolling Avg) 5-YrRolling Avg
Progress (continued)
new and upgrading of old guardrail end sections;
funding for strict speed enforcement programs for
State Police motorcycle patrols; installation of the
Safety Edge treatment; strategically placed HTC
median barriers; widened paved shoulders at high-
risk locations; improved legibility of signs; and the
addition of chevron signs on sharp curves. All of
these improvements have proven to drive down the
number of crashes and improve
safety on Illinois roadways.
FIGURE RD-02 Roadway Departure Fatalities 2005-2014
If fatalities are reduced by an average of 25 fatalities per year, zero fatalities would be achieved by 2034.
FIGURE RD-03 Roadway Departure A-Injuries 2005-2014
If A-injuries are reduced by an average of 193 A-injuries per year, zero A-injuries would be achieved by 2034.
5-Year Fatality Rolling Average for 2014: 497
5-Year A-Injury Rolling Average for 2014: 3,856
20Illinois Strategic Highway Safety Plan 2017 Roadway Departure
A-InjuriesState Roadways Local Roadways
Urban Rural Total Urban Rural Total Total
2010 1,161(29%)
912(22%)
2,073(51%)
739(18%)
1,244(31%)
1,983(49%)
4,056(100%)
2011 856(22%)
797(21%)
1,653(43%)
988(26%)
1,185(31%)
2,173(57%)
3,826(100%)
2012 598(15%)
998(25%)
1,596(39%)
1,057(26%)
1,388(34%)
2,445(61%)
4,041(100%)
2013 430(11%)
1,240(33%)
1,670(44%)
1,012(27%)
1,084(29%)
2,096(56%)
3,766(100%)
2014 362(10%)
1,219(34%)
1,581(44%)
997(28%)
1,012(28%)
2,009(56%)
3,590(100%)
Total 3,407(18%)
5,166(27%)
8,573(44%)
4,793(25%)
5,913(31%)
10,706(56%)
19,279(100%)
FatalitiesState Roadways Local Roadways
Urban Rural Total Urban Rural Total Total
2010 116(24%)
125(26%)
241(50%)
99(20%)
145(30%)
244(50%)
485(100%)
2011 81(17%)
128(27%)
209(43%)
114(24%)
158(33%)
272(57%)
481(100%)
2012 91(18%)
121(24%)
212(43%)
120(24%)
164(33%)
284(57%)
496(100%)
2013 45(8%)
200(37%)
245(46%)
128(24%)
162(30%)
290(54%)
535(100%)
2014 40(8%)
199(41%)
239(49%)
123(25%)
124(26%)
247(51%)
486(100%)
Total 373(15%)
773(31%)
1,146(46%)
584(24%)
753(30%)
1,337(54%)
2,483(100%)
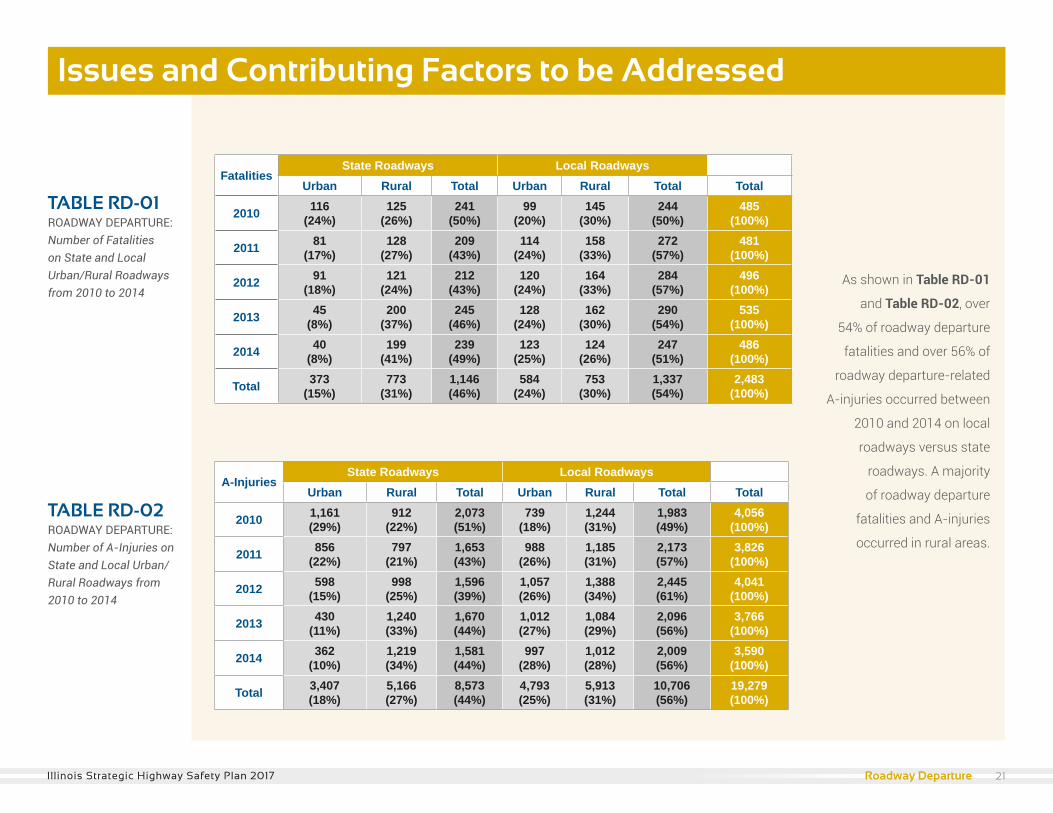
TABLE RD-01 ROADWAY DEPARTURE: Number of Fatalities on State and Local Urban/Rural Roadways from 2010 to 2014
TABLE RD-02 ROADWAY DEPARTURE: Number of A-Injuries on State and Local Urban/Rural Roadways from 2010 to 2014
As shown in Table RD-01
and Table RD-02, over
54% of roadway departure
fatalities and over 56% of
roadway departure-related
A-injuries occurred between
2010 and 2014 on local
roadways versus state
roadways. A majority
of roadway departure
fatalities and A-injuries
occurred in rural areas.
Issues and Contributing Factors to be Addressed
Work Zone 21Illinois Strategic Highway Safety Plan 2017 Roadway Departure
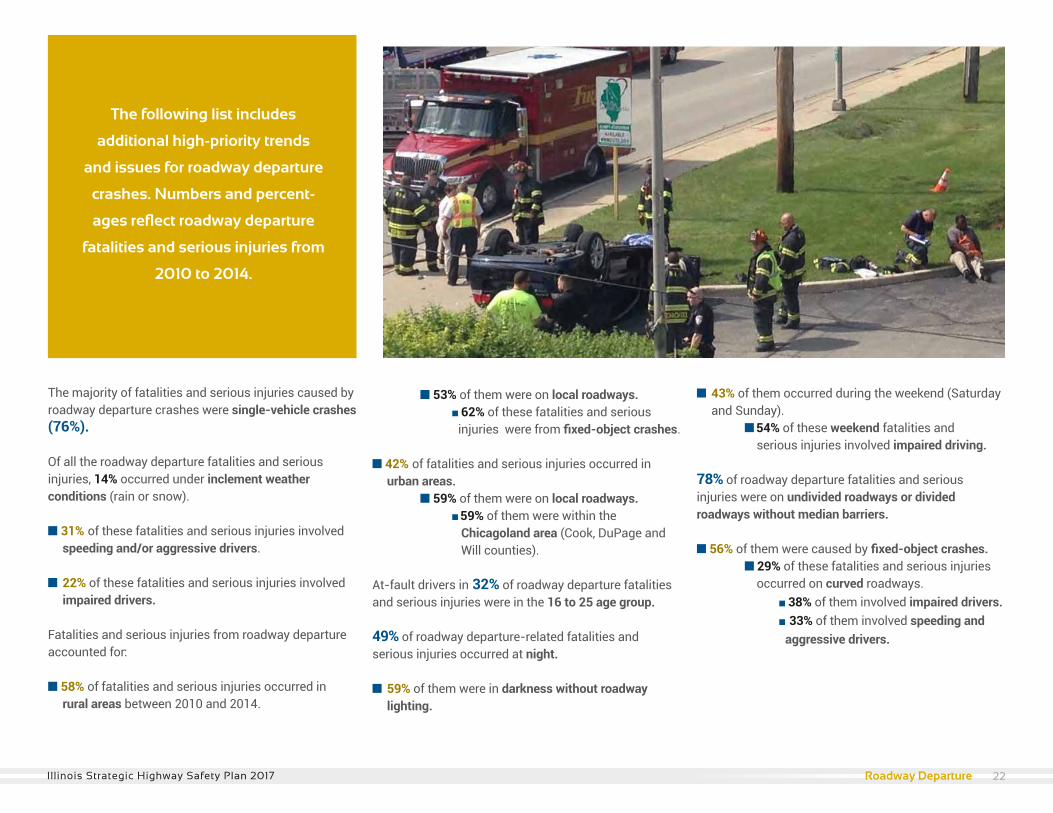
The majority of fatalities and serious injuries caused by roadway departure crashes were single-vehicle crashes (76%).
Of all the roadway departure fatalities and serious injuries, 14% occurred under inclement weather conditions (rain or snow).
n 31% of these fatalities and serious injuries involved speeding and/or aggressive drivers.
n 22% of these fatalities and serious injuries involved impaired drivers.
Fatalities and serious injuries from roadway departure accounted for:
n 58% of fatalities and serious injuries occurred in rural areas between 2010 and 2014.
n 53% of them were on local roadways. n 62% of these fatalities and serious injuries were from fixed-object crashes.
n 42% of fatalities and serious injuries occurred in urban areas. n 59% of them were on local roadways. n 59% of them were within the Chicagoland area (Cook, DuPage and Will counties).
At-fault drivers in 32% of roadway departure fatalities and serious injuries were in the 16 to 25 age group. to 201349% of roadway departure-related fatalities and serious injuries occurred at night.
n 59% of them were in darkness without roadway lighting.
n 43% of them occurred during the weekend (Saturday and Sunday). n 54% of these weekend fatalities and serious injuries involved impaired driving.
78% of roadway departure fatalities and serious injuries were on undivided roadways or divided roadways without median barriers.
n 56% of them were caused by fixed-object crashes. n 29% of these fatalities and serious injuries occurred on curved roadways. n 38% of them involved impaired drivers. n 33% of them involved speeding and aggressive drivers.
The following list includes
additional high-priority trends
and issues for roadway departure
crashes. Numbers and percent-
ages reflect roadway departure
fatalities and serious injuries from
2010 to 2014.
22Illinois Strategic Highway Safety Plan 2017 Roadway Departure
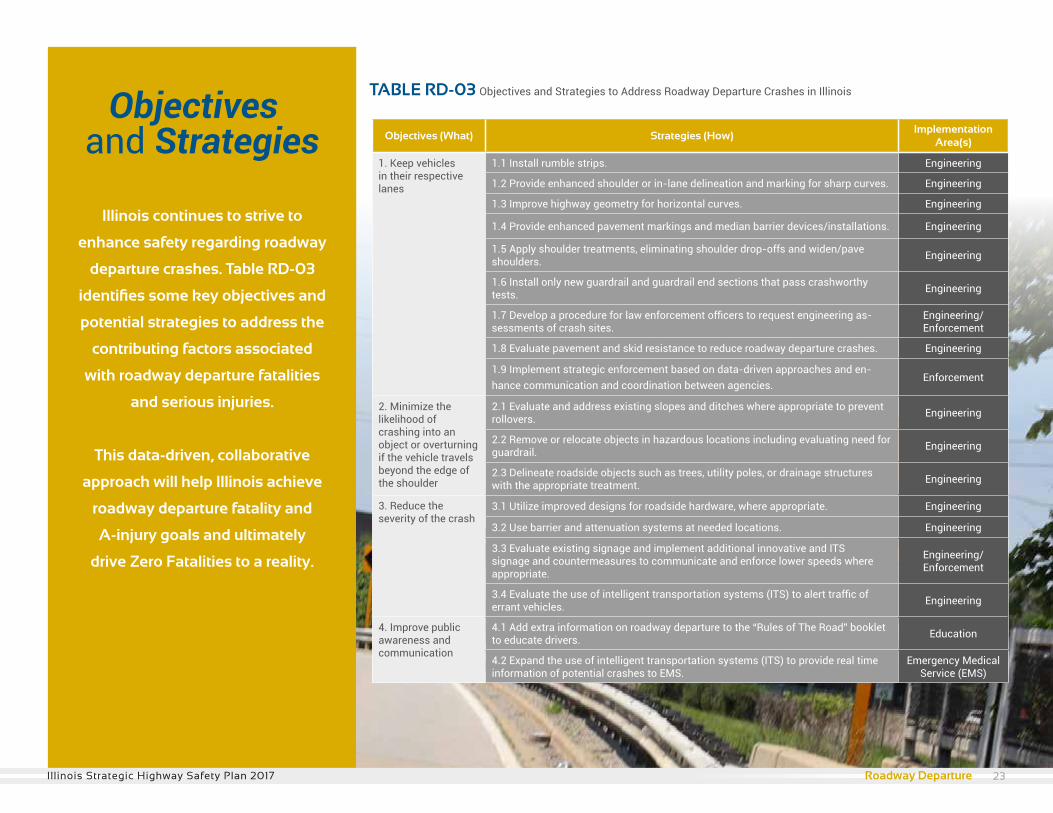
TABLE RD-03 Objectives and Strategies to Address Roadway Departure Crashes in Illinois
Objectives (What) Strategies (How)Implementation
Area(s)
1. Keep vehicles in their respective lanes
1.1 Install rumble strips. Engineering
1.2 Provide enhanced shoulder or in-lane delineation and marking for sharp curves. Engineering
1.3 Improve highway geometry for horizontal curves. Engineering
1.4 Provide enhanced pavement markings and median barrier devices/installations. Engineering
1.5 Apply shoulder treatments, eliminating shoulder drop-offs and widen/pave shoulders. Engineering
1.6 Install only new guardrail and guardrail end sections that pass crashworthy tests. Engineering
1.7 Develop a procedure for law enforcement officers to request engineering as-sessments of crash sites.
Engineering/Enforcement
1.8 Evaluate pavement and skid resistance to reduce roadway departure crashes. Engineering
1.9 Implement strategic enforcement based on data-driven approaches and en-hance communication and coordination between agencies.
Enforcement
2. Minimize the likelihood of crashing into an object or overturning if the vehicle travels beyond the edge of the shoulder
2.1 Evaluate and address existing slopes and ditches where appropriate to prevent rollovers. Engineering
2.2 Remove or relocate objects in hazardous locations including evaluating need for guardrail. Engineering
2.3 Delineate roadside objects such as trees, utility poles, or drainage structures with the appropriate treatment. Engineering
3. Reduce the severity of the crash
3.1 Utilize improved designs for roadside hardware, where appropriate. Engineering
3.2 Use barrier and attenuation systems at needed locations. Engineering
3.3 Evaluate existing signage and implement additional innovative and ITS signage and countermeasures to communicate and enforce lower speeds where appropriate.
Engineering/ Enforcement
3.4 Evaluate the use of intelligent transportation systems (ITS) to alert traffic of errant vehicles. Engineering
4. Improve public awareness and communication
4.1 Add extra information on roadway departure to the “Rules of The Road” booklet to educate drivers. Education
4.2 Expand the use of intelligent transportation systems (ITS) to provide real time information of potential crashes to EMS.
Emergency Medical Service (EMS)
Illinois continues to strive to
enhance safety regarding roadway
departure crashes. Table RD-03
identifies some key objectives and
potential strategies to address the
contributing factors associated
with roadway departure fatalities
and serious injuries.
This data-driven, collaborative
approach will help Illinois achieve
roadway departure fatality and
A-injury goals and ultimately
drive Zero Fatalities to a reality.
Objectivesand Strategies
23Illinois Strategic Highway Safety Plan 2017 Roadway Departure
Impaired Driver
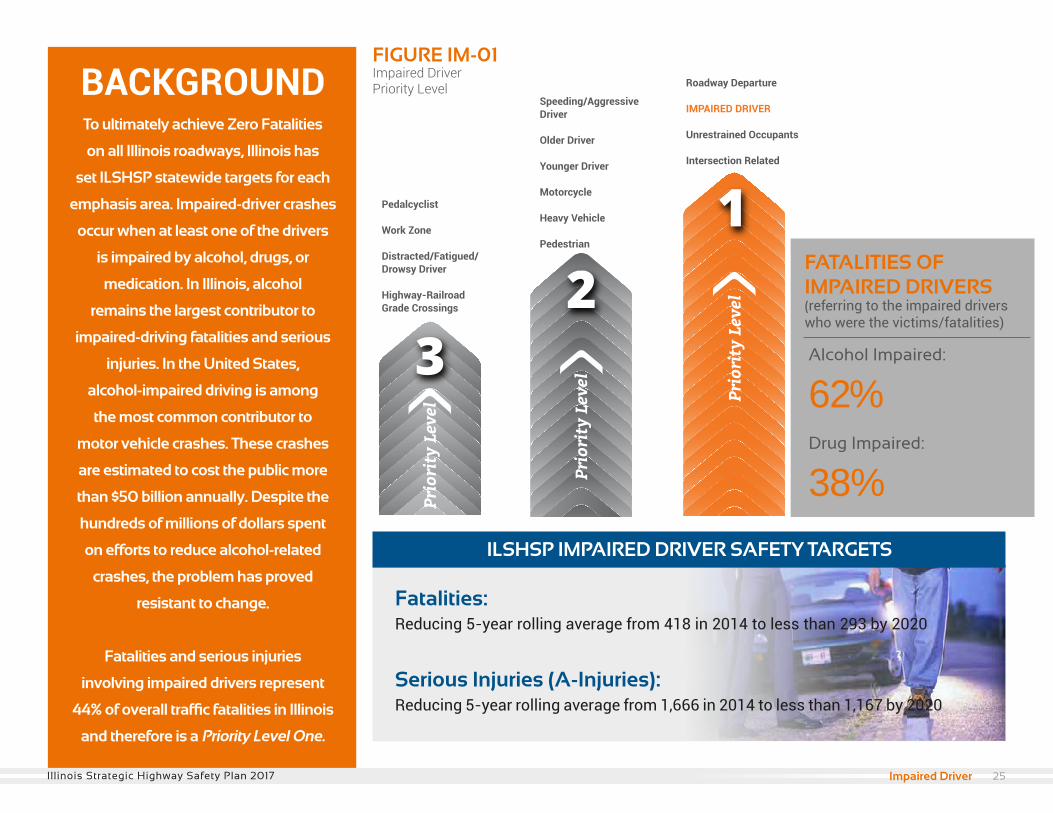
To ultimately achieve Zero Fatalities
on all Illinois roadways, Illinois has
set ILSHSP statewide targets for each
emphasis area. Impaired-driver crashes
occur when at least one of the drivers
is impaired by alcohol, drugs, or
medication. In Illinois, alcohol
remains the largest contributor to
impaired-driving fatalities and serious
injuries. In the United States,
alcohol-impaired driving is among
the most common contributor to
motor vehicle crashes. These crashes
are estimated to cost the public more
than $50 billion annually. Despite the
hundreds of millions of dollars spent
on efforts to reduce alcohol-related
crashes, the problem has proved
resistant to change.
Fatalities and serious injuries
involving impaired drivers represent
44% of overall traffic fatalities in Illinois
and therefore is a Priority Level One.
BACKGROUND
Prio
rity
Lev
el
Pedalcyclist
Work Zone
Distracted/Fatigued/Drowsy Driver
Highway-Railroad Grade Crossings
Speeding/Aggressive Driver
Older Driver
Younger Driver
Motorcycle
Heavy Vehicle
Pedestrian
Roadway Departure
IMPAIRED DRIVER
Unrestrained Occupants
Intersection Related
FIGURE IM-01Impaired Driver Priority Level
Fatalities: Reducing 5-year rolling average from 418 in 2014 to less than 293 by 2020
Serious Injuries (A-Injuries): Reducing 5-year rolling average from 1,666 in 2014 to less than 1,167 by 2020
ILSHSP IMPAIRED DRIVER SAFETY TARGETS
FATALITIES OF IMPAIRED DRIVERS (referring to the impaired drivers who were the victims/fatalities)
Alcohol Impaired:
62%Drug Impaired:
38%
25Illinois Strategic Highway Safety Plan 2017 Impaired Driver
450
440
547 483
412
394
402 462
455375
0
100
200
300
400
500
600
ActualFatalities Linear(Last10Yr) Linear(Last5Yr) 5%AnnualReductionGoal (From5-YrRolling Avg) 5-YrRolling Avg
2,364
2,303 2,196
1,9351,979
1,736
1,653 1,934
1,569
1,439
0
500
1,000
1,500
2,000
2,500
ActualA-Injuries Linear(Last10Yr) Linear(Last5Yr) 5%AnnualReductionGoal (From5-YrRolling Avg) 5-YrRolling Avg
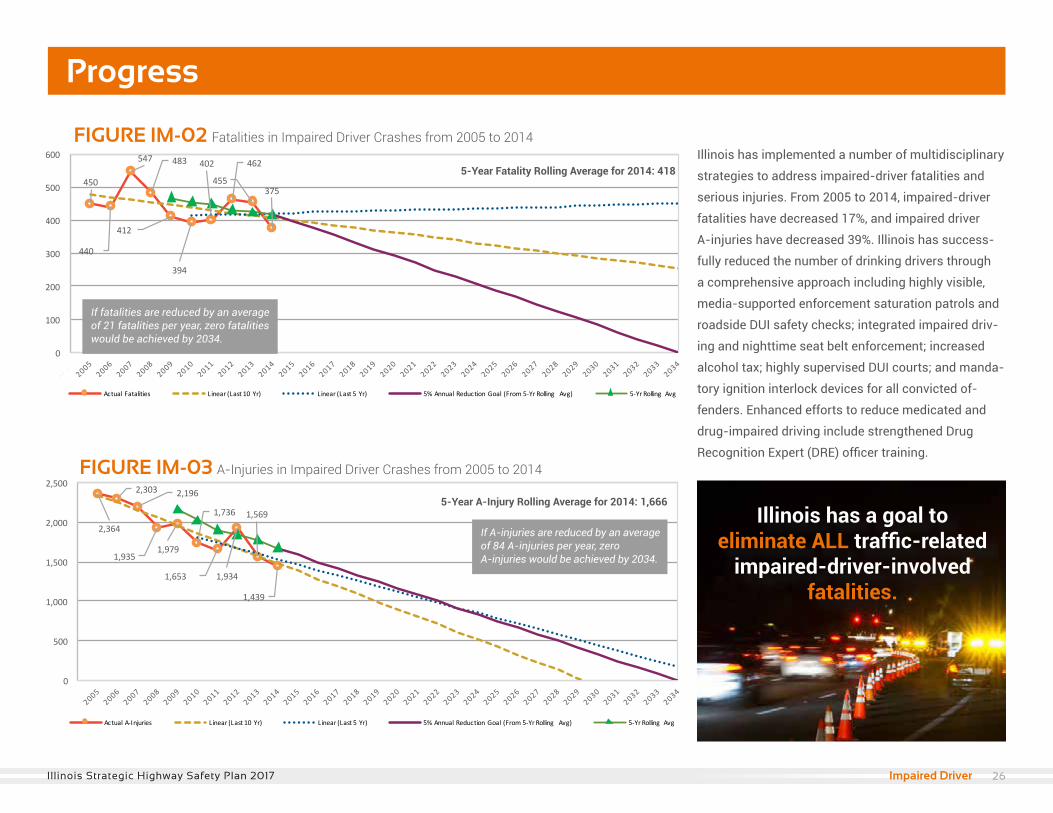
Progress
FIGURE IM-02 Fatalities in Impaired Driver Crashes from 2005 to 2014
450
440
547 483
412
394
402 462
455375
0
100
200
300
400
500
600
ActualFatalities Linear(Last10Yr) Linear(Last5Yr) 5%AnnualReductionGoal (From5-YrRolling Avg) 5-YrRolling Avg
2,364
2,303 2,196
1,9351,979
1,736
1,653 1,934
1,569
1,439
0
500
1,000
1,500
2,000
2,500
ActualA-Injuries Linear(Last10Yr) Linear(Last5Yr) 5%AnnualReductionGoal (From5-YrRolling Avg) 5-YrRolling Avg
If fatalities are reduced by an average of 21 fatalities per year, zero fatalities would be achieved by 2034.
FIGURE IM-03 A-Injuries in Impaired Driver Crashes from 2005 to 2014
If A-injuries are reduced by an average of 84 A-injuries per year, zero A-injuries would be achieved by 2034.
5-Year Fatality Rolling Average for 2014: 418
5-Year A-Injury Rolling Average for 2014: 1,666
Illinois has implemented a number of multidisciplinary
strategies to address impaired-driver fatalities and
serious injuries. From 2005 to 2014, impaired-driver
fatalities have decreased 17%, and impaired driver
A-injuries have decreased 39%. Illinois has success-
fully reduced the number of drinking drivers through
a comprehensive approach including highly visible,
media-supported enforcement saturation patrols and
roadside DUI safety checks; integrated impaired driv-
ing and nighttime seat belt enforcement; increased
alcohol tax; highly supervised DUI courts; and manda-
tory ignition interlock devices for all convicted of-
fenders. Enhanced efforts to reduce medicated and
drug-impaired driving include strengthened Drug
Recognition Expert (DRE) officer training.
Illinois has a goal to eliminate ALL traffic-related
impaired-driver-involvedfatalities.
26Illinois Strategic Highway Safety Plan 2017 Impaired Driver
FatalitiesState Roadways Local Roadways
Urban Rural Total Urban Rural Total Total
2010 116(29%)
72(18%)
188(48%)
93(24%)
113(29%)
206(52%)
394(100%)
2011 99(25%)
78(19%)
177(44%)
109(27%)
116(29%)
225(56%)
402(100%)
2012 116(25%)
88(19%)
204(44%)
122(26%)
136(29%)
258(56%)
462(100%)
2013 54(12%)
154(34%)
208(46%)
141(31%)
106(23%)
247(54%)
455(100%)
2014 57(15%)
121(32%)
178(47%)
110(29%)
87(23%)
197(53%)
375(100%)
Total 442(21%)
513(25%)
955(46%)
575(28%)
558(27%)
1,133(54%)
2,088(100%)
A-InjuriesState Roadways Local Roadways
Urban Rural Total Urban Rural Total Total
2010 667(38%)
278(16%)
945(54%)
377(22%)
414(24%)
791(46%)
1,736(100%)
2011 434(26%)
257(16%)
691(42%)
541(33%)
421(25%)
962(58%)
1,653(100%)
2012 398(21%)
391(20%)
789(41%)
602(31%)
543(28%)
1,145(59%)
1,934(100%)
2013 297(19%)
445(28%)
742(47%)
467(30%)
360(23%)
827(53%)
1,569(100%)
2014 246(17%)
406(28%)
652(45%)
464(32%)
323(22%)
787(55%)
1,439(100%)
Total 2,042(25%)
1,777(21%)
3,819(46%)
2,451(29%)
2,061(25%)
4,512(54%)
8,331(100%)
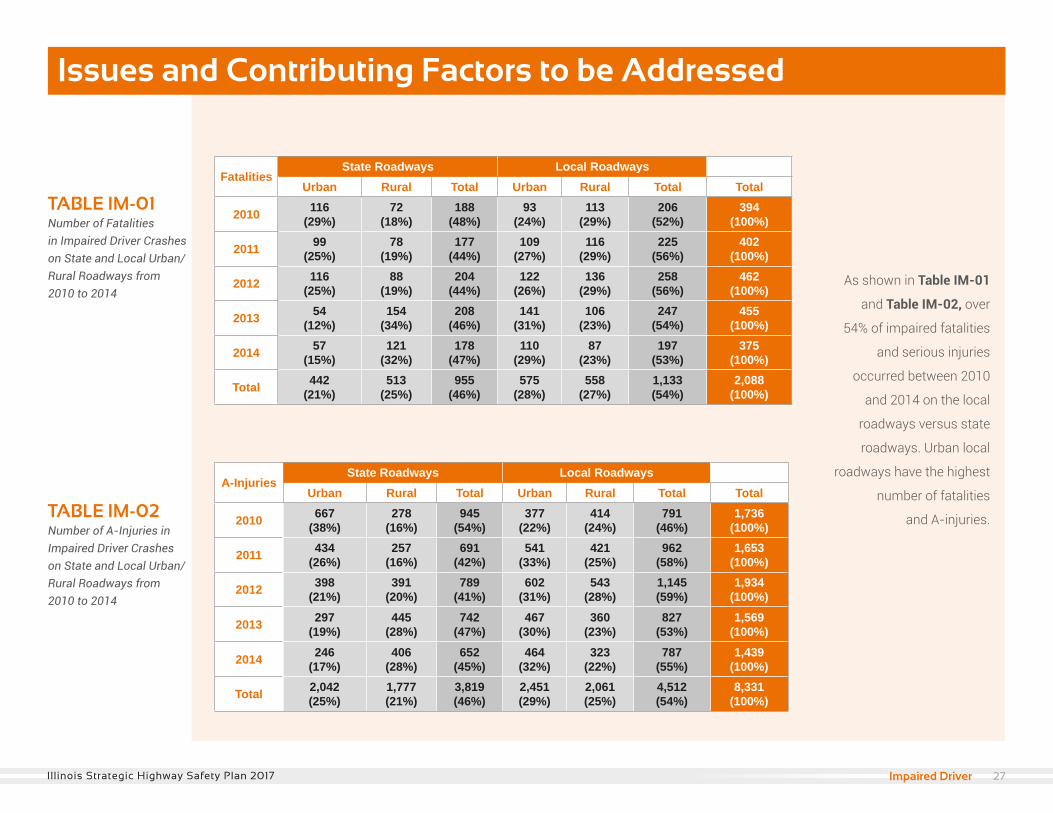
TABLE IM-01 Number of Fatalities in Impaired Driver Crashes on State and Local Urban/Rural Roadways from2010 to 2014
TABLE IM-02 Number of A-Injuries in Impaired Driver Crashes on State and Local Urban/Rural Roadways from 2010 to 2014
As shown in Table IM-01
and Table IM-02, over
54% of impaired fatalities
and serious injuries
occurred between 2010
and 2014 on the local
roadways versus state
roadways. Urban local
roadways have the highest
number of fatalities
and A-injuries.
Issues and Contributing Factors to be Addressed
27Illinois Strategic Highway Safety Plan 2017 Impaired Driver
The Chicagoland area (Cook, DuPage, and Will counties) experienced 33% of the impaired-driver-involved fatalities and serious injuries:
n 48% resulted from roadway departure crashes.
n 19% involved speeding or aggressive driving.
n 22% involved unrestrained occupants.
Of all the impaired-driver-related fatalities and serious injuries, 48% occurred over the weekend.
63% of the impaired-driver-involved fatalities and serious injuries occurred between the hours of 8 p.m. and 5 a.m.:
n 24% occurred between Friday 8 p.m. and Saturday 5 a.m.
n 28% occurred between Saturday 8 p.m. and Sunday 5 a.m.
n 11% occurred between Sunday 8 p.m. and Monday 5 a.m.
A majority of the impaired-driver-involved fatalities and serious injuries occurred in urban areas (53%), and 71% of these occurred on arterials. n Among those on arterials, 39% were on local roadways. n 49% of those on local roadways were roadway departure and 37% were intersection related. n Among those roadway departures, 66% were fixed-object collisions.
n Among those in urban areas, 14% were on interstates and freeways.
In rural areas, 64% of the impaired-driver-involved fatalities and serious injuries occurred on arterials. 23% occurred on local roadways.
n Among these fatalities and serious injuries on rural arterials n 78% were roadway departure n 54% of those were fixed-object collisions and 32% were unrestrained occupants.
n 28% involved unrestrained occupants.
n 16% involved speeding and/or aggressive drivers. n Among those on rural on local roadways n 85% were roadway departure n 70% of those were fixed-object collisions and 38% were unrestrained occupants.
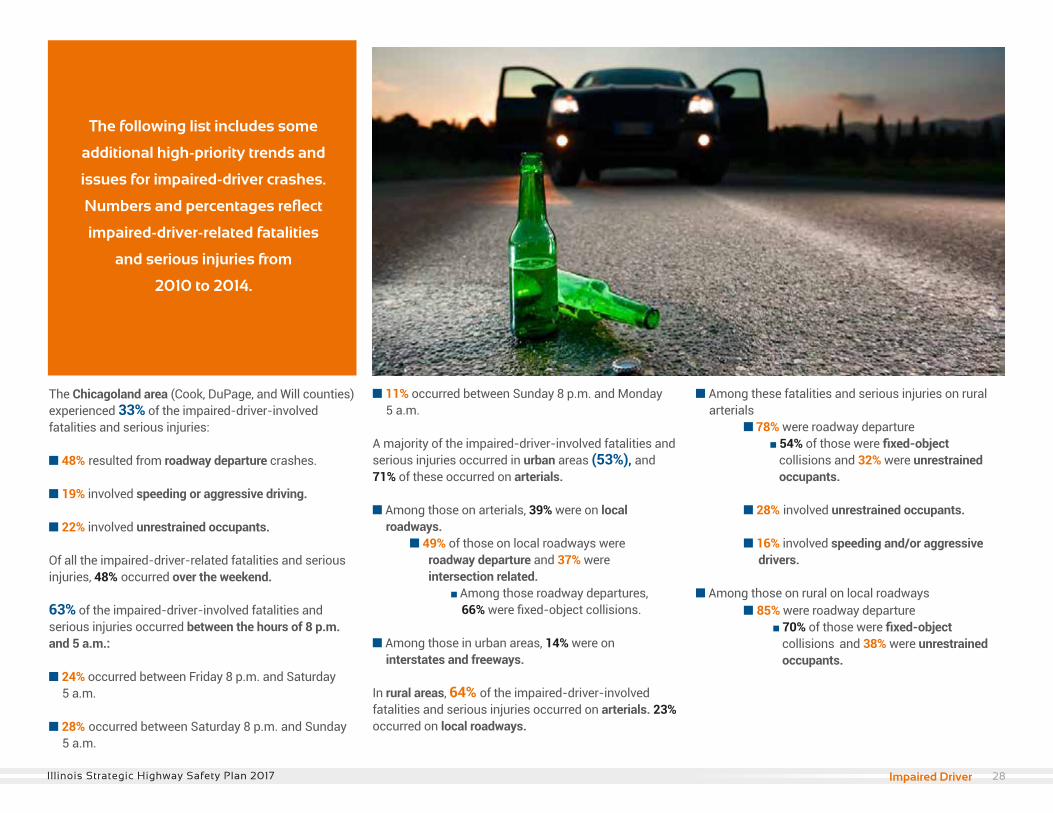
The following list includes some
additional high-priority trends and
issues for impaired-driver crashes.
Numbers and percentages reflect
impaired-driver-related fatalities
and serious injuries from
2010 to 2014.
28Illinois Strategic Highway Safety Plan 2017 Impaired Driver
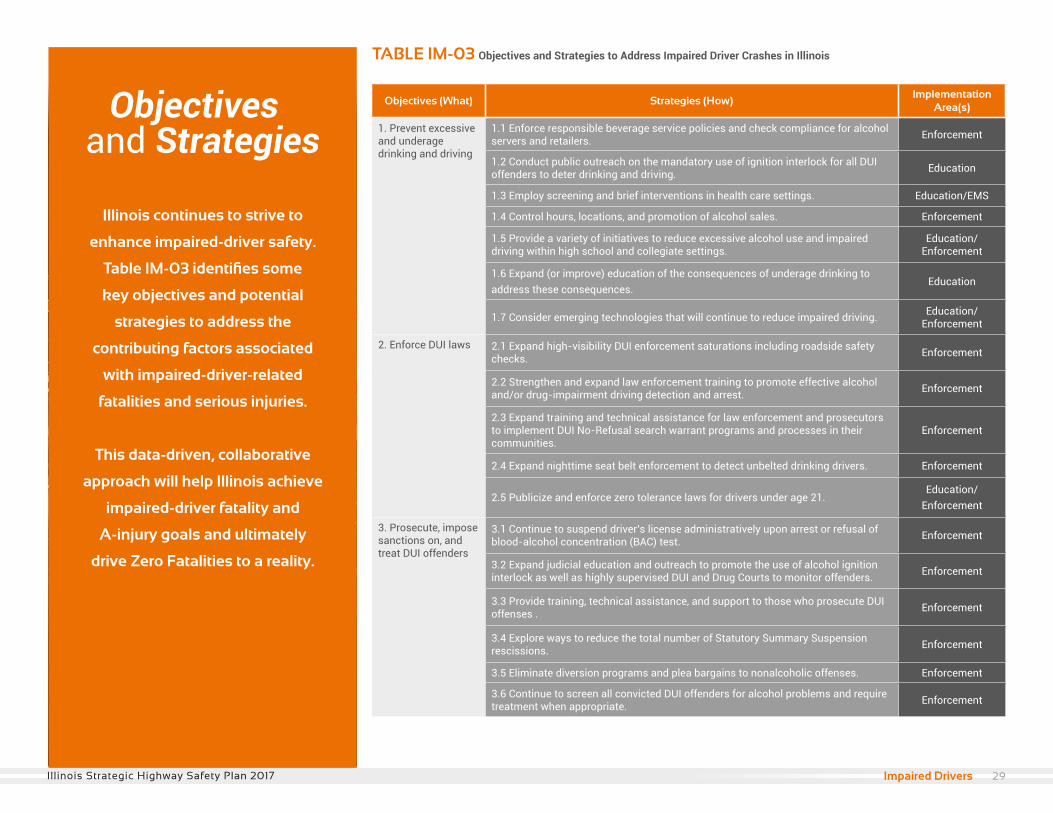
Objectives (What) Strategies (How)Implementation
Area(s)
1. Prevent excessive and underage drinking and driving
1.1 Enforce responsible beverage service policies and check compliance for alcohol servers and retailers. Enforcement
1.2 Conduct public outreach on the mandatory use of ignition interlock for all DUI offenders to deter drinking and driving. Education
1.3 Employ screening and brief interventions in health care settings. Education/EMS
1.4 Control hours, locations, and promotion of alcohol sales. Enforcement
1.5 Provide a variety of initiatives to reduce excessive alcohol use and impaired driving within high school and collegiate settings.
Education/ Enforcement
1.6 Expand (or improve) education of the consequences of underage drinking to address these consequences.
Education
1.7 Consider emerging technologies that will continue to reduce impaired driving. Education/Enforcement
2. Enforce DUI laws 2.1 Expand high-visibility DUI enforcement saturations including roadside safety checks. Enforcement
2.2 Strengthen and expand law enforcement training to promote effective alcohol and/or drug-impairment driving detection and arrest. Enforcement
2.3 Expand training and technical assistance for law enforcement and prosecutors to implement DUI No-Refusal search warrant programs and processes in their communities.
Enforcement
2.4 Expand nighttime seat belt enforcement to detect unbelted drinking drivers. Enforcement
2.5 Publicize and enforce zero tolerance laws for drivers under age 21.Education/
Enforcement
3. Prosecute, impose sanctions on, and treat DUI offenders
3.1 Continue to suspend driver’s license administratively upon arrest or refusal of blood-alcohol concentration (BAC) test. Enforcement
3.2 Expand judicial education and outreach to promote the use of alcohol ignition interlock as well as highly supervised DUI and Drug Courts to monitor offenders. Enforcement
3.3 Provide training, technical assistance, and support to those who prosecute DUI offenses . Enforcement
3.4 Explore ways to reduce the total number of Statutory Summary Suspension rescissions. Enforcement
3.5 Eliminate diversion programs and plea bargains to nonalcoholic offenses. Enforcement
3.6 Continue to screen all convicted DUI offenders for alcohol problems and require treatment when appropriate. Enforcement
TABLE IM-03 Objectives and Strategies to Address Impaired Driver Crashes in Illinois
Illinois continues to strive to
enhance impaired-driver safety.
Table IM-03 identifies some
key objectives and potential
strategies to address the
contributing factors associated
with impaired-driver-related
fatalities and serious injuries.
This data-driven, collaborative
approach will help Illinois achieve
impaired-driver fatality and
A-injury goals and ultimately
drive Zero Fatalities to a reality.
Objectivesand Strategies
29Illinois Strategic Highway Safety Plan 2017 Impaired Drivers
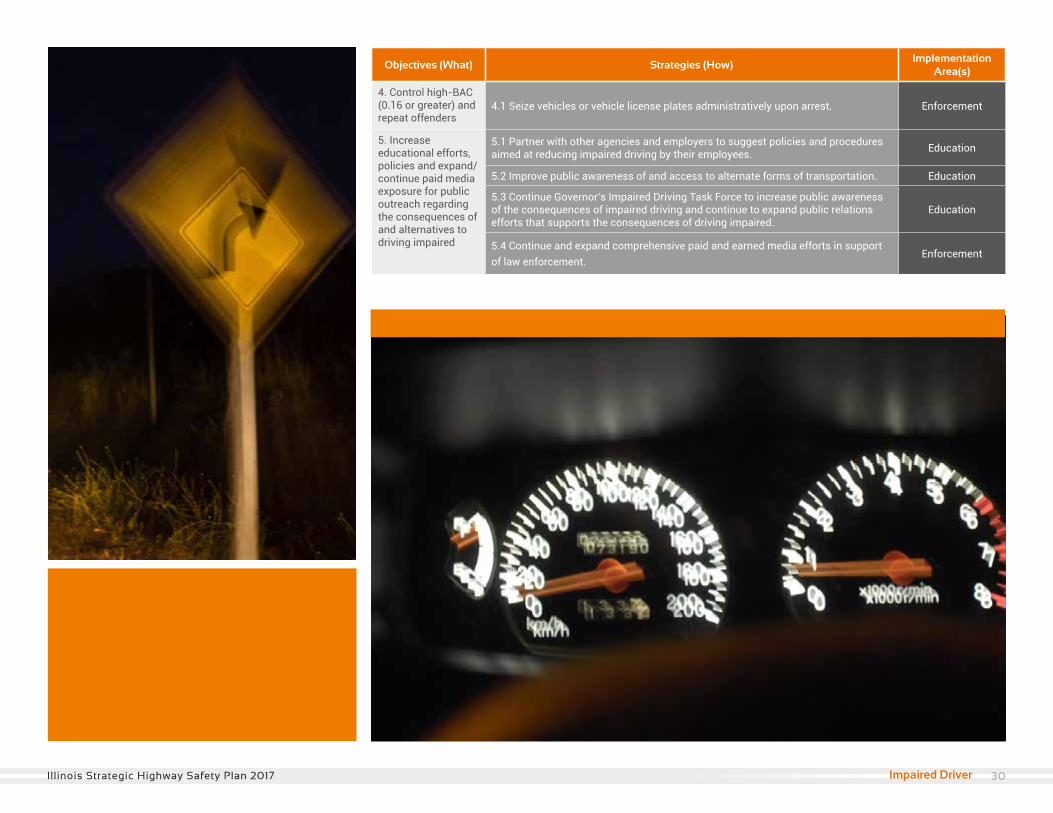
Objectives (What) Strategies (How)Implementation
Area(s)
4. Control high-BAC (0.16 or greater) and repeat offenders
4.1 Seize vehicles or vehicle license plates administratively upon arrest. Enforcement
5. Increase educational efforts, policies and expand/continue paid media exposure for public outreach regarding the consequences of and alternatives to driving impaired
5.1 Partner with other agencies and employers to suggest policies and procedures aimed at reducing impaired driving by their employees. Education
5.2 Improve public awareness of and access to alternate forms of transportation. Education
5.3 Continue Governor’s Impaired Driving Task Force to increase public awareness of the consequences of impaired driving and continue to expand public relations efforts that supports the consequences of driving impaired.
Education
5.4 Continue and expand comprehensive paid and earned media efforts in support of law enforcement.
Enforcement
30Illinois Strategic Highway Safety Plan 2017 Impaired Driver
Unrestrained Occupants
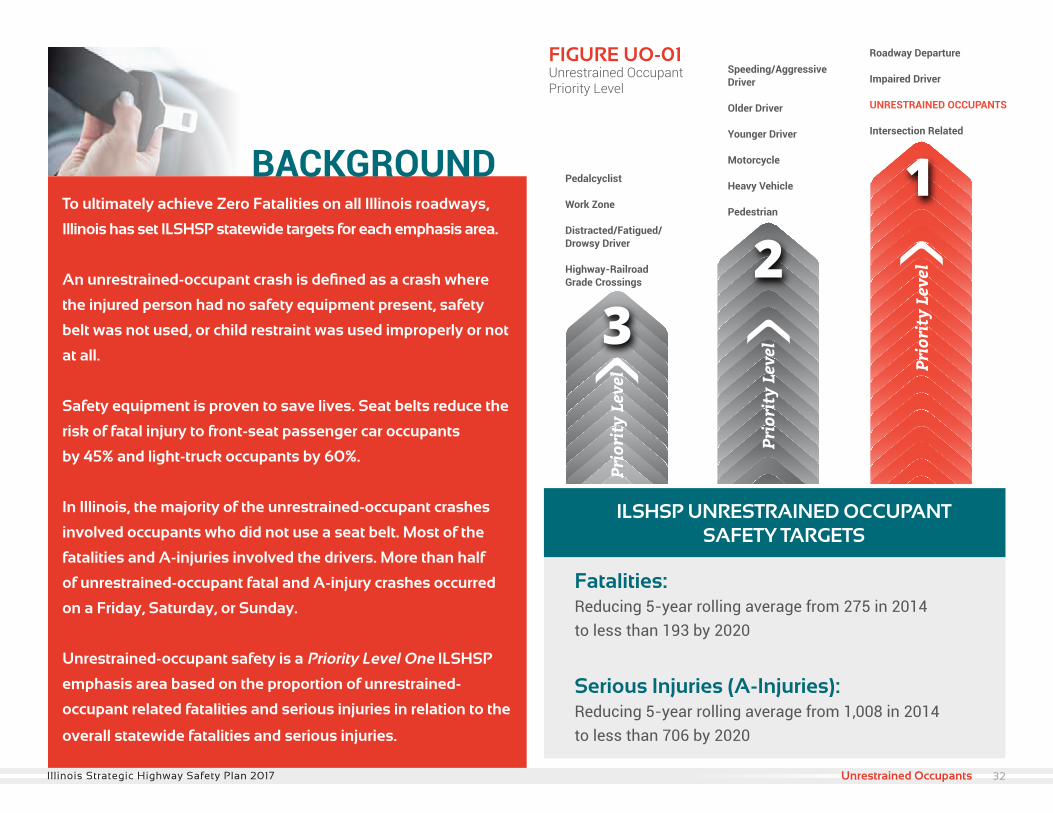
To ultimately achieve Zero Fatalities on all Illinois roadways,
Illinois has set ILSHSP statewide targets for each emphasis area.
An unrestrained-occupant crash is defined as a crash where
the injured person had no safety equipment present, safety
belt was not used, or child restraint was used improperly or not
at all.
Safety equipment is proven to save lives. Seat belts reduce the
risk of fatal injury to front-seat passenger car occupants
by 45% and light-truck occupants by 60%.
In Illinois, the majority of the unrestrained-occupant crashes
involved occupants who did not use a seat belt. Most of the
fatalities and A-injuries involved the drivers. More than half
of unrestrained-occupant fatal and A-injury crashes occurred
on a Friday, Saturday, or Sunday.
Unrestrained-occupant safety is a Priority Level One ILSHSP
emphasis area based on the proportion of unrestrained-
occupant related fatalities and serious injuries in relation to the
overall statewide fatalities and serious injuries.
Pedalcyclist
Work Zone
Distracted/Fatigued/Drowsy Driver
Highway-Railroad Grade Crossings
Speeding/Aggressive Driver
Older Driver
Younger Driver
Motorcycle
Heavy Vehicle
Pedestrian
Roadway Departure
Impaired Driver
UNRESTRAINED OCCUPANTS
Intersection Related
FIGURE UO-01Unrestrained OccupantPriority Level
Fatalities: Reducing 5-year rolling average from 275 in 2014 to less than 193 by 2020
Serious Injuries (A-Injuries): Reducing 5-year rolling average from 1,008 in 2014 to less than 706 by 2020
ILSHSP UNRESTRAINED OCCUPANT SAFETY TARGETS
BACKGROUND
32Illinois Strategic Highway Safety Plan 2017 Unrestrained Occupants
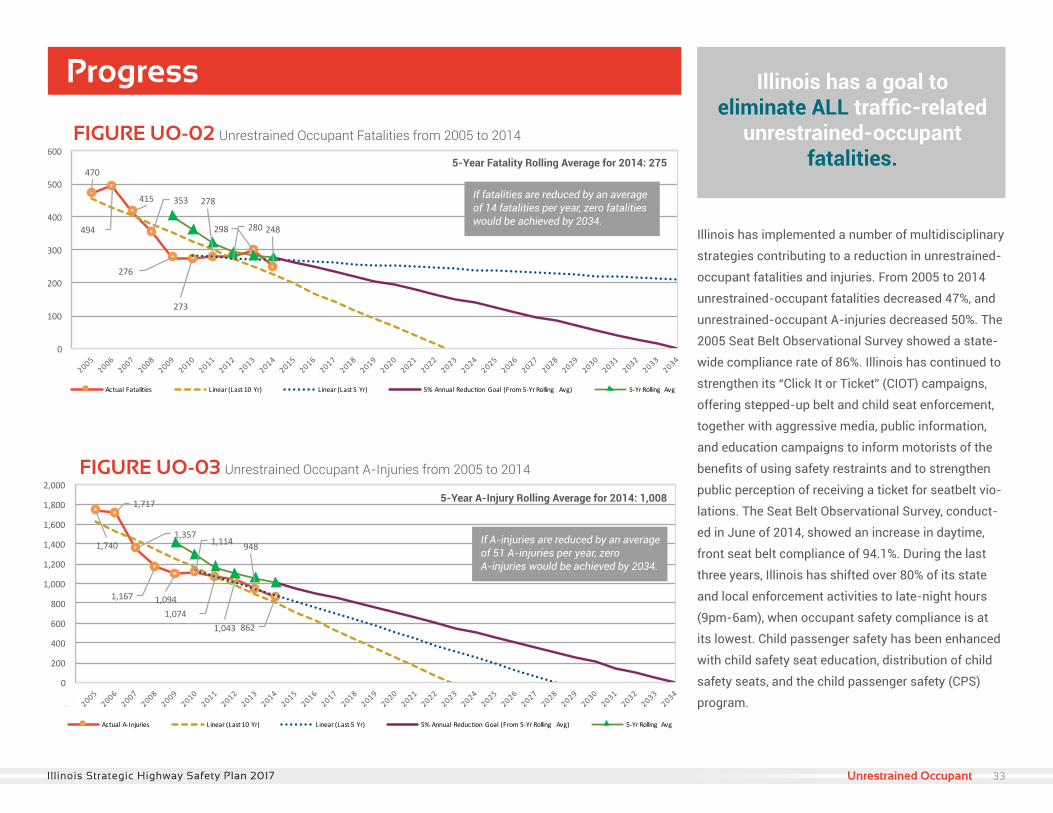
Progress
FIGURE UO-02 Unrestrained Occupant Fatalities from 2005 to 2014
470
494
415 353
276
273
278
280298 248
0
100
200
300
400
500
600
ActualFatalities Linear(Last10Yr) Linear(Last5Yr) 5%AnnualReductionGoal (From5-YrRolling Avg) 5-YrRolling Avg
1,740
1,717
1,357
1,167 1,094
1,114
1,0741,043
948
862
0
200
400
600
800
1,000
1,200
1,400
1,600
1,800
2,000
ActualA-Injuries Linear(Last10Yr) Linear(Last5Yr) 5%AnnualReductionGoal (From5-YrRolling Avg) 5-YrRolling Avg
If fatalities are reduced by an average of 14 fatalities per year, Zero Fatalities would be achieved by 2034.
FIGURE UO-03 Unrestrained Occupant A-Injuries from 2005 to 2014
If A-injuries are reduced by an average of 51 A-injuries per year, zero A-injuries would be achieved by 2034.
5-Year Fatality Rolling Average for 2014: 275
5-Year A-Injury Rolling Average for 2014: 1,008
Illinois has implemented a number of multidisciplinary
strategies contributing to a reduction in unrestrained-
occupant fatalities and injuries. From 2005 to 2014
unrestrained-occupant fatalities decreased 47%, and
unrestrained-occupant A-injuries decreased 50%. The
2005 Seat Belt Observational Survey showed a state-
wide compliance rate of 86%. Illinois has continued to
strengthen its “Click It or Ticket” (CIOT) campaigns,
offering stepped-up belt and child seat enforcement,
together with aggressive media, public information,
and education campaigns to inform motorists of the
benefits of using safety restraints and to strengthen
public perception of receiving a ticket for seatbelt vio-
lations. The Seat Belt Observational Survey, conduct-
ed in June of 2014, showed an increase in daytime,
front seat belt compliance of 94.1%. During the last
three years, Illinois has shifted over 80% of its state
and local enforcement activities to late-night hours
(9pm-6am), when occupant safety compliance is at
its lowest. Child passenger safety has been enhanced
with child safety seat education, distribution of child
safety seats, and the child passenger safety (CPS)
program.
Illinois has a goal to eliminate ALL traffic-related
unrestrained-occupant fatalities.
470
494
415 353
276
273
278
280298 248
0
100
200
300
400
500
600
ActualFatalities Linear(Last10Yr) Linear(Last5Yr) 5%AnnualReductionGoal (From5-YrRolling Avg) 5-YrRolling Avg
1,740
1,717
1,357
1,167 1,094
1,114
1,0741,043
948
862
0
200
400
600
800
1,000
1,200
1,400
1,600
1,800
2,000
ActualA-Injuries Linear(Last10Yr) Linear(Last5Yr) 5%AnnualReductionGoal (From5-YrRolling Avg) 5-YrRolling Avg
If fatalities are reduced by an averageof 14 fatalities per year, zero fatalitieswould be achieved by 2034.
5-Year Fatality Rolling Average for 2014: 275
33Illinois Strategic Highway Safety Plan 2017 Unrestrained Occupant
FatalitiesState Roadways Local Roadways
Urban Rural Total Urban Rural Total Total
2010 68(25%)
70(26%)
138(51%)
48(18%)
87(32%)
135(49%)
273(100%)
2011 55(20%)
59(21%)
114(41%)
69(25%)
95(34%)
164(59%)
278(100%)
2012 62(22%)
70(25%)
132(47%)
59(21%)
89(32%)
148(53%)
280(100%)
2013 27(9%)
115(39%)
142(48%)
66(22%)
90(30%)
156(52%)
298(100%)
2014 35(14%)
90(36%)
125(50%)
54(22%)
69(28%)
123(50%)
248(100%)
Total 247(18%)
404(29%)
651(47%)
296(21%)
430(31%)
726(53%)
1,377(100%)
A-InjuriesState Roadways Local Roadways
Urban Rural Total Urban Rural Total Total
2010 393(35%)
212(19%)
605(54%)
229(21%)
280(25%)
509(46%)
1,114(100%)
2011 253(24%)
183(17%)
436(41%)
357(33%)
281(26%)
638(59%)
1,074(100%)
2012 184(18%)
223(21%)
407(39%)
316(30%)
320(31%)
636(61%)
1,043(100%)
2013 142(15%)
237(25%)
379(40%)
337(36%)
232(24%)
569(60%)
948(100%)
2014 118(14%)
256(30%)
374(43%)
300(35%)
188(22%)
488(57%)
862(100%)
Total 1,090(22%)
1,111(22%)
2,201(44%)
1,539(31%)
1,301(26%)
2,840(56%)
5,041(100%)
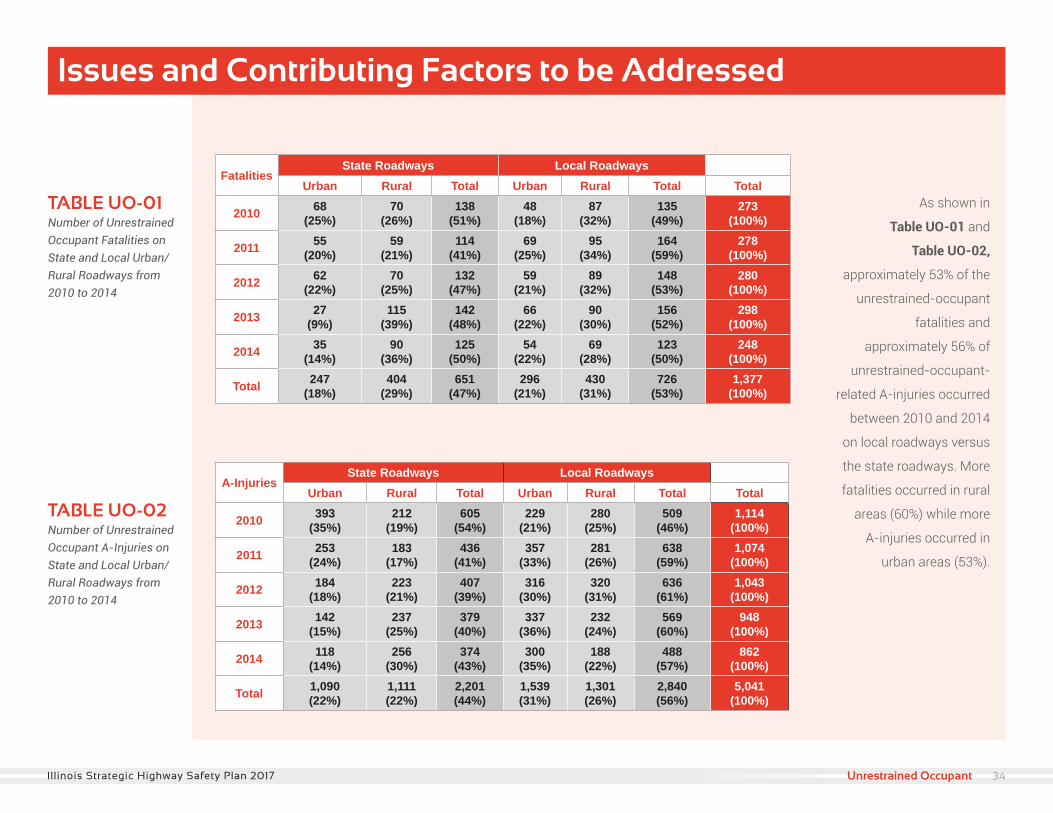
TABLE UO-01 Number of Unrestrained Occupant Fatalities on State and Local Urban/Rural Roadways from2010 to 2014
TABLE UO-02 Number of Unrestrained Occupant A-Injuries onState and Local Urban/Rural Roadways from 2010 to 2014
As shown in
Table UO-01 and
Table UO-02,
approximately 53% of the
unrestrained-occupant
fatalities and
approximately 56% of
unrestrained-occupant-
related A-injuries occurred
between 2010 and 2014
on local roadways versus
the state roadways. More
fatalities occurred in rural
areas (60%) while more
A-injuries occurred in
urban areas (53%).
Issues and Contributing Factors to be Addressed
34Illinois Strategic Highway Safety Plan 2017 Unrestrained Occupant
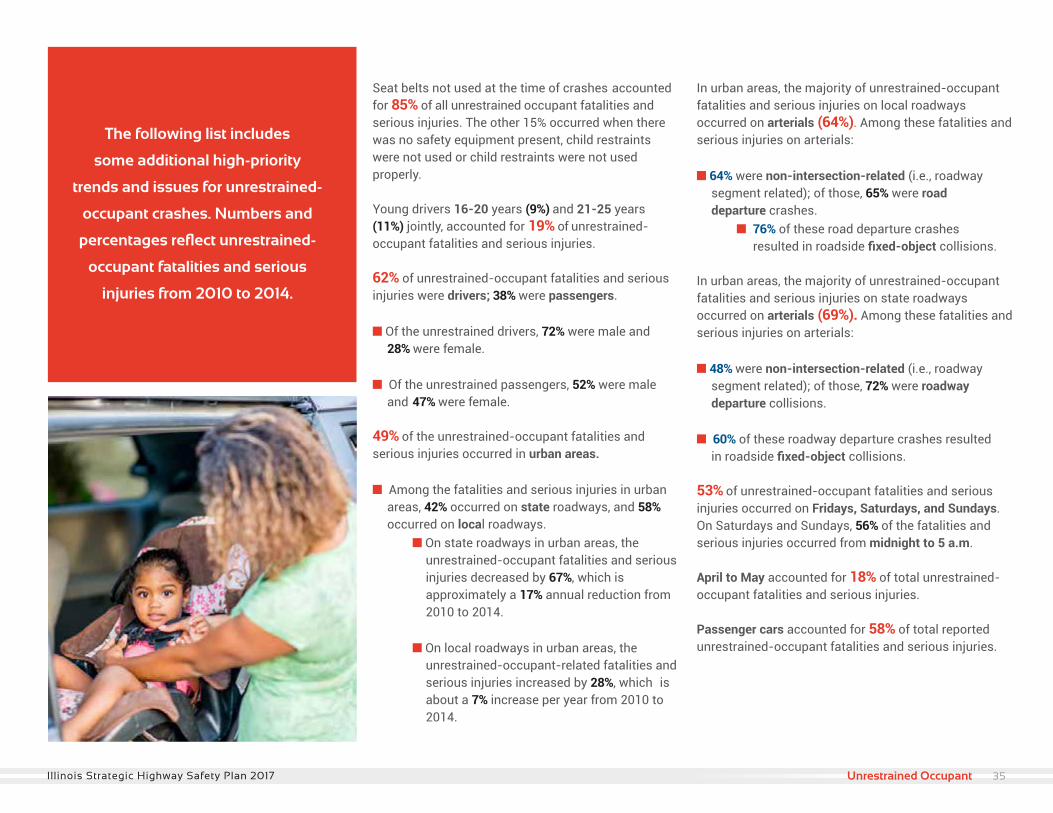
The following list includes
some additional high-priority
trends and issues for unrestrained-
occupant crashes. Numbers and
percentages reflect unrestrained-
occupant fatalities and serious
injuries from 2010 to 2014.
Seat belts not used at the time of crashes accounted for 85% of all unrestrained occupant fatalities and serious injuries. The other 15% occurred when there was no safety equipment present, child restraints were not used or child restraints were not used properly.
Young drivers 16-20 years (9%) and 21-25 years (11%) jointly, accounted for 19% of unrestrained-occupant fatalities and serious injuries.
62% of unrestrained-occupant fatalities and serious injuries were drivers; 38% were passengers.
n Of the unrestrained drivers, 72% were male and 28% were female. n Of the unrestrained passengers, 52% were male and 47% were female.
49% of the unrestrained-occupant fatalities and serious injuries occurred in urban areas.
n Among the fatalities and serious injuries in urban areas, 42% occurred on state roadways, and 58% occurred on local roadways. n On state roadways in urban areas, the unrestrained-occupant fatalities and serious injuries decreased by 67%, which is approximately a 17% annual reduction from 2010 to 2014. n On local roadways in urban areas, the unrestrained-occupant-related fatalities and serious injuries increased by 28%, which is about a 7% increase per year from 2010 to 2014.
In urban areas, the majority of unrestrained-occupant fatalities and serious injuries on local roadways occurred on arterials (64%). Among these fatalities and serious injuries on arterials:
n 64% were non-intersection-related (i.e., roadway segment related); of those, 65% were road departure crashes. n 76% of these road departure crashes resulted in roadside fixed-object collisions.
In urban areas, the majority of unrestrained-occupant fatalities and serious injuries on state roadways occurred on arterials (69%). Among these fatalities and serious injuries on arterials:
n 48% were non-intersection-related (i.e., roadway segment related); of those, 72% were roadway departure collisions.
n 60% of these roadway departure crashes resulted in roadside fixed-object collisions.
53% of unrestrained-occupant fatalities and serious injuries occurred on Fridays, Saturdays, and Sundays. On Saturdays and Sundays, 56% of the fatalities and serious injuries occurred from midnight to 5 a.m.
April to May accounted for 18% of total unrestrained-occupant fatalities and serious injuries.
Passenger cars accounted for 58% of total reported unrestrained-occupant fatalities and serious injuries.
35Illinois Strategic Highway Safety Plan 2017 Unrestrained Occupant
Objectives (What) Strategies (How)Implementation
Area(s)
1. Increase use of occupant restraints by all vehicle occupants
1.1 Conduct highly publicized enforcement campaigns with highly visible marketing to increase restraint use. Education
1.2 Increase enforcement for no seat belt use. Enforcement
1.3 Encourage employer programs that require seat belt use. Education/Enforcement
1.4 Improve restraint-usage data collection, integration, analysis, and sharing between agencies at all levels.
Education/ Enforcement
1.5 Develop restraint-use awareness materials to distribute with impaired-driving information.
Education/ Enforcement
2. Ensure that restraints, especially child and infant restraints, are properly used
2.1 Provide community locations for instruction in proper child restraint use, including both public safety agencies and health care providers. Education
2.2 Continue to conduct high-profile “child restraint inspection” events at multiple community locations. Education
3. Increase awareness of the consequences of unrestrained occupants
3.1 Provide enhanced public education to population groups with lower-than-average restraint use rates. Education
3.2 Provide access to appropriate information, materials, and guidelines for those implementing programs to increase occupant restraint use. Education
3.3 Encourage the use of interactive educational tools. Education
3.4 Increase public awareness of consequences of non-usage (e.g. fines, injury, death). Education
3.5 Educate children, parents and guardians on the importance of using seat belts. Education
4. Decrease the likelihood and/or severities involving unrestrained occupants
4.1 Increase the use of low-cost safety strategies to reduce roadway departure crashes. Engineering
4.2 Investigate opportunities to utilize technology to increase proper seat belt usage. Engineering
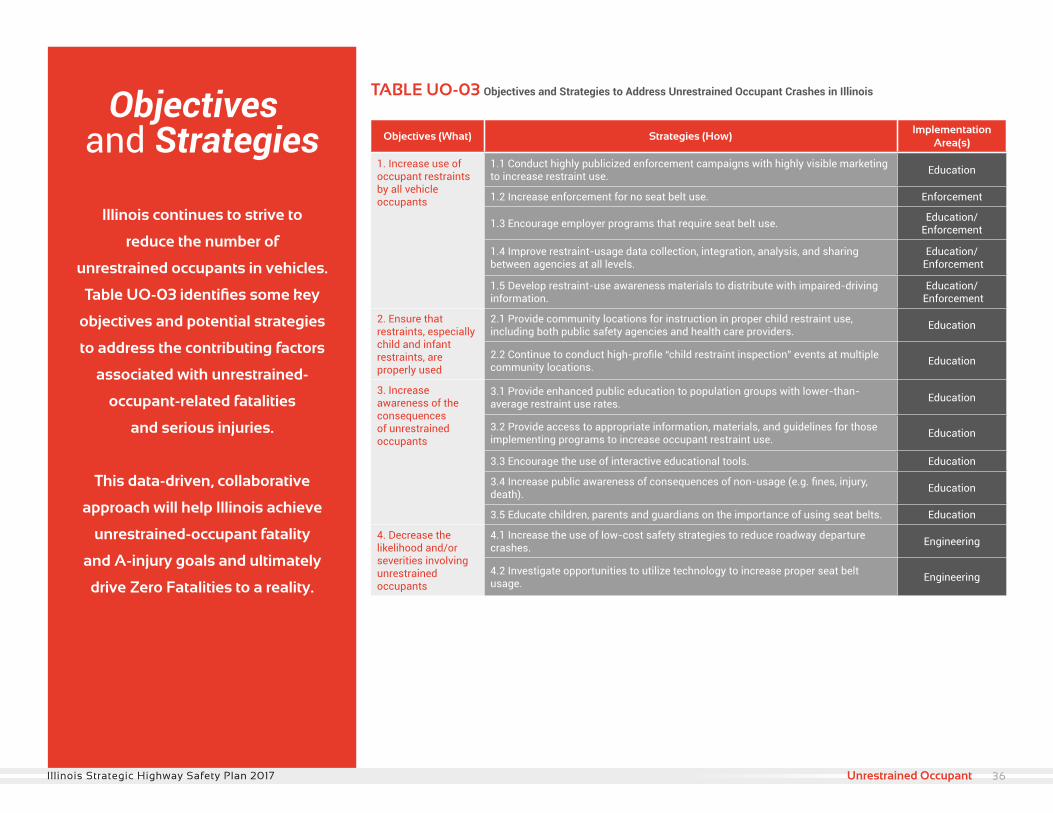
TABLE UO-03 Objectives and Strategies to Address Unrestrained Occupant Crashes in Illinois
Illinois continues to strive to
reduce the number of
unrestrained occupants in vehicles.
Table UO-03 identifies some key
objectives and potential strategies
to address the contributing factors
associated with unrestrained-
occupant-related fatalities
and serious injuries.
This data-driven, collaborative
approach will help Illinois achieve
unrestrained-occupant fatality
and A-injury goals and ultimately
drive Zero Fatalities to a reality.
Objectivesand Strategies
36Illinois Strategic Highway Safety Plan 2017 Unrestrained Occupant
Intersection Related
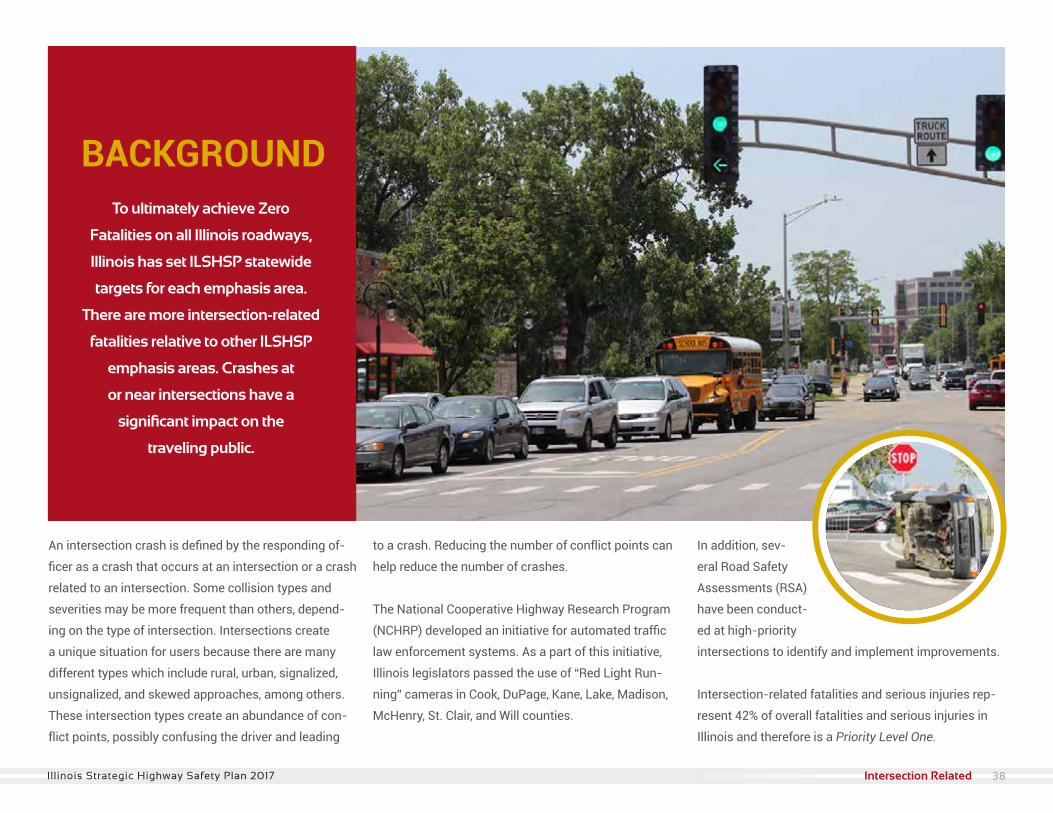
An intersection crash is defined by the responding of-
ficer as a crash that occurs at an intersection or a crash
related to an intersection. Some collision types and
severities may be more frequent than others, depend-
ing on the type of intersection. Intersections create
a unique situation for users because there are many
different types which include rural, urban, signalized,
unsignalized, and skewed approaches, among others.
These intersection types create an abundance of con-
flict points, possibly confusing the driver and leading
to a crash. Reducing the number of conflict points can
help reduce the number of crashes.
The National Cooperative Highway Research Program
(NCHRP) developed an initiative for automated traffic
law enforcement systems. As a part of this initiative,
Illinois legislators passed the use of “Red Light Run-
ning” cameras in Cook, DuPage, Kane, Lake, Madison,
McHenry, St. Clair, and Will counties.
In addition, sev-
eral Road Safety
Assessments (RSA)
have been conduct-
ed at high-priority
intersections to identify and implement improvements.
Intersection-related fatalities and serious injuries rep-
resent 42% of overall fatalities and serious injuries in
Illinois and therefore is a Priority Level One.
To ultimately achieve Zero
Fatalities on all Illinois roadways,
Illinois has set ILSHSP statewide
targets for each emphasis area.
There are more intersection-related
fatalities relative to other ILSHSP
emphasis areas. Crashes at
or near intersections have a
significant impact on the
traveling public.
BACKGROUND
38Illinois Strategic Highway Safety Plan 2017 Intersection Related
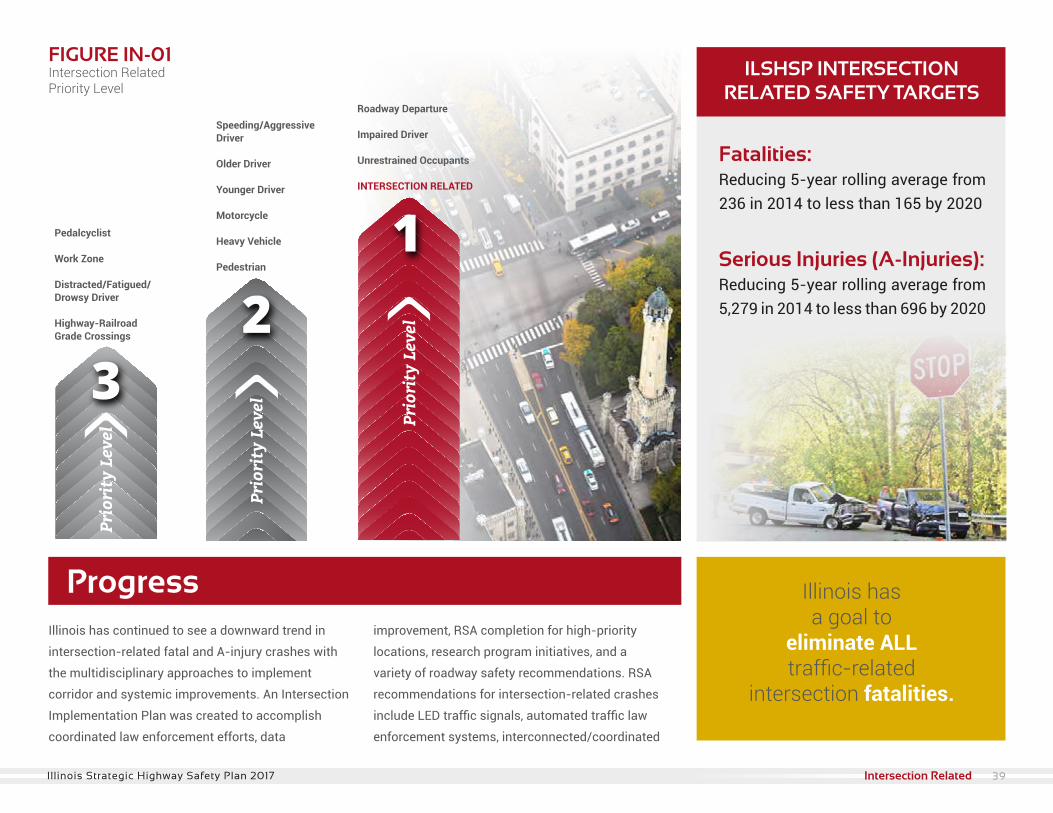
Fatalities: Reducing 5-year rolling average from 236 in 2014 to less than 165 by 2020
Serious Injuries (A-Injuries): Reducing 5-year rolling average from 5,279 in 2014 to less than 696 by 2020
FIGURE IN-01Intersection Related Priority Level
ProgressIllinois has continued to see a downward trend in
intersection-related fatal and A-injury crashes with
the multidisciplinary approaches to implement
corridor and systemic improvements. An Intersection
Implementation Plan was created to accomplish
coordinated law enforcement efforts, data
improvement, RSA completion for high-priority
locations, research program initiatives, and a
variety of roadway safety recommendations. RSA
recommendations for intersection-related crashes
include LED traffic signals, automated traffic law
enforcement systems, interconnected/coordinated
ILSHSP INTERSECTION RELATED SAFETY TARGETS
Illinois has a goal to
eliminate ALL traffic-related
intersection fatalities.
Pedalcyclist
Work Zone
Distracted/Fatigued/Drowsy Driver
Highway-Railroad Grade Crossings
Speeding/AggressiveDriver
Older Driver
Younger Driver
Motorcycle
Heavy Vehicle
Pedestrian
Roadway Departure
Impaired Driver
Unrestrained Occupants
INTERSECTION RELATED
39Illinois Strategic Highway Safety Plan 2017 Intersection Related
407
324
351
254
232
233
237 240
244 224
0
50
100
150
200
250
300
350
400
450
ActualFatalities Linear(Last10Yr) Linear(Last5Yr) 5%AnnualReductionGoal (From5-YrRolling Avg) 5-YrRolling Avg
8,631
8,559
7,135
6,004 5,654
5,445
5,183
5,532
5,374
4,863
0
1,000
2,000
3,000
4,000
5,000
6,000
7,000
8,000
9,000
10,000
ActualA-Injuries Linear(Last10Yr) Linear(Last5Yr) 5%AnnualReductionGoal (From5-YrRolling Avg) 5-YrRolling Avg
Progress (continued)
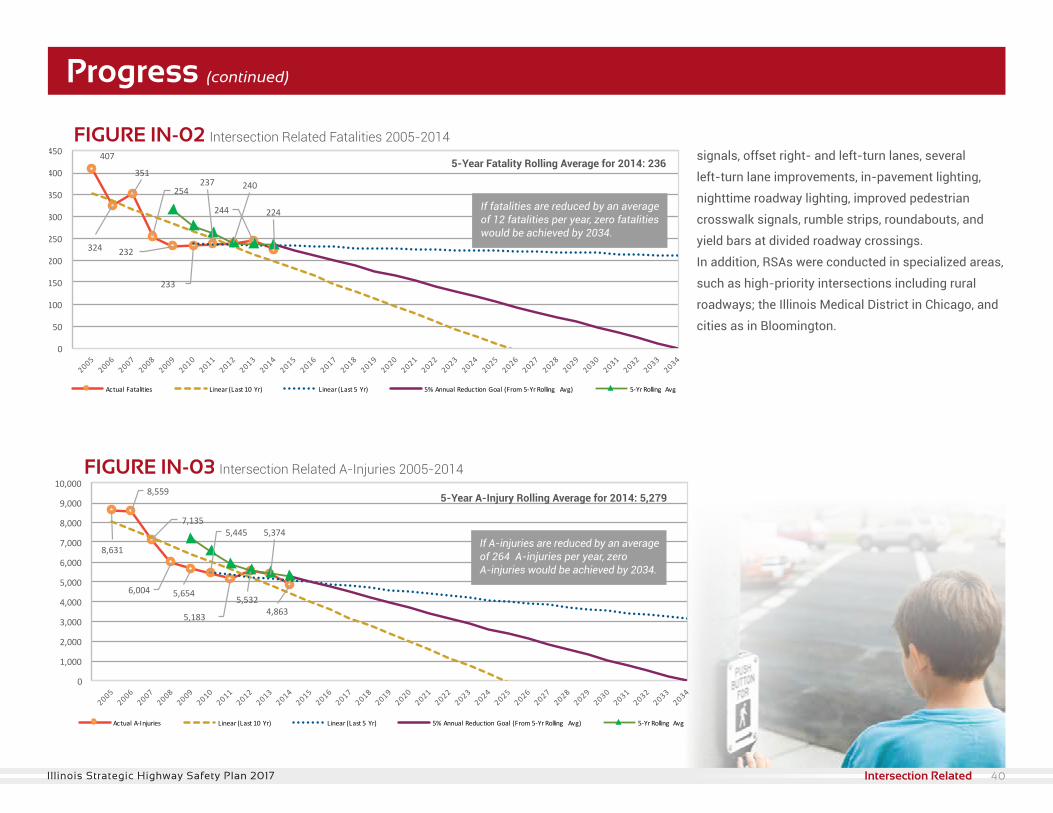
signals, offset right- and left-turn lanes, several
left-turn lane improvements, in-pavement lighting,
nighttime roadway lighting, improved pedestrian
crosswalk signals, rumble strips, roundabouts, and
yield bars at divided roadway crossings.
In addition, RSAs were conducted in specialized areas,
such as high-priority intersections including rural
roadways; the Illinois Medical District in Chicago, and
cities as in Bloomington.
FIGURE IN-02 Intersection Related Fatalities 2005-2014
If fatalities are reduced by an average of 12 fatalities per year, zero fatalities would be achieved by 2034.
FIGURE IN-03 Intersection Related A-Injuries 2005-2014
If A-injuries are reduced by an average of 264 A-injuries per year, zero A-injuries would be achieved by 2034.
5-Year Fatality Rolling Average for 2014: 236
5-Year A-Injury Rolling Average for 2014: 5,279
40Illinois Strategic Highway Safety Plan 2017 Intersection Related
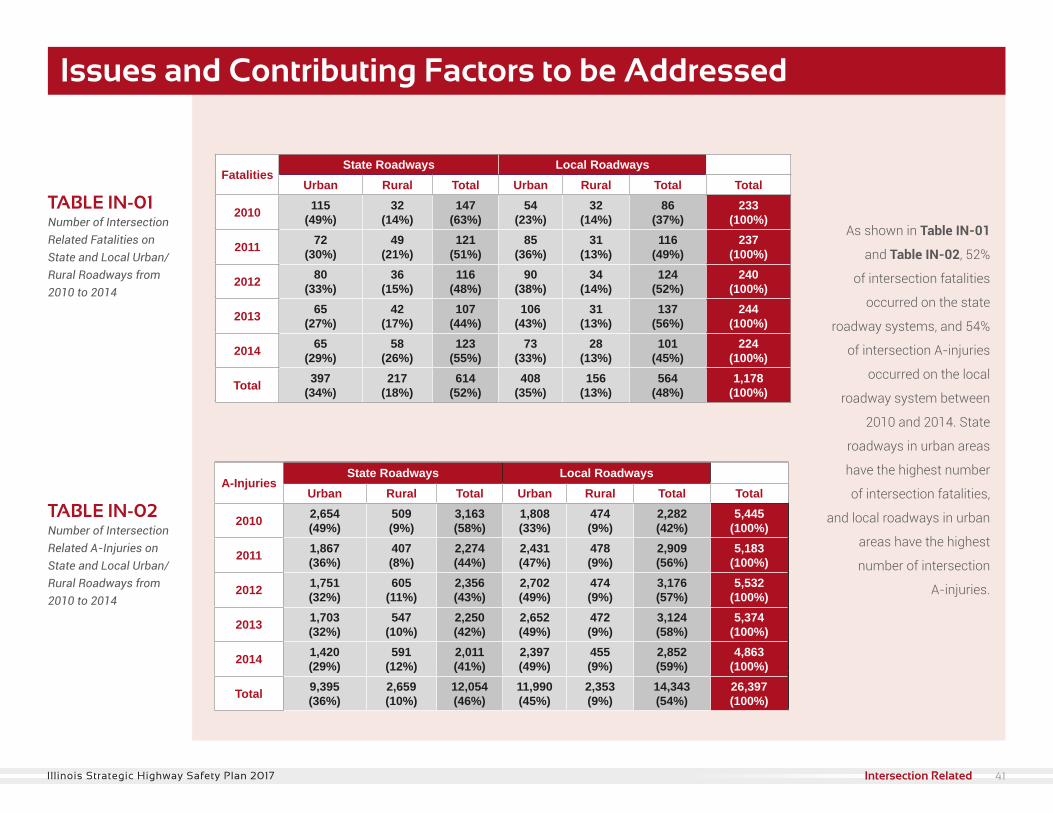
TABLE IN-01 Number of Intersection Related Fatalities on State and Local Urban/Rural Roadways from2010 to 2014
TABLE IN-02 Number of Intersection Related A-Injuries onState and Local Urban/Rural Roadways from 2010 to 2014
Issues and Contributing Factors to be Addressed
As shown in Table IN-01
and Table IN-02, 52%
of intersection fatalities
occurred on the state
roadway systems, and 54%
of intersection A-injuries
occurred on the local
roadway system between
2010 and 2014. State
roadways in urban areas
have the highest number
of intersection fatalities,
and local roadways in urban
areas have the highest
number of intersection
A-injuries.
FatalitiesState Roadways Local Roadways
Urban Rural Total Urban Rural Total Total
2010 43(30%)
27(19%)
70(48%)
37(26%)
38(26%)
75(52%)
145(100%)
2011 19(14%)
31(22%)
50(36%)
48(35%)
41(29%)
89(64%)
139(100%)
2012 28(22%)
28(22%)
56(44%)
31(24%)
40(31%)
71(56%)
127(100%)
2013 22(15%)
50(34%)
72(49%)
36(24%)
40(27%)
76(51%)
148(100%)
2014 19(14%)
50(37%)
69(51%)
35(26%)
31(23%)
66(49%)
135(100%)
Total 131(19%)
186(27%)
317(46%)
187(27%)
190(27%)
377(54%)
694(100%)
A-InjuriesState Roadways Local Roadways
Urban Rural Total Urban Rural Total Total
2010 1,041(39%)
373(14%)
1,414(53%)
741(28%)
531(20%)
1,272(47%)
2,686(100%)
2011 719(30%)
300(13%)
1,019(43%)
854(36%)
493(21%)
1,347(57%)
2,366(100%)
2012 648(25%)
423(17%)
1,071(42%)
938(37%)
537(21%)
1,475(58%)
2,546(100%)
2013 503(20%)
524(21%)
1,027(42%)
939(38%)
492(20%)
1,431(58%)
2,458(100%)
2014 397(18%)
546(25%)
943(43%)
803(37%)
438(20%)
1,241(57%)
2,184(100%)
Total 3,308(27%)
2,166(18%)
5,474(45%)
4,275(35%)
2,491(20%)
6,766(55%)
12,240(100%)
FatalitiesState Roadways Local Roadways
Urban Rural Total Urban Rural Total Total
2010 115(49%)
32(14%)
147(63%)
54(23%)
32(14%)
86(37%)
233(100%)
2011 72(30%)
49(21%)
121(51%)
85(36%)
31(13%)
116(49%)
237(100%)
2012 80(33%)
36(15%)
116(48%)
90(38%)
34(14%)
124(52%)
240(100%)
2013 65(27%)
42(17%)
107(44%)
106(43%)
31(13%)
137(56%)
244(100%)
2014 65(29%)
58(26%)
123(55%)
73(33%)
28(13%)
101(45%)
224(100%)
Total 397(34%)
217(18%)
614(52%)
408(35%)
156(13%)
564(48%)
1,178(100%)
A-InjuriesState Roadways Local Roadways
Urban Rural Total Urban Rural Total Total
2010 2,654(49%)
509(9%)
3,163(58%)
1,808(33%)
474(9%)
2,282(42%)
5,445(100%)
2011 1,867(36%)
407(8%)
2,274(44%)
2,431(47%)
478(9%)
2,909(56%)
5,183(100%)
2012 1,751(32%)
605(11%)
2,356(43%)
2,702(49%)
474(9%)
3,176(57%)
5,532(100%)
2013 1,703(32%)
547(10%)
2,250(42%)
2,652(49%)
472(9%)
3,124(58%)
5,374(100%)
2014 1,420(29%)
591(12%)
2,011(41%)
2,397(49%)
455(9%)
2,852(59%)
4,863(100%)
Total 9,395(36%)
2,659(10%)
12,054(46%)
11,990(45%)
2,353(9%)
14,343(54%)
26,397(100%)
41Illinois Strategic Highway Safety Plan 2017 Intersection Related
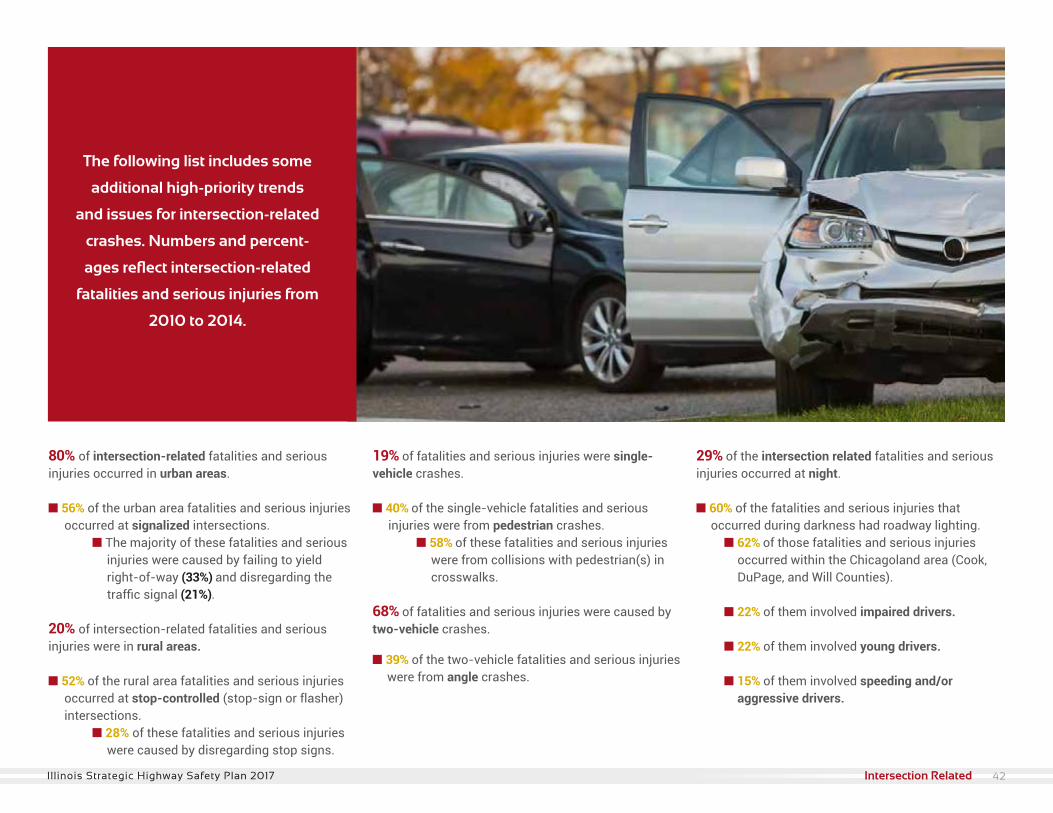
80% of intersection-related fatalities and serious injuries occurred in urban areas.
n 56% of the urban area fatalities and serious injuries occurred at signalized intersections. n The majority of these fatalities and serious injuries were caused by failing to yield right-of-way (33%) and disregarding the traffic signal (21%). 20% of intersection-related fatalities and serious injuries were in rural areas.
n 52% of the rural area fatalities and serious injuries occurred at stop-controlled (stop-sign or flasher) intersections. n 28% of these fatalities and serious injuries were caused by disregarding stop signs.
19% of fatalities and serious injuries were single-vehicle crashes. n 40% of the single-vehicle fatalities and serious injuries were from pedestrian crashes. n 58% of these fatalities and serious injuries were from collisions with pedestrian(s) in crosswalks. 68% of fatalities and serious injuries were caused by two-vehicle crashes.
n 39% of the two-vehicle fatalities and serious injuries were from angle crashes.
29% of the intersection related fatalities and serious injuries occurred at night.
n 60% of the fatalities and serious injuries that occurred during darkness had roadway lighting. n 62% of those fatalities and serious injuries occurred within the Chicagoland area (Cook, DuPage, and Will Counties).
n 22% of them involved impaired drivers.
n 22% of them involved young drivers.
n 15% of them involved speeding and/or aggressive drivers.
The following list includes some
additional high-priority trends
and issues for intersection-related
crashes. Numbers and percent-
ages reflect intersection-related
fatalities and serious injuries from
2010 to 2014.
42Illinois Strategic Highway Safety Plan 2017 Intersection Related
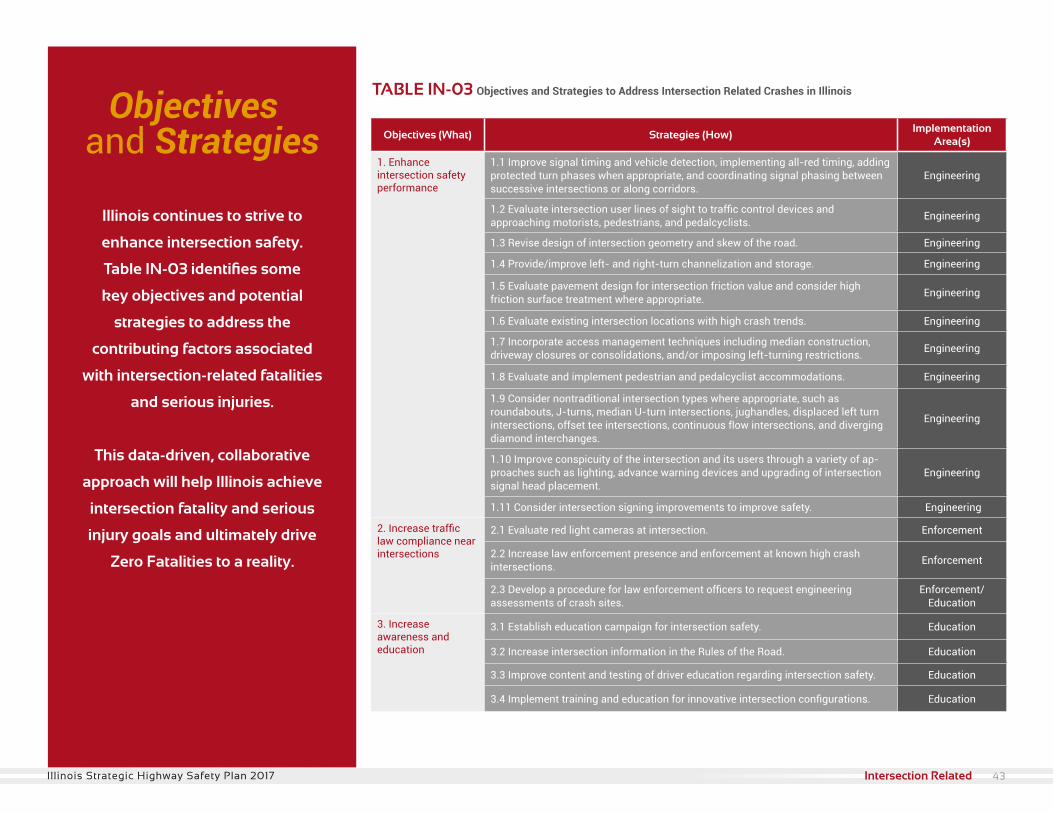
Objectives (What) Strategies (How)Implementation
Area(s)
1. Enhance intersection safety performance
1.1 Improve signal timing and vehicle detection, implementing all-red timing, adding protected turn phases when appropriate, and coordinating signal phasing between successive intersections or along corridors.
Engineering
1.2 Evaluate intersection user lines of sight to traffic control devices and approaching motorists, pedestrians, and pedalcyclists. Engineering
1.3 Revise design of intersection geometry and skew of the road. Engineering
1.4 Provide/improve left- and right-turn channelization and storage. Engineering
1.5 Evaluate pavement design for intersection friction value and consider high friction surface treatment where appropriate. Engineering
1.6 Evaluate existing intersection locations with high crash trends. Engineering
1.7 Incorporate access management techniques including median construction, driveway closures or consolidations, and/or imposing left-turning restrictions. Engineering
1.8 Evaluate and implement pedestrian and pedalcyclist accommodations. Engineering
1.9 Consider nontraditional intersection types where appropriate, such as roundabouts, J-turns, median U-turn intersections, jughandles, displaced left turn intersections, offset tee intersections, continuous flow intersections, and diverging diamond interchanges.
Engineering
1.10 Improve conspicuity of the intersection and its users through a variety of ap-proaches such as lighting, advance warning devices and upgrading of intersection signal head placement.
Engineering
1.11 Consider intersection signing improvements to improve safety. Engineering
2. Increase traffic law compliance nearintersections
2.1 Evaluate red light cameras at intersection. Enforcement
2.2 Increase law enforcement presence and enforcement at known high crash intersections. Enforcement
2.3 Develop a procedure for law enforcement officers to request engineering assessments of crash sites.
Enforcement/ Education
3. Increase awareness and education
3.1 Establish education campaign for intersection safety. Education
3.2 Increase intersection information in the Rules of the Road. Education
3.3 Improve content and testing of driver education regarding intersection safety. Education
3.4 Implement training and education for innovative intersection configurations. Education
TABLE IN-03 Objectives and Strategies to Address Intersection Related Crashes in Illinois
Illinois continues to strive to
enhance intersection safety.
Table IN-03 identifies some
key objectives and potential
strategies to address the
contributing factors associated
with intersection-related fatalities
and serious injuries.
This data-driven, collaborative
approach will help Illinois achieve
intersection fatality and serious
injury goals and ultimately drive
Zero Fatalities to a reality.
Objectivesand Strategies
43Illinois Strategic Highway Safety Plan 2017 Intersection Related
Speeding/Aggressive Driver
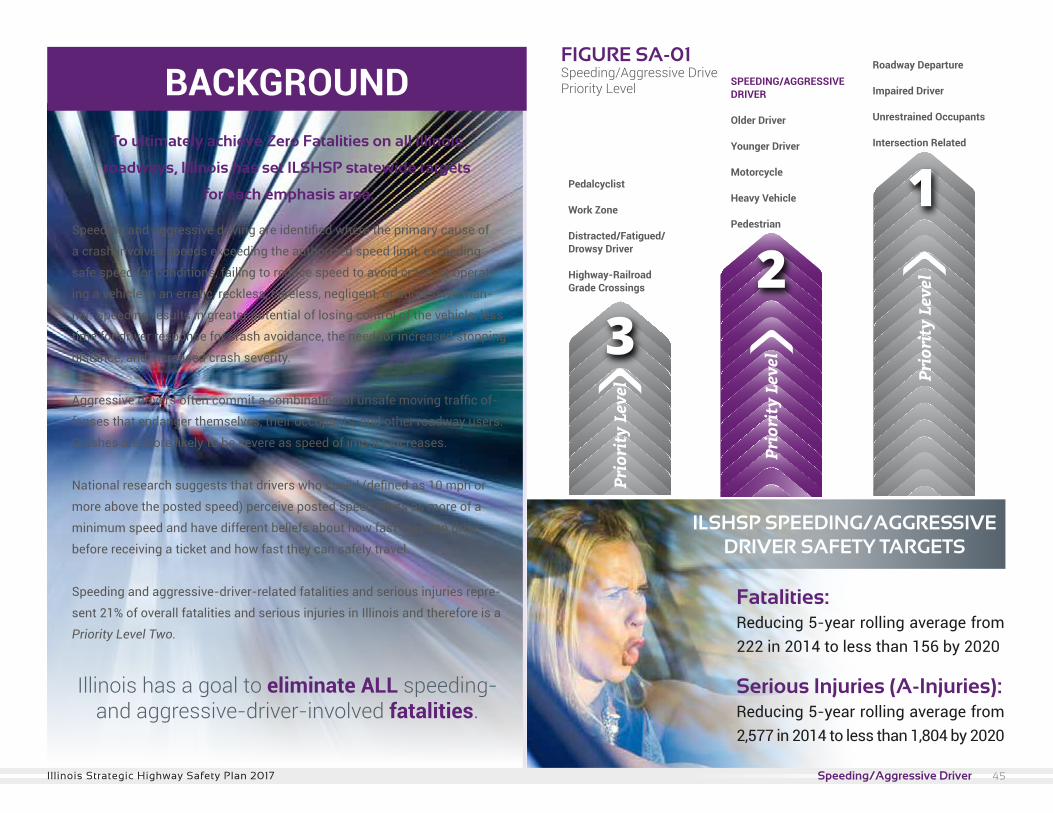
Speeding and aggressive driving are identified where the primary cause of
a crash involves speeds exceeding the authorized speed limit, exceeding
safe speed for conditions, failing to reduce speed to avoid crash, or operat-
ing a vehicle in an erratic, reckless, careless, negligent, or aggressive man-
ner. Speeding results in greater potential of losing control of the vehicle, less
time for driver response for crash avoidance, the need for increased stopping
distance, and increased crash severity.
Aggressive drivers often commit a combination of unsafe moving traffic of-
fenses that endanger themselves, their occupants, and other roadway users.
Crashes are more likely to be severe as speed of impact increases.
National research suggests that drivers who speed (defined as 10 mph or
more above the posted speed) perceive posted speed limits as more of a
minimum speed and have different beliefs about how fast they can drive
before receiving a ticket and how fast they can safely travel.
Speeding and aggressive-driver-related fatalities and serious injuries repre-
sent 21% of overall fatalities and serious injuries in Illinois and therefore is a
Priority Level Two.
To ultimately achieve Zero Fatalities on all Illinois
roadways, Illinois has set ILSHSP statewide targets
for each emphasis area.
BACKGROUND
Pedalcyclist
Work Zone
Distracted/Fatigued/Drowsy Driver
Highway-Railroad Grade Crossings
SPEEDING/AGGRESSIVEDRIVER
Older Driver
Younger Driver
Motorcycle
Heavy Vehicle
Pedestrian
Roadway Departure
Impaired Driver
Unrestrained Occupants
Intersection Related
Fatalities: Reducing 5-year rolling average from 222 in 2014 to less than 156 by 2020
Serious Injuries (A-Injuries): Reducing 5-year rolling average from 2,577 in 2014 to less than 1,804 by 2020
FIGURE SA-01Speeding/Aggressive DrivePriority Level
Illinois has a goal to eliminate ALL speeding- and aggressive-driver-involved fatalities.
ILSHSP SPEEDING/AGGRESSIVE DRIVER SAFETY TARGETS
45Illinois Strategic Highway Safety Plan 2017 Speeding/Aggressive Driver
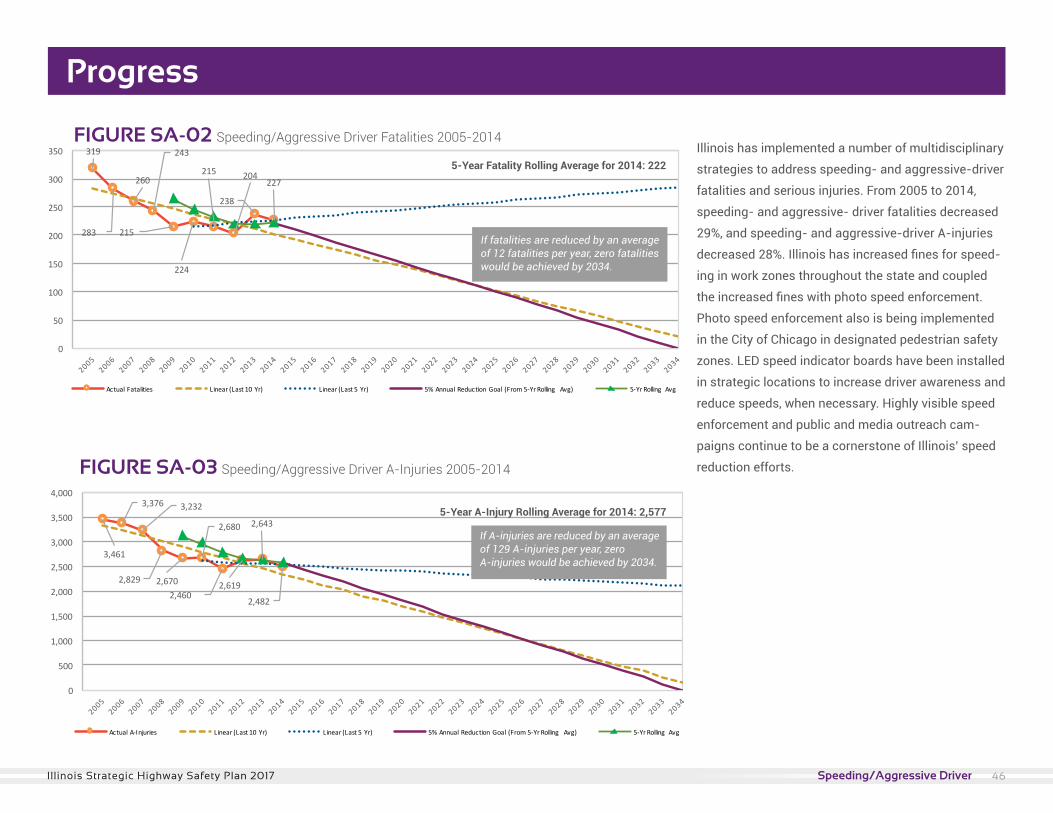
319
283
260
243
215
224
215 204
238
227
0
50
100
150
200
250
300
350
ActualFatalities Linear(Last10Yr) Linear(Last5Yr) 5%AnnualReductionGoal (From5-YrRolling Avg) 5-YrRolling Avg
3,461
3,376 3,232
2,829 2,670
2,680
2,4602,619
2,643
2,482
0
500
1,000
1,500
2,000
2,500
3,000
3,500
4,000
ActualA-Injuries Linear(Last10Yr) Linear(Last5Yr) 5%AnnualReductionGoal (From5-YrRolling Avg) 5-YrRolling Avg
Progress
Illinois has implemented a number of multidisciplinary
strategies to address speeding- and aggressive-driver
fatalities and serious injuries. From 2005 to 2014,
speeding- and aggressive- driver fatalities decreased
29%, and speeding- and aggressive-driver A-injuries
decreased 28%. Illinois has increased fines for speed-
ing in work zones throughout the state and coupled
the increased fines with photo speed enforcement.
Photo speed enforcement also is being implemented
in the City of Chicago in designated pedestrian safety
zones. LED speed indicator boards have been installed
in strategic locations to increase driver awareness and
reduce speeds, when necessary. Highly visible speed
enforcement and public and media outreach cam-
paigns continue to be a cornerstone of Illinois’ speed
reduction efforts.
FIGURE SA-02 Speeding/Aggressive Driver Fatalities 2005-2014
If fatalities are reduced by an average of 12 fatalities per year, zero fatalities would be achieved by 2034.
FIGURE SA-03 Speeding/Aggressive Driver A-Injuries 2005-2014
If A-injuries are reduced by an average of 129 A-injuries per year, zero A-injuries would be achieved by 2034.
5-Year Fatality Rolling Average for 2014: 222
5-Year A-Injury Rolling Average for 2014: 2,577
46Illinois Strategic Highway Safety Plan 2017 Speeding/Aggressive Driver
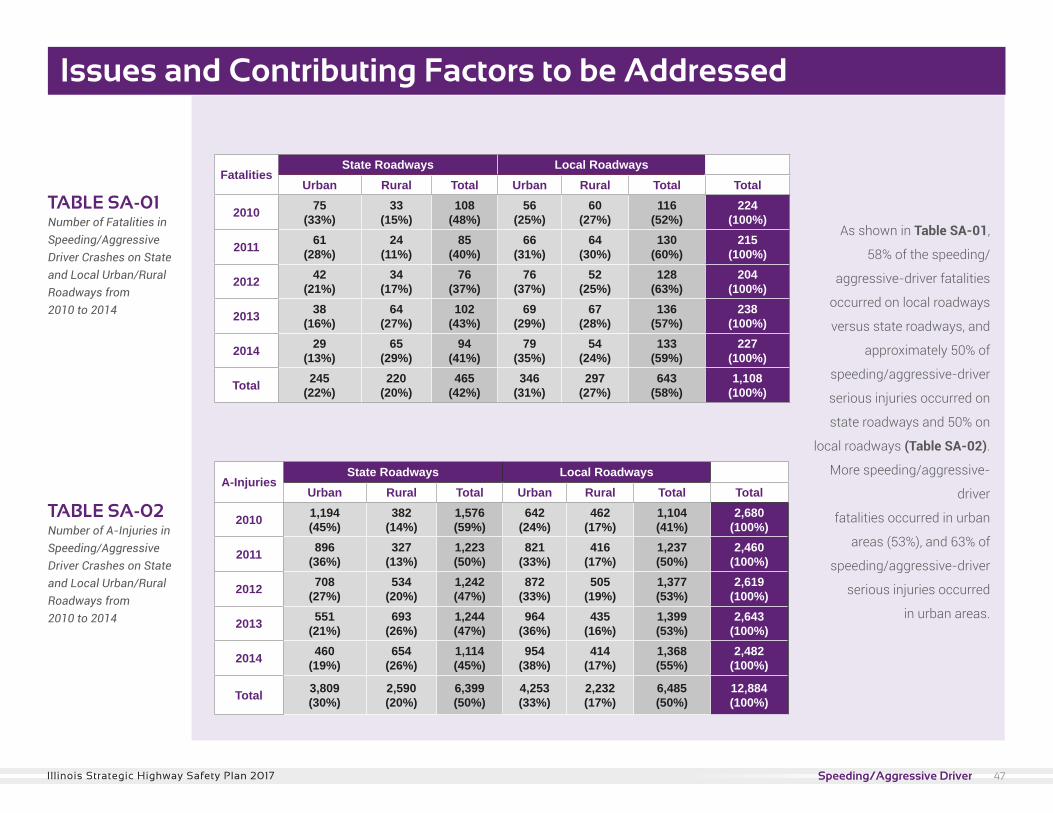
FatalitiesState Roadways Local Roadways
Urban Rural Total Urban Rural Total Total
2010 75(33%)
33(15%)
108(48%)
56(25%)
60(27%)
116(52%)
224(100%)
2011 61(28%)
24(11%)
85(40%)
66(31%)
64(30%)
130(60%)
215(100%)
2012 42(21%)
34(17%)
76(37%)
76(37%)
52(25%)
128(63%)
204(100%)
2013 38(16%)
64(27%)
102(43%)
69(29%)
67(28%)
136(57%)
238(100%)
2014 29(13%)
65(29%)
94(41%)
79(35%)
54(24%)
133(59%)
227(100%)
Total 245(22%)
220(20%)
465(42%)
346(31%)
297(27%)
643(58%)
1,108(100%)
A-InjuriesState Roadways Local Roadways
Urban Rural Total Urban Rural Total Total
2010 1,194(45%)
382(14%)
1,576(59%)
642(24%)
462(17%)
1,104(41%)
2,680(100%)
2011 896(36%)
327(13%)
1,223(50%)
821(33%)
416(17%)
1,237(50%)
2,460(100%)
2012 708(27%)
534(20%)
1,242(47%)
872(33%)
505(19%)
1,377(53%)
2,619(100%)
2013 551(21%)
693(26%)
1,244(47%)
964(36%)
435(16%)
1,399(53%)
2,643(100%)
2014 460(19%)
654(26%)
1,114(45%)
954(38%)
414(17%)
1,368(55%)
2,482(100%)
Total 3,809(30%)
2,590(20%)
6,399(50%)
4,253(33%)
2,232(17%)
6,485(50%)
12,884(100%)
TABLE SA-01 Number of Fatalities in Speeding/AggressiveDriver Crashes on Stateand Local Urban/Rural Roadways from2010 to 2014
TABLE SA-02 Number of A-Injuries in Speeding/Aggressive Driver Crashes on Stateand Local Urban/Rural Roadways from 2010 to 2014
Issues and Contributing Factors to be Addressed
As shown in Table SA-01,
58% of the speeding/
aggressive-driver fatalities
occurred on local roadways
versus state roadways, and
approximately 50% of
speeding/aggressive-driver
serious injuries occurred on
state roadways and 50% on
local roadways (Table SA-02).
More speeding/aggressive-
driver
fatalities occurred in urban
areas (53%), and 63% of
speeding/aggressive-driver
serious injuries occurred
in urban areas.
Intersection Related 47Illinois Strategic Highway Safety Plan 2017 Speeding/Aggressive Driver
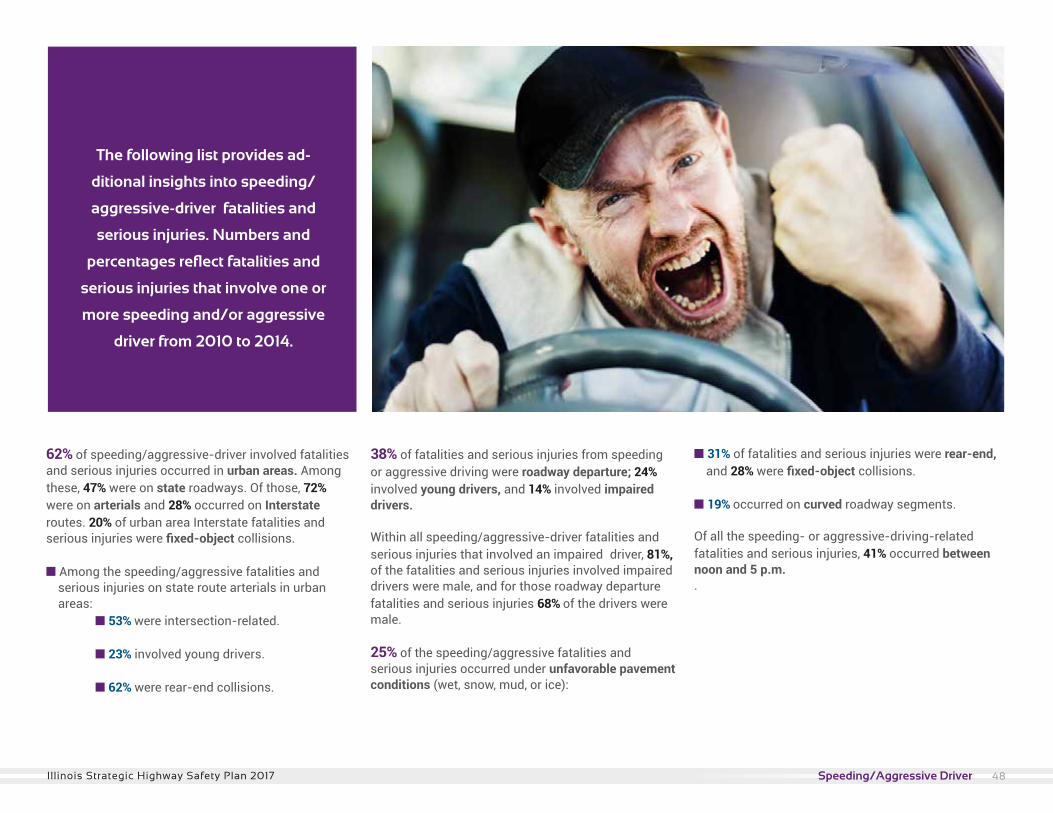
62% of speeding/aggressive-driver involved fatalities and serious injuries occurred in urban areas. Among these, 47% were on state roadways. Of those, 72% were on arterials and 28% occurred on Interstate routes. 20% of urban area Interstate fatalities and serious injuries were fixed-object collisions.
n Among the speeding/aggressive fatalities and serious injuries on state route arterials in urban areas: n 53% were intersection-related. n 23% involved young drivers.
n 62% were rear-end collisions.
38% of fatalities and serious injuries from speeding or aggressive driving were roadway departure; 24% involved young drivers, and 14% involved impaired drivers.
Within all speeding/aggressive-driver fatalities and serious injuries that involved an impaired driver, 81%, of the fatalities and serious injuries involved impaired drivers were male, and for those roadway departure fatalities and serious injuries 68% of the drivers were male.
25% of the speeding/aggressive fatalities and serious injuries occurred under unfavorable pavement conditions (wet, snow, mud, or ice):
n 31% of fatalities and serious injuries were rear-end, and 28% were fixed-object collisions.
n 19% occurred on curved roadway segments.
Of all the speeding- or aggressive-driving-related fatalities and serious injuries, 41% occurred between noon and 5 p.m..
The following list provides ad-
ditional insights into speeding/
aggressive-driver fatalities and
serious injuries. Numbers and
percentages reflect fatalities and
serious injuries that involve one or
more speeding and/or aggressive
driver from 2010 to 2014.
48Illinois Strategic Highway Safety Plan 2017 Speeding/Aggressive Driver
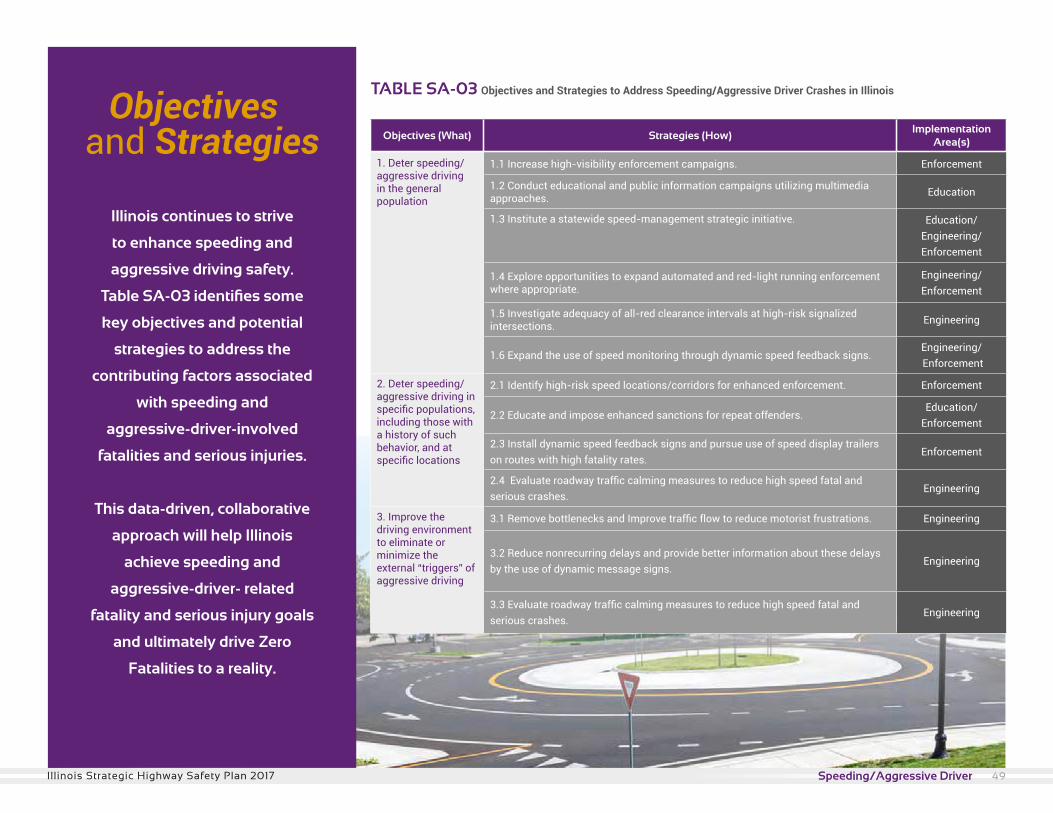
Objectives (What) Strategies (How)Implementation
Area(s)
1. Deter speeding/ aggressive driving in the general population
1.1 Increase high-visibility enforcement campaigns. Enforcement
1.2 Conduct educational and public information campaigns utilizing multimedia approaches. Education
1.3 Institute a statewide speed-management strategic initiative. Education/Engineering/Enforcement
1.4 Explore opportunities to expand automated and red-light running enforcement where appropriate.
Engineering/ Enforcement
1.5 Investigate adequacy of all-red clearance intervals at high-risk signalized intersections. Engineering
1.6 Expand the use of speed monitoring through dynamic speed feedback signs.Engineering/ Enforcement
2. Deter speeding/ aggressive driving in specific populations, including those with a history of such behavior, and at specific locations
2.1 Identify high-risk speed locations/corridors for enhanced enforcement. Enforcement
2.2 Educate and impose enhanced sanctions for repeat offenders.Education/
Enforcement
2.3 Install dynamic speed feedback signs and pursue use of speed display trailers on routes with high fatality rates.
Enforcement
2.4 Evaluate roadway traffic calming measures to reduce high speed fatal and serious crashes.
Engineering
3. Improve the driving environment to eliminate or minimize the external “triggers” of aggressive driving
3.1 Remove bottlenecks and Improve traffic flow to reduce motorist frustrations. Engineering
3.2 Reduce nonrecurring delays and provide better information about these delays by the use of dynamic message signs.
Engineering
3.3 Evaluate roadway traffic calming measures to reduce high speed fatal andserious crashes.
Engineering
TABLE SA-03 Objectives and Strategies to Address Speeding/Aggressive Driver Crashes in Illinois
Illinois continues to strive
to enhance speeding and
aggressive driving safety.
Table SA-03 identifies some
key objectives and potential
strategies to address the
contributing factors associated
with speeding and
aggressive-driver-involved
fatalities and serious injuries.
This data-driven, collaborative
approach will help Illinois
achieve speeding and
aggressive-driver- related
fatality and serious injury goals
and ultimately drive Zero
Fatalities to a reality.
Objectivesand Strategies
Young Driver 49Illinois Strategic Highway Safety Plan 2017 Speeding/Aggressive Driver
Older Driver
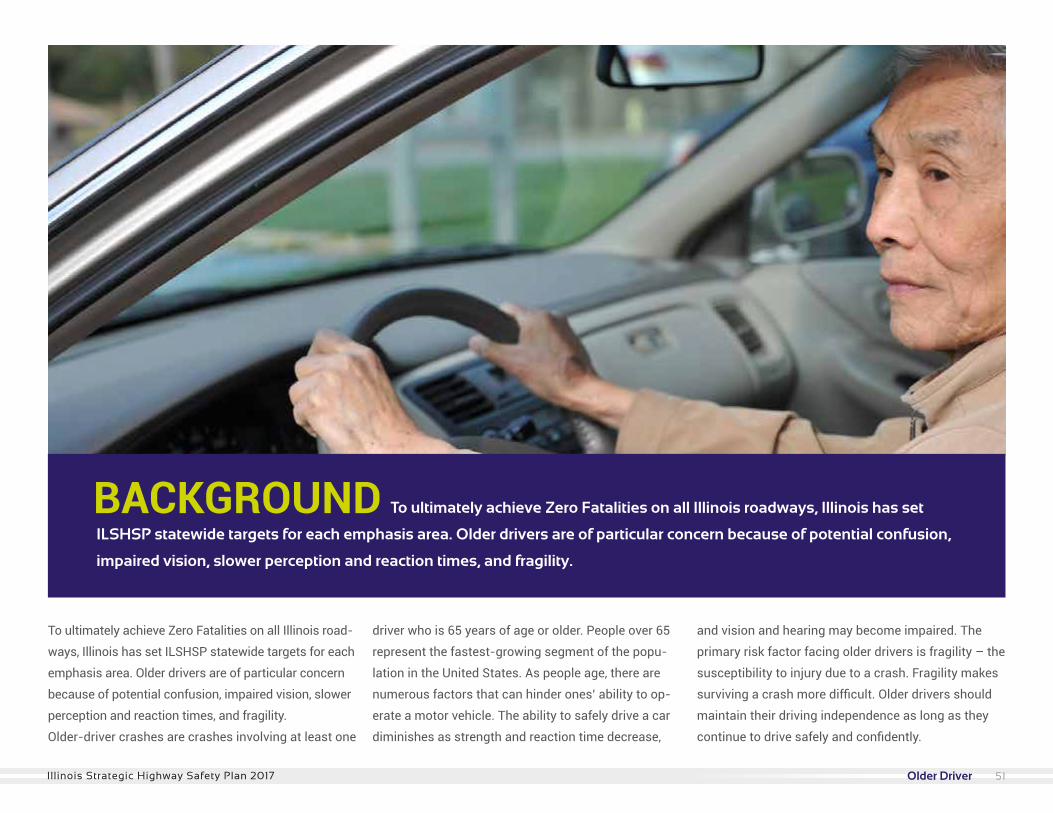
To ultimately achieve Zero Fatalities on all Illinois road-
ways, Illinois has set ILSHSP statewide targets for each
emphasis area. Older drivers are of particular concern
because of potential confusion, impaired vision, slower
perception and reaction times, and fragility.
Older-driver crashes are crashes involving at least one
driver who is 65 years of age or older. People over 65
represent the fastest-growing segment of the popu-
lation in the United States. As people age, there are
numerous factors that can hinder ones’ ability to op-
erate a motor vehicle. The ability to safely drive a car
diminishes as strength and reaction time decrease,
and vision and hearing may become impaired. The
primary risk factor facing older drivers is fragility – the
susceptibility to injury due to a crash. Fragility makes
surviving a crash more difficult. Older drivers should
maintain their driving independence as long as they
continue to drive safely and confidently.
To ultimately achieve Zero Fatalities on all Illinois roadways, Illinois has set
ILSHSP statewide targets for each emphasis area. Older drivers are of particular concern because of potential confusion,
impaired vision, slower perception and reaction times, and fragility.
BACKGROUND
51Illinois Strategic Highway Safety Plan 2017 Older Driver
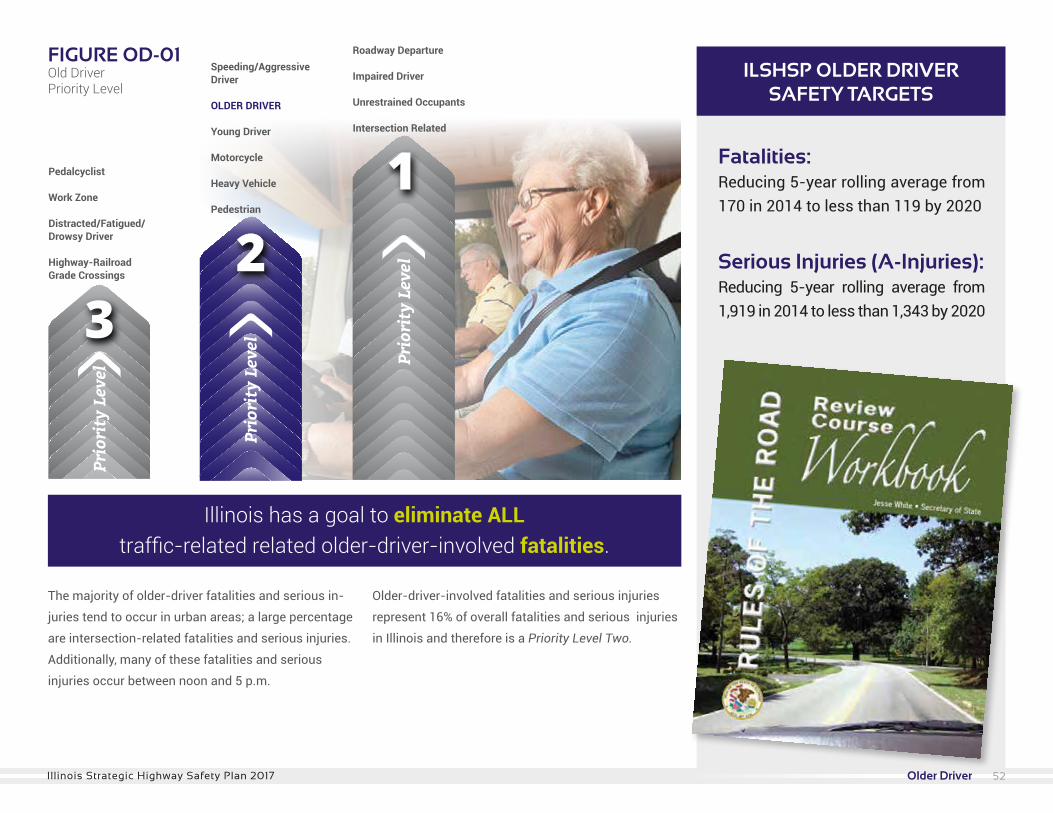
FIGURE OD-01Old Driver Priority Level
Fatalities: Reducing 5-year rolling average from 170 in 2014 to less than 119 by 2020
Serious Injuries (A-Injuries): Reducing 5-year rolling average from 1,919 in 2014 to less than 1,343 by 2020
ILSHSP OLDER DRIVER SAFETY TARGETS
Illinois has a goal to eliminate ALL traffic-related related older-driver-involved fatalities.
Pedalcyclist
Work Zone
Distracted/Fatigued/Drowsy Driver
Highway-Railroad Grade Crossings
Speeding/AggressiveDriver
OLDER DRIVER
Young Driver
Motorcycle
Heavy Vehicle
Pedestrian
Roadway Departure
Impaired Driver
Unrestrained Occupants
Intersection Related
The majority of older-driver fatalities and serious in-
juries tend to occur in urban areas; a large percentage
are intersection-related fatalities and serious injuries.
Additionally, many of these fatalities and serious
injuries occur between noon and 5 p.m.
Older-driver-involved fatalities and serious injuries
represent 16% of overall fatalities and serious injuries
in Illinois and therefore is a Priority Level Two.
52Illinois Strategic Highway Safety Plan 2017 Older Driver
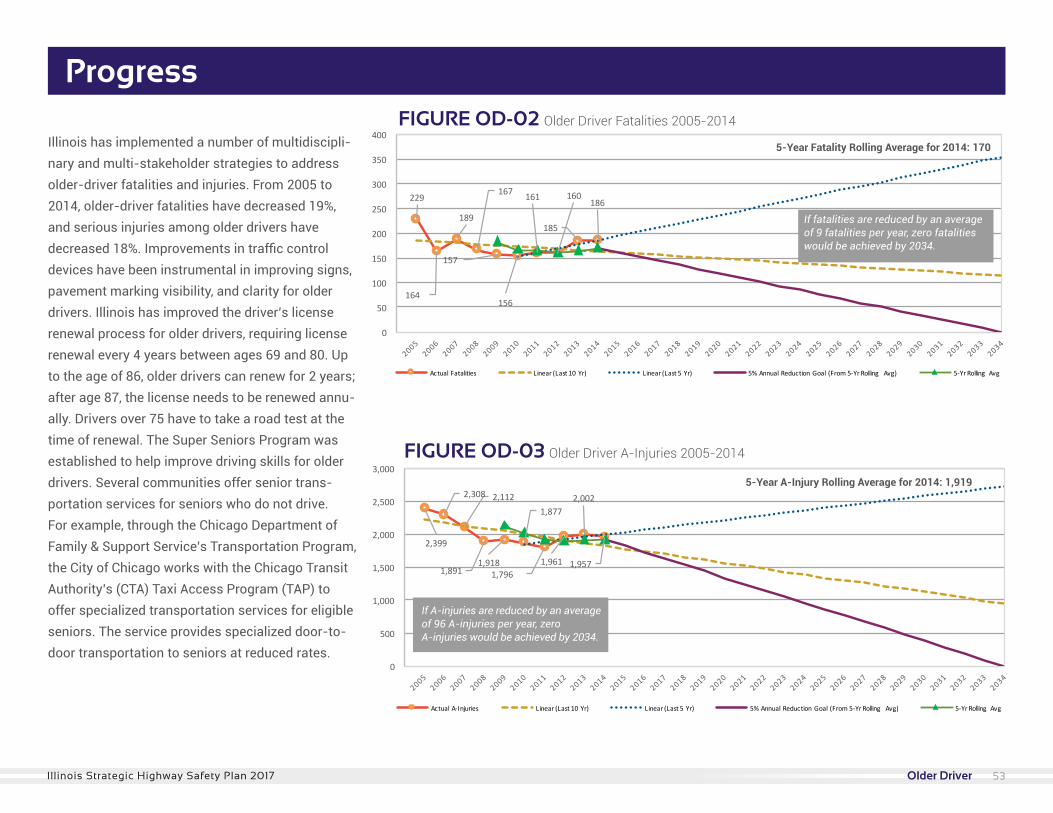
Illinois has implemented a number of multidiscipli-nary and multi-stakeholder strategies to address older-driver fatalities and injuries. From 2005 to 2014, older-driver fatalities have decreased 19%, and serious injuries among older drivers have decreased 18%. Improvements in traffic control devices have been instrumental in improving signs, pavement marking visibility, and clarity for older drivers. Illinois has improved the driver’s license renewal process for older drivers, requiring license renewal every 4 years between ages 69 and 80. Up to the age of 86, older drivers can renew for 2 years; after age 87, the license needs to be renewed annu-ally. Drivers over 75 have to take a road test at the time of renewal. The Super Seniors Program was established to help improve driving skills for older drivers. Several communities offer senior trans-portation services for seniors who do not drive. For example, through the Chicago Department of Family & Support Service’s Transportation Program, the City of Chicago works with the Chicago Transit Authority’s (CTA) Taxi Access Program (TAP) to offer specialized transportation services for eligible seniors. The service provides specialized door-to-door transportation to seniors at reduced rates.
Progress
229
164
189
167
157
156
161 160
185
186
0
50
100
150
200
250
300
350
400
ActualFatalities Linear(Last10Yr) Linear(Last5Yr) 5%AnnualReductionGoal (From5-YrRolling Avg) 5-YrRolling Avg
2,399
2,308 2,112
1,8911,918
1,877
1,7961,961
2,002
1,957
0
500
1,000
1,500
2,000
2,500
3,000
ActualA-Injuries Linear(Last10Yr) Linear(Last5Yr) 5%AnnualReductionGoal (From5-YrRolling Avg) 5-YrRolling Avg
FIGURE OD-02 Older Driver Fatalities 2005-2014
229
164
189
167
157
156
161 160
185
186
0
50
100
150
200
250
300
350
400
ActualFatalities Linear(Last10Yr) Linear(Last5Yr) 5%AnnualReductionGoal (From5-YrRolling Avg) 5-YrRolling Avg
2,399
2,308 2,112
1,8911,918
1,877
1,7961,961
2,002
1,957
0
500
1,000
1,500
2,000
2,500
3,000
ActualA-Injuries Linear(Last10Yr) Linear(Last5Yr) 5%AnnualReductionGoal (From5-YrRolling Avg) 5-YrRolling Avg
If fatalities are reduced by an average of 9 fatalities per year, zero fatalities would be achieved by 2034.
FIGURE OD-03 Older Driver A-Injuries 2005-2014
If A-injuries are reduced by an average of 96 A-injuries per year, zero A-injuries would be achieved by 2034.
5-Year Fatality Rolling Average for 2014: 170
5-Year A-Injury Rolling Average for 2014: 1,919
53Illinois Strategic Highway Safety Plan 2017 Older Driver
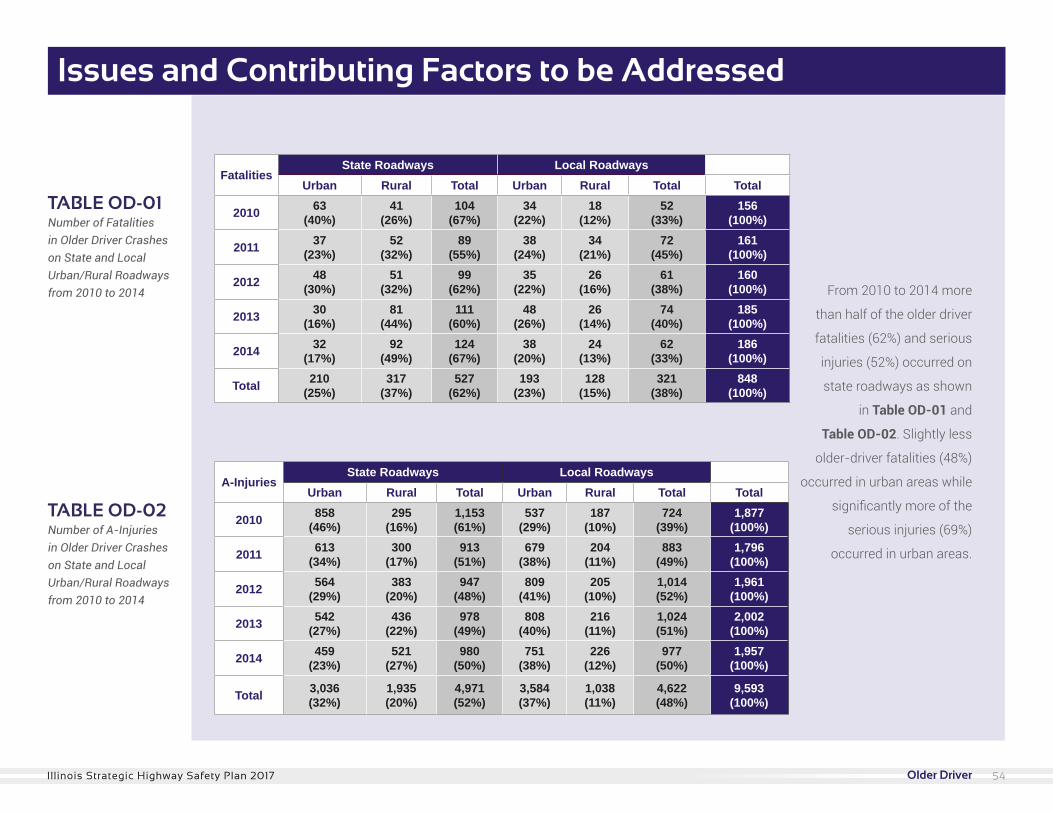
FatalitiesState Roadways Local Roadways
Urban Rural Total Urban Rural Total Total
2010 63(40%)
41(26%)
104(67%)
34(22%)
18(12%)
52(33%)
156(100%)
2011 37(23%)
52(32%)
89(55%)
38(24%)
34(21%)
72(45%)
161(100%)
2012 48(30%)
51(32%)
99(62%)
35(22%)
26(16%)
61(38%)
160(100%)
2013 30(16%)
81(44%)
111(60%)
48(26%)
26(14%)
74(40%)
185(100%)
2014 32(17%)
92(49%)
124(67%)
38(20%)
24(13%)
62(33%)
186(100%)
Total 210(25%)
317(37%)
527(62%)
193(23%)
128(15%)
321(38%)
848(100%)
A-InjuriesState Roadways Local Roadways
Urban Rural Total Urban Rural Total Total
2010 858(46%)
295(16%)
1,153(61%)
537(29%)
187(10%)
724(39%)
1,877(100%)
2011 613(34%)
300(17%)
913(51%)
679(38%)
204(11%)
883(49%)
1,796(100%)
2012 564(29%)
383(20%)
947(48%)
809(41%)
205(10%)
1,014(52%)
1,961(100%)
2013 542(27%)
436(22%)
978(49%)
808(40%)
216(11%)
1,024(51%)
2,002(100%)
2014 459(23%)
521(27%)
980(50%)
751(38%)
226(12%)
977(50%)
1,957(100%)
Total 3,036(32%)
1,935(20%)
4,971(52%)
3,584(37%)
1,038(11%)
4,622(48%)
9,593(100%)
TABLE OD-01 Number of Fatalities in Older Driver Crashes on State and Local Urban/Rural Roadways from 2010 to 2014
TABLE OD-02 Number of A-Injuries in Older Driver Crashes on State and Local Urban/Rural Roadwaysfrom 2010 to 2014
From 2010 to 2014 more
than half of the older driver
fatalities (62%) and serious
injuries (52%) occurred on
state roadways as shown
in Table OD-01 and
Table OD-02. Slightly less
older-driver fatalities (48%)
occurred in urban areas while
significantly more of the
serious injuries (69%)
occurred in urban areas.
Issues and Contributing Factors to be Addressed
54Illinois Strategic Highway Safety Plan 2017 Older Driver
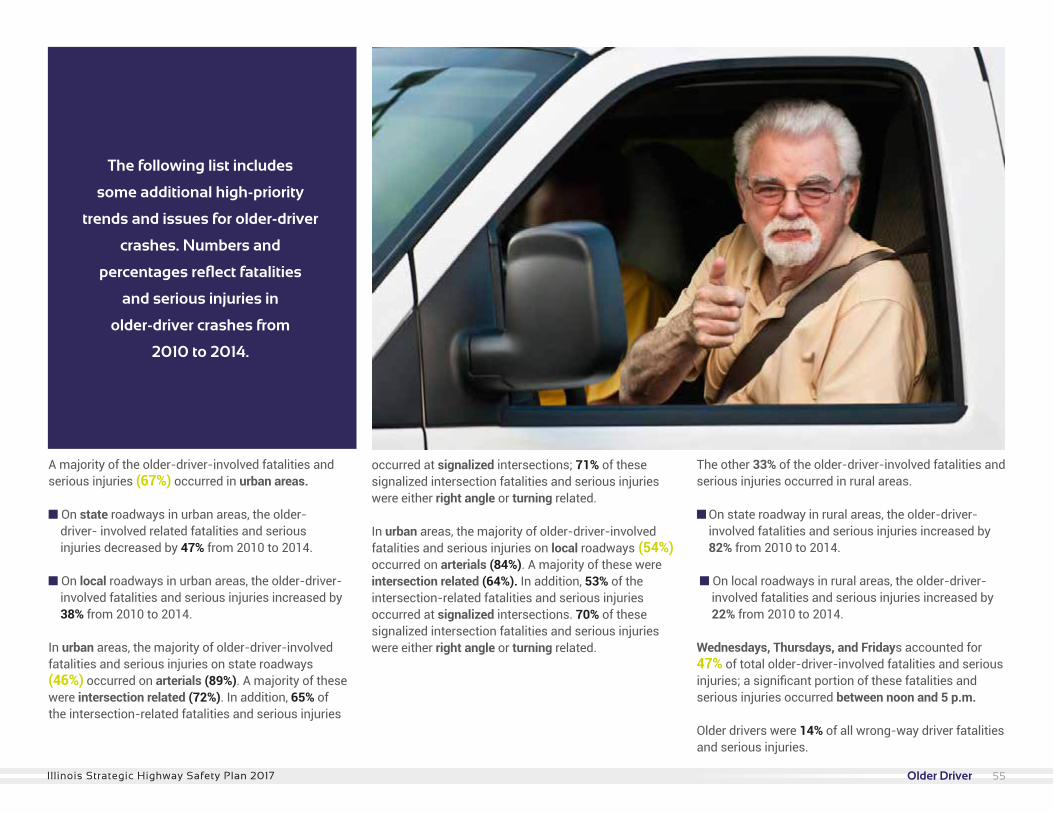
The following list includes
some additional high-priority
trends and issues for older-driver
crashes. Numbers and
percentages reflect fatalities
and serious injuries in
older-driver crashes from
2010 to 2014.
A majority of the older-driver-involved fatalities and serious injuries (67%) occurred in urban areas. n On state roadways in urban areas, the older- driver- involved related fatalities and serious injuries decreased by 47% from 2010 to 2014.
n On local roadways in urban areas, the older-driver- involved fatalities and serious injuries increased by 38% from 2010 to 2014.
In urban areas, the majority of older-driver-involved fatalities and serious injuries on state roadways (46%) occurred on arterials (89%). A majority of these were intersection related (72%). In addition, 65% of the intersection-related fatalities and serious injuries
occurred at signalized intersections; 71% of these signalized intersection fatalities and serious injuries were either right angle or turning related.
In urban areas, the majority of older-driver-involved fatalities and serious injuries on local roadways (54%) occurred on arterials (84%). A majority of these were intersection related (64%). In addition, 53% of the intersection-related fatalities and serious injuries occurred at signalized intersections. 70% of these signalized intersection fatalities and serious injuries were either right angle or turning related.
Young Driver
The other 33% of the older-driver-involved fatalities and serious injuries occurred in rural areas.
n On state roadway in rural areas, the older-driver- involved fatalities and serious injuries increased by 82% from 2010 to 2014.
n On local roadways in rural areas, the older-driver- involved fatalities and serious injuries increased by 22% from 2010 to 2014.
Wednesdays, Thursdays, and Fridays accounted for 47% of total older-driver-involved fatalities and serious injuries; a significant portion of these fatalities and serious injuries occurred between noon and 5 p.m.
Older drivers were 14% of all wrong-way driver fatalities and serious injuries.
55Illinois Strategic Highway Safety Plan 2017 Older Driver
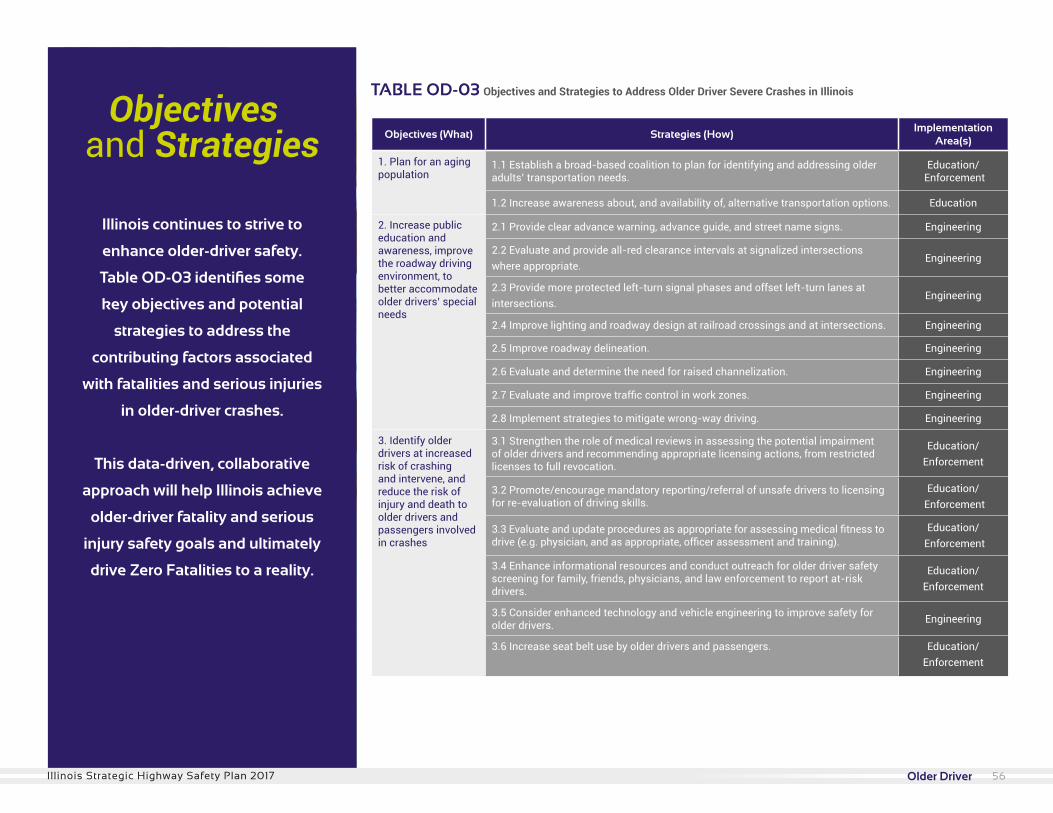
Objectives (What) Strategies (How)Implementation
Area(s)
1. Plan for an aging population
1.1 Establish a broad-based coalition to plan for identifying and addressing older adults’ transportation needs.
Education/ Enforcement
1.2 Increase awareness about, and availability of, alternative transportation options. Education
2. Increase public education and awareness, improve the roadway driving environment, to better accommodate older drivers’ special needs
2.1 Provide clear advance warning, advance guide, and street name signs. Engineering
2.2 Evaluate and provide all-red clearance intervals at signalized intersections where appropriate.
Engineering
2.3 Provide more protected left-turn signal phases and offset left-turn lanes at intersections.
Engineering
2.4 Improve lighting and roadway design at railroad crossings and at intersections. Engineering
2.5 Improve roadway delineation. Engineering
2.6 Evaluate and determine the need for raised channelization. Engineering
2.7 Evaluate and improve traffic control in work zones. Engineering
2.8 Implement strategies to mitigate wrong-way driving. Engineering
3. Identify older drivers at increased risk of crashing and intervene, and reduce the risk of injury and death to older drivers and passengers involved in crashes
3.1 Strengthen the role of medical reviews in assessing the potential impairment of older drivers and recommending appropriate licensing actions, from restricted licenses to full revocation.
Education/ Enforcement
3.2 Promote/encourage mandatory reporting/referral of unsafe drivers to licensing for re-evaluation of driving skills.
Education/ Enforcement
3.3 Evaluate and update procedures as appropriate for assessing medical fitness to drive (e.g. physician, and as appropriate, officer assessment and training).
Education/ Enforcement
3.4 Enhance informational resources and conduct outreach for older driver safety screening for family, friends, physicians, and law enforcement to report at-risk drivers.
Education/ Enforcement
3.5 Consider enhanced technology and vehicle engineering to improve safety for older drivers. Engineering
3.6 Increase seat belt use by older drivers and passengers. Education/ Enforcement
TABLE OD-03 Objectives and Strategies to Address Older Driver Severe Crashes in Illinois
Illinois continues to strive to
enhance older-driver safety.
Table OD-03 identifies some
key objectives and potential
strategies to address the
contributing factors associated
with fatalities and serious injuries
in older-driver crashes.
This data-driven, collaborative
approach will help Illinois achieve
older-driver fatality and serious
injury safety goals and ultimately
drive Zero Fatalities to a reality.
Objectivesand Strategies
56Illinois Strategic Highway Safety Plan 2017 Older Driver
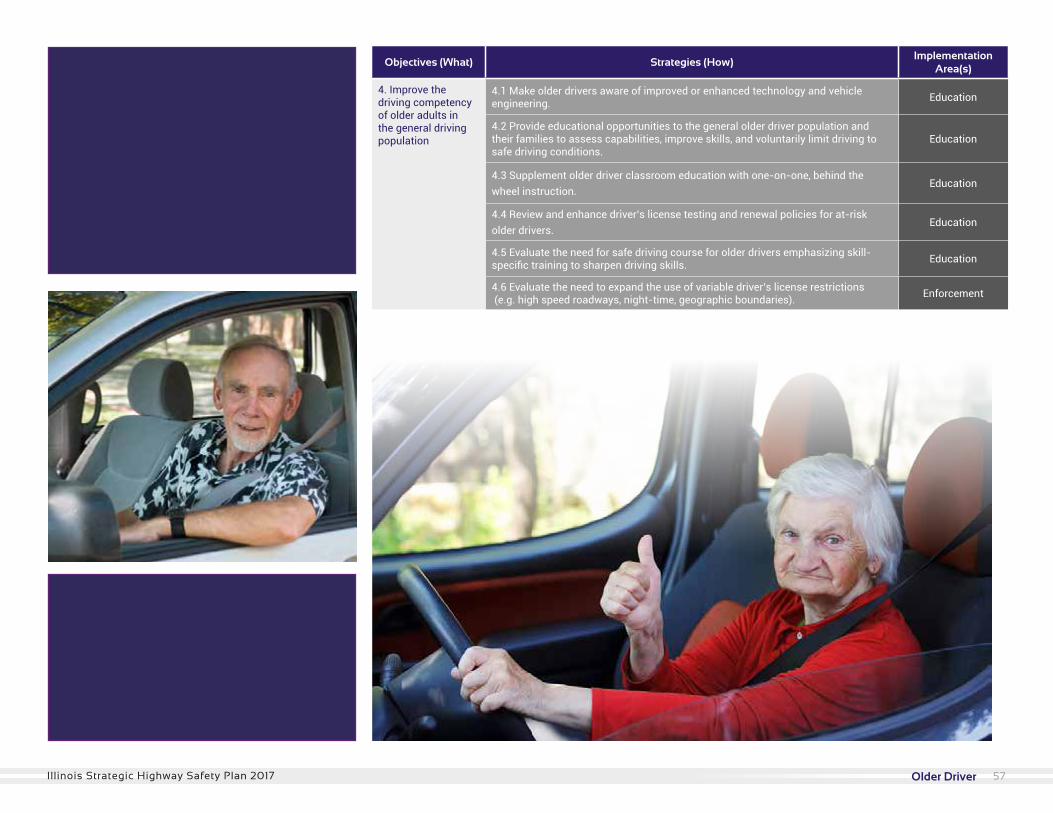
Objectives (What) Strategies (How)Implementation
Area(s)
4. Improve the driving competency of older adults in the general driving population
4.1 Make older drivers aware of improved or enhanced technology and vehicle engineering. Education
4.2 Provide educational opportunities to the general older driver population and their families to assess capabilities, improve skills, and voluntarily limit driving to safe driving conditions.
Education
4.3 Supplement older driver classroom education with one-on-one, behind the wheel instruction.
Education
4.4 Review and enhance driver’s license testing and renewal policies for at-risk older drivers.
Education
4.5 Evaluate the need for safe driving course for older drivers emphasizing skill-specific training to sharpen driving skills. Education
4.6 Evaluate the need to expand the use of variable driver’s license restrictions (e.g. high speed roadways, night-time, geographic boundaries). Enforcement
57Illinois Strategic Highway Safety Plan 2017 Older Driver

Young Driver
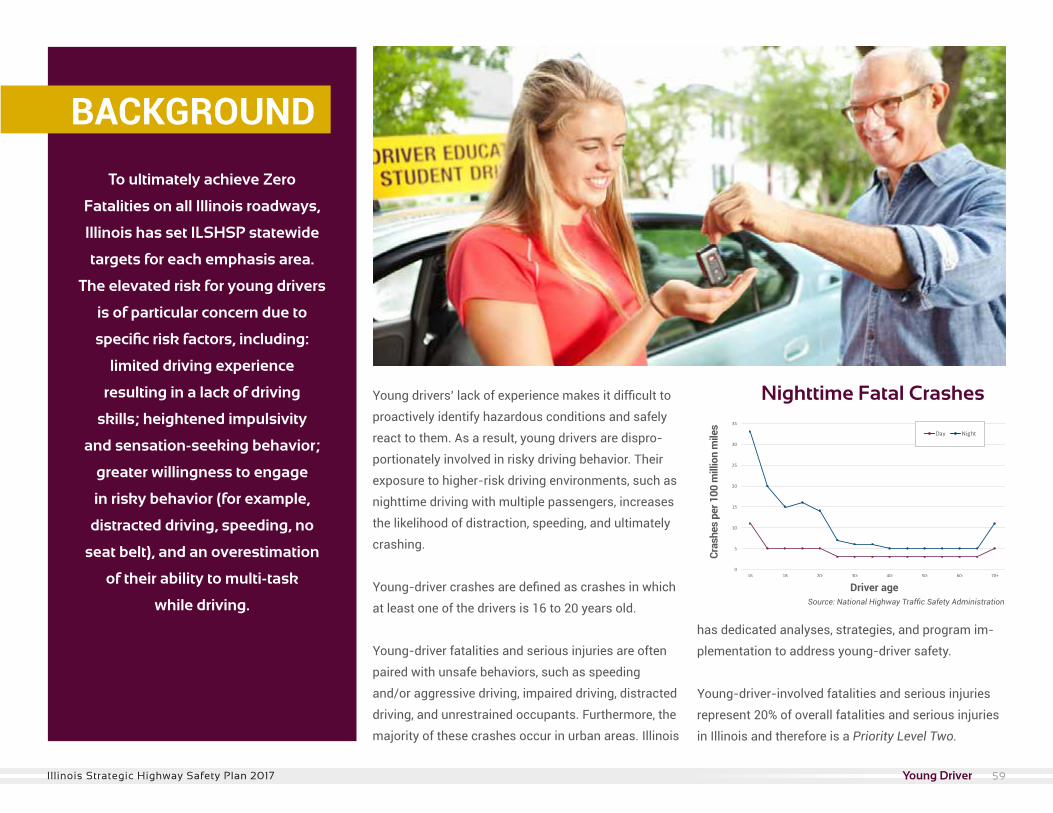
Young drivers’ lack of experience makes it difficult to
proactively identify hazardous conditions and safely
react to them. As a result, young drivers are dispro-
portionately involved in risky driving behavior. Their
exposure to higher-risk driving environments, such as
nighttime driving with multiple passengers, increases
the likelihood of distraction, speeding, and ultimately
crashing.
Young-driver crashes are defined as crashes in which
at least one of the drivers is 16 to 20 years old.
Young-driver fatalities and serious injuries are often
paired with unsafe behaviors, such as speeding
and/or aggressive driving, impaired driving, distracted
driving, and unrestrained occupants. Furthermore, the
majority of these crashes occur in urban areas. Illinois
has dedicated analyses, strategies, and program im-
plementation to address young-driver safety.
Young-driver-involved fatalities and serious injuries
represent 20% of overall fatalities and serious injuries
in Illinois and therefore is a Priority Level Two.
To ultimately achieve Zero
Fatalities on all Illinois roadways,
Illinois has set ILSHSP statewide
targets for each emphasis area.
The elevated risk for young drivers
is of particular concern due to
specific risk factors, including:
limited driving experience
resulting in a lack of driving
skills; heightened impulsivity
and sensation-seeking behavior;
greater willingness to engage
in risky behavior (for example,
distracted driving, speeding, no
seat belt), and an overestimation
of their ability to multi-task
while driving.
BACKGROUND
0
5
10
15
20
25
30
35
16 18 20- 30- 40- 50- 60- 70+
Day NightDriver age
Cras
hes
per 1
00 m
illio
n m
iles
Source: National Highway Traffic Safety Administration
Nighttime Fatal Crashes0
5
10
15
20
25
30
35
16 18 20-‐ 30-‐ 40-‐ 50-‐
Day Night
59Illinois Strategic Highway Safety Plan 2017 Young Driver
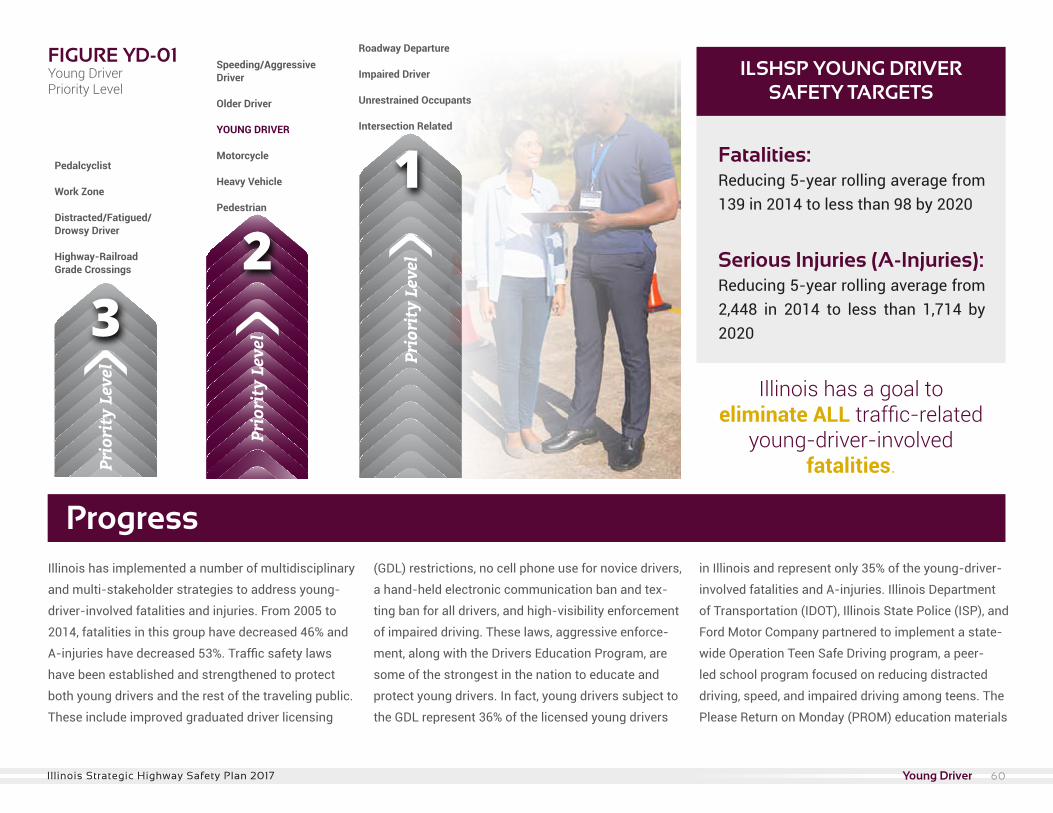
Pedalcyclist
Work Zone
Distracted/Fatigued/Drowsy Driver
Highway-Railroad Grade Crossings
Speeding/AggressiveDriver
Older Driver
YOUNG DRIVER
Motorcycle
Heavy Vehicle
Pedestrian
Roadway Departure
Impaired Driver
Unrestrained Occupants
Intersection Related
Fatalities: Reducing 5-year rolling average from 139 in 2014 to less than 98 by 2020
Serious Injuries (A-Injuries): Reducing 5-year rolling average from 2,448 in 2014 to less than 1,714 by 2020
FIGURE YD-01Young Driver Priority Level
ProgressIllinois has implemented a number of multidisciplinary
and multi-stakeholder strategies to address young-
driver-involved fatalities and injuries. From 2005 to
2014, fatalities in this group have decreased 46% and
A-injuries have decreased 53%. Traffic safety laws
have been established and strengthened to protect
both young drivers and the rest of the traveling public.
These include improved graduated driver licensing
(GDL) restrictions, no cell phone use for novice drivers,
a hand-held electronic communication ban and tex-
ting ban for all drivers, and high-visibility enforcement
of impaired driving. These laws, aggressive enforce-
ment, along with the Drivers Education Program, are
some of the strongest in the nation to educate and
protect young drivers. In fact, young drivers subject to
the GDL represent 36% of the licensed young drivers
in Illinois and represent only 35% of the young-driver-
involved fatalities and A-injuries. Illinois Department
of Transportation (IDOT), Illinois State Police (ISP), and
Ford Motor Company partnered to implement a state-
wide Operation Teen Safe Driving program, a peer-
led school program focused on reducing distracted
driving, speed, and impaired driving among teens. The
Please Return on Monday (PROM) education materials
ILSHSP YOUNG DRIVER SAFETY TARGETS
Illinois has a goal to eliminate ALL traffic-related
young-driver-involved fatalities.
60Illinois Strategic Highway Safety Plan 2017 Young Driver
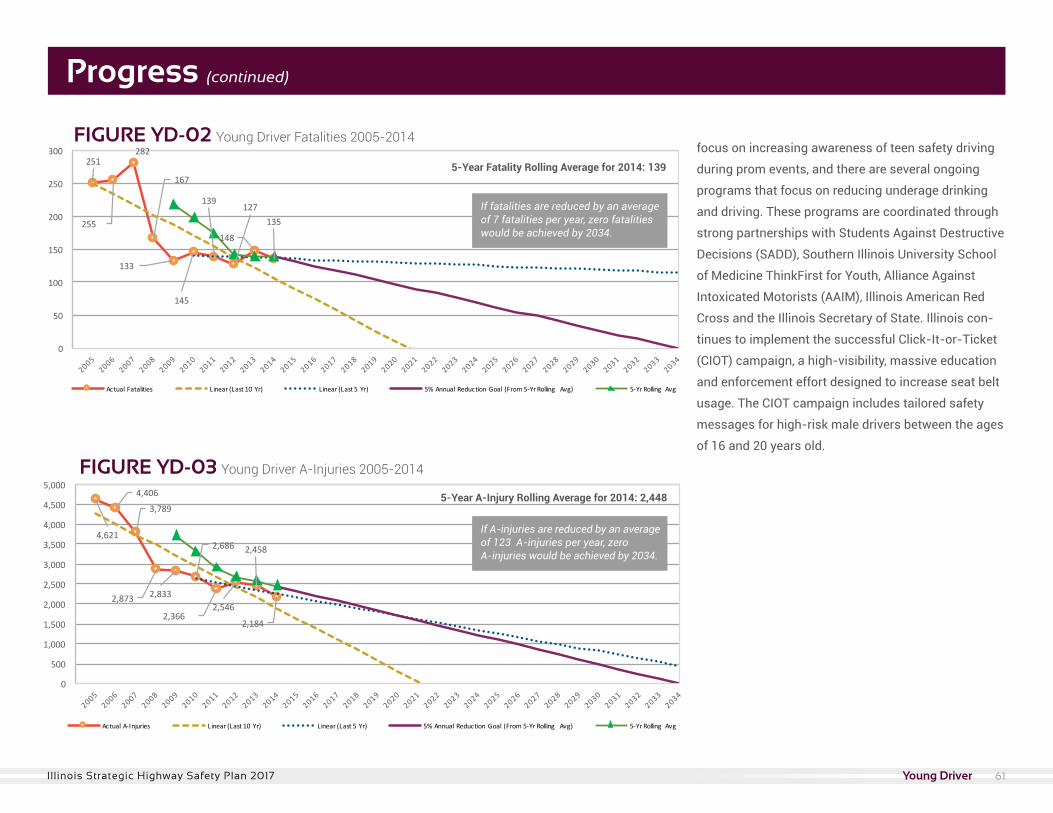
251
255
282
167
133
145
139127
148
135
0
50
100
150
200
250
300
ActualFatalities Linear(Last10Yr) Linear(Last5Yr) 5%AnnualReductionGoal (From5-YrRolling Avg) 5-YrRolling Avg
4,621
4,406
3,789
2,873 2,833
2,686
2,3662,546
2,458
2,184
0
500
1,000
1,500
2,000
2,500
3,000
3,500
4,000
4,500
5,000
ActualA-Injuries Linear(Last10Yr) Linear(Last5Yr) 5%AnnualReductionGoal (From5-YrRolling Avg) 5-YrRolling Avg
Progress (continued)
focus on increasing awareness of teen safety driving
during prom events, and there are several ongoing
programs that focus on reducing underage drinking
and driving. These programs are coordinated through
strong partnerships with Students Against Destructive
Decisions (SADD), Southern Illinois University School
of Medicine ThinkFirst for Youth, Alliance Against
Intoxicated Motorists (AAIM), Illinois American Red
Cross and the Illinois Secretary of State. Illinois con-
tinues to implement the successful Click-It-or-Ticket
(CIOT) campaign, a high-visibility, massive education
and enforcement effort designed to increase seat belt
usage. The CIOT campaign includes tailored safety
messages for high-risk male drivers between the ages
of 16 and 20 years old.
FIGURE YD-02 Young Driver Fatalities 2005-2014
If fatalities are reduced by an average of 7 fatalities per year, zero fatalities would be achieved by 2034.
FIGURE YD-03 Young Driver A-Injuries 2005-2014
If A-injuries are reduced by an average of 123 A-injuries per year, zero A-injuries would be achieved by 2034.
5-Year Fatality Rolling Average for 2014: 139
5-Year A-Injury Rolling Average for 2014: 2,448
61Illinois Strategic Highway Safety Plan 2017 Young Driver
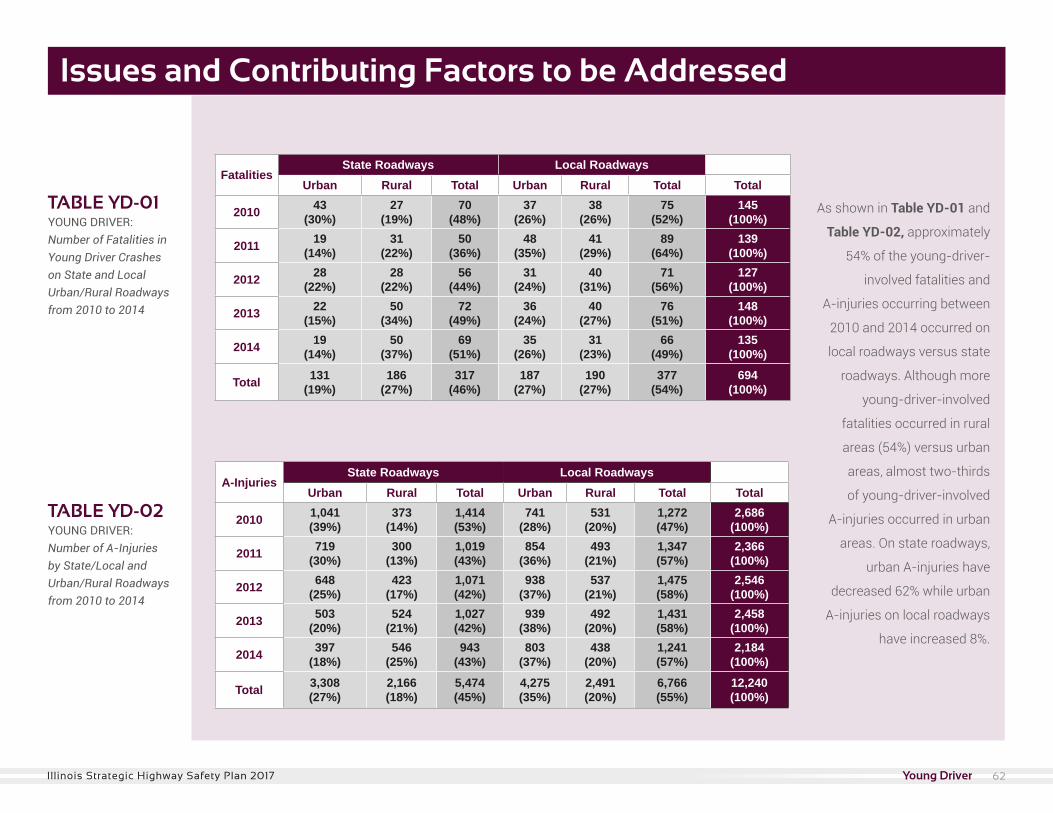
TABLE YD-01 YOUNG DRIVER: Number of Fatalities in Young Driver Crashes on State and Local Urban/Rural Roadways from 2010 to 2014
TABLE YD-02 YOUNG DRIVER: Number of A-Injuries by State/Local and Urban/Rural Roadways from 2010 to 2014
Issues and Contributing Factors to be Addressed
As shown in Table YD-01 and
Table YD-02, approximately
54% of the young-driver-
involved fatalities and
A-injuries occurring between
2010 and 2014 occurred on
local roadways versus state
roadways. Although more
young-driver-involved
fatalities occurred in rural
areas (54%) versus urban
areas, almost two-thirds
of young-driver-involved
A-injuries occurred in urban
areas. On state roadways,
urban A-injuries have
decreased 62% while urban
A-injuries on local roadways
have increased 8%.
FatalitiesState Roadways Local Roadways
Urban Rural Total Urban Rural Total Total
2010 43(30%)
27(19%)
70(48%)
37(26%)
38(26%)
75(52%)
145(100%)
2011 19(14%)
31(22%)
50(36%)
48(35%)
41(29%)
89(64%)
139(100%)
2012 28(22%)
28(22%)
56(44%)
31(24%)
40(31%)
71(56%)
127(100%)
2013 22(15%)
50(34%)
72(49%)
36(24%)
40(27%)
76(51%)
148(100%)
2014 19(14%)
50(37%)
69(51%)
35(26%)
31(23%)
66(49%)
135(100%)
Total 131(19%)
186(27%)
317(46%)
187(27%)
190(27%)
377(54%)
694(100%)
A-InjuriesState Roadways Local Roadways
Urban Rural Total Urban Rural Total Total
2010 1,041(39%)
373(14%)
1,414(53%)
741(28%)
531(20%)
1,272(47%)
2,686(100%)
2011 719(30%)
300(13%)
1,019(43%)
854(36%)
493(21%)
1,347(57%)
2,366(100%)
2012 648(25%)
423(17%)
1,071(42%)
938(37%)
537(21%)
1,475(58%)
2,546(100%)
2013 503(20%)
524(21%)
1,027(42%)
939(38%)
492(20%)
1,431(58%)
2,458(100%)
2014 397(18%)
546(25%)
943(43%)
803(37%)
438(20%)
1,241(57%)
2,184(100%)
Total 3,308(27%)
2,166(18%)
5,474(45%)
4,275(35%)
2,491(20%)
6,766(55%)
12,240(100%)
62Illinois Strategic Highway Safety Plan 2017 Young Driver
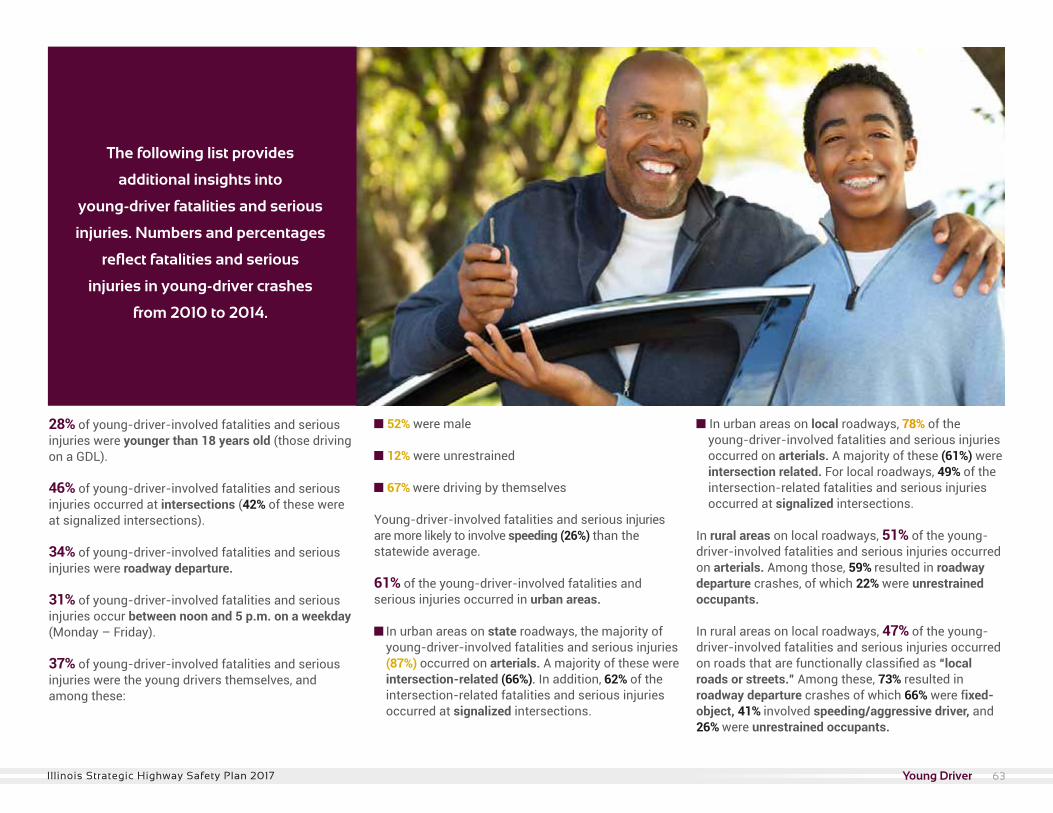
Young Driver
The following list provides
additional insights into
young-driver fatalities and serious
injuries. Numbers and percentages
reflect fatalities and serious
injuries in young-driver crashes
from 2010 to 2014.
28% of young-driver-involved fatalities and serious injuries were younger than 18 years old (those driving on a GDL). 46% of young-driver-involved fatalities and serious injuries occurred at intersections (42% of these were at signalized intersections).
34% of young-driver-involved fatalities and serious injuries were roadway departure. 31% of young-driver-involved fatalities and serious injuries occur between noon and 5 p.m. on a weekday (Monday – Friday).
37% of young-driver-involved fatalities and serious injuries were the young drivers themselves, and among these:
n 52% were male
n 12% were unrestrained
n 67% were driving by themselves
Young-driver-involved fatalities and serious injuries are more likely to involve speeding (26%) than the statewide average.
61% of the young-driver-involved fatalities and serious injuries occurred in urban areas.
n In urban areas on state roadways, the majority of young-driver-involved fatalities and serious injuries (87%) occurred on arterials. A majority of these were intersection-related (66%). In addition, 62% of the intersection-related fatalities and serious injuries occurred at signalized intersections.
n In urban areas on local roadways, 78% of the young-driver-involved fatalities and serious injuries occurred on arterials. A majority of these (61%) were intersection related. For local roadways, 49% of the intersection-related fatalities and serious injuries occurred at signalized intersections.
In rural areas on local roadways, 51% of the young-driver-involved fatalities and serious injuries occurred on arterials. Among those, 59% resulted in roadway departure crashes, of which 22% were unrestrained occupants.
In rural areas on local roadways, 47% of the young-driver-involved fatalities and serious injuries occurred on roads that are functionally classified as “local roads or streets.” Among these, 73% resulted in roadway departure crashes of which 66% were fixed-object, 41% involved speeding/aggressive driver, and 26% were unrestrained occupants.
63Illinois Strategic Highway Safety Plan 2017 Young Driver
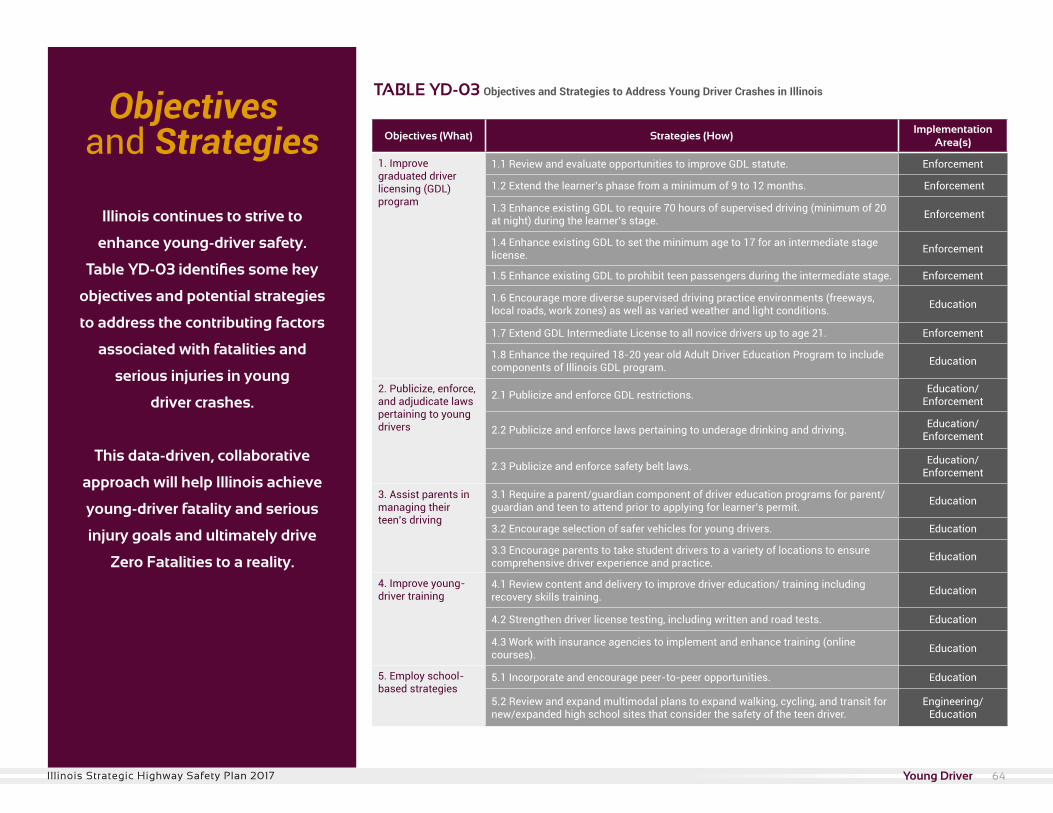
Young Driver
Objectives (What) Strategies (How)Implementation
Area(s)
1. Improve graduated driver licensing (GDL) program
1.1 Review and evaluate opportunities to improve GDL statute. Enforcement
1.2 Extend the learner’s phase from a minimum of 9 to 12 months. Enforcement
1.3 Enhance existing GDL to require 70 hours of supervised driving (minimum of 20 at night) during the learner’s stage. Enforcement
1.4 Enhance existing GDL to set the minimum age to 17 for an intermediate stage license. Enforcement
1.5 Enhance existing GDL to prohibit teen passengers during the intermediate stage. Enforcement
1.6 Encourage more diverse supervised driving practice environments (freeways, local roads, work zones) as well as varied weather and light conditions. Education
1.7 Extend GDL Intermediate License to all novice drivers up to age 21. Enforcement
1.8 Enhance the required 18-20 year old Adult Driver Education Program to include components of Illinois GDL program. Education
2. Publicize, enforce, and adjudicate laws pertaining to young drivers
2.1 Publicize and enforce GDL restrictions. Education/ Enforcement
2.2 Publicize and enforce laws pertaining to underage drinking and driving. Education/ Enforcement
2.3 Publicize and enforce safety belt laws. Education/ Enforcement
3. Assist parents in managing their teen’s driving
3.1 Require a parent/guardian component of driver education programs for parent/guardian and teen to attend prior to applying for learner’s permit. Education
3.2 Encourage selection of safer vehicles for young drivers. Education
3.3 Encourage parents to take student drivers to a variety of locations to ensure comprehensive driver experience and practice. Education
4. Improve young-driver training
4.1 Review content and delivery to improve driver education/ training including recovery skills training. Education
4.2 Strengthen driver license testing, including written and road tests. Education
4.3 Work with insurance agencies to implement and enhance training (online courses). Education
5. Employ school-based strategies
5.1 Incorporate and encourage peer-to-peer opportunities. Education
5.2 Review and expand multimodal plans to expand walking, cycling, and transit for new/expanded high school sites that consider the safety of the teen driver.
Engineering/Education
TABLE YD-03 Objectives and Strategies to Address Young Driver Crashes in Illinois
Illinois continues to strive to
enhance young-driver safety.
Table YD-03 identifies some key
objectives and potential strategies
to address the contributing factors
associated with fatalities and
serious injuries in young
driver crashes.
This data-driven, collaborative
approach will help Illinois achieve
young-driver fatality and serious
injury goals and ultimately drive
Zero Fatalities to a reality.
Objectivesand Strategies
64Illinois Strategic Highway Safety Plan 2017 Young Driver
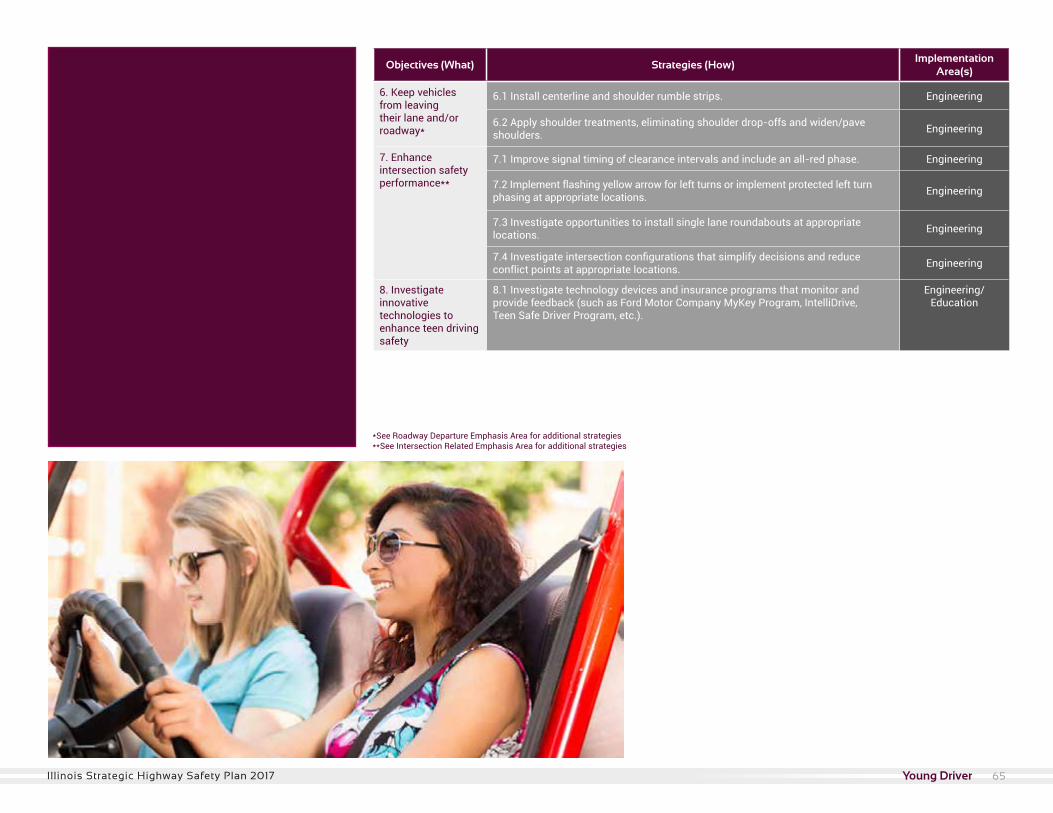
Objectives (What) Strategies (How)Implementation
Area(s)
6. Keep vehicles from leaving their lane and/or roadway*
6.1 Install centerline and shoulder rumble strips. Engineering
6.2 Apply shoulder treatments, eliminating shoulder drop-offs and widen/pave shoulders. Engineering
7. Enhance intersection safety performance**
7.1 Improve signal timing of clearance intervals and include an all-red phase. Engineering
7.2 Implement flashing yellow arrow for left turns or implement protected left turn phasing at appropriate locations. Engineering
7.3 Investigate opportunities to install single lane roundabouts at appropriate locations. Engineering
7.4 Investigate intersection configurations that simplify decisions and reduce conflict points at appropriate locations. Engineering
8. Investigate innovative technologies to enhance teen driving safety
8.1 Investigate technology devices and insurance programs that monitor and provide feedback (such as Ford Motor Company MyKey Program, IntelliDrive, Teen Safe Driver Program, etc.).
Engineering/Education
*See Roadway Departure Emphasis Area for additional strategies**See Intersection Related Emphasis Area for additional strategies
65Illinois Strategic Highway Safety Plan 2017 Young Driver
Motorcycle
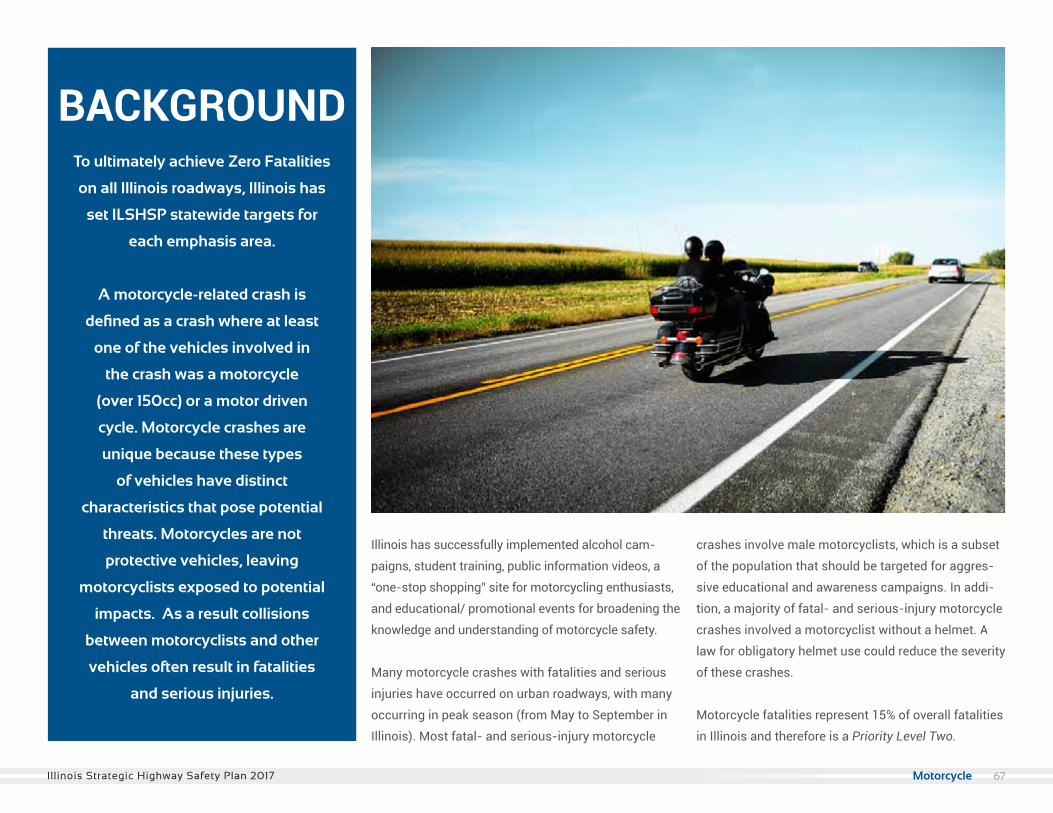
To ultimately achieve Zero Fatalities
on all Illinois roadways, Illinois has
set ILSHSP statewide targets for
each emphasis area.
A motorcycle-related crash is
defined as a crash where at least
one of the vehicles involved in
the crash was a motorcycle
(over 150cc) or a motor driven
cycle. Motorcycle crashes are
unique because these types
of vehicles have distinct
characteristics that pose potential
threats. Motorcycles are not
protective vehicles, leaving
motorcyclists exposed to potential
impacts. As a result collisions
between motorcyclists and other
vehicles often result in fatalities
and serious injuries.
Illinois has successfully implemented alcohol cam-
paigns, student training, public information videos, a
“one-stop shopping” site for motorcycling enthusiasts,
and educational/ promotional events for broadening the
knowledge and understanding of motorcycle safety.
Many motorcycle crashes with fatalities and serious
injuries have occurred on urban roadways, with many
occurring in peak season (from May to September in
Illinois). Most fatal- and serious-injury motorcycle
crashes involve male motorcyclists, which is a subset
of the population that should be targeted for aggres-
sive educational and awareness campaigns. In addi-
tion, a majority of fatal- and serious-injury motorcycle
crashes involved a motorcyclist without a helmet. A
law for obligatory helmet use could reduce the severity
of these crashes.
Motorcycle fatalities represent 15% of overall fatalities
in Illinois and therefore is a Priority Level Two.
BACKGROUND
67Illinois Strategic Highway Safety Plan 2017 Motorcycle
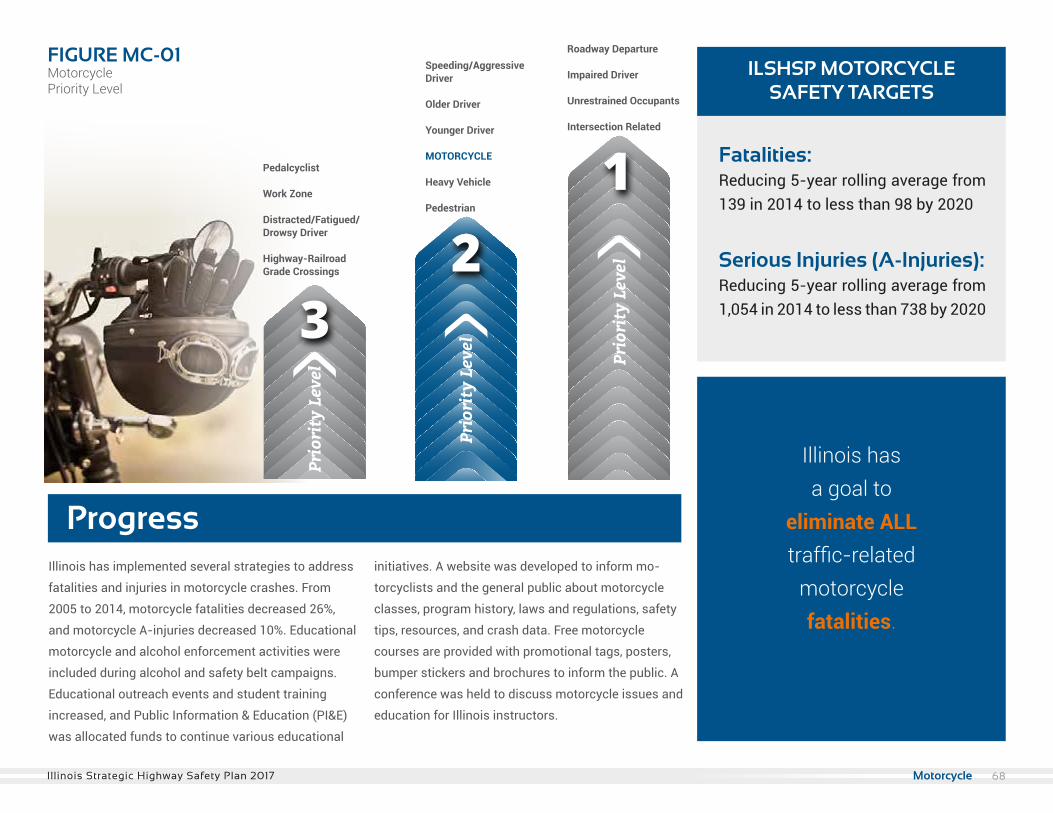
Fatalities: Reducing 5-year rolling average from 139 in 2014 to less than 98 by 2020
Serious Injuries (A-Injuries): Reducing 5-year rolling average from 1,054 in 2014 to less than 738 by 2020
FIGURE MC-01Motorcycle Priority Level
ProgressIllinois has implemented several strategies to address
fatalities and injuries in motorcycle crashes. From
2005 to 2014, motorcycle fatalities decreased 26%,
and motorcycle A-injuries decreased 10%. Educational
motorcycle and alcohol enforcement activities were
included during alcohol and safety belt campaigns.
Educational outreach events and student training
increased, and Public Information & Education (PI&E)
was allocated funds to continue various educational
initiatives. A website was developed to inform mo-
torcyclists and the general public about motorcycle
classes, program history, laws and regulations, safety
tips, resources, and crash data. Free motorcycle
courses are provided with promotional tags, posters,
bumper stickers and brochures to inform the public. A
conference was held to discuss motorcycle issues and
education for Illinois instructors.
ILSHSP MOTORCYCLE SAFETY TARGETS
Illinois has a goal to
eliminate ALL traffic-related
motorcycle fatalities.
Pedalcyclist
Work Zone
Distracted/Fatigued/Drowsy Driver
Highway-RailroadGrade Crossings
Speeding/AggressiveDriver
Older Driver
Younger Driver
MOTORCYCLE
Heavy Vehicle
Pedestrian
Roadway Departure
Impaired Driver
Unrestrained Occupants
Intersection Related
68Illinois Strategic Highway Safety Plan 2017 Motorcycle
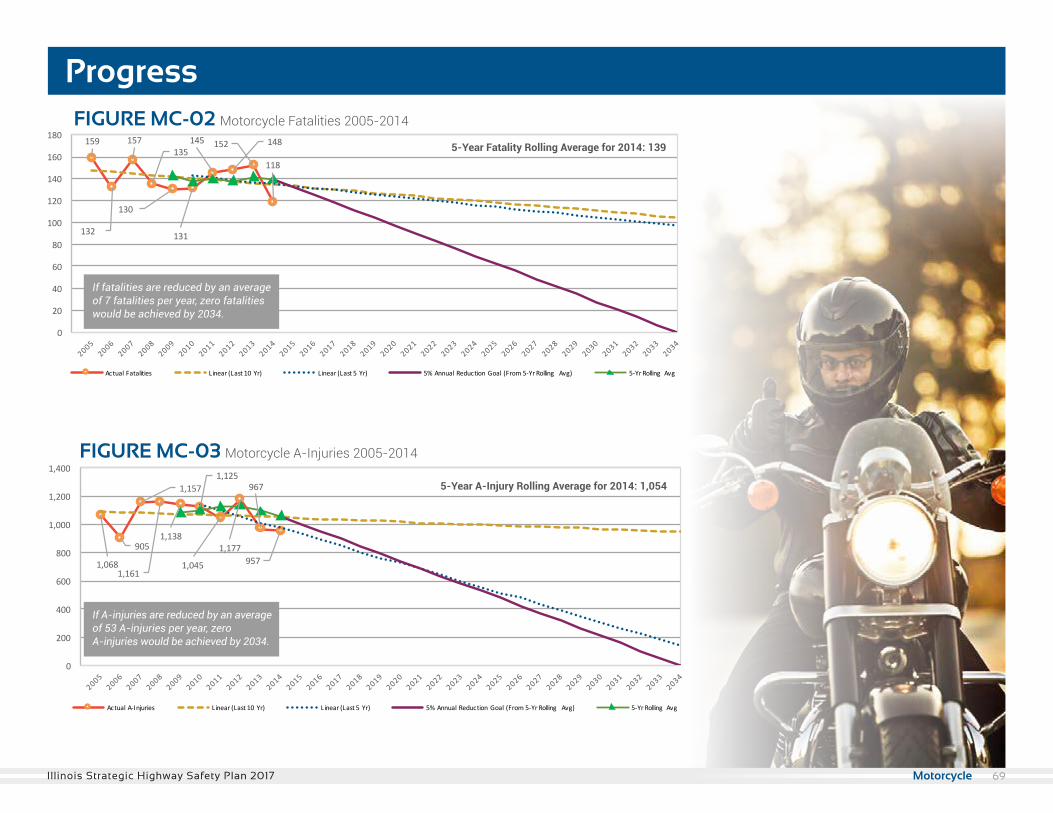
Progress
159
132
157135
130
131
145 148152
118
0
20
40
60
80
100
120
140
160
180
ActualFatalities Linear(Last10Yr) Linear(Last5Yr) 5%AnnualReductionGoal (From5-YrRolling Avg) 5-YrRolling Avg
1,068
905
1,157
1,161
1,138
1,125
1,045
1,177
967
957
0
200
400
600
800
1,000
1,200
1,400
ActualA-Injuries Linear(Last10Yr) Linear(Last5Yr) 5%AnnualReductionGoal (From5-YrRolling Avg) 5-YrRolling Avg
FIGURE MC-02 Motorcycle Fatalities 2005-2014
159
132
157135
130
131
145 148152
118
0
20
40
60
80
100
120
140
160
180
ActualFatalities Linear(Last10Yr) Linear(Last5Yr) 5%AnnualReductionGoal (From5-YrRolling Avg) 5-YrRolling Avg
1,068
905
1,157
1,161
1,138
1,125
1,045
1,177
967
957
0
200
400
600
800
1,000
1,200
1,400
ActualA-Injuries Linear(Last10Yr) Linear(Last5Yr) 5%AnnualReductionGoal (From5-YrRolling Avg) 5-YrRolling Avg
If fatalities are reduced by an average of 7 fatalities per year, zero fatalities would be achieved by 2034.
FIGURE MC-03 Motorcycle A-Injuries 2005-2014
If A-injuries are reduced by an average of 53 A-injuries per year, zero A-injuries would be achieved by 2034.
5-Year Fatality Rolling Average for 2014: 139
5-Year A-Injury Rolling Average for 2014: 1,054
69Illinois Strategic Highway Safety Plan 2017 Motorcycle
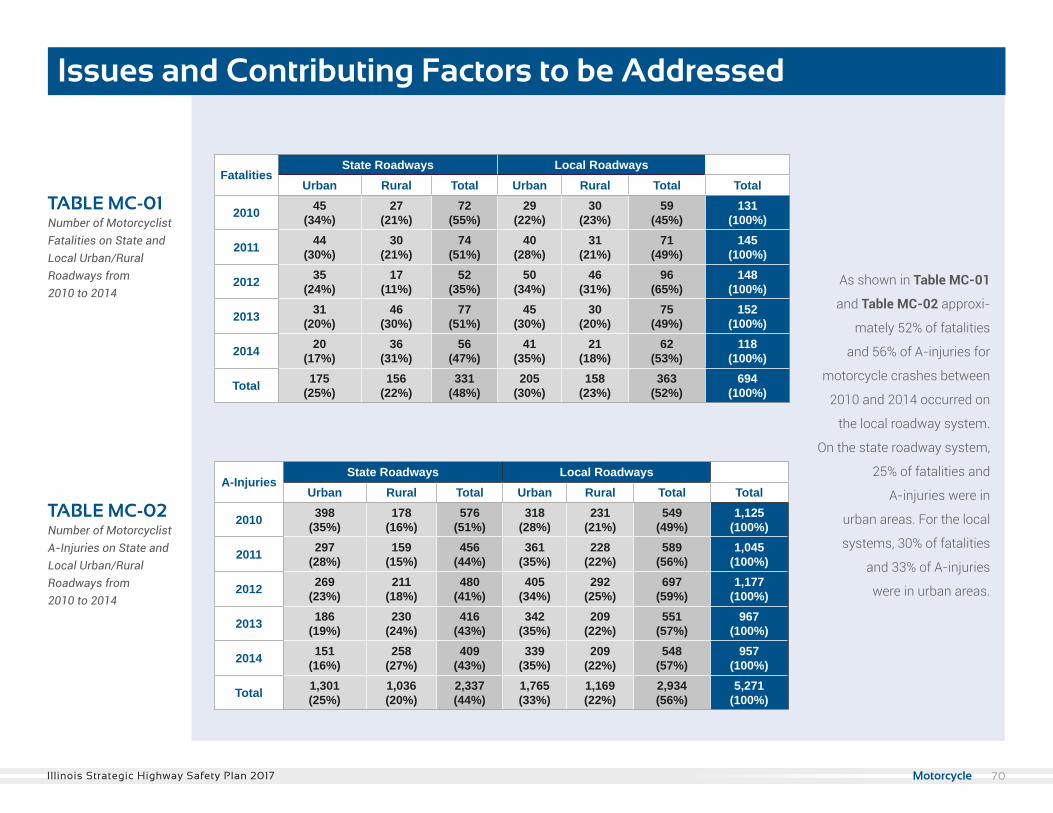
FatalitiesState Roadways Local Roadways
Urban Rural Total Urban Rural Total Total
2010 45(34%)
27(21%)
72(55%)
29(22%)
30(23%)
59(45%)
131(100%)
2011 44(30%)
30(21%)
74(51%)
40(28%)
31(21%)
71(49%)
145(100%)
2012 35(24%)
17(11%)
52(35%)
50(34%)
46(31%)
96(65%)
148(100%)
2013 31(20%)
46(30%)
77(51%)
45(30%)
30(20%)
75(49%)
152(100%)
2014 20(17%)
36(31%)
56(47%)
41(35%)
21(18%)
62(53%)
118(100%)
Total 175(25%)
156(22%)
331(48%)
205(30%)
158(23%)
363(52%)
694(100%)
A-InjuriesState Roadways Local Roadways
Urban Rural Total Urban Rural Total Total
2010 398(35%)
178(16%)
576(51%)
318(28%)
231(21%)
549(49%)
1,125(100%)
2011 297(28%)
159(15%)
456(44%)
361(35%)
228(22%)
589(56%)
1,045(100%)
2012 269(23%)
211(18%)
480(41%)
405(34%)
292(25%)
697(59%)
1,177(100%)
2013 186(19%)
230(24%)
416(43%)
342(35%)
209(22%)
551(57%)
967(100%)
2014 151(16%)
258(27%)
409(43%)
339(35%)
209(22%)
548(57%)
957(100%)
Total 1,301(25%)
1,036(20%)
2,337(44%)
1,765(33%)
1,169(22%)
2,934(56%)
5,271(100%)
TABLE MC-01 Number of Motorcyclist Fatalities on State and Local Urban/Rural Roadways from 2010 to 2014
TABLE MC-02 Number of Motorcyclist A-Injuries on State and Local Urban/Rural Roadways from 2010 to 2014
As shown in Table MC-01
and Table MC-02 approxi-
mately 52% of fatalities
and 56% of A-injuries for
motorcycle crashes between
2010 and 2014 occurred on
the local roadway system.
On the state roadway system,
25% of fatalities and
A-injuries were in
urban areas. For the local
systems, 30% of fatalities
and 33% of A-injuries
were in urban areas.
Issues and Contributing Factors to be Addressed
Older Driver 70Illinois Strategic Highway Safety Plan 2017 Motorcycle
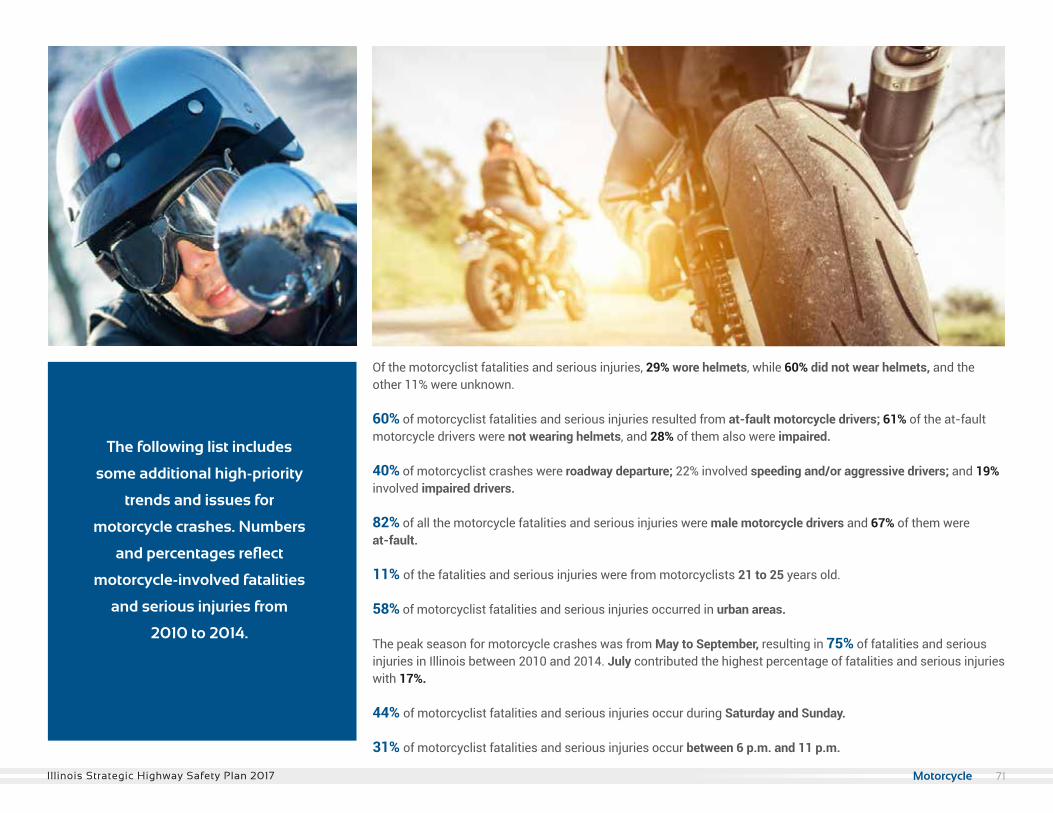
The following list includes
some additional high-priority
trends and issues for
motorcycle crashes. Numbers
and percentages reflect
motorcycle-involved fatalities
and serious injuries from
2010 to 2014.
Of the motorcyclist fatalities and serious injuries, 29% wore helmets, while 60% did not wear helmets, and the other 11% were unknown. 60% of motorcyclist fatalities and serious injuries resulted from at-fault motorcycle drivers; 61% of the at-fault motorcycle drivers were not wearing helmets, and 28% of them also were impaired. 40% of motorcyclist crashes were roadway departure; 22% involved speeding and/or aggressive drivers; and 19% involved impaired drivers. 82% of all the motorcycle fatalities and serious injuries were male motorcycle drivers and 67% of them wereat-fault. 11% of the fatalities and serious injuries were from motorcyclists 21 to 25 years old. 58% of motorcyclist fatalities and serious injuries occurred in urban areas.
The peak season for motorcycle crashes was from May to September, resulting in 75% of fatalities and serious injuries in Illinois between 2010 and 2014. July contributed the highest percentage of fatalities and serious injuries with 17%.
44% of motorcyclist fatalities and serious injuries occur during Saturday and Sunday. 31% of motorcyclist fatalities and serious injuries occur between 6 p.m. and 11 p.m.
Work Zone 71Illinois Strategic Highway Safety Plan 2017 Motorcycle
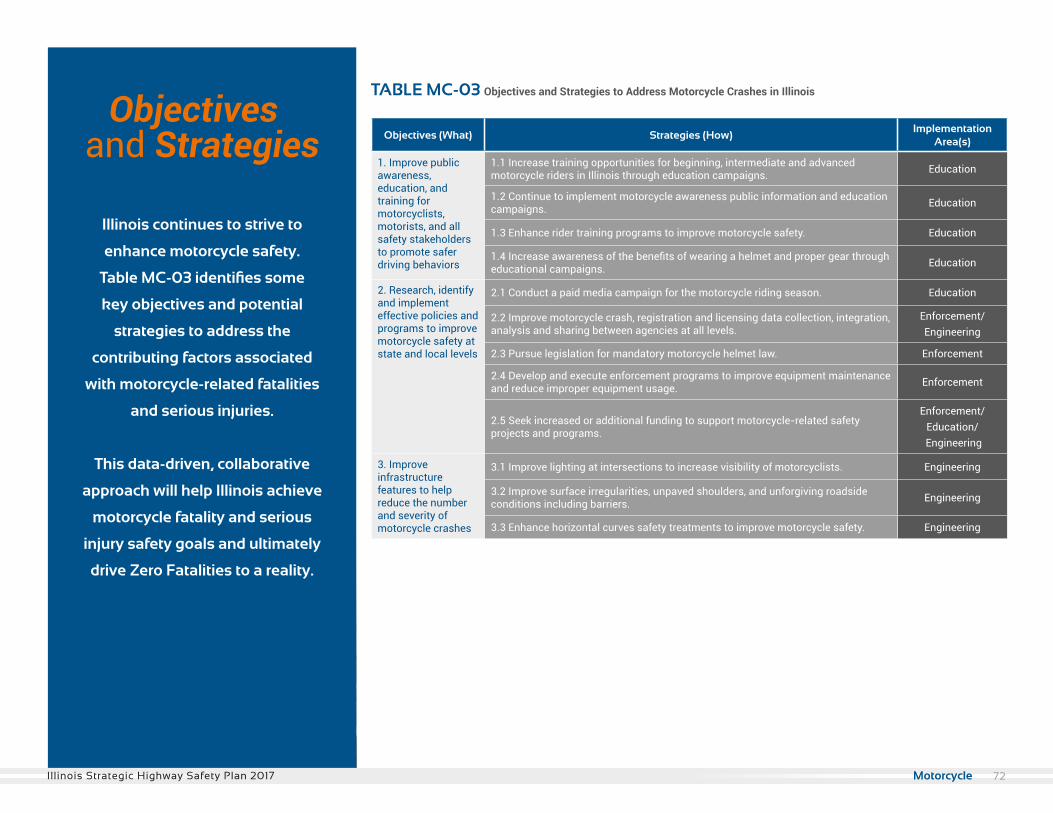
Objectives (What) Strategies (How)Implementation
Area(s)
1. Improve public awareness, education, and training for motorcyclists, motorists, and all safety stakeholders to promote safer driving behaviors
1.1 Increase training opportunities for beginning, intermediate and advanced motorcycle riders in Illinois through education campaigns. Education
1.2 Continue to implement motorcycle awareness public information and education campaigns. Education
1.3 Enhance rider training programs to improve motorcycle safety. Education
1.4 Increase awareness of the benefits of wearing a helmet and proper gear through educational campaigns. Education
2. Research, identify and implement effective policies and programs to improve motorcycle safety at state and local levels
2.1 Conduct a paid media campaign for the motorcycle riding season. Education
2.2 Improve motorcycle crash, registration and licensing data collection, integration, analysis and sharing between agencies at all levels.
Enforcement/ Engineering
2.3 Pursue legislation for mandatory motorcycle helmet law. Enforcement
2.4 Develop and execute enforcement programs to improve equipment maintenance and reduce improper equipment usage. Enforcement
2.5 Seek increased or additional funding to support motorcycle-related safety projects and programs.
Enforcement/ Education/
Engineering
3. Improve infrastructure features to help reduce the number and severity of motorcycle crashes
3.1 Improve lighting at intersections to increase visibility of motorcyclists. Engineering
3.2 Improve surface irregularities, unpaved shoulders, and unforgiving roadside conditions including barriers. Engineering
3.3 Enhance horizontal curves safety treatments to improve motorcycle safety. Engineering
TABLE MC-03 Objectives and Strategies to Address Motorcycle Crashes in Illinois
Illinois continues to strive to
enhance motorcycle safety.
Table MC-03 identifies some
key objectives and potential
strategies to address the
contributing factors associated
with motorcycle-related fatalities
and serious injuries.
This data-driven, collaborative
approach will help Illinois achieve
motorcycle fatality and serious
injury safety goals and ultimately
drive Zero Fatalities to a reality.
Objectivesand Strategies
Older Driver 72Illinois Strategic Highway Safety Plan 2017 Motorcycle
Heavy Vehicle
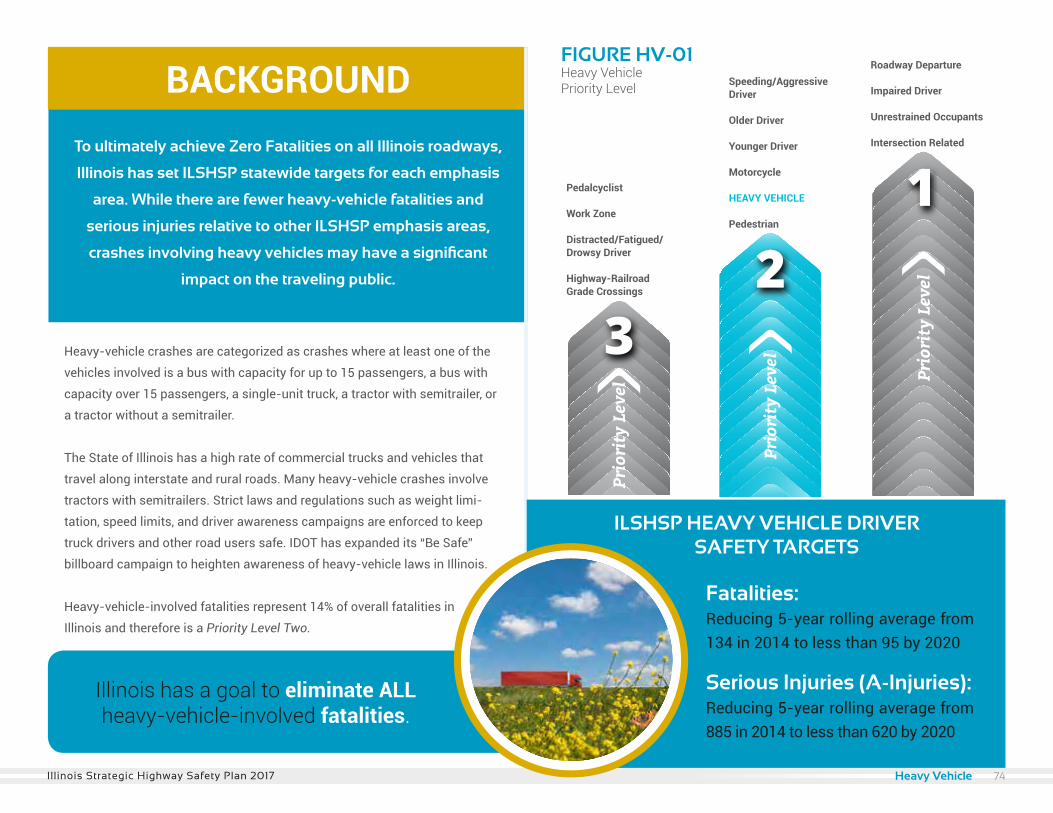
Heavy-vehicle crashes are categorized as crashes where at least one of the
vehicles involved is a bus with capacity for up to 15 passengers, a bus with
capacity over 15 passengers, a single-unit truck, a tractor with semitrailer, or
a tractor without a semitrailer.
The State of Illinois has a high rate of commercial trucks and vehicles that
travel along interstate and rural roads. Many heavy-vehicle crashes involve
tractors with semitrailers. Strict laws and regulations such as weight limi-
tation, speed limits, and driver awareness campaigns are enforced to keep
truck drivers and other road users safe. IDOT has expanded its “Be Safe”
billboard campaign to heighten awareness of heavy-vehicle laws in Illinois.
Heavy-vehicle-involved fatalities represent 14% of overall fatalities in
Illinois and therefore is a Priority Level Two.
To ultimately achieve Zero Fatalities on all Illinois roadways,
Illinois has set ILSHSP statewide targets for each emphasis
area. While there are fewer heavy-vehicle fatalities and
serious injuries relative to other ILSHSP emphasis areas,
crashes involving heavy vehicles may have a significant
impact on the traveling public.
BACKGROUND
Pedalcyclist
Work Zone
Distracted/Fatigued/Drowsy Driver
Highway-RailroadGrade Crossings
Speeding/AggressiveDriver
Older Driver
Younger Driver
Motorcycle
HEAVY VEHICLE
Pedestrian
Roadway Departure
Impaired Driver
Unrestrained Occupants
Intersection Related
Fatalities: Reducing 5-year rolling average from 134 in 2014 to less than 95 by 2020
Serious Injuries (A-Injuries): Reducing 5-year rolling average from 885 in 2014 to less than 620 by 2020
FIGURE HV-01Heavy VehiclePriority Level
ILSHSP HEAVY VEHICLE DRIVER SAFETY TARGETS
Illinois has a goal to eliminate ALL heavy-vehicle-involved fatalities.
74Illinois Strategic Highway Safety Plan 2017 Heavy Vehicle
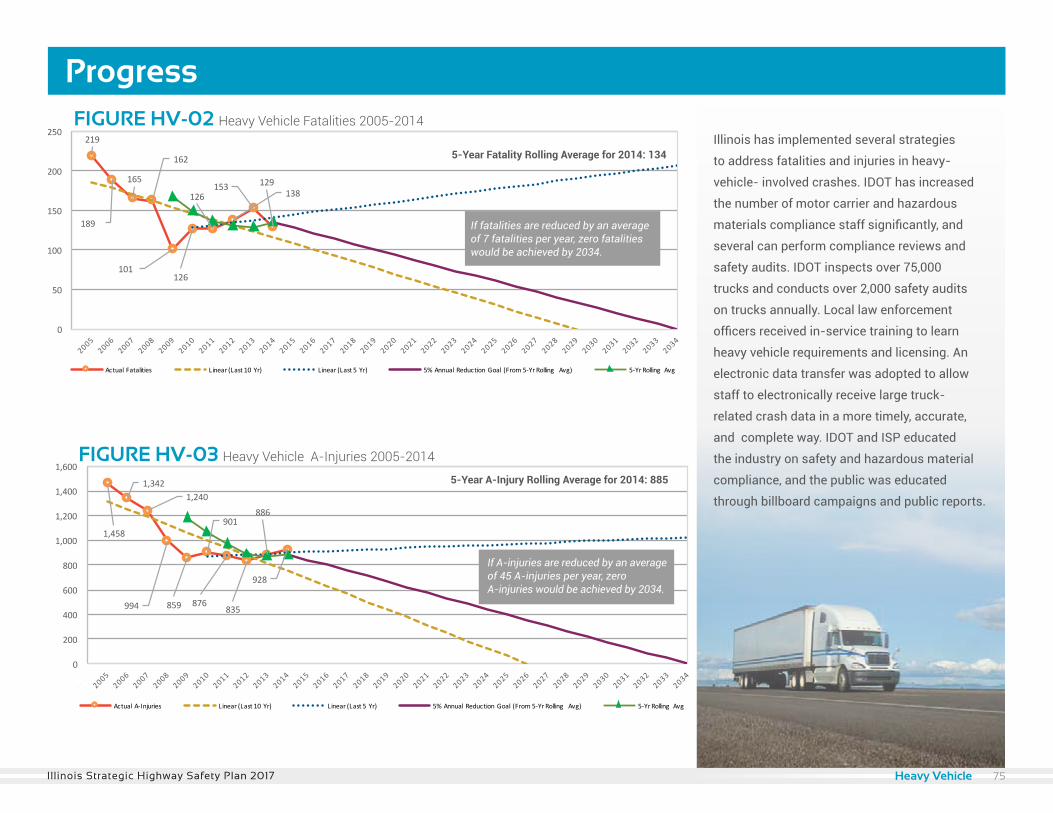
Progress
219
189
165
162
101126
126 138153 129
0
50
100
150
200
250
ActualFatalities Linear(Last10Yr) Linear(Last5Yr) 5%AnnualReductionGoal (From5-YrRolling Avg) 5-YrRolling Avg
1,458
1,3421,240
994 859
901
876835
886
928
0
200
400
600
800
1,000
1,200
1,400
1,600
ActualA-Injuries Linear(Last10Yr) Linear(Last5Yr) 5%AnnualReductionGoal (From5-YrRolling Avg) 5-YrRolling Avg
FIGURE HV-02 Heavy Vehicle Fatalities 2005-2014
219
189
165
162
101126
126 138153 129
0
50
100
150
200
250
ActualFatalities Linear(Last10Yr) Linear(Last5Yr) 5%AnnualReductionGoal (From5-YrRolling Avg) 5-YrRolling Avg
1,458
1,3421,240
994 859
901
876835
886
928
0
200
400
600
800
1,000
1,200
1,400
1,600
ActualA-Injuries Linear(Last10Yr) Linear(Last5Yr) 5%AnnualReductionGoal (From5-YrRolling Avg) 5-YrRolling Avg
If fatalities are reduced by an average of 7 fatalities per year, zero fatalities would be achieved by 2034.
FIGURE HV-03 Heavy Vehicle A-Injuries 2005-2014
If A-injuries are reduced by an average of 45 A-injuries per year, zero A-injuries would be achieved by 2034.
5-Year Fatality Rolling Average for 2014: 134
5-Year A-Injury Rolling Average for 2014: 885
Illinois has implemented several strategies
to address fatalities and injuries in heavy-
vehicle- involved crashes. IDOT has increased
the number of motor carrier and hazardous
materials compliance staff significantly, and
several can perform compliance reviews and
safety audits. IDOT inspects over 75,000
trucks and conducts over 2,000 safety audits
on trucks annually. Local law enforcement
officers received in-service training to learn
heavy vehicle requirements and licensing. An
electronic data transfer was adopted to allow
staff to electronically receive large truck-
related crash data in a more timely, accurate,
and complete way. IDOT and ISP educated
the industry on safety and hazardous material
compliance, and the public was educated
through billboard campaigns and public reports.
75Illinois Strategic Highway Safety Plan 2017 Heavy Vehicle
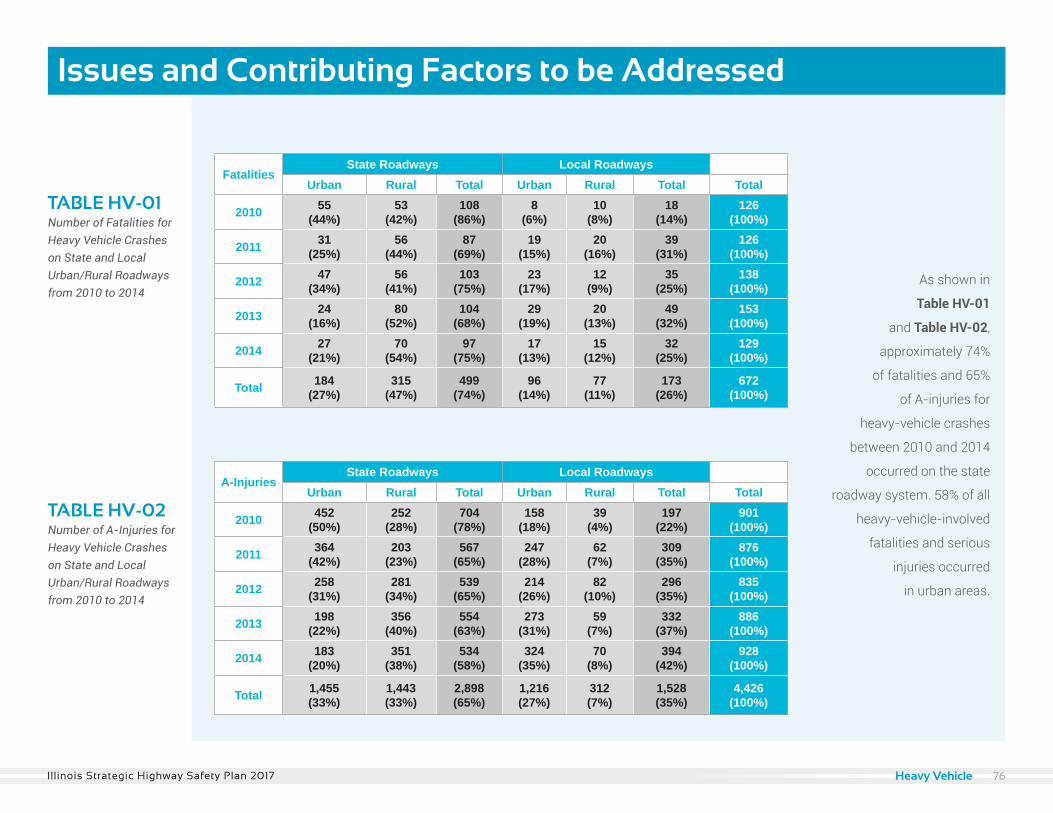
FatalitiesState Roadways Local Roadways
Urban Rural Total Urban Rural Total Total
2010 55(44%)
53(42%)
108(86%)
8(6%)
10(8%)
18(14%)
126(100%)
2011 31(25%)
56(44%)
87(69%)
19(15%)
20(16%)
39(31%)
126(100%)
2012 47(34%)
56(41%)
103(75%)
23(17%)
12(9%)
35(25%)
138(100%)
2013 24(16%)
80(52%)
104(68%)
29(19%)
20(13%)
49(32%)
153(100%)
2014 27(21%)
70(54%)
97(75%)
17(13%)
15(12%)
32(25%)
129(100%)
Total 184(27%)
315(47%)
499(74%)
96(14%)
77(11%)
173(26%)
672(100%)
A-InjuriesState Roadways Local Roadways
Urban Rural Total Urban Rural Total Total
2010 452(50%)
252(28%)
704(78%)
158(18%)
39(4%)
197(22%)
901(100%)
2011 364(42%)
203(23%)
567(65%)
247(28%)
62(7%)
309(35%)
876(100%)
2012 258(31%)
281(34%)
539(65%)
214(26%)
82(10%)
296(35%)
835(100%)
2013 198(22%)
356(40%)
554(63%)
273(31%)
59(7%)
332(37%)
886(100%)
2014 183(20%)
351(38%)
534(58%)
324(35%)
70(8%)
394(42%)
928(100%)
Total 1,455(33%)
1,443(33%)
2,898(65%)
1,216(27%)
312(7%)
1,528(35%)
4,426(100%)
TABLE HV-01 Number of Fatalities for Heavy Vehicle Crashes on State and Local Urban/Rural Roadways from 2010 to 2014
TABLE HV-02 Number of A-Injuries for Heavy Vehicle Crashes on State and LocalUrban/Rural Roadways from 2010 to 2014
As shown in
Table HV-01
and Table HV-02,
approximately 74%
of fatalities and 65%
of A-injuries for
heavy-vehicle crashes
between 2010 and 2014
occurred on the state
roadway system. 58% of all
heavy-vehicle-involved
fatalities and serious
injuries occurred
in urban areas.
Issues and Contributing Factors to be Addressed
76Illinois Strategic Highway Safety Plan 2017 Heavy Vehicle
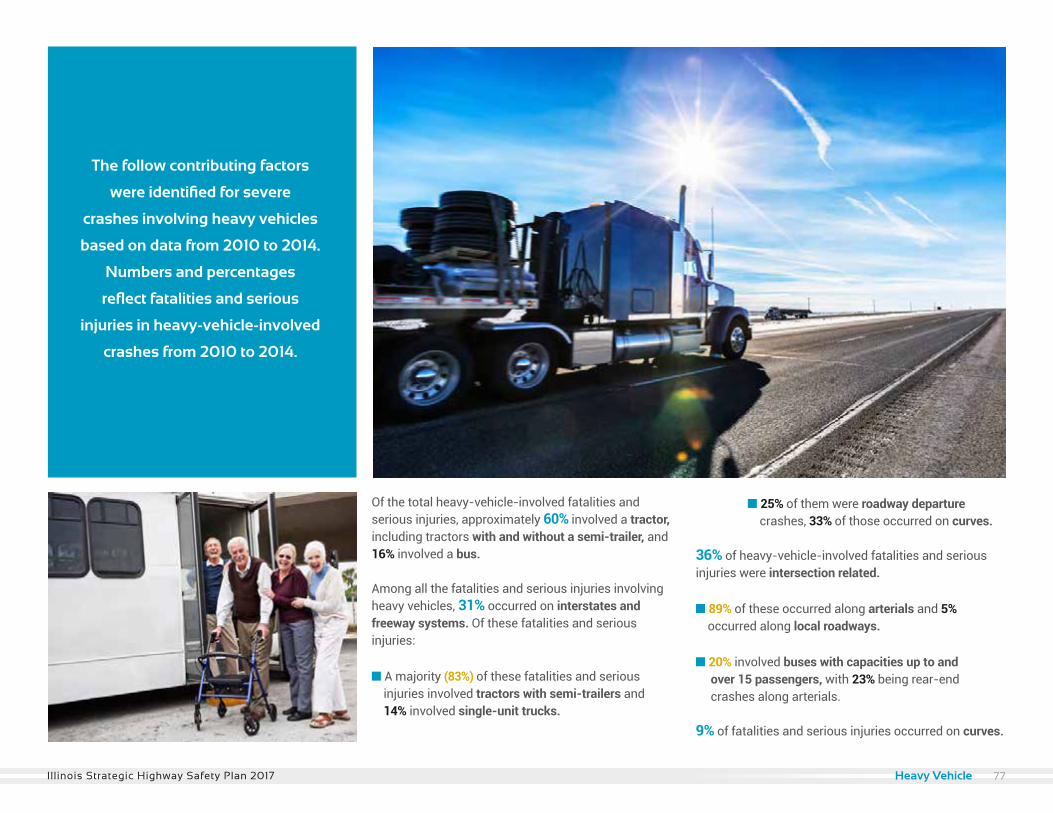
The follow contributing factors
were identified for severe
crashes involving heavy vehicles
based on data from 2010 to 2014.
Numbers and percentages
reflect fatalities and serious
injuries in heavy-vehicle-involved
crashes from 2010 to 2014.
Of the total heavy-vehicle-involved fatalities and serious injuries, approximately 60% involved a tractor, including tractors with and without a semi-trailer, and 16% involved a bus.
Among all the fatalities and serious injuries involving heavy vehicles, 31% occurred on interstates and freeway systems. Of these fatalities and serious injuries:
n A majority (83%) of these fatalities and serious injuries involved tractors with semi-trailers and 14% involved single-unit trucks.
n 25% of them were roadway departure crashes, 33% of those occurred on curves.
36% of heavy-vehicle-involved fatalities and serious injuries were intersection related.
n 89% of these occurred along arterials and 5% occurred along local roadways.
n 20% involved buses with capacities up to and over 15 passengers, with 23% being rear-end crashes along arterials.
9% of fatalities and serious injuries occurred on curves.
77Illinois Strategic Highway Safety Plan 2017 Heavy Vehicle
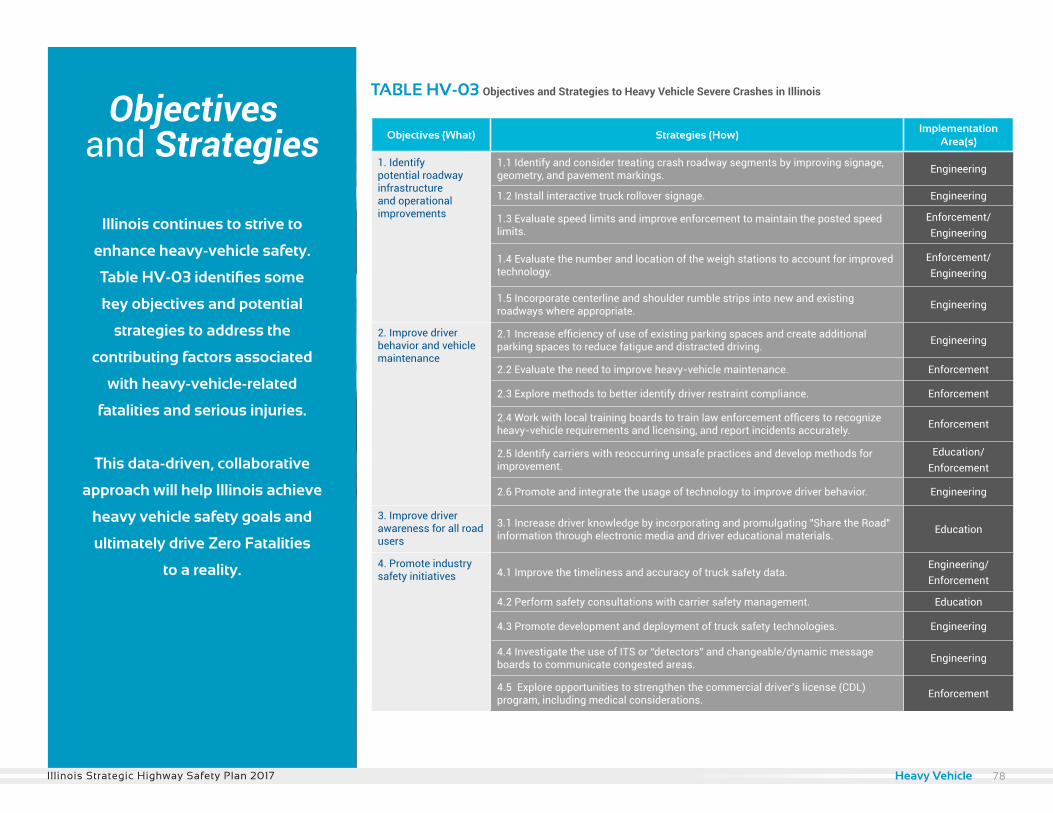
Illinois continues to strive to
enhance heavy-vehicle safety.
Table HV-03 identifies some
key objectives and potential
strategies to address the
contributing factors associated
with heavy-vehicle-related
fatalities and serious injuries.
This data-driven, collaborative
approach will help Illinois achieve
heavy vehicle safety goals and
ultimately drive Zero Fatalities
to a reality.
Objectivesand Strategies Objectives (What) Strategies (How)
Implementation Area(s)
1. Identify potential roadway infrastructure and operational improvements
1.1 Identify and consider treating crash roadway segments by improving signage, geometry, and pavement markings. Engineering
1.2 Install interactive truck rollover signage. Engineering
1.3 Evaluate speed limits and improve enforcement to maintain the posted speed limits.
Enforcement/ Engineering
1.4 Evaluate the number and location of the weigh stations to account for improved technology.
Enforcement/ Engineering
1.5 Incorporate centerline and shoulder rumble strips into new and existing roadways where appropriate. Engineering
2. Improve driver behavior and vehicle maintenance
2.1 Increase efficiency of use of existing parking spaces and create additional parking spaces to reduce fatigue and distracted driving. Engineering
2.2 Evaluate the need to improve heavy-vehicle maintenance. Enforcement
2.3 Explore methods to better identify driver restraint compliance. Enforcement
2.4 Work with local training boards to train law enforcement officers to recognize heavy-vehicle requirements and licensing, and report incidents accurately. Enforcement
2.5 Identify carriers with reoccurring unsafe practices and develop methods for improvement.
Education/Enforcement
2.6 Promote and integrate the usage of technology to improve driver behavior. Engineering
3. Improve driver awareness for all road users
3.1 Increase driver knowledge by incorporating and promulgating "Share the Road" information through electronic media and driver educational materials. Education
4. Promote industry safety initiatives 4.1 Improve the timeliness and accuracy of truck safety data.
Engineering/Enforcement
4.2 Perform safety consultations with carrier safety management. Education
4.3 Promote development and deployment of truck safety technologies. Engineering
4.4 Investigate the use of ITS or “detectors” and changeable/dynamic message boards to communicate congested areas. Engineering
4.5 Explore opportunities to strengthen the commercial driver’s license (CDL) program, including medical considerations. Enforcement
78Illinois Strategic Highway Safety Plan 2017
TABLE HV-03 Objectives and Strategies to Heavy Vehicle Severe Crashes in Illinois
Heavy Vehicle
Pedestrian
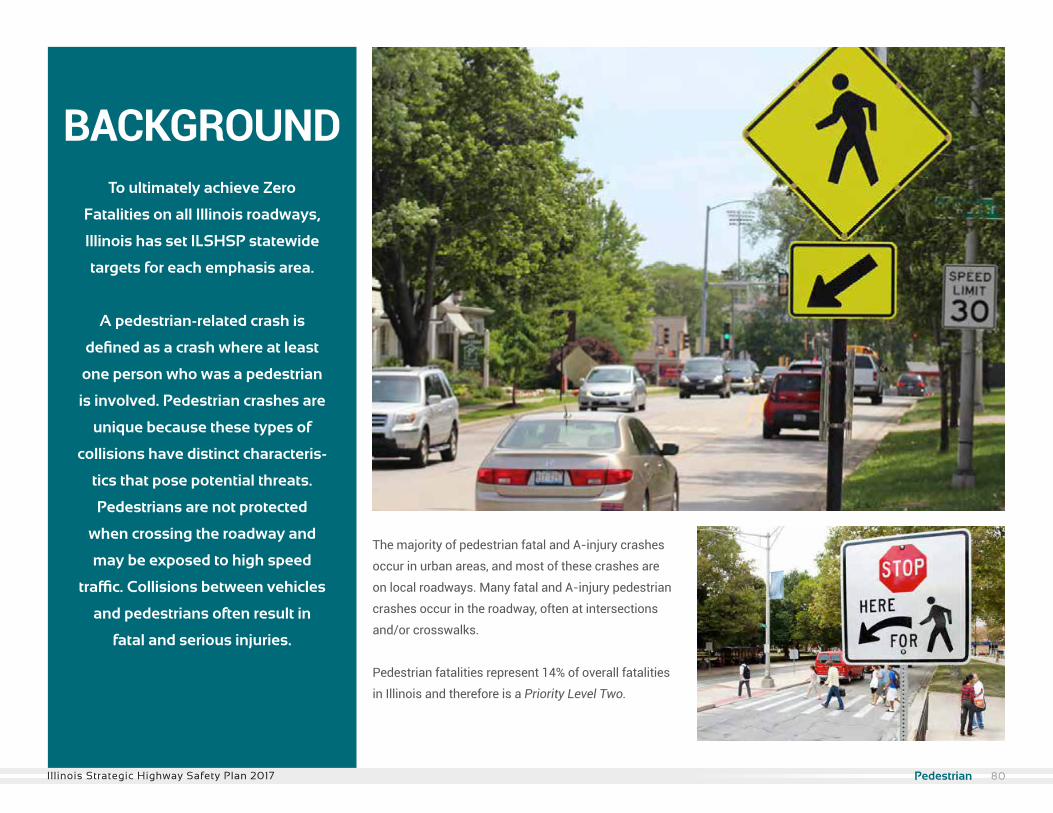
To ultimately achieve Zero
Fatalities on all Illinois roadways,
Illinois has set ILSHSP statewide
targets for each emphasis area.
A pedestrian-related crash is
defined as a crash where at least
one person who was a pedestrian
is involved. Pedestrian crashes are
unique because these types of
collisions have distinct characteris-
tics that pose potential threats.
Pedestrians are not protected
when crossing the roadway and
may be exposed to high speed
traffic. Collisions between vehicles
and pedestrians often result in
fatal and serious injuries.
BACKGROUND
The majority of pedestrian fatal and A-injury crashes
occur in urban areas, and most of these crashes are
on local roadways. Many fatal and A-injury pedestrian
crashes occur in the roadway, often at intersections
and/or crosswalks.
Pedestrian fatalities represent 14% of overall fatalities
in Illinois and therefore is a Priority Level Two.
80Illinois Strategic Highway Safety Plan 2017 Pedestrian
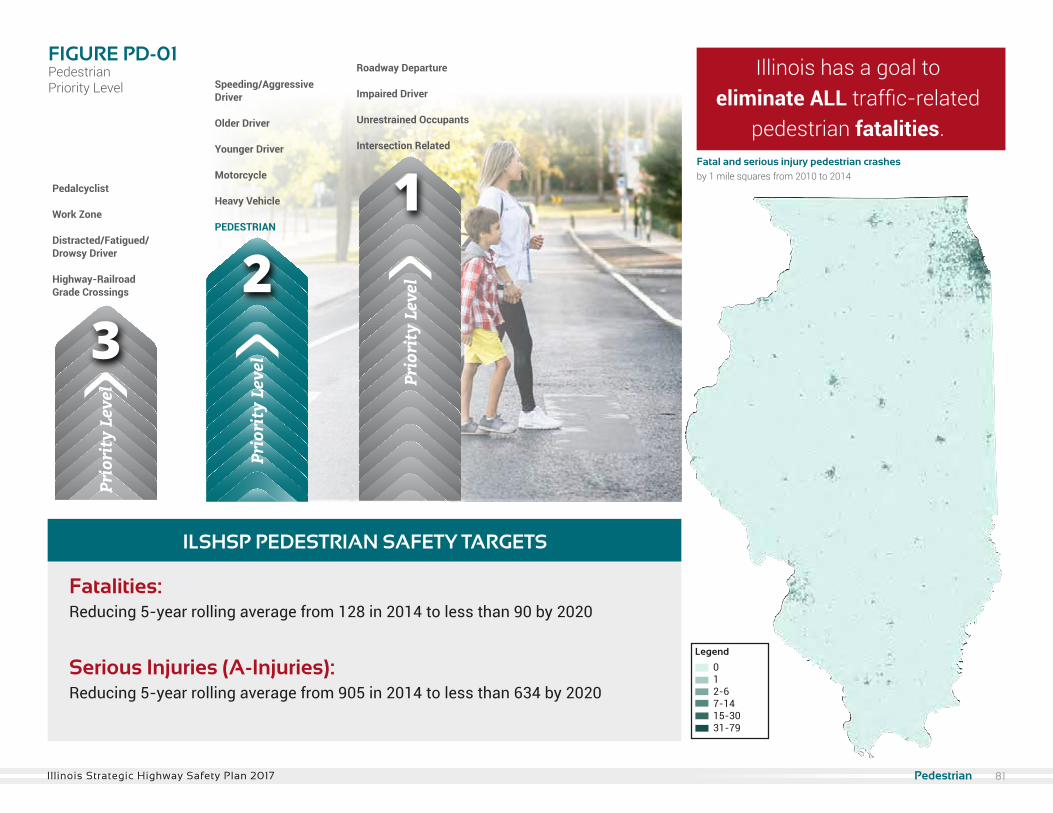
Pedalcyclist
Work Zone
Distracted/Fatigued/Drowsy Driver
Highway-RailroadGrade Crossings
Speeding/AggressiveDriver
Older Driver
Younger Driver
Motorcycle
Heavy Vehicle
PEDESTRIAN
Roadway Departure
Impaired Driver
Unrestrained Occupants
Intersection Related
FIGURE PD-01Pedestrian Priority Level
Fatalities: Reducing 5-year rolling average from 128 in 2014 to less than 90 by 2020
Serious Injuries (A-Injuries): Reducing 5-year rolling average from 905 in 2014 to less than 634 by 2020
ILSHSP PEDESTRIAN SAFETY TARGETS
Illinois has a goal to eliminate ALL traffic-related
pedestrian fatalities.Fatal and serious injury pedestrian crashesby 1 mile squares from 2010 to 2014
Legend 0
12-67-1415-3031-79
81Illinois Strategic Highway Safety Plan 2017 Pedestrian
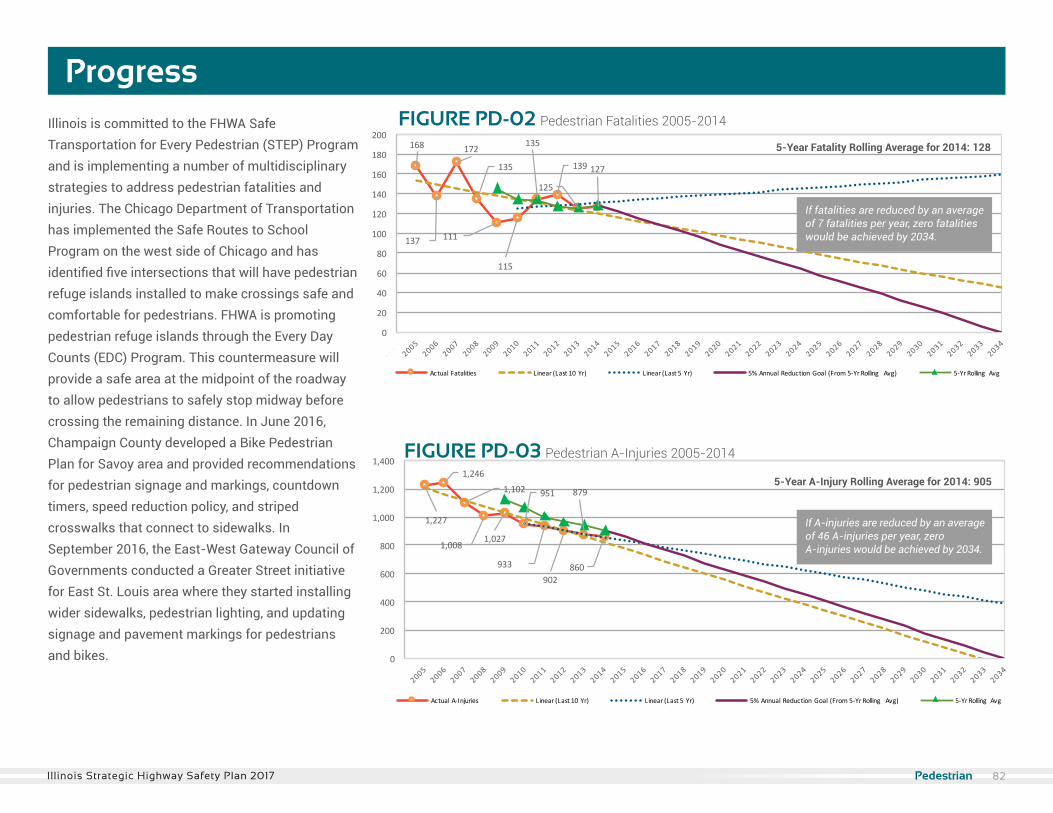
Illinois is committed to the FHWA Safe Transportation for Every Pedestrian (STEP) Program and is implementing a number of multidisciplinary strategies to address pedestrian fatalities and injuries. The Chicago Department of Transportation has implemented the Safe Routes to School Program on the west side of Chicago and has identified five intersections that will have pedestrian refuge islands installed to make crossings safe and comfortable for pedestrians. FHWA is promoting pedestrian refuge islands through the Every Day Counts (EDC) Program. This countermeasure will provide a safe area at the midpoint of the roadway to allow pedestrians to safely stop midway before crossing the remaining distance. In June 2016, Champaign County developed a Bike Pedestrian Plan for Savoy area and provided recommendations for pedestrian signage and markings, countdown timers, speed reduction policy, and striped crosswalks that connect to sidewalks. In September 2016, the East-West Gateway Council of Governments conducted a Greater Street initiative for East St. Louis area where they started installing wider sidewalks, pedestrian lighting, and updating signage and pavement markings for pedestrians and bikes.
Progress
168
137
172
135
111
115
135
139
125
127
0
20
40
60
80
100
120
140
160
180
200
ActualFatalities Linear(Last10Yr) Linear(Last5Yr) 5%AnnualReductionGoal (From5-YrRolling Avg) 5-YrRolling Avg
1,227
1,2461,102
1,0081,027
951
933
902
879
860
0
200
400
600
800
1,000
1,200
1,400
ActualA-Injuries Linear(Last10Yr) Linear(Last5Yr) 5%AnnualReductionGoal (From5-YrRolling Avg) 5-YrRolling Avg
FIGURE PD-02 Pedestrian Fatalities 2005-2014
168
137
172
135
111
115
135
139
125
127
0
20
40
60
80
100
120
140
160
180
200
ActualFatalities Linear(Last10Yr) Linear(Last5Yr) 5%AnnualReductionGoal (From5-YrRolling Avg) 5-YrRolling Avg
1,227
1,2461,102
1,0081,027
951
933
902
879
860
0
200
400
600
800
1,000
1,200
1,400
ActualA-Injuries Linear(Last10Yr) Linear(Last5Yr) 5%AnnualReductionGoal (From5-YrRolling Avg) 5-YrRolling Avg
If fatalities are reduced by an average of 7 fatalities per year, zero fatalities would be achieved by 2034.
FIGURE PD-03 Pedestrian A-Injuries 2005-2014
If A-injuries are reduced by an average of 46 A-injuries per year, zero A-injuries would be achieved by 2034.
5-Year Fatality Rolling Average for 2014: 128
5-Year A-Injury Rolling Average for 2014: 905
82Illinois Strategic Highway Safety Plan 2017 Pedestrian
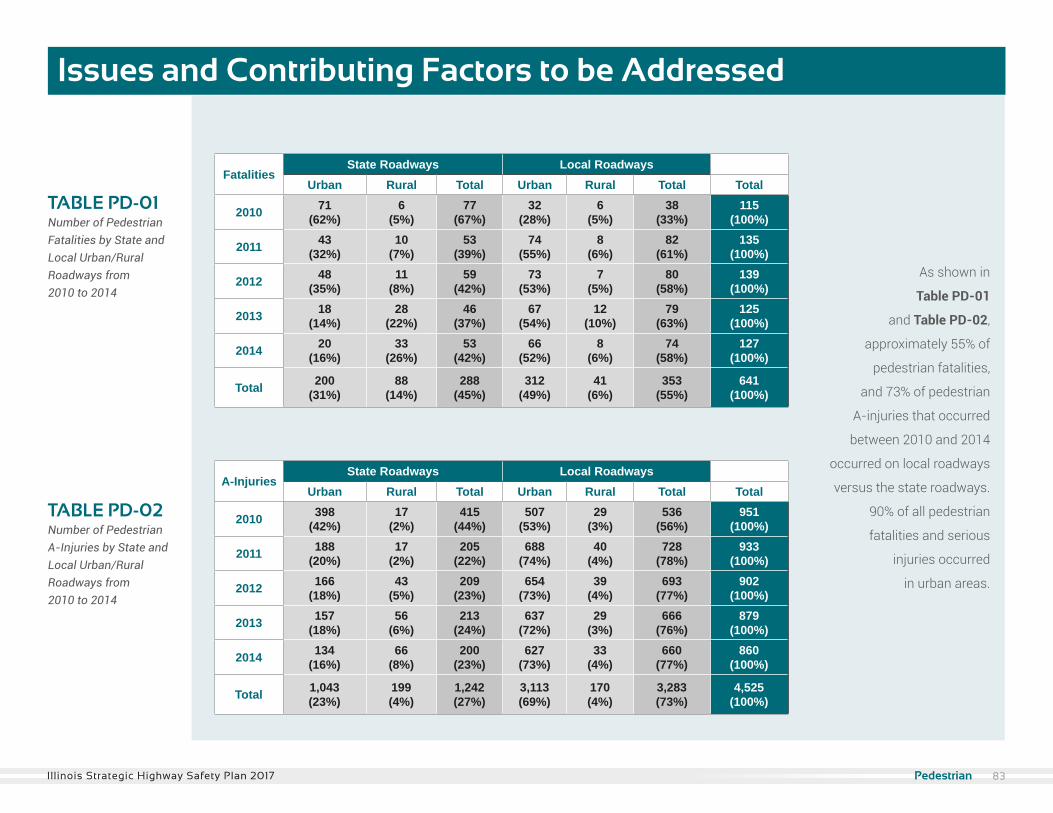
FatalitiesState Roadways Local Roadways
Urban Rural Total Urban Rural Total Total
2010 71(62%)
6(5%)
77(67%)
32(28%)
6(5%)
38(33%)
115(100%)
2011 43(32%)
10(7%)
53(39%)
74(55%)
8(6%)
82(61%)
135(100%)
2012 48(35%)
11(8%)
59(42%)
73(53%)
7(5%)
80(58%)
139(100%)
2013 18(14%)
28(22%)
46(37%)
67(54%)
12(10%)
79(63%)
125(100%)
2014 20(16%)
33(26%)
53(42%)
66(52%)
8(6%)
74(58%)
127(100%)
Total 200(31%)
88(14%)
288(45%)
312(49%)
41(6%)
353(55%)
641(100%)
A-InjuriesState Roadways Local Roadways
Urban Rural Total Urban Rural Total Total
2010 398(42%)
17(2%)
415(44%)
507(53%)
29(3%)
536(56%)
951(100%)
2011 188(20%)
17(2%)
205(22%)
688(74%)
40(4%)
728(78%)
933(100%)
2012 166(18%)
43(5%)
209(23%)
654(73%)
39(4%)
693(77%)
902(100%)
2013 157(18%)
56(6%)
213(24%)
637(72%)
29(3%)
666(76%)
879(100%)
2014 134(16%)
66(8%)
200(23%)
627(73%)
33(4%)
660(77%)
860(100%)
Total 1,043(23%)
199(4%)
1,242(27%)
3,113(69%)
170(4%)
3,283(73%)
4,525(100%)
TABLE PD-01 Number of Pedestrian Fatalities by State and Local Urban/Rural Roadways from 2010 to 2014
TABLE PD-02 Number of Pedestrian A-Injuries by State and Local Urban/Rural Roadways from 2010 to 2014
As shown in
Table PD-01
and Table PD-02,
approximately 55% of
pedestrian fatalities,
and 73% of pedestrian
A-injuries that occurred
between 2010 and 2014
occurred on local roadways
versus the state roadways.
90% of all pedestrian
fatalities and serious
injuries occurred
in urban areas.
Issues and Contributing Factors to be Addressed
83Illinois Strategic Highway Safety Plan 2017 Pedestrian
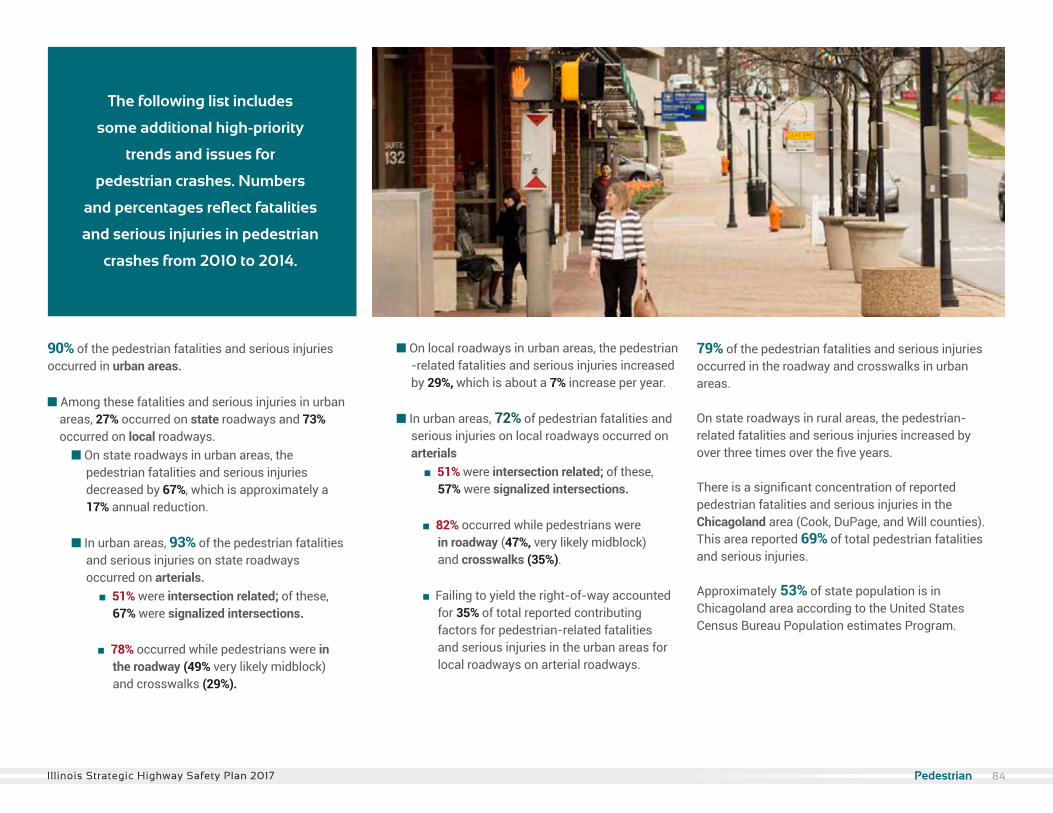
The following list includes
some additional high-priority
trends and issues for
pedestrian crashes. Numbers
and percentages reflect fatalities
and serious injuries in pedestrian
crashes from 2010 to 2014.
90% of the pedestrian fatalities and serious injuries occurred in urban areas.
n Among these fatalities and serious injuries in urban areas, 27% occurred on state roadways and 73% occurred on local roadways. n On state roadways in urban areas, the pedestrian fatalities and serious injuries decreased by 67%, which is approximately a 17% annual reduction.
n In urban areas, 93% of the pedestrian fatalities and serious injuries on state roadways occurred on arterials. n 51% were intersection related; of these, 67% were signalized intersections.
n 78% occurred while pedestrians were in the roadway (49% very likely midblock) and crosswalks (29%).
n On local roadways in urban areas, the pedestrian -related fatalities and serious injuries increased by 29%, which is about a 7% increase per year.
n In urban areas, 72% of pedestrian fatalities and serious injuries on local roadways occurred on arterials n 51% were intersection related; of these, 57% were signalized intersections.
n 82% occurred while pedestrians were in roadway (47%, very likely midblock) and crosswalks (35%).
n Failing to yield the right-of-way accounted for 35% of total reported contributing factors for pedestrian-related fatalities and serious injuries in the urban areas for local roadways on arterial roadways.
79% of the pedestrian fatalities and serious injuries occurred in the roadway and crosswalks in urban areas.
On state roadways in rural areas, the pedestrian-related fatalities and serious injuries increased by over three times over the five years.
There is a significant concentration of reported pedestrian fatalities and serious injuries in the Chicagoland area (Cook, DuPage, and Will counties). This area reported 69% of total pedestrian fatalities and serious injuries.
Approximately 53% of state population is in Chicagoland area according to the United States Census Bureau Population estimates Program.
84Illinois Strategic Highway Safety Plan 2017 Pedestrian
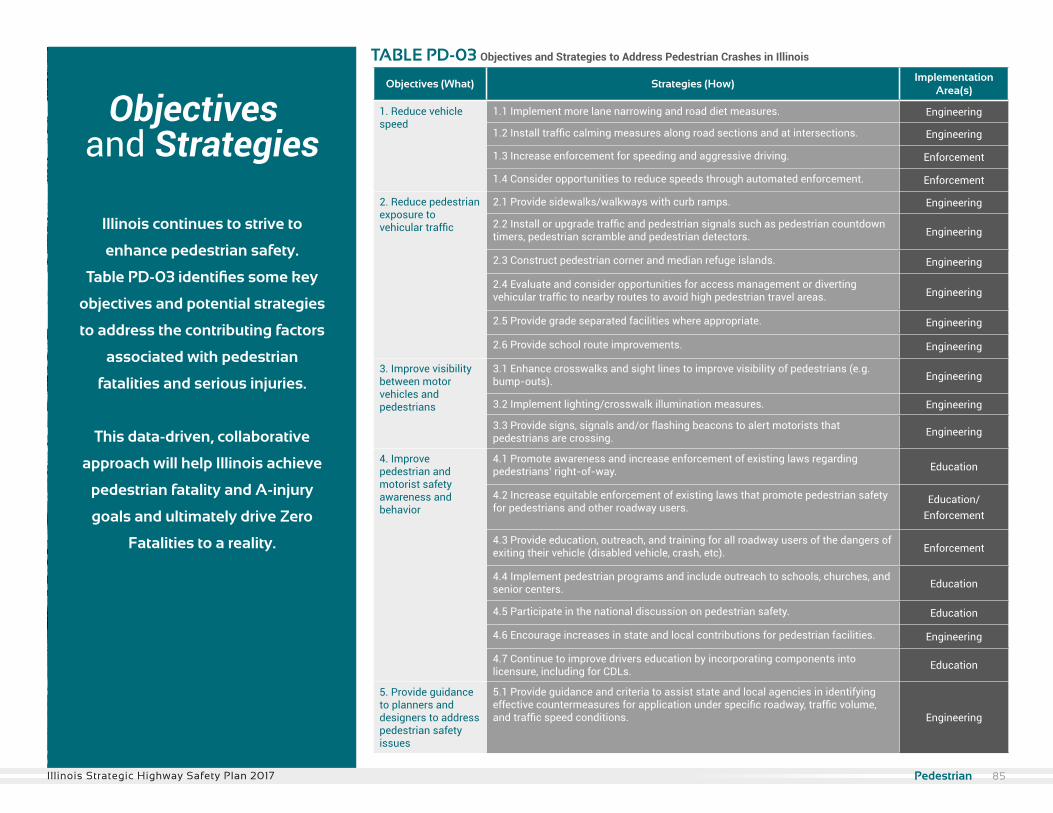
TABLE PD-03 Objectives and Strategies to Address Pedestrian Crashes in Illinois
Illinois continues to strive to
enhance pedestrian safety.
Table PD-03 identifies some key
objectives and potential strategies
to address the contributing factors
associated with pedestrian
fatalities and serious injuries.
This data-driven, collaborative
approach will help Illinois achieve
pedestrian fatality and A-injury
goals and ultimately drive Zero
Fatalities to a reality.
Objectivesand Strategies
Objectives (What) Strategies (How)Implementation
Area(s)
1. Reduce vehicle speed
1.1 Implement more lane narrowing and road diet measures. Engineering
1.2 Install traffic calming measures along road sections and at intersections. Engineering
1.3 Increase enforcement for speeding and aggressive driving. Enforcement
1.4 Consider opportunities to reduce speeds through automated enforcement. Enforcement
2. Reduce pedestrian exposure to vehicular traffic
2.1 Provide sidewalks/walkways with curb ramps. Engineering
2.2 Install or upgrade traffic and pedestrian signals such as pedestrian countdown timers, pedestrian scramble and pedestrian detectors. Engineering
2.3 Construct pedestrian corner and median refuge islands. Engineering
2.4 Evaluate and consider opportunities for access management or diverting vehicular traffic to nearby routes to avoid high pedestrian travel areas. Engineering
2.5 Provide grade separated facilities where appropriate. Engineering
2.6 Provide school route improvements. Engineering
3. Improve visibility between motor vehicles and pedestrians
3.1 Enhance crosswalks and sight lines to improve visibility of pedestrians (e.g. bump-outs). Engineering
3.2 Implement lighting/crosswalk illumination measures. Engineering
3.3 Provide signs, signals and/or flashing beacons to alert motorists that pedestrians are crossing. Engineering
4. Improve pedestrian and motorist safety awareness and behavior
4.1 Promote awareness and increase enforcement of existing laws regardingpedestrians’ right-of-way. Education
4.2 Increase equitable enforcement of existing laws that promote pedestrian safety for pedestrians and other roadway users.
Education/ Enforcement
4.3 Provide education, outreach, and training for all roadway users of the dangers ofexiting their vehicle (disabled vehicle, crash, etc). Enforcement
4.4 Implement pedestrian programs and include outreach to schools, churches, and senior centers. Education
4.5 Participate in the national discussion on pedestrian safety. Education
4.6 Encourage increases in state and local contributions for pedestrian facilities. Engineering
4.7 Continue to improve drivers education by incorporating components into licensure, including for CDLs. Education
5. Provide guidance to planners and designers to address pedestrian safety issues
5.1 Provide guidance and criteria to assist state and local agencies in identifying effective countermeasures for application under specific roadway, traffic volume, and traffic speed conditions. Engineering
85Illinois Strategic Highway Safety Plan 2017 Pedestrian

Pedalcyclist
To ultimately achieve Zero Fatalities on all Illinois roadways, Illinois has set ILSHSP statewide targets for each emphasis area.
A pedalcyclist-related crash is defined as a crash where at least one person who is a pedalcyclist is involved. Pedalcyclists are
not protected when crossing the roadway and may have limited protection when riding along the roadway resulting in expo-
sure to high speed traffic. Collisions between vehicles and pedalcyclists often result in fatal and serious injuries.
Pedalcyclist collisions have distinct characteristics
that pose significant potential threats to cyclist
safety. IDOT has successfully developed policies
where pedalcyclists are considered in the planning,
design, and implementation of roadways. For
example, pedalcyclist usage and accommodations
are considered during the planning of shoulders and
rumble strips.
In addition, Complete Streets legislation provides for
full consideration of pedestrians and bicyclists in the
planning and development of transportation facilities.
In all urbanized areas, IDOT accommodates non-
motorized users along bicycle and pedestrian ways as
a default condition.
BACKGROUND
87Illinois Strategic Highway Safety Plan 2017 Pedalcyclist
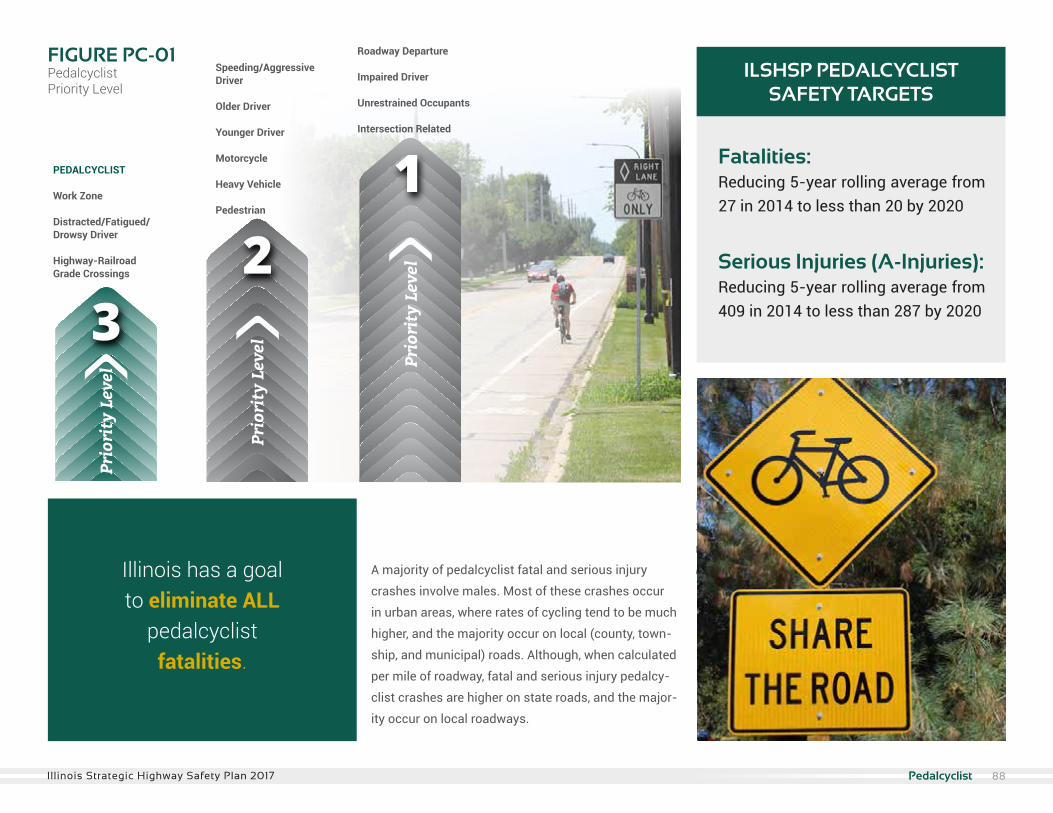
PEDALCYCLIST
Work Zone
Distracted/Fatigued/Drowsy Driver
Highway-RailroadGrade Crossings
Speeding/AggressiveDriver
Older Driver
Younger Driver
Motorcycle
Heavy Vehicle
Pedestrian
Roadway Departure
Impaired Driver
Unrestrained Occupants
Intersection Related
A majority of pedalcyclist fatal and serious injury
crashes involve males. Most of these crashes occur
in urban areas, where rates of cycling tend to be much
higher, and the majority occur on local (county, town-
ship, and municipal) roads. Although, when calculated
per mile of roadway, fatal and serious injury pedalcy-
clist crashes are higher on state roads, and the major-
ity occur on local roadways.
Pedalcyclist fatalities and serious injuries represent
3% of overall fatalities and serious injuries, which
make them a Priority Level Three.
Priority Level Three.
Fatalities: Reducing 5-year rolling average from 27 in 2014 to less than 20 by 2020
Serious Injuries (A-Injuries): Reducing 5-year rolling average from 409 in 2014 to less than 287 by 2020
ILSHSP PEDALCYCLIST SAFETY TARGETS
Illinois has a goal to eliminate ALL
pedalcyclist fatalities.
FIGURE PC-01Pedalcyclist Priority Level
88Illinois Strategic Highway Safety Plan 2017 Pedalcyclist
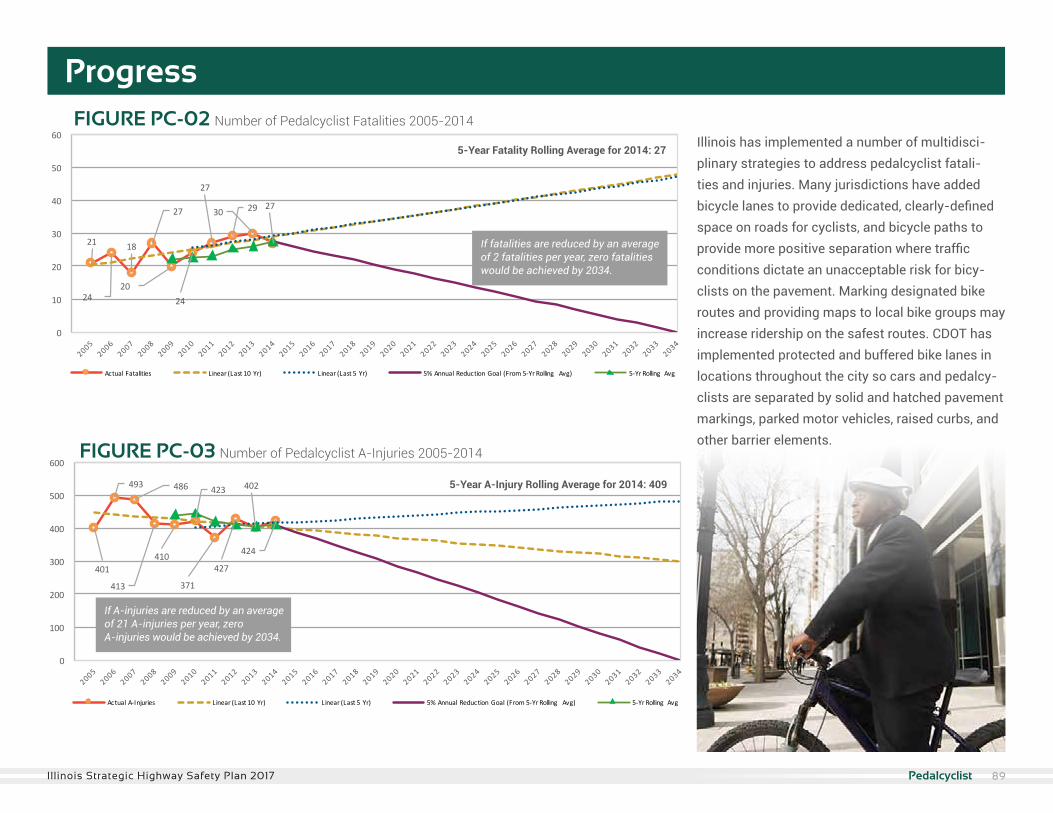
Illinois has implemented a number of multidisci-plinary strategies to address pedalcyclist fatali-ties and injuries. Many jurisdictions have added bicycle lanes to provide dedicated, clearly-defined space on roads for cyclists, and bicycle paths to provide more positive separation where traffic conditions dictate an unacceptable risk for bicy-clists on the pavement. Marking designated bike routes and providing maps to local bike groups may increase ridership on the safest routes. CDOT has implemented protected and buffered bike lanes in locations throughout the city so cars and pedalcy-clists are separated by solid and hatched pavement markings, parked motor vehicles, raised curbs, and other barrier elements.
Progress
21
24
18
27
2024
27
293027
0
10
20
30
40
50
60
ActualFatalities Linear(Last10Yr) Linear(Last5Yr) 5%AnnualReductionGoal (From5-YrRolling Avg) 5-YrRolling Avg
401
493 486
413
410
423
371
427
402
424
0
100
200
300
400
500
600
ActualA-Injuries Linear(Last10Yr) Linear(Last5Yr) 5%AnnualReductionGoal (From5-YrRolling Avg) 5-YrRolling Avg
FIGURE PC-02 Number of Pedalcyclist Fatalities 2005-2014
21
24
18
27
2024
27
293027
0
10
20
30
40
50
60
ActualFatalities Linear(Last10Yr) Linear(Last5Yr) 5%AnnualReductionGoal (From5-YrRolling Avg) 5-YrRolling Avg
401
493 486
413
410
423
371
427
402
424
0
100
200
300
400
500
600
ActualA-Injuries Linear(Last10Yr) Linear(Last5Yr) 5%AnnualReductionGoal (From5-YrRolling Avg) 5-YrRolling Avg
If fatalities are reduced by an average of 2 fatalities per year, zero fatalities would be achieved by 2034.
FIGURE PC-03 Number of Pedalcyclist A-Injuries 2005-2014
If A-injuries are reduced by an average of 21 A-injuries per year, zero A-injuries would be achieved by 2034.
5-Year Fatality Rolling Average for 2014: 27
5-Year A-Injury Rolling Average for 2014: 409
Pedestrian 89Illinois Strategic Highway Safety Plan 2017 Pedalcyclist
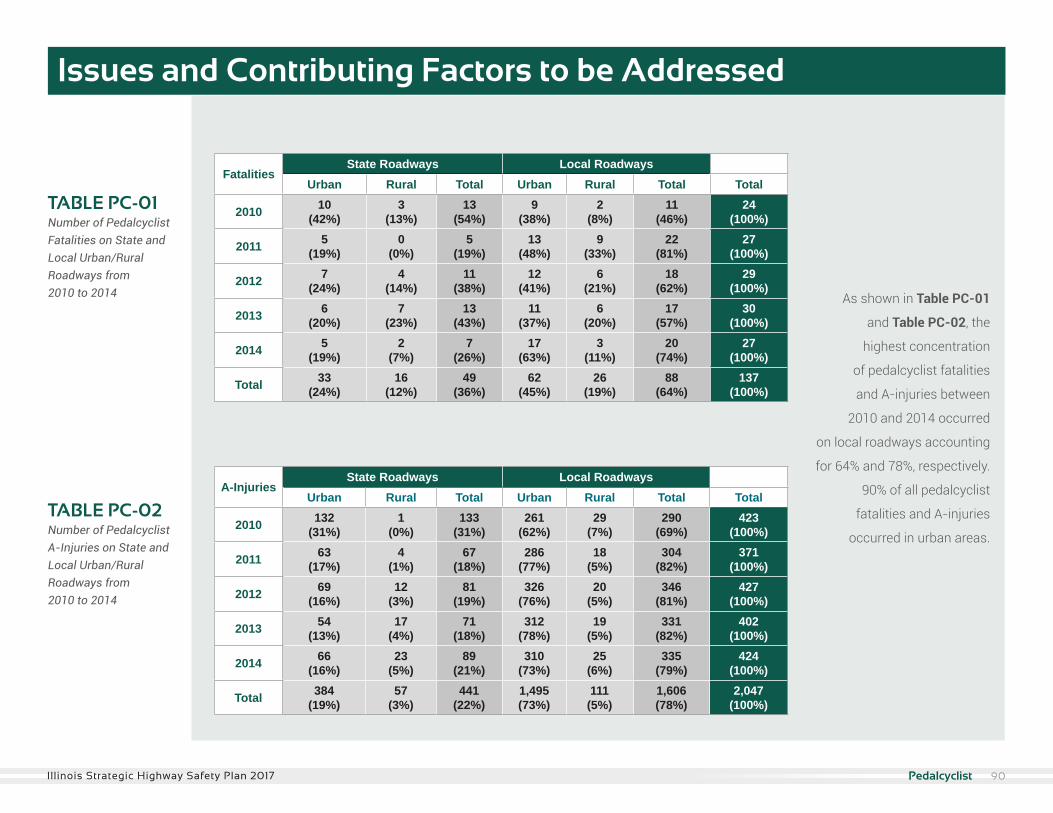
TABLE PD-01 Number of Fatalities in Pedestrian Crashes by State and Local Urban/Rural Roadways from 2010 to 2014
FatalitiesState Roadways Local Roadways
Urban Rural Total Urban Rural Total Total
2010 10(42%)
3(13%)
13(54%)
9(38%)
2(8%)
11(46%)
24(100%)
2011 5(19%)
0(0%)
5(19%)
13(48%)
9(33%)
22(81%)
27(100%)
2012 7(24%)
4(14%)
11(38%)
12(41%)
6(21%)
18(62%)
29(100%)
2013 6(20%)
7(23%)
13(43%)
11(37%)
6(20%)
17(57%)
30(100%)
2014 5(19%)
2(7%)
7(26%)
17(63%)
3(11%)
20(74%)
27(100%)
Total 33(24%)
16(12%)
49(36%)
62(45%)
26(19%)
88(64%)
137(100%)
A-InjuriesState Roadways Local Roadways
Urban Rural Total Urban Rural Total Total
2010 132(31%)
1(0%)
133(31%)
261(62%)
29(7%)
290(69%)
423(100%)
2011 63(17%)
4(1%)
67(18%)
286(77%)
18(5%)
304(82%)
371(100%)
2012 69(16%)
12(3%)
81(19%)
326(76%)
20(5%)
346(81%)
427(100%)
2013 54(13%)
17(4%)
71(18%)
312(78%)
19(5%)
331(82%)
402(100%)
2014 66(16%)
23(5%)
89(21%)
310(73%)
25(6%)
335(79%)
424(100%)
Total 384(19%)
57(3%)
441(22%)
1,495(73%)
111(5%)
1,606(78%)
2,047(100%)
90Illinois Strategic Highway Safety Plan 2017 Pedalcyclist
TABLE PC-01 Number of Pedalcyclist Fatalities on State and Local Urban/Rural Roadways from2010 to 2014
TABLE PC-02 Number of Pedalcyclist A-Injuries on State and Local Urban/Rural Roadways from 2010 to 2014
As shown in Table PC-01
and Table PC-02, the
highest concentration
of pedalcyclist fatalities
and A-injuries between
2010 and 2014 occurred
on local roadways accounting
for 64% and 78%, respectively.
90% of all pedalcyclist
fatalities and A-injuries
occurred in urban areas.
Issues and Contributing Factors to be Addressed
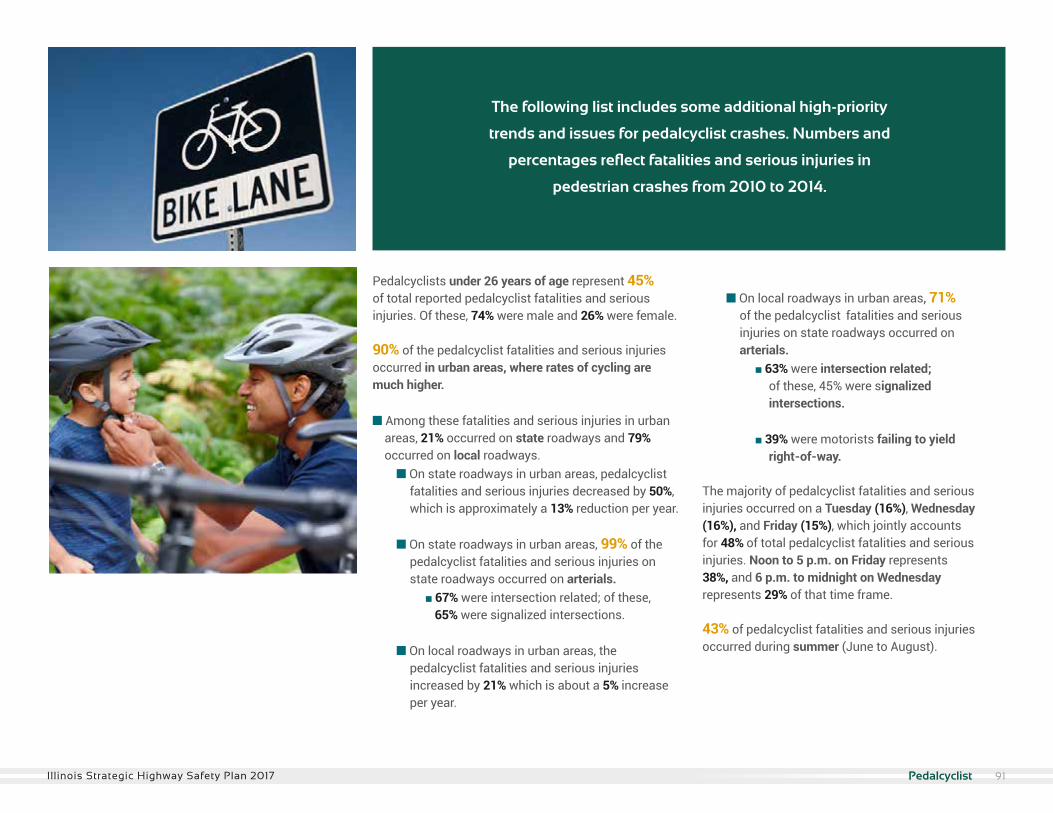
The following list includes some additional high-priority
trends and issues for pedalcyclist crashes. Numbers and
percentages reflect fatalities and serious injuries in
pedestrian crashes from 2010 to 2014.
Pedalcyclists under 26 years of age represent 45% of total reported pedalcyclist fatalities and serious injuries. Of these, 74% were male and 26% were female. 90% of the pedalcyclist fatalities and serious injuries occurred in urban areas, where rates of cycling are much higher.
n Among these fatalities and serious injuries in urban areas, 21% occurred on state roadways and 79% occurred on local roadways. n On state roadways in urban areas, pedalcyclist fatalities and serious injuries decreased by 50%, which is approximately a 13% reduction per year.
n On state roadways in urban areas, 99% of the pedalcyclist fatalities and serious injuries on state roadways occurred on arterials. n 67% were intersection related; of these, 65% were signalized intersections.
n On local roadways in urban areas, the pedalcyclist fatalities and serious injuries increased by 21% which is about a 5% increase per year.
n On local roadways in urban areas, 71% of the pedalcyclist fatalities and serious injuries on state roadways occurred on arterials. n 63% were intersection related; of these, 45% were signalized intersections. n 39% were motorists failing to yield right-of-way.
The majority of pedalcyclist fatalities and serious injuries occurred on a Tuesday (16%), Wednesday (16%), and Friday (15%), which jointly accounts for 48% of total pedalcyclist fatalities and serious injuries. Noon to 5 p.m. on Friday represents 38%, and 6 p.m. to midnight on Wednesday represents 29% of that time frame.
43% of pedalcyclist fatalities and serious injuries occurred during summer (June to August).
91Illinois Strategic Highway Safety Plan 2017 Pedalcyclist
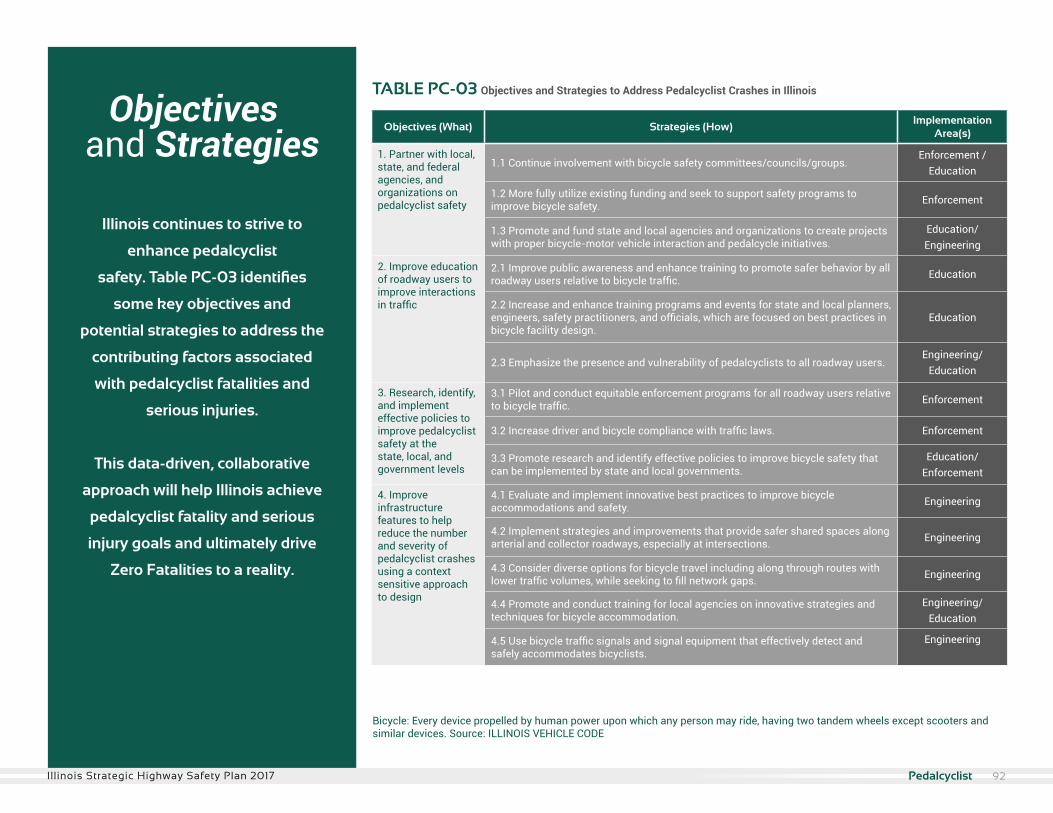
Objectives (What) Strategies (How)Implementation
Area(s)
1. Partner with local, state, and federal agencies, and organizations on pedalcyclist safety
1.1 Continue involvement with bicycle safety committees/councils/groups.Enforcement /
Education
1.2 More fully utilize existing funding and seek to support safety programs to improve bicycle safety. Enforcement
1.3 Promote and fund state and local agencies and organizations to create projects with proper bicycle-motor vehicle interaction and pedalcycle initiatives.
Education/Engineering
2. Improve education of roadway users to improve interactions in traffic
2.1 Improve public awareness and enhance training to promote safer behavior by all roadway users relative to bicycle traffic. Education
2.2 Increase and enhance training programs and events for state and local planners, engineers, safety practitioners, and officials, which are focused on best practices in bicycle facility design.
Education
2.3 Emphasize the presence and vulnerability of pedalcyclists to all roadway users.Engineering/
Education
3. Research, identify, and implement effective policies to improve pedalcyclist safety at the state, local, and government levels
3.1 Pilot and conduct equitable enforcement programs for all roadway users relative to bicycle traffic. Enforcement
3.2 Increase driver and bicycle compliance with traffic laws. Enforcement
3.3 Promote research and identify effective policies to improve bicycle safety that can be implemented by state and local governments.
Education/ Enforcement
4. Improve infrastructure features to help reduce the number and severity of pedalcyclist crashes using a context sensitive approach to design
4.1 Evaluate and implement innovative best practices to improve bicycle accommodations and safety. Engineering
4.2 Implement strategies and improvements that provide safer shared spaces along arterial and collector roadways, especially at intersections. Engineering
4.3 Consider diverse options for bicycle travel including along through routes with lower traffic volumes, while seeking to fill network gaps. Engineering
4.4 Promote and conduct training for local agencies on innovative strategies and techniques for bicycle accommodation.
Engineering/Education
4.5 Use bicycle traffic signals and signal equipment that effectively detect and safely accommodates bicyclists.
Engineering
TABLE PC-03 Objectives and Strategies to Address Pedalcyclist Crashes in Illinois
Illinois continues to strive to
enhance pedalcyclist
safety. Table PC-03 identifies
some key objectives and
potential strategies to address the
contributing factors associated
with pedalcyclist fatalities and
serious injuries.
This data-driven, collaborative
approach will help Illinois achieve
pedalcyclist fatality and serious
injury goals and ultimately drive
Zero Fatalities to a reality.
Objectivesand Strategies
Bicycle: Every device propelled by human power upon which any person may ride, having two tandem wheels except scooters andsimilar devices. Source: ILLINOIS VEHICLE CODE
92Illinois Strategic Highway Safety Plan 2017 Pedalcyclist
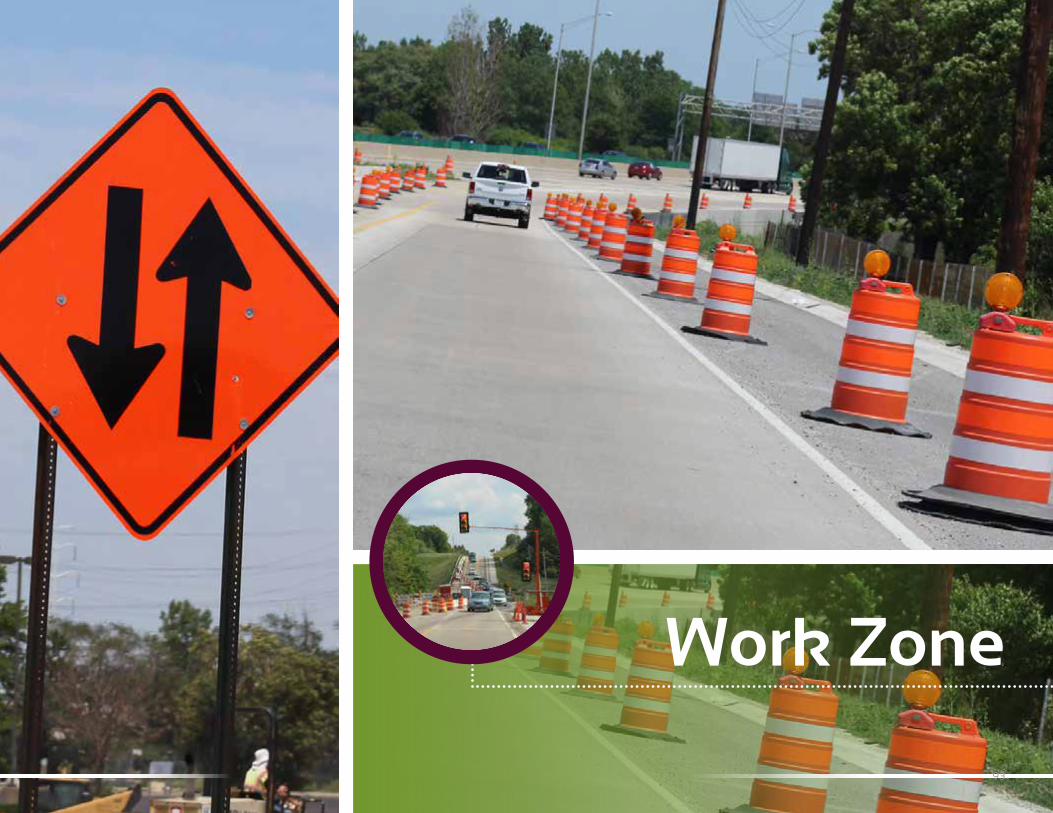
Work Zone
93
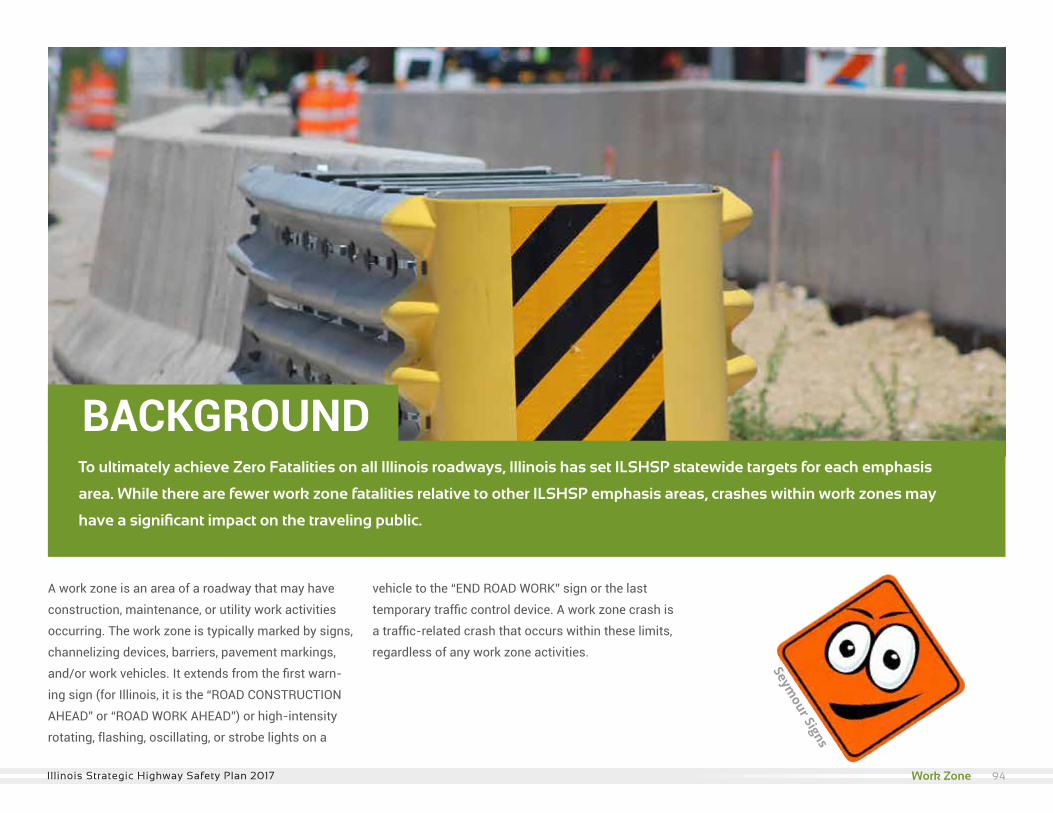
To ultimately achieve Zero Fatalities on all Illinois roadways, Illinois has set ILSHSP statewide targets for each emphasis
area. While there are fewer work zone fatalities relative to other ILSHSP emphasis areas, crashes within work zones may
have a significant impact on the traveling public.
A work zone is an area of a roadway that may have
construction, maintenance, or utility work activities
occurring. The work zone is typically marked by signs,
channelizing devices, barriers, pavement markings,
and/or work vehicles. It extends from the first warn-
ing sign (for Illinois, it is the “ROAD CONSTRUCTION
AHEAD” or “ROAD WORK AHEAD”) or high-intensity
rotating, flashing, oscillating, or strobe lights on a
vehicle to the “END ROAD WORK” sign or the last
temporary traffic control device. A work zone crash is
a traffic-related crash that occurs within these limits,
regardless of any work zone activities.
Seymour Signs
BACKGROUND
94Illinois Strategic Highway Safety Plan 2017 Work Zone
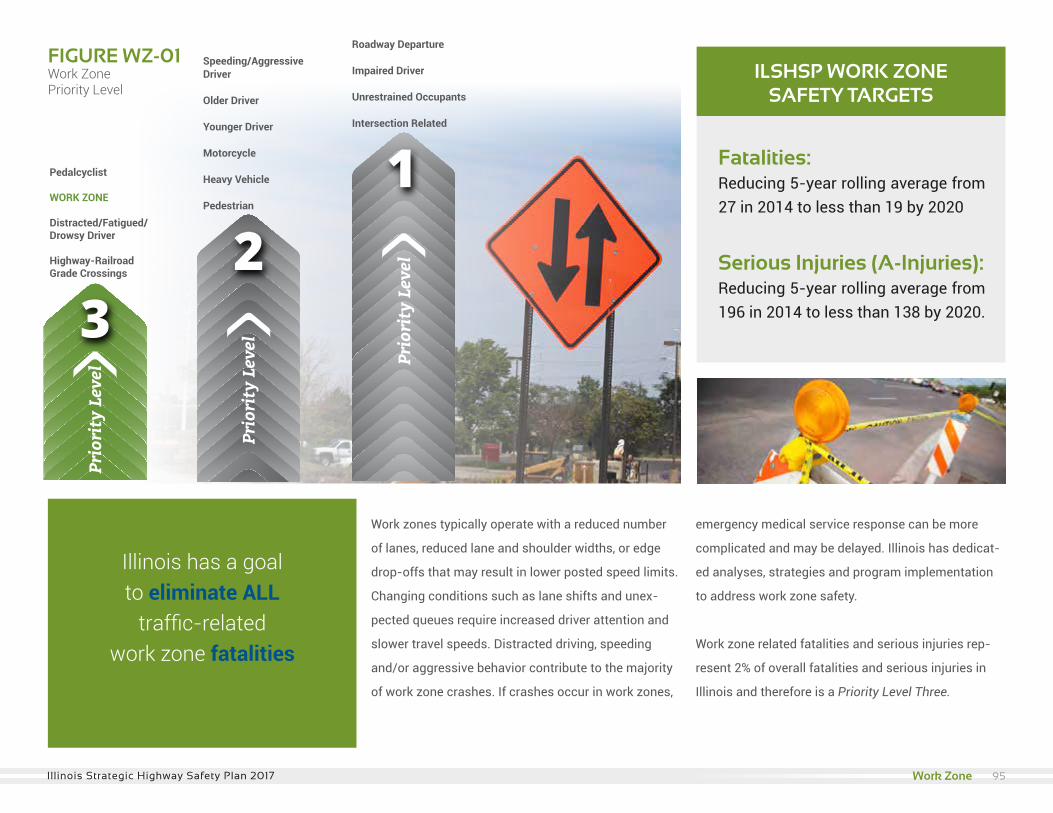
Pedalcyclist
WORK ZONE
Distracted/Fatigued/Drowsy Driver
Highway-Railroad Grade Crossings
Speeding/AggressiveDriver
Older Driver
Younger Driver
Motorcycle
Heavy Vehicle
Pedestrian
Roadway Departure
Impaired Driver
Unrestrained Occupants
Intersection Related
Work zones typically operate with a reduced number
of lanes, reduced lane and shoulder widths, or edge
drop-offs that may result in lower posted speed limits.
Changing conditions such as lane shifts and unex-
pected queues require increased driver attention and
slower travel speeds. Distracted driving, speeding
and/or aggressive behavior contribute to the majority
of work zone crashes. If crashes occur in work zones,
emergency medical service response can be more
complicated and may be delayed. Illinois has dedicat-
ed analyses, strategies and program implementation
to address work zone safety.
Work zone related fatalities and serious injuries rep-
resent 2% of overall fatalities and serious injuries in
Illinois and therefore is a Priority Level Three.
FIGURE WZ-01Work ZonePriority Level
Fatalities: Reducing 5-year rolling average from 27 in 2014 to less than 19 by 2020
Serious Injuries (A-Injuries): Reducing 5-year rolling average from 196 in 2014 to less than 138 by 2020.
ILSHSP WORK ZONE SAFETY TARGETS
Illinois has a goal to eliminate ALL
traffic-related work zone fatalities
95Illinois Strategic Highway Safety Plan 2017 Work Zone
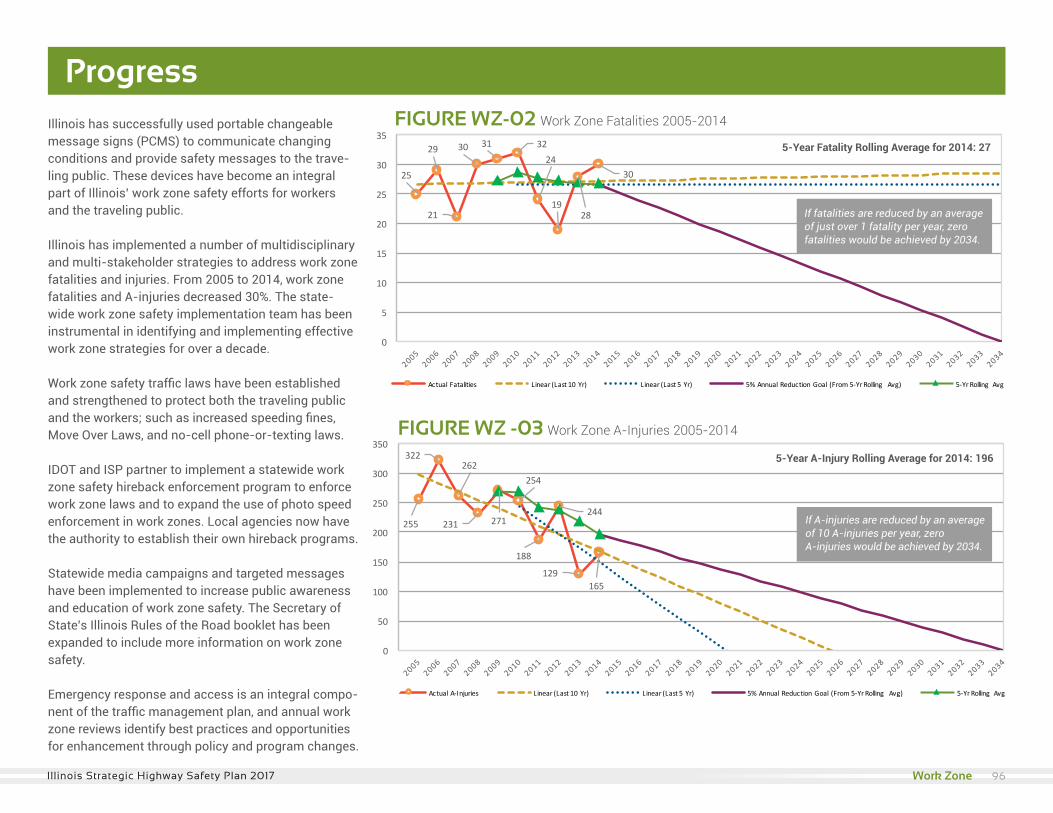
25
29
21
30 31 3224
1928
30
0
5
10
15
20
25
30
35
ActualFatalities Linear(Last10Yr) Linear(Last5Yr) 5%AnnualReductionGoal (From5-YrRolling Avg) 5-YrRolling Avg
255
322262
231 271
254
188
244
129165
0
50
100
150
200
250
300
350
ActualA-Injuries Linear(Last10Yr) Linear(Last5Yr) 5%AnnualReductionGoal (From5-YrRolling Avg) 5-YrRolling Avg
Illinois has successfully used portable changeable message signs (PCMS) to communicate changing conditions and provide safety messages to the trave-ling public. These devices have become an integral part of Illinois’ work zone safety efforts for workers and the traveling public.
Illinois has implemented a number of multidisciplinary and multi-stakeholder strategies to address work zone fatalities and injuries. From 2005 to 2014, work zone fatalities and A-injuries decreased 30%. The state-wide work zone safety implementation team has been instrumental in identifying and implementing effective work zone strategies for over a decade.
Work zone safety traffic laws have been established and strengthened to protect both the traveling public and the workers; such as increased speeding fines, Move Over Laws, and no-cell phone-or-texting laws.
IDOT and ISP partner to implement a statewide work zone safety hireback enforcement program to enforce work zone laws and to expand the use of photo speed enforcement in work zones. Local agencies now have the authority to establish their own hireback programs.
Statewide media campaigns and targeted messages have been implemented to increase public awareness and education of work zone safety. The Secretary of State’s Illinois Rules of the Road booklet has been expanded to include more information on work zone safety.
Emergency response and access is an integral compo-nent of the traffic management plan, and annual work zone reviews identify best practices and opportunities for enhancement through policy and program changes.
Progress
25
29
21
30 31 3224
1928
30
0
5
10
15
20
25
30
35
ActualFatalities Linear(Last10Yr) Linear(Last5Yr) 5%AnnualReductionGoal (From5-YrRolling Avg) 5-YrRolling Avg
255
322262
231 271
254
188
244
129165
0
50
100
150
200
250
300
350
ActualA-Injuries Linear(Last10Yr) Linear(Last5Yr) 5%AnnualReductionGoal (From5-YrRolling Avg) 5-YrRolling Avg
FIGURE WZ-02 Work Zone Fatalities 2005-2014
If fatalities are reduced by an average of just over 1 fatality per year, zero fatalities would be achieved by 2034.
FIGURE WZ -03 Work Zone A-Injuries 2005-2014
If A-injuries are reduced by an average of 10 A-injuries per year, zero A-injuries would be achieved by 2034.
5-Year Fatality Rolling Average for 2014: 27
5-Year A-Injury Rolling Average for 2014: 196
96Illinois Strategic Highway Safety Plan 2017 Work Zone
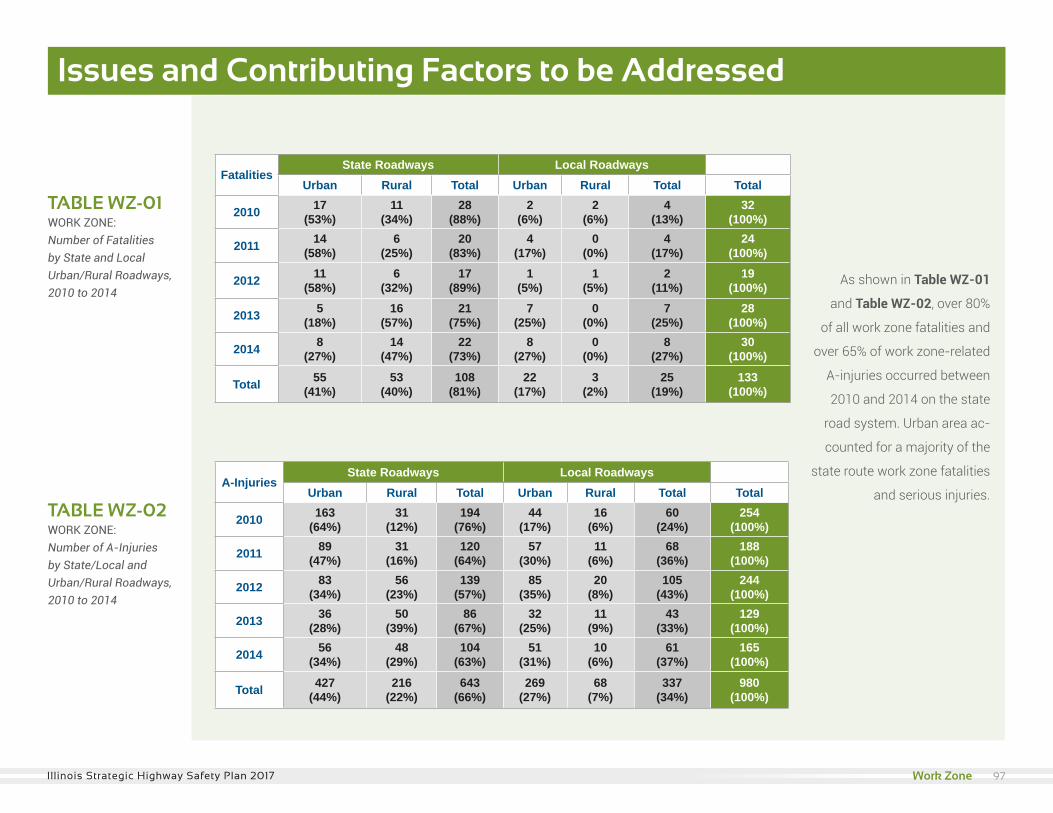
TABLE WZ-01 WORK ZONE: Number of Fatalities by State and Local Urban/Rural Roadways, 2010 to 2014
TABLE WZ-02 WORK ZONE: Number of A-Injuries by State/Local and Urban/Rural Roadways, 2010 to 2014
As shown in Table WZ-01
and Table WZ-02, over 80%
of all work zone fatalities and
over 65% of work zone-related
A-injuries occurred between
2010 and 2014 on the state
road system. Urban area ac-
counted for a majority of the
state route work zone fatalities
and serious injuries.
Issues and Contributing Factors to be Addressed
FatalitiesState Roadways Local Roadways
Urban Rural Total Urban Rural Total Total
2010 17(53%)
11(34%)
28(88%)
2(6%)
2(6%)
4(13%)
32(100%)
2011 14(58%)
6(25%)
20(83%)
4(17%)
0(0%)
4(17%)
24(100%)
2012 11(58%)
6(32%)
17(89%)
1(5%)
1(5%)
2(11%)
19(100%)
2013 5(18%)
16(57%)
21(75%)
7(25%)
0(0%)
7(25%)
28(100%)
2014 8(27%)
14(47%)
22(73%)
8(27%)
0(0%)
8(27%)
30(100%)
Total 55(41%)
53(40%)
108(81%)
22(17%)
3(2%)
25(19%)
133(100%)
A-InjuriesState Roadways Local Roadways
Urban Rural Total Urban Rural Total Total
2010 163(64%)
31(12%)
194(76%)
44(17%)
16(6%)
60(24%)
254(100%)
2011 89(47%)
31(16%)
120(64%)
57(30%)
11(6%)
68(36%)
188(100%)
2012 83(34%)
56(23%)
139(57%)
85(35%)
20(8%)
105(43%)
244(100%)
2013 36(28%)
50(39%)
86(67%)
32(25%)
11(9%)
43(33%)
129(100%)
2014 56(34%)
48(29%)
104(63%)
51(31%)
10(6%)
61(37%)
165(100%)
Total 427(44%)
216(22%)
643(66%)
269(27%)
68(7%)
337(34%)
980(100%)
97Illinois Strategic Highway Safety Plan 2017 Work Zone
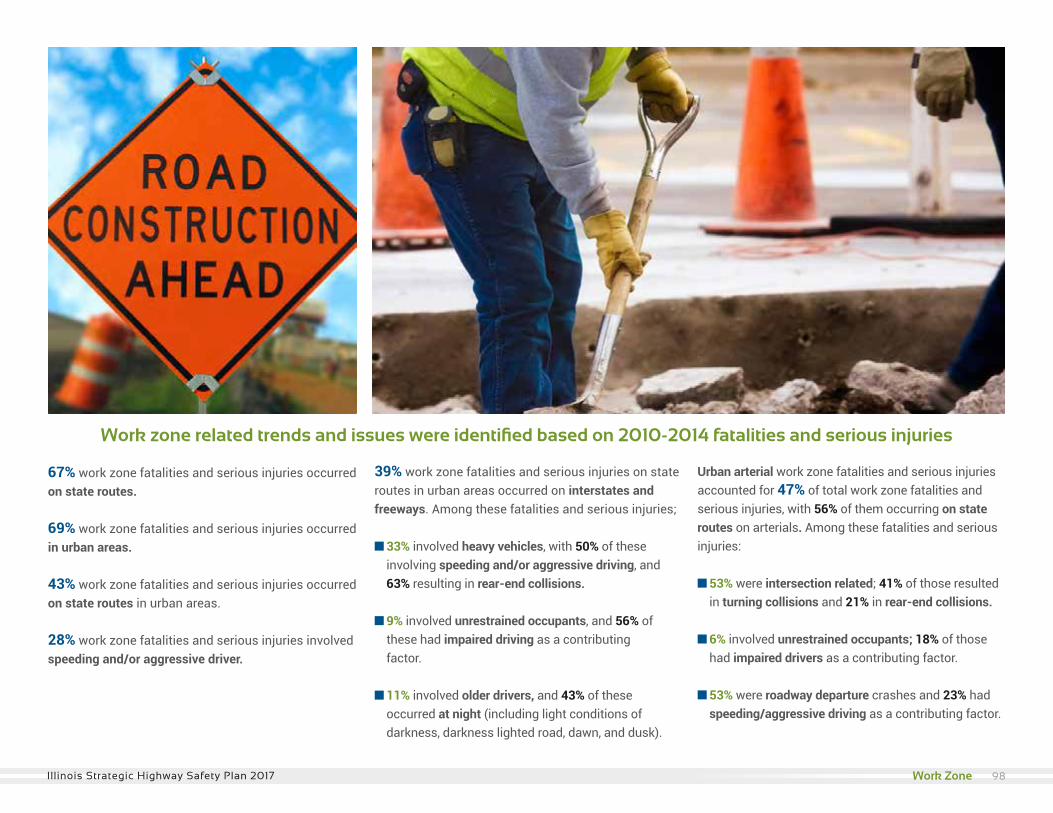
39% work zone fatalities and serious injuries on state routes in urban areas occurred on interstates and freeways. Among these fatalities and serious injuries;
n 33% involved heavy vehicles, with 50% of these involving speeding and/or aggressive driving, and 63% resulting in rear-end collisions.
n 9% involved unrestrained occupants, and 56% of these had impaired driving as a contributing factor.
n 11% involved older drivers, and 43% of these occurred at night (including light conditions of darkness, darkness lighted road, dawn, and dusk).
Urban arterial work zone fatalities and serious injuriesaccounted for 47% of total work zone fatalities andserious injuries, with 56% of them occurring on state routes on arterials. Among these fatalities and seriousinjuries:
n 53% were intersection related; 41% of those resulted in turning collisions and 21% in rear-end collisions.
n 6% involved unrestrained occupants; 18% of those had impaired drivers as a contributing factor.
n 53% were roadway departure crashes and 23% had speeding/aggressive driving as a contributing factor.
67% work zone fatalities and serious injuries occurred on state routes.
69% work zone fatalities and serious injuries occurred in urban areas.
43% work zone fatalities and serious injuries occurred on state routes in urban areas.
28% work zone fatalities and serious injuries involved speeding and/or aggressive driver.
Work zone related trends and issues were identified based on 2010-2014 fatalities and serious injuries
98Illinois Strategic Highway Safety Plan 2017 Work Zone
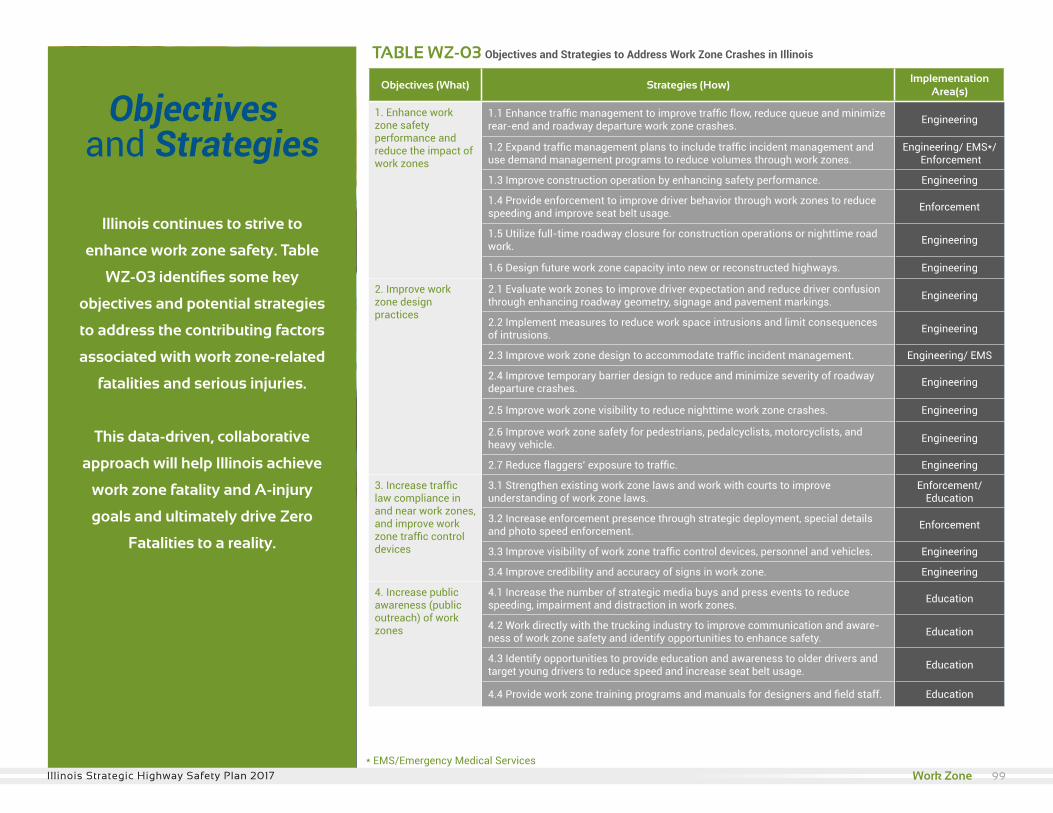
Objectives (What) Strategies (How)Implementation
Area(s)
1. Enhance work zone safety performance and reduce the impact of work zones
1.1 Enhance traffic management to improve traffic flow, reduce queue and minimize rear-end and roadway departure work zone crashes. Engineering
1.2 Expand traffic management plans to include traffic incident management and use demand management programs to reduce volumes through work zones.
Engineering/ EMS*/ Enforcement
1.3 Improve construction operation by enhancing safety performance. Engineering
1.4 Provide enforcement to improve driver behavior through work zones to reduce speeding and improve seat belt usage. Enforcement
1.5 Utilize full-time roadway closure for construction operations or nighttime road work. Engineering
1.6 Design future work zone capacity into new or reconstructed highways. Engineering
2. Improve work zone design practices
2.1 Evaluate work zones to improve driver expectation and reduce driver confusion through enhancing roadway geometry, signage and pavement markings. Engineering
2.2 Implement measures to reduce work space intrusions and limit consequences of intrusions. Engineering
2.3 Improve work zone design to accommodate traffic incident management. Engineering/ EMS
2.4 Improve temporary barrier design to reduce and minimize severity of roadway departure crashes. Engineering
2.5 Improve work zone visibility to reduce nighttime work zone crashes. Engineering
2.6 Improve work zone safety for pedestrians, pedalcyclists, motorcyclists, and heavy vehicle. Engineering
2.7 Reduce flaggers’ exposure to traffic. Engineering
3. Increase traffic law compliance in and near work zones, and improve work zone traffic control devices
3.1 Strengthen existing work zone laws and work with courts to improve understanding of work zone laws.
Enforcement/ Education
3.2 Increase enforcement presence through strategic deployment, special details and photo speed enforcement. Enforcement
3.3 Improve visibility of work zone traffic control devices, personnel and vehicles. Engineering
3.4 Improve credibility and accuracy of signs in work zone. Engineering
4. Increase public awareness (public outreach) of work zones
4.1 Increase the number of strategic media buys and press events to reduce speeding, impairment and distraction in work zones. Education
4.2 Work directly with the trucking industry to improve communication and aware-ness of work zone safety and identify opportunities to enhance safety. Education
4.3 Identify opportunities to provide education and awareness to older drivers and target young drivers to reduce speed and increase seat belt usage. Education
4.4 Provide work zone training programs and manuals for designers and field staff. Education
TABLE WZ-03 Objectives and Strategies to Address Work Zone Crashes in Illinois
Illinois continues to strive to
enhance work zone safety. Table
WZ-03 identifies some key
objectives and potential strategies
to address the contributing factors
associated with work zone-related
fatalities and serious injuries.
This data-driven, collaborative
approach will help Illinois achieve
work zone fatality and A-injury
goals and ultimately drive Zero
Fatalities to a reality.
Objectivesand Strategies
* EMS/Emergency Medical Services99Illinois Strategic Highway Safety Plan 2017 99Illinois Strategic Highway Safety Plan 2017 Work Zone
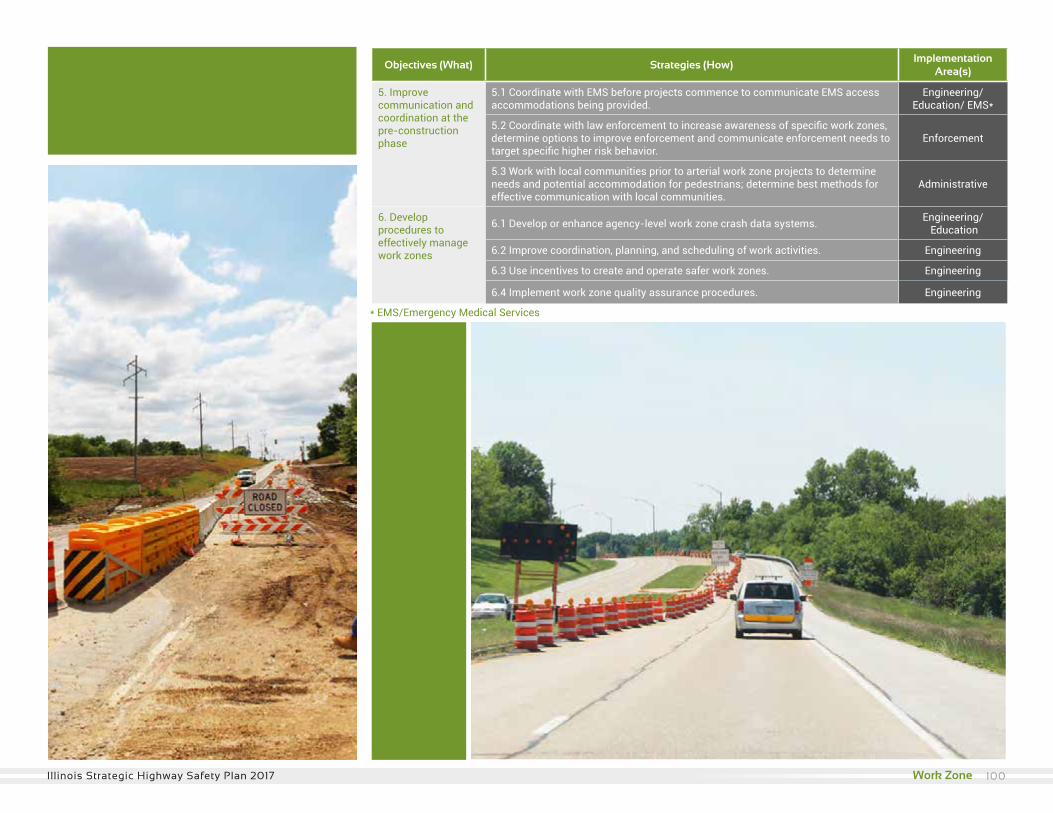
Objectives (What) Strategies (How)Implementation
Area(s)
5. Improve communication and coordination at the pre-construction phase
5.1 Coordinate with EMS before projects commence to communicate EMS access accommodations being provided.
Engineering/ Education/ EMS*
5.2 Coordinate with law enforcement to increase awareness of specific work zones, determine options to improve enforcement and communicate enforcement needs to target specific higher risk behavior.
Enforcement
5.3 Work with local communities prior to arterial work zone projects to determine needs and potential accommodation for pedestrians; determine best methods for effective communication with local communities.
Administrative
6. Develop procedures to effectively manage work zones
6.1 Develop or enhance agency-level work zone crash data systems. Engineering/ Education
6.2 Improve coordination, planning, and scheduling of work activities. Engineering
6.3 Use incentives to create and operate safer work zones. Engineering
6.4 Implement work zone quality assurance procedures. Engineering
* EMS/Emergency Medical Services
100Illinois Strategic Highway Safety Plan 2017 Work Zone
Distracted/Fatigued/Drowsy Driver
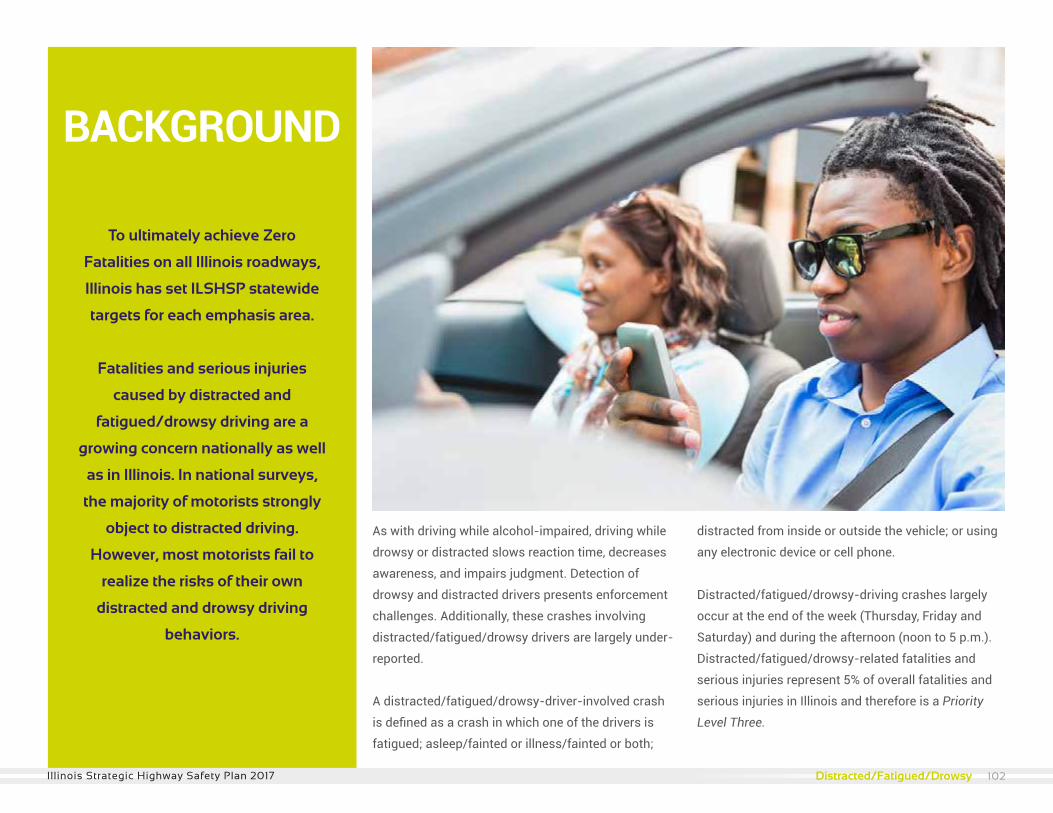
To ultimately achieve Zero
Fatalities on all Illinois roadways,
Illinois has set ILSHSP statewide
targets for each emphasis area.
Fatalities and serious injuries
caused by distracted and
fatigued/drowsy driving are a
growing concern nationally as well
as in Illinois. In national surveys,
the majority of motorists strongly
object to distracted driving.
However, most motorists fail to
realize the risks of their own
distracted and drowsy driving
behaviors.
BACKGROUND
As with driving while alcohol-impaired, driving while
drowsy or distracted slows reaction time, decreases
awareness, and impairs judgment. Detection of
drowsy and distracted drivers presents enforcement
challenges. Additionally, these crashes involving
distracted/fatigued/drowsy drivers are largely under-
reported.
A distracted/fatigued/drowsy-driver-involved crash
is defined as a crash in which one of the drivers is
fatigued; asleep/fainted or illness/fainted or both;
distracted from inside or outside the vehicle; or using
any electronic device or cell phone.
Distracted/fatigued/drowsy-driving crashes largely
occur at the end of the week (Thursday, Friday and
Saturday) and during the afternoon (noon to 5 p.m.).
Distracted/fatigued/drowsy-related fatalities and
serious injuries represent 5% of overall fatalities and
serious injuries in Illinois and therefore is a Priority
Level Three.
102Illinois Strategic Highway Safety Plan 2017 Distracted/Fatigued/Drowsy
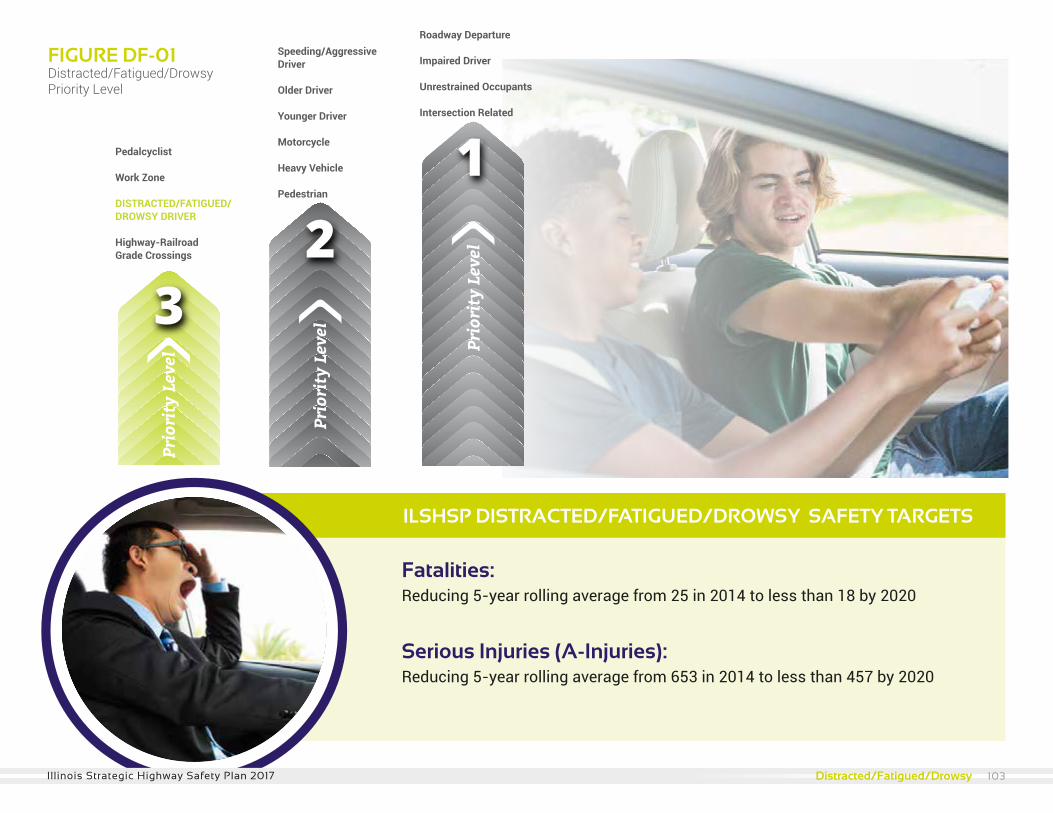
Pedalcyclist
Work Zone
DISTRACTED/FATIGUED/DROWSY DRIVER
Highway-Railroad Grade Crossings
Speeding/AggressiveDriver
Older Driver
Younger Driver
Motorcycle
Heavy Vehicle
Pedestrian
Roadway Departure
Impaired Driver
Unrestrained Occupants
Intersection Related
FIGURE DF-01Distracted/Fatigued/DrowsyPriority Level
Fatalities: Reducing 5-year rolling average from 25 in 2014 to less than 18 by 2020
Serious Injuries (A-Injuries): Reducing 5-year rolling average from 653 in 2014 to less than 457 by 2020
ILSHSP DISTRACTED/FATIGUED/DROWSY SAFETY TARGETS
103Illinois Strategic Highway Safety Plan 2017 Distracted/Fatigued/Drowsy
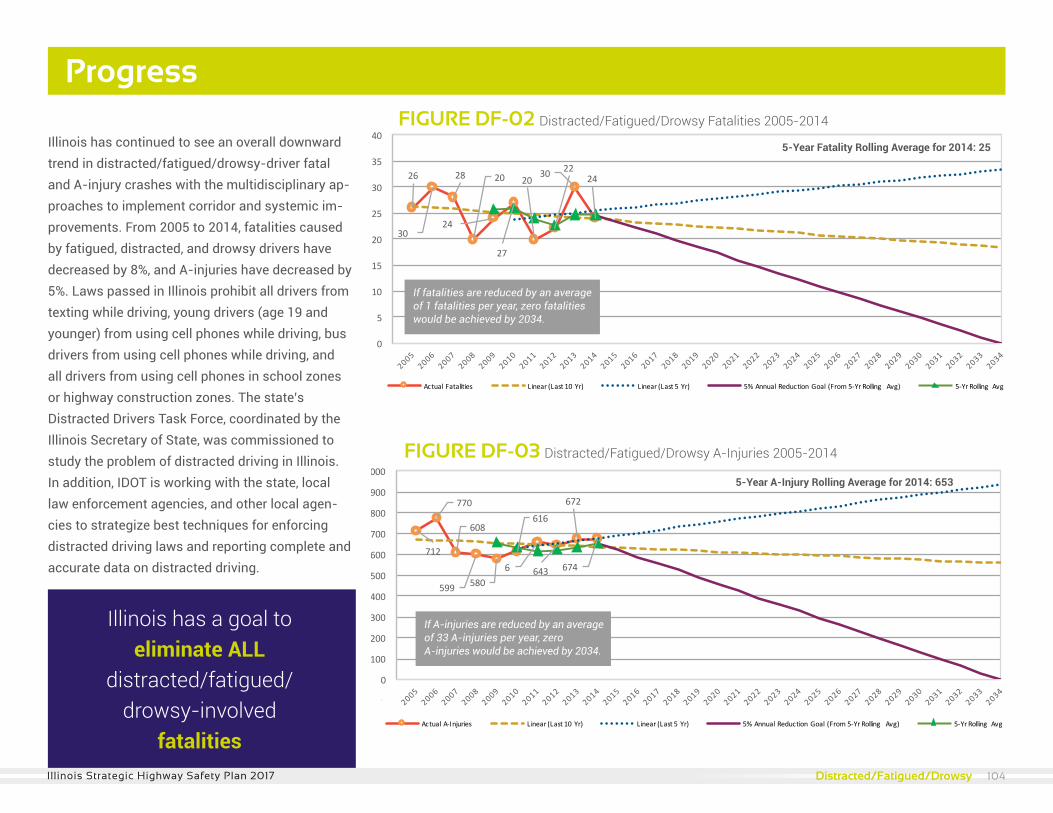
Illinois has continued to see an overall downward trend in distracted/fatigued/drowsy-driver fatal and A-injury crashes with the multidisciplinary ap-proaches to implement corridor and systemic im-provements. From 2005 to 2014, fatalities caused by fatigued, distracted, and drowsy drivers have decreased by 8%, and A-injuries have decreased by 5%. Laws passed in Illinois prohibit all drivers from texting while driving, young drivers (age 19 and younger) from using cell phones while driving, bus drivers from using cell phones while driving, and all drivers from using cell phones in school zones or highway construction zones. The state’s Distracted Drivers Task Force, coordinated by the Illinois Secretary of State, was commissioned to study the problem of distracted driving in Illinois. In addition, IDOT is working with the state, local law enforcement agencies, and other local agen-cies to strategize best techniques for enforcing distracted driving laws and reporting complete and accurate data on distracted driving.
Progress
26
30
28 20
24
27
202230 24
0
5
10
15
20
25
30
35
40
ActualFatalities Linear(Last10Yr) Linear(Last5Yr) 5%AnnualReductionGoal (From5-YrRolling Avg) 5-YrRolling Avg
712
770
608
599 580
616
6 643
672
674
0
100
200
300
400
500
600
700
800
900
1000
ActualA-Injuries Linear(Last10Yr) Linear(Last5Yr) 5%AnnualReductionGoal (From5-YrRolling Avg) 5-YrRolling Avg
FIGURE DF-03 Distracted/Fatigued/Drowsy A-Injuries 2005-2014
If A-injuries are reduced by an average of 33 A-injuries per year, zero A-injuries would be achieved by 2034.
5-Year Fatality Rolling Average for 2014: 25
5-Year A-Injury Rolling Average for 2014: 653
If fatalities are reduced by an average of 1 fatalities per year, zero fatalities would be achieved by 2034.
FIGURE DF-02 Distracted/Fatigued/Drowsy Fatalities 2005-2014
Illinois has a goal to eliminate ALL
distracted/fatigued/drowsy-involved
fatalities104Illinois Strategic Highway Safety Plan 2017 Distracted/Fatigued/Drowsy
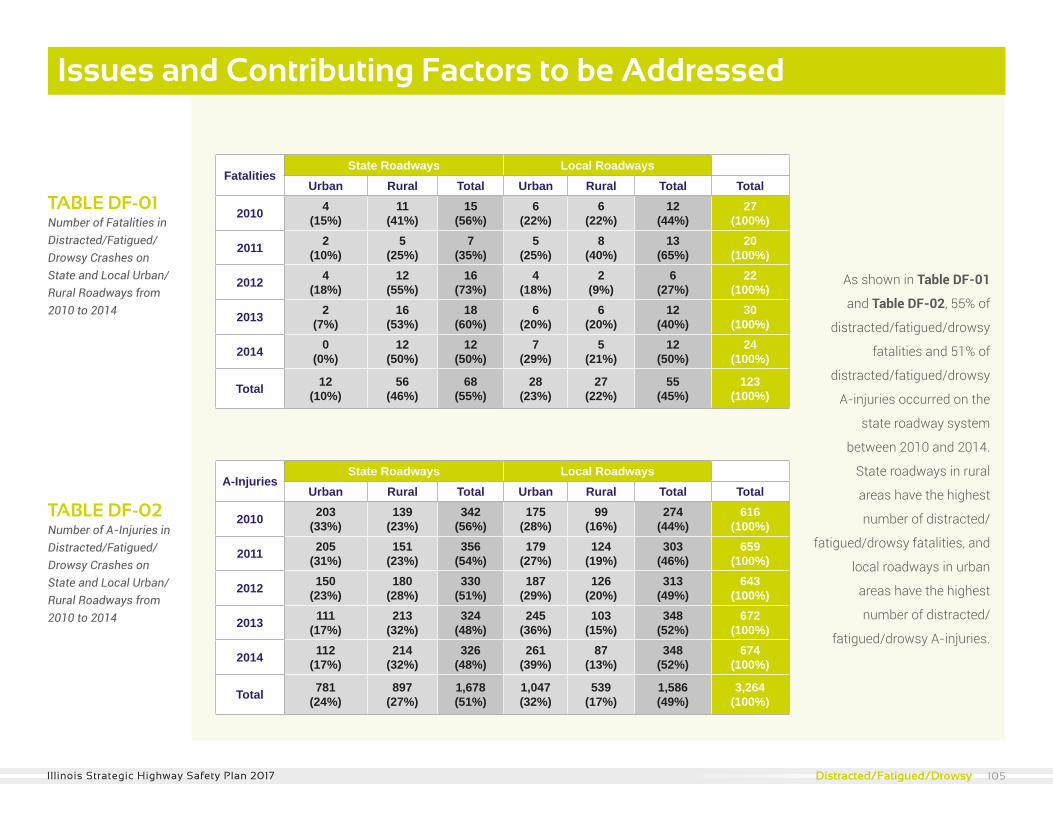
FatalitiesState Roadways Local Roadways
Urban Rural Total Urban Rural Total Total
2010 4(15%)
11(41%)
15(56%)
6(22%)
6(22%)
12(44%)
27(100%)
2011 2(10%)
5(25%)
7(35%)
5(25%)
8(40%)
13(65%)
20(100%)
2012 4(18%)
12(55%)
16(73%)
4(18%)
2(9%)
6(27%)
22(100%)
2013 2(7%)
16(53%)
18(60%)
6(20%)
6(20%)
12(40%)
30(100%)
2014 0(0%)
12(50%)
12(50%)
7(29%)
5(21%)
12(50%)
24(100%)
Total 12(10%)
56(46%)
68(55%)
28(23%)
27(22%)
55(45%)
123(100%)
A-InjuriesState Roadways Local Roadways
Urban Rural Total Urban Rural Total Total
2010 203(33%)
139(23%)
342(56%)
175(28%)
99(16%)
274(44%)
616(100%)
2011 205(31%)
151(23%)
356(54%)
179(27%)
124(19%)
303(46%)
659(100%)
2012 150(23%)
180(28%)
330(51%)
187(29%)
126(20%)
313(49%)
643(100%)
2013 111(17%)
213(32%)
324(48%)
245(36%)
103(15%)
348(52%)
672(100%)
2014 112(17%)
214(32%)
326(48%)
261(39%)
87(13%)
348(52%)
674(100%)
Total 781(24%)
897(27%)
1,678(51%)
1,047(32%)
539(17%)
1,586(49%)
3,264(100%)
TABLE DF-01 Number of Fatalities in Distracted/Fatigued/Drowsy Crashes on State and Local Urban/Rural Roadways from 2010 to 2014
TABLE DF-02 Number of A-Injuries in Distracted/Fatigued/Drowsy Crashes on State and Local Urban/Rural Roadways from2010 to 2014
As shown in Table DF-01
and Table DF-02, 55% of
distracted/fatigued/drowsy
fatalities and 51% of
distracted/fatigued/drowsy
A-injuries occurred on the
state roadway system
between 2010 and 2014.
State roadways in rural
areas have the highest
number of distracted/
fatigued/drowsy fatalities, and
local roadways in urban
areas have the highest
number of distracted/
fatigued/drowsy A-injuries.
Issues and Contributing Factors to be Addressed
Work Zone 105Illinois Strategic Highway Safety Plan 2017 Distracted/Fatigued/Drowsy
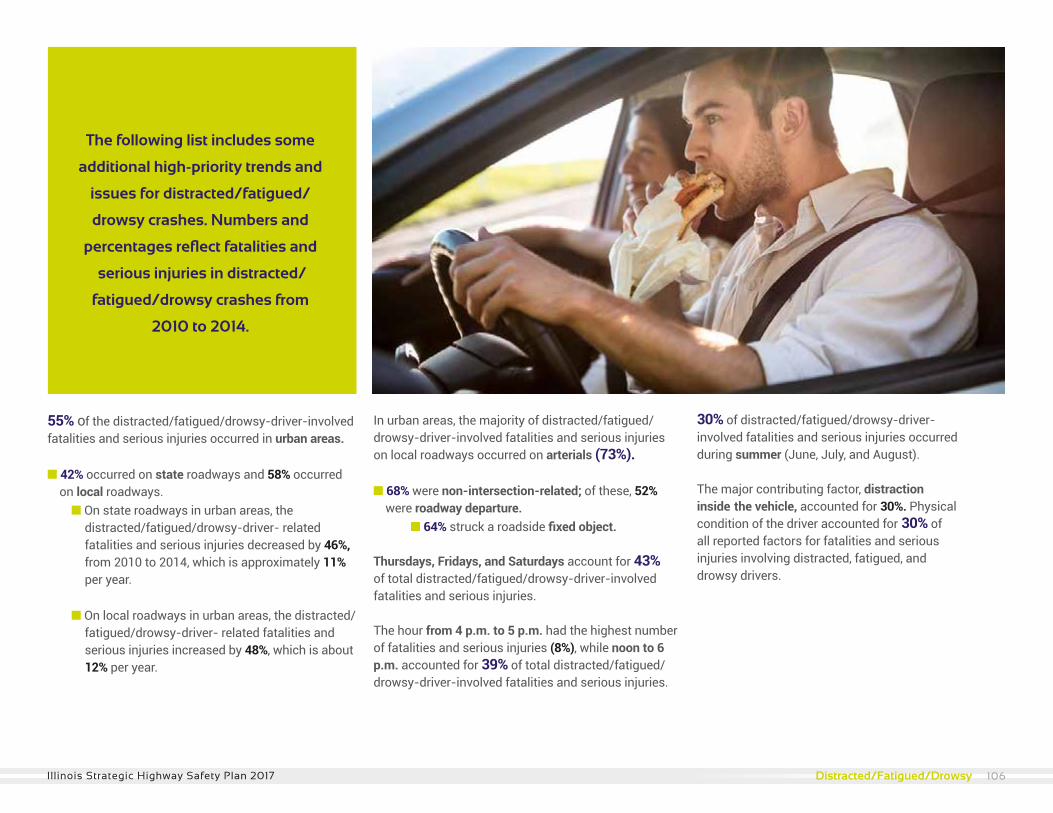
The following list includes some
additional high-priority trends and
issues for distracted/fatigued/
drowsy crashes. Numbers and
percentages reflect fatalities and
serious injuries in distracted/
fatigued/drowsy crashes from
2010 to 2014.
55% of the distracted/fatigued/drowsy-driver-involved fatalities and serious injuries occurred in urban areas.
n 42% occurred on state roadways and 58% occurred on local roadways. n On state roadways in urban areas, the distracted/fatigued/drowsy-driver- related fatalities and serious injuries decreased by 46%, from 2010 to 2014, which is approximately 11% per year.
n On local roadways in urban areas, the distracted/ fatigued/drowsy-driver- related fatalities and serious injuries increased by 48%, which is about 12% per year.
In urban areas, the majority of distracted/fatigued/drowsy-driver-involved fatalities and serious injuries on local roadways occurred on arterials (73%).
n 68% were non-intersection-related; of these, 52% were roadway departure. n 64% struck a roadside fixed object.
Thursdays, Fridays, and Saturdays account for 43% of total distracted/fatigued/drowsy-driver-involved fatalities and serious injuries. The hour from 4 p.m. to 5 p.m. had the highest number of fatalities and serious injuries (8%), while noon to 6 p.m. accounted for 39% of total distracted/fatigued/drowsy-driver-involved fatalities and serious injuries.
30% of distracted/fatigued/drowsy-driver- involved fatalities and serious injuries occurred during summer (June, July, and August).
The major contributing factor, distraction inside the vehicle, accounted for 30%. Physical condition of the driver accounted for 30% of all reported factors for fatalities and serious injuries involving distracted, fatigued, and drowsy drivers.
106Illinois Strategic Highway Safety Plan 2017 Distracted/Fatigued/Drowsy
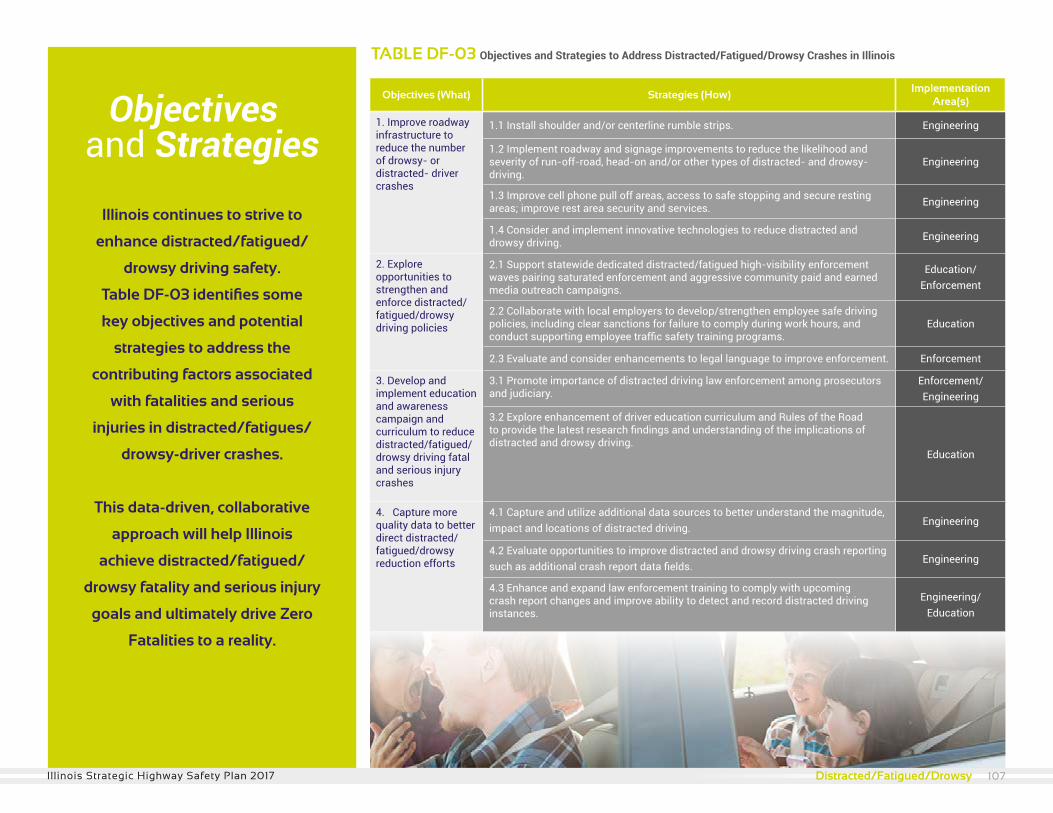
Objectives (What) Strategies (How)Implementation
Area(s)
1. Improve roadway infrastructure to reduce the number of drowsy- or distracted- driver crashes
1.1 Install shoulder and/or centerline rumble strips. Engineering
1.2 Implement roadway and signage improvements to reduce the likelihood and severity of run-off-road, head-on and/or other types of distracted- and drowsy-driving.
Engineering
1.3 Improve cell phone pull off areas, access to safe stopping and secure resting areas; improve rest area security and services. Engineering
1.4 Consider and implement innovative technologies to reduce distracted and drowsy driving. Engineering
2. Explore opportunities to strengthen and enforce distracted/fatigued/drowsy driving policies
2.1 Support statewide dedicated distracted/fatigued high-visibility enforcement waves pairing saturated enforcement and aggressive community paid and earned media outreach campaigns.
Education/ Enforcement
2.2 Collaborate with local employers to develop/strengthen employee safe driving policies, including clear sanctions for failure to comply during work hours, and conduct supporting employee traffic safety training programs.
Education
2.3 Evaluate and consider enhancements to legal language to improve enforcement. Enforcement
3. Develop and implement education and awareness campaign and curriculum to reduce distracted/fatigued/drowsy driving fatal and serious injury crashes
3.1 Promote importance of distracted driving law enforcement among prosecutors and judiciary.
Enforcement/Engineering
3.2 Explore enhancement of driver education curriculum and Rules of the Road to provide the latest research findings and understanding of the implications of distracted and drowsy driving.
Education
4. Capture more quality data to better direct distracted/fatigued/drowsy reduction efforts
4.1 Capture and utilize additional data sources to better understand the magnitude, impact and locations of distracted driving. Engineering
4.2 Evaluate opportunities to improve distracted and drowsy driving crash reporting such as additional crash report data fields.
Engineering
4.3 Enhance and expand law enforcement training to comply with upcoming crash report changes and improve ability to detect and record distracted driving instances.
Engineering/Education
TABLE DF-03 Objectives and Strategies to Address Distracted/Fatigued/Drowsy Crashes in Illinois
Illinois continues to strive to
enhance distracted/fatigued/
drowsy driving safety.
Table DF-03 identifies some
key objectives and potential
strategies to address the
contributing factors associated
with fatalities and serious
injuries in distracted/fatigues/
drowsy-driver crashes.
This data-driven, collaborative
approach will help Illinois
achieve distracted/fatigued/
drowsy fatality and serious injury
goals and ultimately drive Zero
Fatalities to a reality.
Objectivesand Strategies
107Illinois Strategic Highway Safety Plan 2017 Distracted/Fatigued/Drowsy
Highway-Railroad Grade Crossings
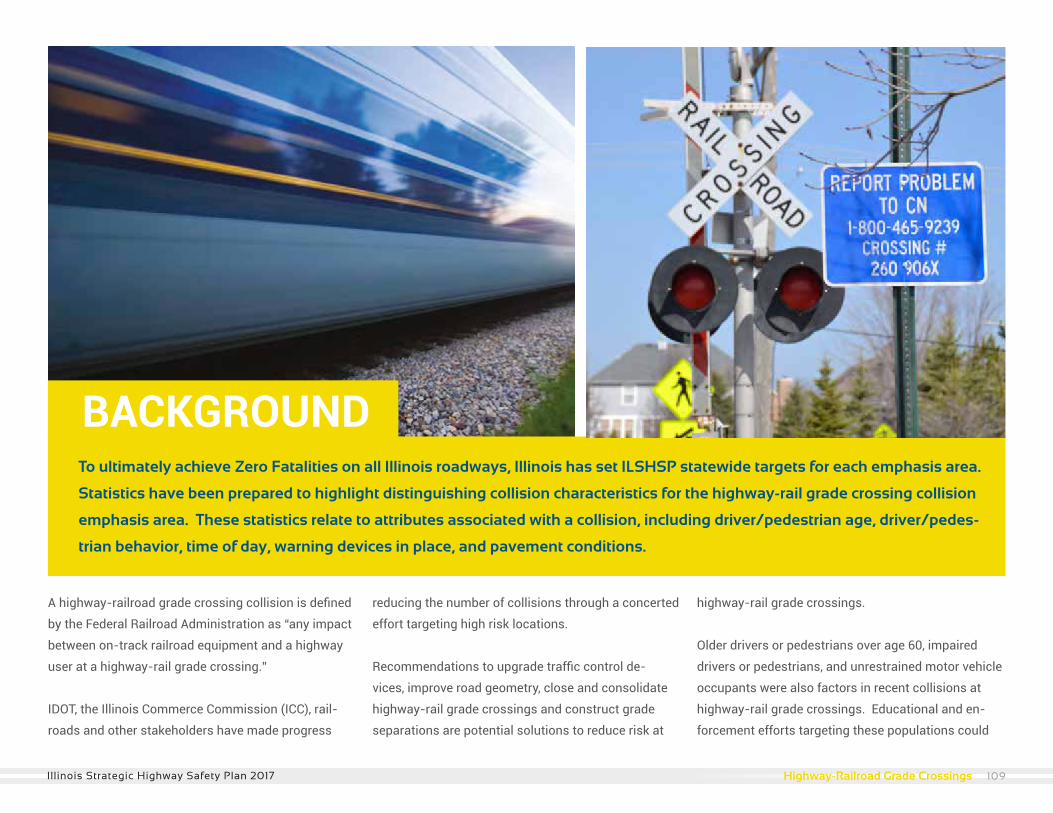
To ultimately achieve Zero Fatalities on all Illinois roadways, Illinois has set ILSHSP statewide targets for each emphasis area.
Statistics have been prepared to highlight distinguishing collision characteristics for the highway-rail grade crossing collision
emphasis area. These statistics relate to attributes associated with a collision, including driver/pedestrian age, driver/pedes-
trian behavior, time of day, warning devices in place, and pavement conditions.
A highway-railroad grade crossing collision is defined
by the Federal Railroad Administration as “any impact
between on-track railroad equipment and a highway
user at a highway-rail grade crossing.”
IDOT, the Illinois Commerce Commission (ICC), rail-
roads and other stakeholders have made progress
reducing the number of collisions through a concerted
effort targeting high risk locations.
Recommendations to upgrade traffic control de-
vices, improve road geometry, close and consolidate
highway-rail grade crossings and construct grade
separations are potential solutions to reduce risk at
highway-rail grade crossings.
Older drivers or pedestrians over age 60, impaired
drivers or pedestrians, and unrestrained motor vehicle
occupants were also factors in recent collisions at
highway-rail grade crossings. Educational and en-
forcement efforts targeting these populations could
BACKGROUND
109Illinois Strategic Highway Safety Plan 2017 Highway-Railroad Grade Crossings
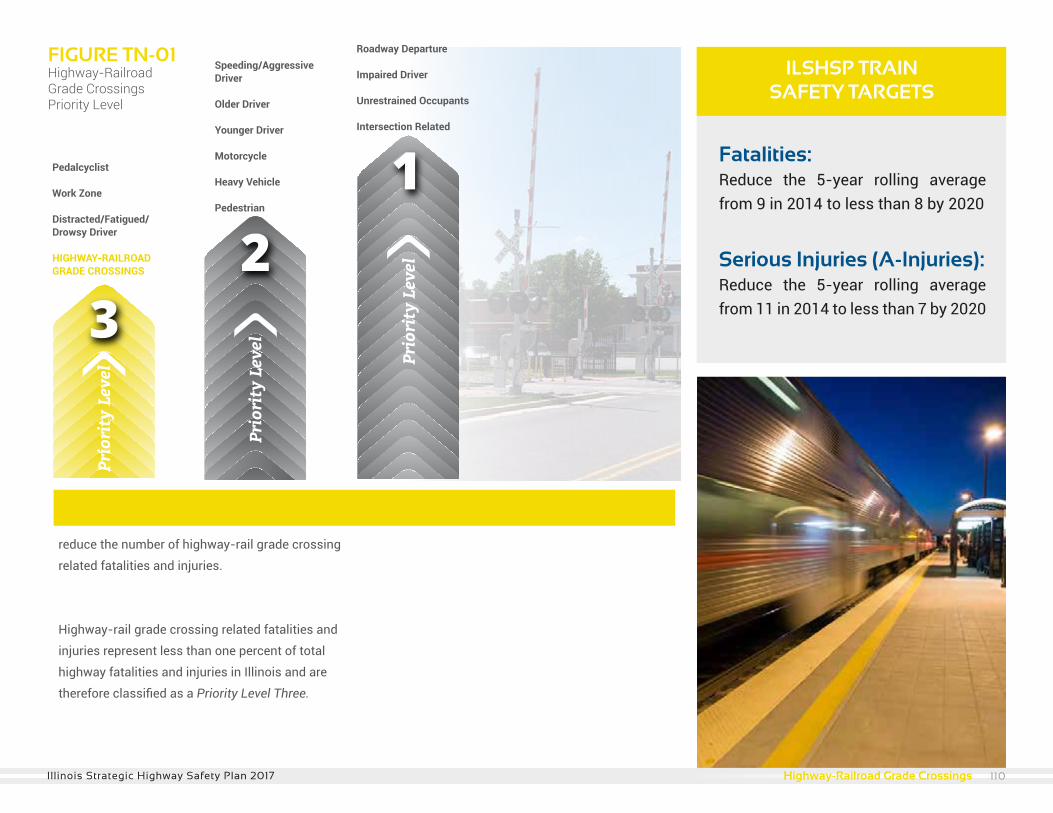
Pedalcyclist
Work Zone
Distracted/Fatigued/Drowsy Driver
HIGHWAY-RAILROAD GRADE CROSSINGS
Speeding/AggressiveDriver
Older Driver
Younger Driver
Motorcycle
Heavy Vehicle
Pedestrian
Roadway Departure
Impaired Driver
Unrestrained Occupants
Intersection Related
Fatalities: Reduce the 5-year rolling average from 9 in 2014 to less than 8 by 2020
Serious Injuries (A-Injuries): Reduce the 5-year rolling average from 11 in 2014 to less than 7 by 2020
FIGURE TN-01Highway-Railroad Grade CrossingsPriority Level
ILSHSP TRAIN SAFETY TARGETS
reduce the number of highway-rail grade crossing
related fatalities and injuries.
Highway-rail grade crossing related fatalities and
injuries represent less than one percent of total
highway fatalities and injuries in Illinois and are
therefore classified as a Priority Level Three.
110Illinois Strategic Highway Safety Plan 2017 Highway-Railroad Grade Crossings
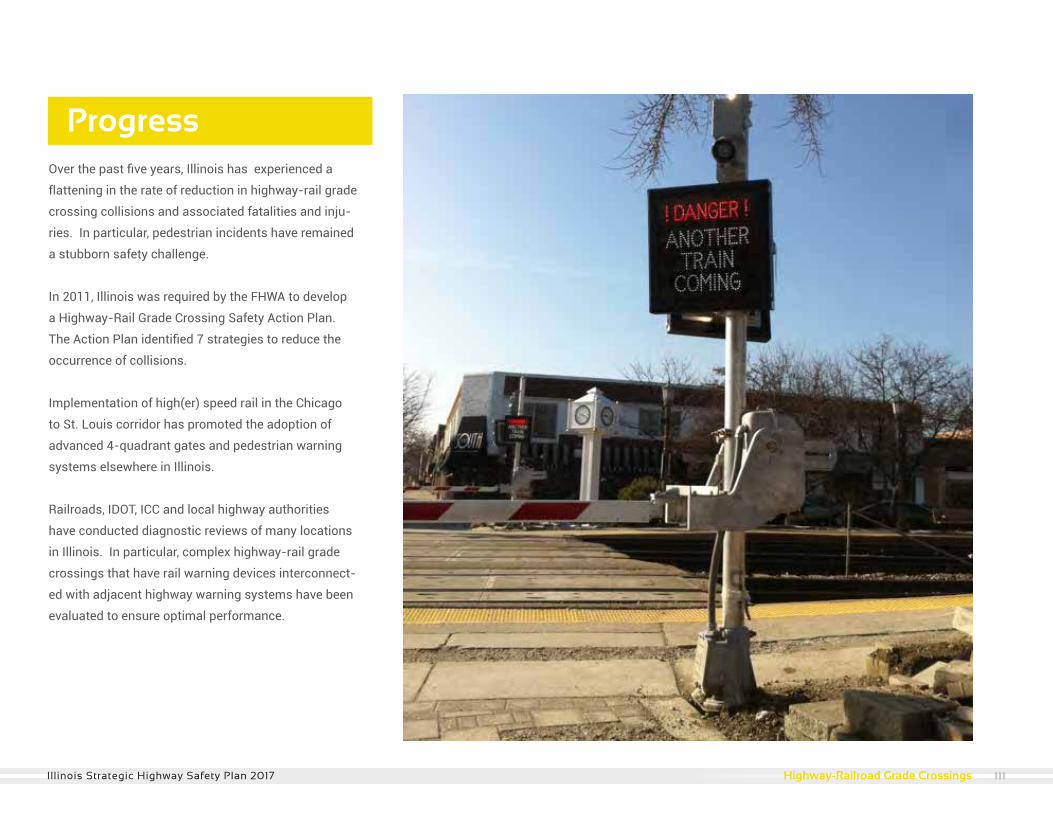
ProgressOver the past five years, Illinois has experienced a
flattening in the rate of reduction in highway-rail grade
crossing collisions and associated fatalities and inju-
ries. In particular, pedestrian incidents have remained
a stubborn safety challenge.
In 2011, Illinois was required by the FHWA to develop
a Highway-Rail Grade Crossing Safety Action Plan.
The Action Plan identified 7 strategies to reduce the
occurrence of collisions.
Implementation of high(er) speed rail in the Chicago
to St. Louis corridor has promoted the adoption of
advanced 4-quadrant gates and pedestrian warning
systems elsewhere in Illinois.
Railroads, IDOT, ICC and local highway authorities
have conducted diagnostic reviews of many locations
in Illinois. In particular, complex highway-rail grade
crossings that have rail warning devices interconnect-
ed with adjacent highway warning systems have been
evaluated to ensure optimal performance.
111Illinois Strategic Highway Safety Plan 2017 Highway-Railroad Grade Crossings
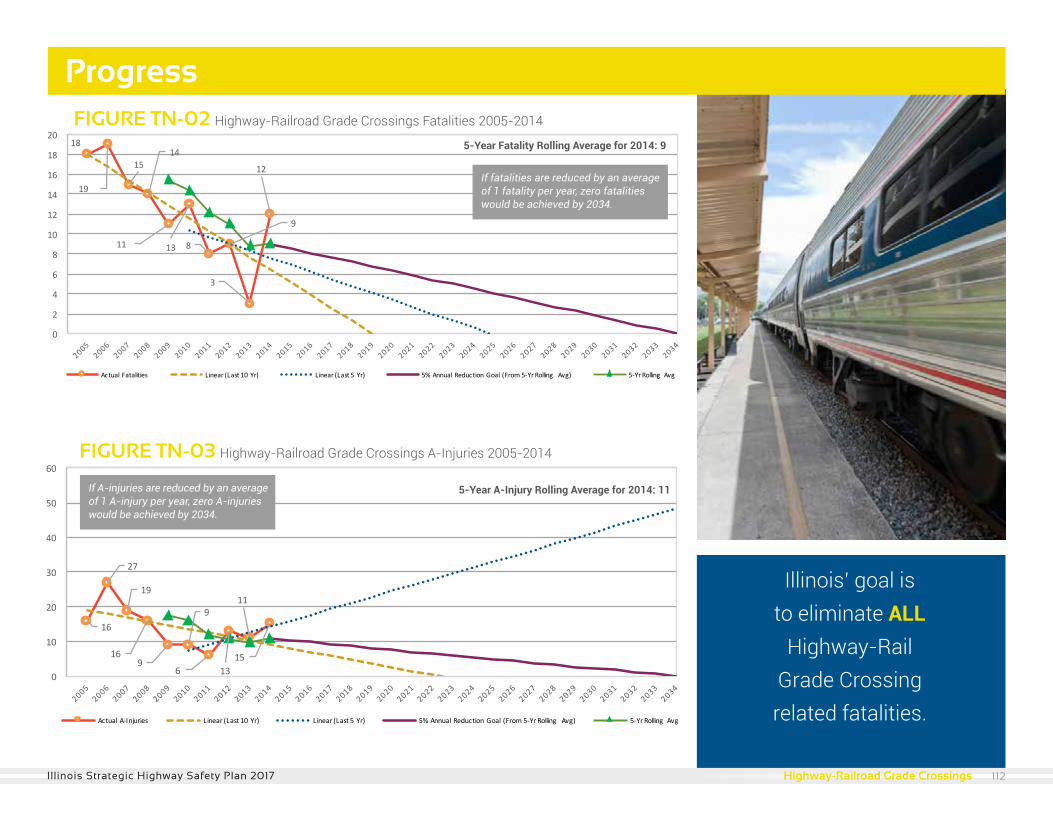
Progress
18
19
1514
11 13 8
9
3
12
0
2
4
6
8
10
12
14
16
18
20
ActualFatalities Linear(Last10Yr) Linear(Last5Yr) 5%AnnualReductionGoal (From5-YrRolling Avg) 5-YrRolling Avg
16
27
19
16 9
9
6
13
11
150
10
20
30
40
50
60
ActualA-Injuries Linear(Last10Yr) Linear(Last5Yr) 5%AnnualReductionGoal (From5-YrRolling Avg) 5-YrRolling Avg
16
27
19
169
9
6 13
11
15
0
10
20
30
40
50
60
ActualA-Injuries Linear(Last10Yr) Linear(Last5Yr) 5%AnnualReductionGoal (From5-YrRolling Avg) 5-YrRolling Avg
FIGURE TN-03 Highway-Railroad Grade Crossings A-Injuries 2005-2014
If A-injuries are reduced by an average of 1 A-injury per year, zero A-injuries would be achieved by 2034.
5-Year Fatality Rolling Average for 2014: 9
5-Year A-Injury Rolling Average for 2014: 11
If fatalities are reduced by an average of 1 fatality per year, zero fatalities would be achieved by 2034.
FIGURE TN-02 Highway-Railroad Grade Crossings Fatalities 2005-2014
Distracted/Fatigued/Drowsy
Illinois’ goal isto eliminate ALL
Highway-Rail Grade Crossingrelated fatalities.
112Illinois Strategic Highway Safety Plan 2017 Highway-Railroad Grade Crossings
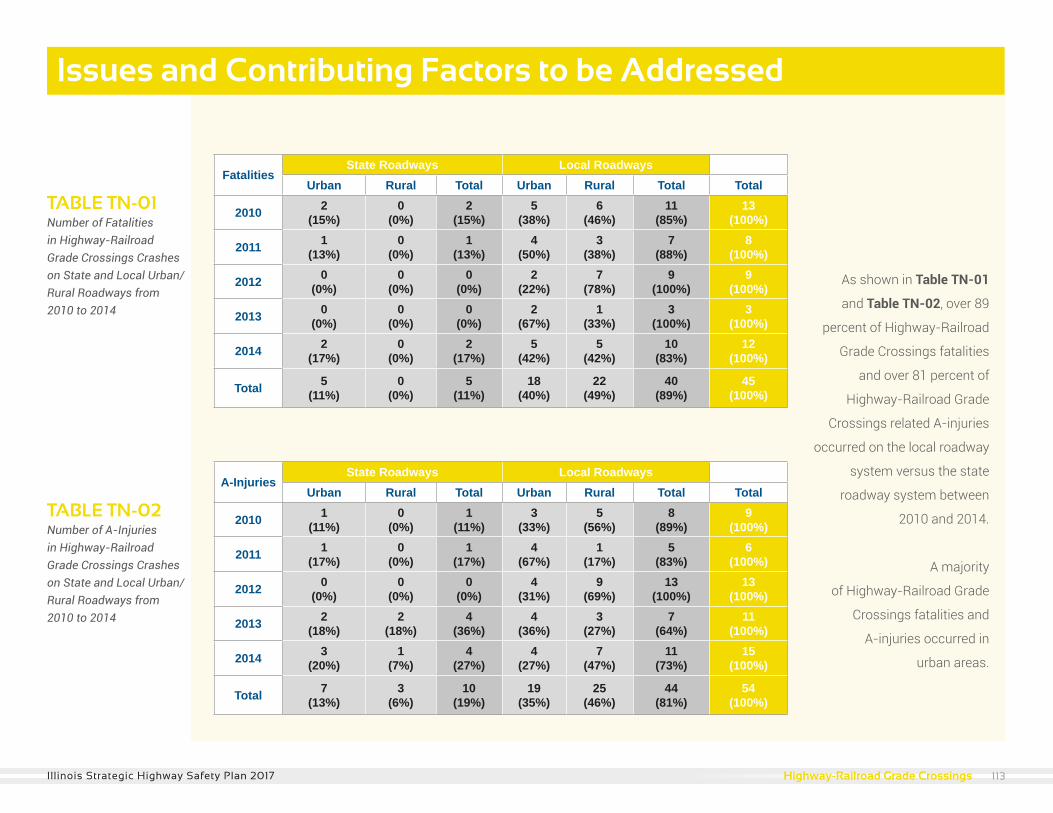
FatalitiesState Roadways Local Roadways
Urban Rural Total Urban Rural Total Total
2010 2(15%)
0(0%)
2(15%)
5(38%)
6(46%)
11(85%)
13(100%)
2011 1(13%)
0(0%)
1(13%)
4(50%)
3(38%)
7(88%)
8(100%)
2012 0(0%)
0(0%)
0(0%)
2(22%)
7(78%)
9(100%)
9(100%)
2013 0(0%)
0(0%)
0(0%)
2(67%)
1(33%)
3(100%)
3(100%)
2014 2(17%)
0(0%)
2(17%)
5(42%)
5(42%)
10(83%)
12(100%)
Total 5(11%)
0(0%)
5(11%)
18(40%)
22(49%)
40(89%)
45(100%)
A-InjuriesState Roadways Local Roadways
Urban Rural Total Urban Rural Total Total
2010 1(11%)
0(0%)
1(11%)
3(33%)
5(56%)
8(89%)
9(100%)
2011 1(17%)
0(0%)
1(17%)
4(67%)
1(17%)
5(83%)
6(100%)
2012 0(0%)
0(0%)
0(0%)
4(31%)
9(69%)
13(100%)
13(100%)
2013 2(18%)
2(18%)
4(36%)
4(36%)
3(27%)
7(64%)
11(100%)
2014 3(20%)
1(7%)
4(27%)
4(27%)
7(47%)
11(73%)
15(100%)
Total 7(13%)
3(6%)
10(19%)
19(35%)
25(46%)
44(81%)
54(100%)
TABLE TN-01 Number of Fatalities in Highway-RailroadGrade Crossings Crasheson State and Local Urban/Rural Roadways from 2010 to 2014
TABLE TN-02 Number of A-Injuries in Highway-RailroadGrade Crossings Crashes on State and Local Urban/Rural Roadways from2010 to 2014
As shown in Table TN-01
and Table TN-02, over 89
percent of Highway-Railroad
Grade Crossings fatalities
and over 81 percent of
Highway-Railroad Grade
Crossings related A-injuries
occurred on the local roadway
system versus the state
roadway system between
2010 and 2014.
A majority
of Highway-Railroad Grade
Crossings fatalities and
A-injuries occurred in
urban areas.
Issues and Contributing Factors to be Addressed
Work ZoneDistracted/Fatigued/Drowsy 113Illinois Strategic Highway Safety Plan 2017 Highway-Railroad Grade Crossings
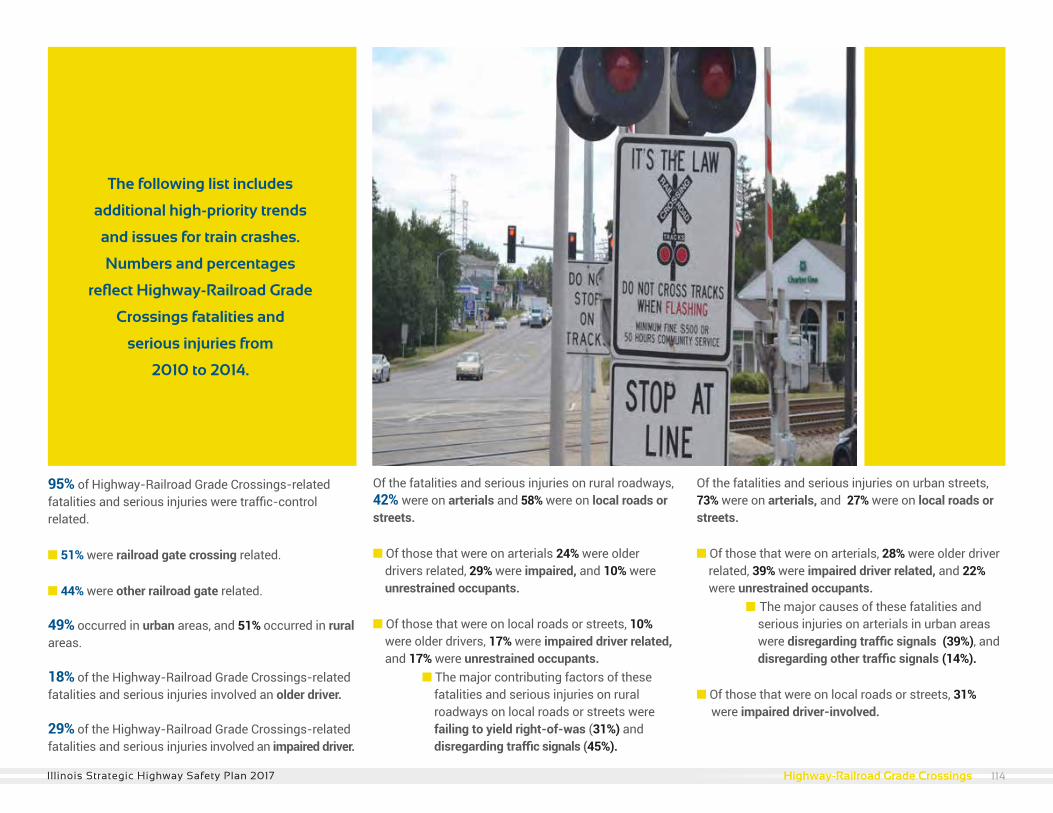
The following list includes
additional high-priority trends
and issues for train crashes.
Numbers and percentages
reflect Highway-Railroad Grade
Crossings fatalities and
serious injuries from
2010 to 2014.
95% of Highway-Railroad Grade Crossings-related fatalities and serious injuries were traffic-control related.
n 51% were railroad gate crossing related.
n 44% were other railroad gate related.
49% occurred in urban areas, and 51% occurred in rural areas.
18% of the Highway-Railroad Grade Crossings-related fatalities and serious injuries involved an older driver.
29% of the Highway-Railroad Grade Crossings-related fatalities and serious injuries involved an impaired driver.
Of the fatalities and serious injuries on rural roadways, 42% were on arterials and 58% were on local roads or streets.
n Of those that were on arterials 24% were older drivers related, 29% were impaired, and 10% were unrestrained occupants.
n Of those that were on local roads or streets, 10% were older drivers, 17% were impaired driver related, and 17% were unrestrained occupants. n The major contributing factors of these fatalities and serious injuries on rural roadways on local roads or streets were failing to yield right-of-was (31%) and disregarding traffic signals (45%).
Of the fatalities and serious injuries on urban streets, 73% were on arterials, and 27% were on local roads or streets.
n Of those that were on arterials, 28% were older driver related, 39% were impaired driver related, and 22% were unrestrained occupants. n The major causes of these fatalities and serious injuries on arterials in urban areas were disregarding traffic signals (39%), and disregarding other traffic signals (14%).
n Of those that were on local roads or streets, 31% were impaired driver-involved.
114Illinois Strategic Highway Safety Plan 2017 Highway-Railroad Grade Crossings
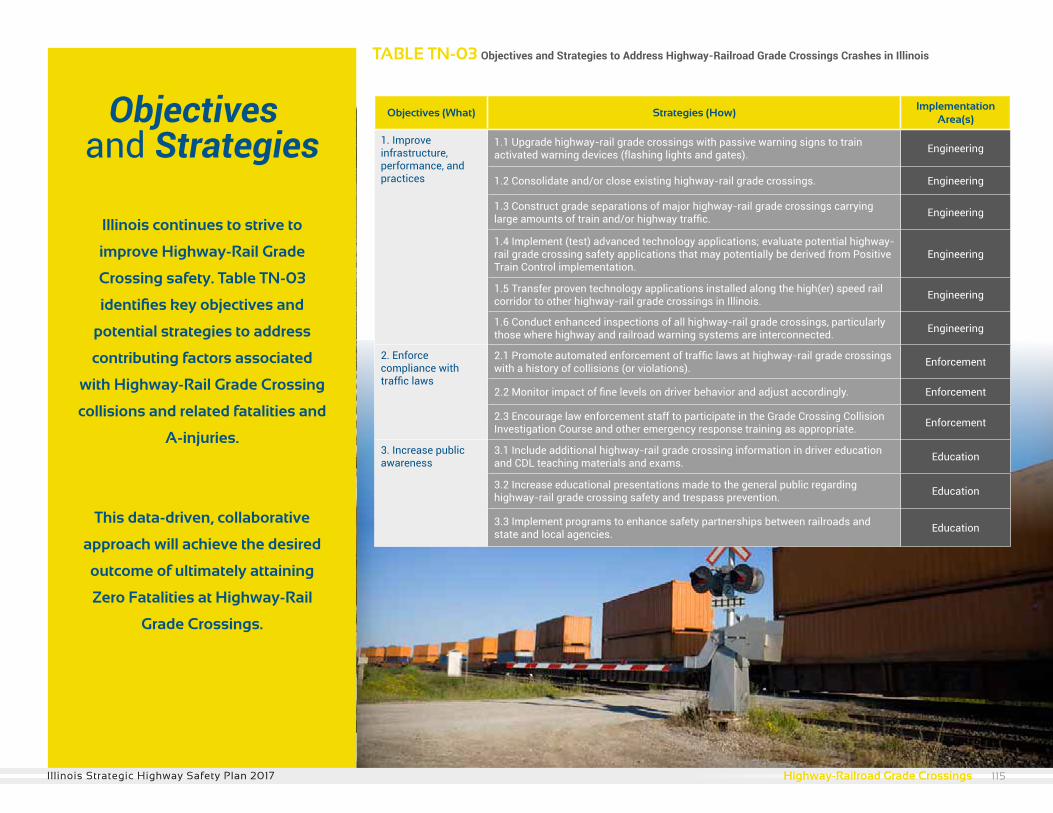
Objectives (What) Strategies (How)Implementation
Area(s)
1. Improve infrastructure, performance, and practices
1.1 Upgrade highway-rail grade crossings with passive warning signs to train activated warning devices (flashing lights and gates). Engineering
1.2 Consolidate and/or close existing highway-rail grade crossings. Engineering
1.3 Construct grade separations of major highway-rail grade crossings carrying large amounts of train and/or highway traffic. Engineering
1.4 Implement (test) advanced technology applications; evaluate potential highway-rail grade crossing safety applications that may potentially be derived from Positive Train Control implementation.
Engineering
1.5 Transfer proven technology applications installed along the high(er) speed rail corridor to other highway-rail grade crossings in Illinois. Engineering
1.6 Conduct enhanced inspections of all highway-rail grade crossings, particularly those where highway and railroad warning systems are interconnected. Engineering
2. Enforce compliance with traffic laws
2.1 Promote automated enforcement of traffic laws at highway-rail grade crossings with a history of collisions (or violations). Enforcement
2.2 Monitor impact of fine levels on driver behavior and adjust accordingly. Enforcement
2.3 Encourage law enforcement staff to participate in the Grade Crossing Collision Investigation Course and other emergency response training as appropriate. Enforcement
3. Increase public awareness
3.1 Include additional highway-rail grade crossing information in driver education and CDL teaching materials and exams. Education
3.2 Increase educational presentations made to the general public regarding highway-rail grade crossing safety and trespass prevention. Education
3.3 Implement programs to enhance safety partnerships between railroads and state and local agencies. Education
TABLE TN-03 Objectives and Strategies to Address Highway-Railroad Grade Crossings Crashes in Illinois
Illinois continues to strive to
improve Highway-Rail Grade
Crossing safety. Table TN-03
identifies key objectives and
potential strategies to address
contributing factors associated
with Highway-Rail Grade Crossing
collisions and related fatalities and
A-injuries.
This data-driven, collaborative
approach will achieve the desired
outcome of ultimately attaining
Zero Fatalities at Highway-Rail
Grade Crossings.
Objectivesand Strategies
115Illinois Strategic Highway Safety Plan 2017 Highway-Railroad Grade Crossings
Traffic Incident Management
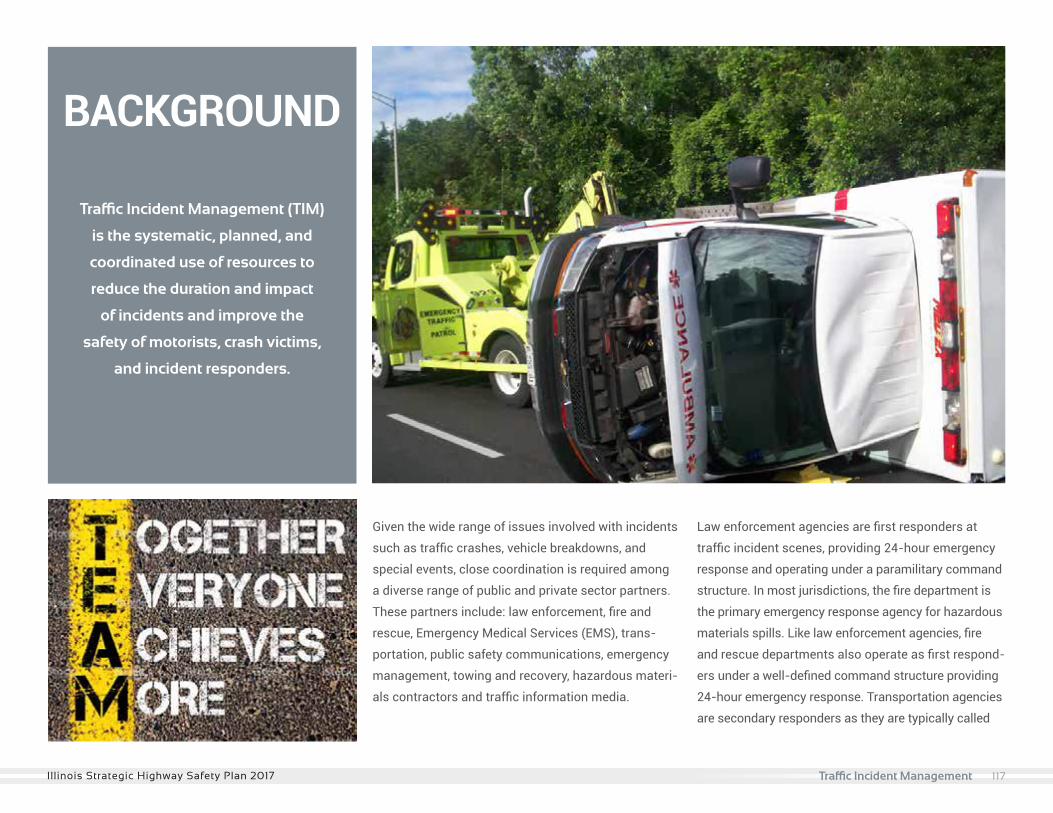
Traffic Incident Management (TIM)
is the systematic, planned, and
coordinated use of resources to
reduce the duration and impact
of incidents and improve the
safety of motorists, crash victims,
and incident responders.
BACKGROUND
Given the wide range of issues involved with incidents
such as traffic crashes, vehicle breakdowns, and
special events, close coordination is required among
a diverse range of public and private sector partners.
These partners include: law enforcement, fire and
rescue, Emergency Medical Services (EMS), trans-
portation, public safety communications, emergency
management, towing and recovery, hazardous materi-
als contractors and traffic information media.
Law enforcement agencies are first responders at
traffic incident scenes, providing 24-hour emergency
response and operating under a paramilitary command
structure. In most jurisdictions, the fire department is
the primary emergency response agency for hazardous
materials spills. Like law enforcement agencies, fire
and rescue departments also operate as first respond-
ers under a well-defined command structure providing
24-hour emergency response. Transportation agencies
are secondary responders as they are typically called
117Illinois Strategic Highway Safety Plan 2017 Traffic Incident Management
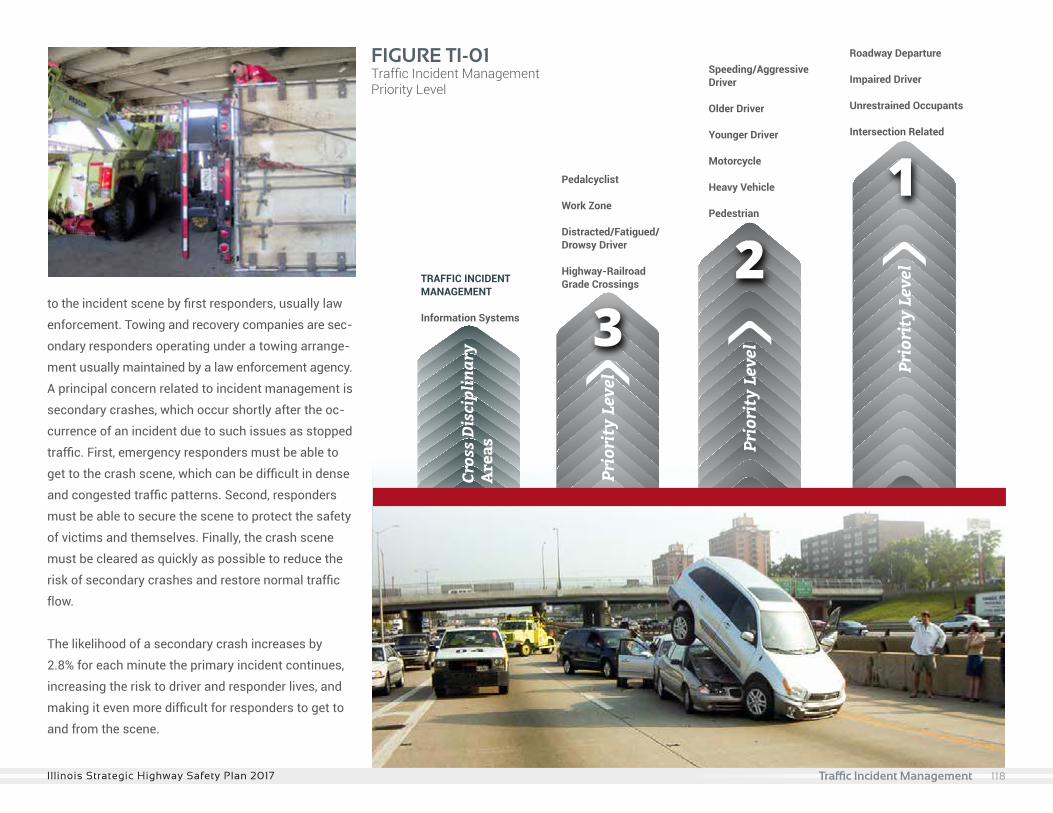
to the incident scene by first responders, usually law
enforcement. Towing and recovery companies are sec-
ondary responders operating under a towing arrange-
ment usually maintained by a law enforcement agency.
A principal concern related to incident management is
secondary crashes, which occur shortly after the oc-
currence of an incident due to such issues as stopped
traffic. First, emergency responders must be able to
get to the crash scene, which can be difficult in dense
and congested traffic patterns. Second, responders
must be able to secure the scene to protect the safety
of victims and themselves. Finally, the crash scene
must be cleared as quickly as possible to reduce the
risk of secondary crashes and restore normal traffic
flow.
The likelihood of a secondary crash increases by
2.8% for each minute the primary incident continues,
increasing the risk to driver and responder lives, and
making it even more difficult for responders to get to
and from the scene.
Pedalcyclist
Work Zone
Distracted/Fatigued/Drowsy Driver
Highway-RailroadGrade Crossings
Speeding/Aggressive Driver
Older Driver
Younger Driver
Motorcycle
Heavy Vehicle
Pedestrian
Roadway Departure
Impaired Driver
Unrestrained Occupants
Intersection Related
TRAFFIC INCIDENT MANAGEMENT
Information Systems
Cros
s D
isci
plin
ary
Are
as
FIGURE TI-01Traffic Incident Management Priority Level
Train 118Illinois Strategic Highway Safety Plan 2017 Traffic Incident Management
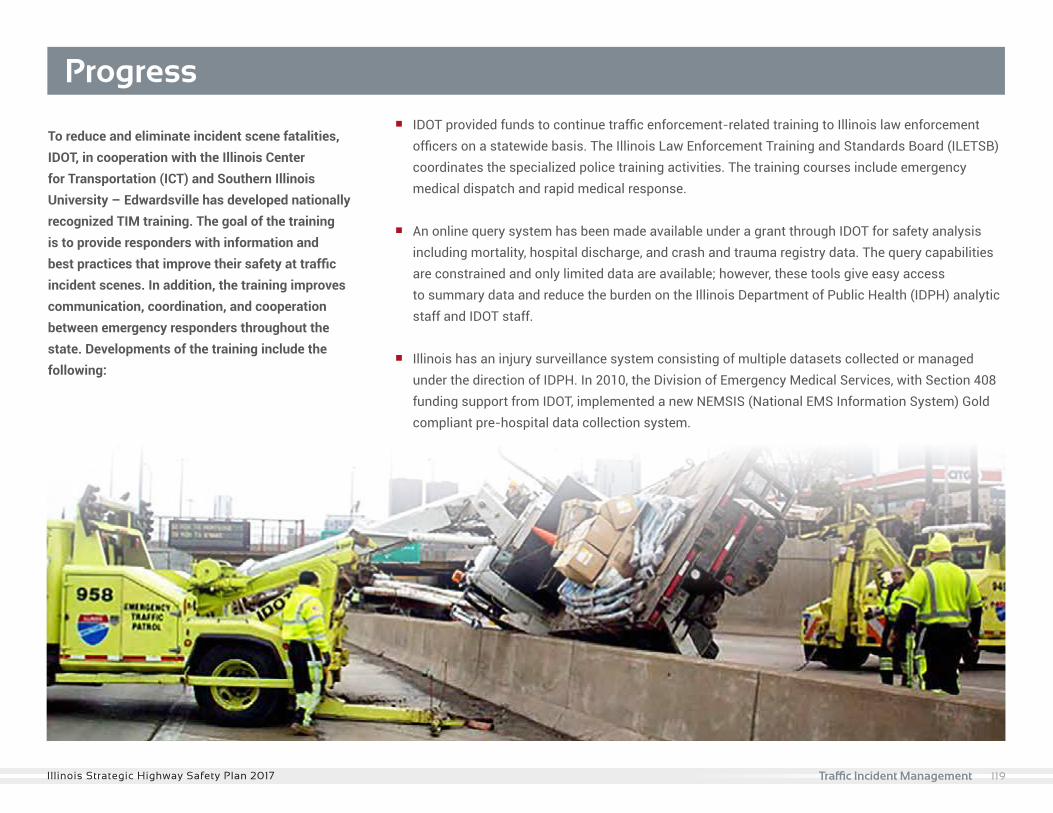
Progress
Distracted/Fatigued/Drowsy Train
To reduce and eliminate incident scene fatalities, IDOT, in cooperation with the Illinois Center for Transportation (ICT) and Southern Illinois University – Edwardsville has developed nationally recognized TIM training. The goal of the training is to provide responders with information and best practices that improve their safety at traffic incident scenes. In addition, the training improves communication, coordination, and cooperation between emergency responders throughout the state. Developments of the training include the following:
n IDOT provided funds to continue traffic enforcement-related training to Illinois law enforcement officers on a statewide basis. The Illinois Law Enforcement Training and Standards Board (ILETSB) coordinates the specialized police training activities. The training courses include emergency medical dispatch and rapid medical response.
n An online query system has been made available under a grant through IDOT for safety analysis including mortality, hospital discharge, and crash and trauma registry data. The query capabilities are constrained and only limited data are available; however, these tools give easy access to summary data and reduce the burden on the Illinois Department of Public Health (IDPH) analytic staff and IDOT staff.
n Illinois has an injury surveillance system consisting of multiple datasets collected or managed under the direction of IDPH. In 2010, the Division of Emergency Medical Services, with Section 408 funding support from IDOT, implemented a new NEMSIS (National EMS Information System) Gold compliant pre-hospital data collection system.
119Illinois Strategic Highway Safety Plan 2017 Traffic Incident Management
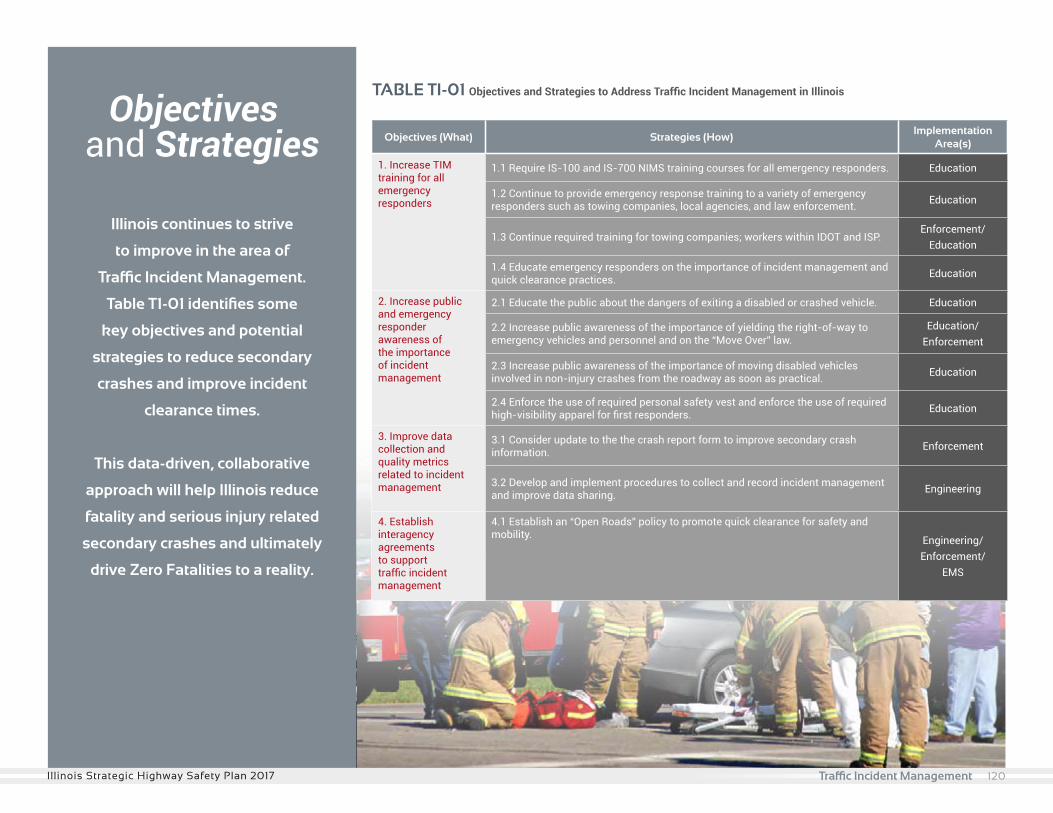
Objectives (What) Strategies (How)Implementation
Area(s)
1. Increase TIM training for all emergency responders
1.1 Require IS-100 and IS-700 NIMS training courses for all emergency responders. Education
1.2 Continue to provide emergency response training to a variety of emergency responders such as towing companies, local agencies, and law enforcement. Education
1.3 Continue required training for towing companies; workers within IDOT and ISP.Enforcement/
Education
1.4 Educate emergency responders on the importance of incident management and quick clearance practices. Education
2. Increase public and emergency responder awareness of the importance of incident management
2.1 Educate the public about the dangers of exiting a disabled or crashed vehicle. Education
2.2 Increase public awareness of the importance of yielding the right-of-way to emergency vehicles and personnel and on the “Move Over” law.
Education/ Enforcement
2.3 Increase public awareness of the importance of moving disabled vehicles involved in non-injury crashes from the roadway as soon as practical. Education
2.4 Enforce the use of required personal safety vest and enforce the use of required high-visibility apparel for first responders. Education
3. Improve data collection and quality metrics related to incident management
3.1 Consider update to the the crash report form to improve secondary crash information. Enforcement
3.2 Develop and implement procedures to collect and record incident management and improve data sharing. Engineering
4. Establish interagency agreements to support traffic incident management
4.1 Establish an “Open Roads” policy to promote quick clearance for safety and mobility. Engineering/
Enforcement/EMS
TABLE TI-01 Objectives and Strategies to Address Traffic Incident Management in Illinois
Illinois continues to strive
to improve in the area of
Traffic Incident Management.
Table T1-01 identifies some
key objectives and potential
strategies to reduce secondary
crashes and improve incident
clearance times.
This data-driven, collaborative
approach will help Illinois reduce
fatality and serious injury related
secondary crashes and ultimately
drive Zero Fatalities to a reality.
Objectivesand Strategies
120Illinois Strategic Highway Safety Plan 2017 Traffic Incident Management
Information Systems

To ultimately achieve Zero Fatalities on all Illinois roadways, Illinois has set ILSHSP
statewide targets for each emphasis area. Information systems for decision making is a data system that provides accurate
and up-to-date information and performs analyses functions. These systems can aid in structuring the basic data available for
analysis and reports, which can be used for guidance in decision making.
BACKGROUND
From these information systems, data are analyzed
and prepared to highlight distinguishing crash
characteristics for each emphasis area. These data
relate to attributes associated with a crash, including
driver’s age, driver behavior, time of day, safety
equipment used, and pavement conditions. Accurate,
complete, and timely data are necessary for statistical
analyses. This section addresses many issues that
surround information systems for decision making.
Information systems for decision making extends
through all priority levels of ILSHSP, because this
component of traffic safety affects the analysis of each
emphasis area.
122Illinois Strategic Highway Safety Plan 2017 Information Systems
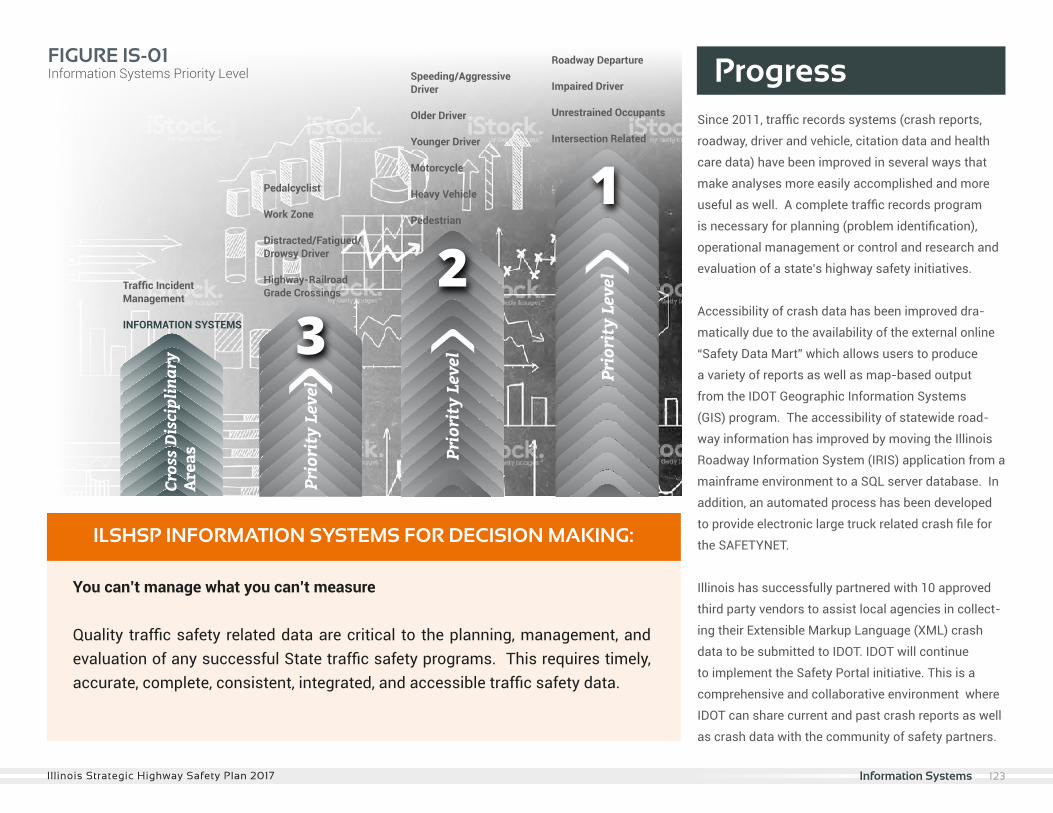
You can’t manage what you can’t measure
Quality traffic safety related data are critical to the planning, management, and evaluation of any successful State traffic safety programs. This requires timely, accurate, complete, consistent, integrated, and accessible traffic safety data.
Cros
s D
isci
plin
ary
Are
asPedalcyclist
Work Zone
Distracted/Fatigued/Drowsy Driver
Highway-RailroadGrade Crossings
Speeding/Aggressive Driver
Older Driver
Younger Driver
Motorcycle
Heavy Vehicle
Pedestrian
Roadway Departure
Impaired Driver
Unrestrained Occupants
Intersection Related
Traffic Incident Management
INFORMATION SYSTEMS
FIGURE IS-01Information Systems Priority Level
ILSHSP INFORMATION SYSTEMS FOR DECISION MAKING:
ProgressSince 2011, traffic records systems (crash reports,
roadway, driver and vehicle, citation data and health
care data) have been improved in several ways that
make analyses more easily accomplished and more
useful as well. A complete traffic records program
is necessary for planning (problem identification),
operational management or control and research and
evaluation of a state’s highway safety initiatives.
Accessibility of crash data has been improved dra-
matically due to the availability of the external online
“Safety Data Mart” which allows users to produce
a variety of reports as well as map-based output
from the IDOT Geographic Information Systems
(GIS) program. The accessibility of statewide road-
way information has improved by moving the Illinois
Roadway Information System (IRIS) application from a
mainframe environment to a SQL server database. In
addition, an automated process has been developed
to provide electronic large truck related crash file for
the SAFETYNET.
Illinois has successfully partnered with 10 approved
third party vendors to assist local agencies in collect-
ing their Extensible Markup Language (XML) crash
data to be submitted to IDOT. IDOT will continue
to implement the Safety Portal initiative. This is a
comprehensive and collaborative environment where
IDOT can share current and past crash reports as well
as crash data with the community of safety partners.
123Illinois Strategic Highway Safety Plan 2017 Information Systems
This environment will bring together data, knowledge,
training and tools which will assist Bureau of Safety
Programs and Engineering, Bureau of Local Roads and
Streets, District personnel, county engineers, federal,
state and local law enforcement agencies to provide
better analysis of crash information to achieve im-
provements in safety.
Illinois revised its Emergency Management Services
(EMS) data collection system to one that is National
EMS Information System (NEMSIS) compliant and
that will allow agencies to submit data electronically
via software provided by the state or by their own
third-party vendor. This revision will allow the Illinois
Department of Public Health (IDPH) to begin receiv-
ing data from all agencies across the state for the first
time in several years. This effort will allow Illinois to
fill a significant void and make tremendous improve-
ments in the timeliness, completeness, accuracy and
uniformity of the state’s EMS data.
The state has demonstrated notable progress in the
roadway component of the traffic records system
since the 2011 traffic records assessment. The most
notable of the improvements was in the IRIS which
has a mainframe application to a SQL server data-
base.
The Illinois Secretary of State’s Office (SOS) adminis-
ters the driver licensing and vehicle registration and
titling services for the state. The integrity of the driver
file is enhanced by the use of facial recognition tech-
nology to identify those applicants who may already
have a driver’s license under some other identity. The
Social Security On-line Verification and the System-
atic Alien Verification for Entitlements systems are
checked prior to license issuance as well.
Driver records completeness suffers somewhat from
the courts’ ability and willingness to allow convictions
to be diverted from a driver history for attendance at a
driver improvement school or performance of commu-
nity service. These opportunities decrease the overall
completeness of the driver file. However, the state
does post all crash involvement to the driver records
and linking to the vehicle file is possible through the
driver’s license number.
The SOS Vehicle Services Department maintains com-
plete vehicle records that meet appropriate standards
and records include appropriate indicators such as
stolen and salvage. The National Motor Vehicle Title
Information System (NMVTIS) facilitates exchanges of
such information between states and helps to prevent
title and odometer fraud by making such informa-
tion available nationwide. Illinois is currently the only
state that is not a participant in the NMVTIS system.
In FY 2017 IDOT funded the Data Warehouse project
with the SOS. SOS maintains information systems to
support both Driver’s License and Vehicle Services in
Illinois.
The databases contain information on approximately
8.7 million drivers and 11 million registered vehicles
in Illinois. Illinois has an injury surveillance system
consisting of multiple datasets collected or managed
under the direction of IDPH.
Progress (continued)
124Illinois Strategic Highway Safety Plan 2017 Information Systems
Progress (continued)
The goal is to provide highly accessible, intuitive,
points of access to SOS drivers and vehicles joined
data.
These data sets include:
· Pre-hospital EMS data
· Emergency Department data
· Hospital Discharge data
· Trauma Registry data
· Vital Statistics data
· Head and Spinal Cord Registry data
Since the 2011 traffic records assessment, the state
has made significant improvements in the type, quality
and completeness of injury data. In 2008, collection
of External Causes of Injury Codes (E-CODES) became
a requirement of the hospital discharge data. Then, in
2009, IDPH began to receive emergency department
data from the state’s hospitals.
Illinois has made significant progress toward linking
the crash data to hospital discharge data. Since 2006,
Illinois has been a Crash Outcome Data Evaluation
System (CODES) state. The CODES project was devel-
oped to link datasets for hospital discharge and crash
data for the years 2002, 2003, 2005-2011. There is no
current unique identifier between crash and hospital
discharge data; consequently, linked datasets have
been developed using probabilistic methods based on
CODES2000 software. Several reports have been gen-
erated based on the linked data. With the inclu-
sion of emergency department data in 2009 and
the recent requirement of E-CODES in hospital
discharge and emergency department datasets,
the CODES program has improved linked crash
and health care data.
Analysts at IDOT, along with other partners, have
produced a multitude of reports that focus on
traffic safety program areas. CODES data have
been used to support legislative activities, espe-
cially in the area of occupant restraint.
125Illinois Strategic Highway Safety Plan 2017 Information Systems
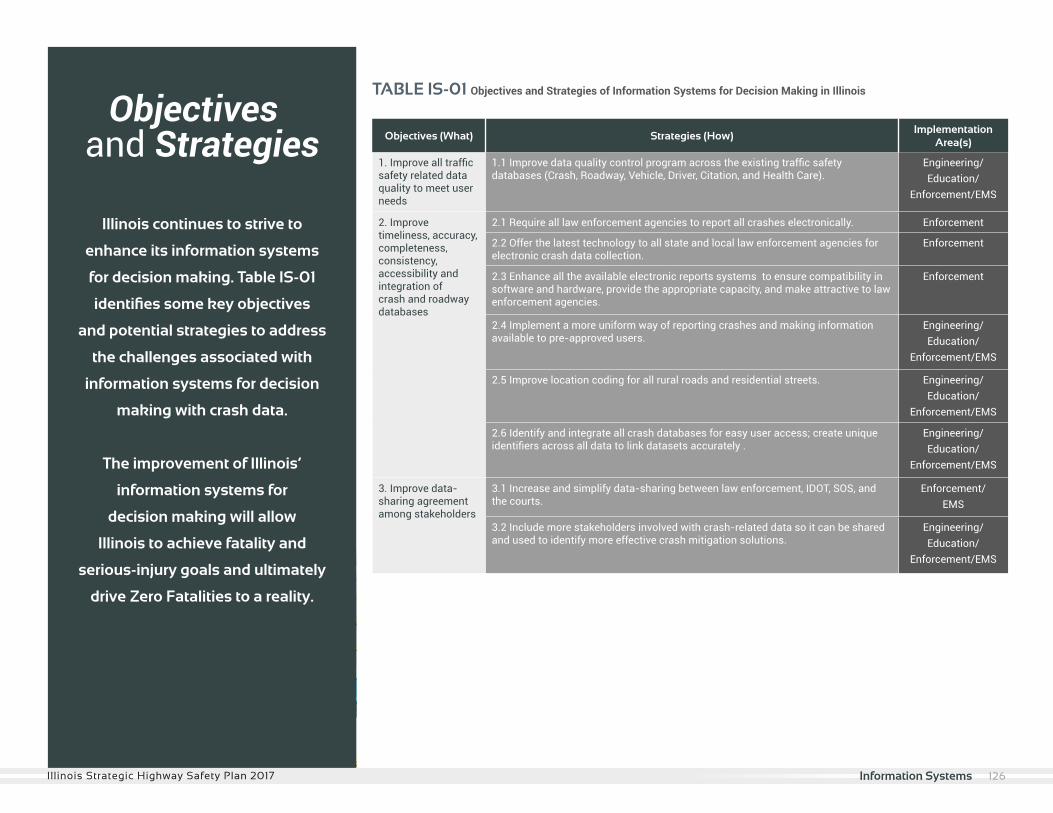
Objectives (What) Strategies (How)Implementation
Area(s)
1. Improve all traffic safety related data quality to meet user needs
1.1 Improve data quality control program across the existing traffic safety databases (Crash, Roadway, Vehicle, Driver, Citation, and Health Care).
Engineering/Education/
Enforcement/EMS
2. Improve timeliness, accuracy, completeness, consistency, accessibility and integration of crash and roadway databases
2.1 Require all law enforcement agencies to report all crashes electronically. Enforcement
2.2 Offer the latest technology to all state and local law enforcement agencies for electronic crash data collection.
Enforcement
2.3 Enhance all the available electronic reports systems to ensure compatibility in software and hardware, provide the appropriate capacity, and make attractive to law enforcement agencies.
Enforcement
2.4 Implement a more uniform way of reporting crashes and making information available to pre-approved users.
Engineering/ Education/
Enforcement/EMS
2.5 Improve location coding for all rural roads and residential streets. Engineering/ Education/
Enforcement/EMS
2.6 Identify and integrate all crash databases for easy user access; create unique identifiers across all data to link datasets accurately .
Engineering/ Education/
Enforcement/EMS
3. Improve data-sharing agreement among stakeholders
3.1 Increase and simplify data-sharing between law enforcement, IDOT, SOS, and the courts.
Enforcement/EMS
3.2 Include more stakeholders involved with crash-related data so it can be shared and used to identify more effective crash mitigation solutions.
Engineering/ Education/
Enforcement/EMS
TABLE IS-01 Objectives and Strategies of Information Systems for Decision Making in Illinois
Illinois continues to strive to
enhance its information systems
for decision making. Table IS-01
identifies some key objectives
and potential strategies to address
the challenges associated with
information systems for decision
making with crash data.
The improvement of Illinois’
information systems for
decision making will allow
Illinois to achieve fatality and
serious-injury goals and ultimately
drive Zero Fatalities to a reality.
Objectivesand Strategies
126Illinois Strategic Highway Safety Plan 2017 Information Systems
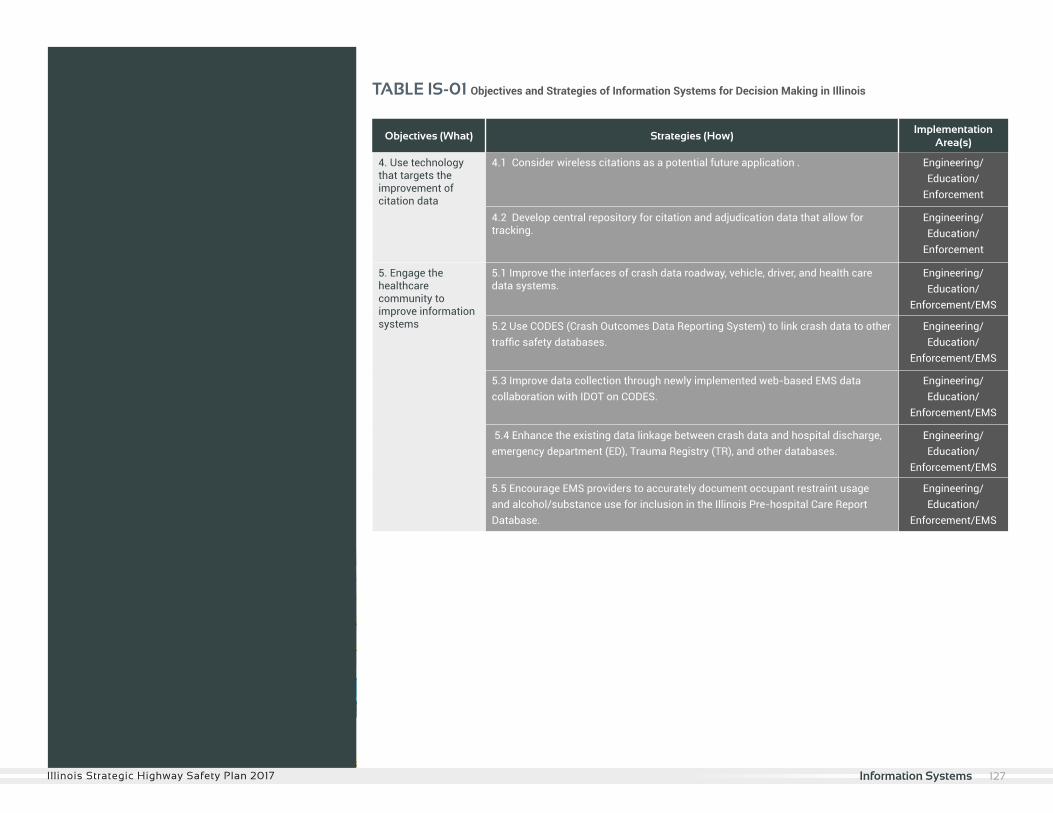
Objectives (What) Strategies (How)Implementation
Area(s)
4. Use technology that targets the improvement of citation data
4.1 Consider wireless citations as a potential future application . Engineering/Education/
Enforcement
4.2 Develop central repository for citation and adjudication data that allow for tracking.
Engineering/Education/
Enforcement
5. Engage the healthcare community to improve information systems
5.1 Improve the interfaces of crash data roadway, vehicle, driver, and health care data systems.
Engineering/Education/
Enforcement/EMS
5.2 Use CODES (Crash Outcomes Data Reporting System) to link crash data to other traffic safety databases.
Engineering/Education/
Enforcement/EMS
5.3 Improve data collection through newly implemented web-based EMS data collaboration with IDOT on CODES.
Engineering/Education/
Enforcement/EMS
5.4 Enhance the existing data linkage between crash data and hospital discharge, emergency department (ED), Trauma Registry (TR), and other databases.
Engineering/Education/
Enforcement/EMS
5.5 Encourage EMS providers to accurately document occupant restraint usage and alcohol/substance use for inclusion in the Illinois Pre-hospital Care Report Database.
Engineering/Education/
Enforcement/EMS
TABLE IS-01 Objectives and Strategies of Information Systems for Decision Making in Illinois
127Illinois Strategic Highway Safety Plan 2017 Information Systems
References
Countermeasures that work: A highway safety countermeasures guide for state highway safety offices, eighth edition. (2015)
Retrieved November 2015; DOT HS 812 202 from http://www.nhtsa.gov/staticfiles/nti/pdf/812202-CountermeasuresThatWork8th.pdf
128Illinois Strategic Highway Safety Plan 2017

Priscilla TobiasPriscilla A. Tobias, PE
Director-Office of Program Development
Assistant Chief Engineer
Illinois Department of Transportation, Bureau of Safety Programs and Engineering
2300 S. Dirksen Parkway, Room 005/007
Springfield, IL 62764
Phone: 217-524-8127
Email: [email protected]
Contact Information
129Illinois Strategic Highway Safety Plan 2017