illinois nutrient loss reduction strategy nutrient ... · illinois nutrient loss reduction strategy...
TRANSCRIPT
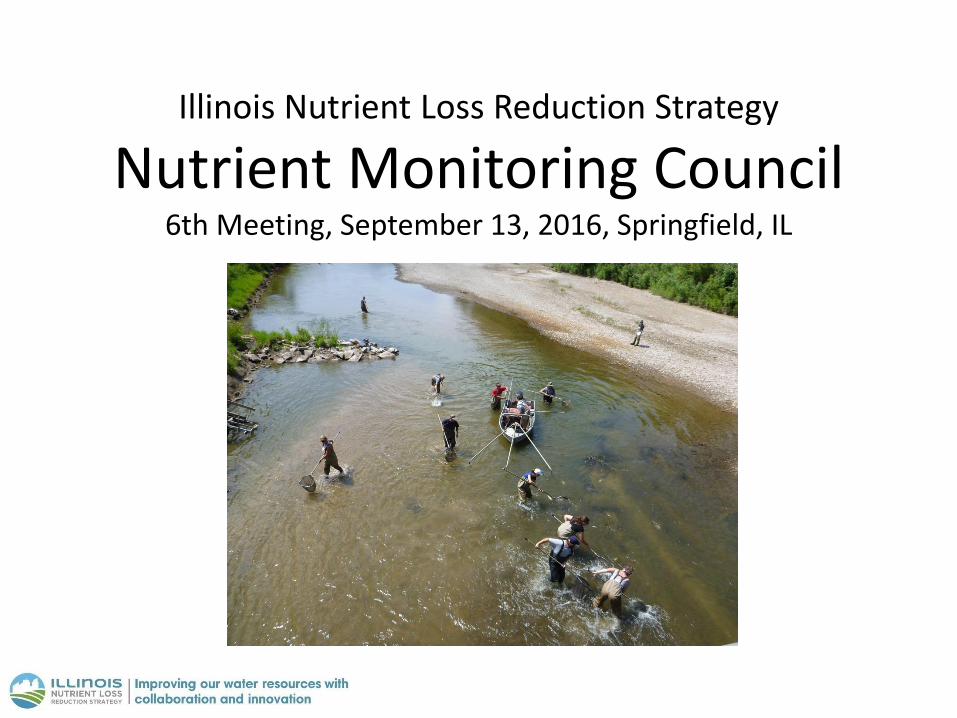
Illinois Nutrient Loss Reduction Strategy
Nutrient Monitoring Council 6th Meeting, September 13, 2016, Springfield, IL


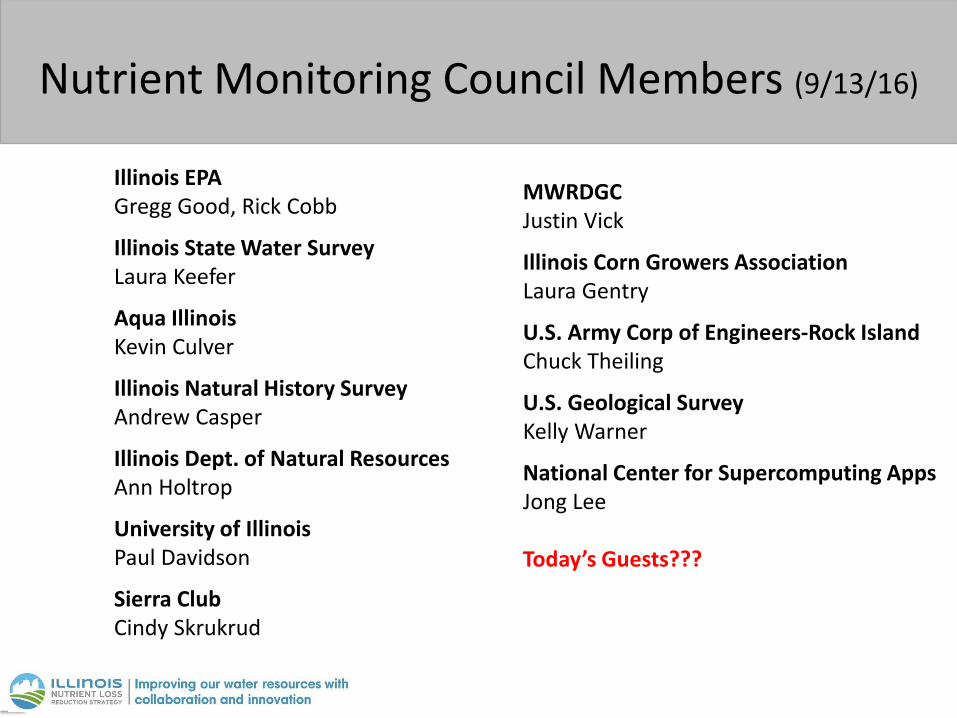
Illinois EPA Gregg Good, Rick Cobb
Illinois State Water Survey Laura Keefer
Aqua Illinois Kevin Culver
Illinois Natural History Survey Andrew Casper
Illinois Dept. of Natural Resources Ann Holtrop
University of Illinois Paul Davidson
Sierra Club Cindy Skrukrud
Nutrient Monitoring Council Members (9/13/16)
MWRDGC Justin Vick
Illinois Corn Growers Association Laura Gentry
U.S. Army Corp of Engineers-Rock Island Chuck Theiling
U.S. Geological Survey Kelly Warner
National Center for Supercomputing Apps Jong Lee Today’s Guests???
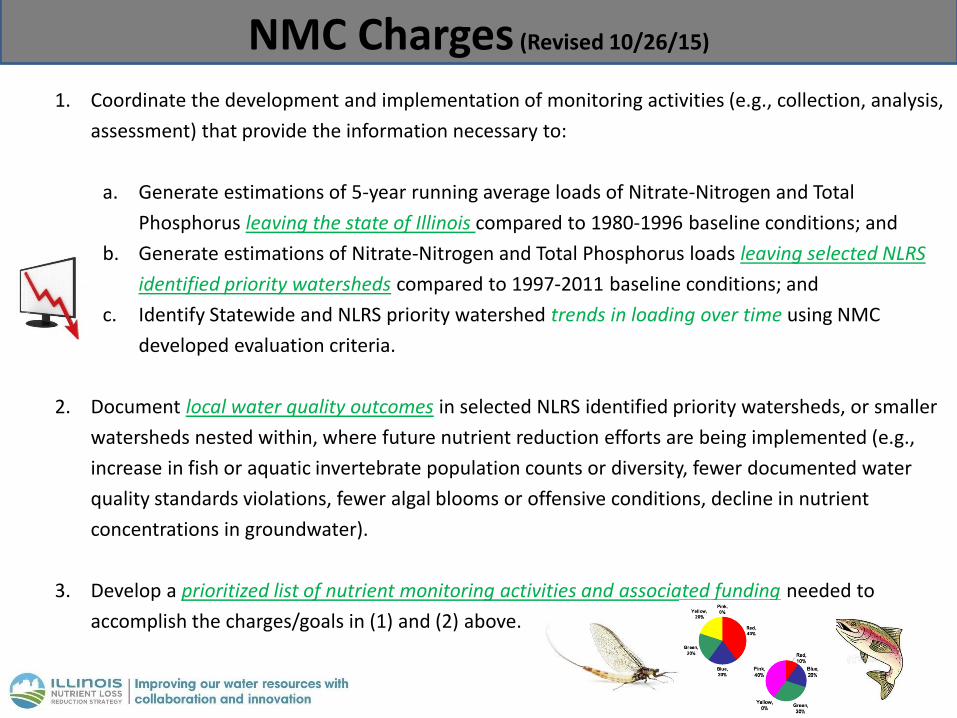
NMC Charges (Revised 10/26/15)
1. Coordinate the development and implementation of monitoring activities (e.g., collection, analysis,
assessment) that provide the information necessary to:
a. Generate estimations of 5-year running average loads of Nitrate-Nitrogen and Total
Phosphorus leaving the state of Illinois compared to 1980-1996 baseline conditions; and
b. Generate estimations of Nitrate-Nitrogen and Total Phosphorus loads leaving selected NLRS
identified priority watersheds compared to 1997-2011 baseline conditions; and
c. Identify Statewide and NLRS priority watershed trends in loading over time using NMC
developed evaluation criteria.
2. Document local water quality outcomes in selected NLRS identified priority watersheds, or smaller
watersheds nested within, where future nutrient reduction efforts are being implemented (e.g.,
increase in fish or aquatic invertebrate population counts or diversity, fewer documented water
quality standards violations, fewer algal blooms or offensive conditions, decline in nutrient
concentrations in groundwater).
3. Develop a prioritized list of nutrient monitoring activities and associated funding needed to
accomplish the charges/goals in (1) and (2) above.
U.S. Department of the Interior
U.S. Geological Survey
USGS Super Gage Operational Update
and Web Display of Nutrient Information
Nutrient Monitoring Council
September 13, 2016
Springfield, IL
Kelly Warner, USGS
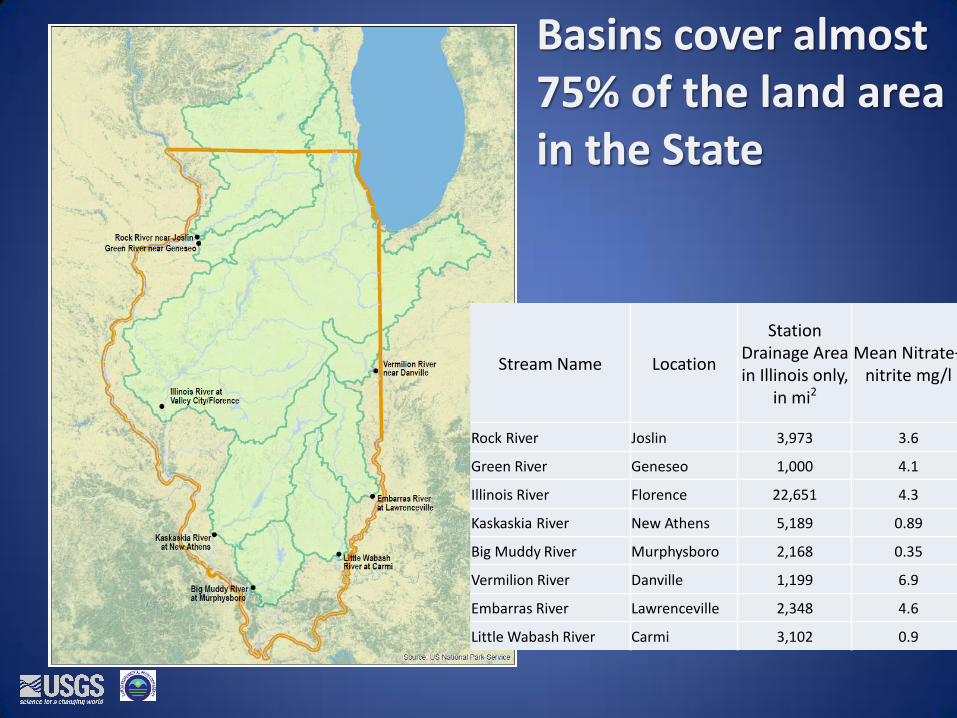
Basins cover almost 75% of the land area in the State
Stream Name Location
Station Drainage Area in Illinois only,
in mi2
Mean Nitrate+ nitrite mg/l
Rock River Joslin 3,973 3.6
Green River Geneseo 1,000 4.1
Illinois River Florence 22,651 4.3
Kaskaskia River New Athens 5,189 0.89
Big Muddy River Murphysboro 2,168 0.35
Vermilion River Danville 1,199 6.9
Embarras River Lawrenceville 2,348 4.6
Little Wabash River Carmi 3,102 0.9
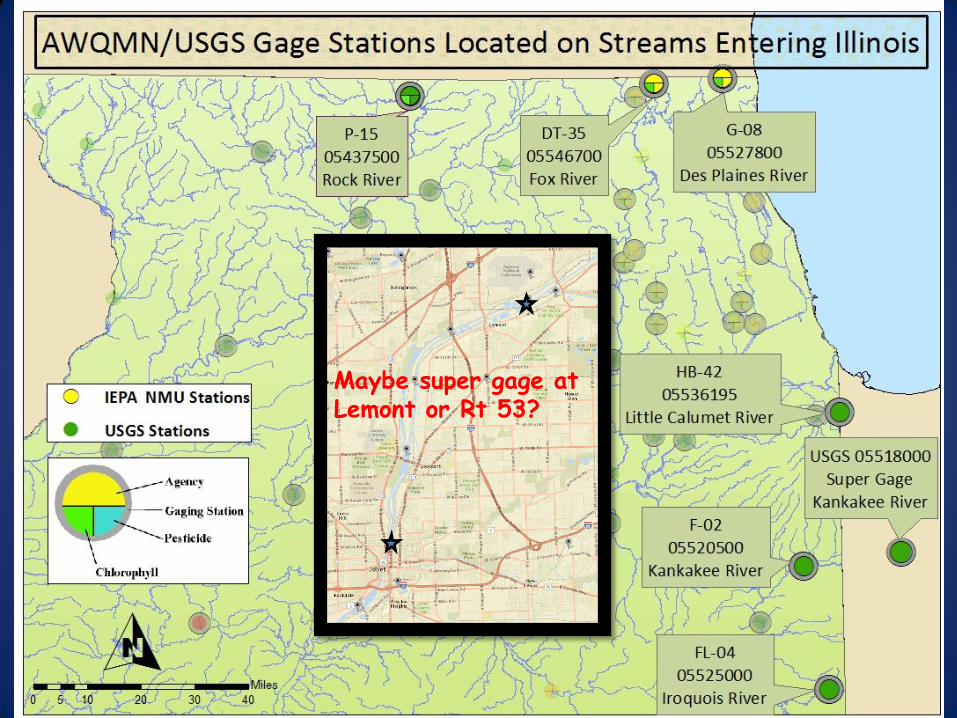
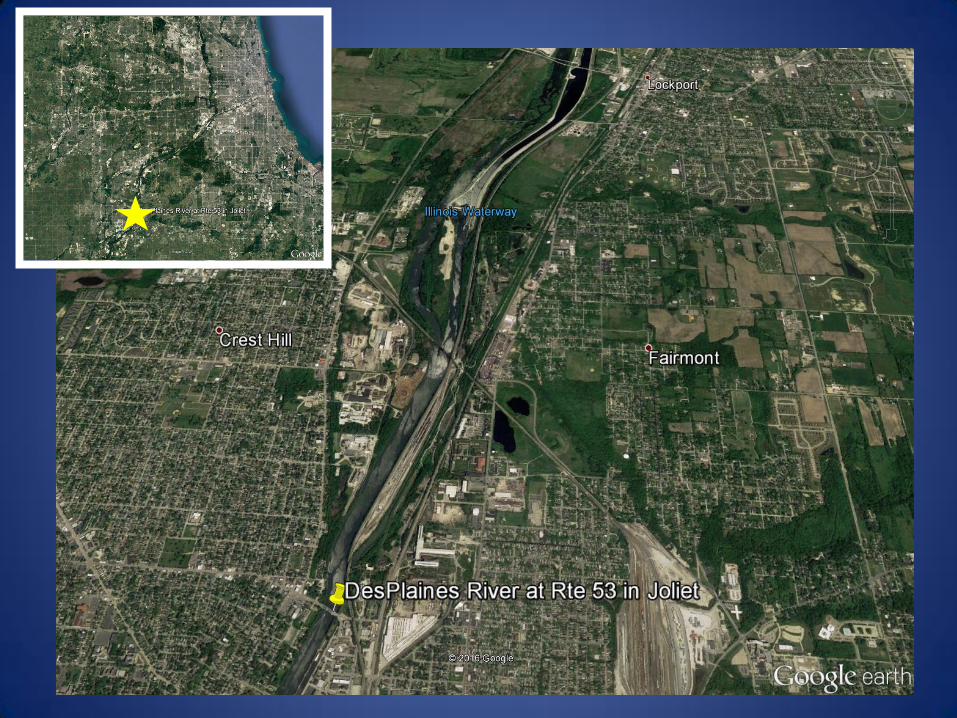
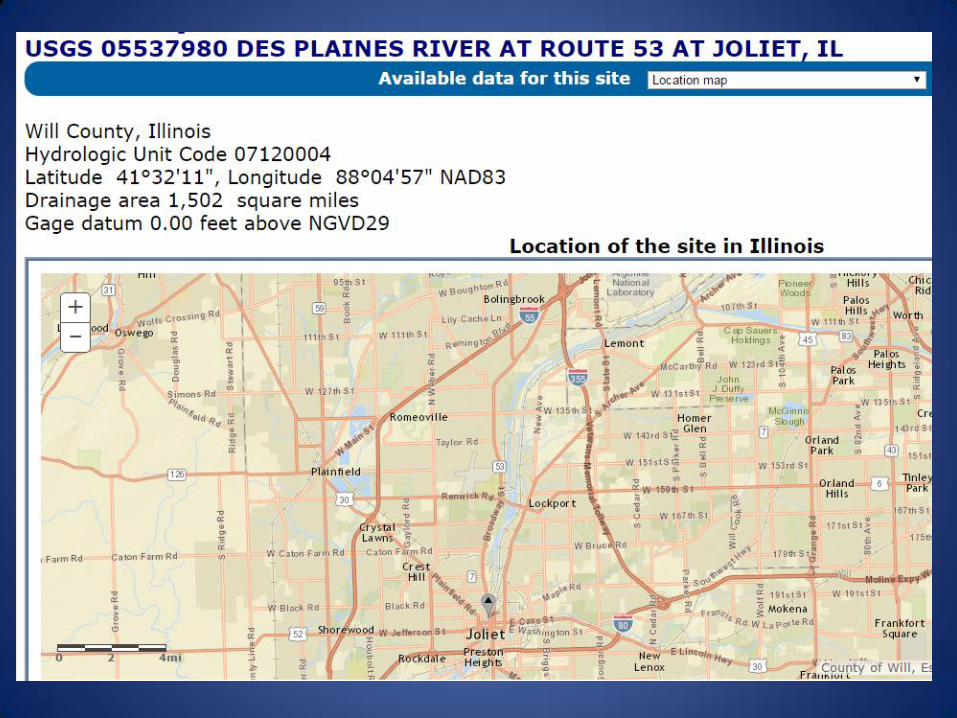
Maybe super gage at Lemont or Rt 53?

New Super Gage Questions
Cost?
How to Fund?
Specific Recommendation to the Policy Working Group?
Rick Cobb, P.G. Deputy Division Manager
Division of Public Water Supplies and Manager, Groundwater Section
Illinois EPA
Nutrient Monitoring Council September 13, 2016 Update
An ongoing Illinois EPA nitrate trend study of Community Water Supply Wells (reported in the 2014 Integrated Water Quality Report require under the Clean Water Act); and
The Illinois EPA received a Supplemental Clean Water Act Section 106 Monitoring Grant on July 19, 2016 from U.S. EPA Region V to begin the assessment of the nitrate hot spots in the Havana Lowlands.
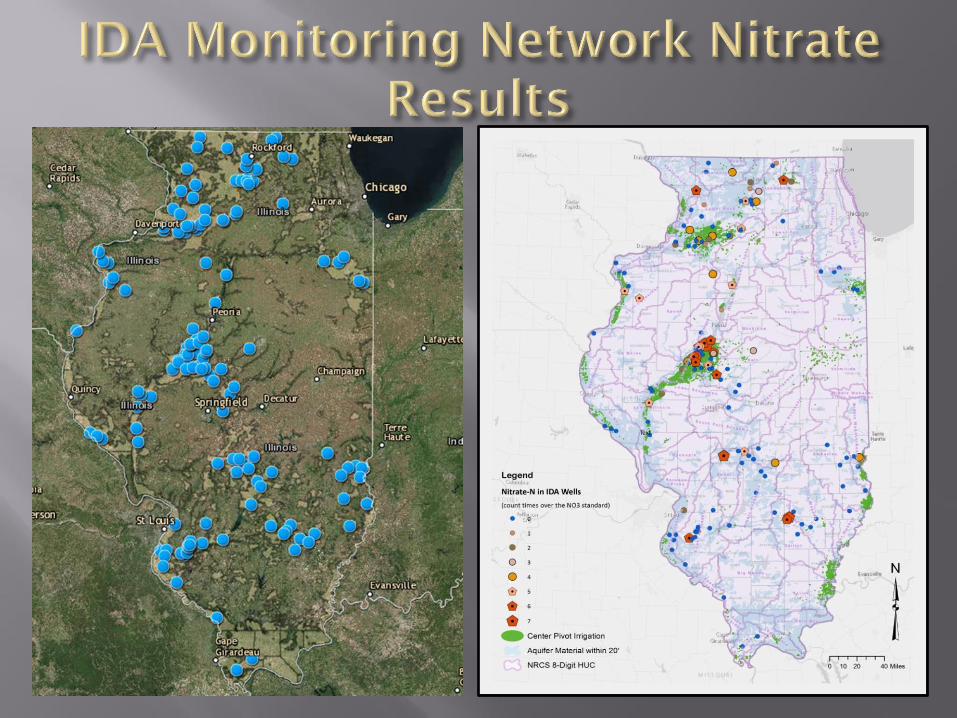
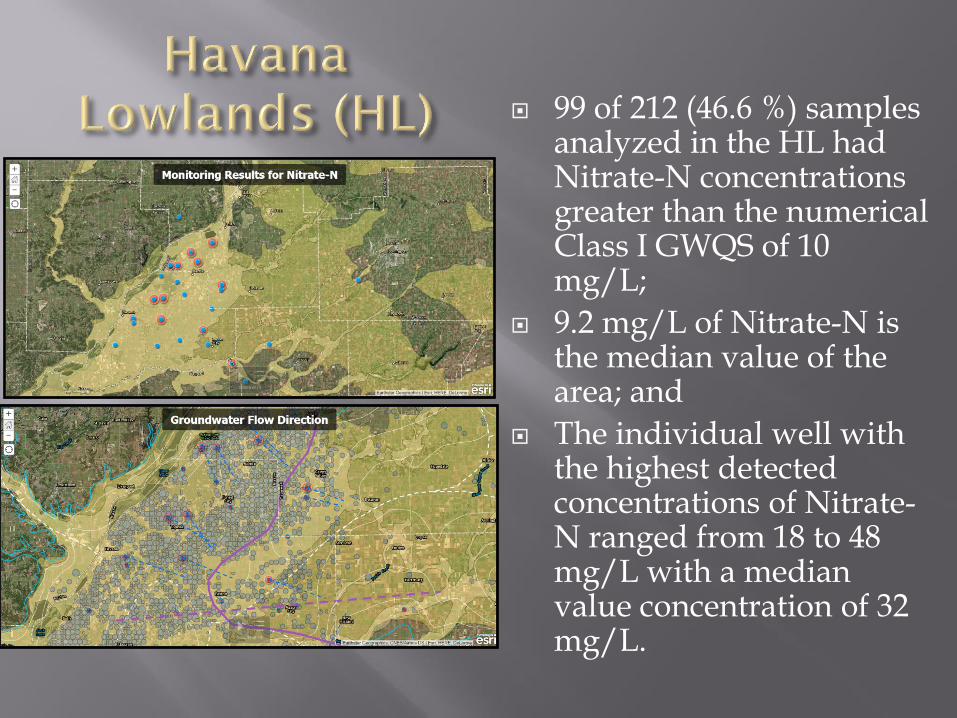
99 of 212 (46.6 %) samples analyzed in the HL had Nitrate-N concentrations greater than the numerical Class I GWQS of 10 mg/L;
9.2 mg/L of Nitrate-N is the median value of the area; and
The individual well with the highest detected concentrations of Nitrate-N ranged from 18 to 48 mg/L with a median value concentration of 32 mg/L.
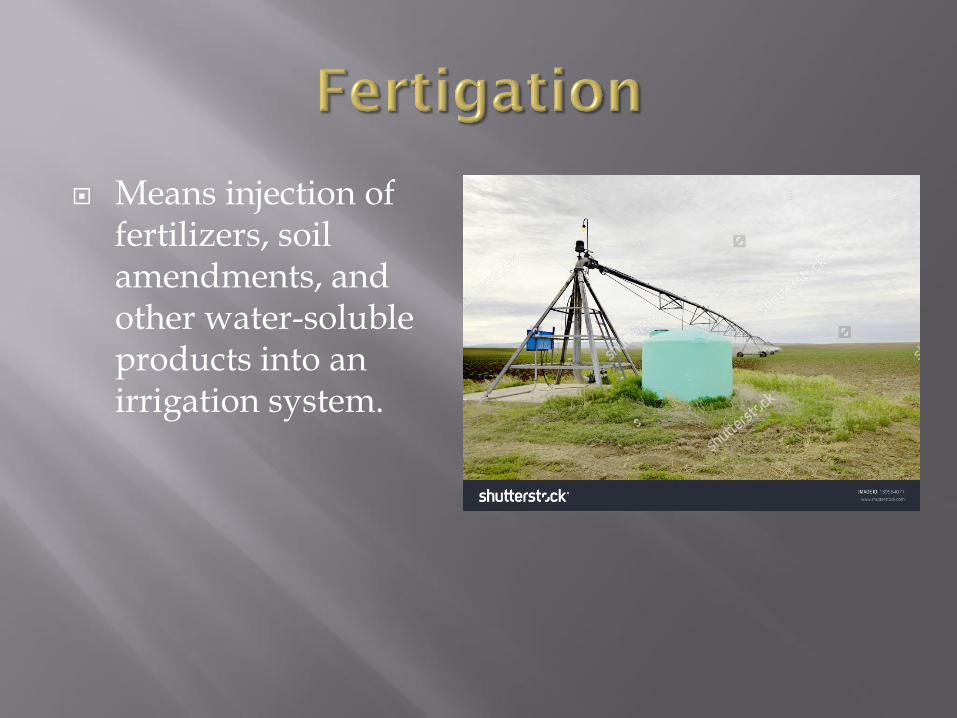
Means injection of fertilizers, soil amendments, and other water-soluble products into an irrigation system.
This will help provide key beneficial NLRS information in assessing and managing nitrate in groundwater by: Determining fluctuations in nitrate concentrations
resulting from seasonal climatic changes or groundwater conditions such as dissolved oxygen or pH.
Assessing the amount of de-nitrification and source indication by conducting nitrogen gas and nitrogen isotope work.
Determining temporal nitrate concentrations resulting from agricultural practices such as irrigation or fertigation and possible best management practices that could mitigate these changes.
National Center for Supercomputing Applications
University of Illinois at Urbana-Champaign
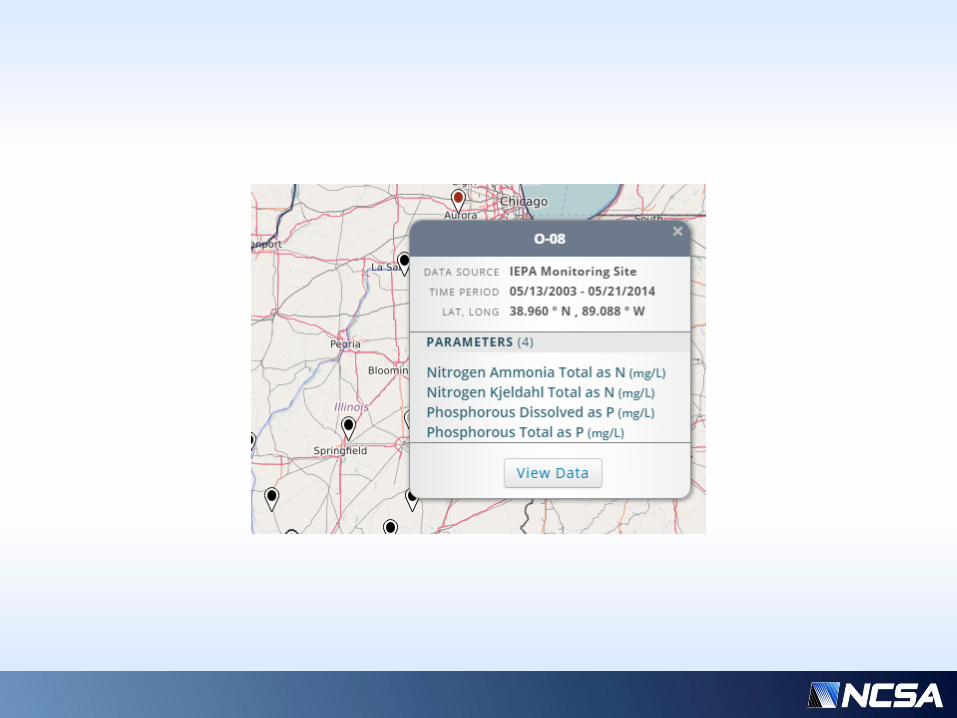
Exploring IEPA Ambient
Water Quality Monitoring
Network Data with Great
Lakes To Gulf Virtual
Observatory Part 2
Jong Sung Lee ([email protected])
Senior Research Scientist, NCSA
Sep 13, 2016 @ 6th Nutrient Monitoring
Council Meeting
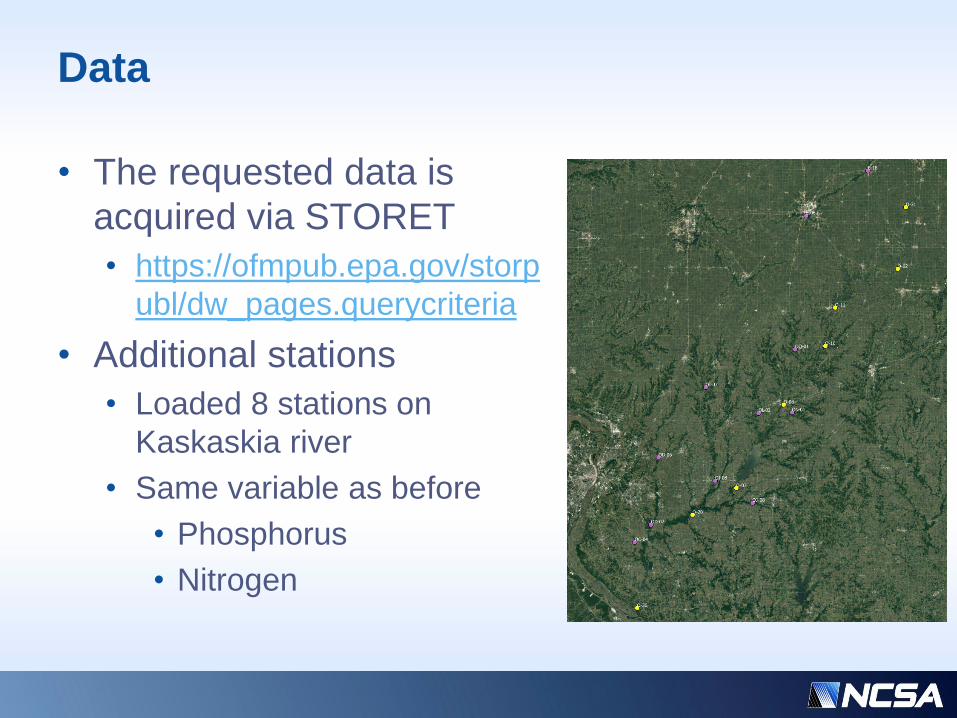
Data
• The requested data is
acquired via STORET
• https://ofmpub.epa.gov/storp
ubl/dw_pages.querycriteria
• Additional stations
• Loaded 8 stations on
Kaskaskia river
• Same variable as before
• Phosphorus
• Nitrogen
Progress
• Two methods to acquire the data
• 1. Creating a query on STORET web interface and
downloading the results
• 2. Acquiring data (results) directly via STORET web
service
• We are working on #2.
• For this exercise, we used #1 method still.
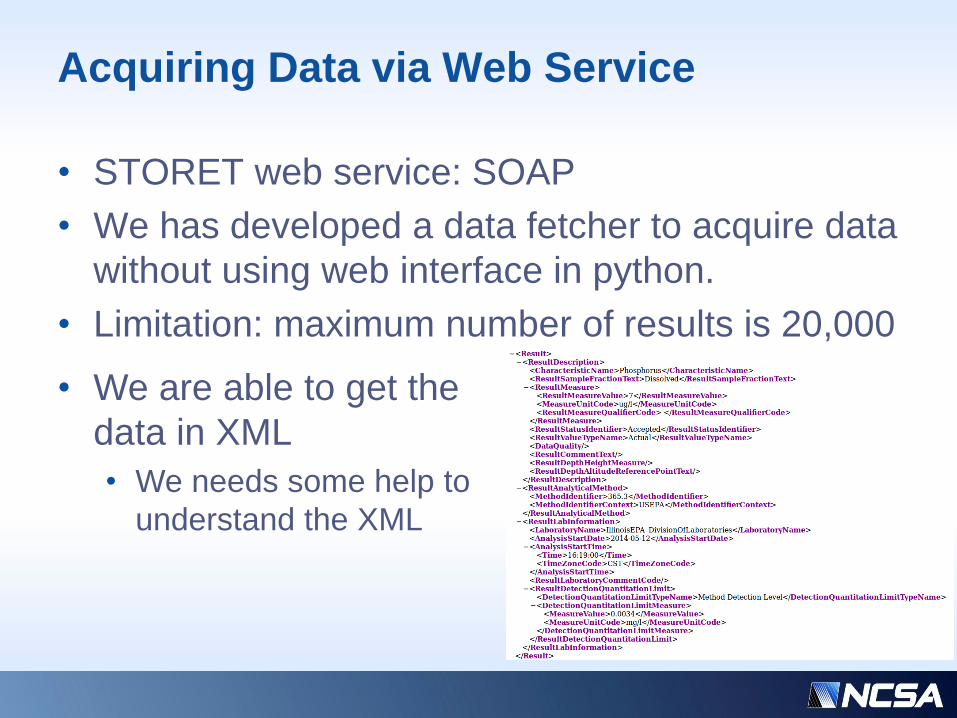
Acquiring Data via Web Service
• STORET web service: SOAP
• We has developed a data fetcher to acquire data
without using web interface in python.
• Limitation: maximum number of results is 20,000
• We are able to get the
data in XML
• We needs some help to
understand the XML
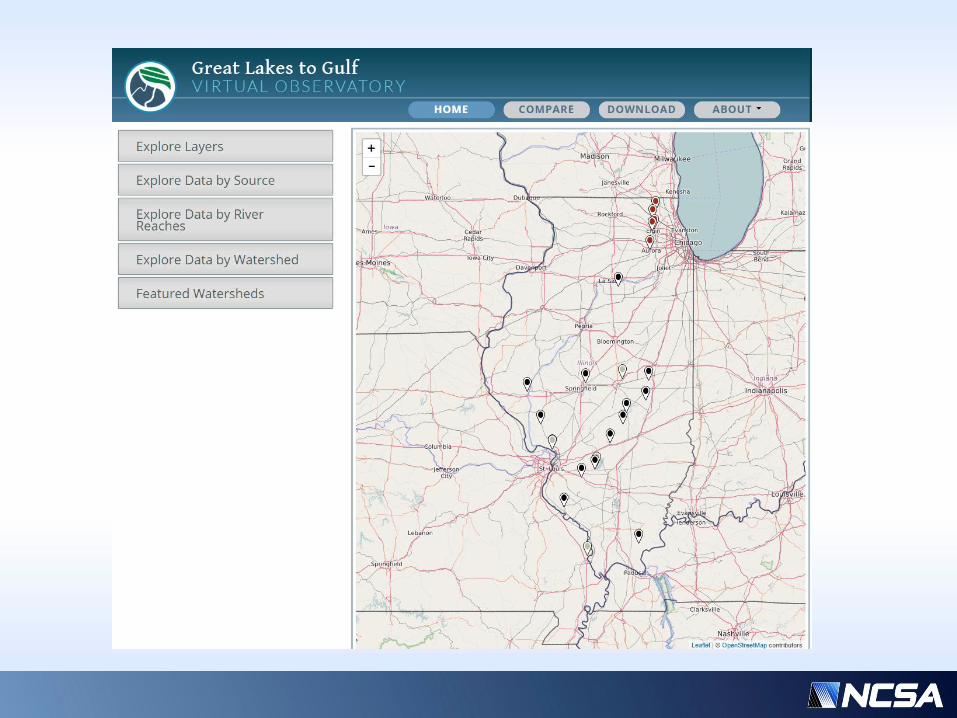
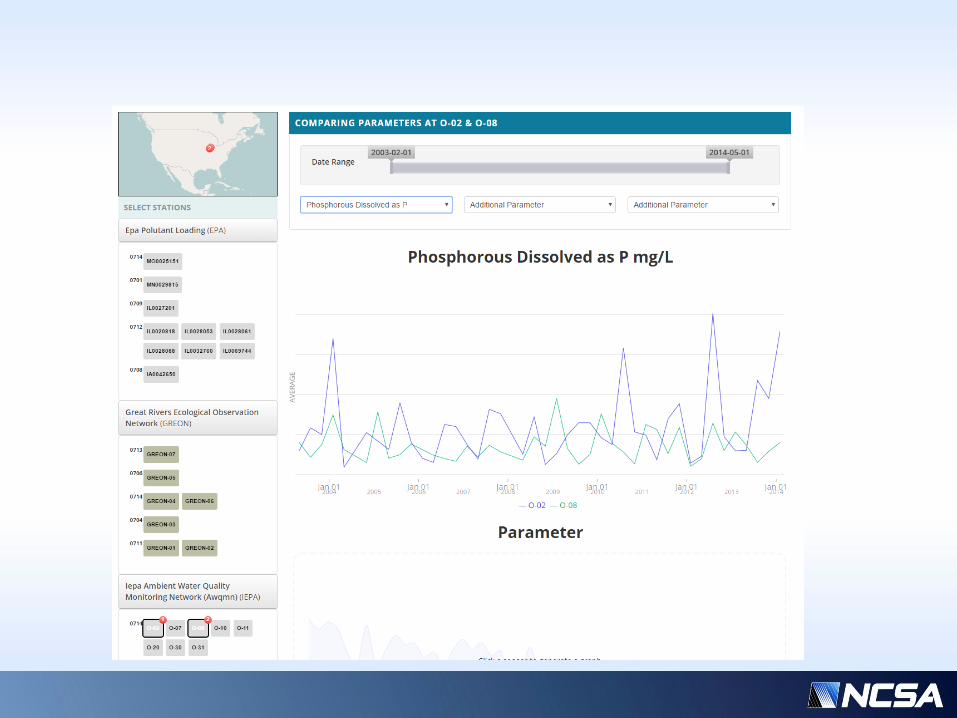
Demo
• http://gltg-dev.ncsa.illinois.edu/geodashboard/
Imaginations unbound

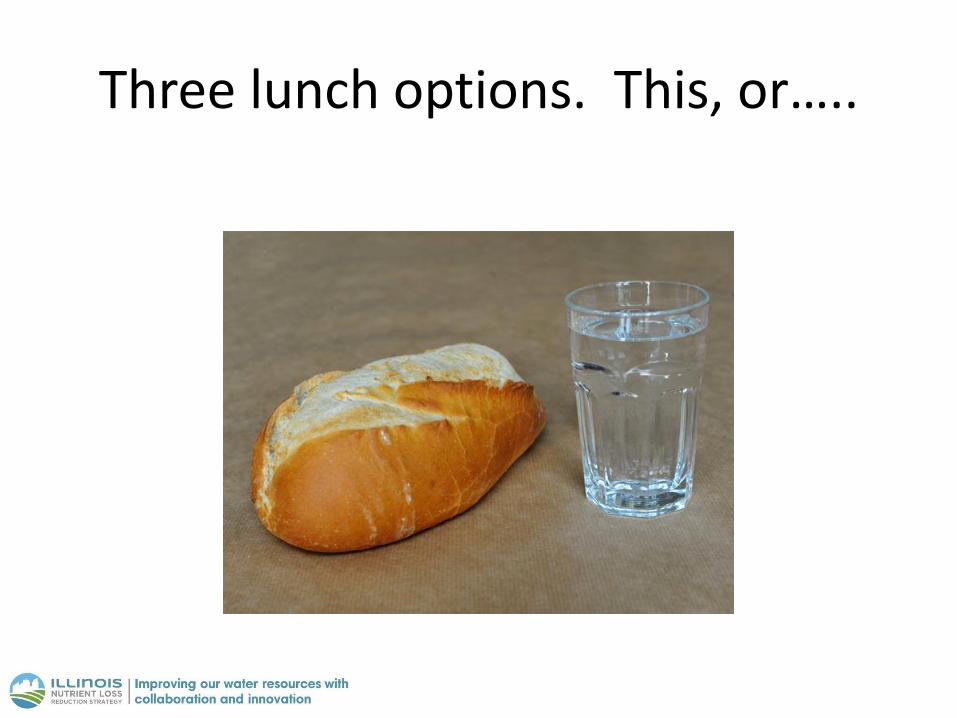
Three lunch options. This, or…..

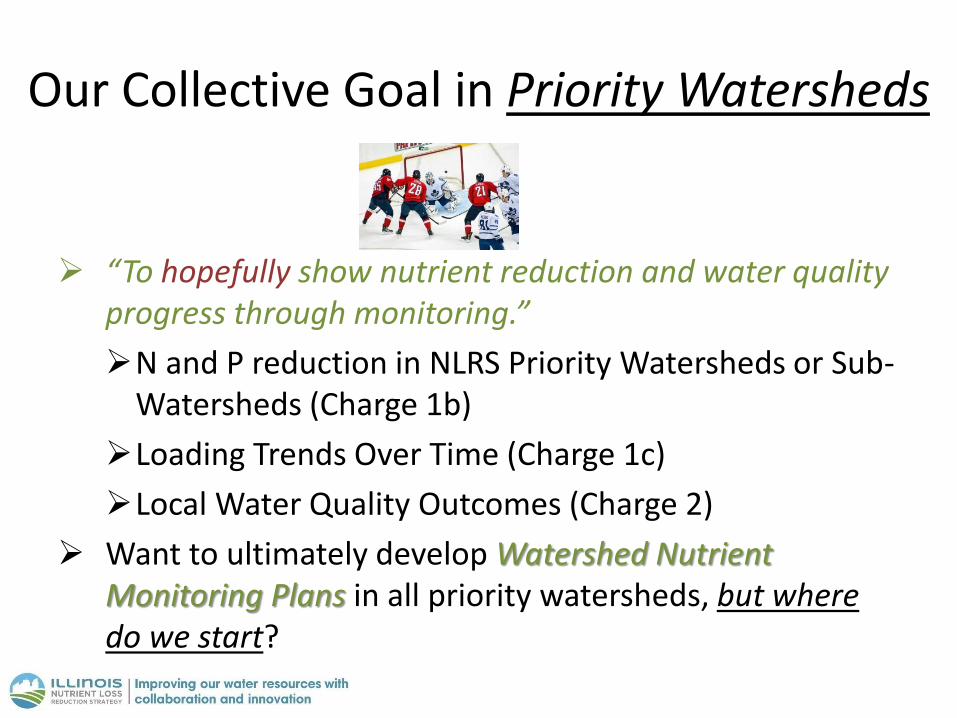
Our Collective Goal in Priority Watersheds
“To hopefully show nutrient reduction and water quality progress through monitoring.”
N and P reduction in NLRS Priority Watersheds or Sub-Watersheds (Charge 1b)
Loading Trends Over Time (Charge 1c)
Local Water Quality Outcomes (Charge 2)
Want to ultimately develop Watershed Nutrient Monitoring Plans in all priority watersheds, but where do we start?
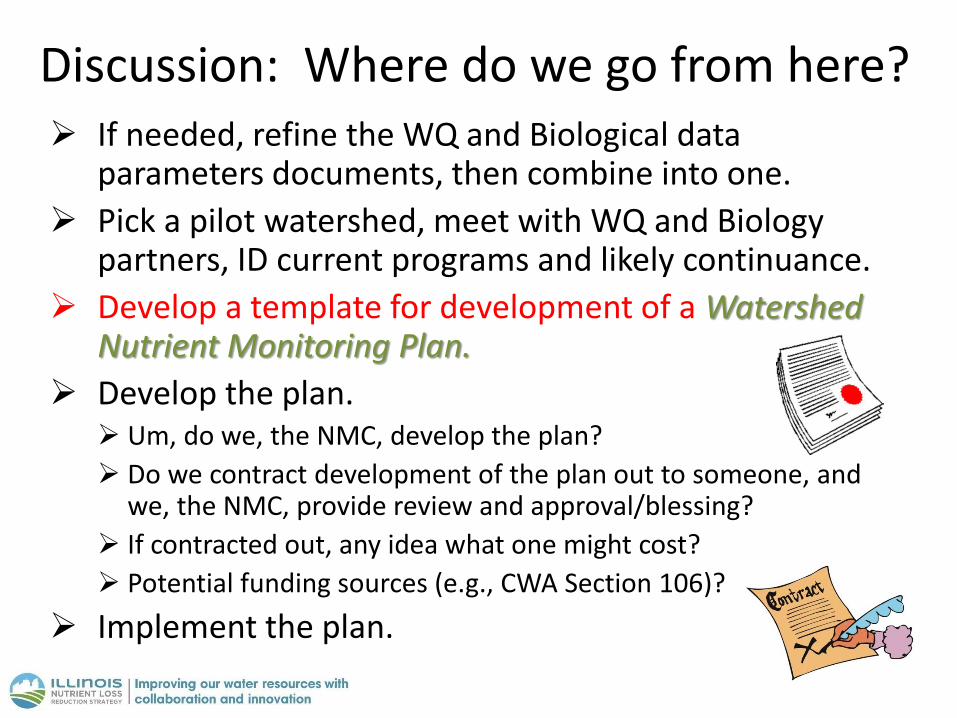
Discussion: Where do we go from here? If needed, refine the WQ and Biological data
parameters documents, then combine into one.
Pick a pilot watershed, meet with WQ and Biology partners, ID current programs and likely continuance.
Develop a template for development of a Watershed Nutrient Monitoring Plan.
Develop the plan. Um, do we, the NMC, develop the plan?
Do we contract development of the plan out to someone, and we, the NMC, provide review and approval/blessing?
If contracted out, any idea what one might cost?
Potential funding sources (e.g., CWA Section 106)?
Implement the plan.
Today’s Exercise – Brainstorm the Development of a Watershed
Nutrient Monitoring Plan “Template”
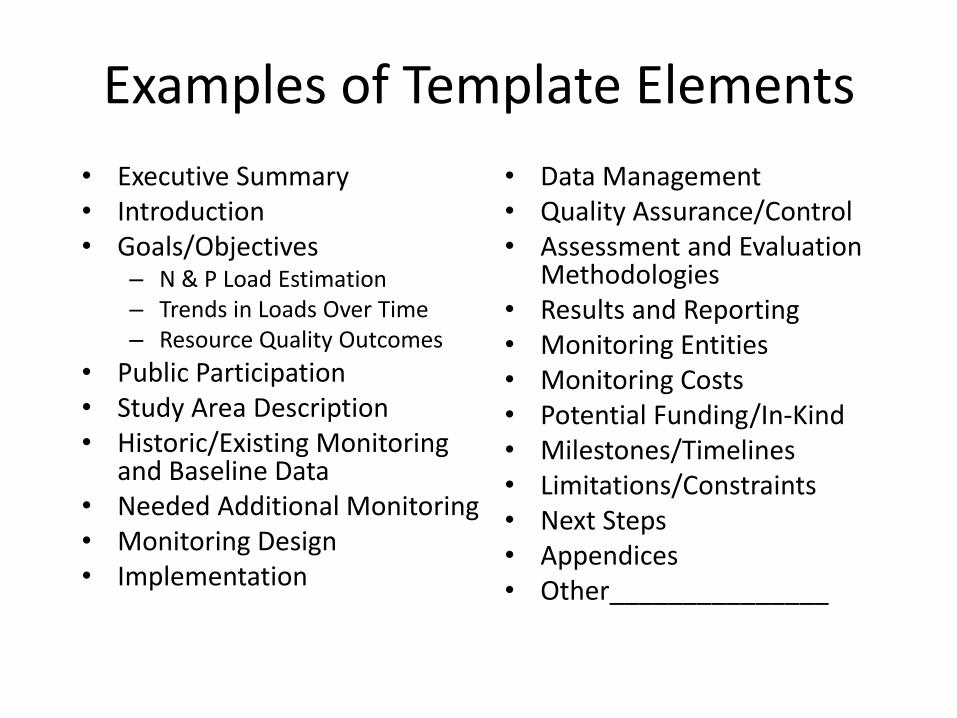
Examples of Template Elements
• Executive Summary • Introduction • Goals/Objectives
– N & P Load Estimation – Trends in Loads Over Time – Resource Quality Outcomes
• Public Participation • Study Area Description • Historic/Existing Monitoring
and Baseline Data • Needed Additional Monitoring • Monitoring Design • Implementation
• Data Management • Quality Assurance/Control • Assessment and Evaluation
Methodologies • Results and Reporting • Monitoring Entities • Monitoring Costs • Potential Funding/In-Kind • Milestones/Timelines • Limitations/Constraints • Next Steps • Appendices • Other_______________
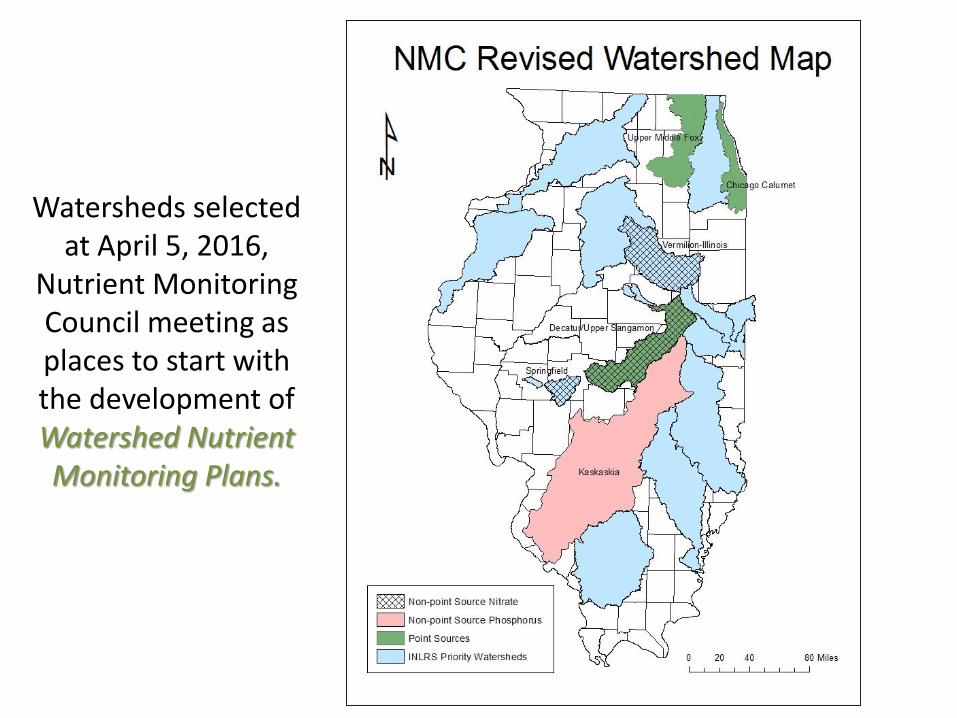
Watersheds selected at April 5, 2016,
Nutrient Monitoring Council meeting as places to start with the development of Watershed Nutrient Monitoring Plans.
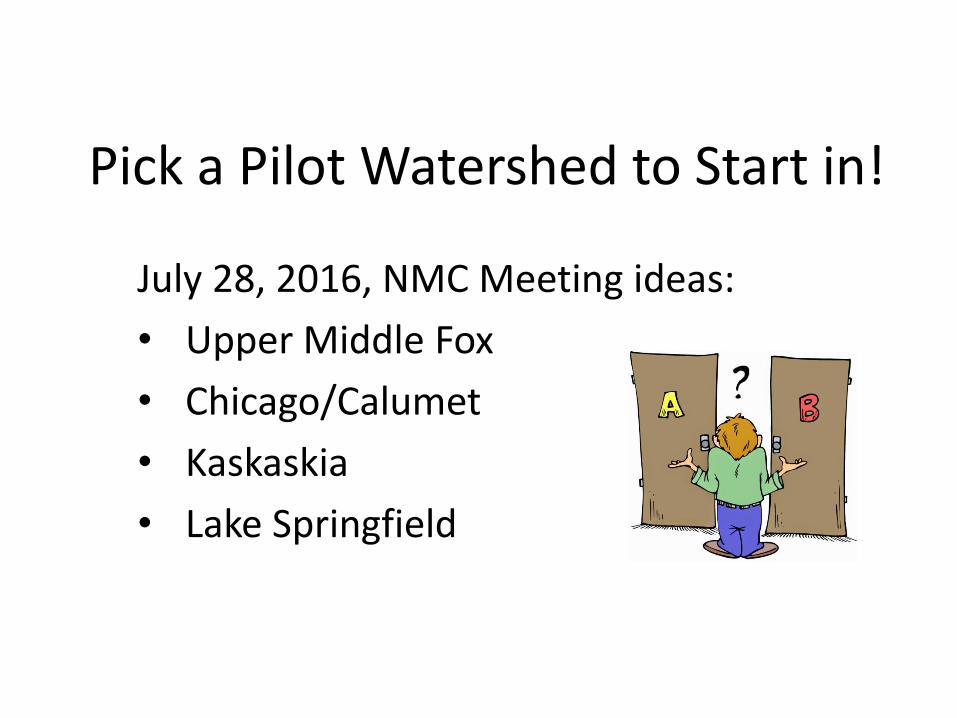
Pick a Pilot Watershed to Start in!
July 28, 2016, NMC Meeting ideas:
• Upper Middle Fox
• Chicago/Calumet
• Kaskaskia
• Lake Springfield
“Next Steps” Summary (NMC September 13, 2016)
Summarize today’s action items
A.
B.
C.
Future topics for the December 6, 2016 meeting?
Other (TBD)
Next NMC Meetings
December 6, 2016
March 14, 2017?
June 6, 2017?
September 12, 2017?
December 5, 2017?