ii - eis-bonn.github.ioeis-bonn.github.io/theses/2016/rohan_asmat/thesis.pdf2.4 human computer...
TRANSCRIPT

ii


v
Contents
Abbreviations xv
Abstract xvi
Acknowledgements xvii
Conventions xviii
1 Introduction 11.1 Problem Description and Motivation . . . . . 1
1.1.1 Problem Description . . . . . . . . . . 21.1.2 Motivation . . . . . . . . . . . . . . . . 3
1.2 Thesis Structure . . . . . . . . . . . . . . . . . 3
2 Background 52.1 Scientific Terminologies . . . . . . . . . . . . 5
2.1.1 Science . . . . . . . . . . . . . . . . . . 52.1.2 Scientist . . . . . . . . . . . . . . . . . 62.1.3 Research . . . . . . . . . . . . . . . . . 62.1.4 Conference . . . . . . . . . . . . . . . . 62.1.5 Workshops . . . . . . . . . . . . . . . . 72.1.6 Paper . . . . . . . . . . . . . . . . . . . 72.1.7 Proceedings . . . . . . . . . . . . . . . 82.1.8 Open Access . . . . . . . . . . . . . . . 8
2.2 CEUR Workshop Proceedings . . . . . . . . . 82.2.1 Publishing at CEUR Workshop Pro-
ceedings . . . . . . . . . . . . . . . . . 92.3 CEUR Make . . . . . . . . . . . . . . . . . . . 112.4 Human Computer Interaction . . . . . . . . . 122.5 Design Patterns . . . . . . . . . . . . . . . . . 13
2.5.1 Design Patterns A Historical Back-ground . . . . . . . . . . . . . . . . . . 14
2.5.2 Design Patterns In HCI: An Introduc-tion . . . . . . . . . . . . . . . . . . . . 15
vi Contents
Example Design Pattern: Grid of Equals 162.6 Usability and User Experience and Design . . 17
2.6.1 Focus Groups . . . . . . . . . . . . . . 192.6.2 Usability Evaluation . . . . . . . . . . 20
Usability Metrics . . . . . . . . . . . . 20Usability Evaluation Methods . . . . . 21
2.7 User Centered Design . . . . . . . . . . . . . 232.8 Technologies Used in Implementation . . . . 24
2.8.1 HTML5 . . . . . . . . . . . . . . . . . 242.8.2 CSS3 . . . . . . . . . . . . . . . . . . . 252.8.3 Materializecss . . . . . . . . . . . . . . 262.8.4 Javascript . . . . . . . . . . . . . . . . 272.8.5 jQuery [26] . . . . . . . . . . . . . . . . 272.8.6 XML . . . . . . . . . . . . . . . . . . . 282.8.7 PHP . . . . . . . . . . . . . . . . . . . 28
3 Related Work 293.1 Related Workflows and Software Systems . . 29
3.1.1 Proceedings for Large Scale Confer-ences and Workshops . . . . . . . . . 30Proceedings Workflow for Large
Scale Conferences andWorkshops . . . . . . . . . . 30
3.1.2 Proceedings for Small Scale and Vir-tual Conferences and Workshops . . 32Proceedings Workflow for Small
Scale and Virtual Confer-ences and Workshops . . . . 32
3.1.3 Easy Chair . . . . . . . . . . . . . . . . 333.1.4 Proceedings Workflow for Easy Chair 343.1.5 Overview of other Conference Man-
agement Systems . . . . . . . . . . . . 363.2 Usability Evaluation of Related Systems . . . 37
3.2.1 Gracoli: A Graphical Command LineUser Interface . . . . . . . . . . . . . . 37
3.2.2 Student preferences toward micro-computer user interfaces . . . . . . . . 38
4 Usability Evaluation Methodology and CEURMake Usability Evaluation 404.1 Evaluation Design and Setup . . . . . . . . . 40
4.1.1 Participants . . . . . . . . . . . . . . . 414.1.2 Experiment Procedure . . . . . . . . . 42
Contents vii
Think Aloud Design Setup . . . . . . 42Question Asking Design Setup . . . . 42
4.1.3 Usability Evaluation Questionaire . . 43System Usability Scale . . . . . . . . . 43Question for User Interaction Satis-
faction . . . . . . . . . . . . . 444.1.4 Dataset for Usability Testing . . . . . 45
4.2 Usability Evaluation of CEUR Make . . . . . 454.2.1 Participants . . . . . . . . . . . . . . . 46
Think Aloud Design Setup . . . . . . 46Question Asking Design Setup . . . . 47
4.2.2 Usability Evaluation Interview . . . . 48Quantitative Results . . . . . . . . . . 48Qualitative Results . . . . . . . . . . . 48
4.2.3 User Satisfaction Questionnaire . . . . 51System Usability Scale . . . . . . . . . 51Question for User Interaction Satis-
faction . . . . . . . . . . . . . 534.2.4 Summary . . . . . . . . . . . . . . . . 55
5 Design and Implementation of CEUR MakeWeb Interface 575.1 Architecture . . . . . . . . . . . . . . . . . . . 58
5.1.1 Interface Layer . . . . . . . . . . . . . 58MaterialUI . . . . . . . . . . . . . . . . 59jQuery Steps . . . . . . . . . . . . . . . 61Interface Layer File Strucure . . . . . . 63HTML Files . . . . . . . . . . . . . . . 64CSS . . . . . . . . . . . . . . . . . . . . 68Validation . . . . . . . . . . . . . . . . 68
5.1.2 Middleware Layer . . . . . . . . . . . 695.1.3 Storage Layer . . . . . . . . . . . . . . 71
Standard Store . . . . . . . . . . . . . . 71UserDirectories . . . . . . . . . . . . . 72EasyChair . . . . . . . . . . . . . . . . 72
5.2 User Interface . . . . . . . . . . . . . . . . . . 725.2.1 Sitemap . . . . . . . . . . . . . . . . . 725.2.2 Interface Design . . . . . . . . . . . . . 73
Navigational Menu . . . . . . . . . . . 73Footer Menu . . . . . . . . . . . . . . . 74Home View (Index.html) . . . . . . . . 74Issue View (Issue.html) . . . . . . . . 75Proceedings View (Proceedings.html) 76
viii Contents
Publish View (Publish.html) . . . . . . 76PublishPage View (PublishPage.html) 77EasyChairUpload View (Easy-
ChairUpload.html) . . . . . 795.2.3 Design Patterns . . . . . . . . . . . . . 79
Design Pattern: Pagination[36] . . . . 79Design Pattern: Autocomplete[34] . . 80Design Pattern: Card[35] . . . . . . . . 81Design Pattern: Wizard[37] . . . . . . 83
5.2.4 User Centered Design . . . . . . . . . 83Iteration One: Low Fidelity Prototype 84Iteration One: Medium Fidelity Pro-
totype . . . . . . . . . . . . . 84Iteration Three: High Fidelity Prototype 86
6 Usability Evaluation and Comparative Evalua-tion of CEUR Make GUI 876.1 Usability Evaluation of CEUR Make Graphi-
cal User Interface . . . . . . . . . . . . . . . . 876.1.1 Participants . . . . . . . . . . . . . . . 886.1.2 Usability Evaluation Interview . . . . 88
Quantitative Results . . . . . . . . . . 88Qualitative Results . . . . . . . . . . . 89
6.1.3 User Satisfaction Questionnaire . . . . 91System Usability Scale . . . . . . . . . 91Question for User Interaction Satis-
faction . . . . . . . . . . . . . 936.2 Comparison of CEUR Make Graphical User
Interface with CEUR Make . . . . . . . . . . . 956.2.1 Participants . . . . . . . . . . . . . . . 956.2.2 Quantitative Results Comparison . . . 966.2.3 Qualitative Results Comparison . . . 976.2.4 System Usability Scale Results Com-
parison . . . . . . . . . . . . . . . . . . 986.2.5 Question for user Interaction Satisfac-
tion Comparison . . . . . . . . . . . . 996.3 Summary . . . . . . . . . . . . . . . . . . . . . 100
7 Summary and future work 1027.1 Summary . . . . . . . . . . . . . . . . . . . . . 1027.2 Future work . . . . . . . . . . . . . . . . . . . 104
7.2.1 User Profiling . . . . . . . . . . . . . . 1047.2.2 Collaborative Space for Editors . . . . 105
Contents ix
7.2.3 Automatic Identification of Paper, Ti-tles and Page Numbers . . . . . . . . . 105
7.2.4 System State Saving . . . . . . . . . . 1067.2.5 Social Scientific Community . . . . . . 106
7.3 Conclusion . . . . . . . . . . . . . . . . . . . . 106
A Usability Evaluation Form for CEUR Make 108A.1 Letter of Consent[38] . . . . . . . . . . . . . . 108A.2 Usability Evaluation . . . . . . . . . . . . . . 109
A.2.1 Evaluation Interview . . . . . . . . . . 109Instructions . . . . . . . . . . . . . . . 110Task 1 - Initiate Generation . . . . . . 110Task 2 - Generate Workshop and
Copyright Form . . . . . . . 110Task 3 - Generate TOC and and Zip
Archive . . . . . . . . . . . . 112Task 4 - Search a Proceeding . . . . . . 113
A.2.2 Evaluation Questionnaire . . . . . . . 113System Usability Scale . . . . . . . . . 113Questionnaire for User Interaction
Satisfaction . . . . . . . . . . 114Demographic Questionnaire . . . . . 114
A.3 End Note . . . . . . . . . . . . . . . . . . . . . 114
B Usability Evaluation of CEUR Make Web Interface116B.1 Letter of Consent[38] . . . . . . . . . . . . . . 116B.2 Usability Evaluation . . . . . . . . . . . . . . 117
B.2.1 Evaluation Interview . . . . . . . . . . 118Instructions . . . . . . . . . . . . . . . 118Task 1 - Initiate Generation . . . . . . 118Task 2 - Generate Workshop and
Copyright Form . . . . . . . 118Task 3 - Generate TOC and and Zip
Archive . . . . . . . . . . . . 119Task 4 - Search a Proceeding . . . . . . 120
B.2.2 Evaluation Questionnaire . . . . . . . 120System Usability Scale . . . . . . . . . 120Questionnaire for User Interaction
Satisfaction . . . . . . . . . . 121Demographic Questionnaire . . . . . 122
B.3 End Note . . . . . . . . . . . . . . . . . . . . . 122
C Usability Evaluation Results for CEUR Make 124C.1 Think Aloud Design Setup Results . . . . . . 124
x Contents
C.1.1 Demographics . . . . . . . . . . . . . . 124C.1.2 Usability Evaluation Interview . . . . 125
Quantitative: Task Completion Time . 125Qualitative: Notes, Feedback . . . . . 126
C.1.3 Evaluation Questionnaire . . . . . . . 127System Usability Scale(SUS) . . . . . . 127Question for User Interaction Satis-
faction(QUIS) . . . . . . . . . 127C.2 Question Asking Design Setup Results . . . . 127
C.2.1 Demographics . . . . . . . . . . . . . . 128C.2.2 Usability Evaluation Interview . . . . 128C.2.3 Evaluation Questionnaire . . . . . . . 129
System Usability Scale(SUS) . . . . . . 129Question for User Interaction Satis-
faction(QUIS) . . . . . . . . . 129
D Usability Evaluation Results for CEUR MakeWeb Interface 132D.1 Think Aloud Design Setup Results . . . . . . 132
D.1.1 Demographics . . . . . . . . . . . . . . 133D.1.2 Usability Evaluation Interview . . . . 133
Quantitative: Task Completion Time . 134Qualitative: Notes, Feedback . . . . . 134
D.1.3 Evaluation Questionnaire . . . . . . . 134System Usability Scale(SUS) . . . . . . 135Question for User Interaction Satis-
faction(QUIS) . . . . . . . . . 135D.2 Question Asking Design Setup Results . . . . 136
D.2.1 Demographics . . . . . . . . . . . . . . 136D.2.2 Usability Evaluation Interview . . . . 137D.2.3 Evaluation Questionnaire . . . . . . . 137
System Usability Scale(SUS) . . . . . . 137Question for User Interaction Satis-
faction(QUIS) . . . . . . . . . 138
E Source Code 141
Bibliography 142
Index 146
xi
List of Figures
2.1 Index Page of CEUR Workshop Proceedings 92.2 CEUR Make User Workflow . . . . . . . . . . 112.3 Grid of Equals Design Pattern[26] . . . . . . . 162.4 Grid of Equals Design Pattern by Hulu[28] . 172.5 Grid of Equals Design Pattern by CNN[27] . 182.6 Steps of User Centered Design Process . . . . 24
3.1 Proceedings Workflow for Large Scale Con-ferences and Workshops . . . . . . . . . . . . 31
3.2 Proceedings Workflow for Small Scale andVirtual Conferences and Workshops . . . . . 33
3.3 Interface of EasyChair’s Program CommitteeManager . . . . . . . . . . . . . . . . . . . . . 34
3.4 Interface of EasyChair’s Paper AssignmentOverview . . . . . . . . . . . . . . . . . . . . . 35
3.5 EasyChair Interface for Generating Proceed-ings . . . . . . . . . . . . . . . . . . . . . . . . 36
3.6 EasyChair Interface for Viewing Contentsand Downloading Proceedings . . . . . . . . 36
4.1 System Usability Scale Key . . . . . . . . . . . 444.2 Experience Comparison of Participants:
Think Aloud VS Question Asking . . . . . . . 474.3 Average Time Taken To Complete A Task . . 494.4 Qualitative Feedback: Positive Feedback for
CEUR Make . . . . . . . . . . . . . . . . . . . 504.5 Qualitative Feedback: Negative Feedback
for CEUR Make . . . . . . . . . . . . . . . . . 514.6 System Usability Scale Score for CEUR Make 534.7 Question for User Interaction Satisfaction
Average Score per Question for CEUR Make- Part 1 . . . . . . . . . . . . . . . . . . . . . . 53
xii List of Figures
4.8 Question for User Interaction SatisfactionAverage Score per Question for CEUR Make- Part 2 . . . . . . . . . . . . . . . . . . . . . . 54
4.9 Most Problematic Areas according to QUISfor CEUR Make . . . . . . . . . . . . . . . . . 55
5.1 CEUR Make Graphical User Interface Archi-tecture . . . . . . . . . . . . . . . . . . . . . . 59
5.2 MaterialUI based Card: Proceedings Code . . 605.3 Toast: Feedback Toast after Table of Contents
Creation . . . . . . . . . . . . . . . . . . . . . 605.4 Interface Layer file Structure for CEUR Make
Graphical User Interface . . . . . . . . . . . . 645.5 Middleware Layer File Structure . . . . . . . 695.6 Storage Layer File Structure . . . . . . . . . . 715.7 Sitemap of CEUR Make Graphical User In-
terface . . . . . . . . . . . . . . . . . . . . . . . 735.8 Navigational Menu . . . . . . . . . . . . . . . 745.9 Footer Menu . . . . . . . . . . . . . . . . . . . 745.10 Index View . . . . . . . . . . . . . . . . . . . . 755.11 Issue View . . . . . . . . . . . . . . . . . . . . 755.12 Proceedings View . . . . . . . . . . . . . . . . 765.13 Publish View . . . . . . . . . . . . . . . . . . . 775.14 File Generation View . . . . . . . . . . . . . . 775.15 Table of Contents File Generation Wizard . . 785.16 Workshop File Generation Wizard . . . . . . 795.17 Resources Generated by CEUR Make Graph-
ical User Interface . . . . . . . . . . . . . . . . 805.18 EasyChairUpload View . . . . . . . . . . . . . 815.19 Design Pattern: Pagination . . . . . . . . . . . 825.20 Design Pattern: Autocomplete . . . . . . . . . 835.21 Iteration One: Mockup . . . . . . . . . . . . . 845.22 Iteration Two: Announcements Page . . . . . 855.23 Iteration Two: Proceedings Page . . . . . . . 865.24 Iteration Two: Publish Page . . . . . . . . . . 86
6.1 Average Time Taken To Complete A Task . . 896.2 Qualitative: Positive Feedback . . . . . . . . 916.3 Qualitative: Negative Feedback . . . . . . . . 926.4 System Usability Scale Score for CEUR Make
Graphical User Interface . . . . . . . . . . . . 936.5 Question for User Interaction Satisfaction
Average Score per Question for CEUR MakeGUI - Part 1 . . . . . . . . . . . . . . . . . . . 94
List of Figures xiii
6.6 Question for User Interaction SatisfactionAverage Score per Question for CEUR MakeGUI - Part 2 . . . . . . . . . . . . . . . . . . . 94
6.7 Task Completion Time Comparison . . . . . . 976.8 Qualitative Feedback Comparison . . . . . . 986.9 System Usability Scale Comparison . . . . . . 996.10 Question for User Interaction Satisfaction
Comparison . . . . . . . . . . . . . . . . . . . 100
A.1 Workshop Metadata for Usability Test ofCEUR Make . . . . . . . . . . . . . . . . . . . 111
A.2 Conference Metadata for Usability Test ofCEUR Make . . . . . . . . . . . . . . . . . . . 111
A.3 Editors Metadata for Usability Test of CEURMake . . . . . . . . . . . . . . . . . . . . . . . 112
A.4 Table of Contents Metadata for Usability Testof CEUR Make . . . . . . . . . . . . . . . . . . 112
A.5 System Usability Scale Questionnaire forCEUR Make . . . . . . . . . . . . . . . . . . . 113
A.6 Questionnaire for User Interaction Satisfac-tion for CEUR Make part 1 . . . . . . . . . . . 114
A.7 Questionnaire for User Interaction Satisfac-tion for CEUR Make part 2 . . . . . . . . . . . 115
A.8 Demographics Questionnaire for CEUR Make 115
B.1 System Usability Scale Questionnaire forCEUR Make Web Interface . . . . . . . . . . . 121
B.2 Questionnaire for User Interaction Satisfac-tion for CEUR Make part 1 . . . . . . . . . . . 121
B.3 Questionnaire for User Interaction Satisfac-tion for CEUR Make part 2 . . . . . . . . . . . 122
B.4 Demographics Questionnaire for CEUR Make 123
C.1 Demographics for the users who partici-pated in the Think Aloud Design Setup . . . 125
C.2 Task Completion Time Results for Ceur Make 126C.3 Qualitative Notes for Think Aloud Design
Setup . . . . . . . . . . . . . . . . . . . . . . . 126C.4 System Usability Scale Results for Think
Aloud Design Setup . . . . . . . . . . . . . . . 128C.5 Question for User Interaction Satisfaction
Results for Think Aloud Design Setup . . . . 129C.6 Demographics for the users who partici-
pated in the Question Asking Design Setup . 130
xiv
C.7 Qualitative Notes for Question Asking De-sign Setup . . . . . . . . . . . . . . . . . . . . 130
C.8 System Usability Scale Results for QuestionAsking Design Setup . . . . . . . . . . . . . . 131
D.1 Demographics for the users who partici-pated in the Think Aloud Design Setup . . . 133
D.2 Task Completion Time Results for CeurMake GUI . . . . . . . . . . . . . . . . . . . . 134
D.3 Qualitative Notes for Think Aloud DesignSetup . . . . . . . . . . . . . . . . . . . . . . . 135
D.4 System Usability Scale Results for ThinkAloud Design Setup . . . . . . . . . . . . . . . 136
D.5 Question for User Interaction SatisfactionResults for Think Aloud Design Setup . . . . 137
D.6 Demographics for the users who partici-pated in the Question Asking Design Setup . 138
D.7 Qualitative Notes for Question Asking De-sign Setup . . . . . . . . . . . . . . . . . . . . 139
D.8 System Usability Scale Results for QuestionAsking Design Setup . . . . . . . . . . . . . . 140
List of Tables
4.1 Average Time Taken To Complete A Task(Minutes) . . . . . . . . . . . . . . . . . . . . . 49
4.2 System Usability Scale Results for CEUR Make 52
6.1 Average Time Taken To Complete A Task . . 896.2 System Usability Scale Results for CEUR
Make Graphical User Interface . . . . . . . . 93
B.1 Metadata for Workshop . . . . . . . . . . . . 119B.2 Conference Metadata for Workshop . . . . . 119B.3 Data for Workshop Editors . . . . . . . . . . . 119B.4 Data for Table of Contents . . . . . . . . . . . 120
xv
Abbreviations
AI Artificial Intelligence
UI User Interface
UxD User of Experience Design
ACM Association of Computing Machinery
UCD User of Centered Design
CAD Computer Aided Designing
HCI Human Computer Interaction
CHI Computer Human Interaction
SUS System Usability Scale
WWW World Wide Web Work
CSCW Computer Supported Cooperative Work
HTML Hyper Text Markup Language
QUIS Questionnaire for User Interaction Satisfaction
IEEE Institute of Electrical and Electronics Engineers
xvi
Abstract
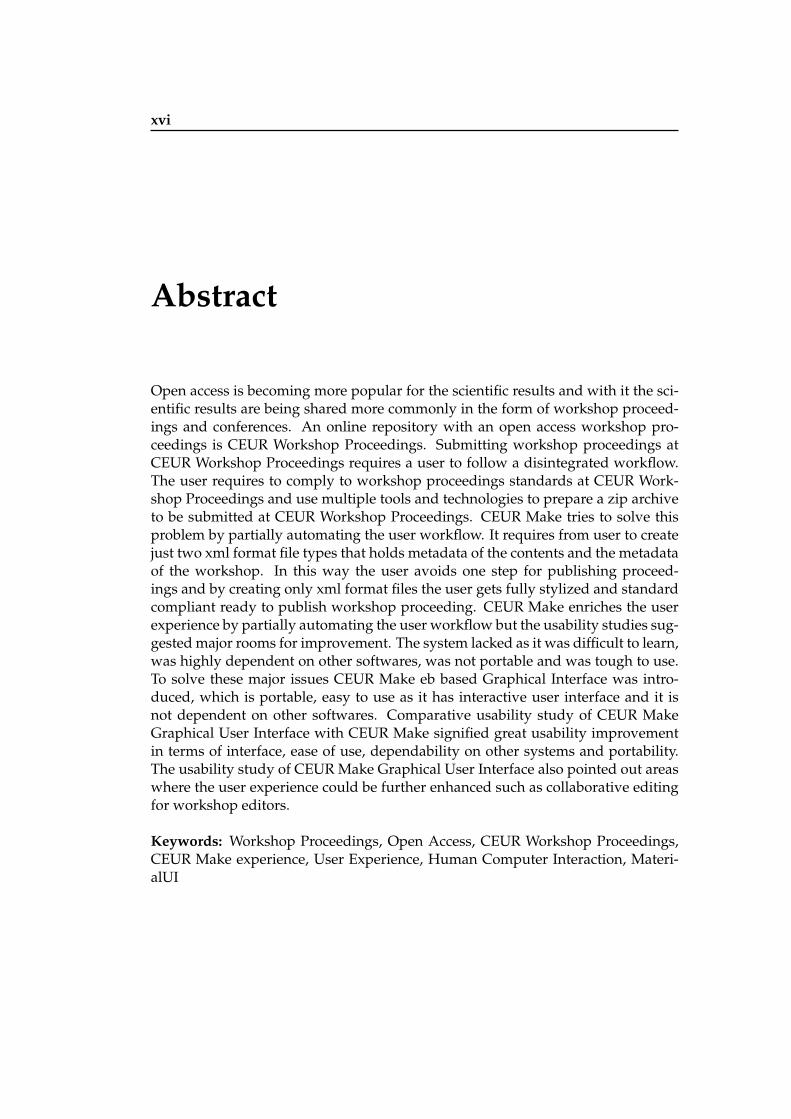
Open access is becoming more popular for the scientific results and with it the sci-entific results are being shared more commonly in the form of workshop proceed-ings and conferences. An online repository with an open access workshop pro-ceedings is CEUR Workshop Proceedings. Submitting workshop proceedings atCEUR Workshop Proceedings requires a user to follow a disintegrated workflow.The user requires to comply to workshop proceedings standards at CEUR Work-shop Proceedings and use multiple tools and technologies to prepare a zip archiveto be submitted at CEUR Workshop Proceedings. CEUR Make tries to solve thisproblem by partially automating the user workflow. It requires from user to createjust two xml format file types that holds metadata of the contents and the metadataof the workshop. In this way the user avoids one step for publishing proceed-ings and by creating only xml format files the user gets fully stylized and standardcompliant ready to publish workshop proceeding. CEUR Make enriches the userexperience by partially automating the user workflow but the usability studies sug-gested major rooms for improvement. The system lacked as it was difficult to learn,was highly dependent on other softwares, was not portable and was tough to use.To solve these major issues CEUR Make eb based Graphical Interface was intro-duced, which is portable, easy to use as it has interactive user interface and it isnot dependent on other softwares. Comparative usability study of CEUR MakeGraphical User Interface with CEUR Make signified great usability improvementin terms of interface, ease of use, dependability on other systems and portability.The usability study of CEUR Make Graphical User Interface also pointed out areaswhere the user experience could be further enhanced such as collaborative editingfor workshop editors.
Keywords: Workshop Proceedings, Open Access, CEUR Workshop Proceedings,CEUR Make experience, User Experience, Human Computer Interaction, Materi-alUI
xvii
Acknowledgements
I would like to thank Prof. Dr. Sören Auer for his interest in the topic and for pro-viding me with a valuable feedback. I would also like to pay a high regard to mymentor, Dr. Christoph Lange who helped me throughout my master thesis dura-tion. Without his insightful feedback and valuable comments it would not havebeen possible. I would also like to thank my parents who supported me throughthick and thin. Finally, special thanks to my sister who reminded me constantlythat good things await you after hard journeys.
xviii
Conventions
Throughout this thesis we use the following conventions.
Text conventions
Definitions of technical terms or short excursus are set offin coloured boxes.
EXCURSUS:Excursus is a detailed discussion of a particular point in abook, usually in an appendix, or digressions in a writtentext.
Definition:Excursus
Source code and implementation symbols are written intypewriter-style text.
<?phpecho "Hello World!";?>
The whole thesis is written in Canadian English.
Download links are set off in coloured boxes.
File: myFilea
ahttp://hci.rwth-aachen.de/public/folder/file number.file
1
Chapter 1
Introduction
"If you want a great site, you’ve got to test. Afteryou’ve worked on a site for even a few weeks,you can’t see it freshly anymore. You know toomuch. The only way to find out if it really worksis to test it." - Steve Krug
1.1 Problem Description and Motivation
Scientific work, results and research data are being rapidly Scientific discoveryand scientificknowledge havebeen achieved onlyby those who havegone in pursuit of itwithout any practicalpurpose whatsoeverin view. - Max Planck
shared across the globe through internet, live conferencesand workshops. Scientists are doing a lot of research in dif-ferent areas of Computer Science and trying to present theircontributions at different conferences. Among these confer-ences some of the most widely known ones are organisedby organisations like IEEE and ACM, apart from them alot of other conferences are organised by different organisa-tions. Once the scientific work is presented at a conference,it is shared in the form of conference proceedings. Proceed-ings is the collection of scientific papers published and pre-sented at conferences in context to a conference or a work-shop. One such web portal where one can find and publishproceedings is CEUR Workshop Proceedings[3]. The mate-rial at the portal is open access and therefore, it is easily ac-cessible to the audience. The focus of this thesis would be
2 1 Introduction
on improving the workflow of CEUR Workshop Proceed-ings.
1.1.1 Problem Description
Publishing at CEUR Workshop Proceedings require usersThe growth ofscientific research
during the pastdecades has
outpaced the publicresources available
to fund it. - LutzBornmann
to provide certain input files with metadata such as work-shop names, author names etc. The submission files usuallyinclude Table of Contents file in XML format that holds themetadata associated to contents of the proceedings, Work-shop file in XML format that holds metadata associated toworkshops conducted and index file in HTML format thatpresents the workshop proceedings at the CEUR WorkshopProceedings website. In order to publish proceedings atCEUR Workshop Proceedings a user can choose currentlyamong three workflows. Creating a package of files man-ually and submitting at CEUR Workshop Proceedings, cre-ating Table of Contents file and Workshop file and then ob-taining the submission package using CEUR Make utilityand then submitting at CEUR Workshop Proceedings or us-ing EasyChair to get files and using CEUR Make utility togenerate submission package and then submitting at CEURWorkshop Proceedings. All of the workflows presented arediscussed in more detail in Chapter 2 Section 2.3, which arecurrently not intuitive and require a lot of manual work-force. Hence, the main purpose of this thesis is to obtain asolution that could help users focus on the task instead ofcreating additional resources.
In this era, everything is designed while keeping the userneeds at center. Hence, the user can focus more on the de-sired task rather than additional activities. It is also im-portant so that the users can achieve the goals more easily.Initially, in order to submit at CEUR Workshop Proceed-ings, one had to follow a lengthy list of rules[22] and sev-eral standards[22] in order to publish at CEUR WorkshopProceedings. Later, Lange and coworkers[17] developed aterminal based utility that aimed to automate certain partsof publishing at CEUR Workshop Proceedings. The projectis called CEUR Make and is open source which could bedistributed freely. One has to be familiar with command
1.2 Thesis Structure 3
line in order to benefit from the CEUR Make and still has tofollow certain file and naming standards in order to finallypublish at CEUR Workshop Proceedings. The thing thatmakes it difficult for publishers to publish at CEUR Work-shop Proceedings using CEUR Make is that it has a lot ofsoftware dependencies.
1.1.2 Motivation
Today, most of the software applications are interactive and The main thing isthat everythingbecome simple, easyenough for a child tounderstand. - AlbertCamus
designed according to the user needs in order to make thetask for user easier to perform. Hence, the terminal basedutility is without a doubt quite helpful for easing up taskof publishing proceedings for the users and making certainprocesses efficient but it requires knowledge of commandline utility, requires installation of dependencies and it doesnot validate data as much as required. Therefore, the aimof this thesis is to provide a web based graphical user in-terface that is interactive enough for users to publish theproceedings using CEUR Make workflow. It aims to helppublishers in creating different artifacts for publishing atCEUR Workshop Proceedings.
1.2 Thesis Structure
This thesis is organised as following:
Chapter 1 - Introduction : This chapter presents an intro-duction of the topic. It discusses the problem statement andmotivation for the thesis.
Chapter 2 - Background : This chapter provides the back-ground information of the topics covered in this thesis.
Chapter 3 - Related Work : This chapter discusses therelated workflows, software systems and usability tech-niques.
Chapter 4 - Usability Evaluation Methodology and CEUR
4 1 Introduction
Make Usability Evaluation : This chapter presents theevaluation technique for software systems and evaluatesthe usability of CEUR Make utility.
Chapter 5 - Design and Implementation of CEUR MakeWeb Interface : This chapter describes the new design andimplementation of the CEUR MAKE Graphical User Inter-face.
Chapter 6 - Usability Evaluation and Comparative Evalu-ation of CEUR Make GUI : This chapter presents evalu-ation results of CEUR Make Graphical User Interface andalso compares the usability of CEUR Make with CEURMake Graphical User Interface.
Chapter 7 - Summary and Future Work : This chapterpresents conclusion of the thesis and also presents possibil-ities of future work in the domain of workshop proceed-ings.
5
Chapter 2
Background
"Design for spread and scale." – Denise Gersh-bein - Steve Krug
This chapter gives a description about the terminologiesused in the scientific community and discusses workflowfor publishing workshop proceedings at CEUR WorkshopProceedings. The chapter also presents the topics relatedto Human Computer Interaction and Usability and dis-cusses usability evaluation methods. At the end, the chap-ter presents a brief description about the technologies usedin our project.
2.1 Scientific Terminologies
2.1.1 Science
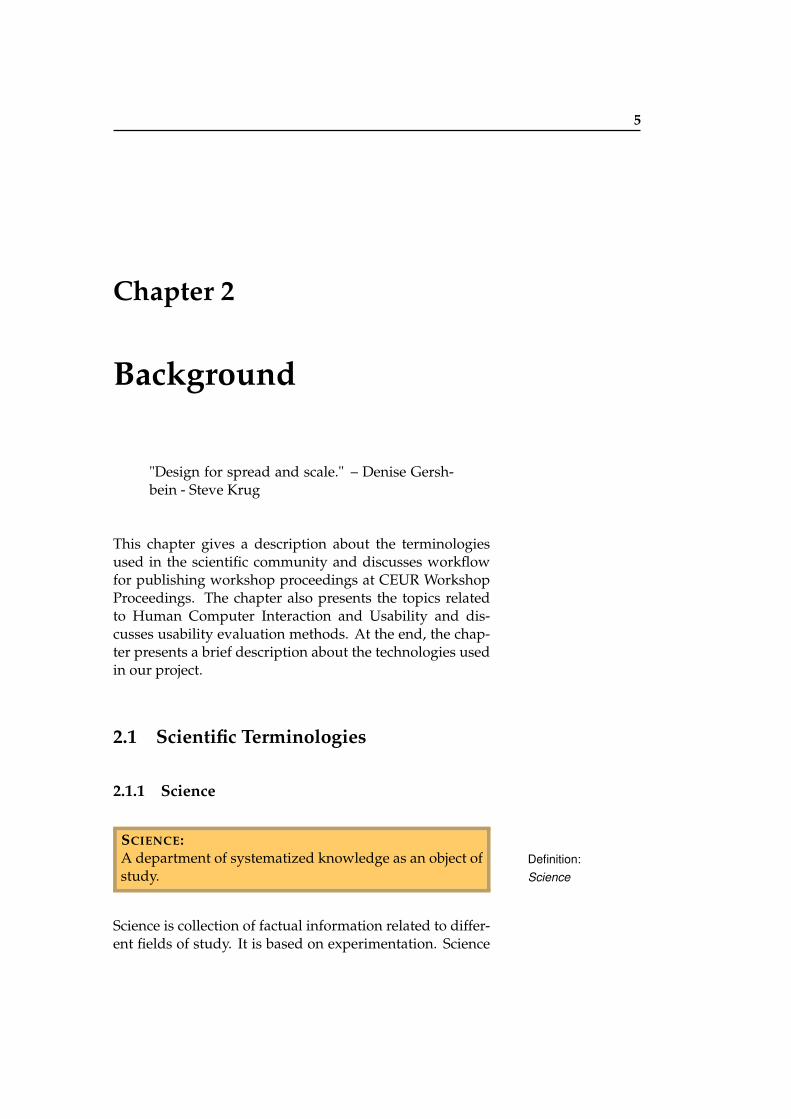
SCIENCE:A department of systematized knowledge as an object ofstudy.
Definition:Science
Science is collection of factual information related to differ-ent fields of study. It is based on experimentation. Science
6 2 Background
includes both the work that is proven as scientific facts andthe work that is still being researched as scientific research.
2.1.2 Scientist
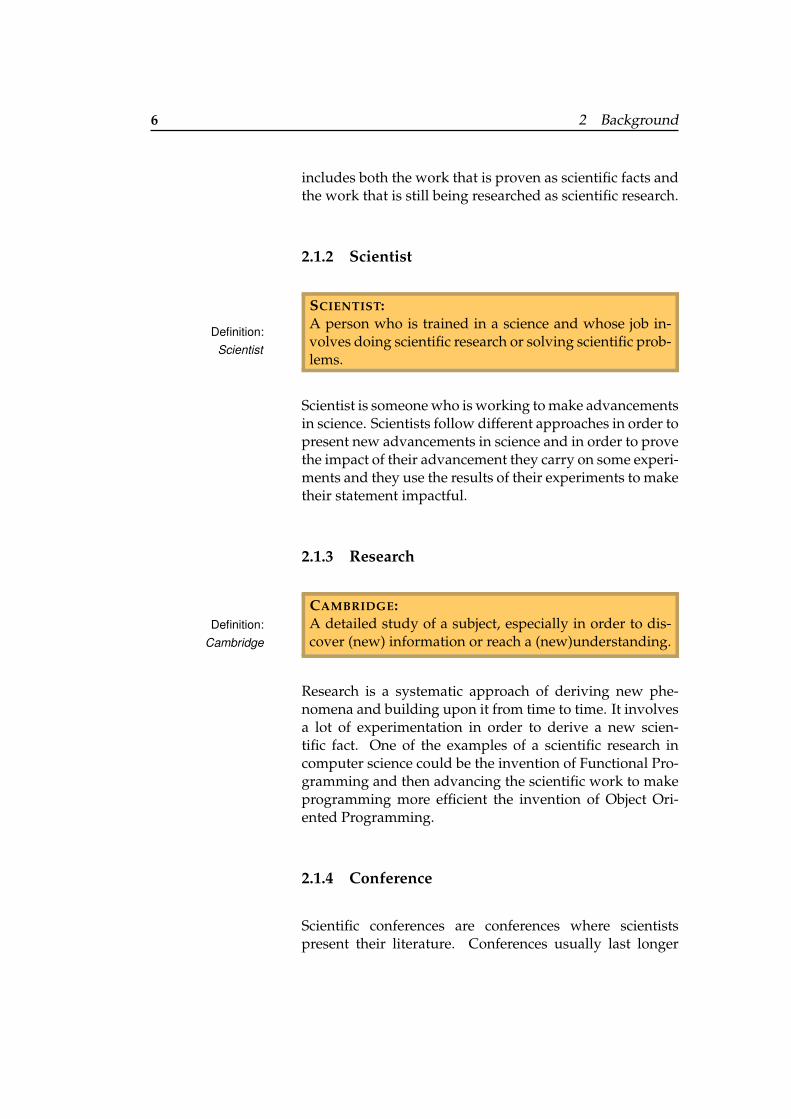
SCIENTIST:A person who is trained in a science and whose job in-volves doing scientific research or solving scientific prob-lems.
Definition:Scientist
Scientist is someone who is working to make advancementsin science. Scientists follow different approaches in order topresent new advancements in science and in order to provethe impact of their advancement they carry on some experi-ments and they use the results of their experiments to maketheir statement impactful.
2.1.3 Research
CAMBRIDGE:A detailed study of a subject, especially in order to dis-cover (new) information or reach a (new)understanding.
Definition:Cambridge
Research is a systematic approach of deriving new phe-nomena and building upon it from time to time. It involvesa lot of experimentation in order to derive a new scien-tific fact. One of the examples of a scientific research incomputer science could be the invention of Functional Pro-gramming and then advancing the scientific work to makeprogramming more efficient the invention of Object Ori-ented Programming.
2.1.4 Conference
Scientific conferences are conferences where scientistspresent their literature. Conferences usually last longer
2.1 Scientific Terminologies 7
than a day. Literature presented at scientific conferencesis peer reviewed in some cases before a final verdict is is-sued on its acceptance or rejection. In most of the scien-tific conferences the literature gets accepted before it is pre-sented at the conference depending on the regulations ofthe conference. Once the literature is accepted at a scien-tific conference, the authors of the papers give short pre-sentations on their paper and share the knowledge withother researchers and scientific community. Later, the pa-pers are published as the part of conference’s proceedings.Organisations which conduct most number of conferencesare ACM and IEEE.
2.1.5 Workshops
Scientific workshops are usually short in nature unlike sci-entific conferences. Scientific workshops could be the partof larger academic conferences. In scientific workshops sci-entists usually share the results of research that is not neces-sarily completed or is still in process. Workshops are usu-ally short. Scientific workshops are more practical in na-ture.
2.1.6 Paper
Scientific paper is the literature written by a scientist in or- According to aresearch 1.346million papers werepublished in 23.750journals within 2006.
der to present his contribution in a particular field. Scien-tific papers are generally presented in scientific conferenceswhich are then reviewed and if it get’s accepted the paperis published at an scientific conference which is then madeavailable in the form of proceedings. A scientific paper thatis not published at an academic conference is sometimespresented as a first draft at a scientific workshop. Scientificpapers hold importance as they help to progress researchin different fields which are then used by other scientists tobuild theories upon the previous research.
8 2 Background
2.1.7 Proceedings
Scientific proceeding is the record of scientific papers pub-lished in different conferences. Scientific proceedings areoften assigned a unique series number in context to the sub-mission of the proceeding. The number is allocated basedon different metrics such as date. So, part of the proceed-ings published on the same date will have the same seriesnumber. Scientific proceedings are sometimes made avail-able before the conference and sometimes after the con-ference. The papers are usually gathered by the editorof the proceeding or the proceedings chair of the confer-ence. For the quality of proceedings, they should be peerreviewed before they get published in proceedings. Pro-ceedings could be published in three common ways, whichincludes publishing it as a book, journal or as a serial pub-lication.
2.1.8 Open Access
Open access is a term coined for research outputs availableonline, that doesn’t have any restrictions on access and arealso free of many restrictions on use.
2.2 CEUR Workshop Proceedings
CEUR Workshop Proceedings[3] is an open access platformEach year CEURworkshop
proceedings have200 volume
submissions.Majority of
workshops arecomputer science
related.
for submitting the scientific proceedings. It is a platformthat is hosted by Sun SITE Central Europe1 and it runs un-der the i5 department2 of RWTH Aachen University. CEURWorkshop Proceedings are officially authorised ISSN pub-lication series3. CEUR Workshop Proceedings offer or-ganisers of academic workshops and conferences to dis-tribute their proceedings using the CEUR Workshop Pro-ceedings. The main page of the CEUR Workshop Proceed-
1http://sunsite.informatik.rwth-aachen.de2http://dbis.rwth-aachen.de/cms3http://ceur-ws.org/issn-1613-0073.html
2.2 CEUR Workshop Proceedings 9
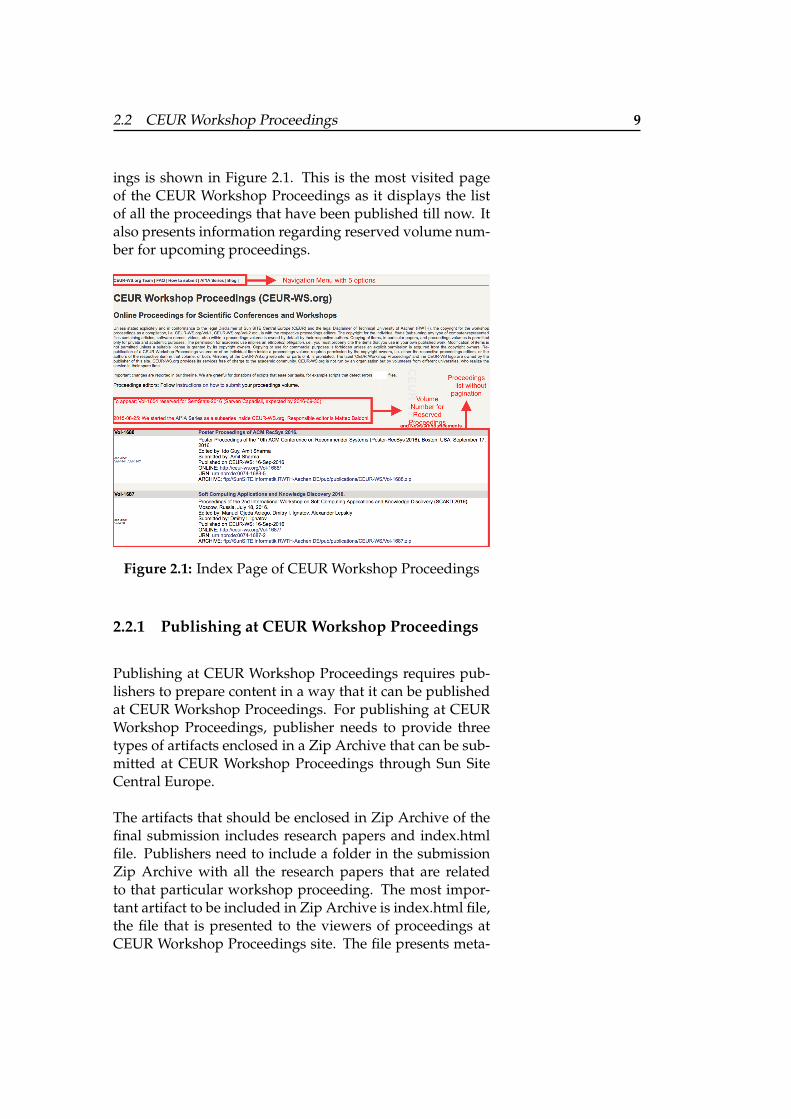
ings is shown in Figure 2.1. This is the most visited pageof the CEUR Workshop Proceedings as it displays the listof all the proceedings that have been published till now. Italso presents information regarding reserved volume num-ber for upcoming proceedings.
Figure 2.1: Index Page of CEUR Workshop Proceedings
2.2.1 Publishing at CEUR Workshop Proceedings
Publishing at CEUR Workshop Proceedings requires pub-lishers to prepare content in a way that it can be publishedat CEUR Workshop Proceedings. For publishing at CEURWorkshop Proceedings, publisher needs to provide threetypes of artifacts enclosed in a Zip Archive that can be sub-mitted at CEUR Workshop Proceedings through Sun SiteCentral Europe.
The artifacts that should be enclosed in Zip Archive of thefinal submission includes research papers and index.htmlfile. Publishers need to include a folder in the submissionZip Archive with all the research papers that are relatedto that particular workshop proceeding. The most impor-tant artifact to be included in Zip Archive is index.html file,the file that is presented to the viewers of proceedings atCEUR Workshop Proceedings site. The file presents meta-
10 2 Background
data in HTML file format associated to workshop proceed-ings, conferences, authors and editors. The general layoutof the index.html4 file is provided by CEUR Workshop Pro-ceedings and the publishers are supposed to comply to thatlayout.
There are certain standards for filling in metadata in indexfile which are discussed below:
HTML Validation: The HTML code should be validatedand therefore the index.html file should be validatedusing the W3C Validator5.
Plain Text Editor: The publishers should create the in-dex.html file using a plain text editor like notepadand they should avoid web based editors as theweb based editors insert special characters in the filewhich can’t be seen. The file should be encoded asUTF-8 Unicode.
Rules for Papers in Proceedings: The papers shouldhave at least 5 pages. Short papers and an abstractcould also be included.
Local vs Absolute Links: Links for the materials thathave been published must be local, whereas the linksfor the workshops home pages and authors homepages are absolute links.
Title capitalization: Title capitalization must be done inemphasized capitalized style or regular english style.The index.html file for proceedings volume shouldcomply to one of the title capitalization styles, mix oftwo is not recommended. MusicBrainz6 is one suchplace to learn about title capitalization rules.
4http://ceur-ws.org/Vol-XXX/index.html5https://validator.w3.org/nu/6http://wiki.musicbrainz.org/Style/Language/
English
2.3 CEUR Make 11
2.3 CEUR Make
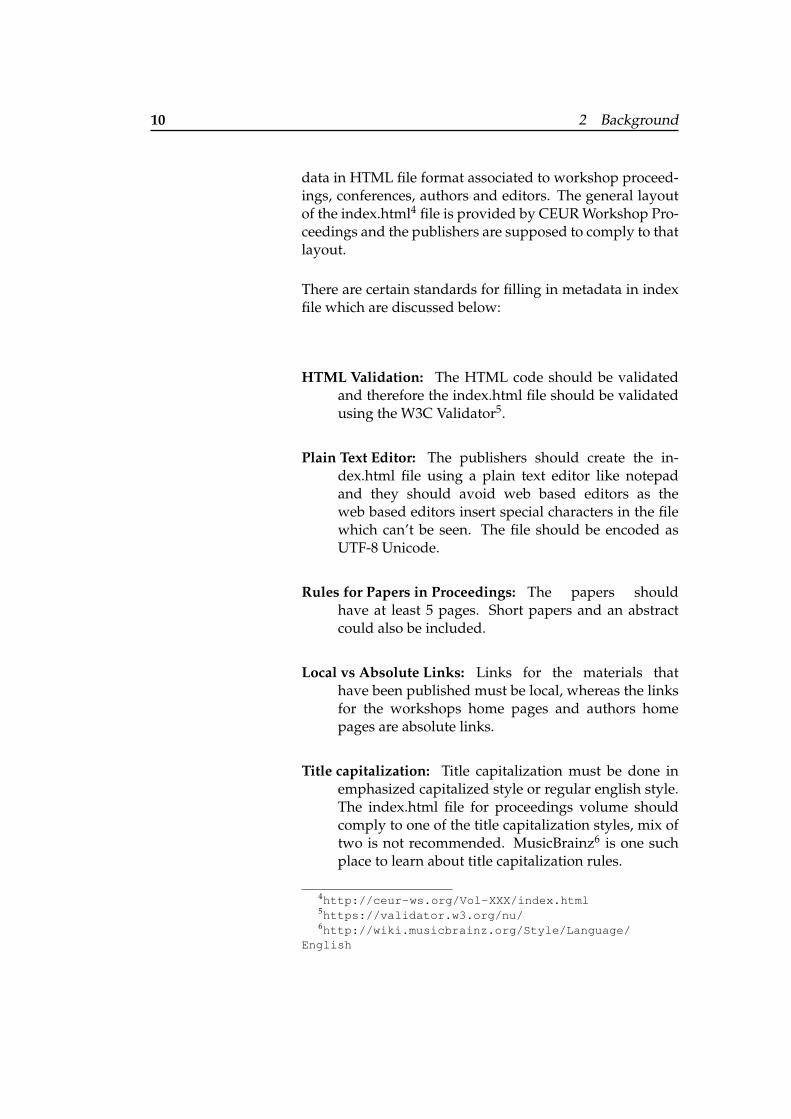
CEUR Make is a command line utility that generates theartifacts required to submit at CEUR Workshop Proceed-ings. As we discussed in the previous Section 2.2.1, to sub-mit workshop proceedings at CEUR Workshop Proceed-ings publishers require index.html file and research papersall enclosed in an Zip Archive. So, CEUR Make takes as aninput two XML format files namely Table of Contents andWorkshop as shown in Figure 2.2 and based on those filesit generates as an output artifacts that are used to publishworkshop proceedings.
Figure 2.2: CEUR Make User Workflow
Publisher can create Table of Contents and Workshop fileby using an XML templates7,8 as provided by the CEURMake team. For creating artifacts linux based shell scriptcommands are used. Before running the command usersneed to download the CEUR Make script package from theCEUR Make Github repository9 and than add the XML filescreated into that folder. After that users can run the shellscript commands from the directory that was installed fromCEUR Make Github repository. The shell scripts for creat-ing the different artifacts are explained below:
Index.html: This is the file that is actually presented toviewer as CEUR Workshop Proceedings. The com-mand to make this file is: make ceur-ws/index.html.
7https://github.com/ceurws/ceur-make/blob/master/toc.xml
8https://github.com/ceurws/ceur-make/blob/master/workshop.xml
9https://github.com/ceurws/ceur-make
12 2 Background
Copyright Form: This is the form that CEUR Make createsas a template based on the Workshop metadata. Thecommand to make this file is : make copyright-form.txt.
Zip Archive: This is ready to submit package at CEURWorkshop Proceedings. It contains all the source filesrequired to submit at CEUR Workshop Proceedings.The command to make this file is : make zip.
BibTex Database: This contains bibliography. The com-mand to make this file is : make ceur-ws/temp.bib.
2.4 Human Computer Interaction
The way humans have been interacting with computershad kept on evolving with time. Few years back graph-ical interfaces were not common and the most commonway for humans to interact with computers was with thekeyboards. Then, in the 1960s [19] direct manipulation ofDifferent faculties
that deals with HCItoday includes
design,communication
studies, psychology,cognitive science,
technology studies,systems engineering
and industrialengineering.
objects with pointing devices was first introduced, whichchanged the human thought process of interacting withcomputers and brought humans more in control of com-puters than computer’s controlling human mind. Some ofthe building blocks of Human Computer Interaction aremouse, bitmapped displays, personal computers, windowsand point and click editor’s ( Baecker and Buxton, 1987,Chapter 1 ).With the innovation of mouse and personalcomputers the human and computer interaction startedevolving more firmly. Researchers, could finally see thatprogramming complex systems was not the key in promot-ing technology among the common users but the key wasto focus on Human Computer Interaction.
With the time came more interactive applications like artpads and computer games. Computer graphics researchwork have been closely associated with the developmentof Human Computer Interaction [14], as it helped in areaslike direct manipulation of complex graphic softwares likeCAD ( computer aided designing ). Technological advance-ments are important in the way they contribute to developmore advantageous Human Computer Interaction systems,
2.5 Design Patterns 13
but with it, human psychology and perception is equallyimportant. One of the most groundbreaking research inthe way psychology helps advance Human Computer In-teraction is by Donald Norman [21]. The research lays de-tail focus on the way things are designed and how humanperception can be used to differentiate between good andbad design. Though, the two main categories of HumanComputer Interaction is the human side and the technol-ogy side, but the field itself is growing enormously and con-tributing in different areas like Computer Supported Coop-erative Work and Artificial Intelligence.
So, Human Computer Interaction is the way humans inter-act with the computers and the way computers respond tohuman interaction. More formal and complete definition ofthe field itself is given as below:
HCI:Human Computer Interaction is a discipline concernedwith the design, evaluation and implementation of inter-active computing systems for human use and with thestudy of major phenomena surrounding them. - ACMSIGCHI
Definition:HCI
Today, researchers are actively working in the field of Hu-man Computer Interaction. They are trying to evolvegraphical user interfaces and interactions of humans withcomputers. The current trend in Human Computer Inter-action is to bring more advanced gestural interactions andhuman eye related computer interactions.
2.5 Design Patterns
This section will present a brief history about design pat-terns and then cover in detail the usage of design patternsin the field of HCI.
14 2 Background
2.5.1 Design Patterns A Historical Background
Design patterns are important in order to promote stan-dardization and quality of work. Design patterns inHuman Computer Interaction takes its route from acontribution, A Pattern Language: Towns, Buildings,Construction[5]. A Pattern Language was a book publishedAt the core... is the
idea that peopleshould design for
themselves their ownhouses, streets and
communities. Thisidea... comes simplyfrom the observation
that most of thewonderful places ofthe world were notmade by architects
but by the people. —Christopher
Alexander et al., APattern Language
in 1977 which focused on following a neat approach in ar-chitectural design, so that the ordinary people could use apattern language to construct beautiful buildings across theworld.
Then, for the first time in software engineering design pat-terns were introduced in OOPSLA conference10 by KentBeck and Ward Cunningham. Further, the design patternsin software engineering became more mature in 1994 withthe introduction of the book Design Patterns: Elementsof Reusable Object-Oriented Software by so called Gangof Four[13]. The book covers in detail the patterns forsoftware design, that could be used as standards to solvecomplex software problems. One example could be theobserver pattern, that is commonly used to observe thechanges in different classes and notify it.
Design patterns in HCI were first introduced by Nor-man and Draper in 1986 in their book called User Cen-tered System: New perspectives on Human ComputerInteraction[9]. The book concentrated on user centered ap-proach in HCI that we will discuss in the next Section 2.7that is user centered design. The book also provided cer-tain patterns that could be used to solve user focused prob-lems. Though, the design patterns were first introduced in1986 but that was not the mark of formal definition of de-sign patterns in HCI. Two years after the introduction ofsoftware design patterns, in 1996 was the formal beginningof realisation of design patterns in the field of HCI whenCoram and Lee introduced A pattern language for inter-face design[31]. Today, design patterns in HCI are widelyused across many applications from personal blogs to com-plex software systems like Adobe’s Creative Suite11. Some
10http://c2.com/doc/oopsla87.html11http://www.adobe.com/products/cs6.html
2.5 Design Patterns 15
of the major contributions are presented at conferences likeCHI12 and INTERACT13 every year to report the major de-sign patterns and methodologies in HCI.
2.5.2 Design Patterns In HCI: An Introduction
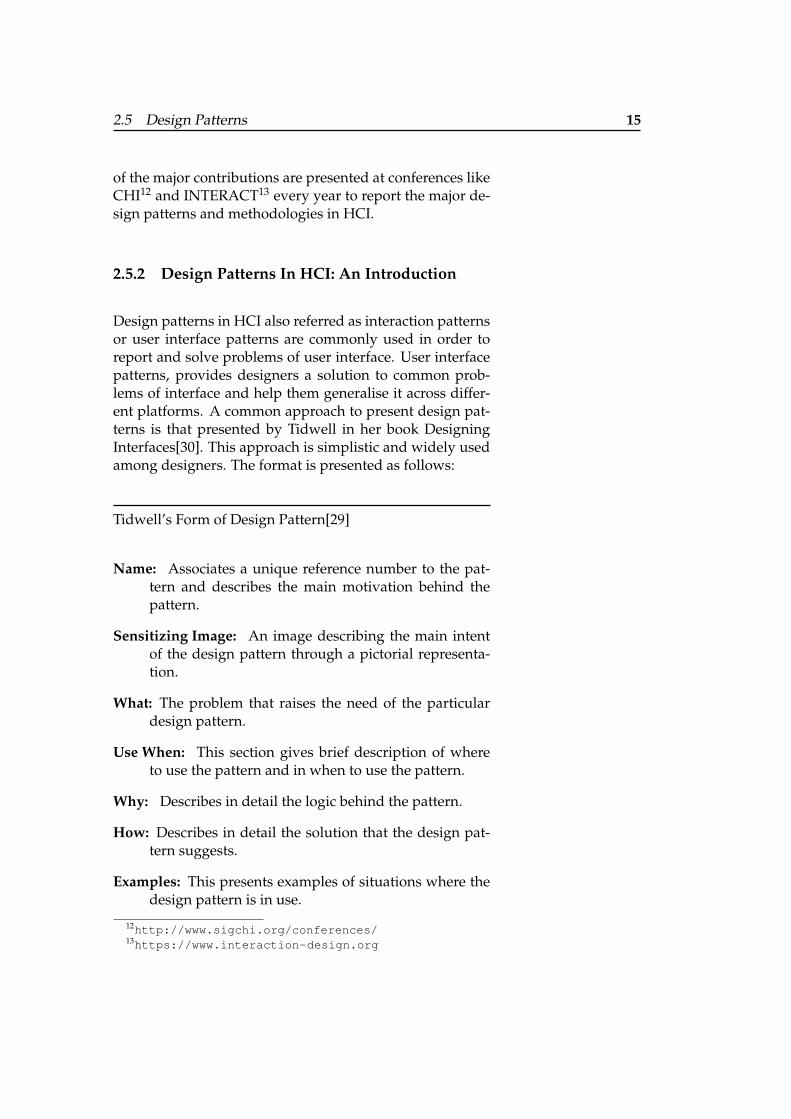
Design patterns in HCI also referred as interaction patternsor user interface patterns are commonly used in order toreport and solve problems of user interface. User interfacepatterns, provides designers a solution to common prob-lems of interface and help them generalise it across differ-ent platforms. A common approach to present design pat-terns is that presented by Tidwell in her book DesigningInterfaces[30]. This approach is simplistic and widely usedamong designers. The format is presented as follows:
Tidwell’s Form of Design Pattern[29]
Name: Associates a unique reference number to the pat-tern and describes the main motivation behind thepattern.
Sensitizing Image: An image describing the main intentof the design pattern through a pictorial representa-tion.
What: The problem that raises the need of the particulardesign pattern.
Use When: This section gives brief description of whereto use the pattern and in when to use the pattern.
Why: Describes in detail the logic behind the pattern.
How: Describes in detail the solution that the design pat-tern suggests.
Examples: This presents examples of situations where thedesign pattern is in use.
12http://www.sigchi.org/conferences/13https://www.interaction-design.org
16 2 Background
The following example would make the idea of design pat-terns more clearer:
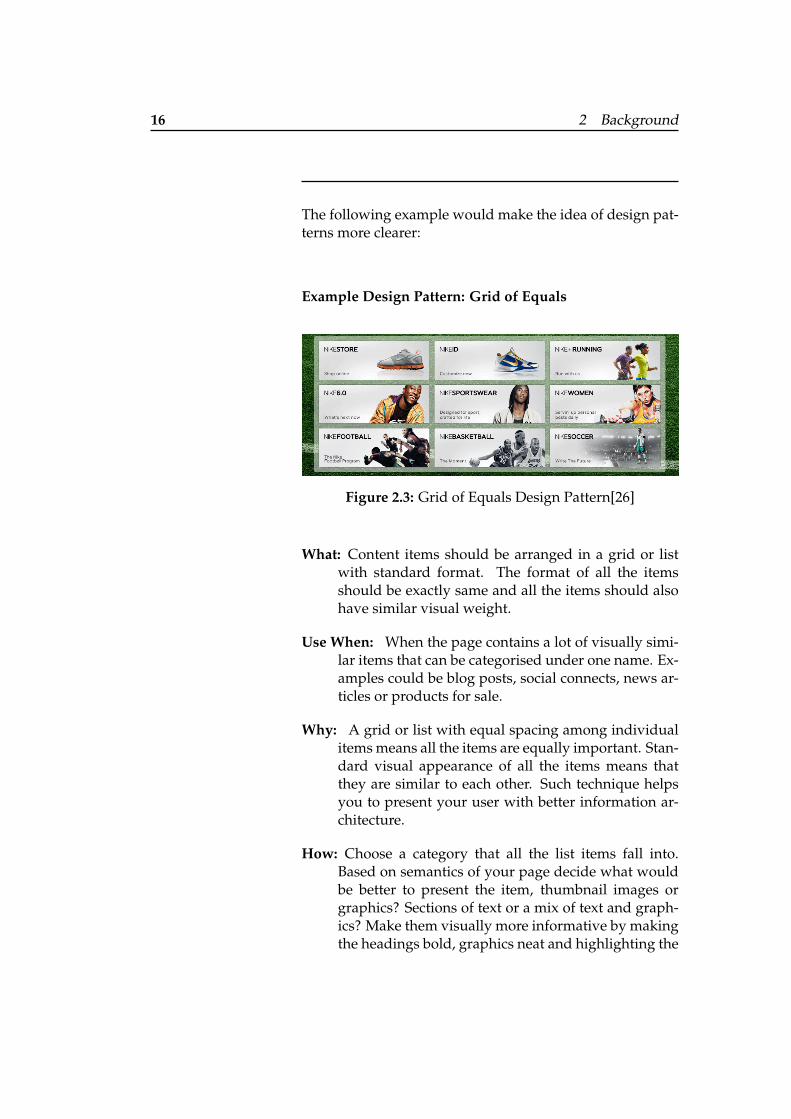
Example Design Pattern: Grid of Equals
Figure 2.3: Grid of Equals Design Pattern[26]
What: Content items should be arranged in a grid or listwith standard format. The format of all the itemsshould be exactly same and all the items should alsohave similar visual weight.
Use When: When the page contains a lot of visually simi-lar items that can be categorised under one name. Ex-amples could be blog posts, social connects, news ar-ticles or products for sale.
Why: A grid or list with equal spacing among individualitems means all the items are equally important. Stan-dard visual appearance of all the items means thatthey are similar to each other. Such technique helpsyou to present your user with better information ar-chitecture.
How: Choose a category that all the list items fall into.Based on semantics of your page decide what wouldbe better to present the item, thumbnail images orgraphics? Sections of text or a mix of text and graph-ics? Make them visually more informative by makingthe headings bold, graphics neat and highlighting the
2.6 Usability and User Experience and Design 17
important things. Once you have decided with de-sign of single items, you can think of arranging themin a grid of single row or multiple rows.
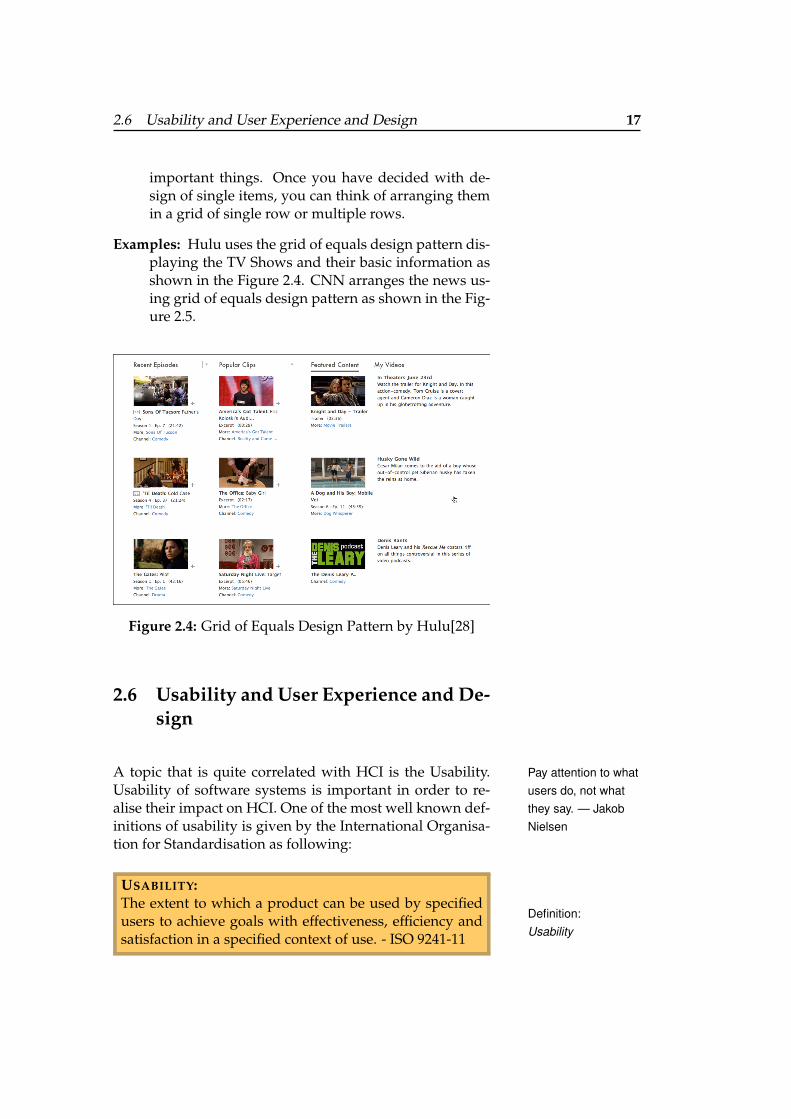
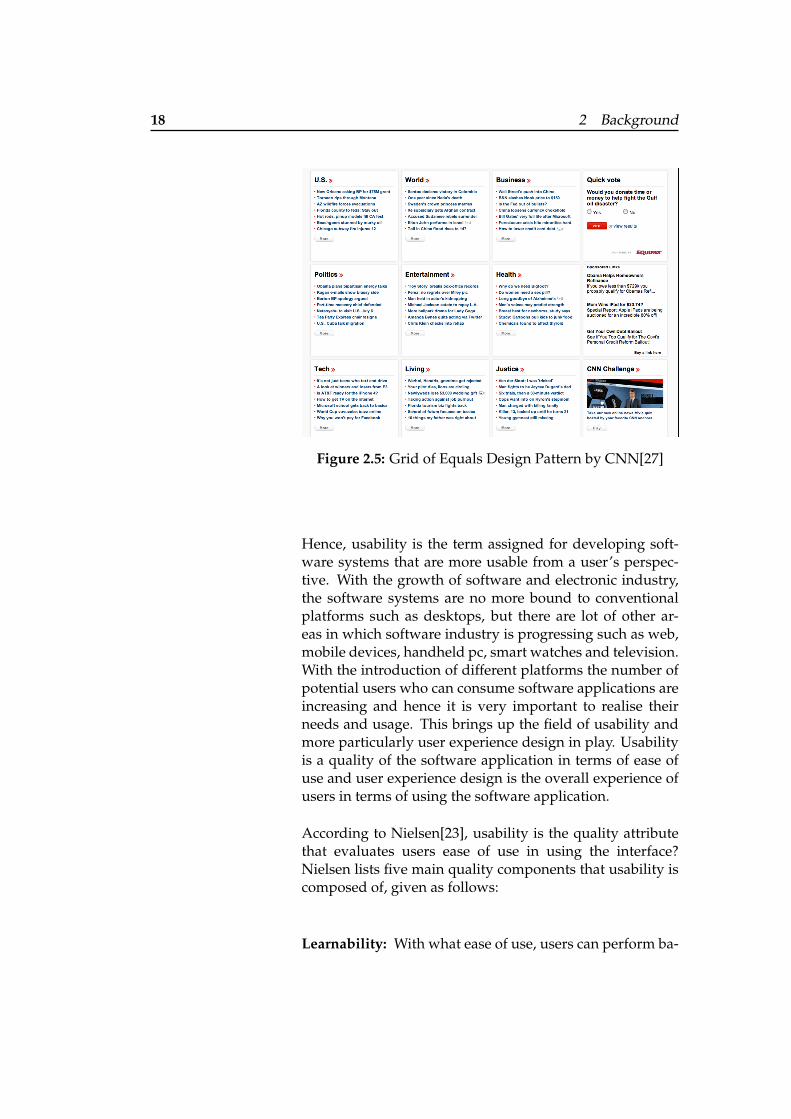
Examples: Hulu uses the grid of equals design pattern dis-playing the TV Shows and their basic information asshown in the Figure 2.4. CNN arranges the news us-ing grid of equals design pattern as shown in the Fig-ure 2.5.
Figure 2.4: Grid of Equals Design Pattern by Hulu[28]
2.6 Usability and User Experience and De-sign
A topic that is quite correlated with HCI is the Usability. Pay attention to whatusers do, not whatthey say. — JakobNielsen
Usability of software systems is important in order to re-alise their impact on HCI. One of the most well known def-initions of usability is given by the International Organisa-tion for Standardisation as following:
USABILITY:The extent to which a product can be used by specifiedusers to achieve goals with effectiveness, efficiency andsatisfaction in a specified context of use. - ISO 9241-11
Definition:Usability
18 2 Background
Figure 2.5: Grid of Equals Design Pattern by CNN[27]
Hence, usability is the term assigned for developing soft-ware systems that are more usable from a user’s perspec-tive. With the growth of software and electronic industry,the software systems are no more bound to conventionalplatforms such as desktops, but there are lot of other ar-eas in which software industry is progressing such as web,mobile devices, handheld pc, smart watches and television.With the introduction of different platforms the number ofpotential users who can consume software applications areincreasing and hence it is very important to realise theirneeds and usage. This brings up the field of usability andmore particularly user experience design in play. Usabilityis a quality of the software application in terms of ease ofuse and user experience design is the overall experience ofusers in terms of using the software application.
According to Nielsen[23], usability is the quality attributethat evaluates users ease of use in using the interface?Nielsen lists five main quality components that usability iscomposed of, given as follows:
Learnability: With what ease of use, users can perform ba-
2.6 Usability and User Experience and Design 19
sic tasks of the application, the first time they use it?
Efficiency: After learning the design of the applicationhow rapidly can users perform the tasks?
Memorability: How easy it is to remember the procedureof performing certain tasks, when a user returns to anapplication after a period of time?
Errors: How many errors users commit while performingthe task, are those errors critical and is it easy for usersto recover from those errors?
Satisfaction: How smooth and satisfactory it is to use thedesign?
Usability is one of the layers that user experience design de-pends on. It’s common for people to mix up the terms us-ability and user experience but these are different. Usabilityis the process of making the software application more us-able for the users and minimising the steps in which userscan achieve certain tasks whereas user experience on theother hand is making the journey of users in using softwaresytems pleasant and emotionally strong.
2.6.1 Focus Groups
Focus groups are important in order to correctly identifythe users of the system under development. It is very im-portant to target the right users in order to develop the soft-ware according to the needs of the users who would be us-ing the software. Though, the interface would be intended A common mistake
that people makewhen trying to designsomethingcompletely foolproofis to underestimatethe ingenuity ofcomplete fools. –Douglas Adams
for a large number of users but in a user study it is possi-ble to involve few users and test it on only limited numberof users. Therefore, the focus groups should be preciselydefined and they should represent the user groups that arepivotal and possibly most frequent users of the system.
According to Nielsen and Landauer [16] five users can al-most find the 75 percent of the problems. The study ofNielsen and Landauer shows that three experts or five usersare enough for finding most of the problems. The study
20 2 Background
conducted by Nielsen and Landauer is valid for the usersfrom the same group and if there are more user groups,from each user group five users can be used to find the 75percent of the problems.
2.6.2 Usability Evaluation
This section will present the usability metrics used whileconducting a usability study and will present few differenttypes of usability evaluation methods.
Usability Metrics
Usability metrics in usability evaluation study are used torealise the results of the usability study. Usability metricsreveal the insights about the usability of a particular sys-tem. Usability metrics can be divided into two major cate-gories which are discussed as following:
Objective or Quantitative Metrics Objective metrics areused to collect the data concerning the performance mea-surements while testing the users. Examples of quantitativemetric:
• Time to complete the task
• Errors committed while performing a task
• Number of tasks successfully completed
• Number of repeating mistakes
Subjective or Qualitative Metrics Subjective metrics statethe satisfaction of users while using the graphical user in-terface of the system. Examples of the qualitative metric:
• Post task questionnaire
• Instructor notes
• Thinking aloud
2.6 Usability and User Experience and Design 21
Usability Evaluation Methods
There are number of usability evaluation methods but wecan divide them into two general categories. The usabil- It doesn’t matter how
many times I have toclick, as long as eachclick is a mindless,unambiguous choice.- Steve Krug
ity evaluation methods that requires the user interface tobe tested on actual users or the ones without the actualusers[20]. Both of the techniques can be further classifiedinto number of techniques which are discussed as follows:
Usability Evaluation Methods without Users Usabilityevaluation methods without users are discussed below:
Literature Review: It is a very handy approach and itsaves time and money. It involves studying litera-ture that has been already published. It gives in-sights over particular interfaces, design patterns anduser behaviour. This could be helpful if the usersof the system and their expertise are similar to yourstudy. This is usually a good starting point to getan overview of what has already been studied andwhere their is room to experiment more?
Heuristic Evaluation: Usability experts critically analysethe interface based on the heuristics developedby usability professionals for example Nielsen andNorman[8]. This is quick and easy way to fix issuesthat are obvious.
Model-Based Evaluation: It is the least commonly usedusability evaluation method. It provides a frameworkto evaluate user interfaces. GOMS[24] is one suchmodel used to evaluate task completion time basedon cognitive psychology framework. It can be per-formed on interface specification but the disadvan-tage is it has limited task applicability.
Cognitive Walkthrough: It is used to evaluate the learn-ability of the system for new or infrequent users.In cognitive walkthrough one or more evaluators gothrough different tasks from the perspective of theuser and try to ask different questions. It is helpfulas it provides detailed analysis of the system but atthe same time it has a disadvantage that it is quitesubjective.
22 2 Background
Usability Evaluation Methods with Users Usability eval-uation methods with users are discussed below:
Silent Observation: It is used to evaluate the interface bysilently observing the user performing a task. Obser-vation is done by evaluators. There is no communica-tion between the evaluator and user in this method.This method is very good to understand the normalflow of the user without intriguing him in other ac-tivities. The problem with this method is that if theuser gets stuck somewhere it’s quite frustrating forhim and he may perform the rest of the tasks with abiased behaviour.
Think Aloud: In this method the user is asked to thinkaloud while performing the task. In this way eval-uators can analyse the mental model of the user. Italso helps to record the actual experience of the user.It is the most commonly used usability evaluationmethodology. A disadvantage of this methodologyis that user might not feel comfortable talking aloudwhile performing tasks. Therefore, it is important tomake user comfortable with the environment beforeperforming the task.
Question Asking: It is based on think aloud method. Italso allows evaluators to ask questions while theusers perform tasks. It is much more interactivemethodology and helps gain more insights of theproblems the user face while performing certain tasksand why do they face those problems? A disadvan-tage of such usability evaluation methodology is thatit could divert the user focus from the actual task. An-other disadvantage of this methodology is that theuser will pay more attention to those aspects of thesystem that he is asked questions about.
Retrospective Testing: In this method user are silentlyobserved and recorded while performing the tasks.After the completion of test users are asked to ex-plain their decisions and behaviour while viewing thevideo. The advantage of such testing is that it helpsto get user suggestions while the disadvantage is that
2.7 User Centered Design 23
it is very time consuming methodology. Another dis-advantage is that user could have forgotten their be-haviour at the time of performing the task, while re-viewing the video.
2.7 User Centered Design
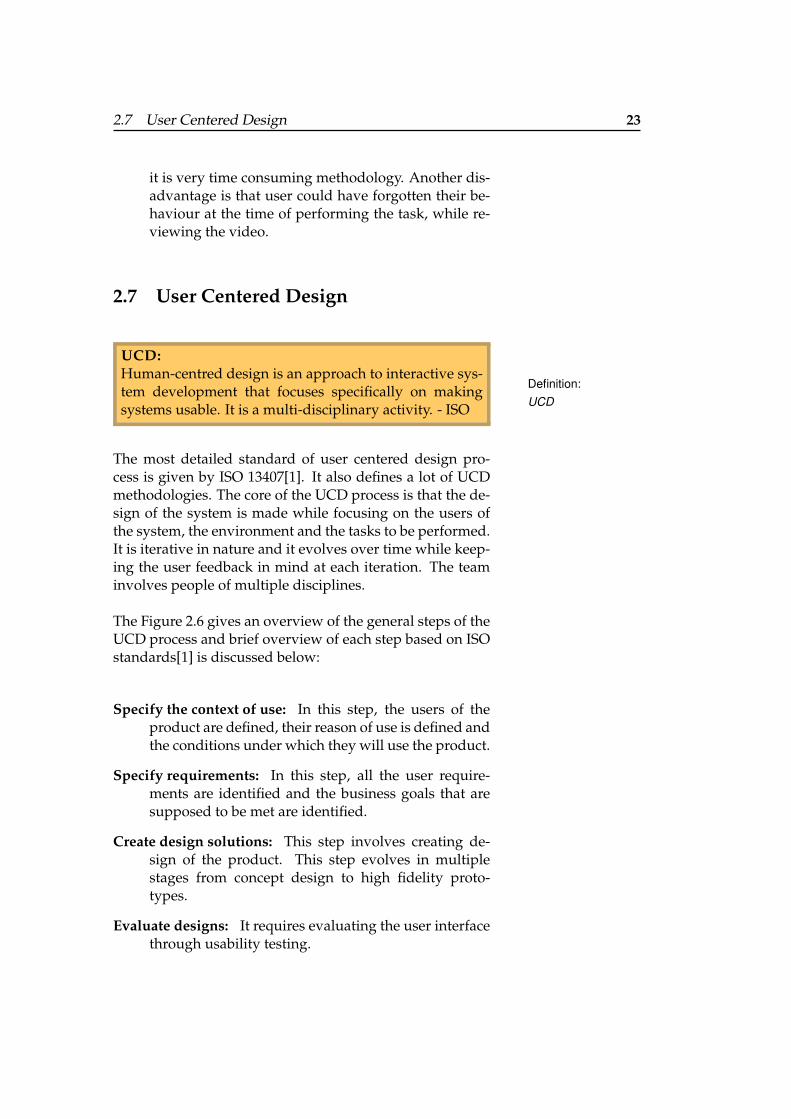
UCD:Human-centred design is an approach to interactive sys-tem development that focuses specifically on makingsystems usable. It is a multi-disciplinary activity. - ISO
Definition:UCD
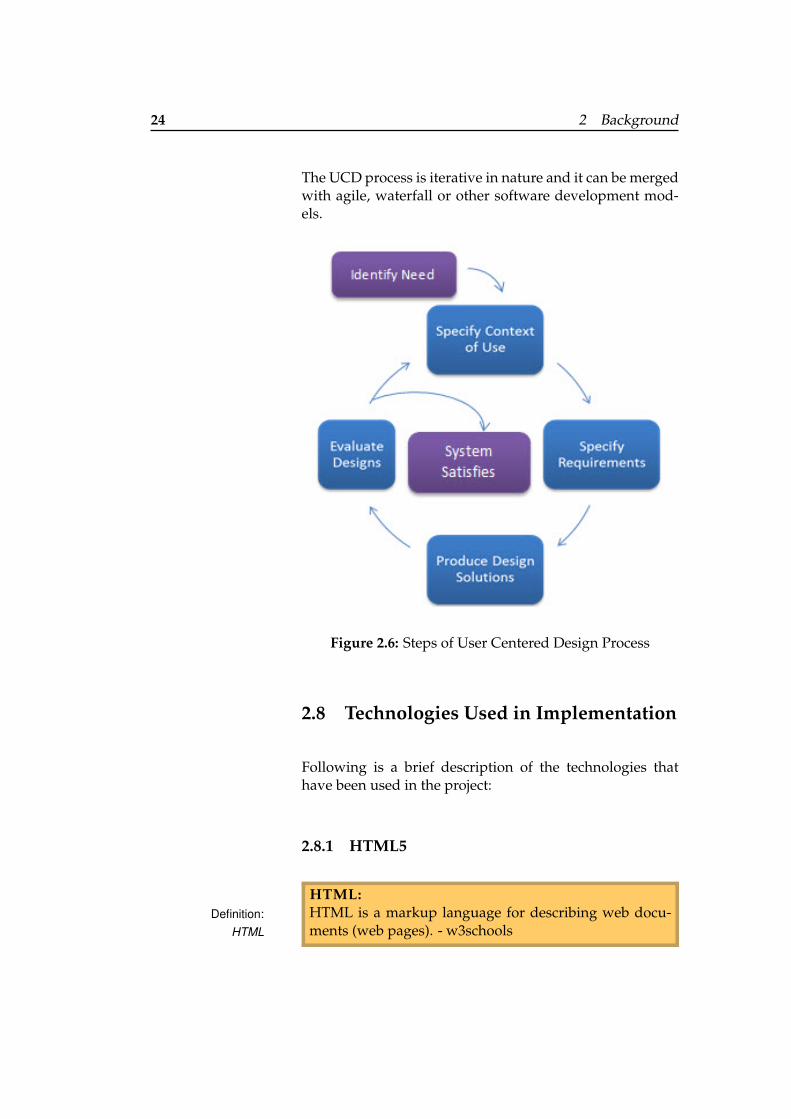
The most detailed standard of user centered design pro-cess is given by ISO 13407[1]. It also defines a lot of UCDmethodologies. The core of the UCD process is that the de-sign of the system is made while focusing on the users ofthe system, the environment and the tasks to be performed.It is iterative in nature and it evolves over time while keep-ing the user feedback in mind at each iteration. The teaminvolves people of multiple disciplines.
The Figure 2.6 gives an overview of the general steps of theUCD process and brief overview of each step based on ISOstandards[1] is discussed below:
Specify the context of use: In this step, the users of theproduct are defined, their reason of use is defined andthe conditions under which they will use the product.
Specify requirements: In this step, all the user require-ments are identified and the business goals that aresupposed to be met are identified.
Create design solutions: This step involves creating de-sign of the product. This step evolves in multiplestages from concept design to high fidelity proto-types.
Evaluate designs: It requires evaluating the user interfacethrough usability testing.
24 2 Background
The UCD process is iterative in nature and it can be mergedwith agile, waterfall or other software development mod-els.
Figure 2.6: Steps of User Centered Design Process
2.8 Technologies Used in Implementation
Following is a brief description of the technologies thathave been used in the project:
2.8.1 HTML5
HTML:HTML is a markup language for describing web docu-ments (web pages). - w3schools
Definition:HTML
2.8 Technologies Used in Implementation 25
HTML5 is a hypertext markup language. HTML5 is mainlyused for designing web interfaces. HTML5 was first intro-duced as HTML and was used to describe scientific doc-uments semantically. Later it became the most popularmarkup language of the World Wide Web and hence it isused widely among the consumers of the web to displaytheir content. Today, HTML5 provides easy syntax for cod- HTML5 comes up
with advancedfeatures such ascanvas, geolocationand animation.
ing the web interface and hence used by everyone to codetheir application from designers to ordinary bloggers andfrom small scale application to the large scale businessessuch as Facebook. HTML5 provides simple interface ele-ments such as buttons, input fields and complex elementssuch as canvas for drawing vector graphics. Therefore,HTML5 is the standard today for designing web applica-tions.
2.8.2 CSS3
CSS:CSS is a language that describes the style of an HTMLdocument. CSS describes how HTML elements shouldbe displayed. - w3schools
Definition:CSS
Cascading Style Sheets commonly referred to as CSS3 isthe standard file format for enhancing and styling the ba-sic HTML5 elements. CSS3 is used to stylize the elementsof HTML5 such as buttons so that they appear more attrac-tive visually, align and position according to presentationrequired. CSS3 can be used in two ways such as an in-line styling or as classes in an external file. Inline styles aremostly used for styling elements that are not used repeti-tively across the application whereas, external CSS classesare quite common when one needs to set theme for thewhole application. CSS3 classes helps to set a theme acrossthe application in minimal amount of code. CSS3 classesare also very important as they help to set brand identityof the application. Today, CSS3 is powered with complexstyling of HTM5 elements such as animation.
26 2 Background
2.8.3 Materializecss
MATERIAL DESIGN:Material Design is a design language that combines theclassic principles of successful design along with innova-tion and technology. Google’s goal is to develop a systemof design that allows for a unified user experience acrossall their products on any platform. - Google
Definition:Material Design
Material design is a design methodology introduced byGoogle. The main goal behind the material design is toprovide a unified design experience across their products,while keeping in mind the principles of good design andusing cutting edge technology. The following three princi-ples are the key principles of material design:
Material is the metaphor This principle is based on theidea of paper and ink as a metaphor. Hence, the ma-terial design associates everything with real world el-ement and gives fine definition to borders and edgesgiving it a feel of real element.
Bold, graphic, intentional This principle again takes itsroute from print based design.The elements of printbased design typography, color and grids should notonly please the eyes of the user but they should alsodefine the content hierarchy and visual guide throughtheir presentation.
Motion provides meaning As users map everything towhat they see in the real world, motion gives themsuch a feel. Hence, making the design more feedbackintensive and familiar user experience could enhance.
Materializecss is a css framework based on the principles ofgoogle’s material design. Materializecss provides severalfeatures such as components, themes and scripting. It iseasy to use and integrate in the web application.
2.8 Technologies Used in Implementation 27
2.8.4 Javascript
JAVASCRIPT:Javascript is the programming language of HTML andthe Web. - w3schools
Definition:Javascript
Javascript is the programming language for the Web. Javascript is the fifthmost popularlanguage of theworld.
Javascript is widely used and is one of the most famousprogramming language of the world. Javascript can bewritten within the HTML5 pages or could be written inexternal files with a file format type javascript. The mainuse of javascript is that it is widely used to manipulateHTML5 elements. Javascript could also be used to manip-ulate HTML5 elements in real time and sending server re-quests. Javascript is also used to validate forms. Today,Javascript has grown a lot, it is being used from frontendto backend. Another advantage of Javascript is that as itis a scripting language it is very fast. As Javascript couldrun on any machine and has no dependencies it has a lot ofopen source code base.
2.8.5 jQuery [26]
JQUERY:jQuery is a JavaScript Library. jQuery greatly simplifiesJavaScript programming. - w3schools
Definition:jQuery
jQuery steps is jQuery based plug-in. It is not very welldocumented for now but is quite powerful for generatingstepwise forms. It could be customised according to theuser needs and also has a support for styling the form. Ithas a form validator plugin included too but that is not welldocumented for now on the site and has several bugs. Theplugin could be downloaded from their online site 14.
14http://www.jquery-steps.com
28 2 Background
2.8.6 XML
XML:XML stands for EXtensible Markup Language. XML wasdesigned to store and transport data. XML was designedto be both human- and machine-readable. - w3schools
Definition:XML
Extensible markup language is widely known as XML.XML was introduced to provide a solution for electronicpublishing. XML takes a tag based approach. XML iswidely used today for publishing electronic contents suchas scientific papers or blog feeds. XML also plays an im-portant role in exchanging the data across multiple webapplications. XML is generally written using a code editorand today almost every programming language provideslibrary to write XML content through programming.
2.8.7 PHP
PHP:PHP is a server scripting language, and a powerfultool for making dynamic and interactive Web pages. -w3schools
Definition:PHP
PHP originally known as personal home page, and todayas hypertext preprocessor is scripting language that is com-monly used for web development. PHP has all the basiclanguage features such as looping and classes. PHP can beused to retrieve data from the database and display it at thefront end. PHP is powerful and easy to learn language. To-day, lots of web applications from personal blogs to largescale business are using PHP to code their applications.
29
Chapter 3
Related Work
“It’s not good enough to just keep producingtechnology with no notion of whether it’s goingto be useful. You have to create stuff that peoplereally want, rather than create stuff just becauseyou can.” – Genevieve Bell, head of Intel’s USAUser Experience Group
The main aim of the thesis is to improve the usability ofCEUR Make and to come up with the design and imple-mentation of a more usable system. Therefore, in order todevelop something more usable and impactful, it is impor-tant to know the related software systems and on going re-search. Hence, in this chapter we present related softwaresystems and ongoing research, on the usability aspects ofthe related systems.
3.1 Related Workflows and Software Sys-tems
In this section we will discuss the softwares that are relatedto our system and workflows for publishing proceedings.First, we will give an overview of the large scale proceed-ings workflow that requires professional third party sys-tems in order to publish their proceedings. Then, we will
30 3 Related Work
discuss middle budget and virtual proceedings which canuse third party systems, but normally due to lack of fundsor because of their open access or virtual nature they followa different track. At the end of this section we will presenta professional web application called EasyChair, that helpsdifferent conference and workshop organisers to automatetheir tasks and also to support in publishing proceedings.
3.1.1 Proceedings for Large Scale Conferences andWorkshops
Large conference and workshop organising bodies likeACM held more than170 events in 2016under their banner
and IEEE publishesaround 1,400
conferenceproceedings every
year.
ACM and IEEE use highly professional software systemto publish the proceedings. This is important as theyhave high number of participants and it is often a complextask to manage the conferences and workshops. Usually,such conference and workshop organising bodies have alot of conferences and workshops under their name. Bothof these organising bodies, organise more than hundredevents each year. Hence, they have proceedings chair orprogram chair associated to their conferences and work-shops, who are responsible to produce proceedings coupleof weeks prior to a conference or workshop. In the follow-ing section, we give an overview of how the proceedingsare published at large scale conferences?
Proceedings Workflow for Large Scale Conferences andWorkshops
This section will present workflow for large scale con-ferences and workshops and in the next section we willpresent the workflow for small scale conferences and work-shops. The workflow categorization is based on the expe-rience of two researchers who have been involved in theorganisation of several computer science conferences andworkshops. The categorization is also based on my expe-rience as a proceedings chair of Computer Science Con-ference for University of Bonn Students(CSCUBS) and mydiscussion with the proceedings chair of ESWC 2016. Pro-gram chair or proceedings chair are normally responsible
3.1 Related Workflows and Software Systems 31
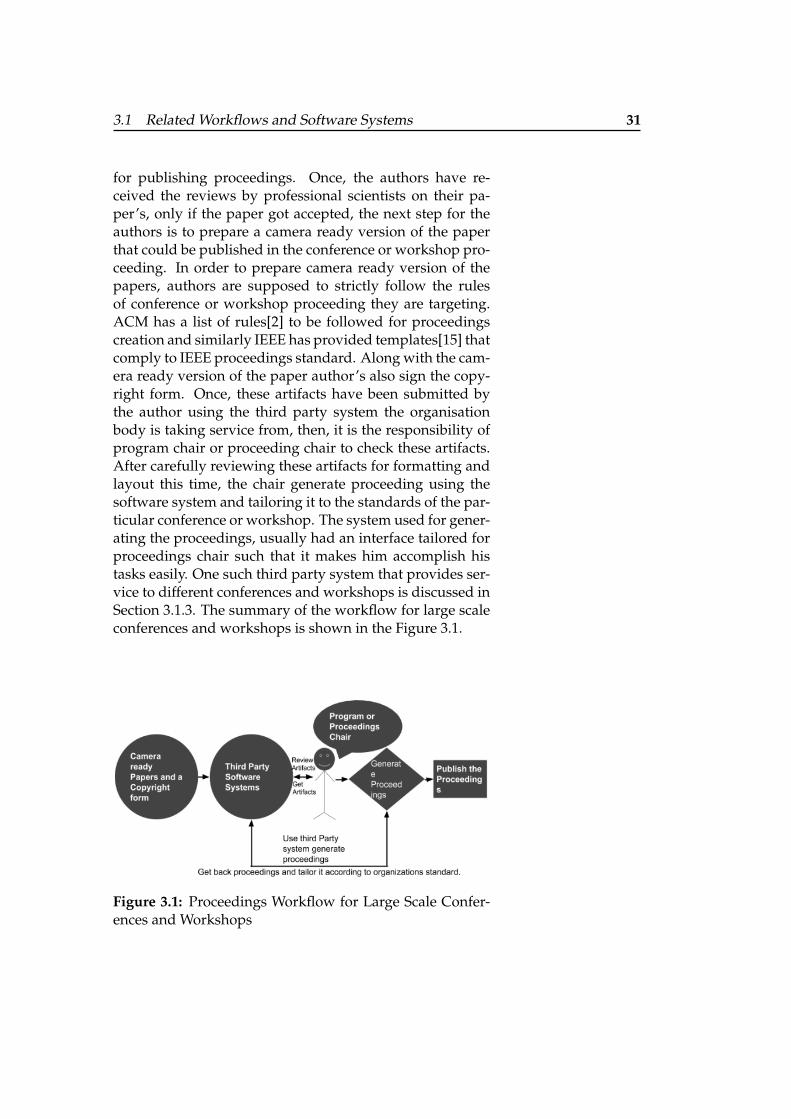
for publishing proceedings. Once, the authors have re-ceived the reviews by professional scientists on their pa-per’s, only if the paper got accepted, the next step for theauthors is to prepare a camera ready version of the paperthat could be published in the conference or workshop pro-ceeding. In order to prepare camera ready version of thepapers, authors are supposed to strictly follow the rulesof conference or workshop proceeding they are targeting.ACM has a list of rules[2] to be followed for proceedingscreation and similarly IEEE has provided templates[15] thatcomply to IEEE proceedings standard. Along with the cam-era ready version of the paper author’s also sign the copy-right form. Once, these artifacts have been submitted bythe author using the third party system the organisationbody is taking service from, then, it is the responsibility ofprogram chair or proceeding chair to check these artifacts.After carefully reviewing these artifacts for formatting andlayout this time, the chair generate proceeding using thesoftware system and tailoring it to the standards of the par-ticular conference or workshop. The system used for gener-ating the proceedings, usually had an interface tailored forproceedings chair such that it makes him accomplish histasks easily. One such third party system that provides ser-vice to different conferences and workshops is discussed inSection 3.1.3. The summary of the workflow for large scaleconferences and workshops is shown in the Figure 3.1.
Figure 3.1: Proceedings Workflow for Large Scale Confer-ences and Workshops
32 3 Related Work
3.1.2 Proceedings for Small Scale and Virtual Con-ferences and Workshops
Small scale and virtual conference (conferences organisedGlobal VirtualConference[6] has till
now published fourvolumes of
proceeding, startingfrom year 2013 to
2016. It is managedby publishing society,
Slovakia.
over web etc.) and workshop’s proceeding structure is dif-ferent than the large scale conference and workshop struc-ture. Small Scale conferences and workshops usually havelow budget to take service of professional software. There-fore most of the time they are following standards inspiredby different organisations and perform tasks manually oruse open source software systems such as CEUR Make toautomate their task of publishing proceedings. Likewise,virtual conferences and workshops are also not high bud-geted ones and they have to follow the similar approach.Two such examples of a conference and workshops virtualproceeding are Global Virtual Conference [6] and CEURWorkshop proceedings [3]. Global Virtual Conference is anonline conference service for scientists to present their con-tributions. The proceedings of the virtual conference aremade available online. CEUR Workshop proceedings as ex-plained previously in the Section 2.2, is an open access pro-ceeding publishing platform. In the following section, wewill discuss in general the workflow of such conferencesand workshops.
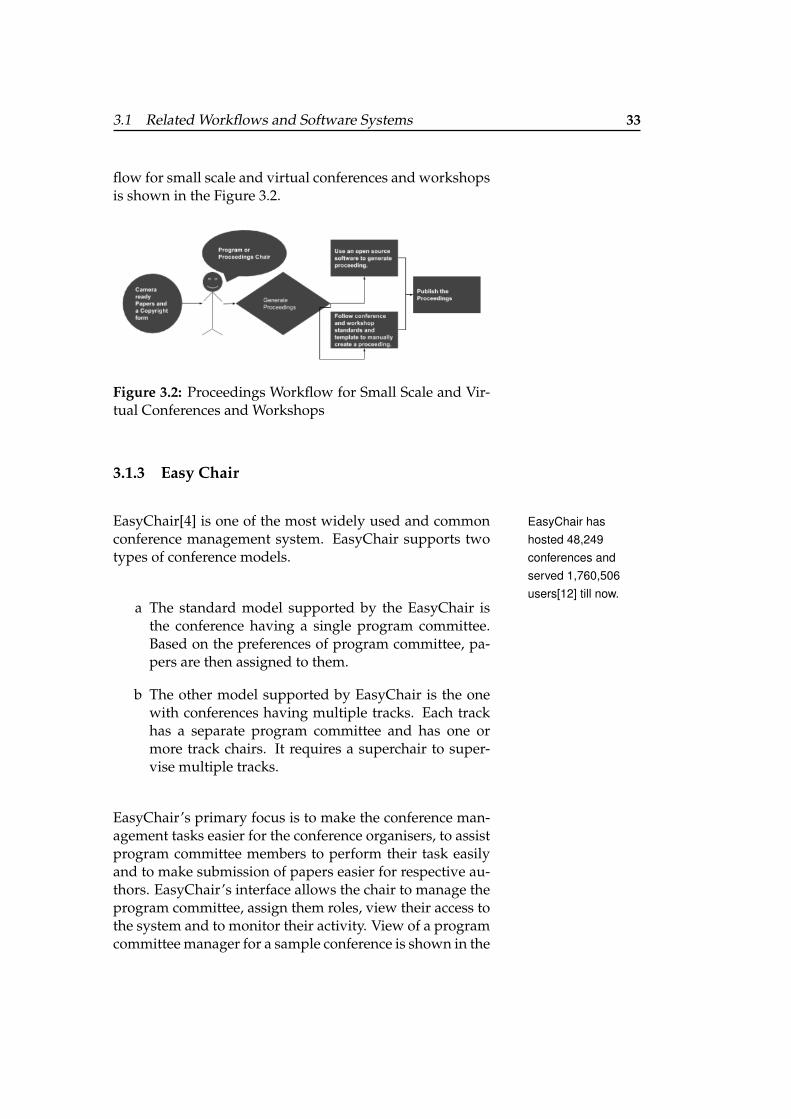
Proceedings Workflow for Small Scale and Virtual Con-ferences and Workshops
Proceedings workflow for small scale and virtual confer-ences and workshops is a bit different from workflow forlarge scale conferences and workshops. Proceedings forsuch conferences and workshops are generated and pub-lished by a program chair or proceedings chair. Program orproceedings chair use open source software or use manuallabour in order to collect artifacts from the authors. Usually,the artifacts consist of camera ready papers and copyrightform. Once, the artifacts are submitted, the program or pro-ceeding chair either uses the open source software systemto generate proceedings or create the proceeding manuallybased on the format followed by the organisation in creat-ing previous year’s proceeding.The summary of the work-
3.1 Related Workflows and Software Systems 33
flow for small scale and virtual conferences and workshopsis shown in the Figure 3.2.
Figure 3.2: Proceedings Workflow for Small Scale and Vir-tual Conferences and Workshops
3.1.3 Easy Chair
EasyChair[4] is one of the most widely used and common EasyChair hashosted 48,249conferences andserved 1,760,506users[12] till now.
conference management system. EasyChair supports twotypes of conference models.
a The standard model supported by the EasyChair isthe conference having a single program committee.Based on the preferences of program committee, pa-pers are then assigned to them.
b The other model supported by EasyChair is the onewith conferences having multiple tracks. Each trackhas a separate program committee and has one ormore track chairs. It requires a superchair to super-vise multiple tracks.
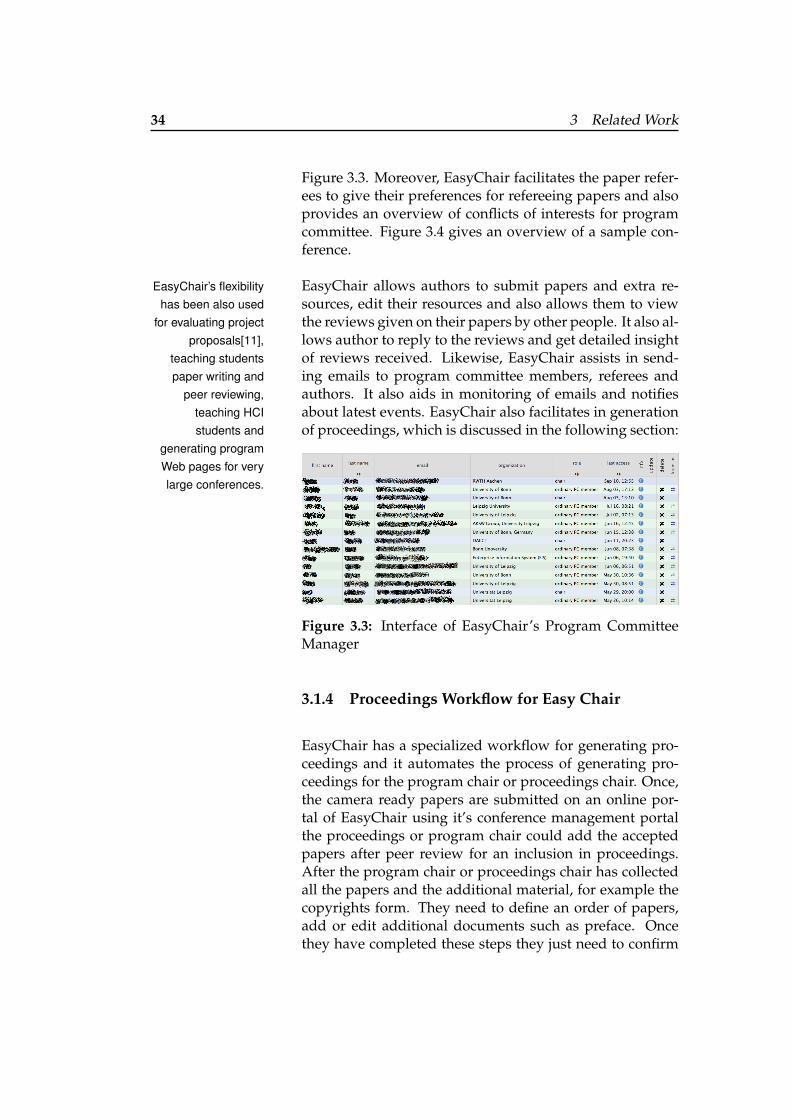
EasyChair’s primary focus is to make the conference man-agement tasks easier for the conference organisers, to assistprogram committee members to perform their task easilyand to make submission of papers easier for respective au-thors. EasyChair’s interface allows the chair to manage theprogram committee, assign them roles, view their access tothe system and to monitor their activity. View of a programcommittee manager for a sample conference is shown in the
34 3 Related Work
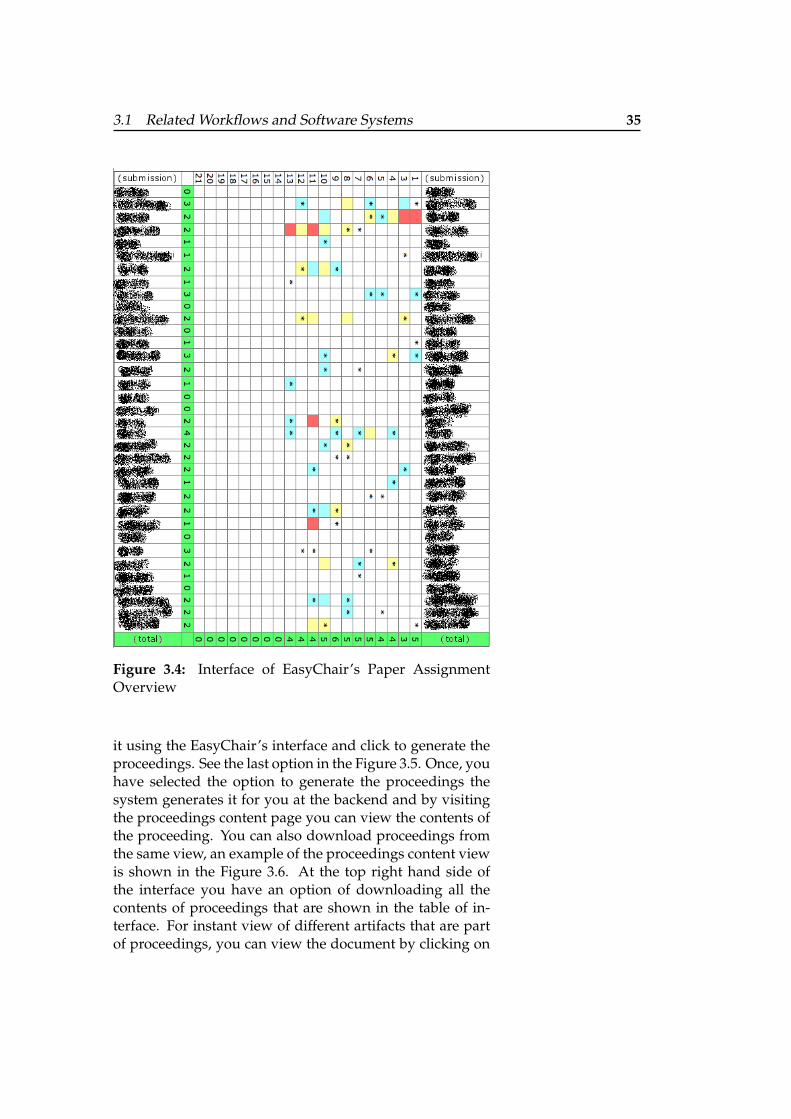
Figure 3.3. Moreover, EasyChair facilitates the paper refer-ees to give their preferences for refereeing papers and alsoprovides an overview of conflicts of interests for programcommittee. Figure 3.4 gives an overview of a sample con-ference.
EasyChair allows authors to submit papers and extra re-EasyChair’s flexibilityhas been also used
for evaluating projectproposals[11],
teaching studentspaper writing and
peer reviewing,teaching HCIstudents and
generating programWeb pages for verylarge conferences.
sources, edit their resources and also allows them to viewthe reviews given on their papers by other people. It also al-lows author to reply to the reviews and get detailed insightof reviews received. Likewise, EasyChair assists in send-ing emails to program committee members, referees andauthors. It also aids in monitoring of emails and notifiesabout latest events. EasyChair also facilitates in generationof proceedings, which is discussed in the following section:
Figure 3.3: Interface of EasyChair’s Program CommitteeManager
3.1.4 Proceedings Workflow for Easy Chair
EasyChair has a specialized workflow for generating pro-ceedings and it automates the process of generating pro-ceedings for the program chair or proceedings chair. Once,the camera ready papers are submitted on an online por-tal of EasyChair using it’s conference management portalthe proceedings or program chair could add the acceptedpapers after peer review for an inclusion in proceedings.After the program chair or proceedings chair has collectedall the papers and the additional material, for example thecopyrights form. They need to define an order of papers,add or edit additional documents such as preface. Oncethey have completed these steps they just need to confirm
3.1 Related Workflows and Software Systems 35
Figure 3.4: Interface of EasyChair’s Paper AssignmentOverview
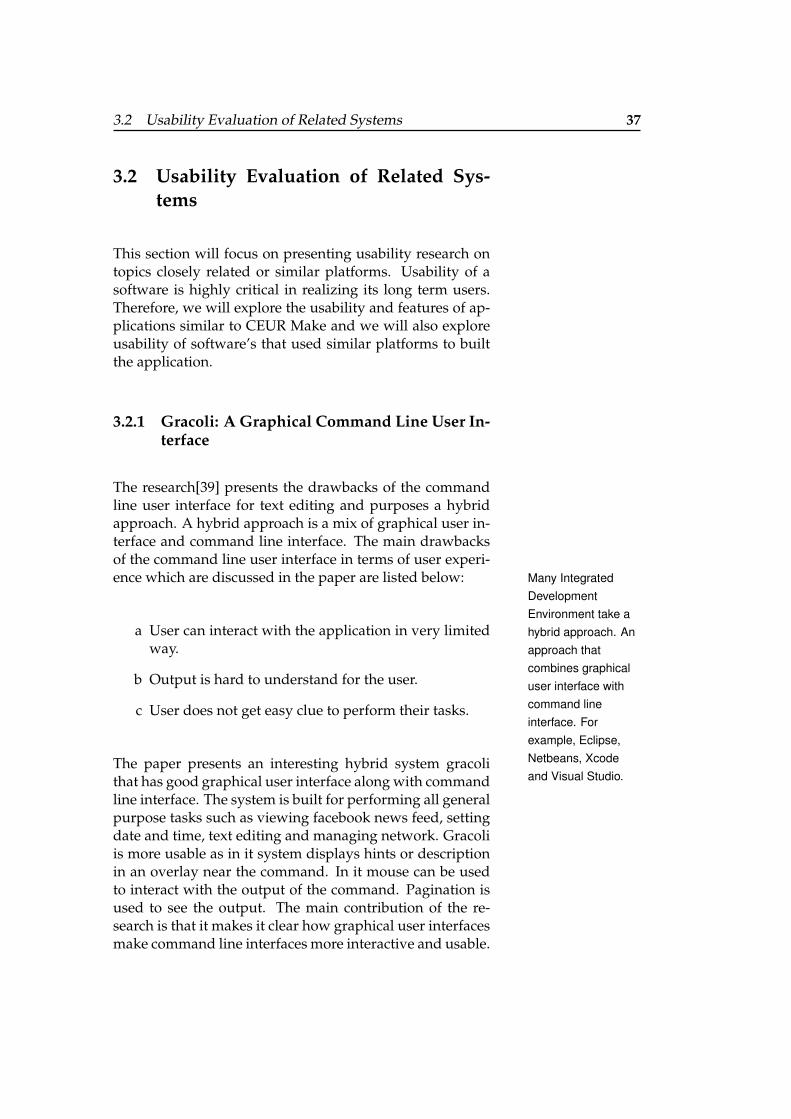
it using the EasyChair’s interface and click to generate theproceedings. See the last option in the Figure 3.5. Once, youhave selected the option to generate the proceedings thesystem generates it for you at the backend and by visitingthe proceedings content page you can view the contents ofthe proceeding. You can also download proceedings fromthe same view, an example of the proceedings content viewis shown in the Figure 3.6. At the top right hand side ofthe interface you have an option of downloading all thecontents of proceedings that are shown in the table of in-terface. For instant view of different artifacts that are partof proceedings, you can view the document by clicking on
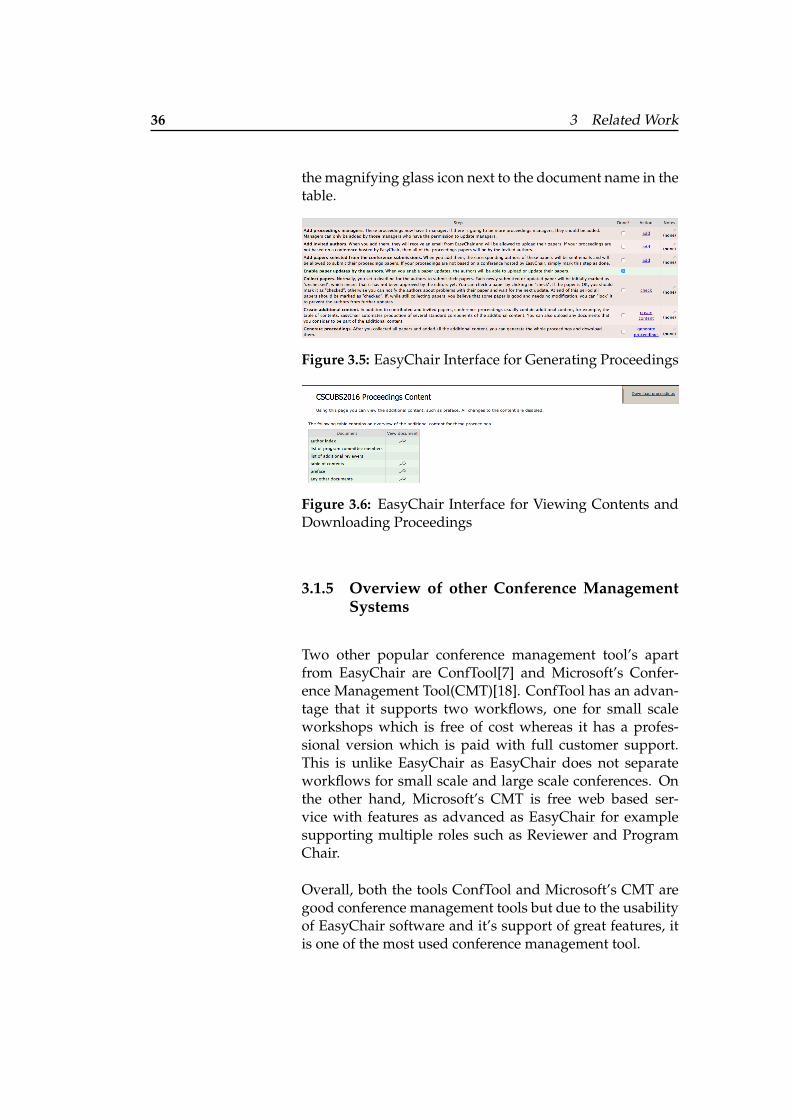
36 3 Related Work
the magnifying glass icon next to the document name in thetable.
Figure 3.5: EasyChair Interface for Generating Proceedings
Figure 3.6: EasyChair Interface for Viewing Contents andDownloading Proceedings
3.1.5 Overview of other Conference ManagementSystems
Two other popular conference management tool’s apartfrom EasyChair are ConfTool[7] and Microsoft’s Confer-ence Management Tool(CMT)[18]. ConfTool has an advan-tage that it supports two workflows, one for small scaleworkshops which is free of cost whereas it has a profes-sional version which is paid with full customer support.This is unlike EasyChair as EasyChair does not separateworkflows for small scale and large scale conferences. Onthe other hand, Microsoft’s CMT is free web based ser-vice with features as advanced as EasyChair for examplesupporting multiple roles such as Reviewer and ProgramChair.
Overall, both the tools ConfTool and Microsoft’s CMT aregood conference management tools but due to the usabilityof EasyChair software and it’s support of great features, itis one of the most used conference management tool.
3.2 Usability Evaluation of Related Systems 37
3.2 Usability Evaluation of Related Sys-tems
This section will focus on presenting usability research ontopics closely related or similar platforms. Usability of asoftware is highly critical in realizing its long term users.Therefore, we will explore the usability and features of ap-plications similar to CEUR Make and we will also exploreusability of software’s that used similar platforms to builtthe application.
3.2.1 Gracoli: A Graphical Command Line User In-terface
The research[39] presents the drawbacks of the commandline user interface for text editing and purposes a hybridapproach. A hybrid approach is a mix of graphical user in-terface and command line interface. The main drawbacksof the command line user interface in terms of user experi-ence which are discussed in the paper are listed below: Many Integrated
DevelopmentEnvironment take ahybrid approach. Anapproach thatcombines graphicaluser interface withcommand lineinterface. Forexample, Eclipse,Netbeans, Xcodeand Visual Studio.
a User can interact with the application in very limitedway.
b Output is hard to understand for the user.
c User does not get easy clue to perform their tasks.
The paper presents an interesting hybrid system gracolithat has good graphical user interface along with commandline interface. The system is built for performing all generalpurpose tasks such as viewing facebook news feed, settingdate and time, text editing and managing network. Gracoliis more usable as in it system displays hints or descriptionin an overlay near the command. In it mouse can be usedto interact with the output of the command. Pagination isused to see the output. The main contribution of the re-search is that it makes it clear how graphical user interfacesmake command line interfaces more interactive and usable.
38 3 Related Work
3.2.2 Student preferences toward microcomputeruser interfaces
In this paper[25] author tries to figure out the problem withApple laid thefoundation of
graphical userinterfaces by
introducing desktopand icons inMacintosh.
command line user interfaces and compare it to graphicaluser interfaces. The author points that users from educa-tional field requires time to learn command line interfacesand perform tasks using it. Whereas, on the other side au-thor tries to reflect the usability of graphical user interfaces.The author presents the fact that with the introduction ofMac OS and Windows, the user’s interaction have becomemuch more interactive and easy.
In order to discover the difference of both, author conductsa study on technical writing course. Some students wereasked to do a technical writing assignment using graphicalword processor and other using command line word pro-cessor. The background knowledge of the users was almostsame.The highlights of the result are listed below:
a 72 percent of people were comfortable using graphi-cal user interfaces within two weeks while 48 percentof people were comfortable using it in two to fourweeks.
b Performance of performing tasks on graphical userinterfaces was slightly higher than that of doing taskson command line user interface. Command line in-terfaces correspond to higher task performance rateswhen users have learned to used the system but asusers of our system does not need to use the system sofrequent so learning can be an overhead. We will dis-cuss more about task performance rates for our sys-tem in Chapter 4 and Chapter 6.
c User attitude towards both the interface was alsoanalysed. For command line interfaces users said thatit has a huge learning curve, windows based word fa-cility is better, it is not much interactive and has onlyone font type. For the graphical user interfaces usersmentioned that it is easy to use, it is self explanatory,layout is logical and manual was confusing at someplaces.

3.2 Usability Evaluation of Related Systems 39
Hence, the study concludes that graphical user interfacesare much more easier to use than command line interfacesand they have low learning curve. It also mentions that ifthe interface is user friendly, users would like to use it morefrequently for performing their tasks.
40
Chapter 4
Usability EvaluationMethodology and CEURMake UsabilityEvaluation
"If you don’t talk to your customers, how willyou know how to talk to your customers?" –Will Evans
This chapter is divided into two sections. First part of thischapter layouts general strategy for conducting usabilitytest for the CEUR Make and CEUR Make Graphical userinterface. The second part of this chapter presents usabilityevaluation results for CEUR Make. Usability evaluation re-sults for CEUR Make graphical user interface are discussedin Chapter 6.
4.1 Evaluation Design and Setup
For the usability evaluation of CEUR Make and CEURMake graphical user interface, a mix of different usabilityevaluation methods were used from the one’s discussed in
4.1 Evaluation Design and Setup 41
Section 2.6.2. The usability evaluation for our systems is di-vided into two sections that are Think aloud and QuestionAsking Usability testing.
4.1.1 Participants
Total number of participants who participated in the usabil-ity test of CEUR Make and CEUR Make graphical user in-terface were 12. Users of the system were divided into twogroups. As, the publishers at CEUR Workshop Proceed-ings were virtually located around the world and it washard to meet all the users in person. Six of the users partici-pated in the Think Aloud Usability test design setup whichis conducted in person and the other six in Question Ask-ing usability test design setup which could be conductedvirtually.
Our focus group was researchers and scientists who wantto publish proceedings at CEUR Workshop Proceedings.As our users were globally located and it was hard to reachour target group we chose 9 participants with previousknowledge of publishing at CEUR Workshop Proceedings,but 3 participants without prior knowledge of publishing atCEUR Workshop Proceedings. The participants who werenot experienced in publishing at CEUR Workshop Proceed-ings were also from academia and had background in usingCEUR Workshop Proceedings site. These participants weregiven training to publish at CEUR Workshop Proceedingsso that we can balance our evaluation results.
We conducted two usability tests, one for CEUR Make andthe other for CEUR Make Graphical User Interface. The de-sign used to select the participants for each test is withinsubject design1. That means, for both the tests same par-ticipants participated, so that they have the same level ofknowledge. This was also used so that the comparisonof both the systems could be evaluated from each partici-pant’s perspective.
1http://www.statsmakemecry.com/smmctheblog/within-subject-and-between-subject-effects-wanting-ice-cream.html
42 4 Usability Evaluation Methodology and CEUR Make Usability Evaluation
4.1.2 Experiment Procedure
Usability test for both the systems were conducted sepa-rately on all user. Participants were given four tasks forboth the tests that were further divided into smaller sec-tions. The tasks were designed such that all the major usecases of the system could be tested. An example task isgiven as following:
Example: Task 4 - Search a Proceedings Volume
• Go to the proceedings page at ceur-ws.org
• Search the proceeding by the following name:
• Cultures of Participation in the Digital Age 2015
The experiment procedure could be further divided intotwo categories as two different usability testing techniqueswere used. Two techniques that were used are described asfollowing:
Think Aloud Design Setup
Number of participants who participated in the ThinkAloud Design setup were 6. For the Think Aloud experi-ment, participants were provided with task sheet for boththe systems as given in Appendix A and B. The partici-pants were then timed for their tasks and notes were takenfor the problems they faced or their unusual mental mod-els. The task completion time for each task was recorded sothat it could be used to make comparison analysis in boththe systems.
Question Asking Design Setup
Number of participants who participated in the QuestionAsking design setup were also 6. Evaluator performed thetasks that are provided in task sheet for both the systems as
4.1 Evaluation Design and Setup 43
given in Appendix A and B. The participants were allowedto ask questions during the interview and the notes of theinterview were made in parallel. It was interactive sessionand the participants were also allowed to use the system.The interview session was conducted through skype.
After the experiment in both the usability test setups, theparticipants were provided with post study questionnairethat are discussed in the next Section 4.1.3.
4.1.3 Usability Evaluation Questionaire
In order to evaluate user satisfaction and user experienceof the system, participants were asked to fill in two poststudy questionnaires and a demographics form. It was anelectronic survey and Google Form2 was used to create andconduct the survey. The post study questionnaire was di-vided into three sections System Usability Scale, Questionfor User Interaction Satisfaction and a questionnaire relatedto demographics. Each of the questionnaire and its impor-tance is discussed briefly below:
System Usability Scale
System Usability Scale(SUS)[33] was used to analyse the According to a studySUS gives bestresults for smallsample sizes.
general experience of users with the system. SUS is widelyused in industry for analysing the user satisfaction with thesystem. The advantages of SUS are that it is quick andcheap. It is also good with large sample sizes, such thatthe calculation is fairly simple even with large sample size.SUS consists of 10 questions. Users can rate each questionfrom a Likert scale ranged from 1 to 5. 1 stands for stronglyagree and 5 stands for strongly disagree.
In order to calculate the final results, there is a specific tech-nique. 1 needs to be subtracted from the user response of anodd question and for even question user response needs tobe subtracted from 5. In this manner all the user responses
2https://docs.google.com/forms
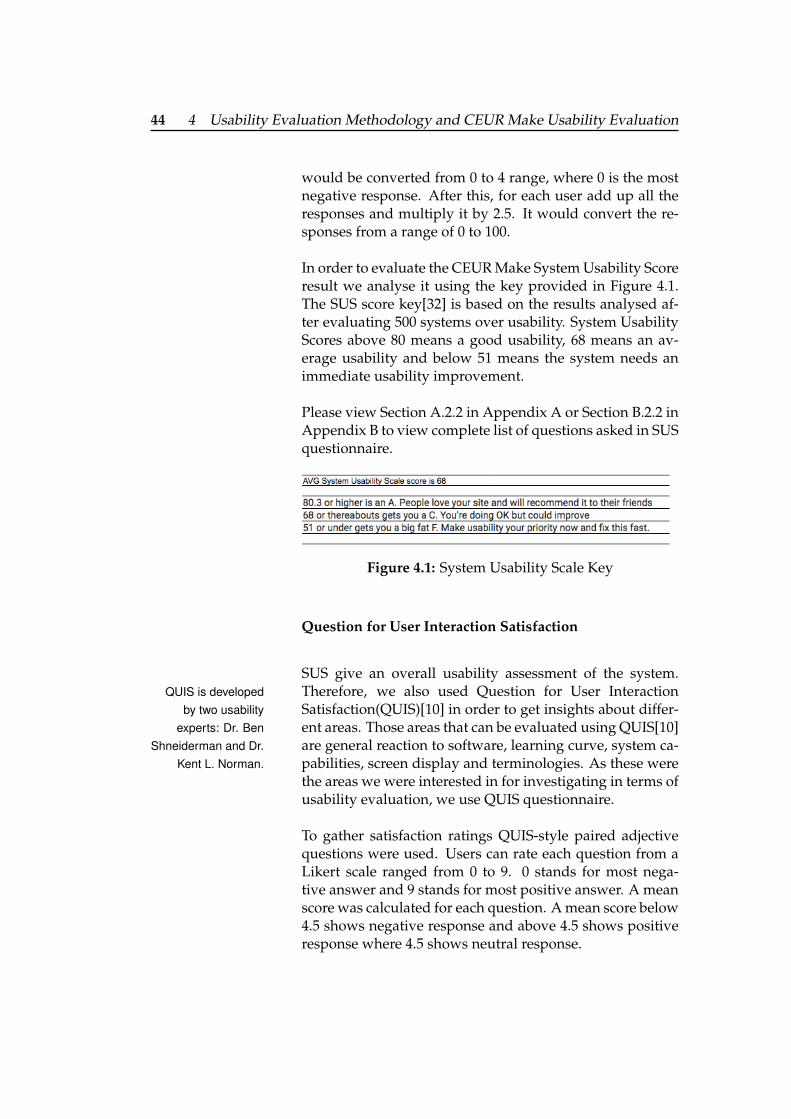
44 4 Usability Evaluation Methodology and CEUR Make Usability Evaluation
would be converted from 0 to 4 range, where 0 is the mostnegative response. After this, for each user add up all theresponses and multiply it by 2.5. It would convert the re-sponses from a range of 0 to 100.
In order to evaluate the CEUR Make System Usability Scoreresult we analyse it using the key provided in Figure 4.1.The SUS score key[32] is based on the results analysed af-ter evaluating 500 systems over usability. System UsabilityScores above 80 means a good usability, 68 means an av-erage usability and below 51 means the system needs animmediate usability improvement.
Please view Section A.2.2 in Appendix A or Section B.2.2 inAppendix B to view complete list of questions asked in SUSquestionnaire.
Figure 4.1: System Usability Scale Key
Question for User Interaction Satisfaction
SUS give an overall usability assessment of the system.Therefore, we also used Question for User InteractionQUIS is developed
by two usabilityexperts: Dr. Ben
Shneiderman and Dr.Kent L. Norman.
Satisfaction(QUIS)[10] in order to get insights about differ-ent areas. Those areas that can be evaluated using QUIS[10]are general reaction to software, learning curve, system ca-pabilities, screen display and terminologies. As these werethe areas we were interested in for investigating in terms ofusability evaluation, we use QUIS questionnaire.
To gather satisfaction ratings QUIS-style paired adjectivequestions were used. Users can rate each question from aLikert scale ranged from 0 to 9. 0 stands for most nega-tive answer and 9 stands for most positive answer. A meanscore was calculated for each question. A mean score below4.5 shows negative response and above 4.5 shows positiveresponse where 4.5 shows neutral response.
4.2 Usability Evaluation of CEUR Make 45
Please view refer Section A.2.2 in Appendix A or SectionB.2.2 in Appendix B to view complete list of questionsasked in QUIS questionnaire.
4.1.4 Dataset for Usability Testing
A standard dataset was used in order to test the usabilityof the system. This was used so that when users create thefiles required to generate workshop proceedings, all of theusers have the same data. In this way the results of individ-ual users could be compared. Hence, this was important inorder to achieve task completion time estimates. Choosinga standard dataset, for two different systems allowed theusers to experience same time complexity while enteringthe data, in this way task completion time addressed moreabout system usability. The dataset for both the tests couldbe viewed in Appendix A and Appendix B.
4.2 Usability Evaluation of CEUR Make
In this section we will describe the results attained duringthe usability testing of CEUR Make. The approach taken isdescribed in previous Section 4.1. The users identity is keptconfidential due to the privacy.
There are two main techniques that are used to conduct theusability testing, which are Think Aloud and Question Ask-ing. Think Aloud was used because it gives realistic resultsthat are close to user’s experience, while Question Askingwas used because it can be conducted remotely. Combin-ing both was important as half of our participants were re-mote participants. Therefore, we chose design techniquesthat were similar but had the difference of usability testenvironment. For both of these usability testing types, inthree main stages test results were recorded that are: De-mographics, Usability Evaluation Interview and Post Eval-uation Questionnaire. Usability Evaluation Interview isfurther divided into Qualitative and Quantitative results.
46 4 Usability Evaluation Methodology and CEUR Make Usability Evaluation
Quantitative results were recorded using Think Aloud De-sign setup and six participants participated in it, whileQualitative results were recorded using both Think AloudDesign and Question Asking Design setup. Six participantsparticipated in recording the Qualitative results. We dis-cuss these in the following sections:
4.2.1 Participants
Overall twelve participants took part in the usability test-ing of the CEUR Make. Participants of CEUR Make usabil-ity test were all academic researchers. The prerequisite ofparticipating in the usability test of CEUR Make was thebackground knowledge of publishing proceedings. Partic-ipants had varying native languages, ages and experiencewith computers. All the participants had majors in com-puter science or related field. The specifics of the partici-pants are discussed below:
Think Aloud Design Setup
The participants who participated in the Think Aloud De-sign setup were from age 28 to 32. In order to avoid genderbiases half of the participants were male and the other halffemale. All the participants who participated in the ThinkAloud Design setup had knowledge of publishing proceed-ings.
As our tool deals with CEUR Make and CEUR WorkshopProceedings, we also got participants knowledge regard-ing these domains. It was hard to find all the users whohad knowledge of publishing at CEUR Workshop Proceed-ings and who used CEUR Make to publish proceedings asthey were located remotely all around the globe. There-fore, we found three participants who had the knowledgeof CEUR Make and CEUR Workshop Proceedings and theother three without any previous knowledge. In this way50 percent of participants had the knowledge and the other50 percent didn’t had the knowledge, so that the resultscould be normalized. The participants who didn’t had
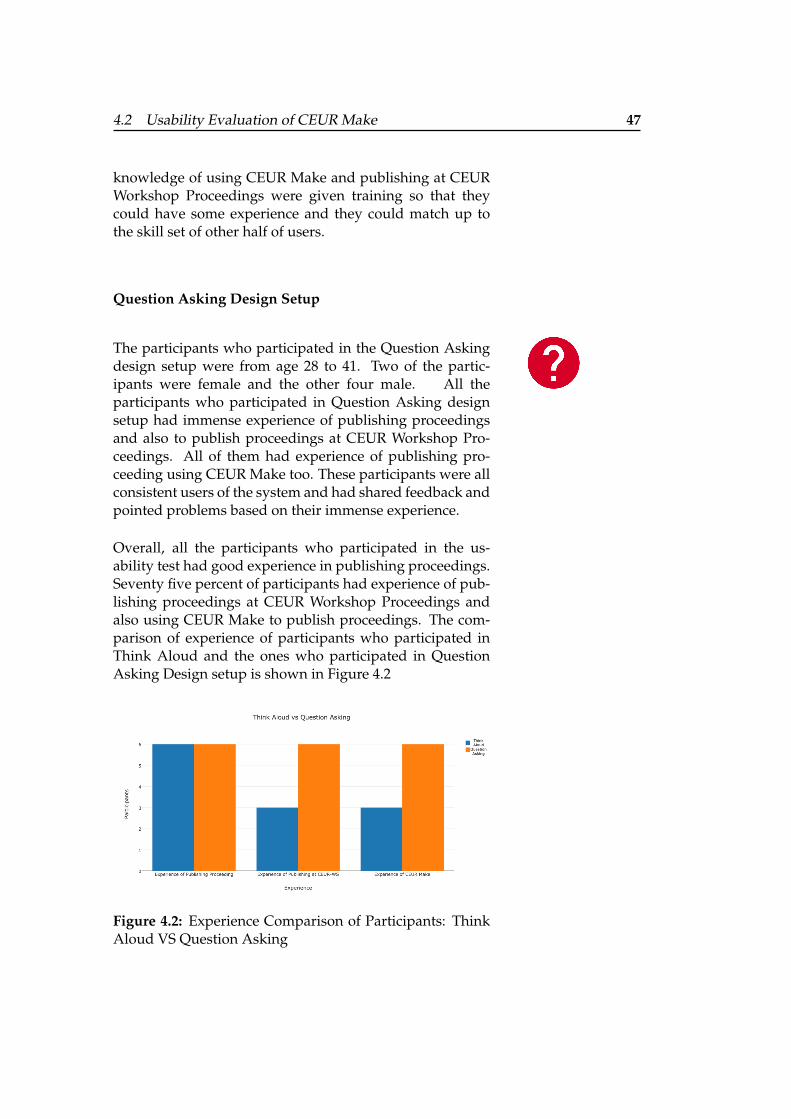
4.2 Usability Evaluation of CEUR Make 47
knowledge of using CEUR Make and publishing at CEURWorkshop Proceedings were given training so that theycould have some experience and they could match up tothe skill set of other half of users.
Question Asking Design Setup
The participants who participated in the Question Askingdesign setup were from age 28 to 41. Two of the partic-ipants were female and the other four male. All theparticipants who participated in Question Asking designsetup had immense experience of publishing proceedingsand also to publish proceedings at CEUR Workshop Pro-ceedings. All of them had experience of publishing pro-ceeding using CEUR Make too. These participants were allconsistent users of the system and had shared feedback andpointed problems based on their immense experience.
Overall, all the participants who participated in the us-ability test had good experience in publishing proceedings.Seventy five percent of participants had experience of pub-lishing proceedings at CEUR Workshop Proceedings andalso using CEUR Make to publish proceedings. The com-parison of experience of participants who participated inThink Aloud and the ones who participated in QuestionAsking Design setup is shown in Figure 4.2
Figure 4.2: Experience Comparison of Participants: ThinkAloud VS Question Asking
48 4 Usability Evaluation Methodology and CEUR Make Usability Evaluation
4.2.2 Usability Evaluation Interview
The results of the usability evaluation interview could bedivided into two sections:
• Quantitative: Task Completion Time
• Qualitative: Notes, Feedback
Both of these results are presented in following sections:
Quantitative Results
The users were asked to Think Aloud while performingtheir tasks, the time to complete the task was recorded bya stopwatch. Six participants actually participated in thistype of experiment. The time taken to complete each taskfor all the six users is presented in detail in Appendix C Sec-tion C.1.2. Average time taken for all the users to completetask is shown in Table 4.1 and in Figure 4.3.
The tasks were designed in most natural order of generat-ing a proceeding. Hence, Task 1 and Task 4 are easier whichare just to initiate generation or to search a proceedings vol-ume. Whereas, Task 2 and Task 3 are lengthier which areto generate the artifacts required for creating a proceeding.Task 2 requires user to create Workshop file which returnsuser with Copyrights form based on Workshop file created.So the average time taken for a user to complete a task ismore for Task 1 and Task 2 as shown in Figure 4.3, whereasit is quite higher for Task 3 and Task 4. These average timetaken to complete a task would be compared with our newsystem in Chapter 6.
Qualitative Results
Important notes were made in case of both the designsetups, Think Aloud and Question Asking. The notes
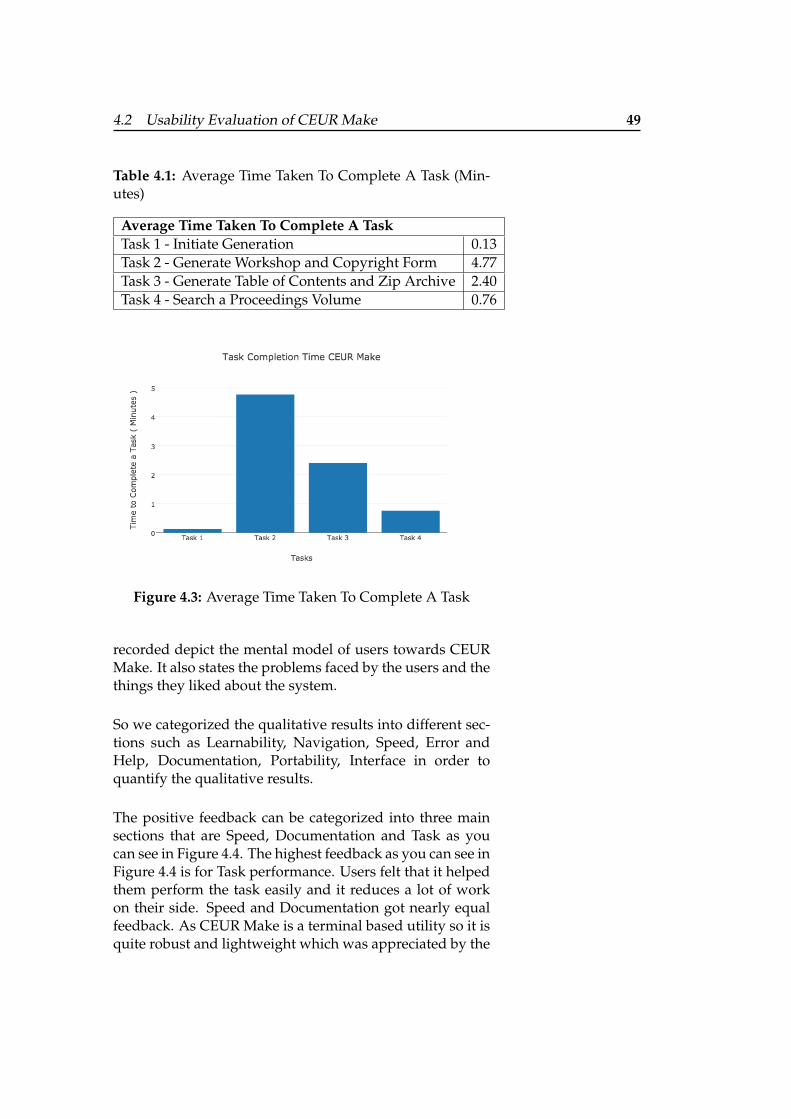
4.2 Usability Evaluation of CEUR Make 49
Table 4.1: Average Time Taken To Complete A Task (Min-utes)
Average Time Taken To Complete A TaskTask 1 - Initiate Generation 0.13Task 2 - Generate Workshop and Copyright Form 4.77Task 3 - Generate Table of Contents and Zip Archive 2.40Task 4 - Search a Proceedings Volume 0.76
Figure 4.3: Average Time Taken To Complete A Task
recorded depict the mental model of users towards CEURMake. It also states the problems faced by the users and thethings they liked about the system.
So we categorized the qualitative results into different sec-tions such as Learnability, Navigation, Speed, Error andHelp, Documentation, Portability, Interface in order toquantify the qualitative results.
The positive feedback can be categorized into three mainsections that are Speed, Documentation and Task as youcan see in Figure 4.4. The highest feedback as you can see inFigure 4.4 is for Task performance. Users felt that it helpedthem perform the task easily and it reduces a lot of workon their side. Speed and Documentation got nearly equalfeedback. As CEUR Make is a terminal based utility so it isquite robust and lightweight which was appreciated by the
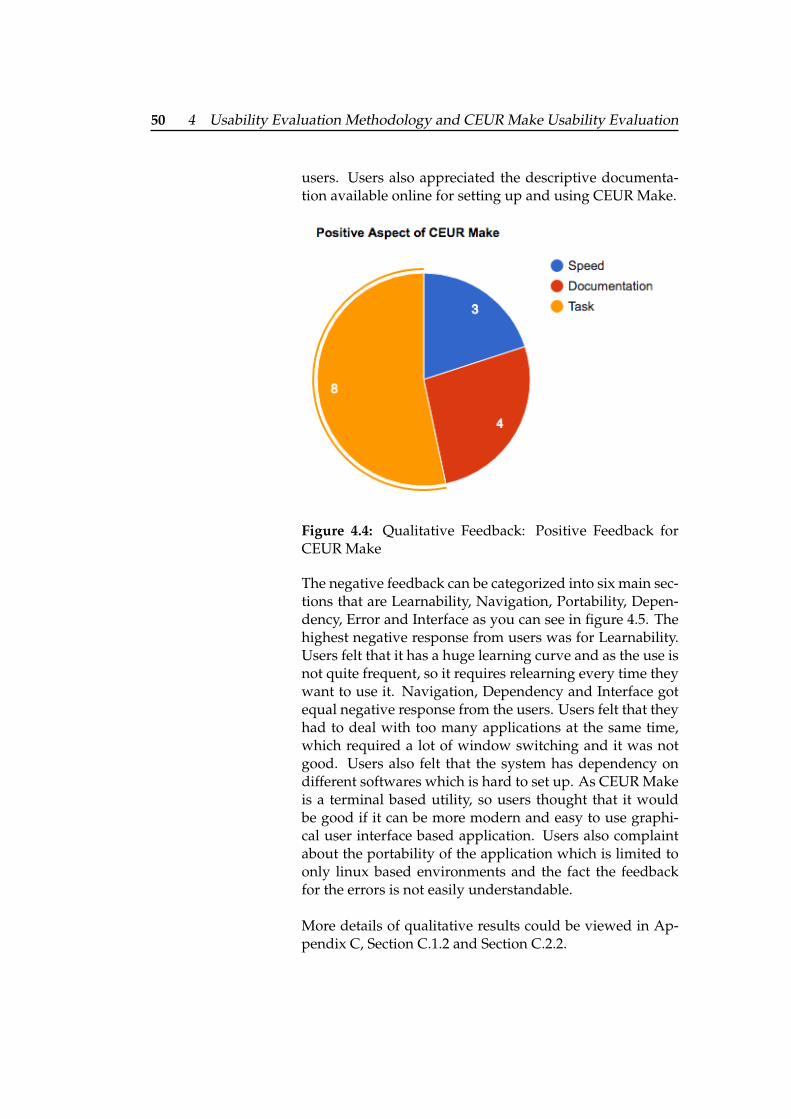
50 4 Usability Evaluation Methodology and CEUR Make Usability Evaluation
users. Users also appreciated the descriptive documenta-tion available online for setting up and using CEUR Make.
Figure 4.4: Qualitative Feedback: Positive Feedback forCEUR Make
The negative feedback can be categorized into six main sec-tions that are Learnability, Navigation, Portability, Depen-dency, Error and Interface as you can see in figure 4.5. Thehighest negative response from users was for Learnability.Users felt that it has a huge learning curve and as the use isnot quite frequent, so it requires relearning every time theywant to use it. Navigation, Dependency and Interface gotequal negative response from the users. Users felt that theyhad to deal with too many applications at the same time,which required a lot of window switching and it was notgood. Users also felt that the system has dependency ondifferent softwares which is hard to set up. As CEUR Makeis a terminal based utility, so users thought that it wouldbe good if it can be more modern and easy to use graphi-cal user interface based application. Users also complaintabout the portability of the application which is limited toonly linux based environments and the fact the feedbackfor the errors is not easily understandable.
More details of qualitative results could be viewed in Ap-pendix C, Section C.1.2 and Section C.2.2.
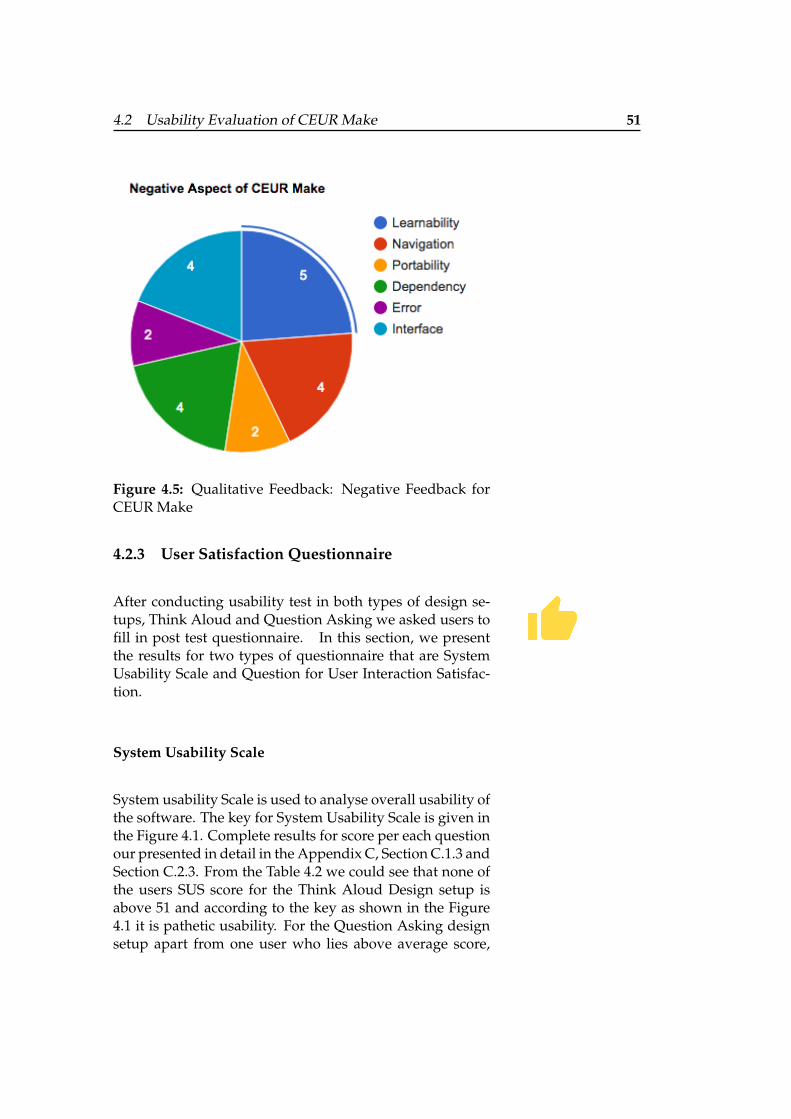
4.2 Usability Evaluation of CEUR Make 51
Figure 4.5: Qualitative Feedback: Negative Feedback forCEUR Make
4.2.3 User Satisfaction Questionnaire
After conducting usability test in both types of design se-tups, Think Aloud and Question Asking we asked users tofill in post test questionnaire. In this section, we presentthe results for two types of questionnaire that are SystemUsability Scale and Question for User Interaction Satisfac-tion.
System Usability Scale
System usability Scale is used to analyse overall usability ofthe software. The key for System Usability Scale is given inthe Figure 4.1. Complete results for score per each questionour presented in detail in the Appendix C, Section C.1.3 andSection C.2.3. From the Table 4.2 we could see that none ofthe users SUS score for the Think Aloud Design setup isabove 51 and according to the key as shown in the Figure4.1 it is pathetic usability. For the Question Asking designsetup apart from one user who lies above average score,
52 4 Usability Evaluation Methodology and CEUR Make Usability Evaluation
Table 4.2: System Usability Scale Results for CEUR Make
System Usability Scale ResultsThink AloudDesign Setup
Question AskingDesign Setup
User 1 50 User 7 72.5User 2 42.5 User 8 40User 3 37.5 User 9 32.5User 4 20 User 10 45User 5 30 User 11 45User 6 50 User 12 30Average 38.3 44.2
the SUS score for the rest of the users is well below passingcriteria that is 51. The average SUS score for all the 12 usersis calculated below:
Average SUS score for Think Aloud Design setup partici-pants (SUS1) = 38.3
Average SUS score for Question Asking design setup par-ticipants (SUS2) = 44.2
Average SUS score for Question Asking design setup wasrelatively better then Think Aloud Design setup as all theparticipants of Question Asking design setup were rela-tively more experienced in publishing using CEUR Make.The difference is just of 5.9 which is insignificant as both ofthe scores are well below the passing criteria which is a SUSscore of 51.
Average SUS score for all the participants = x
x =SUS1 + SUS2
2=
38.3 + 44.2
2= 41.25
Hence, the average SUS score for all the participants is41.25. It is well below the passing criteria for SUS ques-tionnaire which can be seen in Figure 4.6 and therefore theusability of the application must be improved.
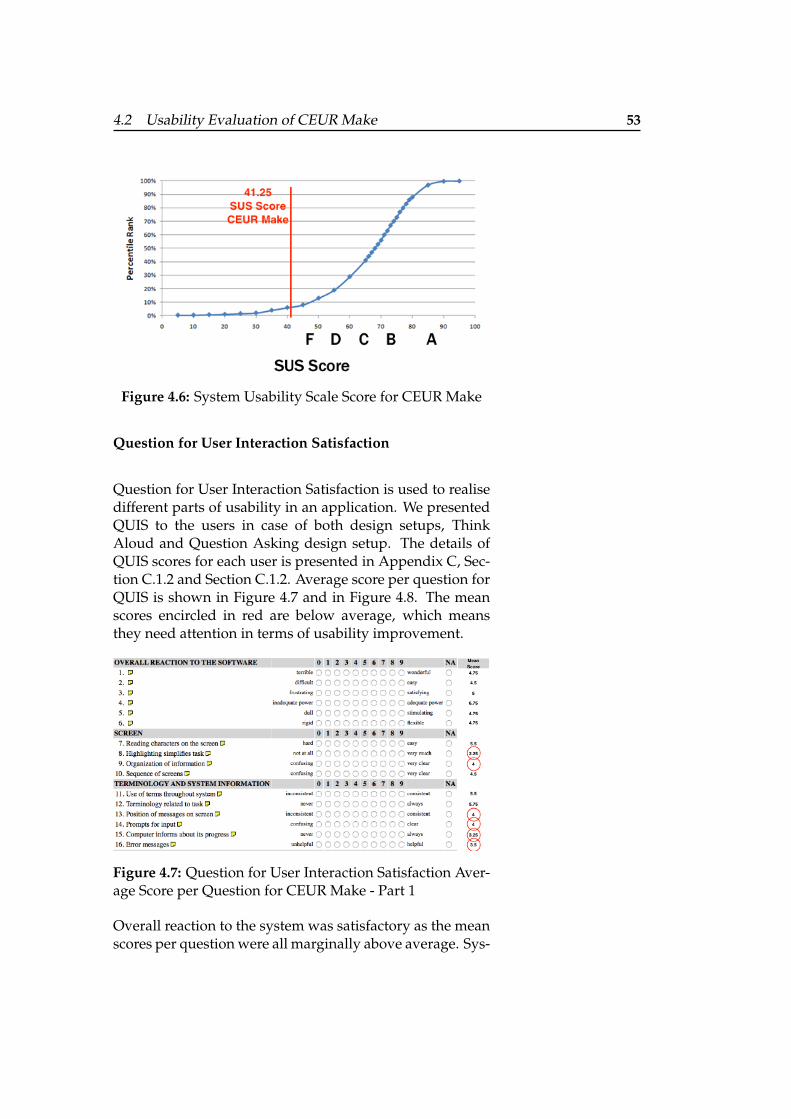
4.2 Usability Evaluation of CEUR Make 53
Figure 4.6: System Usability Scale Score for CEUR Make
Question for User Interaction Satisfaction
Question for User Interaction Satisfaction is used to realisedifferent parts of usability in an application. We presentedQUIS to the users in case of both design setups, ThinkAloud and Question Asking design setup. The details ofQUIS scores for each user is presented in Appendix C, Sec-tion C.1.2 and Section C.1.2. Average score per question forQUIS is shown in Figure 4.7 and in Figure 4.8. The meanscores encircled in red are below average, which meansthey need attention in terms of usability improvement.
Figure 4.7: Question for User Interaction Satisfaction Aver-age Score per Question for CEUR Make - Part 1
Overall reaction to the system was satisfactory as the meanscores per question were all marginally above average. Sys-
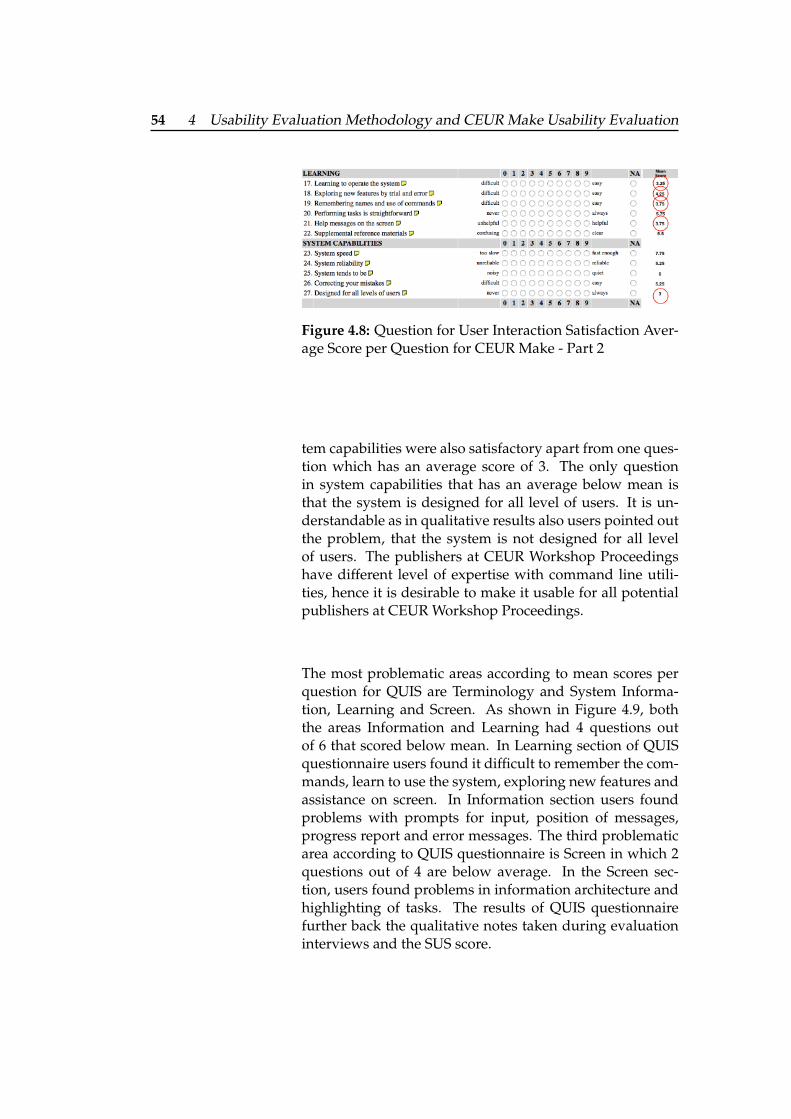
54 4 Usability Evaluation Methodology and CEUR Make Usability Evaluation
Figure 4.8: Question for User Interaction Satisfaction Aver-age Score per Question for CEUR Make - Part 2
tem capabilities were also satisfactory apart from one ques-tion which has an average score of 3. The only questionin system capabilities that has an average below mean isthat the system is designed for all level of users. It is un-derstandable as in qualitative results also users pointed outthe problem, that the system is not designed for all levelof users. The publishers at CEUR Workshop Proceedingshave different level of expertise with command line utili-ties, hence it is desirable to make it usable for all potentialpublishers at CEUR Workshop Proceedings.
The most problematic areas according to mean scores perquestion for QUIS are Terminology and System Informa-tion, Learning and Screen. As shown in Figure 4.9, boththe areas Information and Learning had 4 questions outof 6 that scored below mean. In Learning section of QUISquestionnaire users found it difficult to remember the com-mands, learn to use the system, exploring new features andassistance on screen. In Information section users foundproblems with prompts for input, position of messages,progress report and error messages. The third problematicarea according to QUIS questionnaire is Screen in which 2questions out of 4 are below average. In the Screen sec-tion, users found problems in information architecture andhighlighting of tasks. The results of QUIS questionnairefurther back the qualitative notes taken during evaluationinterviews and the SUS score.
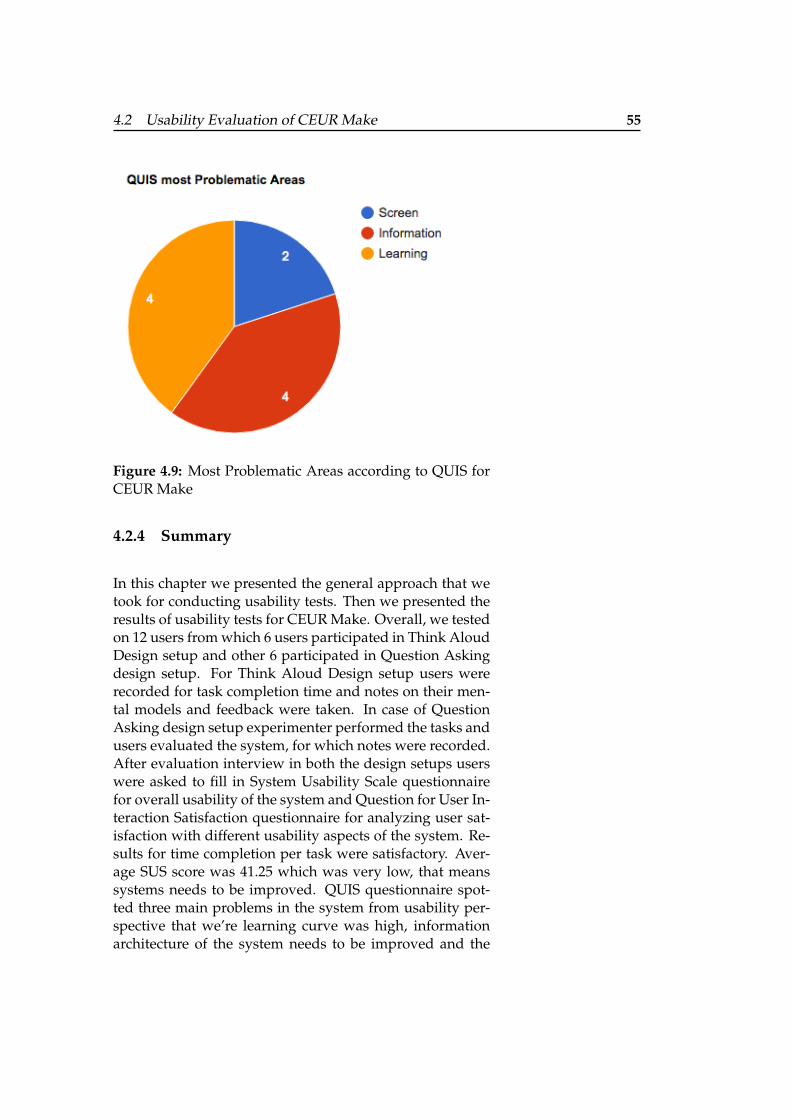
4.2 Usability Evaluation of CEUR Make 55
Figure 4.9: Most Problematic Areas according to QUIS forCEUR Make
4.2.4 Summary
In this chapter we presented the general approach that wetook for conducting usability tests. Then we presented theresults of usability tests for CEUR Make. Overall, we testedon 12 users from which 6 users participated in Think AloudDesign setup and other 6 participated in Question Askingdesign setup. For Think Aloud Design setup users wererecorded for task completion time and notes on their men-tal models and feedback were taken. In case of QuestionAsking design setup experimenter performed the tasks andusers evaluated the system, for which notes were recorded.After evaluation interview in both the design setups userswere asked to fill in System Usability Scale questionnairefor overall usability of the system and Question for User In-teraction Satisfaction questionnaire for analyzing user sat-isfaction with different usability aspects of the system. Re-sults for time completion per task were satisfactory. Aver-age SUS score was 41.25 which was very low, that meanssystems needs to be improved. QUIS questionnaire spot-ted three main problems in the system from usability per-spective that we’re learning curve was high, informationarchitecture of the system needs to be improved and the

56 4 Usability Evaluation Methodology and CEUR Make Usability Evaluation
system is not assistive. Hence, from the results of the us-ability evaluation of CEUR Make we derived requirementsfor our system. In the next chapter that is Chapter 5 we willpresent the design and implementation of our new systemand in Chapter 6 we will evaluate the usability of our newsystem and compare it to CEUR Make.
57
Chapter 5
Design andImplementation ofCEUR Make WebInterface
This chapter presents the design and implementation ofCEUR Make web interface. After usability evaluation ofCEUR Make as discussed in Chapter 4 we came up withCEUR Make Graphical User Interface. CEUR Make Graph-ical Interface is a web interface for CEUR Make. We chooseto design a web interface based on the usability evaluationof CEUR Make that had problems in areas such as portabil-ity, interface, learnability, navigation, dependency and taskperformance.
This chapter contains two sections, in first section we de-scribe the architecture of the Ceur Make Graphical User In-terface and in the second section we describe the interfaceelements of the system.
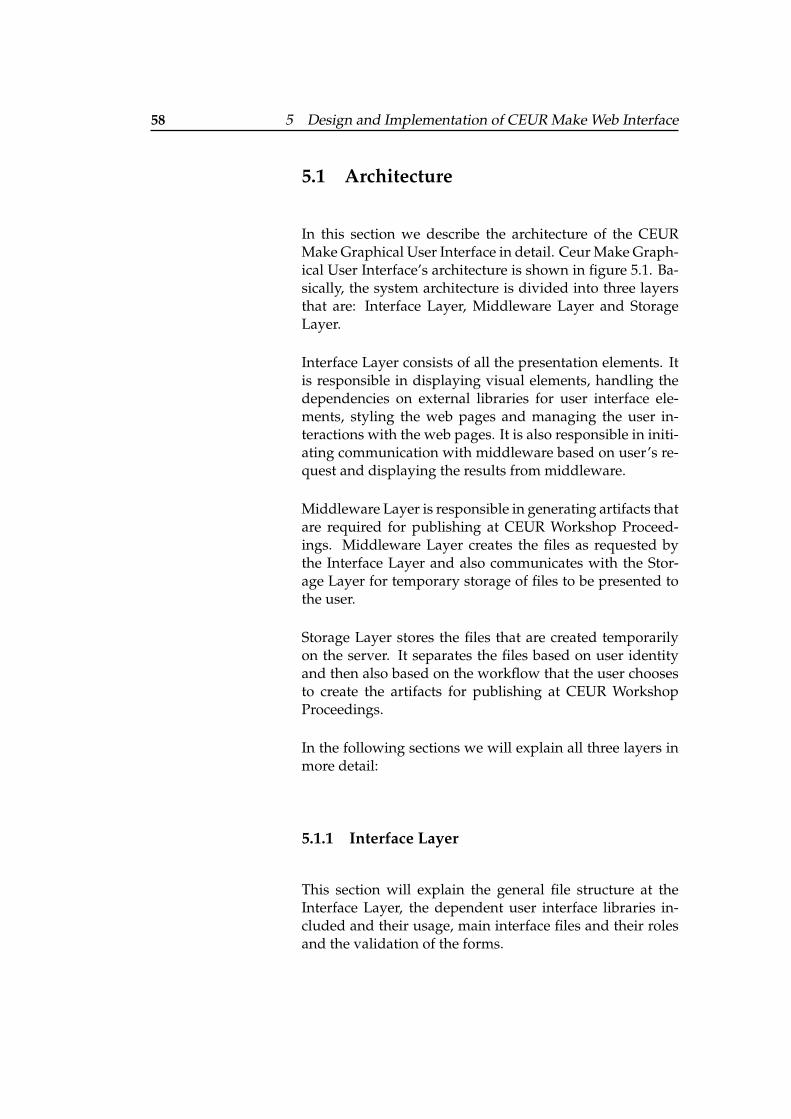
58 5 Design and Implementation of CEUR Make Web Interface
5.1 Architecture
In this section we describe the architecture of the CEURMake Graphical User Interface in detail. Ceur Make Graph-ical User Interface’s architecture is shown in figure 5.1. Ba-sically, the system architecture is divided into three layersthat are: Interface Layer, Middleware Layer and StorageLayer.
Interface Layer consists of all the presentation elements. Itis responsible in displaying visual elements, handling thedependencies on external libraries for user interface ele-ments, styling the web pages and managing the user in-teractions with the web pages. It is also responsible in initi-ating communication with middleware based on user’s re-quest and displaying the results from middleware.
Middleware Layer is responsible in generating artifacts thatare required for publishing at CEUR Workshop Proceed-ings. Middleware Layer creates the files as requested bythe Interface Layer and also communicates with the Stor-age Layer for temporary storage of files to be presented tothe user.
Storage Layer stores the files that are created temporarilyon the server. It separates the files based on user identityand then also based on the workflow that the user choosesto create the artifacts for publishing at CEUR WorkshopProceedings.
In the following sections we will explain all three layers inmore detail:
5.1.1 Interface Layer
This section will explain the general file structure at theInterface Layer, the dependent user interface libraries in-cluded and their usage, main interface files and their rolesand the validation of the forms.
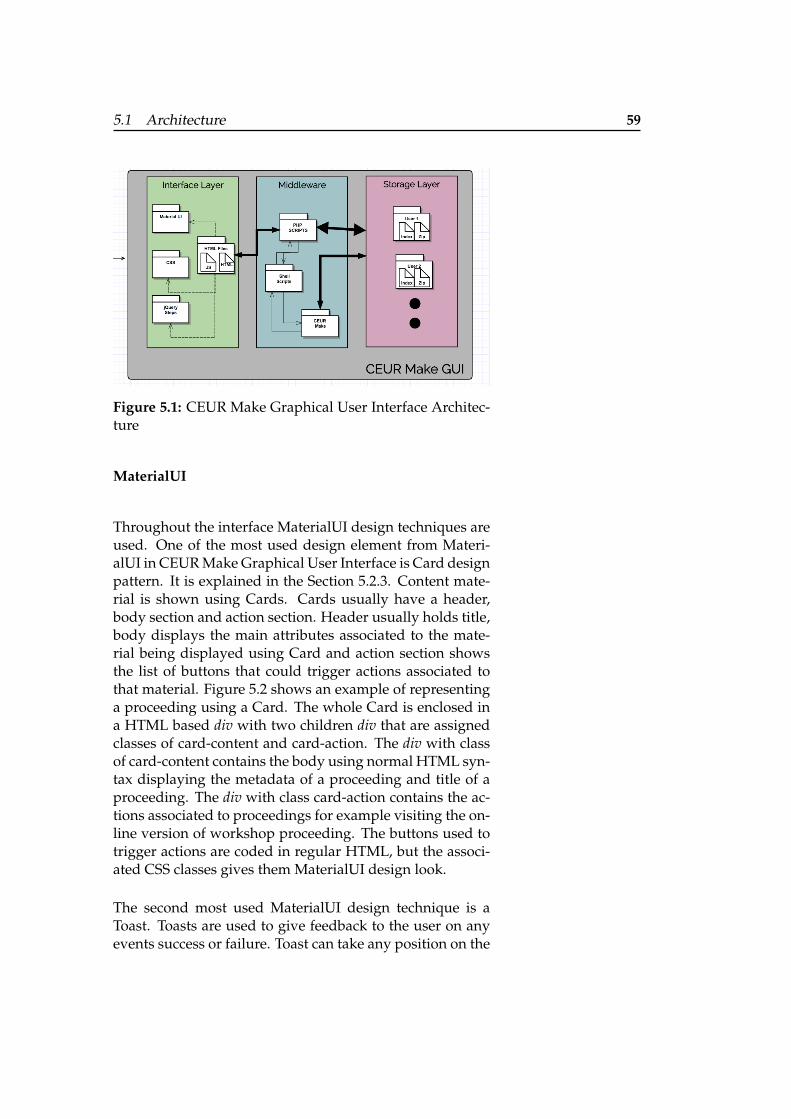
5.1 Architecture 59
Figure 5.1: CEUR Make Graphical User Interface Architec-ture
MaterialUI
Throughout the interface MaterialUI design techniques areused. One of the most used design element from Materi-alUI in CEUR Make Graphical User Interface is Card designpattern. It is explained in the Section 5.2.3. Content mate-rial is shown using Cards. Cards usually have a header,body section and action section. Header usually holds title,body displays the main attributes associated to the mate-rial being displayed using Card and action section showsthe list of buttons that could trigger actions associated tothat material. Figure 5.2 shows an example of representinga proceeding using a Card. The whole Card is enclosed ina HTML based div with two children div that are assignedclasses of card-content and card-action. The div with classof card-content contains the body using normal HTML syn-tax displaying the metadata of a proceeding and title of aproceeding. The div with class card-action contains the ac-tions associated to proceedings for example visiting the on-line version of workshop proceeding. The buttons used totrigger actions are coded in regular HTML, but the associ-ated CSS classes gives them MaterialUI design look.
The second most used MaterialUI design technique is aToast. Toasts are used to give feedback to the user on anyevents success or failure. Toast can take any position on the
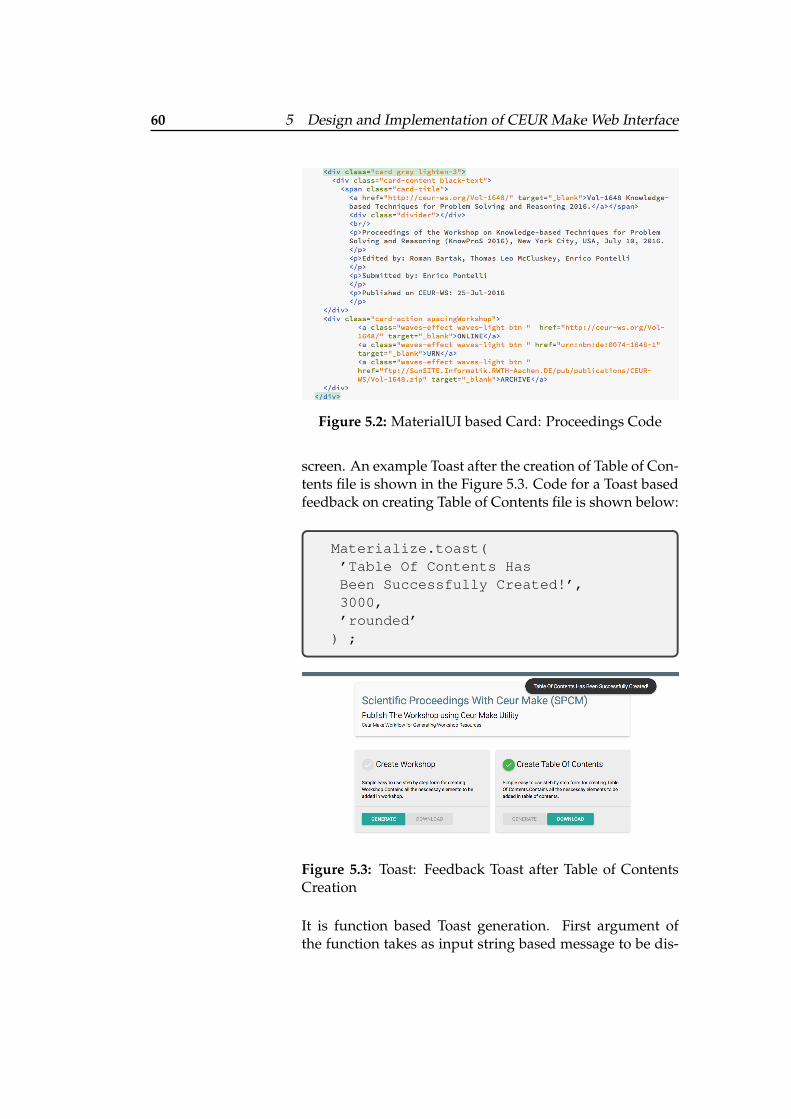
60 5 Design and Implementation of CEUR Make Web Interface
Figure 5.2: MaterialUI based Card: Proceedings Code
screen. An example Toast after the creation of Table of Con-tents file is shown in the Figure 5.3. Code for a Toast basedfeedback on creating Table of Contents file is shown below:
Materialize.toast(’Table Of Contents HasBeen Successfully Created!’,3000,’rounded’) ;
Figure 5.3: Toast: Feedback Toast after Table of ContentsCreation
It is function based Toast generation. First argument ofthe function takes as input string based message to be dis-
5.1 Architecture 61
played as a feedback. The second argument takes time forwhich the toast should last on screen in milliseconds andthe third argument is related to its styling that the edges ofthe Toast should be with rounded corners.
jQuery Steps
jQuery Steps is an external JavaScript library that is used tocreate stepwise wizard for presenting the user with step-wise form. We use jQuery stepwise wizard for present-ing user with views for generating Table of Contents fileas shown in the Figure 5.15 and Workshop file as shownin the Figure 5.15. Stepwise form is created in two steps.We will discuss the creation of stepwise while keeping inmind the creation of wizard for Workshop file generationview. There is a HTML section and a JavaScript section.The HTML Code for Workshop wizard is shown below:
<div id="wizard2"><h1>Metadata</h1><div id="Metadata">//HTML fields for filling in//workshop metadata..</div><h1>Conference</h1><div id="Conference">//HTML fields for filling in//conference metadata associated// to workshop..</div><h1>Editors</h1><div id="Editors">//HTML fields for filling in//workshop metadata..</div></div>
As shown in the code whole wizard is enclosed in a HTMLbased div with a unique id. There are three steps of the wiz-ard and each step has a name represented using HTML h1
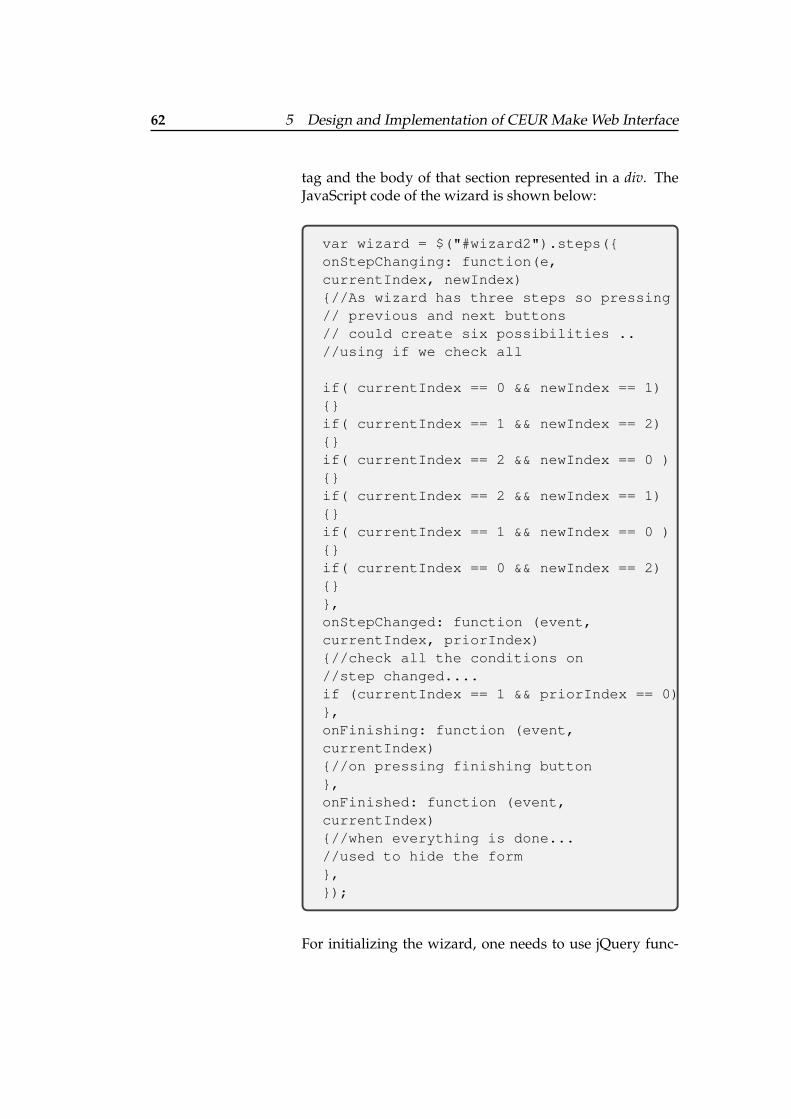
62 5 Design and Implementation of CEUR Make Web Interface
tag and the body of that section represented in a div. TheJavaScript code of the wizard is shown below:
var wizard = $("#wizard2").steps({onStepChanging: function(e,currentIndex, newIndex){//As wizard has three steps so pressing// previous and next buttons// could create six possibilities ..//using if we check all
if( currentIndex == 0 && newIndex == 1){}if( currentIndex == 1 && newIndex == 2){}if( currentIndex == 2 && newIndex == 0 ){}if( currentIndex == 2 && newIndex == 1){}if( currentIndex == 1 && newIndex == 0 ){}if( currentIndex == 0 && newIndex == 2){}},onStepChanged: function (event,currentIndex, priorIndex){//check all the conditions on//step changed....if (currentIndex == 1 && priorIndex == 0)},onFinishing: function (event,currentIndex){//on pressing finishing button},onFinished: function (event,currentIndex){//when everything is done...//used to hide the form},});
For initializing the wizard, one needs to use jQuery func-
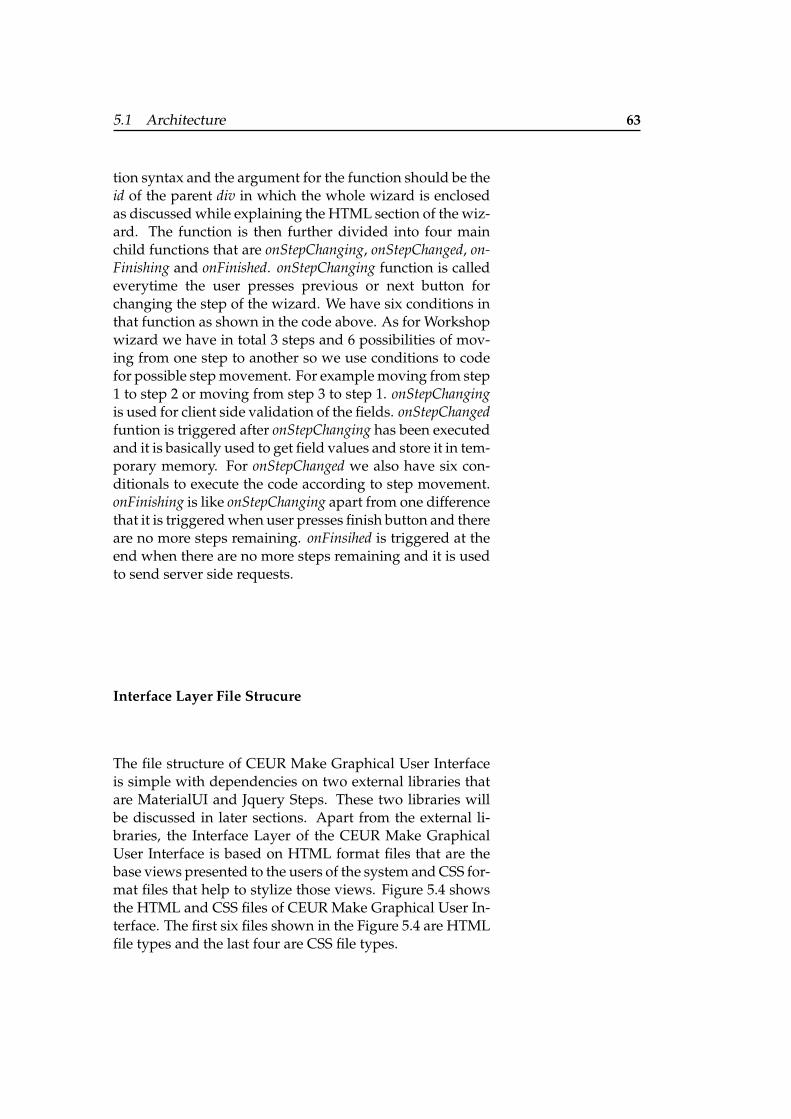
5.1 Architecture 63
tion syntax and the argument for the function should be theid of the parent div in which the whole wizard is enclosedas discussed while explaining the HTML section of the wiz-ard. The function is then further divided into four mainchild functions that are onStepChanging, onStepChanged, on-Finishing and onFinished. onStepChanging function is calledeverytime the user presses previous or next button forchanging the step of the wizard. We have six conditions inthat function as shown in the code above. As for Workshopwizard we have in total 3 steps and 6 possibilities of mov-ing from one step to another so we use conditions to codefor possible step movement. For example moving from step1 to step 2 or moving from step 3 to step 1. onStepChangingis used for client side validation of the fields. onStepChangedfuntion is triggered after onStepChanging has been executedand it is basically used to get field values and store it in tem-porary memory. For onStepChanged we also have six con-ditionals to execute the code according to step movement.onFinishing is like onStepChanging apart from one differencethat it is triggered when user presses finish button and thereare no more steps remaining. onFinsihed is triggered at theend when there are no more steps remaining and it is usedto send server side requests.
Interface Layer File Strucure
The file structure of CEUR Make Graphical User Interfaceis simple with dependencies on two external libraries thatare MaterialUI and Jquery Steps. These two libraries willbe discussed in later sections. Apart from the external li-braries, the Interface Layer of the CEUR Make GraphicalUser Interface is based on HTML format files that are thebase views presented to the users of the system and CSS for-mat files that help to stylize those views. Figure 5.4 showsthe HTML and CSS files of CEUR Make Graphical User In-terface. The first six files shown in the Figure 5.4 are HTMLfile types and the last four are CSS file types.
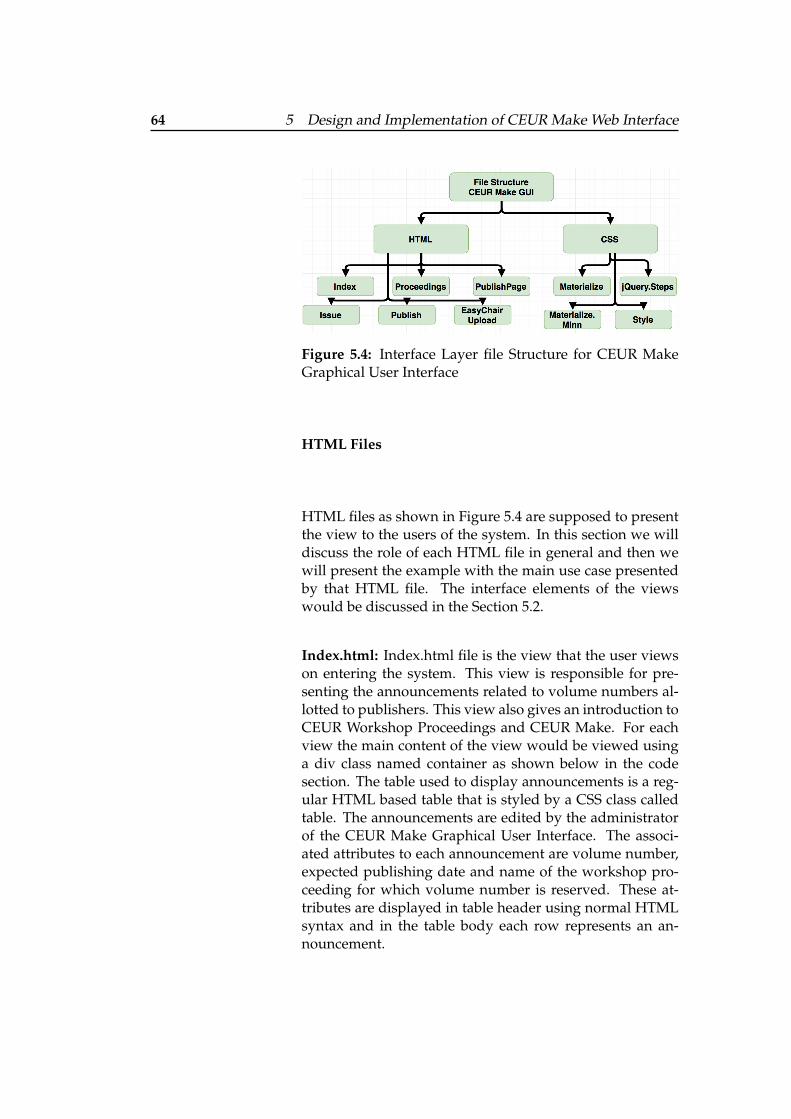
64 5 Design and Implementation of CEUR Make Web Interface
Figure 5.4: Interface Layer file Structure for CEUR MakeGraphical User Interface
HTML Files
HTML files as shown in Figure 5.4 are supposed to presentthe view to the users of the system. In this section we willdiscuss the role of each HTML file in general and then wewill present the example with the main use case presentedby that HTML file. The interface elements of the viewswould be discussed in the Section 5.2.
Index.html: Index.html file is the view that the user viewson entering the system. This view is responsible for pre-senting the announcements related to volume numbers al-lotted to publishers. This view also gives an introduction toCEUR Workshop Proceedings and CEUR Make. For eachview the main content of the view would be viewed usinga div class named container as shown below in the codesection. The table used to display announcements is a reg-ular HTML based table that is styled by a CSS class calledtable. The announcements are edited by the administratorof the CEUR Make Graphical User Interface. The associ-ated attributes to each announcement are volume number,expected publishing date and name of the workshop pro-ceeding for which volume number is reserved. These at-tributes are displayed in table header using normal HTMLsyntax and in the table body each row represents an an-nouncement.
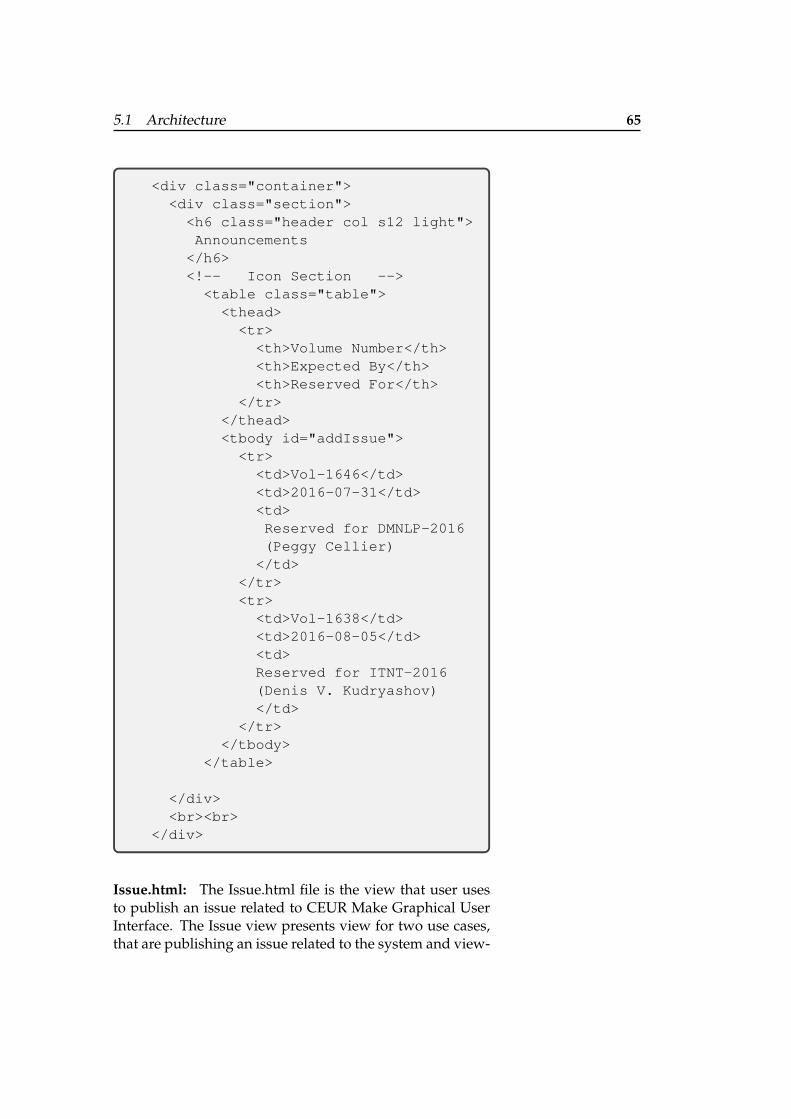
5.1 Architecture 65
<div class="container"><div class="section">
<h6 class="header col s12 light">Announcements</h6><!-- Icon Section --><table class="table">
<thead><tr>
<th>Volume Number</th><th>Expected By</th><th>Reserved For</th>
</tr></thead><tbody id="addIssue">
<tr><td>Vol-1646</td><td>2016-07-31</td><td>Reserved for DMNLP-2016(Peggy Cellier)</td>
</tr><tr>
<td>Vol-1638</td><td>2016-08-05</td><td>Reserved for ITNT-2016(Denis V. Kudryashov)</td>
</tr></tbody>
</table>
</div><br><br>
</div>
Issue.html: The Issue.html file is the view that user usesto publish an issue related to CEUR Make Graphical UserInterface. The Issue view presents view for two use cases,that are publishing an issue related to the system and view-
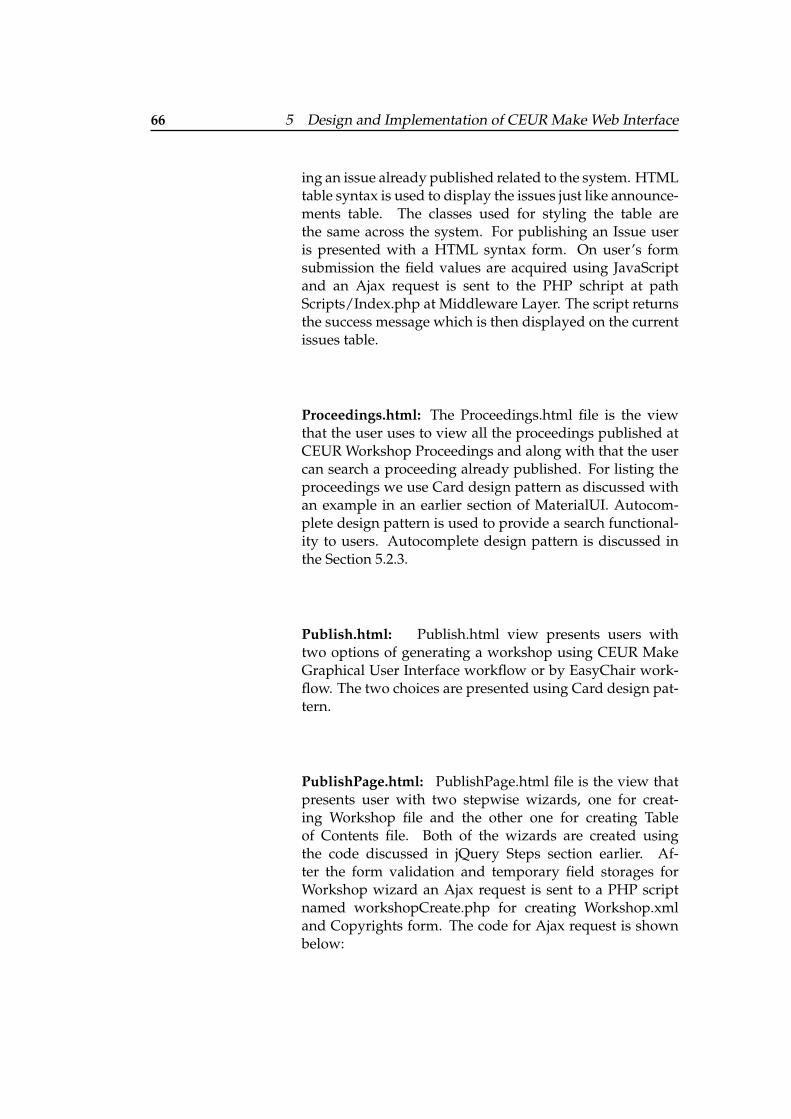
66 5 Design and Implementation of CEUR Make Web Interface
ing an issue already published related to the system. HTMLtable syntax is used to display the issues just like announce-ments table. The classes used for styling the table arethe same across the system. For publishing an Issue useris presented with a HTML syntax form. On user’s formsubmission the field values are acquired using JavaScriptand an Ajax request is sent to the PHP schript at pathScripts/Index.php at Middleware Layer. The script returnsthe success message which is then displayed on the currentissues table.
Proceedings.html: The Proceedings.html file is the viewthat the user uses to view all the proceedings published atCEUR Workshop Proceedings and along with that the usercan search a proceeding already published. For listing theproceedings we use Card design pattern as discussed withan example in an earlier section of MaterialUI. Autocom-plete design pattern is used to provide a search functional-ity to users. Autocomplete design pattern is discussed inthe Section 5.2.3.
Publish.html: Publish.html view presents users withtwo options of generating a workshop using CEUR MakeGraphical User Interface workflow or by EasyChair work-flow. The two choices are presented using Card design pat-tern.
PublishPage.html: PublishPage.html file is the view thatpresents user with two stepwise wizards, one for creat-ing Workshop file and the other one for creating Tableof Contents file. Both of the wizards are created usingthe code discussed in jQuery Steps section earlier. Af-ter the form validation and temporary field storages forWorkshop wizard an Ajax request is sent to a PHP scriptnamed workshopCreate.php for creating Workshop.xmland Copyrights form. The code for Ajax request is shownbelow:
5.1 Architecture 67
var data = JSON.stringify(workshopArray);var xhr = new XMLHttpRequest();xhr.open("POST","workshopCreate.php",!0);xhr.setRequestHeader("Content-Type","application/json;charset=UTF-8");xhr.send(data);xhr.onreadystatechange = function (){if(xhr.readyState == 4 &&xhr.status == 200){// in case we reply back from serverjsondata = xhr.responseText;
//after Workshop CreationcopyrightsFormCreation( );
}}
As we can see in the code it an Ajax request the data fromthe fields is sent as a JSON array to the server and if theworkshopCreate.php script running on server side is ableto create Workshop.xml, another function is called that cre-ates the Copyrights form based on Workshop.xml meta-data. After Workshop.xml and Copyrights form when userfollows the wizard for creating Table of Contents XML for-mat file, a similar Ajax request is sent to another PHP scriptnamed doc.php. If the script is successful in creation of Ta-ble of Contents file, another script creates all the resourcesrequired for publishing at CEUR Workshop Proceedings.
EasyChairUpload.html:
EasyChairUpload.html is the view that allows user to gen-erate artifacts required for CEUR Workshop Proceedingsusing a wizard to create Workshop.xml just like created incase of PublishPage.html. Instead of Table of Contents wiz-ard we import EasyChair resources to create Table of Con-
68 5 Design and Implementation of CEUR Make Web Interface
tents. An Ajax request is sent to a PHP script called Man-agingExtract that uploads the EasyChair resources to theserver and creates Table of Contents file and other artifactsrequired to publish proceedings at CEUR Workshop Pro-ceedings.
CSS
For CSS four main files are used for styling the interface ele-ments as shown in the Figure 5.4. Materialize.css and Mate-rialize.min.css are both same files with only one differenceMaterialize.min.css is compressed and the other is not com-pressed. Materialize.css sets the theme of the applicationbased on Material design. It is downloaded from Materi-alizecss site 1. It is preferable not to customize it. For cus-tomization and overriding we use Style.css. Jquey.steps.cssis the file that sets the theme of the step wise wizards usedfor generating Table of Contents and Workshop files asshown in the Figure 5.15 and the Figure 5.16.
Validation
Form validation is done using regular expressions. The reg-ular expressions used to validate forms could be seen in theJavaScript section of the code files PublishPage.html2 andEasyChairUpload.html3.
Throughout the thesis this technique is used to validate theforms as CEUR Make is also doing server side validationusing regular expressions so in order to maintain standardswe used regular expression based validation on client side.
1http://materializecss.com/2https://github.com/ceurws/ceur-make-ui/blob/
master/CeurMakeGUI/index/PublishPage.html3https://github.com/ceurws/ceur-make-ui/blob/
master/CeurMakeGUI/index/easyChairUpload.php
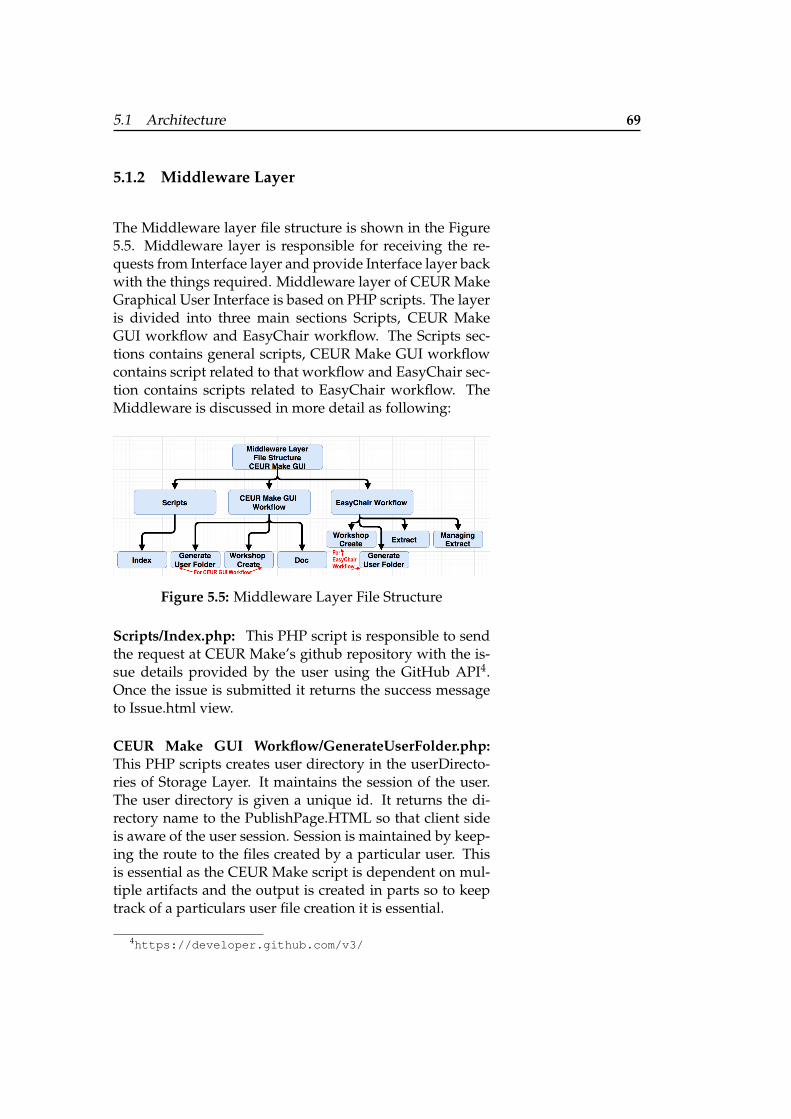
5.1 Architecture 69
5.1.2 Middleware Layer
The Middleware layer file structure is shown in the Figure5.5. Middleware layer is responsible for receiving the re-quests from Interface layer and provide Interface layer backwith the things required. Middleware layer of CEUR MakeGraphical User Interface is based on PHP scripts. The layeris divided into three main sections Scripts, CEUR MakeGUI workflow and EasyChair workflow. The Scripts sec-tions contains general scripts, CEUR Make GUI workflowcontains script related to that workflow and EasyChair sec-tion contains scripts related to EasyChair workflow. TheMiddleware is discussed in more detail as following:
Figure 5.5: Middleware Layer File Structure
Scripts/Index.php: This PHP script is responsible to sendthe request at CEUR Make’s github repository with the is-sue details provided by the user using the GitHub API4.Once the issue is submitted it returns the success messageto Issue.html view.
CEUR Make GUI Workflow/GenerateUserFolder.php:This PHP scripts creates user directory in the userDirecto-ries of Storage Layer. It maintains the session of the user.The user directory is given a unique id. It returns the di-rectory name to the PublishPage.HTML so that client sideis aware of the user session. Session is maintained by keep-ing the route to the files created by a particular user. Thisis essential as the CEUR Make script is dependent on mul-tiple artifacts and the output is created in parts so to keeptrack of a particulars user file creation it is essential.
4https://developer.github.com/v3/
70 5 Design and Implementation of CEUR Make Web Interface
CEUR Make GUI Workflow/doc.php: This PHP script re-ceives as a JSON object the field values from the Table ofContents wizard. It is received using an Ajax request fromPublishPage.HTML. The PHP script reads the JSON objectand translates it into an XML file, following the format ofCEUR Make. In order to transform JSON Object of array toXML, PHP SimpleXML Functions are used.
CEUR Make GUI Workflow/WorkshopCreate.php: ThisPHP script receives as a JSON the field values from Work-shop wizard. It is received using an Ajax request from Pub-lishingPage.HTML. The PHP script reads the JSON objectand translates it into an XML, just like in the case of Tableof Contents.
EasyChair Workflow/GenerateUserFolder.php: This PHPscripts creates user directory in the EasyChair directory ofStorage Layer. It maintains the session of the user just likein case of CEUR Make GUI Workflow. The user directoryis given a unique id. It returns the directory name to theEasyChairUpload.html so that client side is aware of theuser session.
EasyChair Workflow/WorkshopCreate.php: This PHPscript receives as a JSON the field values from Workshopwizard of EasyChairUpload.html. It is received using anAjax request from EasyChairUpload.html. The PHP scriptreads the JSON object and translates it into an XML, justlike in the case of WorkshopCreate.php of CEUR Make GUIWorkflow.
EasyChair Workflow/Extract.php: This PHP script re-ceives a request from the client side that is EasyChairU-pload.html to upload and unzip a zip archived based Easy-Chair resources. It is received using an Ajax request fromEasyChairUpload.html. The PHP script reads the metadataof the zip archive and creates a new directory with the con-tents of zip file.
EasyChair Workflow/ManagingExtract.php: This PHPscript receives as a JSON the field values from Table of Con-tents wizard of EasyChairUpload.html. It is received us-ing an Ajax request from EasyChairUpload.html. The PHP
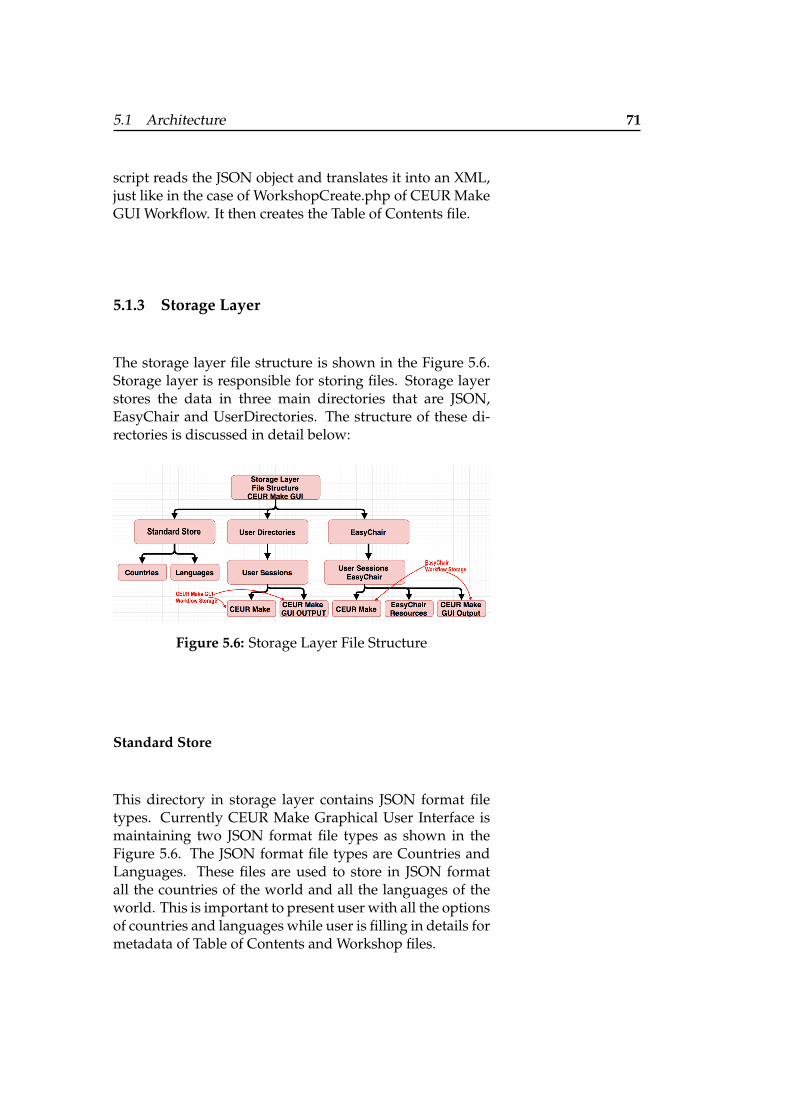
5.1 Architecture 71
script reads the JSON object and translates it into an XML,just like in the case of WorkshopCreate.php of CEUR MakeGUI Workflow. It then creates the Table of Contents file.
5.1.3 Storage Layer
The storage layer file structure is shown in the Figure 5.6.Storage layer is responsible for storing files. Storage layerstores the data in three main directories that are JSON,EasyChair and UserDirectories. The structure of these di-rectories is discussed in detail below:
Figure 5.6: Storage Layer File Structure
Standard Store
This directory in storage layer contains JSON format filetypes. Currently CEUR Make Graphical User Interface ismaintaining two JSON format file types as shown in theFigure 5.6. The JSON format file types are Countries andLanguages. These files are used to store in JSON formatall the countries of the world and all the languages of theworld. This is important to present user with all the optionsof countries and languages while user is filling in details formetadata of Table of Contents and Workshop files.
72 5 Design and Implementation of CEUR Make Web Interface
UserDirectories
This directory as shown in the Figure 5.6 maintains the ses-sions of the users while they use CEUR Make GraphicalUser Interface workflow for creating workshop proceed-ings. Against every session for generating resources man-ually a user directory with unique name is created. Theuser session directory further contains CEUR Make scriptsand CEUR Make Graphical User Interface outputs based onCEUR Make Graphical User Interface manual workflow.
EasyChair
This directory maintains the sessions of the users as shownin the Figure 5.6 while they use EasyChair resources basedworkflow for creating workshop proceedings. Against ev-ery session for generating resources manually a user direc-tory with unique name is created. The user session direc-tory further contains CEUR Make scripts, imported Easy-Chair resources and CEUR Make Graphical User Interfaceoutputs based on EasyChair workflow.
5.2 User Interface
This section will present the sitemap of the application, dif-ferent views, the important design patterns used while cre-ating the views and the User Centered Design methodol-ogy followed in creating the CEUR Make Graphical UserInterface.
5.2.1 Sitemap
The sitemap of the CEUR Make Graphical User Interfaceis shown in the Figure 5.7. The main view is the Homeview which can be seen on entering the CEUR Make Graph-ical User Interface. Navigation Menu helps to navigate be-
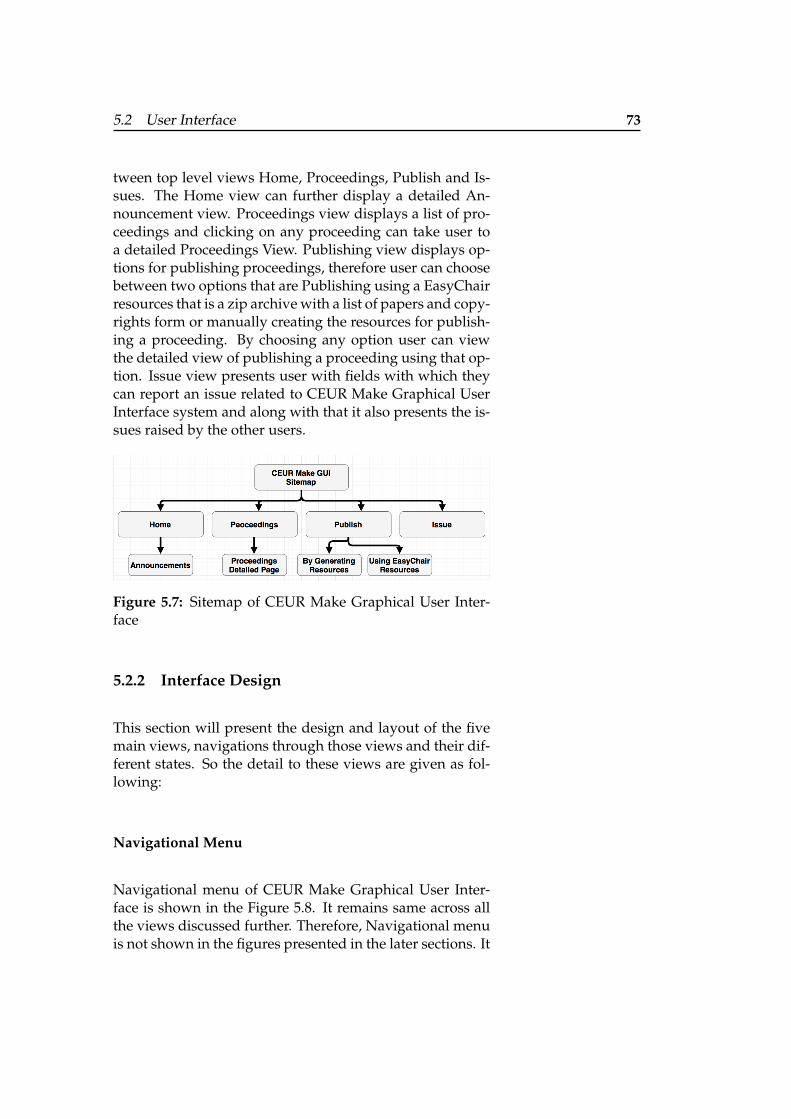
5.2 User Interface 73
tween top level views Home, Proceedings, Publish and Is-sues. The Home view can further display a detailed An-nouncement view. Proceedings view displays a list of pro-ceedings and clicking on any proceeding can take user toa detailed Proceedings View. Publishing view displays op-tions for publishing proceedings, therefore user can choosebetween two options that are Publishing using a EasyChairresources that is a zip archive with a list of papers and copy-rights form or manually creating the resources for publish-ing a proceeding. By choosing any option user can viewthe detailed view of publishing a proceeding using that op-tion. Issue view presents user with fields with which theycan report an issue related to CEUR Make Graphical UserInterface system and along with that it also presents the is-sues raised by the other users.
Figure 5.7: Sitemap of CEUR Make Graphical User Inter-face
5.2.2 Interface Design
This section will present the design and layout of the fivemain views, navigations through those views and their dif-ferent states. So the detail to these views are given as fol-lowing:
Navigational Menu
Navigational menu of CEUR Make Graphical User Inter-face is shown in the Figure 5.8. It remains same across allthe views discussed further. Therefore, Navigational menuis not shown in the figures presented in the later sections. It
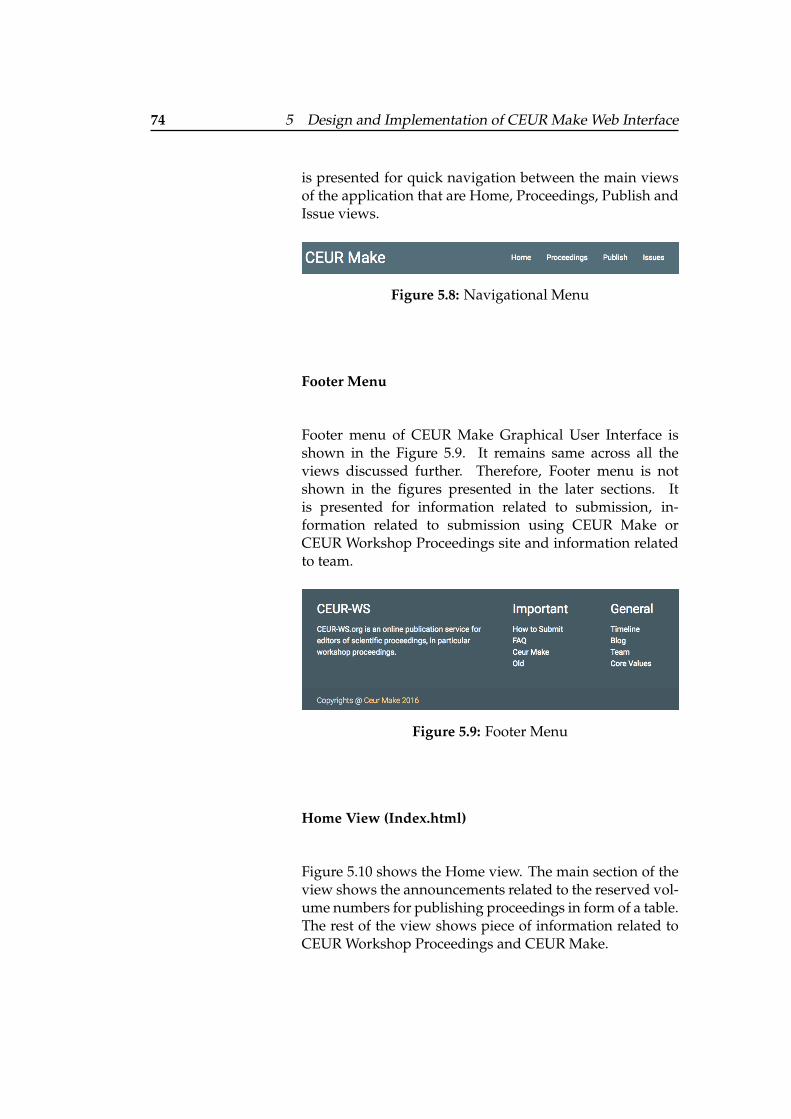
74 5 Design and Implementation of CEUR Make Web Interface
is presented for quick navigation between the main viewsof the application that are Home, Proceedings, Publish andIssue views.
Figure 5.8: Navigational Menu
Footer Menu
Footer menu of CEUR Make Graphical User Interface isshown in the Figure 5.9. It remains same across all theviews discussed further. Therefore, Footer menu is notshown in the figures presented in the later sections. Itis presented for information related to submission, in-formation related to submission using CEUR Make orCEUR Workshop Proceedings site and information relatedto team.
Figure 5.9: Footer Menu
Home View (Index.html)
Figure 5.10 shows the Home view. The main section of theview shows the announcements related to the reserved vol-ume numbers for publishing proceedings in form of a table.The rest of the view shows piece of information related toCEUR Workshop Proceedings and CEUR Make.
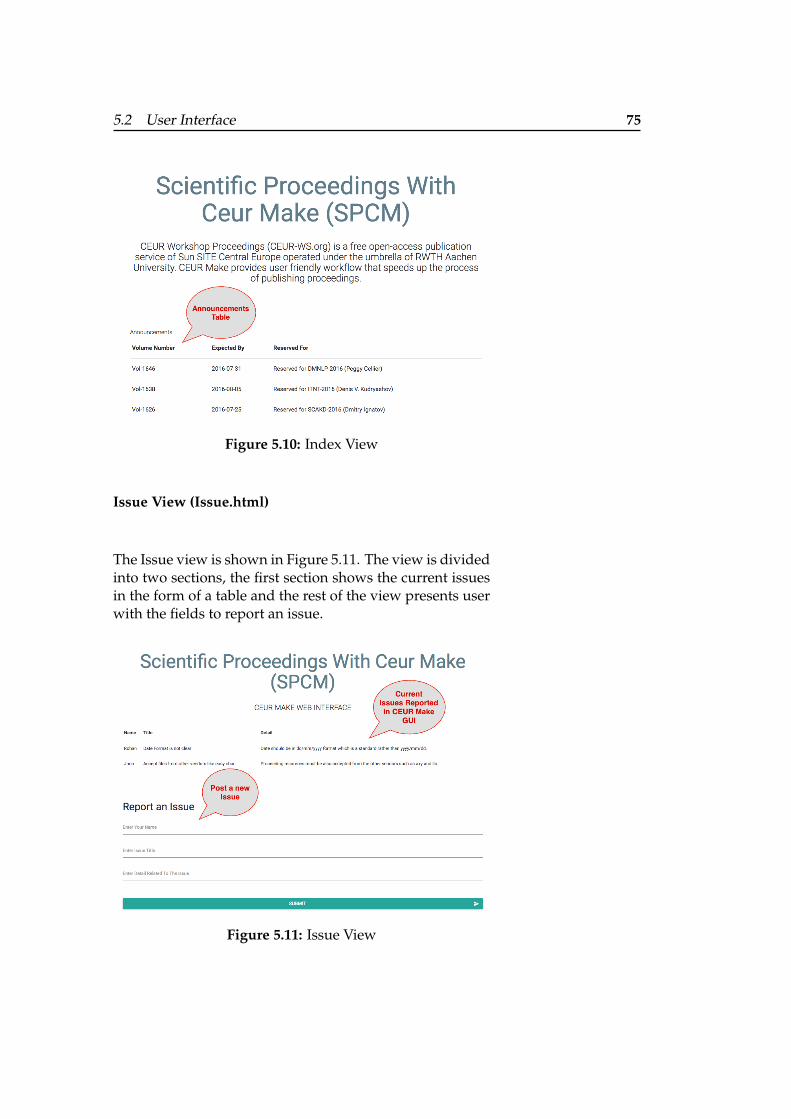
5.2 User Interface 75
Figure 5.10: Index View
Issue View (Issue.html)
The Issue view is shown in Figure 5.11. The view is dividedinto two sections, the first section shows the current issuesin the form of a table and the rest of the view presents userwith the fields to report an issue.
Figure 5.11: Issue View
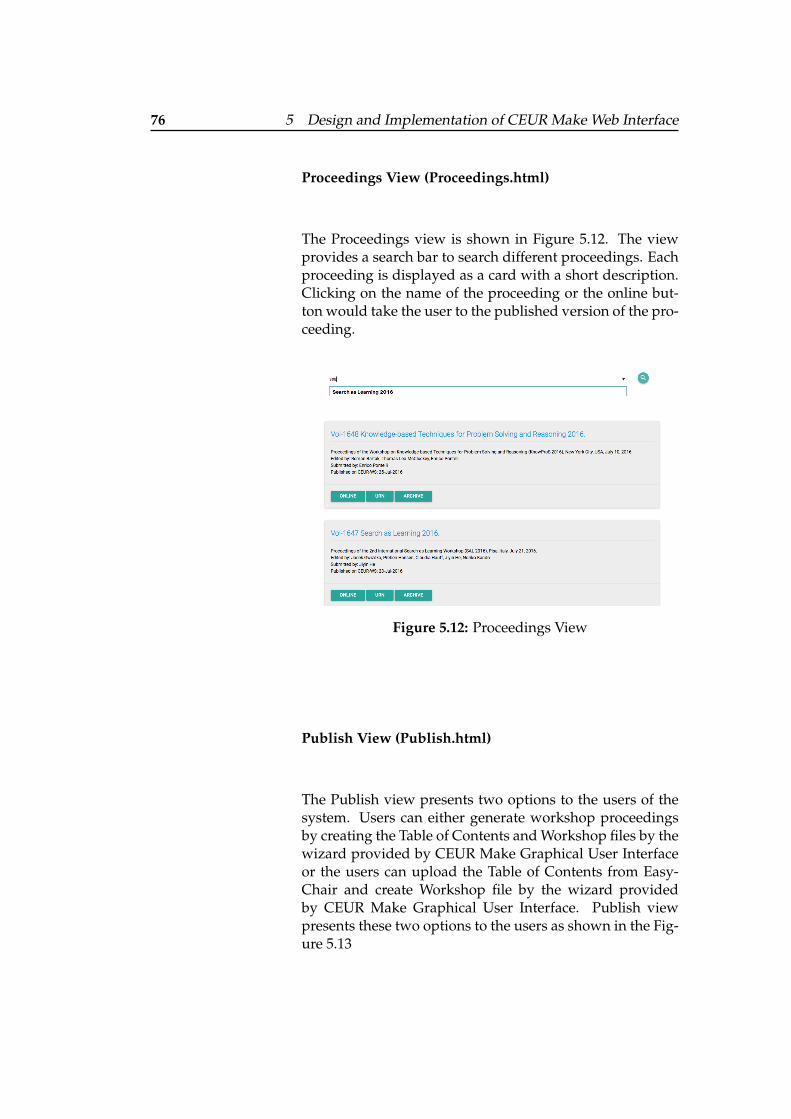
76 5 Design and Implementation of CEUR Make Web Interface
Proceedings View (Proceedings.html)
The Proceedings view is shown in Figure 5.12. The viewprovides a search bar to search different proceedings. Eachproceeding is displayed as a card with a short description.Clicking on the name of the proceeding or the online but-ton would take the user to the published version of the pro-ceeding.
Figure 5.12: Proceedings View
Publish View (Publish.html)
The Publish view presents two options to the users of thesystem. Users can either generate workshop proceedingsby creating the Table of Contents and Workshop files by thewizard provided by CEUR Make Graphical User Interfaceor the users can upload the Table of Contents from Easy-Chair and create Workshop file by the wizard providedby CEUR Make Graphical User Interface. Publish viewpresents these two options to the users as shown in the Fig-ure 5.13
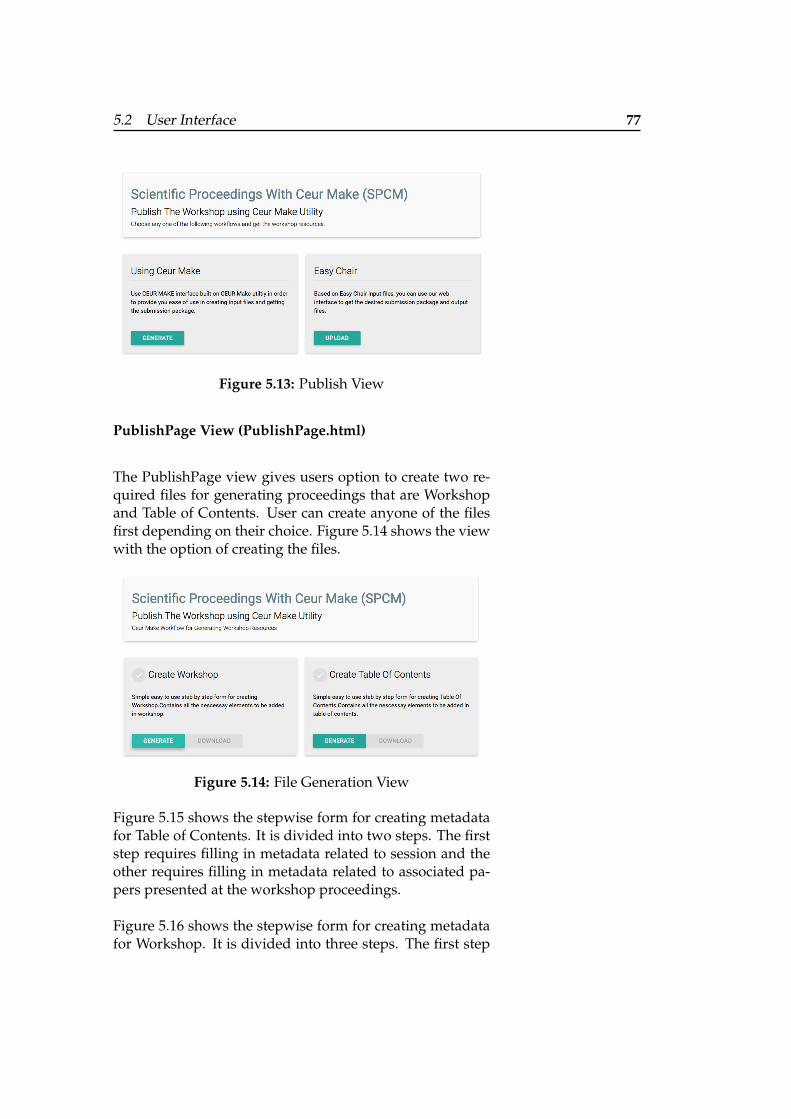
5.2 User Interface 77
Figure 5.13: Publish View
PublishPage View (PublishPage.html)
The PublishPage view gives users option to create two re-quired files for generating proceedings that are Workshopand Table of Contents. User can create anyone of the filesfirst depending on their choice. Figure 5.14 shows the viewwith the option of creating the files.
Figure 5.14: File Generation View
Figure 5.15 shows the stepwise form for creating metadatafor Table of Contents. It is divided into two steps. The firststep requires filling in metadata related to session and theother requires filling in metadata related to associated pa-pers presented at the workshop proceedings.
Figure 5.16 shows the stepwise form for creating metadatafor Workshop. It is divided into three steps. The first step

78 5 Design and Implementation of CEUR Make Web Interface
Figure 5.15: Table of Contents File Generation Wizard
requires filling in metadata related to workshop in general,the second step requires metadata of associated conferenceto the workshop and the third step requires the metadata ofassociated editors of the workshop proceedings.
Once the user have created the two files using the stepwiseforms. The user is presented with all the artifacts requiredfor publishing the workshop proceedings at CEUR Work-shop Proceedings. The final state is shown in the Figure5.17. The system presents with downloadable artifacts thatare Workshop file, Table of Contents file, Copyrights form,Zip archive, BibTex Database and Index.html. Workshopand Table of Contents files are the generated files using thestepwise forms. Index file is the generated workshop pro-ceedings layout. Copyrights form is generated using Work-shop metadata. Zip archive is the ready to submit packageat CEUR Workshop Proceedings. The important thing tonote in the interface is that in the Figure 5.14 the down-load button and the check sign were disabled because atthat time user was still suppose to create the Table of Con-tents file and Workshop file. While in the Figure 5.17 bothof them are enabled signifying the completion of steps.
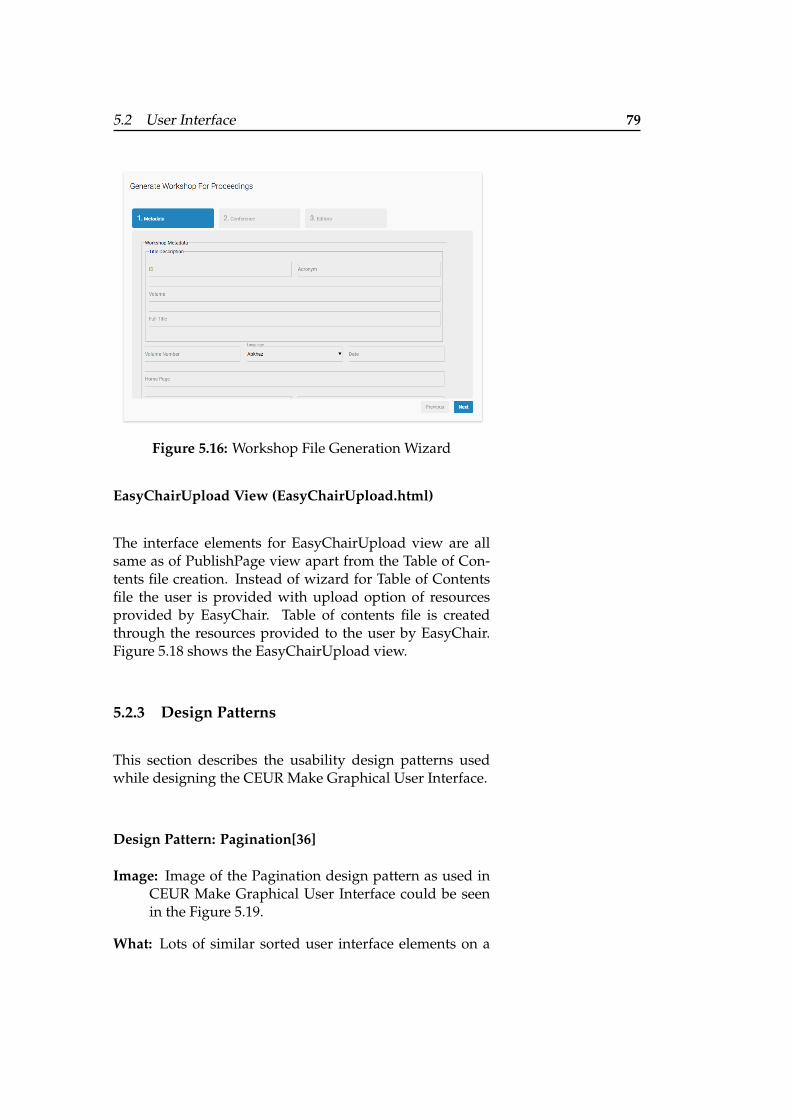
5.2 User Interface 79
Figure 5.16: Workshop File Generation Wizard
EasyChairUpload View (EasyChairUpload.html)
The interface elements for EasyChairUpload view are allsame as of PublishPage view apart from the Table of Con-tents file creation. Instead of wizard for Table of Contentsfile the user is provided with upload option of resourcesprovided by EasyChair. Table of contents file is createdthrough the resources provided to the user by EasyChair.Figure 5.18 shows the EasyChairUpload view.
5.2.3 Design Patterns
This section describes the usability design patterns usedwhile designing the CEUR Make Graphical User Interface.
Design Pattern: Pagination[36]
Image: Image of the Pagination design pattern as used inCEUR Make Graphical User Interface could be seenin the Figure 5.19.
What: Lots of similar sorted user interface elements on a
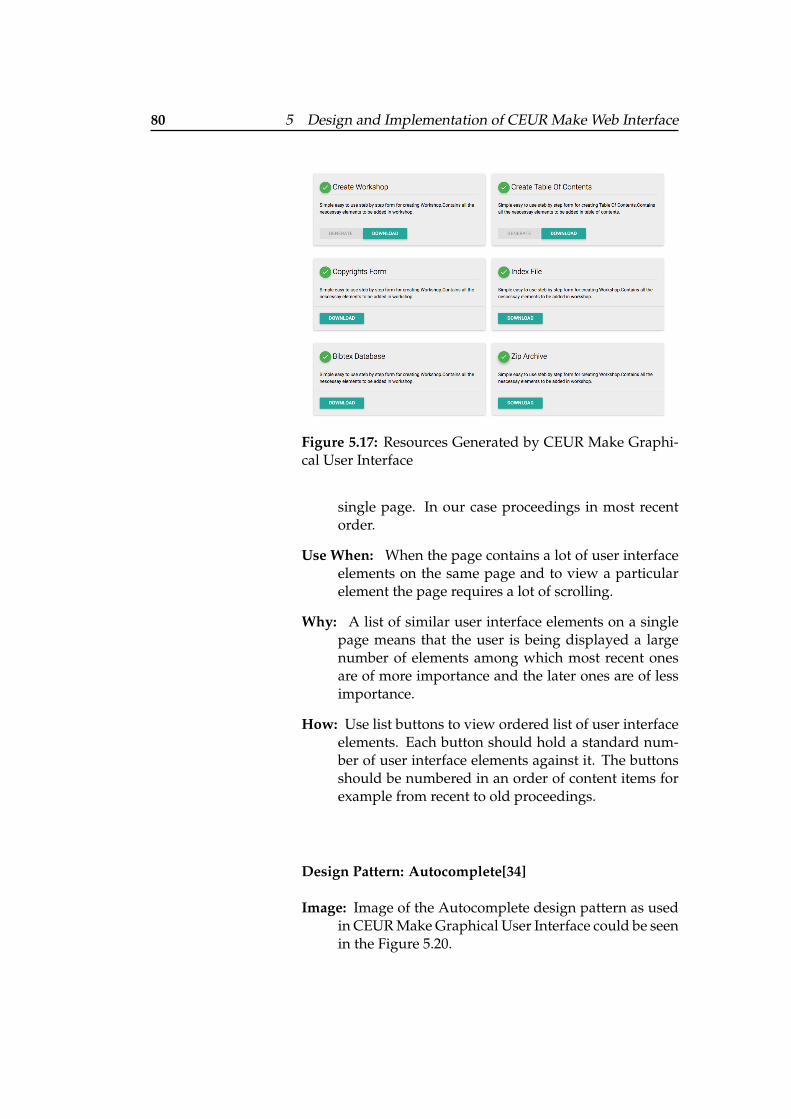
80 5 Design and Implementation of CEUR Make Web Interface
Figure 5.17: Resources Generated by CEUR Make Graphi-cal User Interface
single page. In our case proceedings in most recentorder.
Use When: When the page contains a lot of user interfaceelements on the same page and to view a particularelement the page requires a lot of scrolling.
Why: A list of similar user interface elements on a singlepage means that the user is being displayed a largenumber of elements among which most recent onesare of more importance and the later ones are of lessimportance.
How: Use list buttons to view ordered list of user interfaceelements. Each button should hold a standard num-ber of user interface elements against it. The buttonsshould be numbered in an order of content items forexample from recent to old proceedings.
Design Pattern: Autocomplete[34]
Image: Image of the Autocomplete design pattern as usedin CEUR Make Graphical User Interface could be seenin the Figure 5.20.
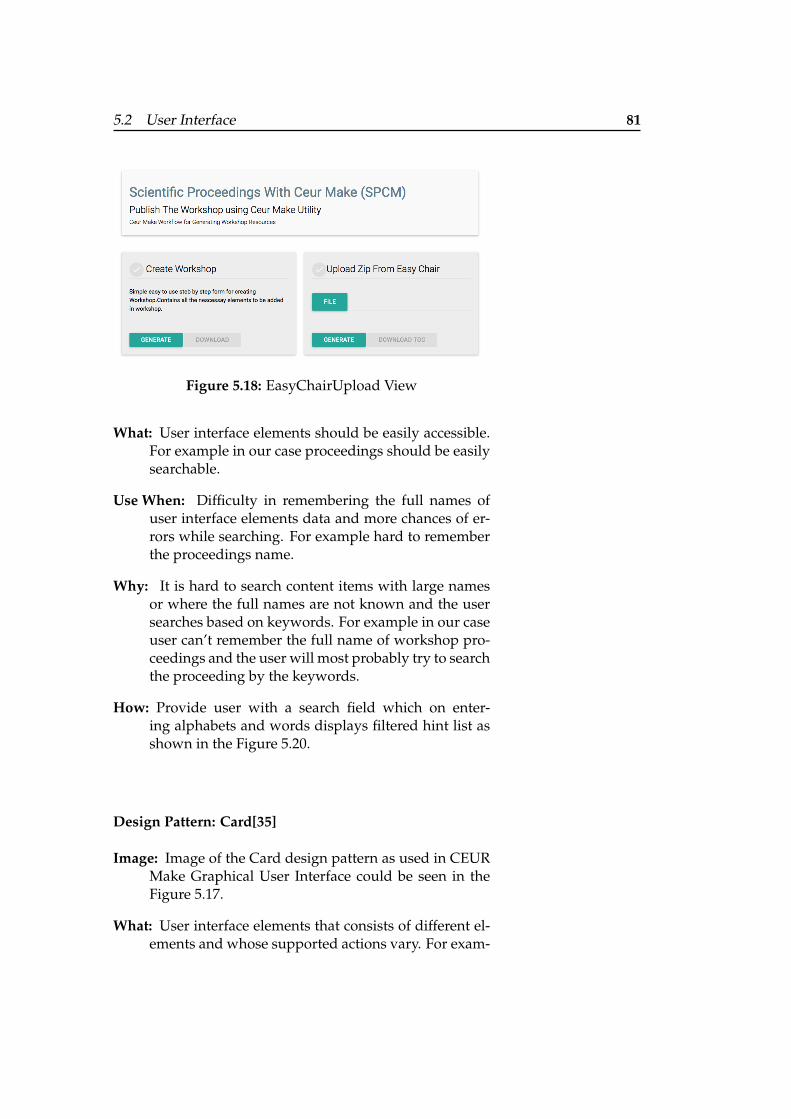
5.2 User Interface 81
Figure 5.18: EasyChairUpload View
What: User interface elements should be easily accessible.For example in our case proceedings should be easilysearchable.
Use When: Difficulty in remembering the full names ofuser interface elements data and more chances of er-rors while searching. For example hard to rememberthe proceedings name.
Why: It is hard to search content items with large namesor where the full names are not known and the usersearches based on keywords. For example in our caseuser can’t remember the full name of workshop pro-ceedings and the user will most probably try to searchthe proceeding by the keywords.
How: Provide user with a search field which on enter-ing alphabets and words displays filtered hint list asshown in the Figure 5.20.
Design Pattern: Card[35]
Image: Image of the Card design pattern as used in CEURMake Graphical User Interface could be seen in theFigure 5.17.
What: User interface elements that consists of different el-ements and whose supported actions vary. For exam-
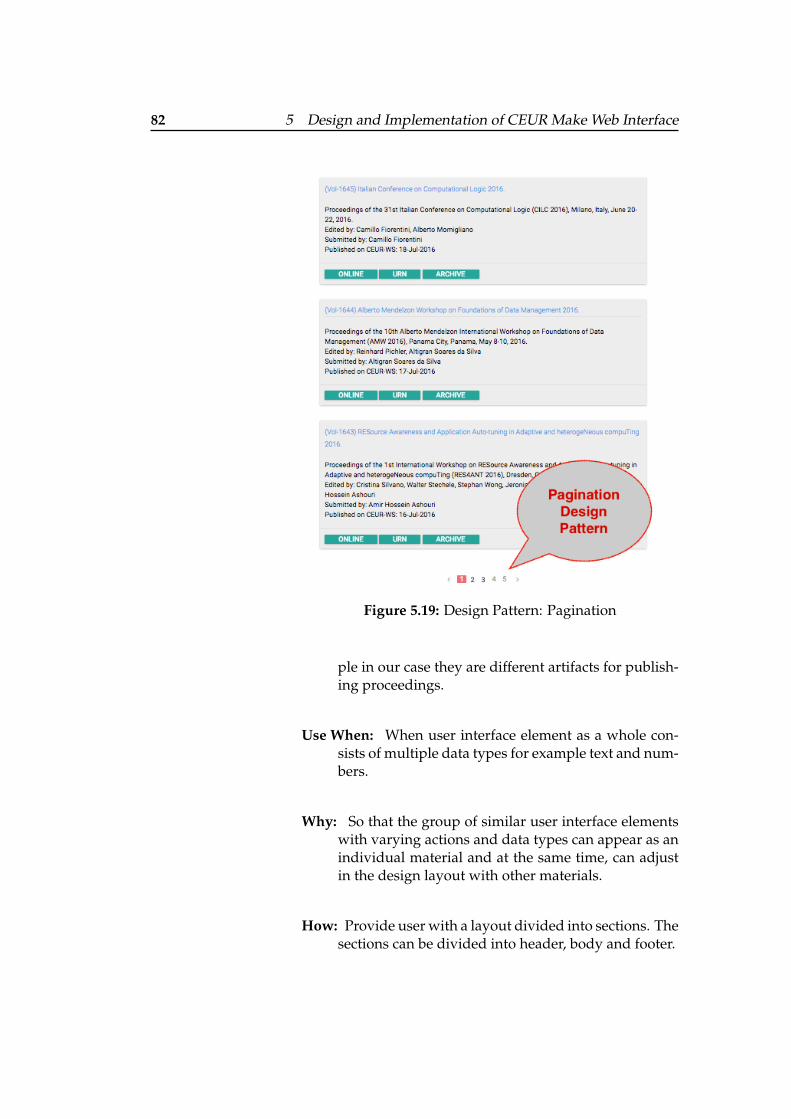
82 5 Design and Implementation of CEUR Make Web Interface
Figure 5.19: Design Pattern: Pagination
ple in our case they are different artifacts for publish-ing proceedings.
Use When: When user interface element as a whole con-sists of multiple data types for example text and num-bers.
Why: So that the group of similar user interface elementswith varying actions and data types can appear as anindividual material and at the same time, can adjustin the design layout with other materials.
How: Provide user with a layout divided into sections. Thesections can be divided into header, body and footer.
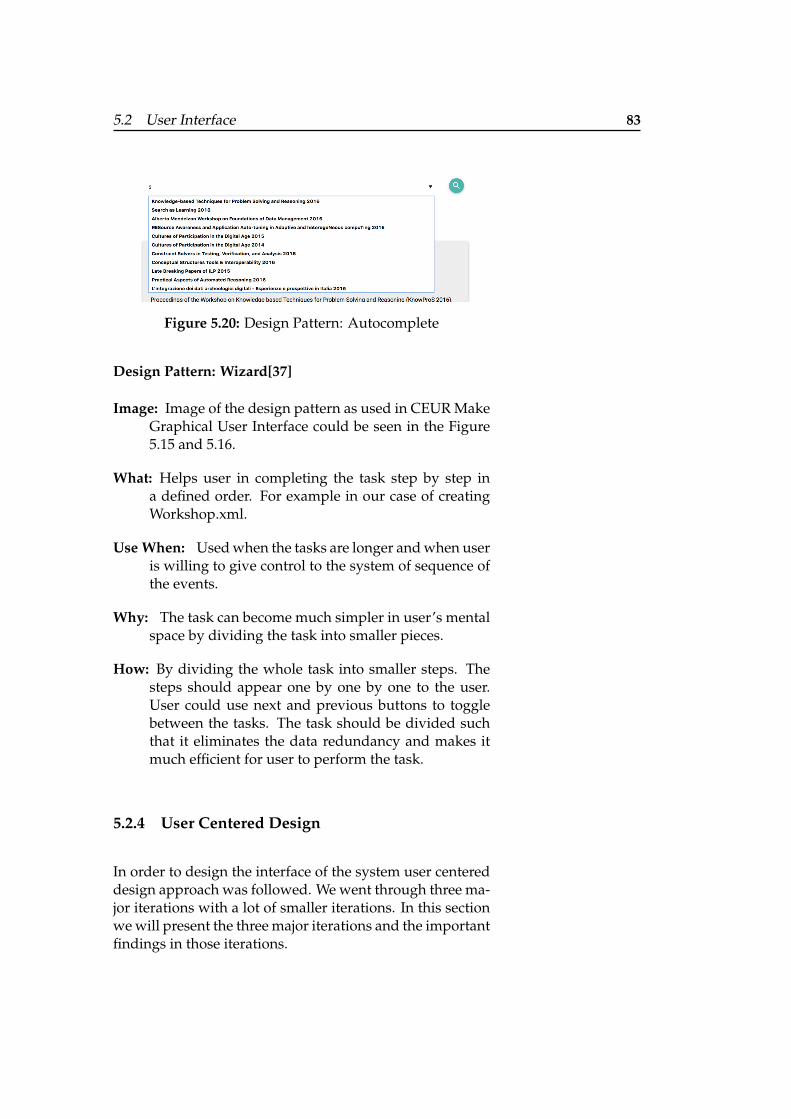
5.2 User Interface 83
Figure 5.20: Design Pattern: Autocomplete
Design Pattern: Wizard[37]
Image: Image of the design pattern as used in CEUR MakeGraphical User Interface could be seen in the Figure5.15 and 5.16.
What: Helps user in completing the task step by step ina defined order. For example in our case of creatingWorkshop.xml.
Use When: Used when the tasks are longer and when useris willing to give control to the system of sequence ofthe events.
Why: The task can become much simpler in user’s mentalspace by dividing the task into smaller pieces.
How: By dividing the whole task into smaller steps. Thesteps should appear one by one by one to the user.User could use next and previous buttons to togglebetween the tasks. The task should be divided suchthat it eliminates the data redundancy and makes itmuch efficient for user to perform the task.
5.2.4 User Centered Design
In order to design the interface of the system user centereddesign approach was followed. We went through three ma-jor iterations with a lot of smaller iterations. In this sectionwe will present the three major iterations and the importantfindings in those iterations.
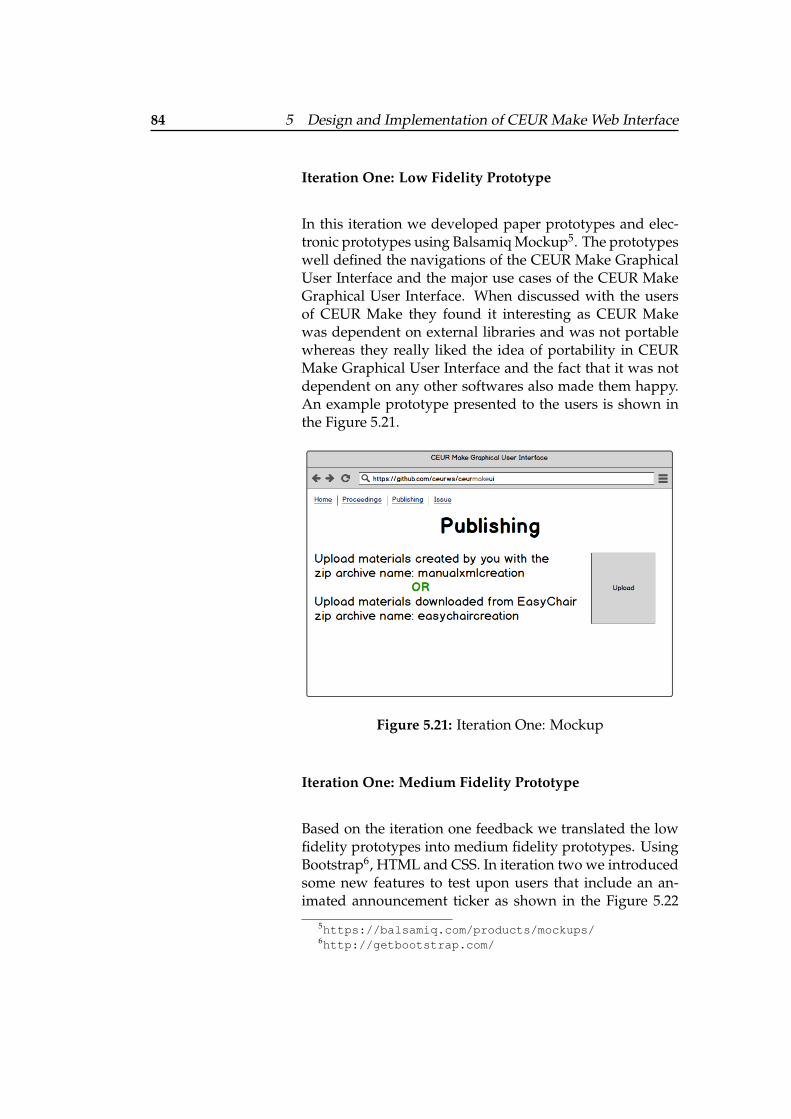
84 5 Design and Implementation of CEUR Make Web Interface
Iteration One: Low Fidelity Prototype
In this iteration we developed paper prototypes and elec-tronic prototypes using Balsamiq Mockup5. The prototypeswell defined the navigations of the CEUR Make GraphicalUser Interface and the major use cases of the CEUR MakeGraphical User Interface. When discussed with the usersof CEUR Make they found it interesting as CEUR Makewas dependent on external libraries and was not portablewhereas they really liked the idea of portability in CEURMake Graphical User Interface and the fact that it was notdependent on any other softwares also made them happy.An example prototype presented to the users is shown inthe Figure 5.21.
Figure 5.21: Iteration One: Mockup
Iteration One: Medium Fidelity Prototype
Based on the iteration one feedback we translated the lowfidelity prototypes into medium fidelity prototypes. UsingBootstrap6, HTML and CSS. In iteration two we introducedsome new features to test upon users that include an an-imated announcement ticker as shown in the Figure 5.22
5https://balsamiq.com/products/mockups/6http://getbootstrap.com/
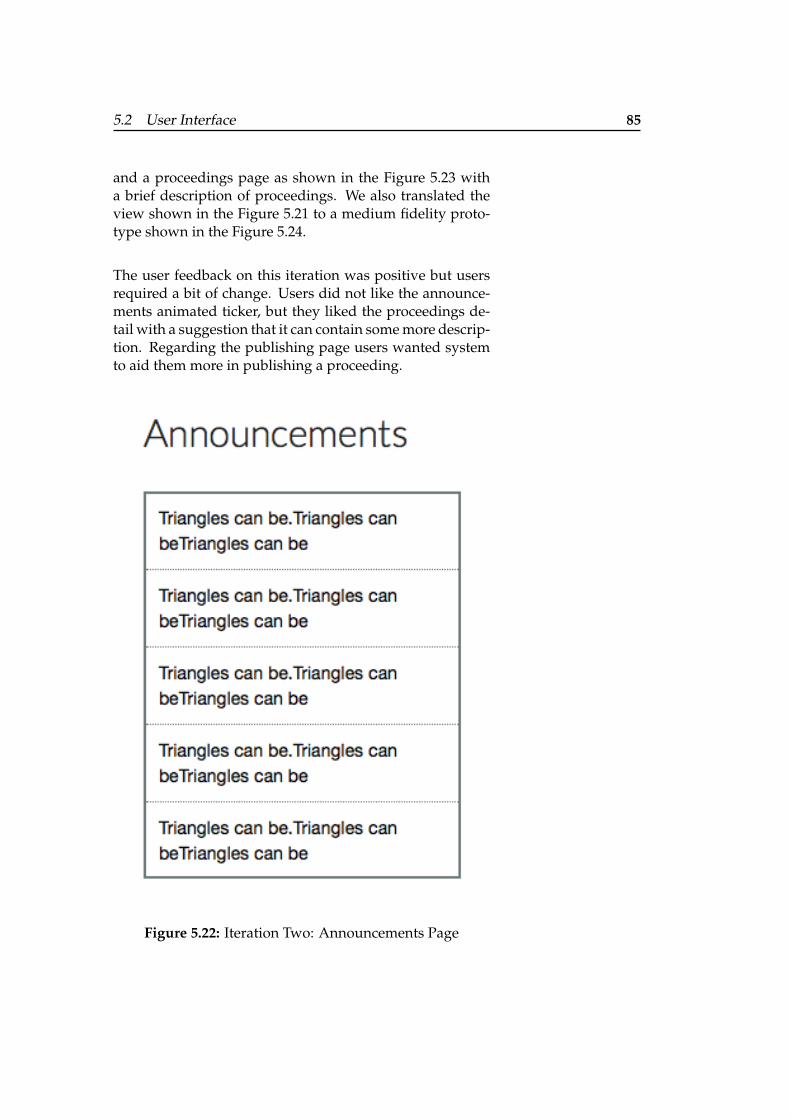
5.2 User Interface 85
and a proceedings page as shown in the Figure 5.23 witha brief description of proceedings. We also translated theview shown in the Figure 5.21 to a medium fidelity proto-type shown in the Figure 5.24.
The user feedback on this iteration was positive but usersrequired a bit of change. Users did not like the announce-ments animated ticker, but they liked the proceedings de-tail with a suggestion that it can contain some more descrip-tion. Regarding the publishing page users wanted systemto aid them more in publishing a proceeding.
Figure 5.22: Iteration Two: Announcements Page
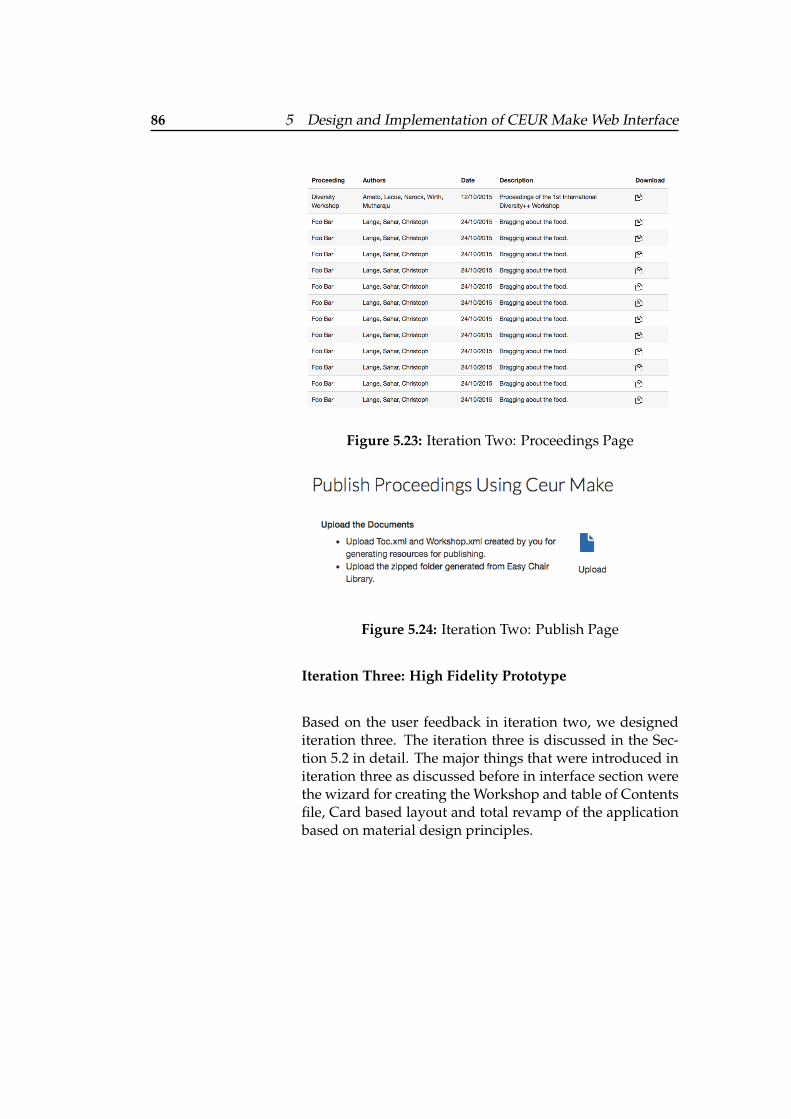
86 5 Design and Implementation of CEUR Make Web Interface
Figure 5.23: Iteration Two: Proceedings Page
Figure 5.24: Iteration Two: Publish Page
Iteration Three: High Fidelity Prototype
Based on the user feedback in iteration two, we designediteration three. The iteration three is discussed in the Sec-tion 5.2 in detail. The major things that were introduced initeration three as discussed before in interface section werethe wizard for creating the Workshop and table of Contentsfile, Card based layout and total revamp of the applicationbased on material design principles.
87
Chapter 6
Usability Evaluation andComparative Evaluationof CEUR Make GUI
"Even the best designers produce successfulproducts only if their designs solve the rightproblems. A wonderful interface to the wrongfeatures will fail." - Jakob Nielsen
In this chapter we will evaluate the usability of our newsystem, CEUR Make Graphical User Interface that we pre-sented in the previous chapter. Then we will compare theusability results of CEUR Make with CEUR Make Graphi-cal User Interface.
6.1 Usability Evaluation of CEUR MakeGraphical User Interface
In this section we will describe the results attained duringthe usability testing of CEUR Make Graphical User Inter-face. The approach taken is described in previous section4.1.
88 6 Usability Evaluation and Comparative Evaluation of CEUR Make GUI
The techniques used and the stages in which usability testswere recorded are the same as discussed in Chapter 4, Sec-tion 4.2. We discuss these in the following sections:
6.1.1 Participants
As we discussed in Chapter 4 in Section 4.1.1 that wechoose within subject design, so our users remain the sameas they were for the usability test of CEUR Make. To gothrough the details of participants who participated in theusability test of CEUR Make Graphical User Interface, youcan refer to Chapter 4, Section 4.2.1.
As in CEUR Make usability test the first 6 users participatedin the Think Aloud Design setup and the other 6 in Ques-tion Asking Design setup. Likewise, in the usability test ofCEUR Make Graphical User Interface the same 6 users par-ticipated in the Think Aloud Design setup and the other sixin the Question Asking Design setup.
6.1.2 Usability Evaluation Interview
The results of the usability evaluation interview could bedivided into two sections:
• Quantitative: Task Completion Time
• Qualitative: Notes, Feedback
Both of these results are presented in following sections:
Quantitative Results
The experiment was performed in the same manner as incase of CEUR Make. The time taken to complete each taskfor all the six users is presented in detail in Appendix D sec-
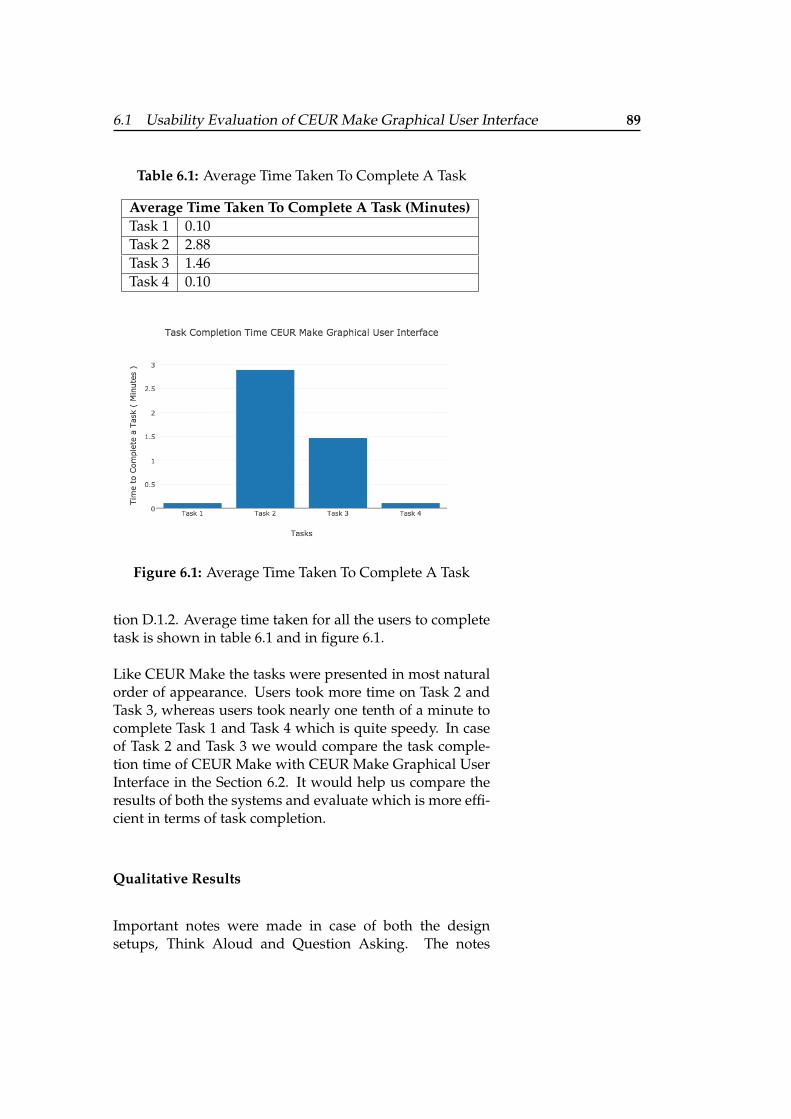
6.1 Usability Evaluation of CEUR Make Graphical User Interface 89
Table 6.1: Average Time Taken To Complete A Task
Average Time Taken To Complete A Task (Minutes)Task 1 0.10Task 2 2.88Task 3 1.46Task 4 0.10
Figure 6.1: Average Time Taken To Complete A Task
tion D.1.2. Average time taken for all the users to completetask is shown in table 6.1 and in figure 6.1.
Like CEUR Make the tasks were presented in most naturalorder of appearance. Users took more time on Task 2 andTask 3, whereas users took nearly one tenth of a minute tocomplete Task 1 and Task 4 which is quite speedy. In caseof Task 2 and Task 3 we would compare the task comple-tion time of CEUR Make with CEUR Make Graphical UserInterface in the Section 6.2. It would help us compare theresults of both the systems and evaluate which is more effi-cient in terms of task completion.
Qualitative Results
Important notes were made in case of both the designsetups, Think Aloud and Question Asking. The notes
90 6 Usability Evaluation and Comparative Evaluation of CEUR Make GUI
recorded states the problems faced by the users and thethings they liked about the system.Detailed qualitative re-sults are presented in the Appendix D.
So we categorized the qualitative results into different sec-tions such as learnability, navigation, error and help, porta-bility, interface, dependency and feature in order to quan-tify the qualitative results.
The positive feedback can be categorized into six main sec-tions that are learnability, navigation, portability, error, in-terface and dependency as shown in the Figure 6.2. Thehighest feedback as shown in the Figure 6.2 is for interface.Users felt that the interface design was good and it wasoverall good experience to work with CEUR Make Graph-ical User Interface. Learnability and Navigation got sec-ond highest feedback. Users thought that the system waseasy to adapt to and there was not much learning requiredbefore using the system. Users also felt that the naviga-tional elements of user interface were designed keeping inmind their natural workflow. Dependency and Error gotequally good response. Users felt good that the system wasnot dependent on any other systems as far client side ofthe system is concerned and it helped them commit less er-rors while performing the tasks. Users also appreciated theportability of the system, they felt good that it was a webinterface that can be opened on any system and environ-ment.
The negative feedback can be categorized into two mainsections that are feature and navigation as you can see inthe Figure 6.3. The highest negative response from userswas on features. Users felt that the system had huge roomfor improvement in terms of features. Users had problemdealing with the navigation, as they felt that the state ofthe system should be stored for long navigations. This ispresented as future work in the Chapter 7.
More details of qualitative results could be viewed in theAppendix D, Section D.1.2 and Section D.2.2.
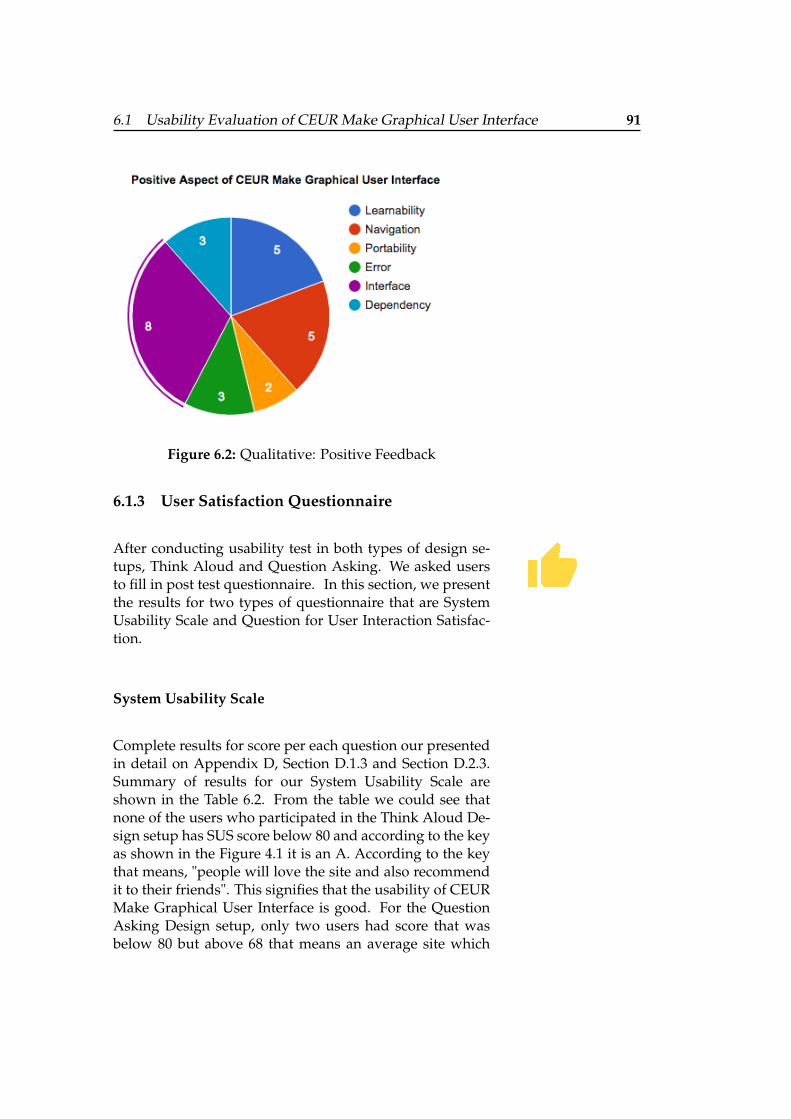
6.1 Usability Evaluation of CEUR Make Graphical User Interface 91
Figure 6.2: Qualitative: Positive Feedback
6.1.3 User Satisfaction Questionnaire
After conducting usability test in both types of design se-tups, Think Aloud and Question Asking. We asked usersto fill in post test questionnaire. In this section, we presentthe results for two types of questionnaire that are SystemUsability Scale and Question for User Interaction Satisfac-tion.
System Usability Scale
Complete results for score per each question our presentedin detail on Appendix D, Section D.1.3 and Section D.2.3.Summary of results for our System Usability Scale areshown in the Table 6.2. From the table we could see thatnone of the users who participated in the Think Aloud De-sign setup has SUS score below 80 and according to the keyas shown in the Figure 4.1 it is an A. According to the keythat means, "people will love the site and also recommendit to their friends". This signifies that the usability of CEURMake Graphical User Interface is good. For the QuestionAsking Design setup, only two users had score that wasbelow 80 but above 68 that means an average site which
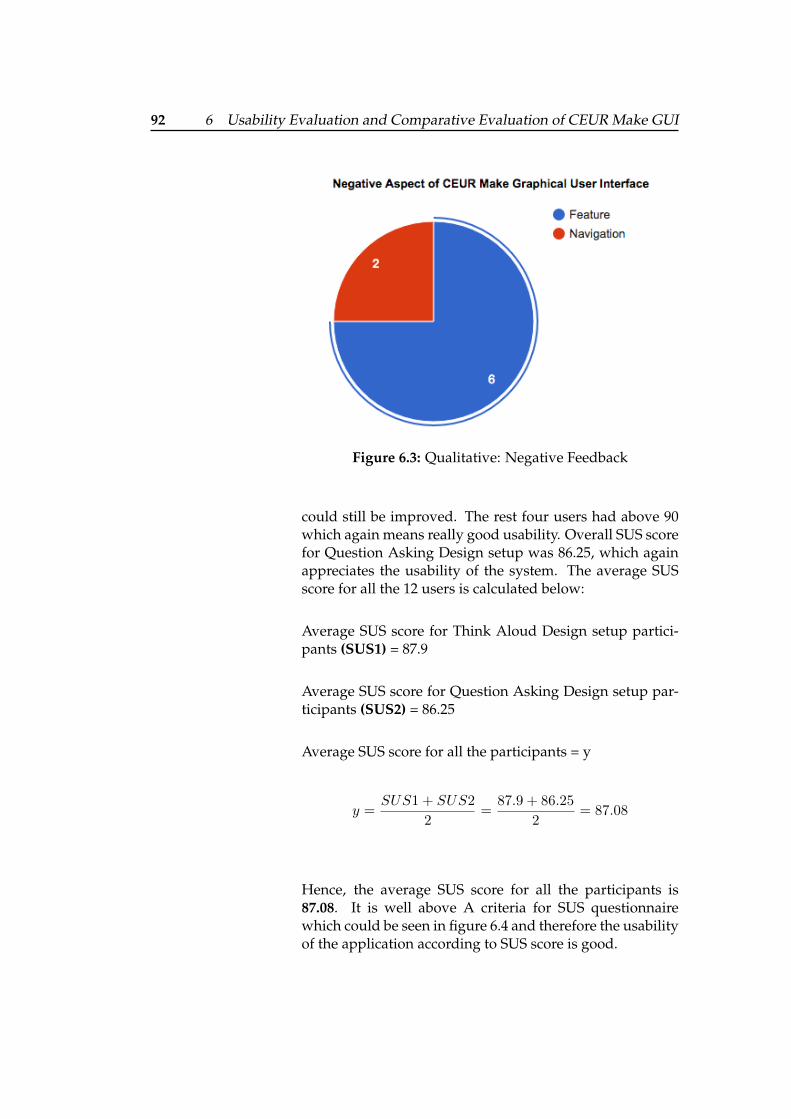
92 6 Usability Evaluation and Comparative Evaluation of CEUR Make GUI
Figure 6.3: Qualitative: Negative Feedback
could still be improved. The rest four users had above 90which again means really good usability. Overall SUS scorefor Question Asking Design setup was 86.25, which againappreciates the usability of the system. The average SUSscore for all the 12 users is calculated below:
Average SUS score for Think Aloud Design setup partici-pants (SUS1) = 87.9
Average SUS score for Question Asking Design setup par-ticipants (SUS2) = 86.25
Average SUS score for all the participants = y
y =SUS1 + SUS2
2=
87.9 + 86.25
2= 87.08
Hence, the average SUS score for all the participants is87.08. It is well above A criteria for SUS questionnairewhich could be seen in figure 6.4 and therefore the usabilityof the application according to SUS score is good.
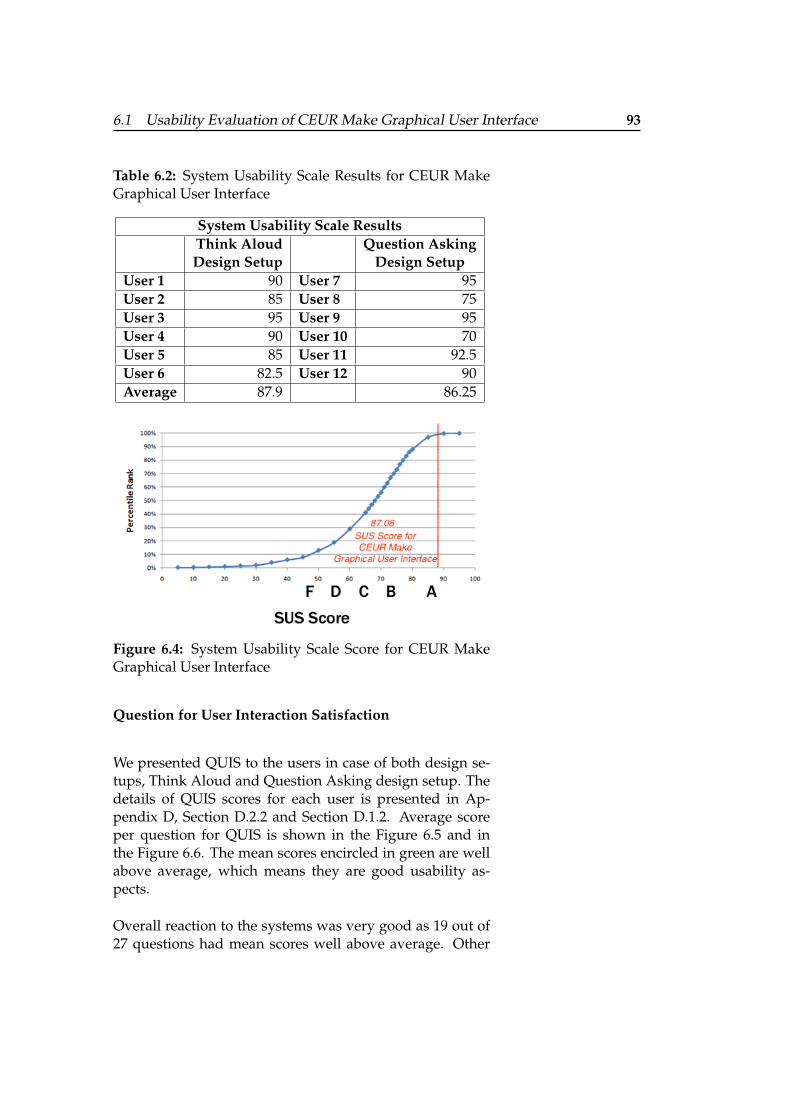
6.1 Usability Evaluation of CEUR Make Graphical User Interface 93
Table 6.2: System Usability Scale Results for CEUR MakeGraphical User Interface
System Usability Scale ResultsThink AloudDesign Setup
Question AskingDesign Setup
User 1 90 User 7 95User 2 85 User 8 75User 3 95 User 9 95User 4 90 User 10 70User 5 85 User 11 92.5User 6 82.5 User 12 90Average 87.9 86.25
Figure 6.4: System Usability Scale Score for CEUR MakeGraphical User Interface
Question for User Interaction Satisfaction
We presented QUIS to the users in case of both design se-tups, Think Aloud and Question Asking design setup. Thedetails of QUIS scores for each user is presented in Ap-pendix D, Section D.2.2 and Section D.1.2. Average scoreper question for QUIS is shown in the Figure 6.5 and inthe Figure 6.6. The mean scores encircled in green are wellabove average, which means they are good usability as-pects.
Overall reaction to the systems was very good as 19 out of27 questions had mean scores well above average. Other
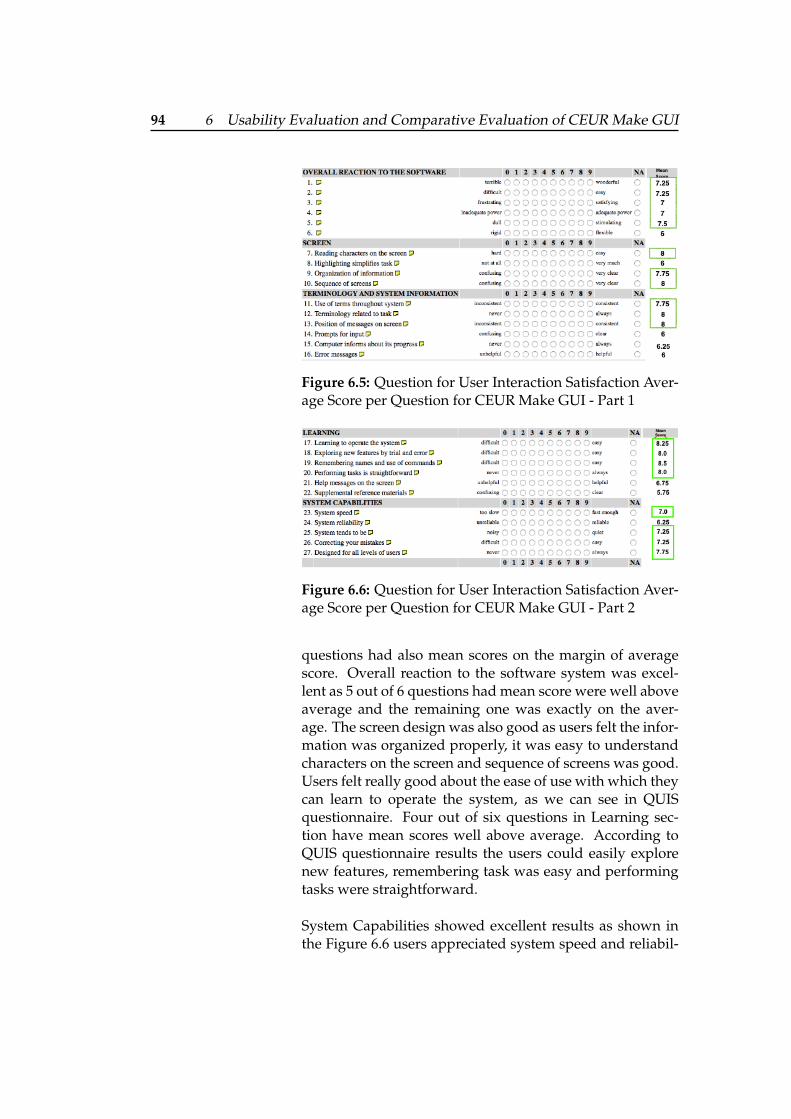
94 6 Usability Evaluation and Comparative Evaluation of CEUR Make GUI
Figure 6.5: Question for User Interaction Satisfaction Aver-age Score per Question for CEUR Make GUI - Part 1
Figure 6.6: Question for User Interaction Satisfaction Aver-age Score per Question for CEUR Make GUI - Part 2
questions had also mean scores on the margin of averagescore. Overall reaction to the software system was excel-lent as 5 out of 6 questions had mean score were well aboveaverage and the remaining one was exactly on the aver-age. The screen design was also good as users felt the infor-mation was organized properly, it was easy to understandcharacters on the screen and sequence of screens was good.Users felt really good about the ease of use with which theycan learn to operate the system, as we can see in QUISquestionnaire. Four out of six questions in Learning sec-tion have mean scores well above average. According toQUIS questionnaire results the users could easily explorenew features, remembering task was easy and performingtasks were straightforward.
System Capabilities showed excellent results as shown inthe Figure 6.6 users appreciated system speed and reliabil-
6.2 Comparison of CEUR Make Graphical User Interface with CEUR Make 95
ity. Users also appreciated that the system was designedfor all level of users and that it was easy to correct mistakesusing CEUR Make Graphical User Interface. Terminologyand System Information section had 3 questions with meanscores well above average and other 3 on the margin. Over-all, QUIS questionnaire had mean scores above averageand it signifies good usability of the CEUR Make Graphi-cal User Interface.
6.2 Comparison of CEUR Make GraphicalUser Interface with CEUR Make
In this section we will compare the usability test results ofCEUR Make with CEUR Make Graphical User Interface.We will compare the results step by step in which the us-ability evaluations were conducted. Statistics and evalua-tion results for Participants, Qualitative analysis, Quanti-tative analysis, System Usability Scale questionnaire andQuestion for User Interaction Satisfaction questionnairewill be presented in this section.
6.2.1 Participants
12 participants participated in both the usability evaluationtests. Participants for both the usability tests were the sameas discussed in this chapter and chapter 4. This was done inorder to compare the improvement of CEUR Make Graph-ical User Interface over CEUR Make. In this way partici-pants had a reference point of what to compare with. Thiswas also important for quantitative result analysis tp ex-plore that what was their task completion rate on CEURMake and what was their task completion rate on CEURMake Graphical User Interface?
96 6 Usability Evaluation and Comparative Evaluation of CEUR Make GUI
6.2.2 Quantitative Results Comparison
We will compare the task completion time in this section.The comparison is done task by task in order to comparethe time required to complete a task with CEUR Make andCEUR Make Graphical User Interface.
TASK 1 Task 1 was to initiate generation of a proceeding.It was simple as in both kind of systems it was one steptask. For CEUR Make users were supposed to enter a com-mand and for CEUR Make Graphical User Interface userswere supposed to press a button. As it was fairly sim-ple, we don’t see a significant difference in task completiontime for this task as shown in the Figure 6.7. Average timetaken for CEUR Make was 0.10 minute whereas for CEURMake Graphical User Interface it was 0.13 minute. It wasmarginally high for the GUI but it can be ignored as GUIalways take more time than running a command line util-ity.
TASK 2 Task 2 was the hardest task, it required creationof workshop.xml file. This was the task where users spentmost of their time as we can see from the Figure 6.7. Wecan see significant reduction in task completion time in caseof CEUR Make Graphical User Interface. On an averageit took users 2.88 minutes to complete task 2 with CEURMake Graphical User Interface whereas it took 4.77 min-utes on an average with CEUR Make. Hence, we can seeit as a significant improvement with our new CEUR MakeGraphical User Interface.
TASK 3 Task 3 was similar to task 2 as it required creationof table of contents file creation. Just like task 2, for task 3also users took less time to complete the task with CEURMake Graphical User Interface then CEUR Make. We canagain see a significant time reduction in task completionwith CEUR Make Graphical User Interface as shown in theFigure 6.7.
TASK 4 Task 4 was to search a proceeding published atCEUR Workshop Proceedings. In this case with old portalusers took almost 0.76 minute to find a proceeding where as
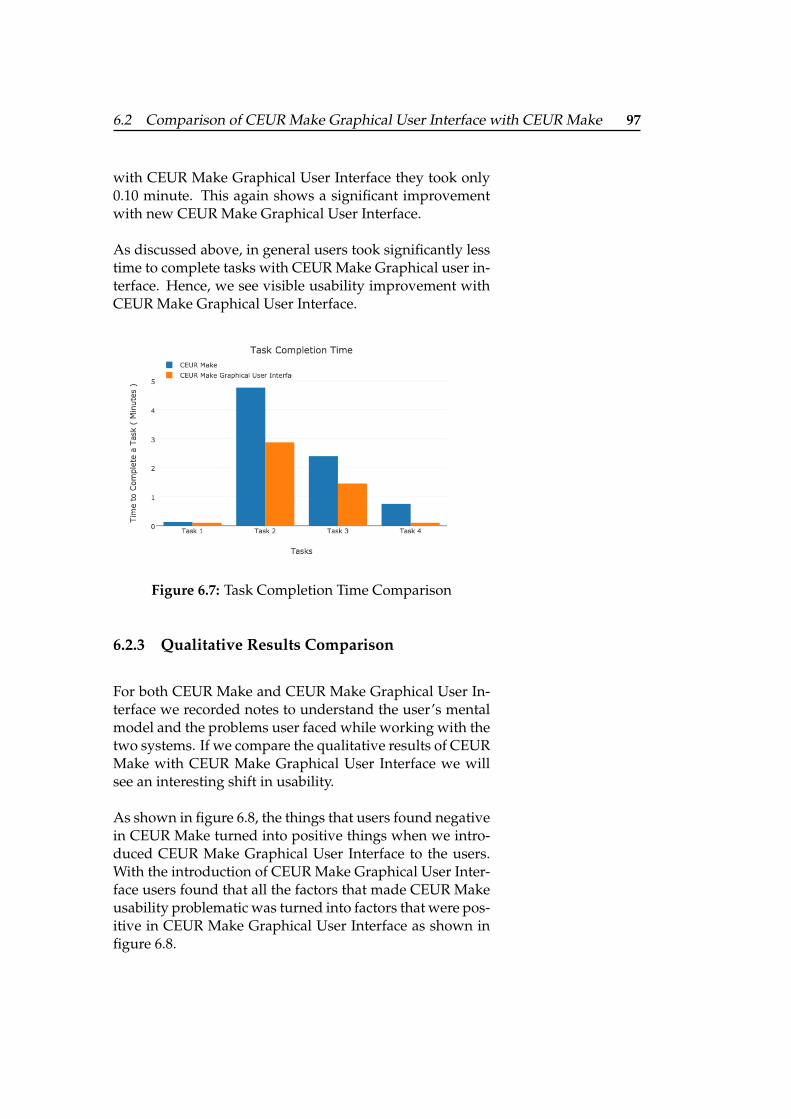
6.2 Comparison of CEUR Make Graphical User Interface with CEUR Make 97
with CEUR Make Graphical User Interface they took only0.10 minute. This again shows a significant improvementwith new CEUR Make Graphical User Interface.
As discussed above, in general users took significantly lesstime to complete tasks with CEUR Make Graphical user in-terface. Hence, we see visible usability improvement withCEUR Make Graphical User Interface.
Figure 6.7: Task Completion Time Comparison
6.2.3 Qualitative Results Comparison
For both CEUR Make and CEUR Make Graphical User In-terface we recorded notes to understand the user’s mentalmodel and the problems user faced while working with thetwo systems. If we compare the qualitative results of CEURMake with CEUR Make Graphical User Interface we willsee an interesting shift in usability.
As shown in figure 6.8, the things that users found negativein CEUR Make turned into positive things when we intro-duced CEUR Make Graphical User Interface to the users.With the introduction of CEUR Make Graphical User Inter-face users found that all the factors that made CEUR Makeusability problematic was turned into factors that were pos-itive in CEUR Make Graphical User Interface as shown infigure 6.8.
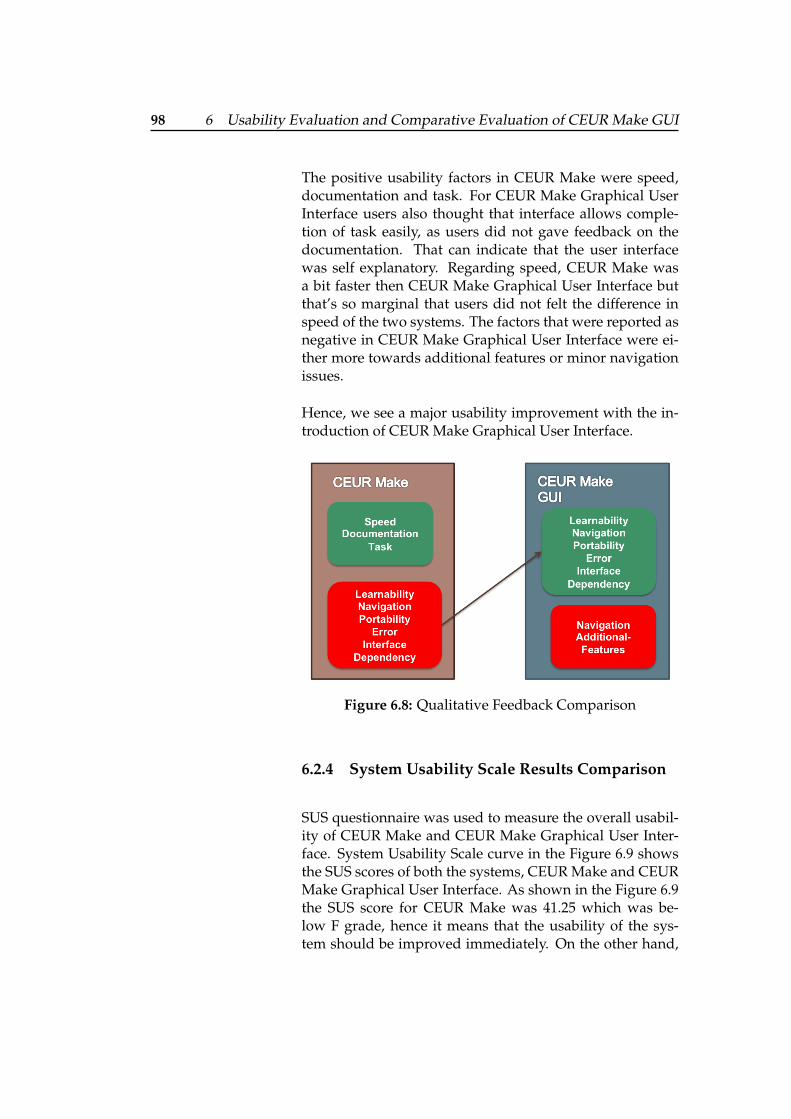
98 6 Usability Evaluation and Comparative Evaluation of CEUR Make GUI
The positive usability factors in CEUR Make were speed,documentation and task. For CEUR Make Graphical UserInterface users also thought that interface allows comple-tion of task easily, as users did not gave feedback on thedocumentation. That can indicate that the user interfacewas self explanatory. Regarding speed, CEUR Make wasa bit faster then CEUR Make Graphical User Interface butthat’s so marginal that users did not felt the difference inspeed of the two systems. The factors that were reported asnegative in CEUR Make Graphical User Interface were ei-ther more towards additional features or minor navigationissues.
Hence, we see a major usability improvement with the in-troduction of CEUR Make Graphical User Interface.
Figure 6.8: Qualitative Feedback Comparison
6.2.4 System Usability Scale Results Comparison
SUS questionnaire was used to measure the overall usabil-ity of CEUR Make and CEUR Make Graphical User Inter-face. System Usability Scale curve in the Figure 6.9 showsthe SUS scores of both the systems, CEUR Make and CEURMake Graphical User Interface. As shown in the Figure 6.9the SUS score for CEUR Make was 41.25 which was be-low F grade, hence it means that the usability of the sys-tem should be improved immediately. On the other hand,
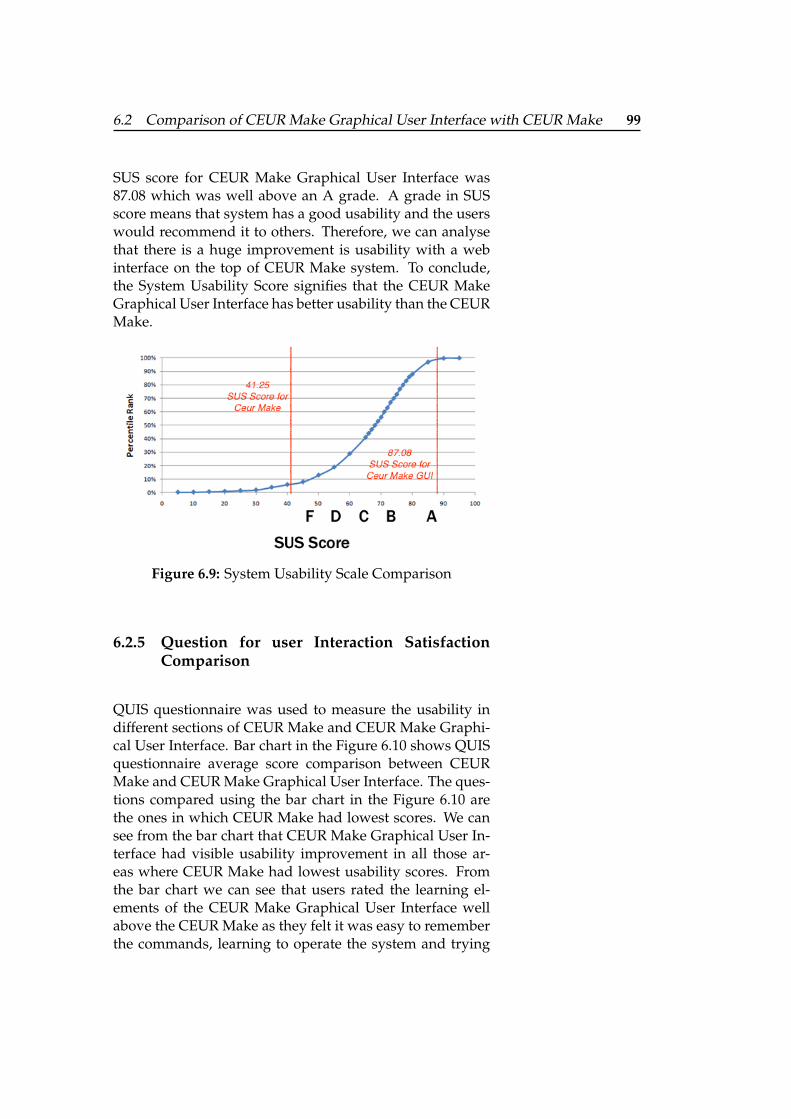
6.2 Comparison of CEUR Make Graphical User Interface with CEUR Make 99
SUS score for CEUR Make Graphical User Interface was87.08 which was well above an A grade. A grade in SUSscore means that system has a good usability and the userswould recommend it to others. Therefore, we can analysethat there is a huge improvement is usability with a webinterface on the top of CEUR Make system. To conclude,the System Usability Score signifies that the CEUR MakeGraphical User Interface has better usability than the CEURMake.
Figure 6.9: System Usability Scale Comparison
6.2.5 Question for user Interaction SatisfactionComparison
QUIS questionnaire was used to measure the usability indifferent sections of CEUR Make and CEUR Make Graphi-cal User Interface. Bar chart in the Figure 6.10 shows QUISquestionnaire average score comparison between CEURMake and CEUR Make Graphical User Interface. The ques-tions compared using the bar chart in the Figure 6.10 arethe ones in which CEUR Make had lowest scores. We cansee from the bar chart that CEUR Make Graphical User In-terface had visible usability improvement in all those ar-eas where CEUR Make had lowest usability scores. Fromthe bar chart we can see that users rated the learning el-ements of the CEUR Make Graphical User Interface wellabove the CEUR Make as they felt it was easy to rememberthe commands, learning to operate the system and trying
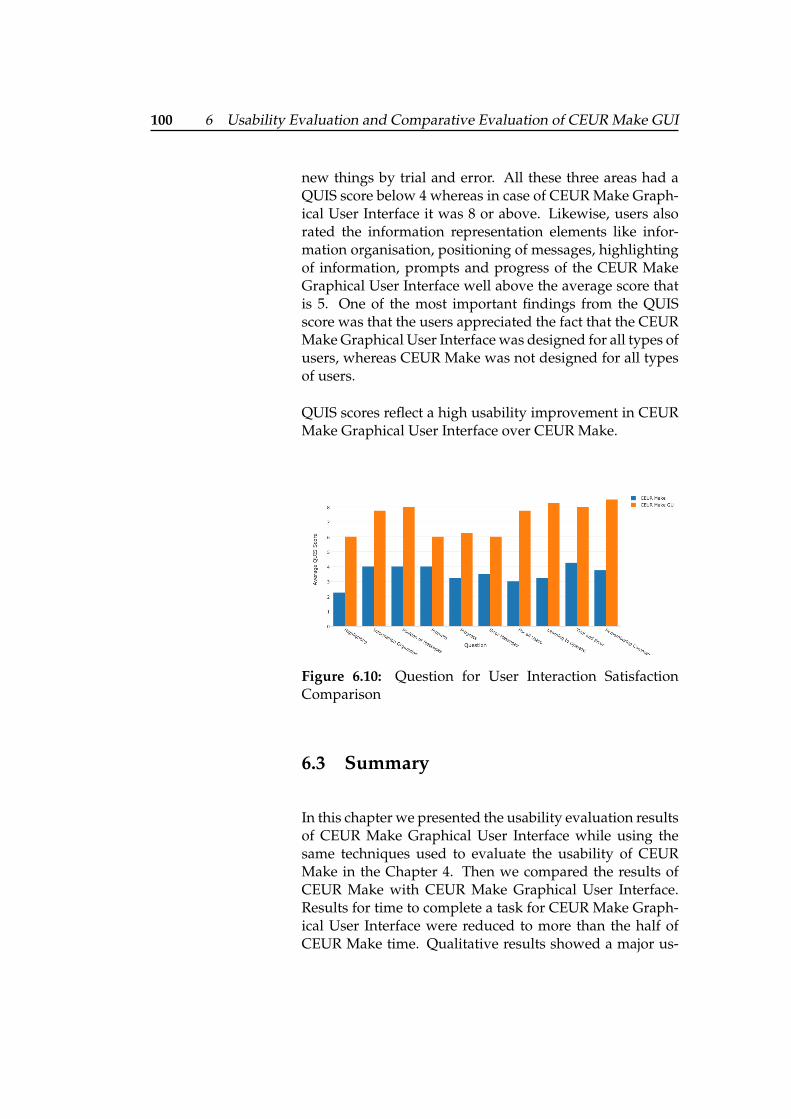
100 6 Usability Evaluation and Comparative Evaluation of CEUR Make GUI
new things by trial and error. All these three areas had aQUIS score below 4 whereas in case of CEUR Make Graph-ical User Interface it was 8 or above. Likewise, users alsorated the information representation elements like infor-mation organisation, positioning of messages, highlightingof information, prompts and progress of the CEUR MakeGraphical User Interface well above the average score thatis 5. One of the most important findings from the QUISscore was that the users appreciated the fact that the CEURMake Graphical User Interface was designed for all types ofusers, whereas CEUR Make was not designed for all typesof users.
QUIS scores reflect a high usability improvement in CEURMake Graphical User Interface over CEUR Make.
Figure 6.10: Question for User Interaction SatisfactionComparison
6.3 Summary
In this chapter we presented the usability evaluation resultsof CEUR Make Graphical User Interface while using thesame techniques used to evaluate the usability of CEURMake in the Chapter 4. Then we compared the results ofCEUR Make with CEUR Make Graphical User Interface.Results for time to complete a task for CEUR Make Graph-ical User Interface were reduced to more than the half ofCEUR Make time. Qualitative results showed a major us-
6.3 Summary 101
ability shift from CEUR Make to CEUR Make GraphicalUser Interface as the negative usability metrics in CEURMake like learnability, navigation, portability, error, depen-dency and interface were all changed to positive usabil-ity metrics of CEUR Make Graphical User Interface. Bothusability evaluation questionnaires SUS and QUIS signi-fied a good usability of CEUR Make Graphical User In-terface over CEUR Make. Hence, it depicts that CEURMake Graphical User Interface has a good usability and byadding few more features that we will present in the Chap-ter 7, it will further improve.
102
Chapter 7
Summary and futurework
This chapter will present a brief summary of the thesis andwill focus on highlighting the future work possibilities ac-cording to our research results.
7.1 Summary
This thesis aimed at automating the publishing workflowfor open access scientific results and it focused on CEURWorkshop proceedings. In this thesis, we presented cur-rent approaches to publish workshop proceedings at CEURWorkshop Proceedings. We also conducted usability eval-uation tests for CEUR Make, a command line utility thathelp publishers to publish at CEUR Workshop Proceed-ings. Three techniques were used to enquire the usability ofCEUR Make, which includes task completion time evalua-tion, qualitative evaluation and post usability survey eval-uation. Usability evaluation results of CEUR Make sug-gested that it had a low usability. Based on heuristic evalu-ations and user feedback on evaluation of CEUR Make, wepresent a Graphical User Interface for CEUR Make. Usabil-ity evaluation was also conducted for the Graphical UserInterface of CEUR Make. The three techniques used to eval-
7.1 Summary 103
uate usability of CEUR Make Graphical User Interface werethe same as used for CEUR Make. The techniques usedwere same to determine the usability results with the sameenvironment, users, conditions and methodologies for boththe systems because it helps to avoid biases and learning ef-fects.
The comparison of task completion time6.2.2 suggests thatCEUR Make Graphical User Interface is more efficient incompleting the tasks, as for all four tasks the average taskcompletion time results for CEUR Make Graphical User In-terface were quite low when compared to CEUR Make. Thecomparison of qualitative evaluation6.2.3 based on mul-tiple qualitative metrics also suggests that CEUR MakeGraphical User Interface is a big interaction improvementover CEUR Make. Finally, post usability evaluation re-sults4.2.3 also show clear that CEUR Make Graphical UserInterface has improved usability over CEUR Make. Asthe System Usability Scale result of CEUR Make was 41.25whereas for CEUR Make Graphical User Interface was87.08. In case of Question for User Interaction Satisfactionquestionnaire CEUR Make had poor results as 11 out of 27questions had results below average and others were alsosatisfactory. CEUR Make Graphical User Interface againshowed good average results for QUESTION for User In-teraction Satisfaction questionnaire, as the results were allabove average. Results of the usability evaluation of boththe systems CEUR Make and CEUR Make Graphical UserInterface indicate a noticeable usability improvement ofCEUR Make over CEUR Make Graphical User Interface.The results also indicate the user interest in the system as itmakes their process of publishing at CEUR Workshop Pro-ceedings effective and efficient. The problematic qualitativemetrics in CEUR Make were learnability, navigation, porta-bility, error, interface and dependency. All of these metricsturned into positive ones when CEUR Make Graphical UserInterface was tested, hence suggesting a major usability im-provement over CEUR Make.
104 7 Summary and future work
7.2 Future work
In this section we will present several areas in which wecan improve the CEUR Make Graphical User Interface in-teraction with the users. The areas we present are basedon the usability evaluations conducted in Chapter 6. Fol-lowing are the areas, which can improve the efficiency andeffectiveness of the CEUR Make Graphical User Interface:
7.2.1 User Profiling
Currently the CEUR Make Graphical User Interface is aweb service that doesn’t require a signup. Anyone can visitthe web address and use the service. By introducing, userprofiling1 that means adding a signup functionality, we canenrich the user experience. This can make the system moreefficient in task completion. Creating Index.html file forpublishing workshop proceedings requires two main xmlformat files that are Table of Contents and Workshop file.Both of these store metadata associated with workshop pro-ceedings. As the CEUR Make Graphical User Interface pro-vides a user with step wise form, which requires user tofill the metadata as an input. User profiling can store usersrecord and record of associated users so that each time userrequires to fill in the forms he doesn’t need to provide as aninput from scratch but he gets hinting.
For example, Table of Contents form requires the name ofthe authors associated with the paper. Based on storedrecord and artificial intelligence algorithm, the systemcould suggest the name of the user as an author and peopleassociated with him in previous submissions. Similarly, incase of filling the form for Workshop, name of the editorscould be suggested by the system based on editors associa-tion in previous submissions.
1https://github.com/ceurws/ceur-make-ui/issues/1

7.2 Future work 105
7.2.2 Collaborative Space for Editors
A collaborative workspace for the editors could be anotherfeature2 of interest for the users as pointed out by the usersin the qualitative results presented in the Appendix D, Sec-tion D.1.2. It would also enhance the usability of the sys-tem, from a publisher’s point of view. Potentially therecould be multiple editors of the workshop and they mightwork collaboratively in parallel to other editors. CEURMake Graphical User Interface currently supports a singleeditor workflow. Usability evaluation results pointed outthat editors like to work in parallel at the same time. There-fore, it would be a good feature as it can fill in the missinguse case in current system and improve the usability of thesystem.
7.2.3 Automatic Identification of Paper, Titles andPage Numbers
Another area where usability of the system could be en-hanced is filling information related to papers metadata.While filling in the fields for creating Table of Contents file,editor needs to add paper associated to a session and re-lated information to that paper. The fields associated topaper that editors require to fill in while using the CEURMake Graphical User Interface are title of paper, page num-bers according to the volume and associated authors.
If system takes a bit more control at middleware, usinga PHP script system could go through all the papers up-loaded by the editors and do a bit of text scraping3. Systemcould in this way able to retrieve title of the paper, totalnumber of pages in the paper and the authors associatedto the paper. Therefore, editor won’t need to input as textin the fields, rather system would do it for the editor andeditor could verify it. This really reduces the amount ofdata editor needs to input into fields while creating Tableof Contents file, hence simplifying the task and making it
2https://github.com/ceurws/ceur-make-ui/issues/23https://github.com/ceurws/ceur-make-ui/issues/3
106 7 Summary and future work
more efficient.
7.2.4 System State Saving
CEUR Make Graphical User Interface does not store thestate of system4 at any particular instance. So, it could befrustrating for the editor. As if, while filling in the fields forcreating Table of Contents or Workshop file the user couldget his page refreshed in which case he would need to fill inthe fields once again. Similarly, if a user decides to leave inbetween of filling the fields and decides to return later, theuser would need to do start from scratch. Hence, storingthe state of the system at different instances could enhancethe user experience of the CERU Make Graphical User In-terface.‘
7.2.5 Social Scientific Community
The area where open access CEUR Workshop Proceedingsis lagging, is the usefulness of the volume published and itsimpact. This could be improved by introducing a systemfor rating or commenting on the different volumes pub-lished at CEUR Workshop Proceedings. This would make itmore effective for the scientists. This would also add morevalue to the volumes published. A social connect to twitterand facebook could also allow single click sharing of thevolume published at the CEUR Workshop Proceedings. Inthis way the scientific results will reach out to a larger au-dience and large number of scientists will be able to ratethe results which will improve the credibility of the resultsbeing shared.
7.3 Conclusion
According to our usability test results CEUR Make Graph-ical User Interface is more usable than CEUR Make. The
4https://github.com/ceurws/ceur-make-ui/issues/4

7.3 Conclusion 107
points discussed in the section 7.2 also highlights the areawhere we could focus on based on usability issues to im-prove the usability of CEUR Make Graphical User Inter-face.
108
Appendix A
Usability EvaluationForm for CEUR Make
The resources presented in the following sections wereused to measure and evaluate the usability of the CEURMake.
A.1 Letter of Consent[38]
Dear Participant,
I invite you to participate in a research study entitled: Us-ability Evaluation of CEUR Make . I am currently enrolled inthe Media Informatics Programme at RWTH Aachen Uni-versity, Aachen, and am in the process of writing my (i.e.,Master’s Thesis). The purpose of the research is to deter-mine: How can the terminal based utility help publishers of pro-ceedings to perform their tasks more efficiently?
The enclosed questionnaire and task list has been designedto collect information on: usability measurement and evalua-tion of CEUR Make.
Your participation in this research project is completelyvoluntary. You may decline altogether, or leave blank
A.2 Usability Evaluation 109
any questions you don’t wish to answer. There are noknown risks to participation beyond those encountered ineveryday life. Your responses will remain confidential andanonymous. Data from this research will be kept underlock and key and reported only as a collective combinedtotal. No one other than the researchers will know yourindividual answers to this questionnaire.
If you agree to participate in this project, please perform thetasks as mentioned in the enclosed evaluation interview forwhich your time will be recorded to complete the tasks andanswer the questions on the questionnaire as best you can.It should take approximately 45 minutes to complete.
If you have any questions about this project, feel freeto contact Rohan Asmat ( Master Thesis Student ) [email protected].
Thank you for your assistance in this important endeavor.
Sincerely yours,
Muhammad Rohan Ali Asmat
A.2 Usability Evaluation
For usability evaluation of the CEUR Make, you will haveto go through two sets of rounds. In the first round thatis Evaluation Interview round, you will be provided withset of tasks that you will have to perform as instructed forwhich you will be recorded and timed. In the second roundthat is evaluation questionnaire round you will have to fillup the questionnaire.
A.2.1 Evaluation Interview
In this section you will be required to perform certain tasksfor which you will be recorded.The instructions are given
110 A Usability Evaluation Form for CEUR Make
below and each task is described in detail which you wouldhave to perform based on the instructions given.
Instructions
Four tasks are described below which would in total takefifteen minutes. Each task may take a minimum of one min-utes and a maximum of five minutes. You have to performall the tasks in the sequence presented below. All the taskswill be explained thoroughly by the interviewer before theevaluation begins. You are asked to allow questions duringthe evaluation but try to keep them as minimum as possiblein order to simulate the actual user behaviour.
Task 1 - Initiate Generation
• Terminal is opened for you(on site users with evalu-ators mac and virtual users through screen sharing)please go into the directory as follows:
• Desktop/usabilitytest/output
Hint: The command is : cd Desktop/usabilitytest/output
Task 2 - Generate Workshop and Copyright Form
Workshop Metadata
• Switch to editor opened in another window calledsublime text and click on workshop.xml file.
• Use the data presented in the figure A.1 on page 111for the first step of workshop.xml file i.e WorkshopMetaData.
Conference Metadata
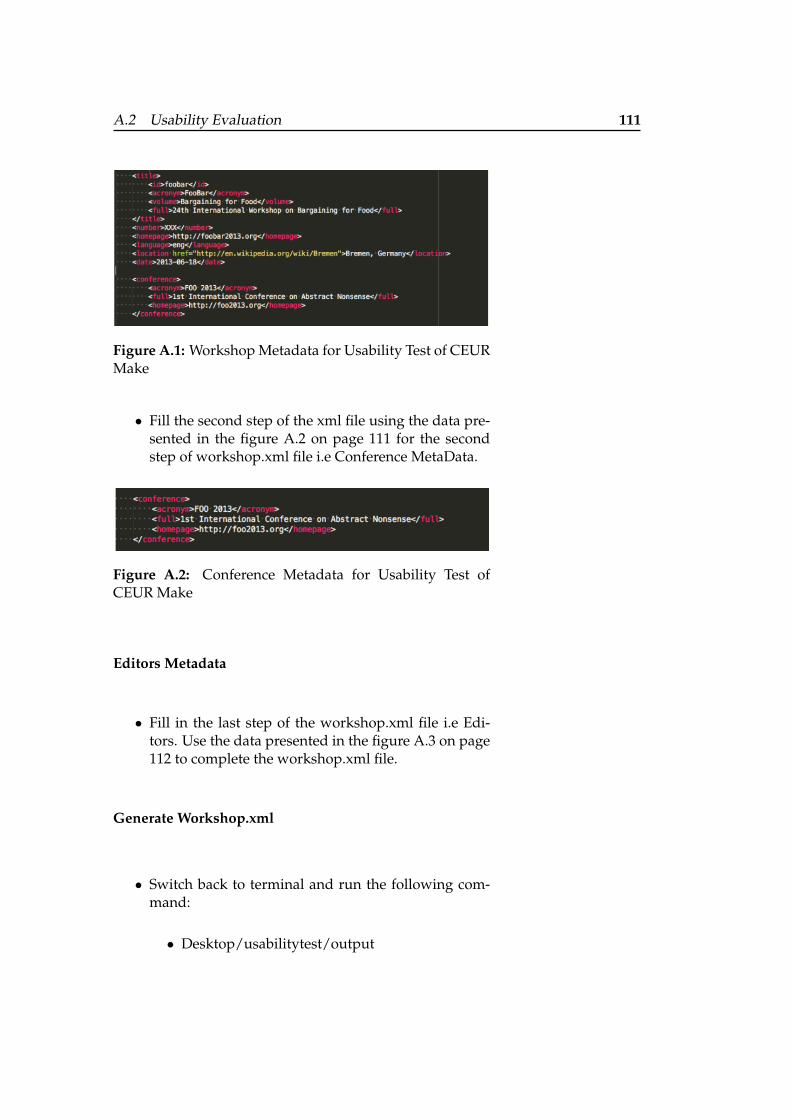
A.2 Usability Evaluation 111
Figure A.1: Workshop Metadata for Usability Test of CEURMake
• Fill the second step of the xml file using the data pre-sented in the figure A.2 on page 111 for the secondstep of workshop.xml file i.e Conference MetaData.
Figure A.2: Conference Metadata for Usability Test ofCEUR Make
Editors Metadata
• Fill in the last step of the workshop.xml file i.e Edi-tors. Use the data presented in the figure A.3 on page112 to complete the workshop.xml file.
Generate Workshop.xml
• Switch back to terminal and run the following com-mand:
• Desktop/usabilitytest/output
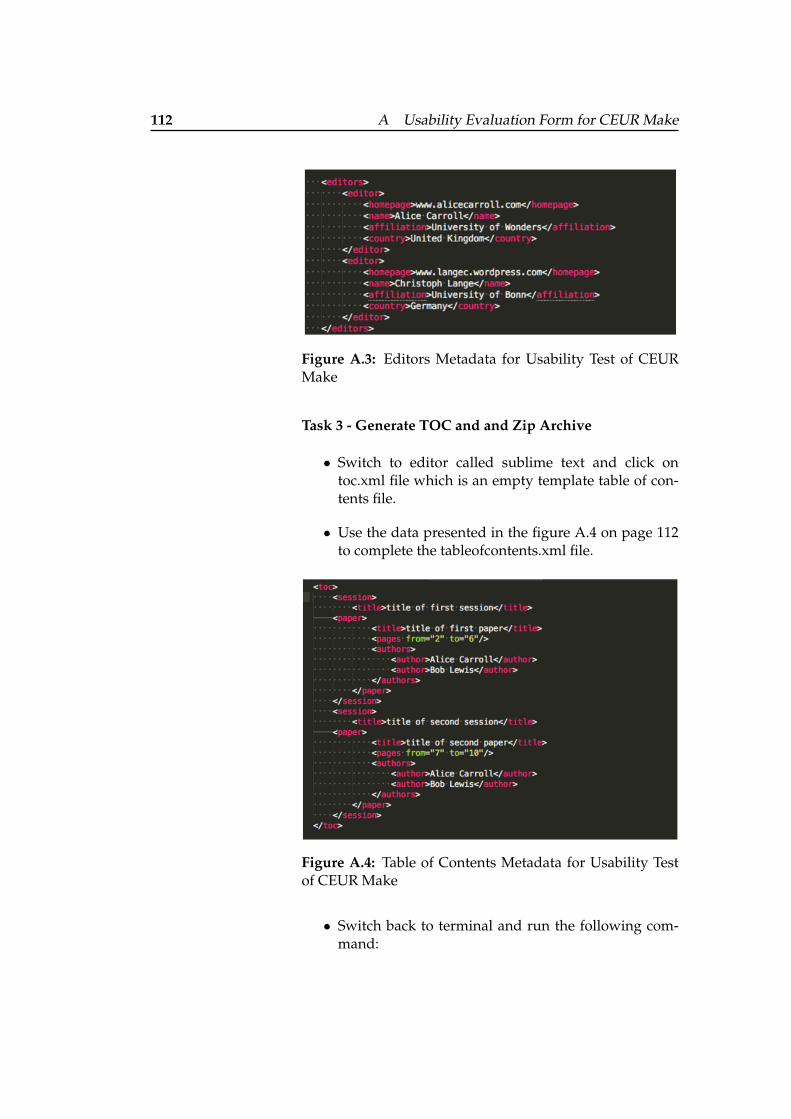
112 A Usability Evaluation Form for CEUR Make
Figure A.3: Editors Metadata for Usability Test of CEURMake
Task 3 - Generate TOC and and Zip Archive
• Switch to editor called sublime text and click ontoc.xml file which is an empty template table of con-tents file.
• Use the data presented in the figure A.4 on page 112to complete the tableofcontents.xml file.
Figure A.4: Table of Contents Metadata for Usability Testof CEUR Make
• Switch back to terminal and run the following com-mand:
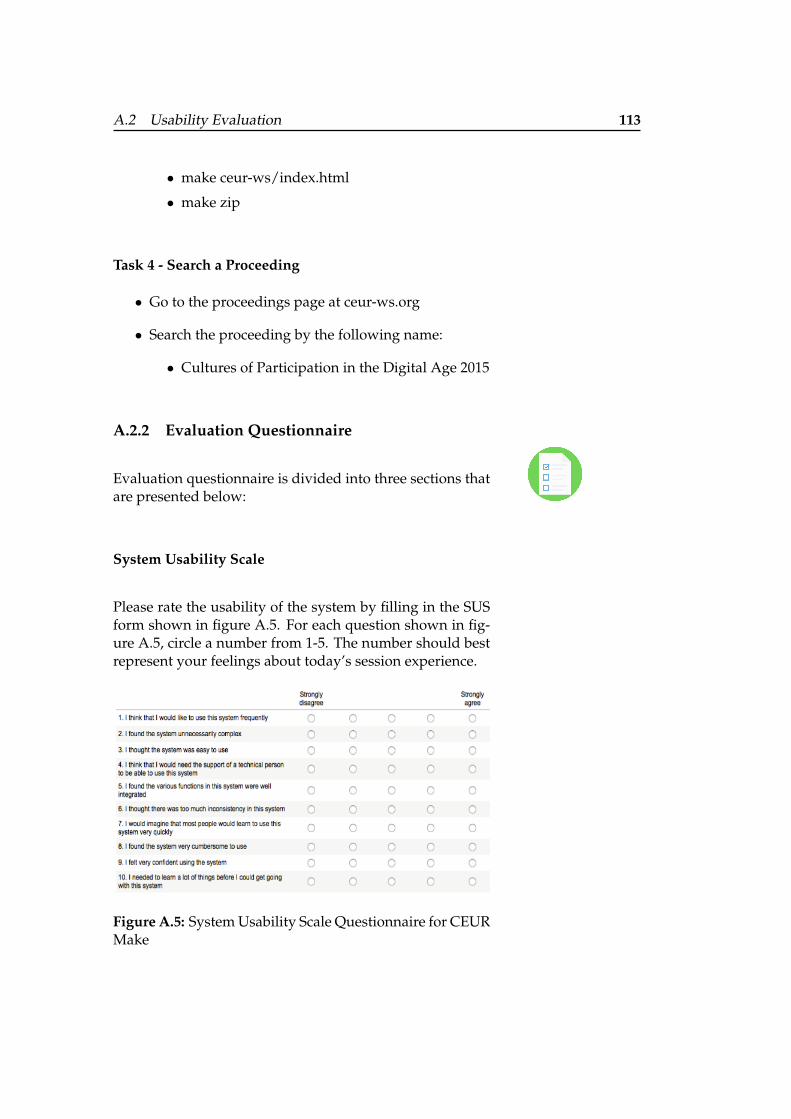
A.2 Usability Evaluation 113
• make ceur-ws/index.html
• make zip
Task 4 - Search a Proceeding
• Go to the proceedings page at ceur-ws.org
• Search the proceeding by the following name:
• Cultures of Participation in the Digital Age 2015
A.2.2 Evaluation Questionnaire
Evaluation questionnaire is divided into three sections thatare presented below:
System Usability Scale
Please rate the usability of the system by filling in the SUSform shown in figure A.5. For each question shown in fig-ure A.5, circle a number from 1-5. The number should bestrepresent your feelings about today’s session experience.
Figure A.5: System Usability Scale Questionnaire for CEURMake
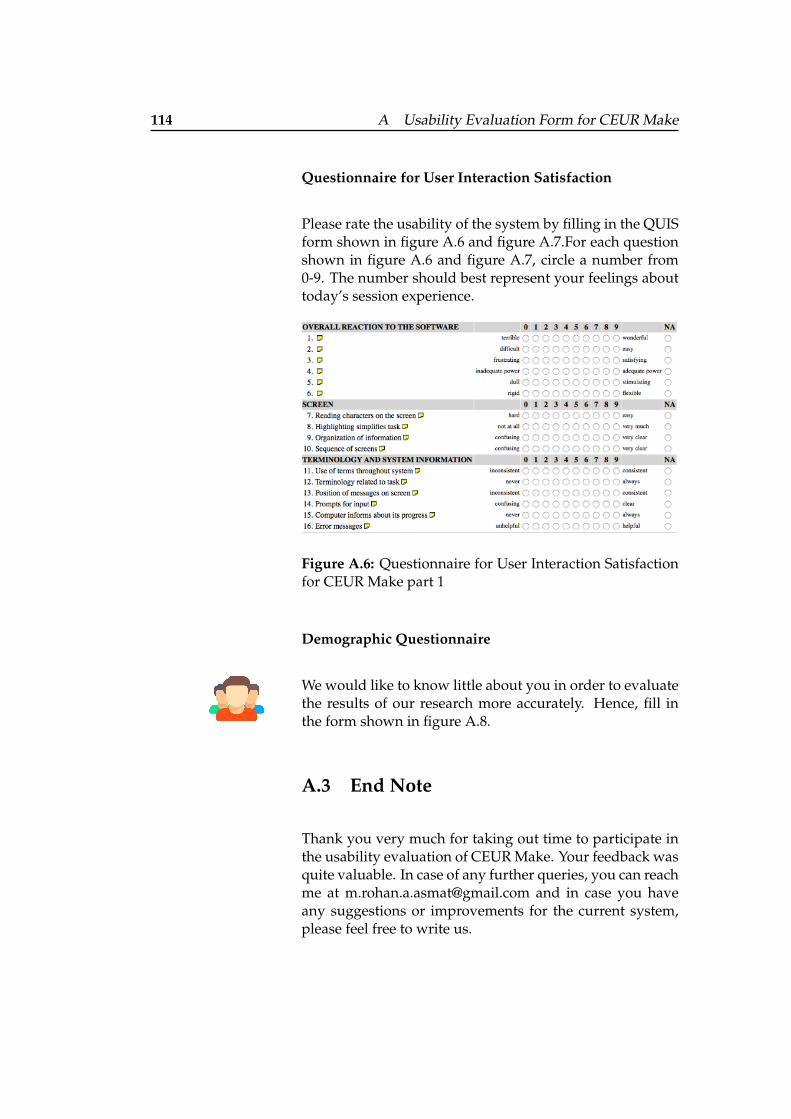
114 A Usability Evaluation Form for CEUR Make
Questionnaire for User Interaction Satisfaction
Please rate the usability of the system by filling in the QUISform shown in figure A.6 and figure A.7.For each questionshown in figure A.6 and figure A.7, circle a number from0-9. The number should best represent your feelings abouttoday’s session experience.
Figure A.6: Questionnaire for User Interaction Satisfactionfor CEUR Make part 1
Demographic Questionnaire
We would like to know little about you in order to evaluatethe results of our research more accurately. Hence, fill inthe form shown in figure A.8.
A.3 End Note
Thank you very much for taking out time to participate inthe usability evaluation of CEUR Make. Your feedback wasquite valuable. In case of any further queries, you can reachme at [email protected] and in case you haveany suggestions or improvements for the current system,please feel free to write us.
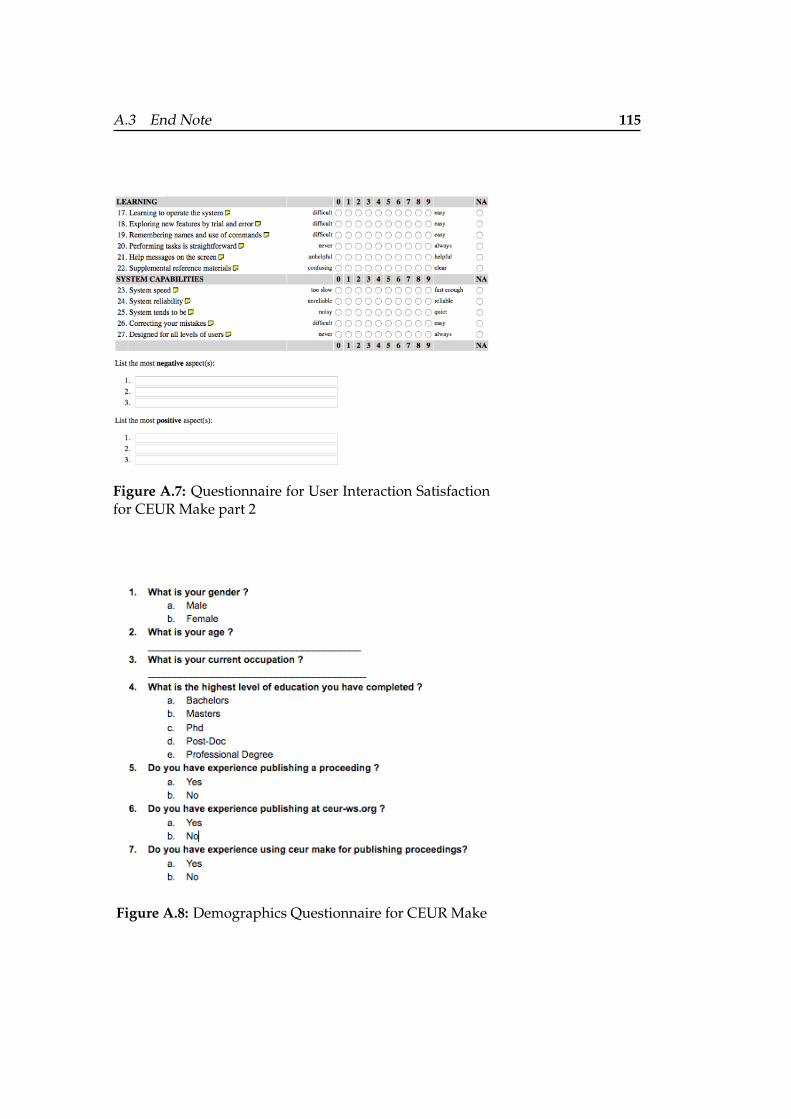
A.3 End Note 115
Figure A.7: Questionnaire for User Interaction Satisfactionfor CEUR Make part 2
Figure A.8: Demographics Questionnaire for CEUR Make
116
Appendix B
Usability Evaluation ofCEUR Make WebInterface
The resources presented in the following sections wereused to measure and evaluate the usability of the CEURMake Web Interface.
B.1 Letter of Consent[38]
Usability Evaluation of CEUR Make Web Interface
Dear Participant,
I invite you to participate in a research study entitled: Us-ability Evaluation of CEUR Make Web Interface . I am cur-rently enrolled in the Media Informatics Programme atRWTH Aachen University, Aachen, and am in the processof writing my (i.e., Master’s Thesis). The purpose of theresearch is to determine: How can the web interface help pub-lishers of proceedings to perform their tasks more efficiently?
The enclosed questionnaire and task list has been designedto collect information on: usability measurement and evalua-tion for CEUR Make Web Interface.
B.2 Usability Evaluation 117
Your participation in this research project is completelyvoluntary. You may decline altogether, or leave blankany questions you don’t wish to answer. There are noknown risks to participation beyond those encountered ineveryday life. Your responses will remain confidential andanonymous. Data from this research will be kept underlock and key and reported only as a collective combinedtotal. No one other than the researchers will know yourindividual answers to this questionnaire.
If you agree to participate in this project, please perform thetasks as mentioned in the enclosed evaluation interview forwhich your time will be recorded to complete the tasks andanswer the questions on the questionnaire as best you can.It should take approximately 45 minutes to complete.
If you have any questions about this project, feel freeto contact Rohan Asmat ( Master Thesis Student ) [email protected].
Thank you for your assistance in this important endeavor.
Sincerely yours,
Muhammad Rohan Ali Asmat
B.2 Usability Evaluation
For usability evaluation of the ceur make, you will haveto go through two sets of rounds. In the first round thatis Evaluation Interview round, you will be provided withset of tasks that you will have to perform as instructed forwhich you will be recorded and timed. In the second roundthat is Evaluation Questionnaire round you will have to fillup the questionnaire.
118 B Usability Evaluation of CEUR Make Web Interface
B.2.1 Evaluation Interview
In this section you will be required to perform certain tasksfor which you will be recorded.The instructions are givenbelow and each task is described in detail which you wouldhave to perform based on the instructions given.
Instructions
Seven tasks are described below which would in total taketwenty minutes. Each task may take a minimum of twominutes and a maximum of eight minutes. You have to per-form all the tasks in the sequence presented below. All thetasks will be explained thoroughly by the interviewer be-fore the evaluation begins. You are asked to allow questionsduring the evaluation but try to keep them as minimum aspossible in order to simulate the actual user behaviour.
Task 1 - Initiate Generation
• Go to Publishing Page and Generate Resources usingCeur Make Web Interface
Task 2 - Generate Workshop and Copyright Form
• Generate Workshop.
• Workshop.xml file is supposed to be created in threesteps that are described below:
• Fill in the first step i.e Workshop Metadata. Usethe data provided to you in table B.1 on page 119to fill in the form.
• Go to second step by pressing next and fill in thesecond step of the form i.e Conference Metadata.Use the data provided to you in table B.2 on page119 to fill in the form.
• Go to the last step by pressing next and fill inthe last step of the form i.e Editors. Use the data
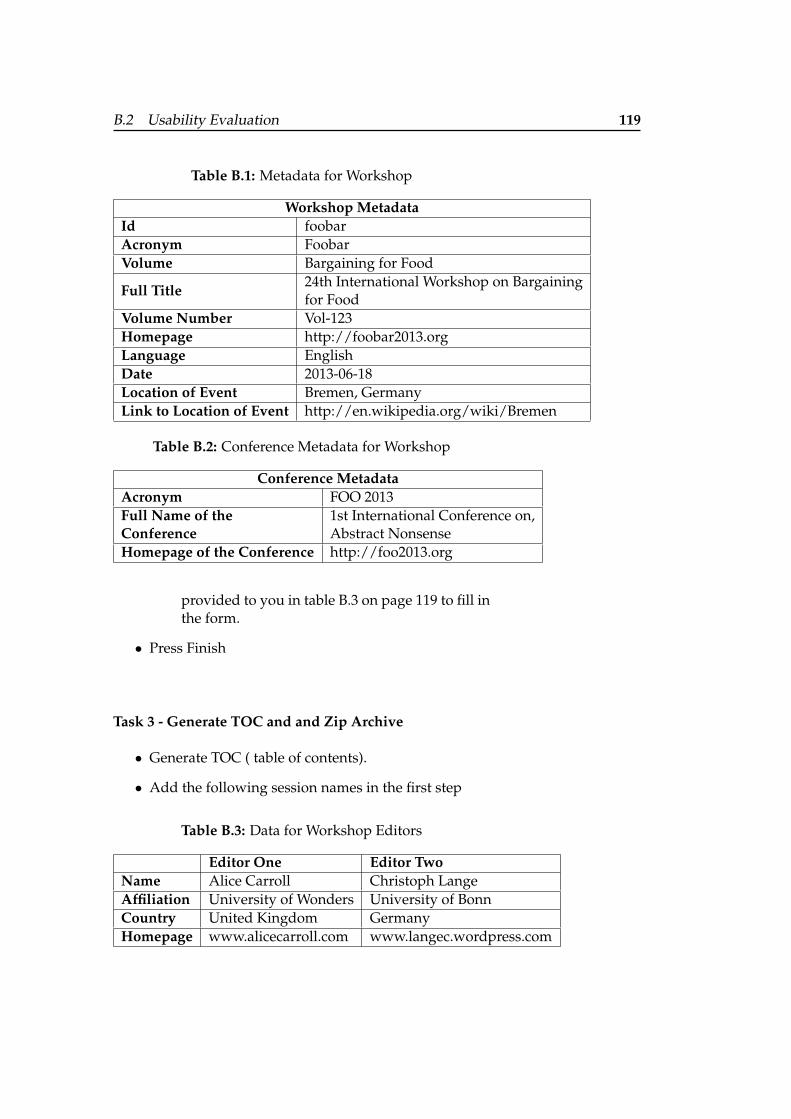
B.2 Usability Evaluation 119
Table B.1: Metadata for Workshop
Workshop MetadataId foobarAcronym FoobarVolume Bargaining for Food
Full Title24th International Workshop on Bargainingfor Food
Volume Number Vol-123Homepage http://foobar2013.orgLanguage EnglishDate 2013-06-18Location of Event Bremen, GermanyLink to Location of Event http://en.wikipedia.org/wiki/Bremen
Table B.2: Conference Metadata for Workshop
Conference MetadataAcronym FOO 2013Full Name of theConference
1st International Conference on,Abstract Nonsense
Homepage of the Conference http://foo2013.org
provided to you in table B.3 on page 119 to fill inthe form.
• Press Finish
Task 3 - Generate TOC and and Zip Archive
• Generate TOC ( table of contents).
• Add the following session names in the first step
Table B.3: Data for Workshop Editors
Editor One Editor TwoName Alice Carroll Christoph LangeAffiliation University of Wonders University of BonnCountry United Kingdom GermanyHomepage www.alicecarroll.com www.langec.wordpress.com
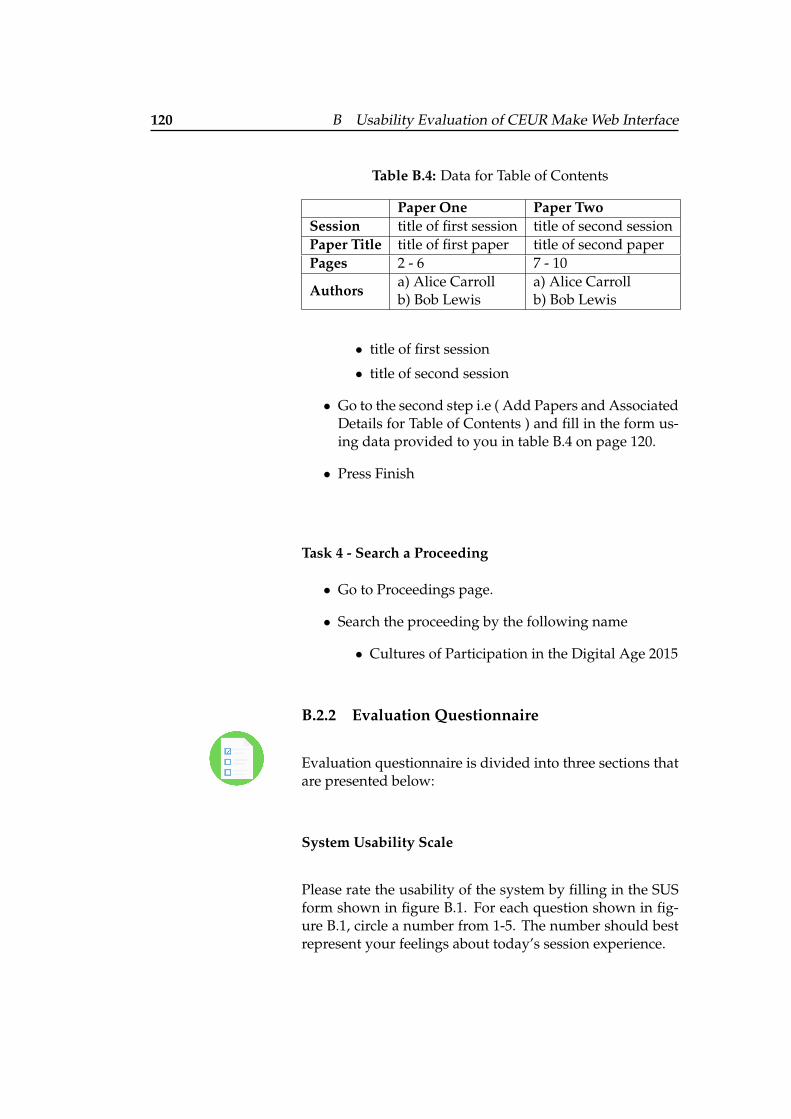
120 B Usability Evaluation of CEUR Make Web Interface
Table B.4: Data for Table of Contents
Paper One Paper TwoSession title of first session title of second sessionPaper Title title of first paper title of second paperPages 2 - 6 7 - 10
Authorsa) Alice Carrollb) Bob Lewis
a) Alice Carrollb) Bob Lewis
• title of first session
• title of second session
• Go to the second step i.e ( Add Papers and AssociatedDetails for Table of Contents ) and fill in the form us-ing data provided to you in table B.4 on page 120.
• Press Finish
Task 4 - Search a Proceeding
• Go to Proceedings page.
• Search the proceeding by the following name
• Cultures of Participation in the Digital Age 2015
B.2.2 Evaluation Questionnaire
Evaluation questionnaire is divided into three sections thatare presented below:
System Usability Scale
Please rate the usability of the system by filling in the SUSform shown in figure B.1. For each question shown in fig-ure B.1, circle a number from 1-5. The number should bestrepresent your feelings about today’s session experience.
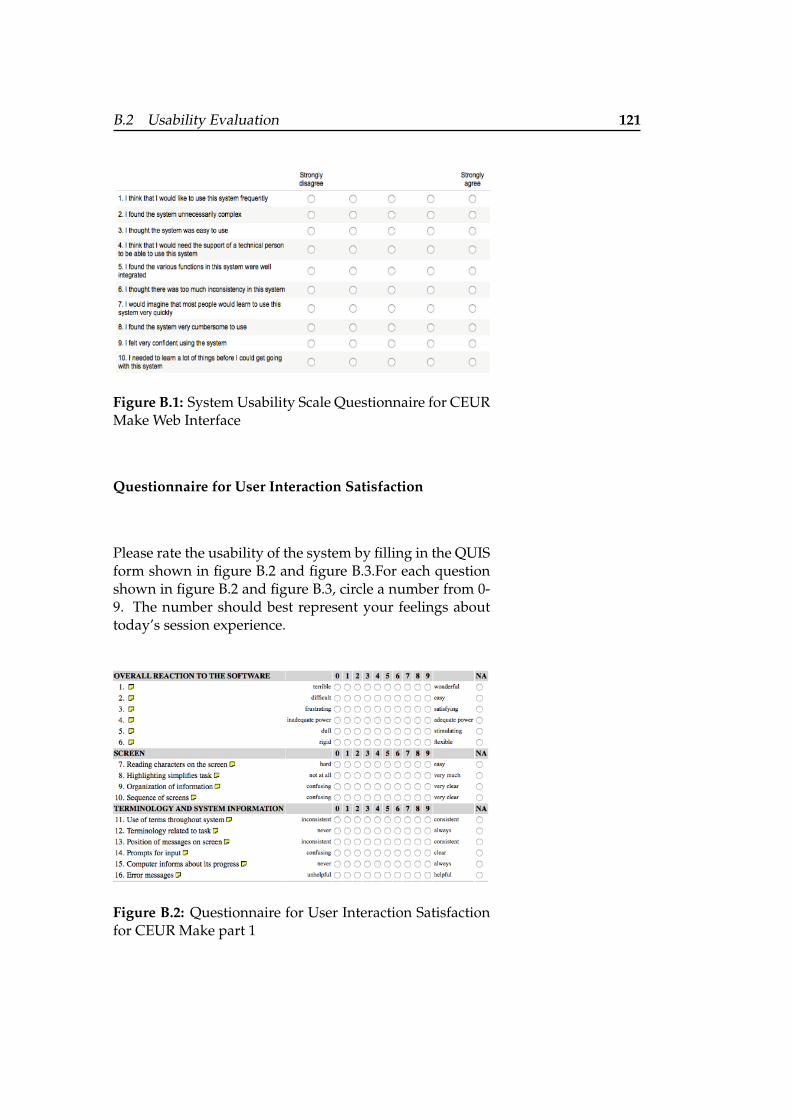
B.2 Usability Evaluation 121
Figure B.1: System Usability Scale Questionnaire for CEURMake Web Interface
Questionnaire for User Interaction Satisfaction
Please rate the usability of the system by filling in the QUISform shown in figure B.2 and figure B.3.For each questionshown in figure B.2 and figure B.3, circle a number from 0-9. The number should best represent your feelings abouttoday’s session experience.
Figure B.2: Questionnaire for User Interaction Satisfactionfor CEUR Make part 1
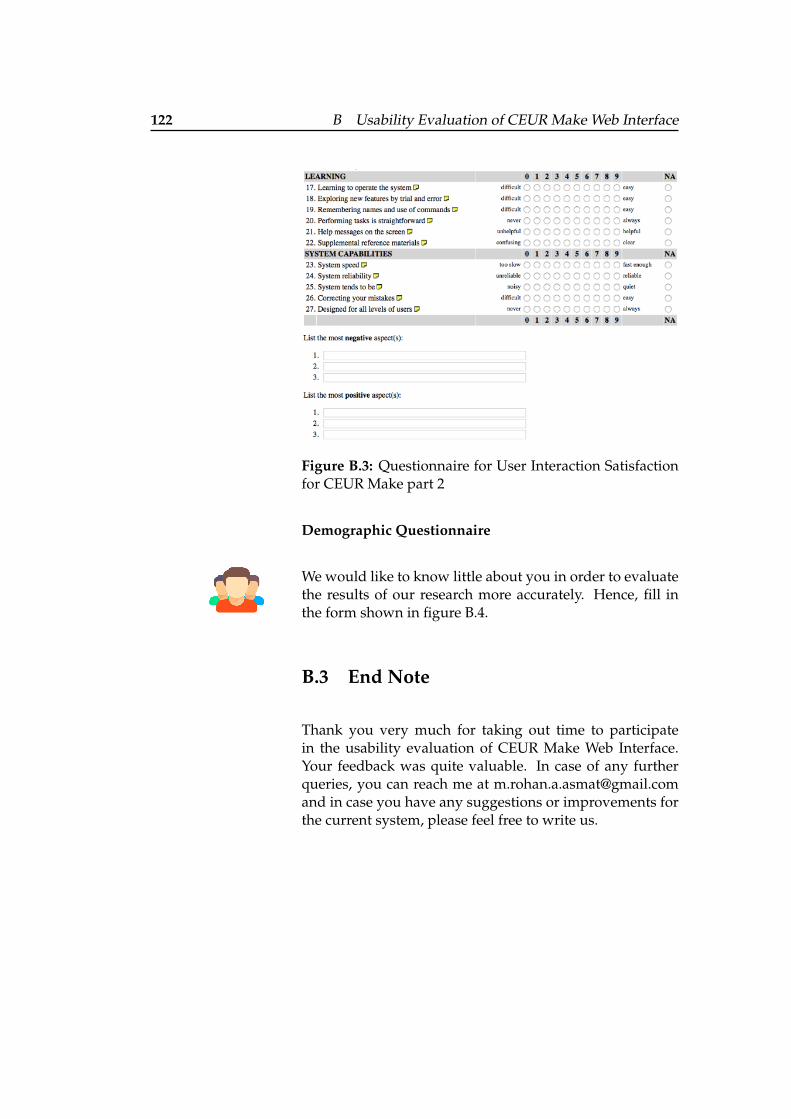
122 B Usability Evaluation of CEUR Make Web Interface
Figure B.3: Questionnaire for User Interaction Satisfactionfor CEUR Make part 2
Demographic Questionnaire
We would like to know little about you in order to evaluatethe results of our research more accurately. Hence, fill inthe form shown in figure B.4.
B.3 End Note
Thank you very much for taking out time to participatein the usability evaluation of CEUR Make Web Interface.Your feedback was quite valuable. In case of any furtherqueries, you can reach me at [email protected] in case you have any suggestions or improvements forthe current system, please feel free to write us.
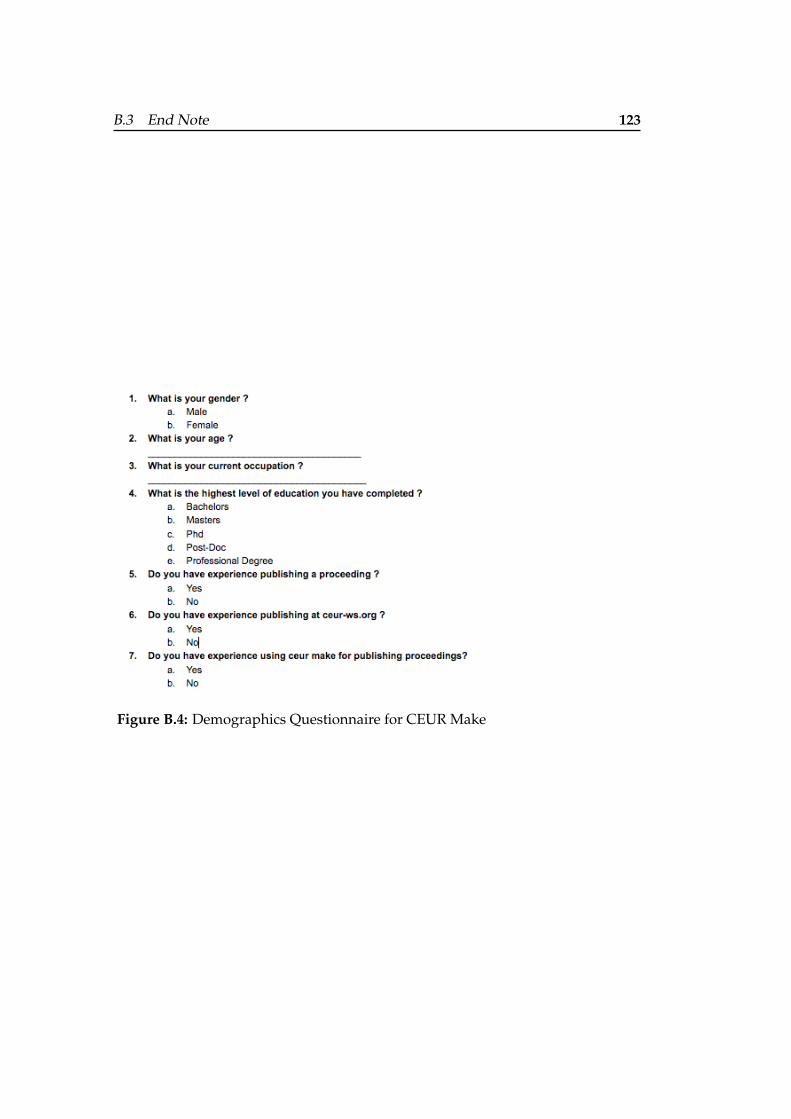
B.3 End Note 123
Figure B.4: Demographics Questionnaire for CEUR Make
124
Appendix C
Usability EvaluationResults for CEUR Make
As discussed in Chapter 4 in section 4.1.2 our evaluationresults can be divided into two design setups that are thinkaloud design setup and question asking design setup. Re-sults from both the design setups are presented in this part.Twelve(12) people participated in total, from which six(6)people participated in the think aloud design setup andsix(6) people participated in the question asking designsetup.
C.1 Think Aloud Design Setup Results
As discussed in Chapter 4 in section 4.1.2 each user test isdivided into three major parts demographics, evaluationinterview and evaluation questionnaire. Results from allthree are presented below:
C.1.1 Demographics
The demographic results of the users who participated inthink aloud design setup is shown in figure D.1.
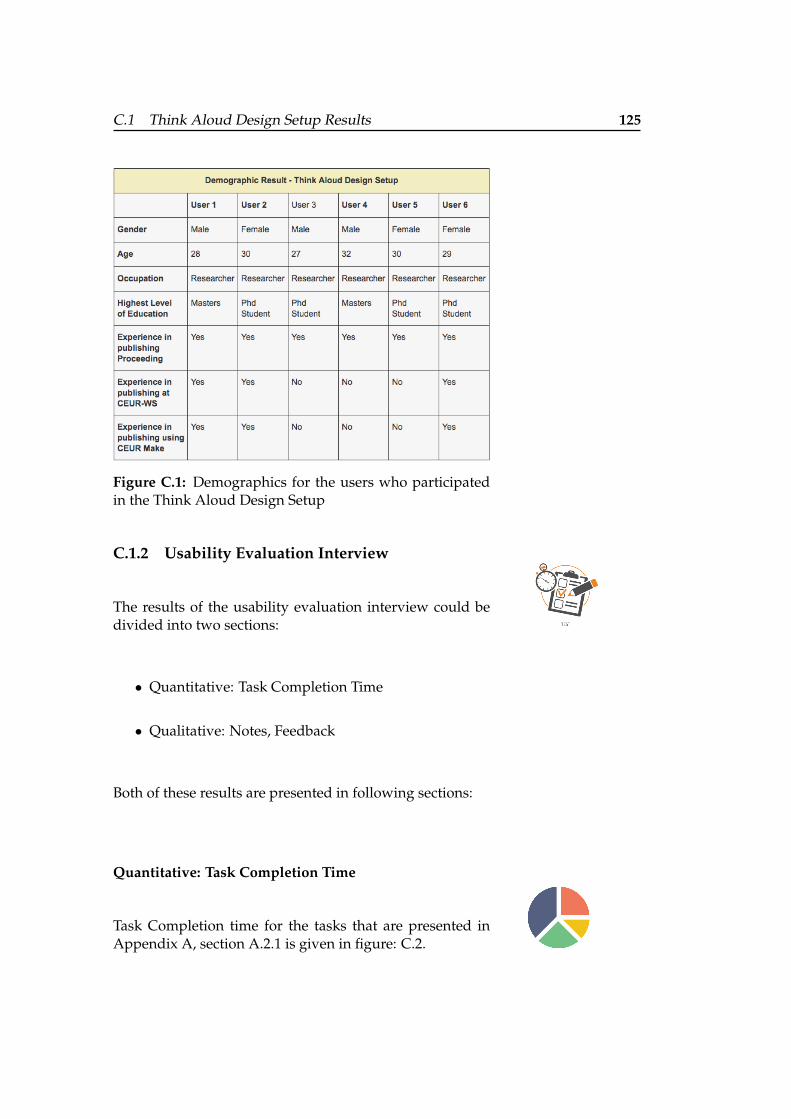
C.1 Think Aloud Design Setup Results 125
Figure C.1: Demographics for the users who participatedin the Think Aloud Design Setup
C.1.2 Usability Evaluation Interview
The results of the usability evaluation interview could bedivided into two sections:
• Quantitative: Task Completion Time
• Qualitative: Notes, Feedback
Both of these results are presented in following sections:
Quantitative: Task Completion Time
Task Completion time for the tasks that are presented inAppendix A, section A.2.1 is given in figure: C.2.
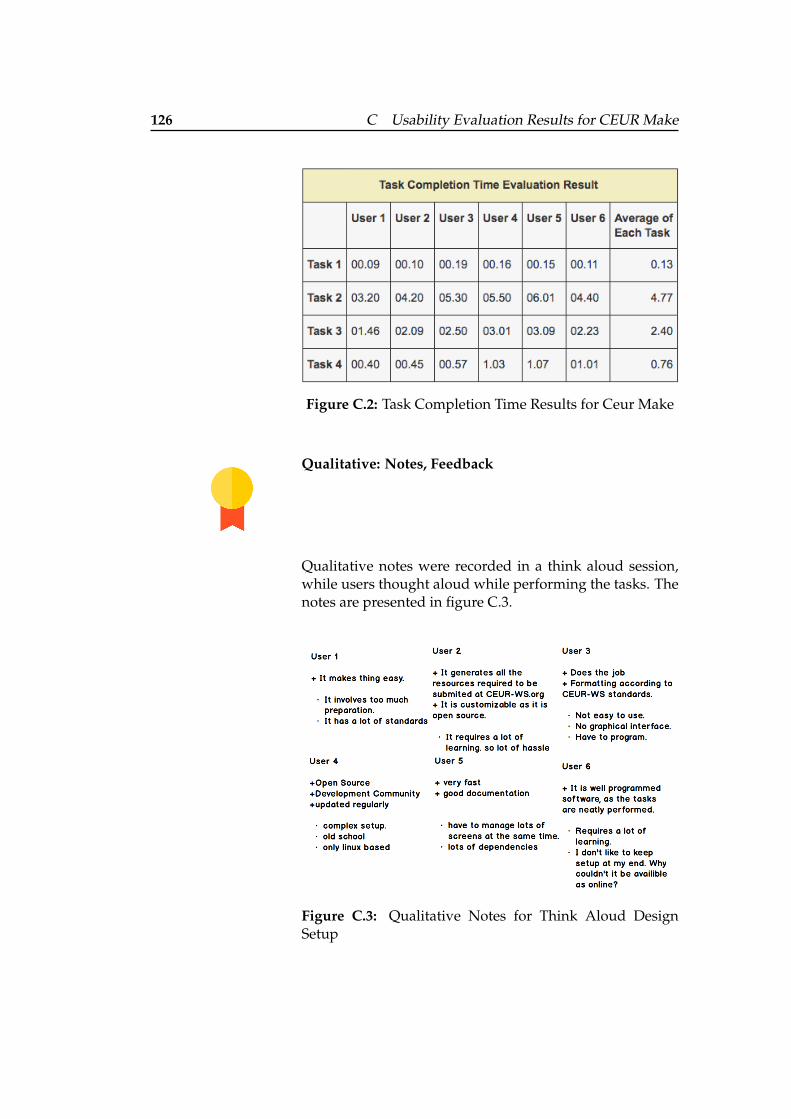
126 C Usability Evaluation Results for CEUR Make
Figure C.2: Task Completion Time Results for Ceur Make
Qualitative: Notes, Feedback
Qualitative notes were recorded in a think aloud session,while users thought aloud while performing the tasks. Thenotes are presented in figure C.3.
Figure C.3: Qualitative Notes for Think Aloud DesignSetup
C.2 Question Asking Design Setup Results 127
C.1.3 Evaluation Questionnaire
After the think aloud experiment users were asked to fillin evaluation questionnaire. The results of the evaluationquestionnaire could be divided into two sections:
• System Usability Scale(SUS)
• Question for User Interaction Satisfaction(QUIS)
Both of these results are presented in following sections:
System Usability Scale(SUS)
The results of SUS for think aloud design setup are pre-sented in figure C.4.
Question for User Interaction Satisfaction(QUIS)
The results of QUIS for think aloud design setup are pre-sented in figure C.5. The results of think aloud correspondto users shown in figure C.5 from 1 to 6.
C.2 Question Asking Design Setup Re-sults
As discussed in Chapter 4 in section 4.1.2 each experimentis divided into three major parts demographics, evaluationinterview and evaluation questionnaire. Results from allthree are presented below:
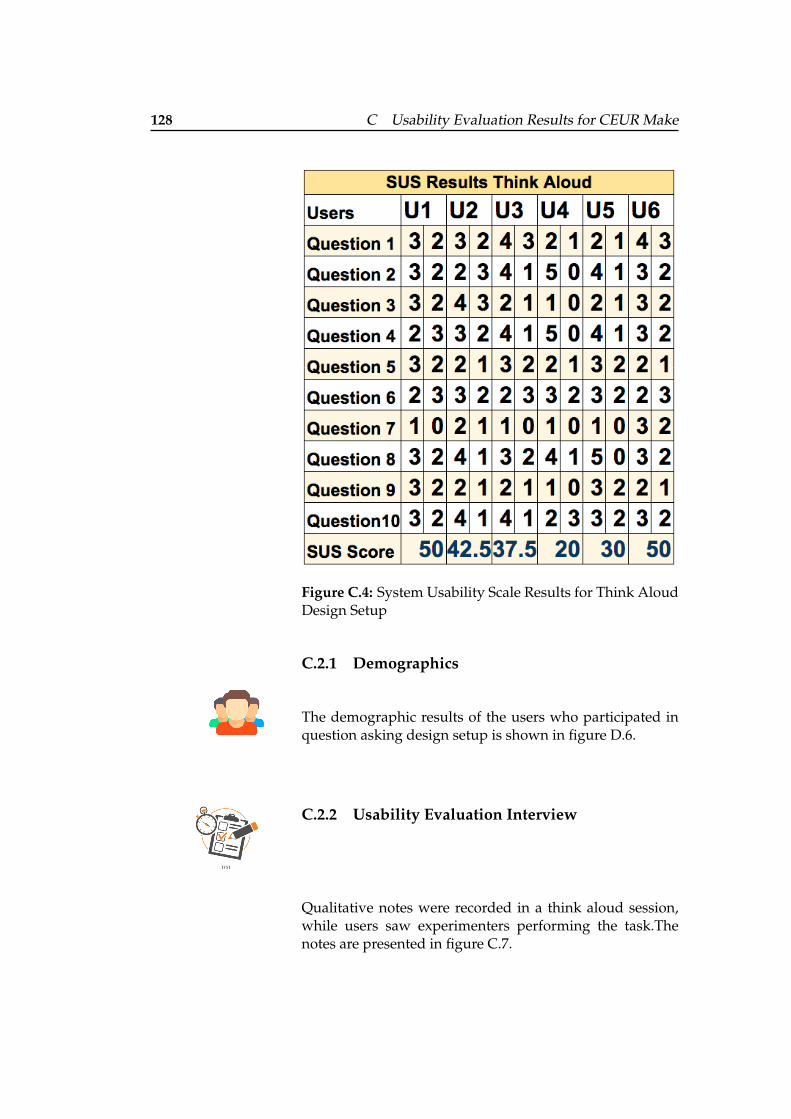
128 C Usability Evaluation Results for CEUR Make
Figure C.4: System Usability Scale Results for Think AloudDesign Setup
C.2.1 Demographics
The demographic results of the users who participated inquestion asking design setup is shown in figure D.6.
C.2.2 Usability Evaluation Interview
Qualitative notes were recorded in a think aloud session,while users saw experimenters performing the task.Thenotes are presented in figure C.7.
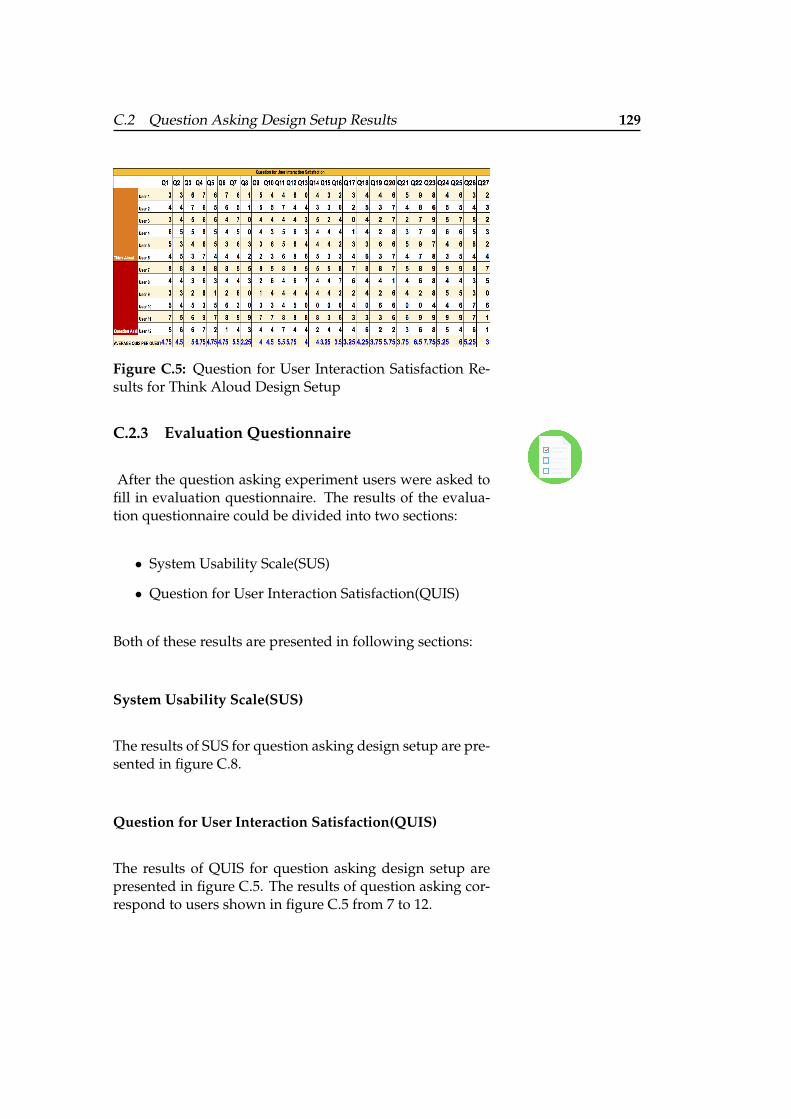
C.2 Question Asking Design Setup Results 129
Figure C.5: Question for User Interaction Satisfaction Re-sults for Think Aloud Design Setup
C.2.3 Evaluation Questionnaire
After the question asking experiment users were asked tofill in evaluation questionnaire. The results of the evalua-tion questionnaire could be divided into two sections:
• System Usability Scale(SUS)
• Question for User Interaction Satisfaction(QUIS)
Both of these results are presented in following sections:
System Usability Scale(SUS)
The results of SUS for question asking design setup are pre-sented in figure C.8.
Question for User Interaction Satisfaction(QUIS)
The results of QUIS for question asking design setup arepresented in figure C.5. The results of question asking cor-respond to users shown in figure C.5 from 7 to 12.
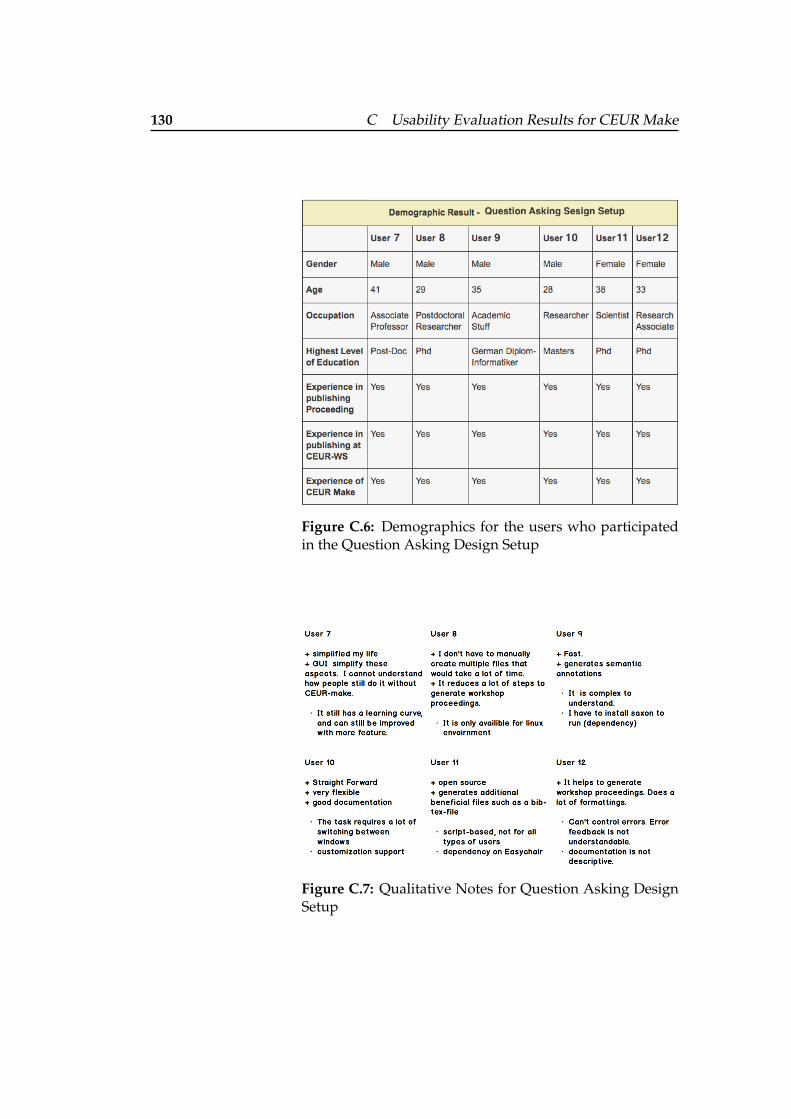
130 C Usability Evaluation Results for CEUR Make
Figure C.6: Demographics for the users who participatedin the Question Asking Design Setup
Figure C.7: Qualitative Notes for Question Asking DesignSetup
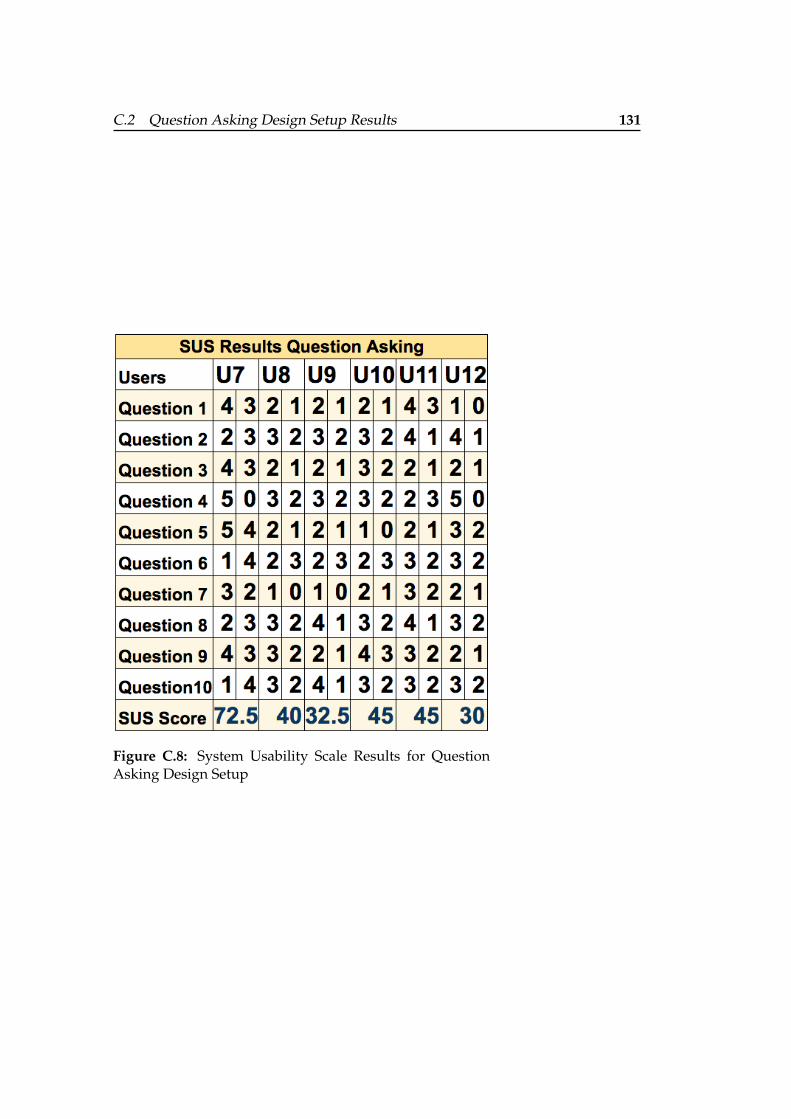
C.2 Question Asking Design Setup Results 131
Figure C.8: System Usability Scale Results for QuestionAsking Design Setup
132
Appendix D
Usability EvaluationResults for CEUR MakeWeb Interface
As discussed in Chapter 4 in section 4.1.2 our evaluationresults can be divided into two design setups that are thinkaloud design setup and question asking design setup. Re-sults from both the design setups are presented in this part.Twelve(12) people participated in total, from which six(6)people participated in the think aloud design setup andsix(6) people participated in the question asking designsetup.
D.1 Think Aloud Design Setup Results
As discussed in Chapter 4 in section 4.1.2 each user test isdivided into three major parts demographics, evaluationinterview and evaluation questionnaire. Results from allthree are presented below:
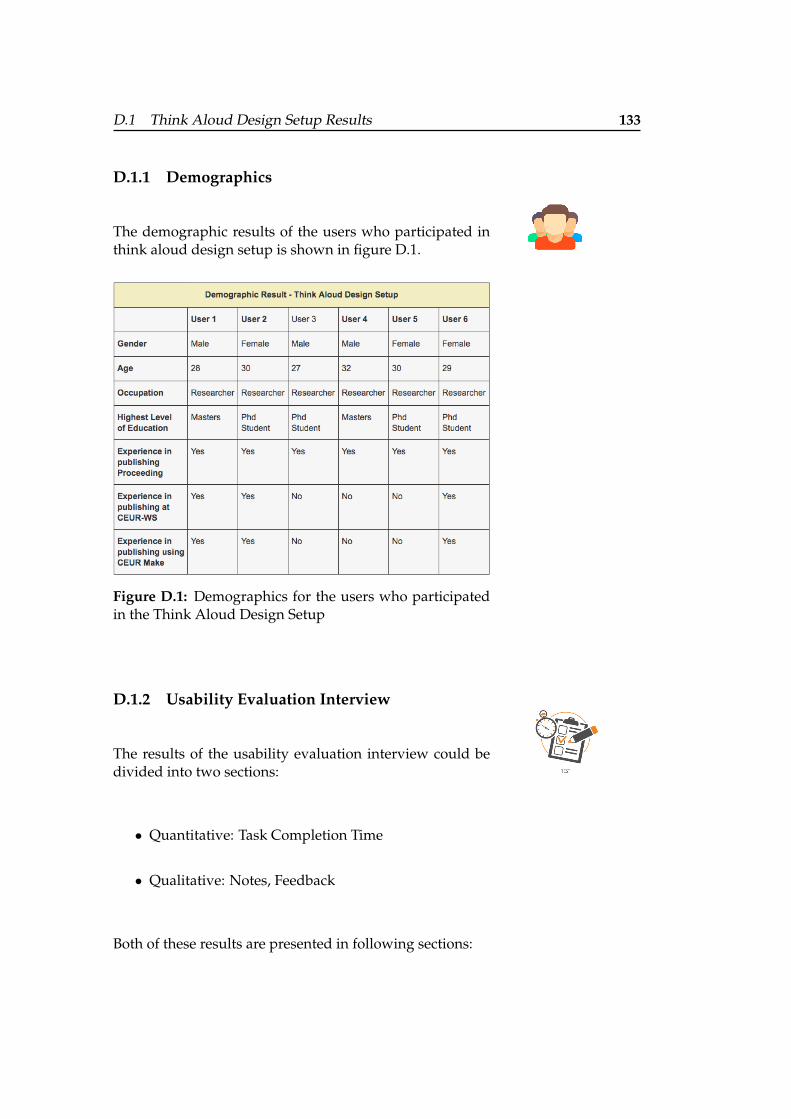
D.1 Think Aloud Design Setup Results 133
D.1.1 Demographics
The demographic results of the users who participated inthink aloud design setup is shown in figure D.1.
Figure D.1: Demographics for the users who participatedin the Think Aloud Design Setup
D.1.2 Usability Evaluation Interview
The results of the usability evaluation interview could bedivided into two sections:
• Quantitative: Task Completion Time
• Qualitative: Notes, Feedback
Both of these results are presented in following sections:
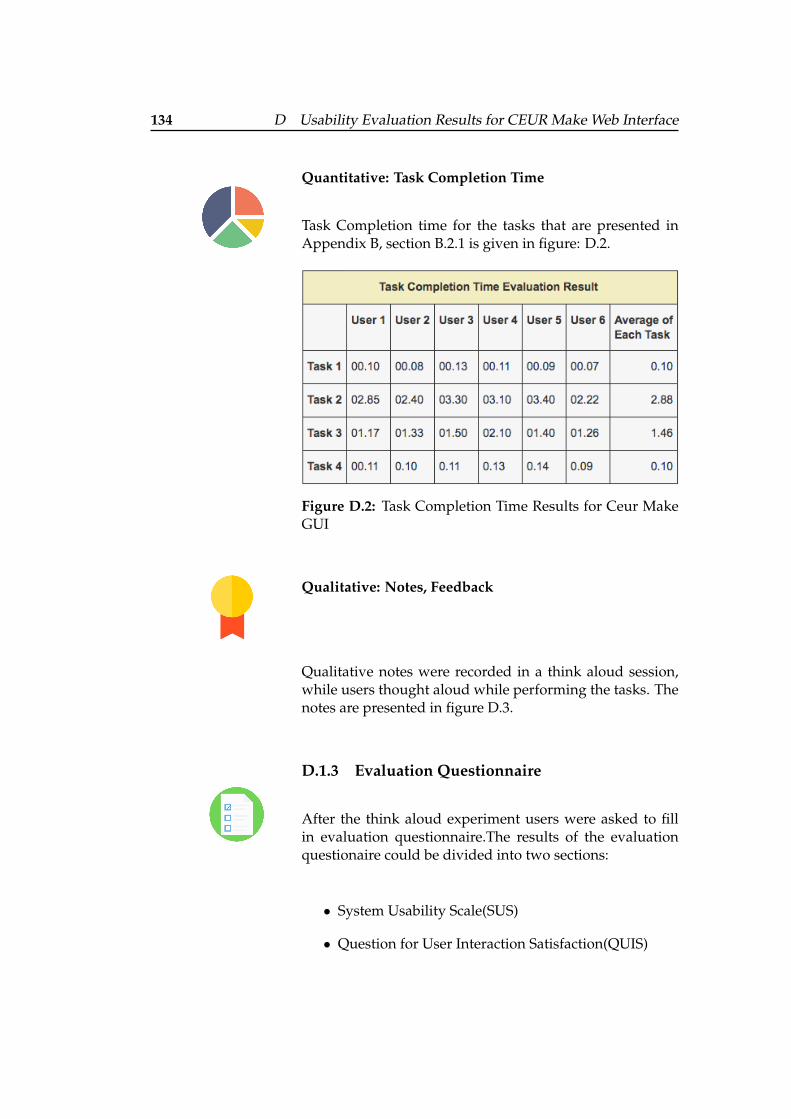
134 D Usability Evaluation Results for CEUR Make Web Interface
Quantitative: Task Completion Time
Task Completion time for the tasks that are presented inAppendix B, section B.2.1 is given in figure: D.2.
Figure D.2: Task Completion Time Results for Ceur MakeGUI
Qualitative: Notes, Feedback
Qualitative notes were recorded in a think aloud session,while users thought aloud while performing the tasks. Thenotes are presented in figure D.3.
D.1.3 Evaluation Questionnaire
After the think aloud experiment users were asked to fillin evaluation questionnaire.The results of the evaluationquestionaire could be divided into two sections:
• System Usability Scale(SUS)
• Question for User Interaction Satisfaction(QUIS)
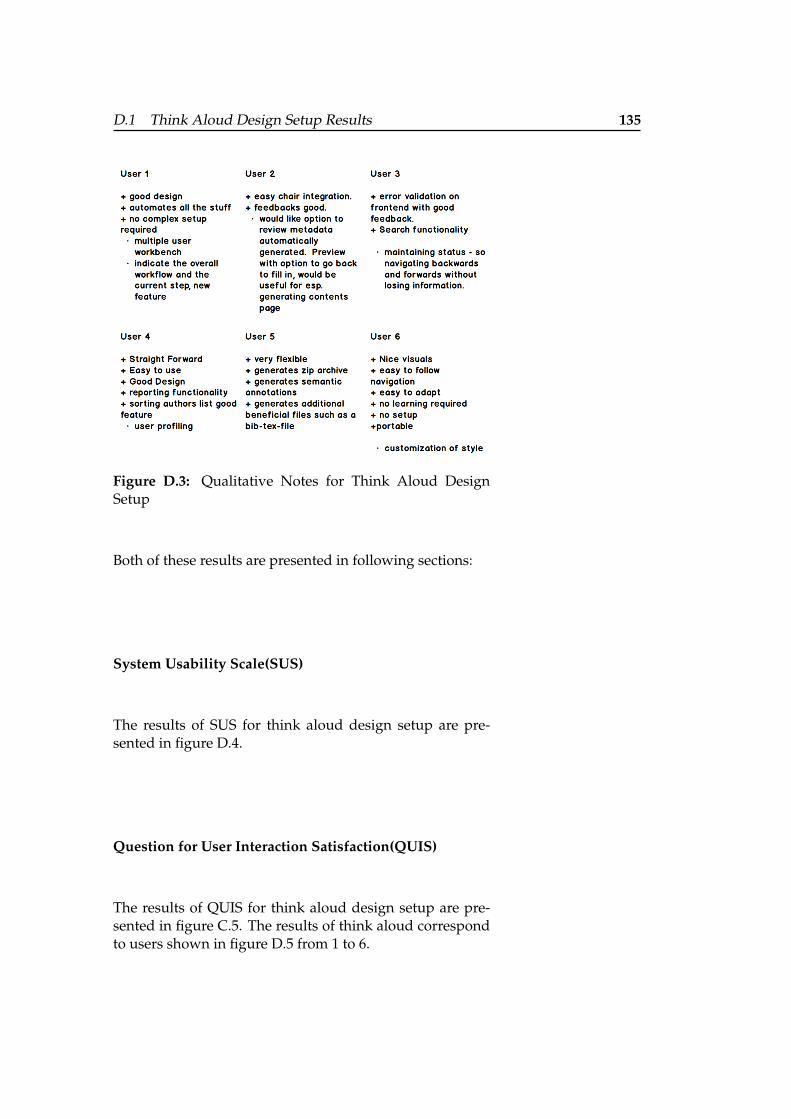
D.1 Think Aloud Design Setup Results 135
Figure D.3: Qualitative Notes for Think Aloud DesignSetup
Both of these results are presented in following sections:
System Usability Scale(SUS)
The results of SUS for think aloud design setup are pre-sented in figure D.4.
Question for User Interaction Satisfaction(QUIS)
The results of QUIS for think aloud design setup are pre-sented in figure C.5. The results of think aloud correspondto users shown in figure D.5 from 1 to 6.
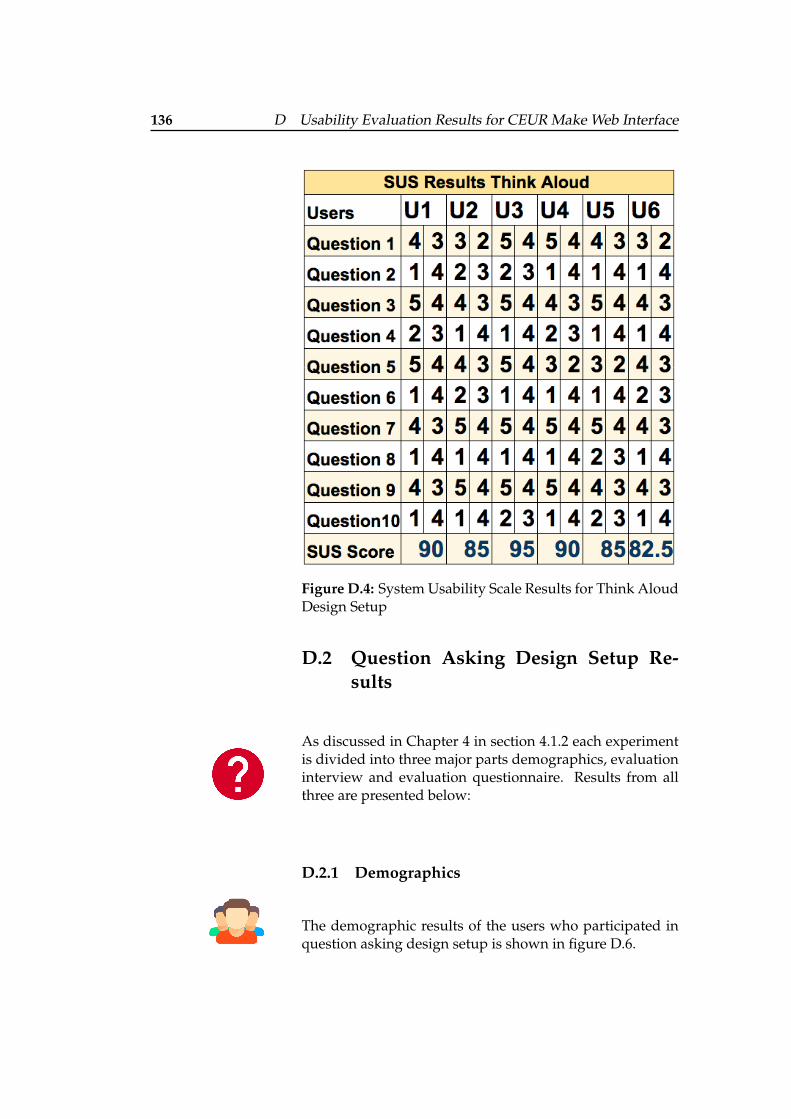
136 D Usability Evaluation Results for CEUR Make Web Interface
Figure D.4: System Usability Scale Results for Think AloudDesign Setup
D.2 Question Asking Design Setup Re-sults
As discussed in Chapter 4 in section 4.1.2 each experimentis divided into three major parts demographics, evaluationinterview and evaluation questionnaire. Results from allthree are presented below:
D.2.1 Demographics
The demographic results of the users who participated inquestion asking design setup is shown in figure D.6.
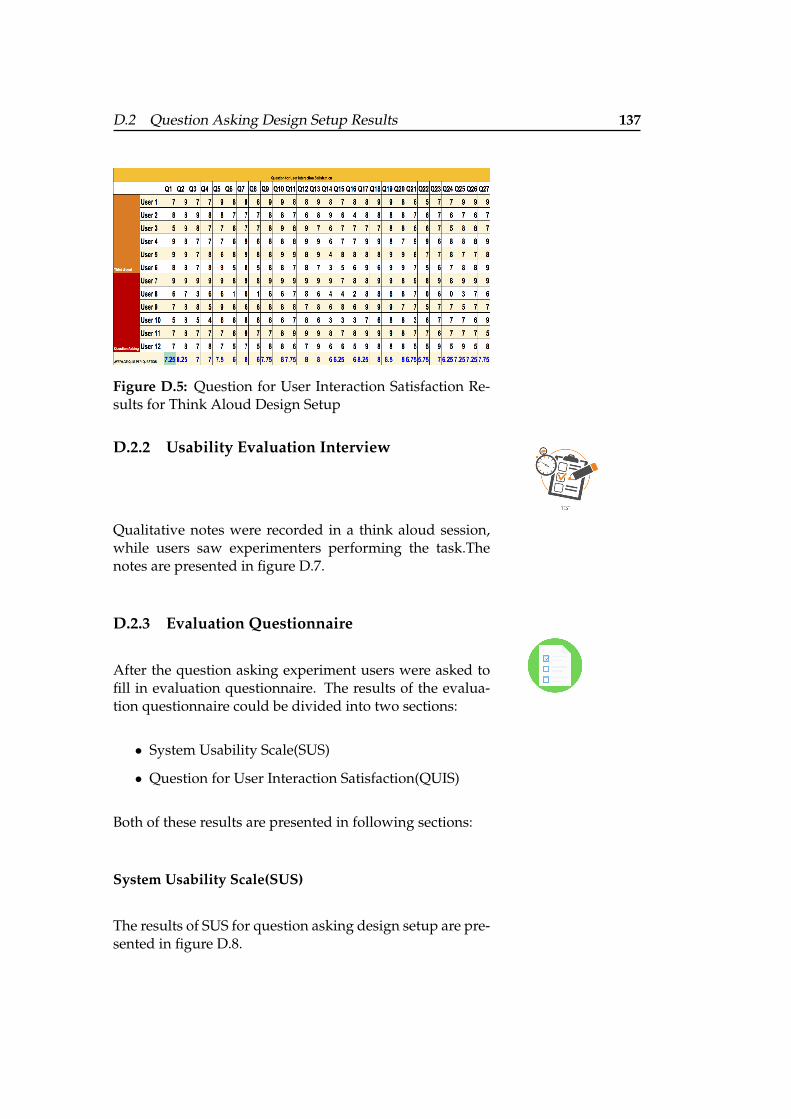
D.2 Question Asking Design Setup Results 137
Figure D.5: Question for User Interaction Satisfaction Re-sults for Think Aloud Design Setup
D.2.2 Usability Evaluation Interview
Qualitative notes were recorded in a think aloud session,while users saw experimenters performing the task.Thenotes are presented in figure D.7.
D.2.3 Evaluation Questionnaire
After the question asking experiment users were asked tofill in evaluation questionnaire. The results of the evalua-tion questionnaire could be divided into two sections:
• System Usability Scale(SUS)
• Question for User Interaction Satisfaction(QUIS)
Both of these results are presented in following sections:
System Usability Scale(SUS)
The results of SUS for question asking design setup are pre-sented in figure D.8.
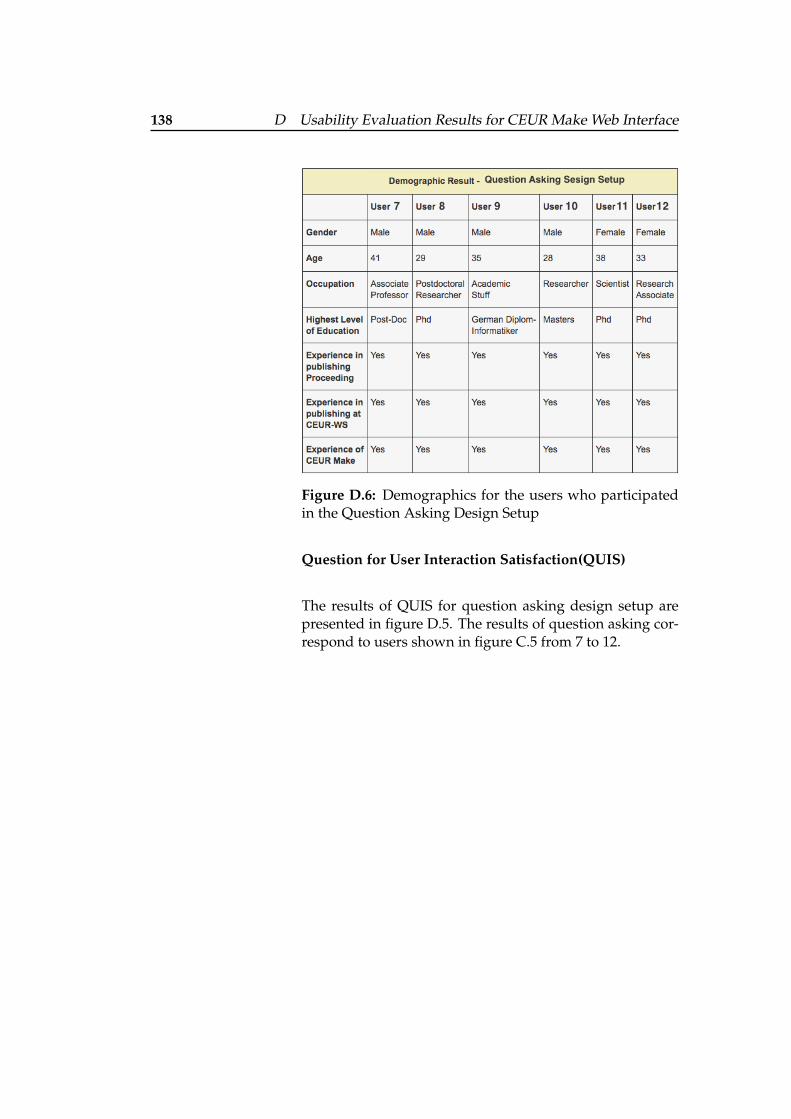
138 D Usability Evaluation Results for CEUR Make Web Interface
Figure D.6: Demographics for the users who participatedin the Question Asking Design Setup
Question for User Interaction Satisfaction(QUIS)
The results of QUIS for question asking design setup arepresented in figure D.5. The results of question asking cor-respond to users shown in figure C.5 from 7 to 12.
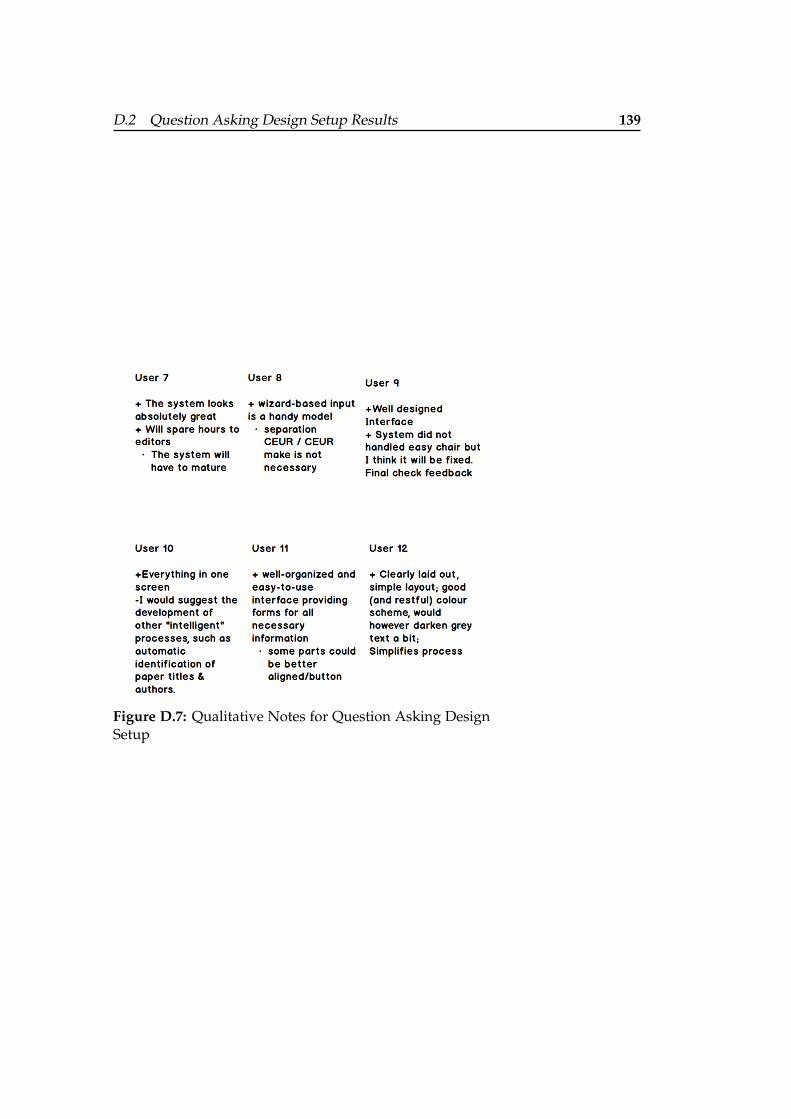
D.2 Question Asking Design Setup Results 139
Figure D.7: Qualitative Notes for Question Asking DesignSetup
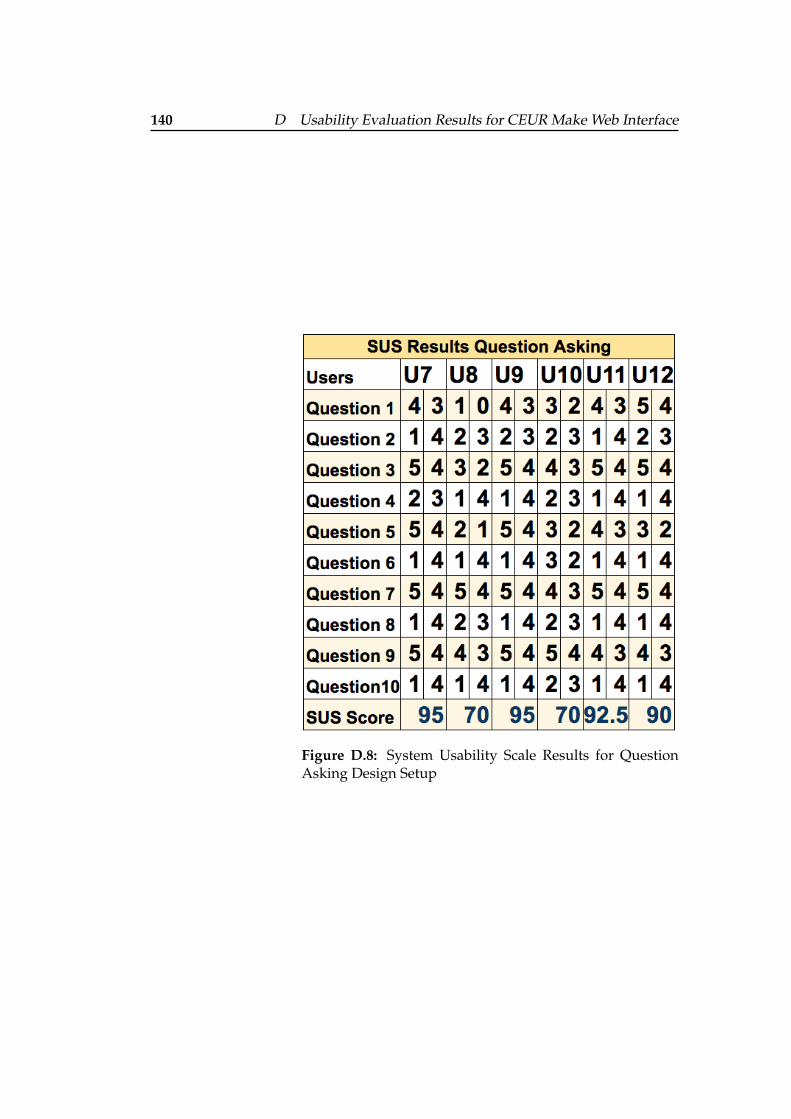
140 D Usability Evaluation Results for CEUR Make Web Interface
Figure D.8: System Usability Scale Results for QuestionAsking Design Setup
141
Appendix E
Source Code
The source code of CEUR Make Graphical User Interfaceis available on the following Github repository: https://github.com/ceurws/ceur-make-ui.
The source code is also written on the attached CD.
142
Bibliography
[1] 9241-210:2010, I. ISO: Ergonomics of human-systeminteraction - Part 210, human-centred design for inter-active systems. http://www.iso.org/iso/home/store/catalogue_ics/catalogue_detail_ics.htm?csnumber=52075. [Online; accessed2016-09-21].
[2] ACM. Preparation of Proceedings formattingrules. http://www.acm.org/sigs/volunteer_resources/conference_manual/6-5proc/,2015. [Online; accessed 2016-09-07].
[3] CEUR. CEUR Workshop Proceedings , open sourcepublishing. www.ceur-ws.org. [Online; accessed2016-09-13].
[4] CHAIR, E. Conference Management System supportsall the conference managing tasks and proceedingsgeneration task. http://easychair.org/. [On-line; accessed 2016-09-08].
[5] CHRISTOPHER ALEXANDER, SARA ISHIKAWA, M. S.M. J. I. F.-K. S. A. A Pattern Language: Towns, Build-ings, Construction (Center for Environmental Structure).Oxford University Press, 1977.
[6] CONFERENCE, G. V. Virtual Scientific Conference pro-ceedings.
[7] CONFTOOL. Conference Management Tool overview.http://www.conftool.net/en/index.html,2016. [Online; accessed 2016-10-07].
[8] DON NORMAN, J. N. Nielsen and Norman evidence-based user experience research, training, and consult-
Bibliography 143
ing. https://www.nngroup.com/. [Online; ac-cessed 2016-09-21].
[9] DONALD A. NORMAN, S. W. D. User Centered Sys-tem Design: New Perspectives on Human-computer Inter-action. CRC Press, 1986.
[10] DR. KENT L. NORMAN, D. B. S. Questionnairefor User Interaction Satisfaction quis. http://www.lap.umd.edu/quis/. [Online; accessed 2016-09-25].
[11] EASYCHAIR. Application of EasyChair the con-ference system. http://www.easychair.org/easychair.cgi. [Online; accessed 2016-10-25].
[12] EASYCHAIR. Users of EasyChair the conference sys-tem. http://www.easychair.org/users.cgi.[Online; accessed 2016-10-25].
[13] ERICH GAMMA, RICHARD HELM, R. J. J. V. DesignPatterns: Elements of Reusable Object-Oriented Software.Addison-Wesley, 1994.
[14] HEWETT, BAECKER, C. C. G. M. P. S., AND VER-PLANK. Curricula human computer interaction tech-nology.
[15] IEEE. Preparation of Proceedings stan-dard templates. https://www.ieee.org/conferences_events/conferences/publishing/templates.html. [Online; accessed2016-09-07].
[16] JAKOB NIELSEN, T. K. L. A mathematical model ofthe finding of usability problems.
[17] MAKE, C. CEUR Make , terminal based utilityfor workflow automation. https://github.com/ceurws/ceur-make. [Online; accessed 2016-09-13].
[18] MICROSOFT. Microsoft’s Academic ConferenceManagement Service overview. https://cmt.research.microsoft.com/cmt/, 2016. [Online;accessed 2016-09-07].
[19] MYERS, B. A. A brief history of human computer in-teraction technology. ACM interactions 5, 2 (1998), 44–54.
144 Bibliography
[20] NIELSEN, J. Morgan Kaufmann. O’Reilly Media, 1993.
[21] NORMAN, D. A. The design of everyday things.
[22] PROCEEDINGS, C. W. CEUR Workshop Proceed-ings rules for publishing. http://ceur-ws.org/HOWTOSUBMIT.html#PREPARE. [Online; accessed2016-10-25].
[23] SARI KUJALA, VIRPI ROTO, K. V.-V.-M. E. K., AND
SINNELÄ, A. Ux curve: A method for evaluating long-term user experience.
[24] STUART K. CARD, ALLEN NEWELL, T. P. M. The psy-chology of human-computer interaction.
[25] SUNIL I. HAZARI, R. R. R. Student preferences to-ward microcomputer user interfaces.
[26] TIDWELL, J. Designing Interfaces grid ofequals. http://designinginterfaces.com/patterns/grid-of-equals/. [Online; accessed2016-10-25].
[27] TIDWELL, J. Designing Interfaces grid of equalscnn. http://designinginterfaces.com/wp-content/images/grid-of-equals-cnn.png. [Online; accessed 2016-10-25].
[28] TIDWELL, J. Designing Interfaces grid of equalshulu. http://designinginterfaces.com/wp-content/images/grid-of-equals-hulu.png. [Online; accessed 2016-10-25].
[29] TIDWELL, J. Designing Interfaces patterns. http://designinginterfaces.com/patterns/. [On-line; accessed 2016-09-20].
[30] TIDWELL, J. Designing Interfaces. O’Reilly Media,November 1, 2005.
[31] TODD CORAM, J. L. A Pattern Language forUser Interface Design experiences. http://www.maplefish.com/todd/papers/Experiences.html. [Online; accessed 2016-09-16].
Bibliography 145
[32] U, M. Measuring Usability With The System UsabilityScale (SUS) , interpreting sus scores. http://www.measuringu.com/sus.php. [Online; accessed 2016-10-13].
[33] U, M. Measuring Usability With The System UsabilityScale (SUS) the system usability scale. http://www.measuringu.com/sus.php. [Online; accessed 2016-09-24].
[34] UIPATTERNS. User Interaction Design Pattern Li-brary: autocomplete. http://ui-patterns.com/patterns/Autocomplete, 2016. [Online; accessed2016-09-23].
[35] UIPATTERNS. User Interaction Design Pattern Library:card. http://ui-patterns.com/patterns/cards, 2016. [Online; accessed 2016-09-23].
[36] UIPATTERNS. User Interaction Design Pattern Li-brary: pagination. http://ui-patterns.com/patterns/Pagination, 2016. [Online; accessed2016-10-23].
[37] UIPATTERNS. User Interaction Design Pattern Library:wizard. http://ui-patterns.com/patterns/Wizard, 2016. [Online; accessed 2016-10-23].
[38] UNIVERSITY, N. D. D. N. Sample Form:consent cover letter for survey research.http://www.ndnu.edu/academics/research/consent-cover-letter-for-survey-research/,2016. [Online; accessed 2016-10-25].
[39] VERMA, P. Gracoli: A graphical command line userinterface.

Typeset November 19, 2016