^igs-o-mn-001(0) april 2016 دﺳﺘﻮراﻟﻌﻤﻞ ﺟﻤﻊ آوري و ﺗﺒﺎدل...
TRANSCRIPT

^IGS-O-MN-001(0) April 2016
Recommended Practice دستورالعمل پيشنهادي
شركت ملي گازايران
IGS
مديريت پژوهش و فنĤوريامورتدوين استانداردها
اين دستورالعمل با توجه به تجربيات عملي و فني كارشناسان شركت ملي گاز تهيه گرديده و استفاده از آن به مدت 1 سال از زمان انتشار الزامي نبوده و صرفاً جهت راهنمايي مي باشد. از كليه كاربران محترم اين دستورالعمل درخواست مي گردد نظرات اصالحي خود را جهت بررسي به امور
تدوين استانداردها اعالم نمايند.بديهي است پس از زمان مقرر اقدامات مقتضي بمنظور اخذ مصوبه ه .م .م جهت الزامي نمودن آن ، صورت خواهد پذيرفت.
دستورالعمل جمع آوري و تبادل اطالعات نگهداري و تعميرات و قابليت اطمينان براي تجهيزات در صنايع گاز طبيعي
Collection and exchange of reliability and maintenance data for equipments in the natural gas industries
Fax:(9821)-8487-5032 براي استفاده ازاستانداردها فقط به آخرين نسخه منتشرشده درسايت استانداردها مراجعه گردد
http://igs.nigc.ir [email protected]

r~o : , 11
\Vt II - •/ · ..... JJI ·
· ~ 1 • ..:;.5 • ·· ·LL-· ..) v- ...>--'-"' ~ ~.)) . • j
.SJ~w' ~.sx. r ~ .i . ..~..o ..? J .. ..::;.) ' \.S""' J) ~ J ~ 1 f .~.;i.:>:..JJ ._-.h
J~ j .... M .JY.Y. ~l_;y.._u..J ,s.)L.... o:~..J~ s:>\.:.J) J ":'--:l:U .J..;J_;;,.J..)i.o . ...::...u-1 ,)Y-1

N.I.G.C April 2016 IGS-O-MN-001(0)
1
CONTENTS PAGES
1. SCOPE 2
2. REFERENCES 3
3. TERMS & DEFINITIONS 5
4. APPLICATIONS 12
5.BENEFITS OF RM DATA COLLECTION AND EXCHANGE 14
6. QUALITY OF DATA 16
7. EQUIPMENT BOUNDARY, TAXONOMY AND TIME DEFINITIONS 20
8. RECOMMENDED DATA FOR EQUIPMENT, FAILURES AND MAINTENANCE 26
APPENDIXES
ANNEX A: (INFORMATIVE) EQUIPMENT-CLASS ATTRIBUTES 34
ANNEX B: (NORMATIVE) INTERPRETATION AND NOTATION OF FAILURE AND
MAINTENANCE PARAMETERS 99
ANNEX C: (INFORMATIVE) GUIDE TO INTERPRETATION AND CALCULATION OF DERIVED
RELIABILITY AND MAINTENANCE PARAMETERS 115
ANNEX D: (INFORMATIVE) TYPICAL REQUIREMENTS FOR DATA 133
ANNEX E: (INFORMATIVE) KEY PERFORMANCE INDICATORS (KPIS) AND BENCHMARKING 139
ANNEX F: (INFORMATIVE) CLASSIFICATION AND DEFINITION OF SAFETY-CRITICAL
FAILURES 148

N.I.G.C April 2016 IGS-O-MN-001(0)
2
1. SCOPE
This Standard provides a comprehensive basis for the collection of reliability and maintenance (RM) data in a standard format for equipment in all facilities and operations within natural gas industry during the operational life cycle of equipment. It describes data-collection principles and associated terms and definitions that constitute a “reliability language” that can be useful for communicating operational experience. The failure modes defined in the normative part of this Standard can be used as a “reliability thesaurus” for various quantitative as well as qualitative applications. This Standard also describes data quality control and assurance practices to provide guidance for the user.
Standardization of data-collection practices facilitates the exchange of information between parties, e.g. plants, owners, manufacturers and contractors. This Standard establishes requirements that any in-house or commercially available RM data system is required to meet when designed for RM data exchange. Examples, guidelines and principles for the exchange and merging of such RM data are addressed.
Annex A contains a summary of equipment that this Standard covers.
• This Standard recommends a minimum amount of data that is required to be collected and it focuses on two main issues:
o Data requirements for the type of data to be collected for use in various analysis methodologies;
o Standardized data format to facilitate the exchange of reliability and maintenance data between plants, owners, manufacturers and contractors.
• The following main categories of data are to be collected:
o Equipment data, e.g. equipment taxonomy, equipment attributes;
o Failure data, e.g. failure cause, failure consequence;
o Maintenance data, e.g. maintenance action, resources used, maintenance consequence, down time.
NOTE Clause 9 gives further details on data content and data format.
• The main areas where such data are used are the following:
o reliability, e.g. failure events and failure mechanisms;
o availability/efficiency, e.g. equipment availability, system availability, plant production availability;
o maintenance, e.g. corrective and preventive maintenance, maintenance supportability;
o Safety and environment, e.g. equipment failures with adverse consequences for safety and/or environment.
• This Standard does not apply to the following:
o data on (direct) cost issues;
o data from laboratory testing and manufacturing (e.g. accelerated lifetime testing);
o complete equipment data sheets (only data seen relevant for assessing the reliability performance are included);
o Additional on-service data that an operator, on an individual basis, can consider useful for operation and maintenance;
o Methods for analyzing and applying RM data (however, principles for how to calculate some basic reliability and maintenance parameters are included in the annexes).

N.I.G.C April 2016 IGS-O-MN-001(0)
3
2. REFERENCES
2.1. Normative References
ISO 14224:2006, Petroleum, petrochemical and natural gas industries — Collection and exchange of reliability and maintenance data for equipment
IEC 60034-1:2004, rotating electrical machines — Part 1: Rating and performance
IEC 60076-1:2000, Power transformers — Part 1: General
IEC 60076-2:1993, Power transformers — Part 2: Temperature rise
IEC 60076-3, Power transformers — Part 3: Insulation levels, dielectric tests and external clearances in air
IEC 60529:2001, Degrees of protection provided by enclosures (IP Code)
IEC 62114, Electrical insulation systems — Thermal classification
ENG-WI-04-1:2013, Equipment RM data collecting procedure, Iranian Gas Transmission Company
2.2. Informative References
IEC 60050-191:1990, quality of service Electrotechnical Vocabulary.
IEC 60079 (all parts), Electrical apparatus for explosive gas atmospheres
IEC 60300-1, Dependability management — Part 1: Dependability management systems
IEC 60300-2, Dependability management — Part 2: Guidelines for dependability management
IEC 60300-3-1, Dependability management — Part 3: Application guide — Analysis techniques for dependability — Guide on methodology
IEC 60300-3-2, Dependability management — Part 3: Application guide — Collection of dependability data from the field
IEC 60300-3-3, Dependability management — Part 3: Application guide — Life cycle costing
IEC 60300-3-4, Dependability management — Part 3: Application guide — Section 4: Guide to the specification of dependability requirements
IEC 60300-3-5, Dependability management — Part 3-5: Application guide — Reliability test conditions and statistical test principles
IEC 60300-3-6, Dependability aspects of dependability management —Part 3: Application guide
IEC 60300-3-7, Dependability management — screening of electronic hardware Part 3-7: Application guide
IEC 60300-3-9, Dependability management — Part 3: Application guide — Section 9: Risk analysis of technological systems
IEC 60300-3-10, Dependability management — Part 3-10: Application guide — Maintainability
IEC 60300-3-11, Dependability management — Part 3-11: Application guide — RCM
IEC 60300-3-12, Dependability management — Part 3-12: Application guide — integrated logistic support
IEC 60319, Presentation and specification of reliability data for electronic components
IEC 60381-2, Analog signals for process control systems — Part 2: Direct voltage signals
IEC 60605-4, Equipment reliability testing — Part 4: Statistical procedures for exponential distribution — Point estimates, confidence intervals, prediction intervals and tolerance intervals
IEC 60605-6, Equipment reliability testing — Part 6: Test for the validity of the constant failure rate or constant failure intensity assumptions
IEC 60706-1, Guide on maintainability program of equipment — Part 1: Introduction, requirements
IEC 60706-2, Guide on maintainability of equipment — Part 2: Maintainability studies during the design phase
IEC 60706-3, Guide on maintainability of equipment — Part 3: Verification and collection, analysis and presentation of data

N.I.G.C April 2016 IGS-O-MN-001(0)
4
IEC 60706-4, Guide on maintainability of equipment — Part 4: Maintenance and maintenance support planning
IEC 60706-5, Guide on maintainability of equipment — Part 5: Diagnostic testing
IEC 60706-6, Guide on maintainability of equipment — Part 6: Statistical methods in maintainability evaluation
IEC 60812, Analysis techniques for system reliability — Procedure for failure mode and effects analysis (FMEA)
IEC 60863, Presentation of reliability, maintainability and availability predictions
IEC 61025, Fault tree analysis (FTA)
IEC 61070, Compliance test procedures for steady-state availability
IEC 61078, Analysis techniques for dependability — Reliability block diagram method
IEC 61123, Reliability testing — Compliance test plans for success ratio
IEC 61124, Reliability testing — Compliance tests for constant failure rate and constant failure intensity
IEC 61164, Reliability growth — Statistical test and estimation methods
IEC 61165, Application of Markov techniques
IEC 61508 (all parts), Functional safety of electrical/electronic/programmable electronic safety-related systems
IEC 61511 (all parts):2004, Functional safety: Safety instrumented systems for the process industry sector
IEC 61649:1997, Goodness-of-fit tests, confidence intervals and lower confidence limits for Weibull
IEC 61650:1997, Reliability data analysis techniques — Procedures for comparison of two constant failure rates and two constant failure (event) intensities
IEC 61703:2001, Mathematical expressions for reliability, availability, maintainability and maintenance support terms
EN 13306:2001, Maintenance terminology
ISO 3977 (all parts), Gas turbines — Procurement
ISO 5208:1993, Industrial valves — Pressure testing of valves
ISO 14001, Environmental management systems — Requirements with guidance for use
ISO 15663-1:2000, Petroleum and natural gas industries — Life cycle costing — Part 1: Methodology
ISO 15663-2:2001, Petroleum and natural gas industries — Life cycle costing — Part 2: Guidance on application of methodology and calculation methods
ISO 15663-3:2001, Petroleum and natural gas industries — Life cycle costing — Part 3: Implementation guidelines
ISO 15926 (all parts), Industrial automation systems and integration — Integration of life-cycle data for process plants including oil and gas production facilities
ISO 17776:2000, Petroleum and natural gas industries — Offshore production installations — Guidelines on tools and techniques for hazard identification and risk assessment
ISO 19900:2002, Petroleum and natural gas industries — General requirements for offshore structures
SAE JA1011:1999, Evaluation Criteria for RCM Processes
SAE JA1012:2002, A Guide to the Reliability Centered Maintenance (RCM) Standard
NORSOK N-001, Rev. 3, Aug, 2000, Structural design
NORSOK Z-008:2001, Criticality analysis for maintenance purposes
NORSOK Z-013:2001, Risk and emergency preparedness analysis
NORSOK Z-016:1998, Regularity management & reliability technology
API RP 14B, Design, Installation, Repair and Operation of Subsurface Safety Valve Systems (API Recommended Practice), July 1994
API RP 580, Risk-Based Inspection (API Recommended Practice), May 2002
MIL-STD-1629A, Procedures for performing FMEA-analysis
N.I.G.C April 2016 IGS-O-MN-001(0)
5
3. TERMS & DEFINITIONS
3.1. DEFINITIONS
For the purposes of this document, the following terms and definitions apply.
NOTE some derived RM parameters, which can be calculated from collected RM data covered by this Standard, are contained in Annex C. References to Annex C are given as deemed appropriate.
3.1.1.Availability
Ability of an item to be in a state to perform a required function under given conditions at a given instant of time or over a given time interval, assuming that the required external resources are provided
NOTE for a more detailed description and interpretation of availability, see Annex C.
3.1.2.Active Maintenance Time
That part of the maintenance time during which a maintenance action is performed on an item, either automatically or manually, excluding logistic delays
NOTE 1 A maintenance action can be carried out while the item is performing a required function.
NOTE 2 for a more detailed description and interpretation of maintenance times, see Figure 4 and Annex C.
3.1.3.Boundary
Interface between an item and its surroundings
3.1.4.Common-Cause Failure
Failures of different items resulting from the same direct cause, occurring within a relatively short time, where these failures are not consequences of another
NOTE Components that fail due to a shared cause normally fail in the same functional mode. The term common mode is, therefore, sometimes used. It is, however, not considered to be a precise term for communicating the characteristics that describe a common-cause failure.
3.1.5.Corrective Maintenance
Maintenance carried out after fault recognition and intended to put an item into a state in which it can perform a required function
NOTE For more specific information, see IEC 60050-191:1990, Figure 191-10.
3.1.6.Critical Failure
Failure of an equipment unit that causes an immediate cessation of the ability to perform a required function
NOTE Includes failures requiring immediate action towards cessation of performing the function, even though actual operation can continue for a short period of time. A critical failure results in an unscheduled repair.
3.1.7.Degraded Failure
Failure that does not cease the fundamental function(s), but compromises one or several functions

N.I.G.C April 2016 IGS-O-MN-001(0)
6
NOTE the failure can be gradual, partial or both. The function can be compromised by any combination of reduced, increased or erratic outputs. An immediate repair can normally be delayed but, in time, such failures can develop into a critical failure if corrective actions are not taken.
3.1.8.Demand
Activation of the function (includes functional, operational and test activation) NOTE for a more detailed description, see C.2.2.
3.1.9.Down state
Internal disabled state of an item characterized either by a fault or by a possible inability to perform a required function during preventive maintenance
NOTE this state is related to availability performance (see 3.1).
3.1.10.Down time
Time interval during which an item is in a down state
NOTE the down time includes all the delays between the item failure and the restoration of its service. Down time can be either planned or unplanned (see Table 4).
3.1.11. Equipment
3.1.11.1.Equipment Class
Class of similar type of equipment units (e.g. all pumps) NOTE Annex A describes a variety of equipment classes.
3.1.11.2.Equipment Data
Technical, operational and environmental parameters characterizing the design and use of an equipment unit
3.1.11.3.Equipment Unit
Specific equipment unit within an equipment class as defined by its boundary (e.g. one pump)
3.1.12.Error
Discrepancy between a computed, observed or measured value or condition and the true, specified or theoretically correct value or condition
NOTE 1 an error can be caused by a faulty item, e.g. a computing error made by faulty computer equipment.
NOTE 2 The French term “erreur” can also designate a mistake.
3.1.13.Failure
Termination of the ability of an item to perform a required function
NOTE 1 after the failure, the item has a fault.
NOTE 2 “Failure” is an event, as distinguished from a “fault,” which is a state.
NOTE 3 this concept as defined does not apply to items consisting of software only.

N.I.G.C April 2016 IGS-O-MN-001(0)
7
NOTE 4 See also Table B.1 and Clauses F.2 and F.3.
3.1.13.1.Failure Cause Root Cause
Circumstances associated with design, manufacture, installation, use and maintenance that have led to a failure
NOTE See also B.2.3.
3.1.13.2.Failure Data
Data characterizing the occurrence of a failure event
3.1.13.3.Failure Impact
Impact of a failure on equipment's function(s) or on the plant
NOTE On the equipment level, failure impact can be classified in three classes (critical, degraded and incipient); see 4.6,
4.7 and 4.26). Classification of failure impact on taxonomy levels 3 to 5 (see Figure 3) is shown in Table 3.
3.1.13.4.Failure Mechanism
Physical, chemical or other process that leads to a failure
NOTE See also B.2.2.
3.1.13.5.Failure Mode
Effect by which a failure is observed on the failed item
NOTE See also B.2.6.
3.1.13.6.Failure on Demand
Failure occurring immediately when the item is solicited to start (e.g. stand-by emergency equipment)
NOTE See also Clause C.6.
3.1.14.Fault
State of an item characterized by inability to perform a required function, excluding such inability during preventive maintenance or other planned actions, or due to lack of external resources
3.1.15.Generic Reliability Data
Reliability data covering families of similar equipment
3.1.16.Hidden Failure
Failure that is not immediately evident to operations and maintenance personnel
NOTE Equipment that fails to perform an “on demand” function falls into this category. It is necessary that such failures be detected to be revealed.
3.1.17.Idle Time

N.I.G.C April 2016 IGS-O-MN-001(0)
8
Part of the up time that an item is not operating
3.1.18.Incipient Failure
Imperfection in the state or condition of an item so that a degraded or critical failure might (or might not) eventually be the expected result if corrective actions are not taken
3.1.19.Indenture Level
Level of subdivision of an item from the point of view of maintenance action
3.1.20.Item
Any part, component, device, subsystem, functional unit, equipment or system that can be individually considered
NOTE In this Standard, the common term “item” is used on all taxonomy levels 6 to 9 in Figure 3. See also 3.30, which define a specific item level.
3.1.21.Logistic Delay
That accumulated time during which maintenance cannot be carried out due to the necessity to acquire maintenance resources, excluding any administrative delay
NOTE Logistic delays can be due to, for example, travelling to unattended installations, pending arrival of spare parts, specialist, test equipment and information, and delays due to unsuitable environmental conditions (e.g. waiting on weather).
3.1.22.Maintainable Item
Item that constitutes a part or an assembly of parts that is normally the lowest level in the equipment hierarchy during maintenance
3.1.22.1.Maintenance
Combination of all technical and administrative actions, including supervisory actions, intended to retain an item in, or restore it to, a state in which it can perform a required function
3.1.22.2.Maintenance Data
Data characterizing the maintenance action planned or done
3.1.22.3Maintenance Impact
Impact of the maintenance on the plant or equipment’s function(s)
NOTE On the equipment level, two severity classes are defined: critical and non-critical. On plant level, three classes are defined: total, partial or zero impact.
3.1.22.4.Maintenance Record
Part of maintenance documentation that contains all failures, faults and maintenance information relating to an item
NOTE this record can also include maintenance costs, item availability or up time and any other data where relevant.
3.1.22.5.Maintainability

N.I.G.C April 2016 IGS-O-MN-001(0)
9
⟨general⟩ ability of an item under given conditions of use, to be retained in, or restored to, a state in which it can perform a required function, when maintenance is performed under given conditions and using stated procedures and resources
NOTE For a more detailed definition and interpretation of maintainability, see Annex C.
3.1.22.6.Maintenance Man-Hours
Accumulated duration of the individual maintenance times used by all maintenance personnel for a given type of maintenance action or over a given time interval
NOTE 1 Maintenance man-hours are expressed in units of hours.
NOTE 2 as several people can work at the same time, man-hours are not directly related to other parameters like MTTR or MDT (see definitions in Annex C.5).
3.1.23.Modification
Combination of all technical and administrative actions intended to change an item
NOTE Modification is not normally a part of maintenance, but is frequently performed by maintenance personnel.
3.1.24.Non-Critical Failure
Failure of an equipment unit that does not cause an immediate cessation of the ability to perform its required function
NOTE Non-critical failures can be categorized as “degraded” (3.7) or “incipient” (3.26).
3.1.25.Operating State
State when an item is performing a required function
3.1.26.Operating Time
Time interval during which an item is in operating state
NOTE Operating time includes actual operation of the equipment or the equipment being available for performing its required function on demand. See also Table 4.
3.1.27.Opportunity Maintenance
Maintenance of an item that is deferred or advanced in time when an unplanned opportunity becomes available
3.1.28.Preventive Maintenance
Maintenance carried out at predetermined intervals or according to prescribed criteria and intended to reduce the probability of failure or the degradation of the functioning of an item
3.1.29.Redundancy
Existence of more than one means for performing a required function of an item
NOTE For more detailed definitions and interpretations, see C.1.2.
3.1.30.Reliability

N.I.G.C April 2016 IGS-O-MN-001(0)
10
Ability of an item to perform a required function under given conditions for a given time interval
NOTE 1 The term “reliability” is also used as a measure of reliability performance and can also be defined as a probability.
NOTE 2 for more detailed definitions and interpretations see Annex C.
3.1.31.Required Function
Function or combination of functions of an item that is considered necessary to provide a given service
3.1.32.Subunit
Assembly of items that provides a specific function that is required for the equipment unit within the main boundary to achieve its intended performance
3.1.33.Surveillance Period
Interval of time (calendar time) between the start date and end date of RM data collection
NOTE For more detailed definitions and interpretations, see Annex C.
3.1.34.Tag Number
Number that identifies the physical location of equipment
NOTE For more detailed definitions and interpretations, see Annex C.
3.1.35.Taxonomy
Systematic classification of items into generic groups based on factors possibly common to several of the items
3.1.36.Up State
State of an item characterized by the fact it can perform a required function, assuming that the external resources, if required, are provided
NOTE this relates to availability performance.
3.1.37.Up Time
Time interval during which an item is in an up state

N.I.G.C April 2016 IGS-O-MN-001(0)
11
3.2. ABBREVIATED TERMS
NOTE Specific abbreviations used for equipment types (e.g. BOP) and units (e.g. kW) are not included in the list below, but covered within each chapter where they are used.
CAPEX capital expenditure NDT nondestructive testing
CDF cumulative distribution function OPEX operational expenditure
CM condition monitoring PM preventive maintenance
CMMIS computerized maintenance management information system
P&ID process and instrument diagram
ESD emergency shutdown PSD process shutdown
FTA fault-tree analysis PSV process safety valve
FMECA failure mode, effect and criticality analysis
QRA quantitative risk assessment
HIPPS high-integrity process-protection system
RA reliability and availability
KPI key performance indicators RAM(S) reliability, availability, maintainability (and safety)
LCC life cycle cost RBI risk-based inspection
LEL lower explosion limit RCM reliability-centered maintenance
MEG Mono ethylene glycol RM reliability and maintenance
MI maintainable item SIL safety integrity level
MTBF mean time between failures SSIV subsea isolation valve
MTTF mean time to failure TEG triethylene glycol
MTTR mean time to repair TTF time to failure
MTTM mean time to maintain TTR time to repair
MUT mean up time WO work order
MDT mean down time
N.I.G.C April 2016 IGS-O-MN-001(0)
12
4. APPLICATIONS
4.1. EQUIPMENT COVERAGE
This Standard is applicable to equipment types used in the natural gas industry, including but not limited to equipment categories such as process equipment and piping, safety equipment, subsea equipment, pipeline systems, loading/unloading equipment. The equipment may be permanently installed at the facilities or used in conjunction with installation, maintenance or modification phases.
Annex A contains examples of how this Standard should be used for specific equipment types. The users are expected to define taxonomies for additional equipment classes as needed based on the principles given by this Standard.
Some principles for RM data collection at equipment level can be applied for monitoring and analyzing performance at plant and system levels constituted by various equipment types. However, facility- and plant-performance monitoring also requires other types of data not covered by this Standard.
4.2. TIME PERIODS
This Standard is applicable to data-collected during the operational life cycle of equipment, including installation, start-up, operation, maintenance and modification. Laboratory testing, manufacturing and fabrication phases are excluded from the scope of this Standard. It is, however, emphasized that analysis of relevant historic RM data shall be used in the dimensioning of such testing prior to operation. Technology qualification and development requirement, and benefit from past reliability knowledge to reveal potential improvement areas (see 8.3).
4.3. USERS OF THIS STANDARD
This Standard is intended for users such as the following.
a) Installation/plant/facility: Operating facility, e.g. maintenance and engineering personnel logging equipment failures or recording maintenance events into facility information management systems.
b) Owner/operator/company: Reliability staff or others creating (generic) equipment reliability databases for equipment located in company facilities; reliability engineers requiring data or maintenance engineers preparing maintenance plans. This Standard provides a format for analyzing any RM data element as appropriate associated with an analysis (as described in Annex D); e.g. root-cause analysis, analysis of historic performance, prediction of future performance, use in a design process, etc.
c) Industry: Groups or companies exchanging equipment RM data or joint industry reliability database project co-operation. Improved communication of equipment reliability performance requires the principles in this Standard to be adhered to (as a “reliability language”).
d) Manufacturers/designers: Use of RM data to improve equipment designs and learn from past experience.
e) Authorities/regulatory bodies: A format for communicating any RM data on an individual-event basis or as
otherwise required from the operating company. This Standard is, for example, vital for authorities addressing safety equipment reliability.
f) Consultant/contractor: A format and quality standard for data collection projects and analyses of safety, reliability or maintenance aspects commonly performed by contractors/consultants for the asset owners (e.g. oil companies).

N.I.G.C April 2016 IGS-O-MN-001(0)
13
While others, such as developers of computer-maintenance-management software, can find this Standard to be useful, the primary users are expected to be owners and/or operators who should find the data to be collected readily available within operating facilities.
4.4. EXCHANGE OF RM DATA
A major objective of this Standard is to make it possible to exchange RM data in a common format within a company, between companies, within an industrial area or in the public domain. Measures for ensuring the quality of data are discussed in Clause 7. Some additional aspects to be considered with respect to exchange of RM data are the following.
a) Detailed versus processed data: Data can be exchanged on various levels from the actual failure and maintenance records to data on a more aggregated level. For example, if only the number of failures of a certain category is required, it is necessary to exchange only the failure rate for these failures. This sort of information is commonly given in public data sources (e.g. reliability-data books). For exchanging data on the overall performance of a unit or a plant (benchmarking), the so-called key performance indicators (KPI) parameters may be used. Examples of such KPI parameters are given in Annex E.
b) Data sensitivity: Some data fields can be of a certain sensitive character and/or possibly be used for purposes for which they were not intended (e.g. to obtain commercial advantages, non-qualified communication of plant/equipment experience). To avoid this, two options can be utilized:
• “blank” such data;
• Make such data anonymous.
The latter can be achieved by defining some anonymous codes representing the data element where only a few authorized persons know the conversion between the codes and the actual data. This is recommended if these data fields are essential for the data taxonomy.
It is important to recognize the potential commercial sensitivity of exchanging reliability and other performance data. Competition law prohibits “collective boycott” agreements or arrangements between competitors where competitors agree not to deal with certain suppliers/contractors. A benchmarking study where competitors exchange information so that suppliers/contractors can be “ranked” incurs a real risk that the parties to the benchmarking study will arrive at a common conclusion not to use particular suppliers/contractors and this should be avoided. Collective boycott arrangements are violations of competition law and can leave individuals and companies exposed to criminal actions.
It is necessary, therefore, that any exchange comply with the national and laws governing anti-competitive practices. Hence, it is recommended that prior to embarking upon such an exercise, clarification of the local guidelines is sought to avoid possible infringement.
c) Data security: Systematized operational-equipment performance (i.e. quality RM data that have a cost to obtain) is an asset generally of great value, and data not open to the public domain shall be treated with appropriate security measures to avoid misuse and not affect the reputation of associated parties. This relates to storage of data (e.g. safe location), transmission of data (e.g. Internet), access to data for authorized users (e.g. password), etc.
d) Value of data: In some cases, it is useful to define a “value measure” for an amount of reliability data. This can be the case in joint industry projects where several contributors are supposed to contribute with an equal “value” of data. Two approaches may be used:
• calculating the actual cost of collecting the data;
• Value the data by combining the population with aggregated surveillance time.

N.I.G.C April 2016 IGS-O-MN-001(0)
14
5. BENEFITS OF RM DATA COLLECTION AND EXCHANGE
Although many plant owners have improved the reliability of their operating facilities, lost production and poor equipment reliability still represent a high annual industrial cost. Even though most failure events are not catastrophic, increased clarity as to the causes of failure events is a key to prioritizing and implementing corrective maintenance actions. This results in sustainable improvements in reliability, leading to improved profitability and safety.
Benefits of reliability data analysis are wide-ranging, including the opportunity to optimize the timing of equipment overhauls and inspections, the content of maintenance procedures, as well as the life cycle costing of sparing and upgrade programs in operating facilities world-wide. Other benefits resulting from the collection and analysis of RM data include improvements in decision-making, reductions in catastrophic failures, reduced environmental impacts, more effective benchmarking and trending of performance, and increased process unit availability.
Improvement of equipment reliability is dependent on experiences from real-life usage. The collection, analysis and feedback of data to equipment designers and manufacturers are, therefore, paramount. Also, when purchasing new equipment, RM data are key parameters to take into account.
In order to merge data from several equipment units, plants or across an industry arena, it is required that parties agree on what data are useful to collect and exchange and that those data are contained in a compatible format.
Recently, several nations with oil and gas industries have issued regulations requiring the companies to have a system for the collection, analysis and implementation of corrective and preventive actions, including improvement of systems and equipment.
Collecting RM data is costly and therefore it is necessary that this effort be balanced against the intended use and benefits. Commonly one would select equipment for RM data collection where the consequences of failures do have impact on safety, production, environment or high repair/replacement cost as indicated below.
A typical feedback loop for potential uses of data is shown in Figure 1.
Figure 1: Typical feedback of analysis from collected reliability and maintenance data

N.I.G.C April 2016 IGS-O-MN-001(0)
15
Industry and business value elements of utilizing this Standard are summarized below:
a) Economic aspects:
• cost-effective design to optimize CAPEX,
• cost-effective operation to optimize OPEX,
• improved profitability (reduced revenue loss),
• LCC/whole-life management,
• reduced cost of insurance;
b) General aspects:
• “being able to operate” (operatorship license), • life extension of capital equipment, • improved product quality, • better (data-based) equipment purchase, • better resource planning;
c) Safety and environmental aspects:
• improved personnel safety, • reduced catastrophic failures, • reduced environmental impact, • improvement of safety procedures and regulations (e.g. extend test interval based on RM
performance), compliance with authority requirements;
d) Analytical:
• higher-quality data, • larger population of data
• improved decision-making,
• reduced uncertainty in decision-making, • qualified benchmarking, • facilitation of industrial co-operation, • creation of a common “reliability” language (understanding, various disciplines), • verification of analysis techniques, • better predictability, • Basis for a risk-based inspection and reliability-availability-maintainability studies.

N.I.G.C April 2016 IGS-O-MN-001(0)
16
6. QUALITY OF DATA
6.1. OBTAINING QUALITY DATA
6.1.1. Definition of data quality
Confidence in the collected RM data, and hence any analysis, is strongly dependent on the quality of the data collected. High-quality data are characterized by the following:
a) Completeness of data in relation to specification;
b) Compliance with definitions of reliability parameters, data types and formats;
c) Accurate input, transfer, handling and storage of data (manually or electronic);
d) Sufficient population and adequate surveillance period to give statistical confidence;
e) Relevance to the data user’s need.
6.1.2. Planning measures
The following measures shall be emphasized before the data-collection process starts.
a) Define the objective for collecting the data in order to collect data relevant for the intended use. Examples of analyses where such data may be used are quantitative risk analysis (QRA); reliability, availability and maintainability analysis (RAM); reliability-centered maintenance (RCM); life cycle cost (LCC); safety integrity level (SIL) analysis. (See also Annex D.)
b) Investigate the source(s) of the data to ensure that relevant data of sufficient quality are available. Sources cover inventory/technical equipment information, RM event data and associated plant impacts.
c) Define the taxonomical information to be included in the database for each equipment unit (see Clause 8).
d) Identify the installation date, population and operating period(s) for the equipment from which data can be collected.
e) Define the boundaries for each equipment class, indicating what RM data are to be collected (see Clause 8). f) Apply a uniform definition of failure and a method of classifying failures (see Clause 9).
f) Apply a uniform definition of failure and a method of classifying failures (see Clause 9).
g) Apply a uniform definition of failure maintenance and a method of classifying maintenance failures (see Clause 9).
h) Define the checks used in data quality verification (see 8.1.3 and 8.1.9). At a minimum, the following shall be verified.
1) The origin of the data is documented and traceable.
2) The data originate from similar equipment type, technology and operating conditions.
3) The equipment is relevant for the purpose (e.g. not outdated models).
4) The data comply with definitions and interpretation rules (e.g. definition of failure).
5) Recorded failures are within the defined equipment boundary and surveillance period.
6) The information is consistent (e.g. consistence between failure modes and failure impact).
7) Data are registered in the correct format.
8) Sufficient data are collected to give acceptable statistical confidence, e.g. not biased by

N.I.G.C April 2016 IGS-O-MN-001(0)
17
outliers. (See recommendations for calculating confidence limits in C.3.2.)
9) Operating and maintenance personnel are consulted to validate the data.
i) Define a priority level for the completeness of data by a suitable method. One method of weighting the importance of the different data to be collected is by using three classes of importance in accordance with the following classification: ⎯ HIGH: compulsory data (coverage ≈ 100 %); ⎯ MEDIUM: highly desirable data (coverage > 75 %); ⎯ LOW: desirable data (coverage > 50 %).
j) Define the level of detail of RM data reported and collected and link it closely to the production and safety importance of the equipment. Base prioritization on safety, regularity and/or other severity measures.
k) Prepare a plan for the data-collection process (see 7.2), e.g. schedules, milestones, data-collection sequence for installations and equipment units, surveillance periods to be covered (see 8.3.1), etc.
l) Plan how the data will be assembled and reported and devise a method for transferring the data from the data source to the reliability data bank using any suitable method (see 7.2).
m) Train, motivate and organize the data-collection personnel, e.g. interpretation of sources, equipment know-how, software tools, involvement of operating personnel and equipment experts, understanding/experience in analysis application of RM data, etc. Ensure that they have an in-depth understanding of the equipment, its operating conditions, this International Standard and the requirements given for data quality.
n) Make a plan for quality assurance of the data-collection process and its deliverables. This shall, as a minimum, include procedures for quality control of the data and recording and correcting deviations. This verification of data quality shall be documented and may vary depending on whether the data collection is for a single plant or involves several company or industry facilities. When merging individual databases, it is imperative that each data record have a unique identification.
o) It is recommended to carry out a cost-benefit analysis of the data collection by running a pilot exercise before the main data-collection phase is started and to revise the plan if necessary.
p) Review the planning measures after a period of using the system (see 7.2.3).
6.1.3. Verification of quality
During and after the data-collection exercise, analyze the data to verify consistency, reasonable distributions, proper codes and correct interpretations in accordance with the planning measures (see 7.1.2). This verification-of-quality process shall be documented and may vary depending on whether the data collection is for a single plant or involves several company or industry facilities. When merging individual databases, it is imperative that each data record have a unique identification.
Assess the quality of data being collected as early as feasible in the data-collection process in accordance with the planning measures (see 8.1.2). A suitable procedure is an assessment by the data collector, who shall be provided with guidelines for what quality measures he/she should focus on in accordance with the planning measures. The main objective of this early assessment is to look for any problems that can require the planning measures to be immediately revised to avoid unacceptable data being collected.
Personnel other than those having collected the data shall verify the quality of each individual data record and the overall reliability pattern reflected by the sum of individual events in accordance with the planning measures (see 8.1.2).

N.I.G.C April 2016 IGS-O-MN-001(0)
18
6.1.4. Limitations and problems
Some of the problems and limitations to be aware of when obtaining quality data are summarized in Table 1.
Table 1 — Problems and limitations and storage
Issue Challenges
Source The data source can lack required data and the source information can be spread over several different systems (computers, files, books, drawings). It is recommended to carefully evaluate this aspect in the planning measures (see 8.1.2) in order to assess data quality, collection method and cost.
Interpretation Commonly, data are compiled from the source into a standardized format (database). In this process, the source data can be interpreted differently by various individuals. Proper definitions, training and quality checks can reduce this problem (see 8.1.2).
Data format In order to limit database size and make it easier to analyze the data, coded information is preferable to a free-text format; however, take care to ensure that the codes selected are appropriate for the information required and be aware that, although codes reduce the size of the database, some information is not collected. Free text should, however, be included in addition to codes to describe unexpected or unclear situations.
Data collection method
Most data needed for this category of data collection are today stored in computerized systems (e.g. CMMIS). By using state-of-the-art conversion algorithms and software, it is possible to transfer data among different computer databases in as (semi-)automated way, thereby saving cost.
Competence and motivation
Data collection in the “normal” manual way can become a repetitive and tedious exercise. Therefore, take care to employ people with sufficient know-how to do the jobs, avoid using personnel with low competence/experience, as data quality can suffer, and find measures to stimulate the RM data-collection staff, e.g. by training, doing plant visits and involving them in data analyses and application of results. Other examples are feedback on data-collection results, involvement in QA processes, relevant information fields in facility CMMIS to stimulate reporting quality, etc.
6.2. DATA COLLECTION PROCESS
6.2.1. Data sources
The facility CMMIS constitutes the main source of RM data. The quality of the data that can be retrieved from this source is dependent on the way RM data are reported in the first place. Reporting of RM data according to this International Standard shall be allowed for in the facility CMMIS, thereby providing a more consistent and sound basis for transferring RM data to equipment RM databases. Other source information can be spread across several different systems (computers, files, books, drawings), for example, feedback on data collection results, involvement in QA processes, adequate or improper use of information fields in facility CMMIS to stimulate reporting quality, etc.
6.2.2. Data collection methods
The typical data-collection process consists of compiling data from different sources into one database where the type and the format of the data are pre-defined. The most common method is as follows.
a) Address all the data sources that are available, and extract the relevant “raw” data into an intermediate storage. If the information is contained in a computerized database, use any suitable methods for extracting the relevant information; viz. extraction of targeted information by specific software methods or printing reports with desired information.
b) Interpret this information and translate it into the type and format desired for the target database. In most cases, this is done by manual interpretation.
c) Transfer the data from the source(s) to the reliability data bank using any suitable method. Suitable “off the-shelf” software can be used to transfer data from one database to another with the desired “language” conversion done by software algorithms. This is, however, feasible only as long as a conversion algorithm sufficiently robust to make a confident conversion can be defined. These methods do require some extra effort upfront and, therefore, are only cost-effective for large quantities of data or repetitive data collection of the same category. It may also be used for maintenance when transferring data from one CMMIS to another.

N.I.G.C April 2016 IGS-O-MN-001(0)
19
d) Data-collection methods significantly impact the cost-benefit analysis for data-collection and shall, therefore, be carefully planned and tested before the main data-collection process is started.
6.2.3. Organization and training
Data collection may be done either within the company using internal sources or as a task done by more specialized companies or personnel. As data are, by nature, “historical”, it evidently takes some time before sufficient data are accumulated to draw valid conclusions based on statistics only. The cost-benefit analysis for collecting data can take some time to become evident but annual tracking of equipment performance captures a useful history. Data collection can require skills from several categories, viz. IT, reliability/statistics, maintenance, operation and data collection. Key personnel shall be familiar, in particular, with the data-collection concept and any specific software for the data-collection activity, and, to a reasonable extent, know the technical, operational and maintenance aspects of the equipment for which data are collected. Proper training of key personnel on these issues is necessary in order to obtain quality data. The personnel who check the quality of the data shall be different from those doing the data collection. Data collectors shall, as a pre-requisite, know this International Standard and give feedback as appropriate. Before data collection starts, it is useful to do a pilot exercise to check the available population, the quality of source information and the feasibility of the data-collection methods. This serves as a model for what can be achieved within a given time and budget. A system for dealing with deviations encountered in the data-collection process, such as ambiguous definitions, lack of interpretation rules, inadequate codes, etc., shall be established and problems solved as soon as possible. It can be a major task to correct corrupt data after many data have been collected. A data-collection exercise shall also provide feedback by summarizing and evaluating all quality lessons learned during the planning and execution of the data-collection effort. Recommendations shall then be fed back to the relevant personnel for improvement on definitions, maintenance systems (e.g. CMMIS-systems) and the data-collection process and personnel.

N.I.G.C April 2016 IGS-O-MN-001(0)
20
7. EQUIPMENT BOUNDARY, TAXONOMY AND TIME DEFINITIONS
7.1. BOUNDARY DESCRIPTION
A clear boundary description is imperative for collecting, merging and analyzing RM data from different industries, plants or sources. It also facilitates communication between operators and equipment manufacturers. Otherwise, the merging and analysis is based on incompatible data. For each equipment class, a boundary shall be defined indicating what RM data are to be collected. This may be given by using a figure, a text definition or a combination of both. An example of a boundary diagram is shown in Figure 2 and an example of a definition to accompany the diagram is as follows: EXAMPLE The boundary applies to both general-service and fire pumps. Inlet and outlet valves and suction strainer are not within the boundary. Furthermore, the pump drivers along with their auxiliary systems are not included. Driver units are recorded as separate inventories (electric motor, gas turbine or combustion engine) and it is important that the failures on the driver, if recorded, be recorded as part of the driver units. A number in the pump inventory gives a reference to the appropriate driver inventory.
Figure 2 — Example of boundary diagram (pumps)
Due attention shall be paid to the location of the instrument elements. In the above example, the central control and monitoring items are typically included within the “control and monitoring” subunit, while individual instrumentation (trip, alarm, control) is typically included within the appropriate subunit, e.g. lubrication system.
The boundary diagram shall show the main lower-level items and the interfaces to the surroundings. Additional textual description shall, when needed for clarity, state in more detail what shall be considered inside and outside the boundaries (see the Example associated with Figure 2).
Boundaries shall avoid overlapping among different equipment classes. For example, when collecting data on instruments as separate equipment units, one shall avoid including those instruments that are also included within the boundaries of other equipment units on which data are being collected. Some overlapping can be difficult to avoid; however, such case(s) shall be identified and treated appropriately during the data analyses.
Recommended boundary diagrams for some selected equipment units are given in Annex A.

N.I.G.C April 2016 IGS-O-MN-001(0)
21
7.2. TAXONOMY
The taxonomy is a systematic classification of items into generic groups based on factors possibly common to several of the items (location, use, equipment subdivision, etc.). A classification of relevant data to be collected in accordance with this International Standard is represented by a hierarchy as shown in Figure 3. Definitions of each segment are provided below, in addition to examples of different business streams and equipment types, as illustrated in Table 2.
Figure 3 — Taxonomy

N.I.G.C April 2016 IGS-O-MN-001(0)
22
Table 2 — Taxonomic examples
Main category
Taxonomic level
Taxonomy hierarchy Definition Examples
Use/location data
1 Industry Type of main industry Natural gas
2 Business category
Type of business or processing stream Midstream, downstream (refining),
3 Installation category
Type of facility Gas production, transportation, LNG, refinery, (see Table A.1)
4 Plant/Unit category
Type of plant/unit Platform, gas sweetening, dehydration, condensate stabilization , Mercaptane removal, Sulphur recovery units(see Table A.2)
5 Section/System Main section/system of the plant
Compression, natural gas, distillation section, tanker loading system (see Table A.3)
Equipment subdivision
6 Equipment class/unit
Class of similar equipment units. Each equipment class contains comparable equipment units (e.g. compressors).
Heat exchanger, compressor, piping, pump, boiler, gas turbine extruder, furnace, blow-out preventer (see Table A.4)
7 Subunit A subsystem necessary for the equipment unit to function
Lubrication subunit, cooling subunit, control and monitoring, heating subunit, quenching subunit, refrigeration subunit, reflux subunit, distributed control subunit
8 Component/ Maintainable item (MI)a
The group of parts of the equipment unit that are commonly maintained (repaired/restored) as a whole
Cooler, coupling, gearbox, lubrication oil pump, instrument loop, motor, valve, filter, pressure sensor, temperature sensor, electric circuit
9 Part b A single piece of equipment
Seal, tube, shell, impeller, gasket, filter plate, bolt, nut, etc.
a For some types of equipment, there might not be a MI; e.g. if the equipment class is piping, there might be no MI, but the part could be “elbow”.
b While this level can be useful in some cases, it is considered optional in this International Standard.
Levels 1 to 5 represent a high-level categorization that relates to industries and plant application regardless of the equipment units (see level 6) involved. This is because an equipment unit (e.g. pump) can be used in many different industries and plant configurations and, for analyzing the reliability of similar equipment, it is necessary to have the operating context. Taxonomic information on these levels (1 to 5) shall be included in the database for each equipment unit as “use/location data” (see Table 2).
Levels 6 to 9 are related to the equipment unit (inventory) with the subdivision in lower indenture levels corresponding to a parent-child relationship. This Standard focuses on the equipment unit level (level 6) for the

N.I.G.C April 2016 IGS-O-MN-001(0)
23
collection of RM data and also indirectly on the lower indenture items, such as subunits and components. The number of subdivision levels for the collection of RM data depends on the complexity of the equipment unit and the use of the data. A single instrument might need no further breakdown, while several levels can be required for a large compressor. For data used in availability analyses, the reliability at the equipment-unit level can be the only data required, while an RCM analysis and root-cause analysis can require data on failure mechanism at the component/maintainable item, or parts, level. This International Standard does not specifically address level 9.
It is necessary that RM data be related to a certain level within the taxonomic hierarchy in order to be meaningful and comparable. For example, a failure mode shall be related to the equipment unit, while a failure mechanism shall be related to the lowest achievable level in the item hierarchy. Table 3 gives guidance on this.
Table 3 — Reliability and maintenance parameters in relation to taxonomy levels
Recorded RM data Hierarchy level a
4 Plant/Unit
5
Section/ System
6 Equipment
unit
7
Subunit
8
Component/ Maintainable item
Impact of failure on safety X b
Impact of maintenance on safety X
Impact of failure on operations X (X) c
Impact of maintenance with regard to operations
X (X)
Failure impact on equipment X (X) (X)
Failure mode (X) X (X) (X)
Failure mechanism (X) (X) X
Failure cause (X) X
Detection method (X) X (X) (X)
Subunit failed X
Component/maintainable item failed X
Down time (X) (X) X
Active maintenance time X (X) (X)
a See Figure 3.
b X = default.
c (X) = possible alternatives.

N.I.G.C April 2016 IGS-O-MN-001(0)
24
7.3. TIMELINE ISSUES
7.3.1. Surveillance and operating period
The equipment surveillance period is typically used as the time period for determining time-related reliability parameters, e.g. MTBF, component life, etc. For many equipment units, the operating, or in-service, period is less than the surveillance period due to maintenance, sparing of equipment or intermittent operation of the equipment (e.g. tank-transfer pumps).
When equipment is in an idle state or in “hot” standby, i.e. being ready for immediate operation when started, it is considered to be operating (or “in-service”) by the definitions in this Standard. Equipment on standby, which would require some activities to be performed before being ready for operation (“cold” standby), is not considered to be in an operating state. The various time-period definitions are illustrated in Table 4.
Data may also be collected for actual preventive maintenance if one wants the full picture of down time caused by all maintenance actions (see Table 4). Periods when equipment is deliberately taken out of service for an extended period, or is being modified, are not considered to be relevant for data collection.
The surveillance period may also cover several states in the life of the item. For example, in a typical gas processing plant, equipments can be installed and functioning, i.e. a stand-by pump maybe installed but this sub-unit would not be started for several weeks. Failures can occur on the equipment during this phase, requiring it to be repaired with a potential delay to start-up. Likewise, equipment can fail during a refinery turnaround, which is not a “production” phase, again requiring repair and possible delay to start-up.
7.3.2. Data collection periods
Depending on use and feasibility, data may be recorded for the whole equipment lifetime or for shorter intervals. The latter is common due both to cost and to getting data within a reasonable time frame. As shown in Annex C, the lifetime of many items is assumed to follow the so-called “bathtub” curve. If only the RM data for the steady-state operating part of an item are required, data collection shall start after the burn-in period is considered to have ended. The length of this period can vary among equipment categories from no burn-in to several months. Data recorded during the steady-state operating period often follows, or is assumed to follow, the exponential lifetime curve (constant failure rate). For some equipment, it is also useful and essential to collect data from “day one” in order to accumulate experience on burn-in failures. In this case, data collected

N.I.G.C April 2016 IGS-O-MN-001(0)
25
from what may be considered as an initial burn-in period shall be distinguished from data collected from the subsequent steady-state operating period.
The length of the data-collection period shall be balanced against the expected failure rate, size of population and access to data. For equipment of high importance (safety) and equipment where one knows that few failures normally occur (e.g. Pipeline), a longer surveillance period is desirable (e.g. the whole lifetime history). It is even useful to collect data for equipment with no failures during the surveillance period because, by observing no failures in a given period, it is possible to estimate the failure rate by “censoring” the data. Methods within statistics shall be used to estimate the confidence of the data (upper/lower confidence limits), as shown in Annex C.
While the surveillance period is just an interval in calendar time between two specific times and can, therefore, be defined exactly, operating time is not always that straightforward to determine. For some rotating equipment, the operating time is recorded on a counter and can be read exactly. For other equipment, this might not be true. Hence, it is often necessary to estimate operating time based on knowledge from the operating and/or maintenance staff. As the “true” failure rate for an item shall be calculated based on actual operation, high priority should be given to collecting or estimating this parameter.
7.3.3. Maintenance times
Two main calendar times during maintenance are recommended to be collected, viz. down time and active repair time. The difference between the two is illustrated in Figure 4.
Figure 4 — Maintenance times
Down time includes the calendar time from the time the equipment is stopped for a repair until it is reconnected to its intended service after having been tested.
Active maintenance time is the calendar time during which maintenance work on the item is actually being performed. By this definition, active repair time cannot normally be greater than the down time.
NOTE exceptionally, active repair time can be greater than down time if the maintenance can be performed with the equipment unit operating.
The operational time required to run down the equipment before repair and ramp up after the repair is not considered to be part of the down time.
NOTE See also definitions in 4.2 and 4.10.

N.I.G.C April 2016 IGS-O-MN-001(0)
26
8. RECOMMENDED DATA FOR EQUIPMENT, FAILURES AND MAINTENANCE
8.1. DATA CATEGORIES
The RM data shall be collected in an organized and structured way. The major data categories for equipment, failure and maintenance data are the following.
a) Equipment unit data (inventory data)
The description of an equipment unit (level 6 in Figure 3) is characterized by the following: 1. Classification data, e.g. industry, plant, location, system; 2. Equipment attributes, e.g. manufacturer’s data, design characteristics; 3. Operation data, e.g. operating mode, operating power, environment.
These data categories shall be general for all equipment classes. Additionally, some data specific for each equipment class (e.g. number of stages for a compressor) are required. Recommended data for some equipment classes are given in Annex A.
b) Failure data
These data are characterized by the following: 1) Identification data, e.g. failure record number and related equipment that has failed; 2) Failure data for characterizing a failure, e.g. failure date, items failed, failure impact, failure mode, failure
Cause, failure detection method.
c) Maintenance data
These data are characterized by the following:
1) Identification data, e.g. maintenance record number, related failure and/or equipment record;
2) Maintenance data, parameters characterizing a maintenance action, e.g. date of maintenance, Maintenance category, maintenance activity, impact of maintenance, items maintained;
3) Maintenance resources, maintenance man-hours per discipline and total, utility equipment/ resources Applied;
4) Maintenance times, active maintenance time, down time.
The type of failure and maintenance data shall normally be common for all equipment classes, with exceptions where it is necessary to collect specific types of data, e.g. gas injection equipment. Corrective-maintenance events shall be recorded in order to describe the corrective action following a failure.
Preventive-maintenance records are required to retain the complete lifetime history of an equipment unit.
8.2. DATA FORMAT
Each record, e.g. a failure event, shall be identified in the database by a number of attributes. Each attribute describes one piece of information, e.g. failure mode. It is recommended that each piece of information be coded where possible. The advantages of this approach versus free text are
• Facilitation of queries and analysis of data,
• Ease of data input,
• Consistency check undertaken at input, by having predefined code lists,

N.I.G.C April 2016 IGS-O-MN-001(0)
27
• Minimization of database size and response time of queries.
The range of predefined codes shall be optimized. A short range of codes is too general to be useful. A long range of codes gives a more precise description, but slows the input process and might not be used fully by the data collector. Selected codes shall, if possible, be mutually exclusive. The disadvantage of a predefined list of codes versus free text is that some detailed information can be lost. For all categories mentioned in 10.1 a), b) and c), it is recommended to include some additional free text giving more explanatory information as available and deemed relevant, e.g. to include a narrative of the occurrence leading to a failure event. This would assist in quality checking the information and browsing through single records to extract more detailed information. Examples of codes are given in Annexes A and B for different equipment types and reliability data.
8.3. DATABASE STRUCTURE
8.3.1. Description
The data collected shall be organized and linked in a database to provide easy access for updates, queries and analysis. Several commercial databases are available that can be used as main building blocks for designing a reliability database. Two aspects of organizing the structure of data shall be addressed as described in 9.3.2 and 9.3.3.
8.3.2. Logical structure
The logical structure defines the logical links among the main data categories in the database. This model represents an application-oriented view of the database. The example in Figure 5 shows a hierarchical structure with failure and maintenance records linked to the equipment unit (inventory). Records describing preventive maintenance (PM) are linked to the inventory description in a many-to-one relation. The same applies for failures, which additionally have related corrective-maintenance records linked to each failure record. Each record (e.g. failure) may consist of several attributes (e.g. failure date, failure mode, etc.).
Figure 5 — Logical data structure (example)

N.I.G.C April 2016 IGS-O-MN-001(0)
28
8.3.3. Database architecture
This defines the design of the database as to how the individual data elements are linked and addressed. The following four model categories are commonly available, ranked in order of complexity and versatility.
a) Hierarchical model: Data fields within records are related by a “family tree” relationship. Each level represents a particular attribute of data.
b) Network model: This is similar to the hierarchical model; however, each attribute can have more than one parent
c) Relational model: The model is constructed from tables of data elements, which are called relations. No access path is defined beforehand; all types of manipulation of the data in tabular form are possible. The majority of database designs use this concept.
d) Object model: The software is considered as a collection of objects, each of which has (1) a structure and (2) an interface. The structure is fixed within each object while the interface is the visible part that provides the link address between the objects. Object modeling enables the database design to be very flexible, extendable, reusable and easy to maintain. This model seems to be popular in new database concepts.
8.4. EQUIPMENT DATA
The classification of equipment into technical, operational and environmental parameters is the basis for the collection of RM data. This information is also necessary to determine whether the data are suitable or valid for various applications. Some data are common to all equipment classes and other data are specific to a particular equipment class.
To ensure that the objectives of this Standard are met, a minimum of data shall be collected. These data are identified by an asterisk (*) in Tables 5, 6 and 8. However, the addition of certain other data categories can significantly improve the potential usability of the RM data (see Annex D).
Table 5 contains the data common to all equipment classes. In addition, some data that are specific for each equipment class shall be recorded. Annex A gives examples of such data for some equipment classes. In the examples in Annex A, the priority data are suggested, but they can vary according to each case or application.
Table 5 — Equipment data common to all equipment classes
Data category Data Taxonomi
c level a
Business category (examples)
Gas Processing Transmission Distribution
Industry 1 Natural Gas Natural gas Natural Gas
Business category (*) 2 Gas Processing Transmission Distribution Installation category 3 Gas Processing
Plant District Province Gas
Distribution Installation code or name (*) 3 South Pars Gas
Complex Dist. No. 1 Tehran Province Gas
Distribution Use/ Owner code or name 4 NIGC NIGC NIGC
Location attributes
Geographic location 3 Boushehr Province Zanjan Province Tehran Province Plant/Unit category (*) 4 Process Gas Compressor
station Complex Process
Plant/Unit code or name (*) 4 SRU Gas Compressor station KHD
CGS
Section/System (see Annex A) (*)
5 Sulfur Recovery Gas Compressor station
Let Down Process
Operation category 5 Manned Manned Manned

N.I.G.C April 2016 IGS-O-MN-001(0)
29
Table 5 (continued)
Data category
Data Taxonomic
level a Business category (examples)
Gas Processing Transmission Distribution
Equipment attributes
Equipment class (see Annex A) (*) 6 Pump Compressor Gas Heating
Equipment Type (see Annex A) (*) 6 Centrifugal Centrifugal Shell and
tube
Equipment identification/ Location (e.g. tag number) (*) b
6 P101-A C1001 C-21
Equipment description (nomenclature) 6 Transfer Main
compressor Gas Heating
Unique equipment identification number b
6 12345XL 10101 Cxy123
Manufacturer’s name (*) 6 Johnson Siemens Smith
Manufacturer’s model designation 6 Mark I SGT-600 GTI
Design data relevant for each equipment class and
subunit/component as applicable, e.g. capacity, power, speed, pressure,
redundancy, relevant standard(s) (see also Annex A)
6 Equipment-specific Equipment-
specific Equipment-
specific
Operation (normal
use)
Normal operating state/Mode (*) 6 Running Active
standby Intermittent
Initial equipment commissioning date 6 1998 2005 1976
Start date of current service (*) 6 1998.02.01 2005.02.01 1976.02.01
Surveillance time, h (calculated) (*) 6 8 950 8 000 5 400
Operational time, h (measured/calculated)
6 3 460 100 5 200
Number of demands during the surveillance period as applicable
(includes both operational and test activation) (*)
6 340 2 N.A.
Operating parameters as relevant for each equipment class; e.g. ambient
conditions, operating power (see Annex A)
6 Equipment-specific Equipment-
specific Equipment-
specific
Additional informatio
n
Additional information in free text as applicable
6 Specify as needed Specify as
needed Specify as needed
Source of data, e.g. P & ID, data sheet, maintenance system
6 Specify as needed Specify as
needed Specify as needed
a See definitions in Figure 3. b The serial number is required for potential change-out at the equipment level. The tag number identifies only the physical location of equipment in the plant. If the equipment is replaced with, e.g. an overhauled unit, the tag number remains the same but the serial number changes. (*) indicates the minimum data that is required to be collected.

N.I.G.C April 2016 IGS-O-MN-001(0)
30
8.5. FAILURE DATA
A uniform definition of failure and a method of classifying failures are essential when it is necessary to combine data from different sources (plants and operators) in a common RM database.
A common report, as given in Table 6 (see also Table 3), for all equipment classes shall be used for reporting failure data. For some equipment classes, e.g. subsea equipment, minor adaptations can be necessary.
The minimum data needed to meet the objectives of this Standard are identified by (*). However, the addition of certain other data categories can significantly improve the potential usability of the RM data; see Annex D.
Table 6 — Failure data
Category Data to be recorded Description
Identification Failure record (*) Unique failure record identification
Equipment identification/Location (*) E.g. tag number (see Table 5)
Failure data
Failure date (*) Date of failure detection (year/month/day)
Failure mode (*) Usually at equipment-unit level (level 6) (see B.2.6) a
Failure impact on plant safety (e.g. personnel, environment, assets) b
Usually zero, partial or total
Failure impact on plant operations (e.g. production, drilling, intervention) b
Usually zero, partial or total
Failure impact on equipment function (*) Effect on equipment-unit function (level 6): critical, degraded, or incipient failure c
Failure mechanism The physical, chemical or other processes which have led to a failure (see Table B.2)
Failure cause d The circumstances during design, manufacture or use which have led to a failure (see Table B.3)
Subunit failed Name of subunit that failed (see examples in Annex A)
Component/Maintainable item(s) failed Name of the failed maintainable item(s) (see Annex A)
Detection method How the failure was detected (see Table B.4)
Operating condition at failure Running, start-up, testing, idle, standby
Remarks Additional information Give more details, if available, on the circumstances leading to the failure: failure of redundant units, failure cause(s) etc.
a For some equipment categories such as subsea equipment, it is recommended to also record failure modes on taxonomic levels lower than the equipment-unit level. b See example of failure consequence classification in Table B.2. c For some equipment categories and applications it may be sufficient to record critical and non-critical (degraded + incipient) failures only. d The failure cause and sometimes the failure mechanism are not known when the data are collected, as they commonly require a root cause analysis to be performed. Such analysis shall be performed for failures of high consequence, high repair/down time cost, or failures occurring significantly more frequent than what is considered “normal” for this equipment unit class (“worst actors”). (*) indicates the minimum data that shall be collected.

N.I.G.C April 2016 IGS-O-MN-001(0)
31
8.6. MAINTENANCE DATA
8.6.1. General
Maintenance is carried out for the following reasons:
a) To correct a failure (corrective maintenance); the failure shall be reported as described in 9.5;
b) As a planned and normally periodic action to prevent failure from occurring (preventive maintenance).
A common report for all equipment classes shall be used for reporting maintenance data. The data required are given in Table 8. For some equipment classes, minor adaptations can be required (e.g. subsea equipment).
The minimum data needed to meet the objectives of this Standard are identified by (*). However, the addition of other data categories can significantly improve the potential usability of the RM data; see Annex D.
8.6.2. Maintenance categories
There are two basic categories of maintenance:
a) a) That done to correct an item after it has failed (corrective maintenance);
b) b) That done to prevent an item from failing (preventive maintenance); part of this can be simply
the checks (inspections, tests) to verify the condition of the equipment to decide whether or not any preventive Maintenance is required.
NOTE “Modification” is not defined as a maintenance category but is a task often performed by the maintenance organization. A modification can have an influence on the reliability and performance of an item.
Figure 6 shows the main maintenance categories in more detail. Table B.5 presents the main types of maintenance activities commonly performed.
Figure 6 — Maintenance categorization

N.I.G.C April 2016 IGS-O-MN-001(0)
32
8.6.3. Reporting maintenance data
8.6.3.1. Corrective maintenance
As a minimum for recording the reliability of an item, it is required that the corrective maintenance to correct a failure shall be recorded.
8.6.3.2. Preventive maintenance
It is recommended that the recording of the actual preventive maintenance (PM) be done essentially in the same way as for corrective actions. This can give the following additional information:
a) Full lifetime story of an item (all failures and maintenance); b) Total resources used on maintenance (man-hours, spare parts); c) Total down time and, hence, total equipment availability, both technical and operational; see Annex C; d) Balance between preventive and corrective maintenance.
Recording PM actions is useful mainly for the maintenance engineer, but is also useful for the reliability engineer wanting to record or estimate the availability of equipment. A lifetime analysis takes into account not only failures but also maintenance actions intended to restore the item to “as-good-as-new” condition. PMs are often performed on a higher indenture level (e.g. “package” level); hence there might not be any data available that can be related to the items on the lower indenture level (subunit, maintainable item). It is necessary to consider this restriction when defining, reporting and analyzing PM data.
During the execution of PM actions, impending failures can be discovered and corrected as part of the PM activities. In this case, the failure(s) shall be recorded as any other failure with the subsequent corrective action done, even though it initially was considered to be a PM-type activity. The failure-detection method shall, in this case, be considered as the type of PM being done. It is, however, realized that some failures, generally of minor character, can be corrected as part of the PM and not recorded individually. The practice on this can vary among companies and should be addressed by the data collector(s) in order to reveal the possible type and amount of failures being included within the PM program.
8.6.3.3. Preventive maintenance program
A final option is to record the planned PM program as well. In this case, it is possible to additionally record the differences between the planned PM and the PM actually performed (backlog). An increasing backlog indicates that control of the conditions of the plant is being jeopardized and can, in adverse circumstances, lead to equipment damage, pollution or personnel injury. Table 7 shows a summary of data to be collected and possible added value for different data categories. Annex D contains a more detailed survey of data requirements for various applications.
Table 7 — Usefulness of maintenance data
Data to be collected Priority with regard to data collection Examples
Corrective maintenance Required (see Table 8)
•Repair time (MTTR) •Amount of corrective maintenance • Replacement/repair strategy
Actual preventive maintenance Recommended
•Full lifetime story of the equipment •Total resources used on maintenance •Total down time •Effect of PM on failure rate •Balance
between corrective and preventive maintenance
Planned preventive maintenance
(maintenance program) Optional •Difference between real and planned PM (backlog) •Updating
program based on experiences (methods, resources, intervals)
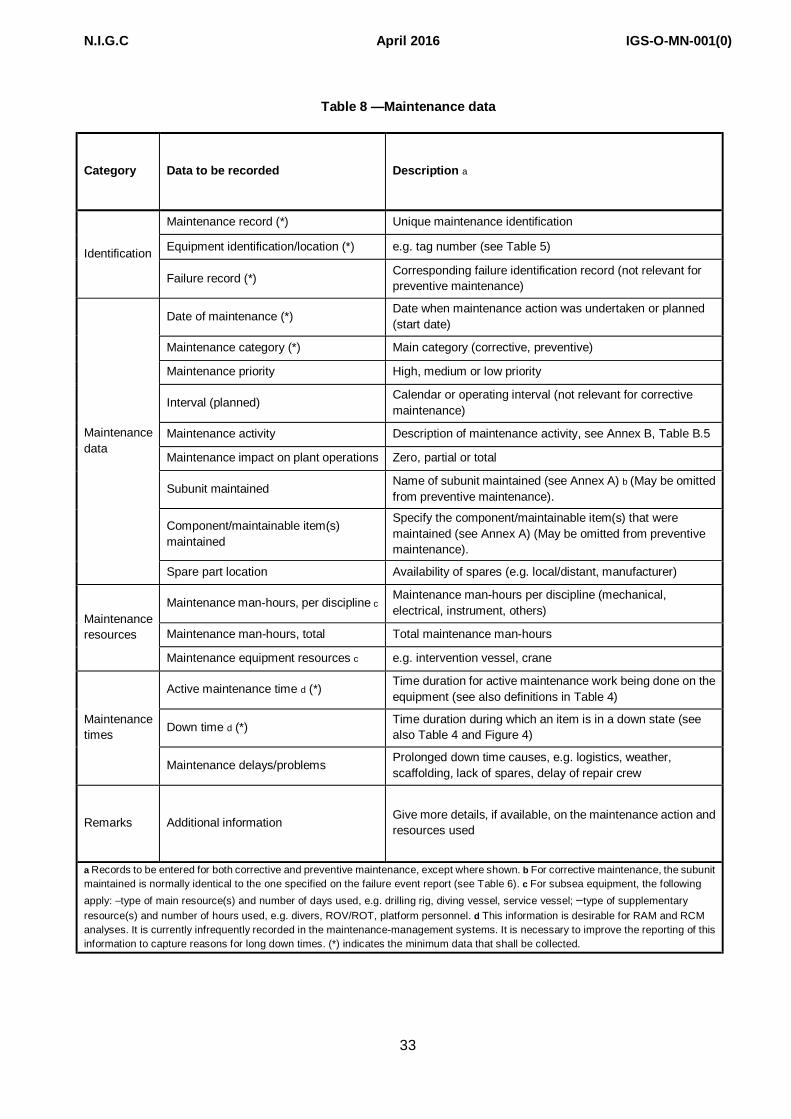
N.I.G.C April 2016 IGS-O-MN-001(0)
33
Table 8 —Maintenance data
Category Data to be recorded Description a
Identification
Maintenance record (*) Unique maintenance identification
Equipment identification/location (*) e.g. tag number (see Table 5)
Failure record (*) Corresponding failure identification record (not relevant for preventive maintenance)
Maintenance data
Date of maintenance (*) Date when maintenance action was undertaken or planned (start date)
Maintenance category (*) Main category (corrective, preventive)
Maintenance priority High, medium or low priority
Interval (planned) Calendar or operating interval (not relevant for corrective maintenance)
Maintenance activity Description of maintenance activity, see Annex B, Table B.5
Maintenance impact on plant operations Zero, partial or total
Subunit maintained Name of subunit maintained (see Annex A) b (May be omitted from preventive maintenance).
Component/maintainable item(s) maintained
Specify the component/maintainable item(s) that were maintained (see Annex A) (May be omitted from preventive maintenance).
Spare part location Availability of spares (e.g. local/distant, manufacturer)
Maintenance resources
Maintenance man-hours, per discipline c Maintenance man-hours per discipline (mechanical, electrical, instrument, others)
Maintenance man-hours, total Total maintenance man-hours
Maintenance equipment resources c e.g. intervention vessel, crane
Maintenance times
Active maintenance time d (*) Time duration for active maintenance work being done on the equipment (see also definitions in Table 4)
Down time d (*) Time duration during which an item is in a down state (see also Table 4 and Figure 4)
Maintenance delays/problems Prolonged down time causes, e.g. logistics, weather, scaffolding, lack of spares, delay of repair crew
Remarks Additional information Give more details, if available, on the maintenance action and resources used
a Records to be entered for both corrective and preventive maintenance, except where shown. b For corrective maintenance, the subunit maintained is normally identical to the one specified on the failure event report (see Table 6). c For subsea equipment, the following apply: ⎯type of main resource(s) and number of days used, e.g. drilling rig, diving vessel, service vessel; ⎯type of supplementary resource(s) and number of hours used, e.g. divers, ROV/ROT, platform personnel. d This information is desirable for RAM and RCM analyses. It is currently infrequently recorded in the maintenance-management systems. It is necessary to improve the reporting of this information to capture reasons for long down times. (*) indicates the minimum data that shall be collected.

N.I.G.C April 2016 IGS-O-MN-001(0)
34
ANNEX A
(INFORMATIVE)
EQUIPMENT-CLASS ATTRIBUTES
A.1 ADVISORY NOTES
A.1.1 General
Annex A provides examples on how typical equipment used in the natural gas industry can be categorized as to their taxonomy, boundary definition, and inventory data. These data are informative for each equipment unit. Normative data, e.g. failure modes, for the equipment examples are shown in Annex B.
A standardized approach has been applied for some of the subunits that are used on a majority of equipment classes (e.g. control and monitoring, lubrication system, cooling system). The result that is the total number of tables required to describe the different data categories and definitions is reduced and, at the same time, there are fewer tailor-made definitions and codes for each individual equipment unit. The user should, therefore, apply those categories and codes that are applicable to the equipment for which data are being collected. Equipment having a unique design can require a more tailor-made categorization instead of that shown in these examples.
In the tables that describe the “equipment-unit subdivision" for the equipment, it is recommended to also include the following:
a. “Maintainable items/Parts” on an as-needed basis, e.g. to include instrumentation;
b. “Others”, if defined “Maintainable items/Parts” are lacking; or
c. “Unknown” category, if sufficient information is not available.
The priority classes given in this annex are high, medium and low. When interpreting or assessing the value of these classes, they can be equated to compulsory (high), highly desirable (medium) and desirable (low).
A.1.2 Boundary definitions
The purpose of the boundary definition is to ensure a common understanding of the “subunit/component” and “maintainable item/part” included within the boundary of a particular equipment unit and, hence, which failure and maintenance events to record. For definition of the boundaries, the following rules are recommended.
a. Do not include items of unique design or configuration-dependant items. Include only those items that are considered to be generic for the equipment class being considered in order to compare “like with like.”
b. Exclude connected items from the equipment-class boundary, unless specifically included by the boundary specification. Failures that occur in a connection (e.g. leak), and that cannot be solely related to the connected item, should be included within the boundary definition.
c. If a driver and the driven unit use a common subunit (e.g. lubrication system), relate failure and

N.I.G.C April 2016 IGS-O-MN-001(0)
35
maintenance events on this subunit, as a general rule, to the driven unit ;
d. Include instrumentation only where it has a specific control and/or monitoring function for the equipment unit in question and/or is locally mounted on the equipment unit. Control and supervisory instrumentation of more general use (e.g. SCADA-systems) should not, as a rule, be included.
In A.2.2 to A.2.9 examples of boundary diagrams for different equipment classes are presented. This list is not exhaustive for the equipment categories covered by this Standard, but includes examples on how taxonomies may be defined for typical equipment found in the natural gas industry.
A.1.3 Common equipment data
This Standard recommends some common equipment data that should be collected for all equipment classes as shown in Table 5.
Additionally, some equipment-specific data for equipment classes are presented in this annex. These data have been found to be useful when comparing performance, or benchmarking, of equipment.
Such design features specific for each equipment class should be considered depending on how far down in equipment categorization the data collector wants, or is required, to go. Collection of data is a trade-off between the cost of obtaining it, which often can be high, and the value of the data in relation to the specific requirements to define each equipment class for the intended analyses. The accessibility of the data in the source(s) also sets a limit on the data that can be collected. An indication of the importance of each data type is indicated. This importance ranking can differ among different users and applications.
A.1.4 Equipment classification and application
Tables A.1 to A.4 provide a methodology for grouping different equipment examples and their application as covered by this Standard. These lists are not meant to be exhaustive but are intended to show the main types of equipment classes and systems and how they can be grouped in categories. Any applied categorization should be appropriate for the intended use and purpose of the data being collected (see 7.1.2). Tables A.1 to A.4 show a categorization related to the taxonomic levels shown Figure 3. ⎯ Table A.1 shows a recommendation for grouping equipment on installation level (level 3 in the taxonomic
hierarchy). ⎯ Table A.2 shows a recommendation for how equipment can be classified on plant/unit level (level 4), as shown in Table 5. ⎯ Table A.3 shows a list of relevant sections/systems (level 5) within natural gas industry where equipment as covered by this Standard can be used. The systems where the equipment is applied should be recorded as one parameter in the general equipment data shown in Table 5 (category “Use/Location”). ⎯ Table A.4 lists typical examples of equipment units used in the natural gas industry as covered by this Standard (level 6). Table A.4 also indicates those equipment taxonomies that are illustrated by examples, as described in A.2.1. B.2.6 contains the associated failure modes for the same equipment examples.
In the classification shown in Tables A.1 to A.3, the terms “upstream,” “midstream,” and “downstream” are used. The interpretation of these terms in this Standard is as follows:
a. Upstream business category of Natural Gas industry involving refining and treatment (e.g. refinery);
b. Midstream business category involving the transportation and storage sectors of the Natural gas industry (e.g. Gas Transmission district);

N.I.G.C April 2016 IGS-O-MN-001(0)
36
c. Downstream business category of Natural Gas industry involving distribution process (e.g. Province Gas Distribution);
Table A.1 — Installation category — Level 3
Business category Upstream Midstream Downstream
Gas processing Liquefied natural gas
plant (LNG) Liquefied petroleum gas plant (LPG) Gas
Mini Liquefied natural gas plant (LNG) Storage Shipping (LNG,
Condensate Pipeline) Natural Gas Storage and
Transmission District
Shipping Terminal Natural Gas Distribution
Table A.2 — Plant/Unit level classification — Level 4 Business category
Upstream Midstream Downstream
Gas processing plant Gas Storage Plant
Pipeline compressor station complex, Pipeline Operation Center(Yard),Gas Storage
Complex
City Gate Station(CGS), Town Boarder(TBS)
Table A.3 — Section/System classification — Level 5
Business category Upstream Midstream Downstream
Process — General Gas processing, Water treatment process condensate-export systems Gas-export systems Utilities a Chemical injection Cooling system Flare system Heating system Oily-water treatment Steam Water injection Methanol air Main power b Emergency power b
Essential power b Fuel gas Materials handling HVAC Fresh water systems Safety and control systems Emergency/process shutdown Fire and gas detection Fire water systems Fire-fighting systems Process control PA/alarm system Emergency preparedness systems
Gas Compressor Station, Gas storage dehydration unit, Emergency power b Essential power b Fuel gas
Safety and control systems Emergency/
Fire-fighting systems Process control PA/alarm system Emergency,
Pig launching and receiving facilities,
Blow down facility, Valve Station
Process-General
Natural Gas Conditioning;
Pressure and Temperature Regulation
a These sections/systems may also be applicable for downstream unless defined specifically for these categories. b Includes both power generation and distribution.

N.I.G.C April 2016 IGS-O-MN-001(0)
37
Table A.4 — Equipment class — Level 6 Equipment category
Equipment class — Level 6 Example included
in Annex A Rotating Combustion engines Yes
Compressors Yes
Electric generators Yes
Electric motors Yes
Gas turbines Yes
Pumps Yes
Steam turbines Yes
Turboexpanders Yes
Blowers and fans No
Liquid expanders No
Mixers No
Mechanical Cranes Yes
Heat exchangers Yes
Heaters and boilers Yes
Vessels Yes
Piping Yes
Winches Yes
Swivels Yes
Turrets Yes
Storage tanks a Yes
Filters and strainers a Yes
Pipeline No
Loading arms No
Steam ejectors No
Xmas trees (topside/onshore)b No
Electrical Uninterruptible power supply Yes
Power transformers Yes
Switchgears/switchboards and distribution boards a Yes
Power cables and terminations a Yes
Lighting tower a Yes
Surge Arrester(Lightening protection) a Yes
Frequency converters No
Safety and control Fire and gas detectors Yes
Input devices Yes
Control units Yes
Valves Yes
Nozzles Yes
Fire-fighting equipment a Yes
Paging a Yes
Emergency calla Yes
Evacuation equipment No
Inert-gas equipment No
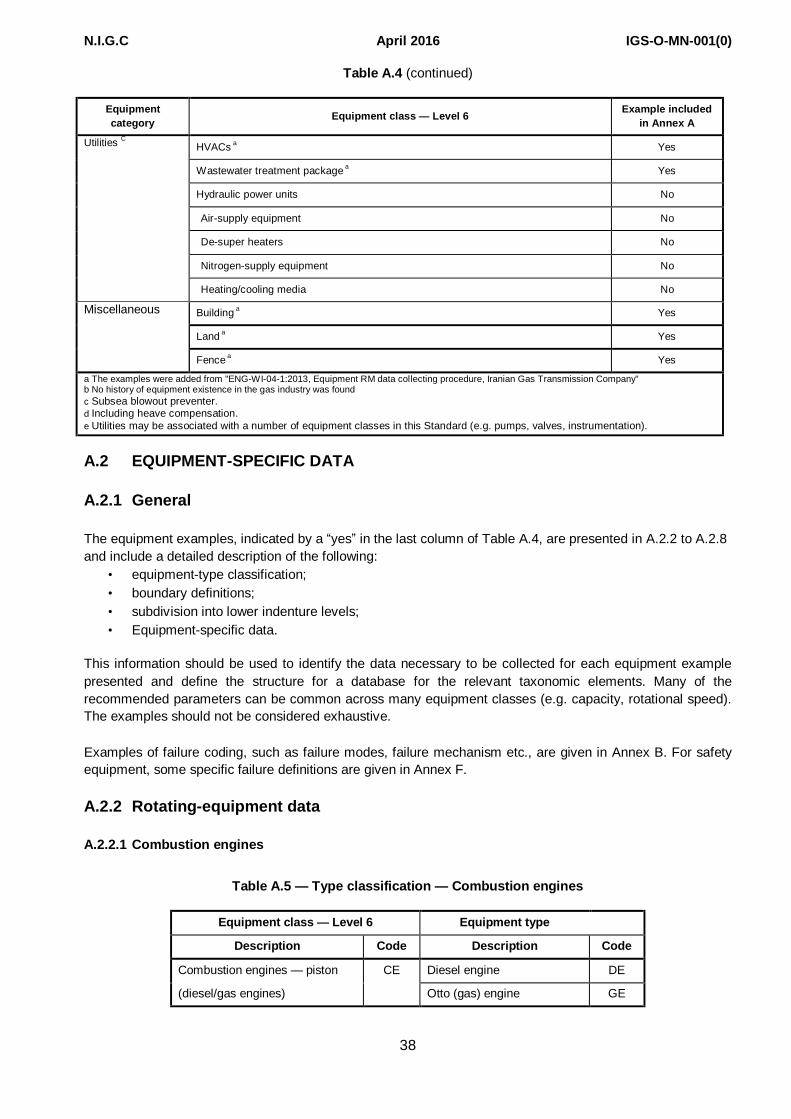
N.I.G.C April 2016 IGS-O-MN-001(0)
38
Table A.4 (continued)
Equipment category Equipment class — Level 6 Example included
in Annex A
Utilities C HVACs a Yes
Wastewater treatment package a Yes
Hydraulic power units No
Air-supply equipment No
De-super heaters No
Nitrogen-supply equipment No
Heating/cooling media No
Miscellaneous Building a Yes
Land a Yes
Fence a Yes
a The examples were added from "ENG-WI-04-1:2013, Equipment RM data collecting procedure, Iranian Gas Transmission Company" b No history of equipment existence in the gas industry was found c Subsea blowout preventer. d Including heave compensation. e Utilities may be associated with a number of equipment classes in this Standard (e.g. pumps, valves, instrumentation).
A.2 EQUIPMENT-SPECIFIC DATA
A.2.1 General
The equipment examples, indicated by a “yes” in the last column of Table A.4, are presented in A.2.2 to A.2.8 and include a detailed description of the following:
• equipment-type classification; • boundary definitions; • subdivision into lower indenture levels; • Equipment-specific data.
This information should be used to identify the data necessary to be collected for each equipment example presented and define the structure for a database for the relevant taxonomic elements. Many of the recommended parameters can be common across many equipment classes (e.g. capacity, rotational speed). The examples should not be considered exhaustive.
Examples of failure coding, such as failure modes, failure mechanism etc., are given in Annex B. For safety equipment, some specific failure definitions are given in Annex F.
A.2.2 Rotating-equipment data
A.2.2.1 Combustion engines
Table A.5 — Type classification — Combustion engines
Equipment class — Level 6 Equipment type Description Code Description Code
Combustion engines — piston CE Diesel engine DE
(diesel/gas engines) Otto (gas) engine GE

N.I.G.C April 2016 IGS-O-MN-001(0)
39
Figure A.1 — Boundary definition — Combustion engines
Table A.6 — Equipment-class subdivision — Combustion engines
Equipment class Level 6
Combustion engines
Subunit/ Component Start system
Combustion engine unit
Control and monitoring
Lubrication system
Cooling system a Miscellaneou
s
Maintainable item/Part
Start energy (battery, air) Starting unit Start control
Air inlet Ignition system Turbocharger Fuel pumps Injectors Fuel filters Exhaust Cylinders Pistons Shaft Thrust bearing Radial bearing Seals Piping Valves
Actuating device Control unit Internal power supply Monitoring Sensors b Valves Wiring Piping Seals
Reservoir Pump Motor Filter Cooler Valves Piping Oil Temperature-control sensor
Heat exchanger Fan Motor Filter Valves Piping Pump Temperature-control sensor
Hood Flange joints
a May include water-cooled or air-cooled systems. b Specify type of sensor, e.g. pressure, temperature, level, etc.

N.I.G.C April 2016 IGS-O-MN-001(0)
40
Table A.7 — Equipment-specific data — Combustion engines
Name Description Unit or code list Priority
Driven unit Driven unit (equipment class, type and identification code)
Specify High
Power - design Maximum rated output (design) Kilowatt High
Power - operating Specify the approximate power at which the unit has been operated for most of the surveillance time
Kilowatt High
Speed Design speed Revolutions per minute High
Number of cylinders Specify number of cylinders Integer Low
Cylinder configuration Type Inline, vee, flat Low
Starting system Type Electric, hydraulic, pneumatic Medium
Ignition system Otto, diesel Compression ignition (diesel), spark plugs
Medium
Fuel Type Gas, light oil, medium oil, heavy oil, dual
Low
Air-inlet filtration type Type Free text Low
Engine-aspiration type Type of engine aspiration Turbo, natural Medium

N.I.G.C April 2016 IGS-O-MN-001(0)
41
A.2.2.2 Compressors
Table A.8 — Type classification — Compressors
Equipment class — Level 6 Equipment type
Description Code Description Code
Compressor CO
Centrifugal CE
Reciprocating RE
Screw SC
Blowers/fans BL
Axial AX
Figure A.2 — Boundary definition — Compressors

N.I.G.C April 2016 IGS-O-MN-001(0)
42
A.2.2.2.1 Equipment boundary definition for compressors
Figure A.2 shows the boundary definition for compressors. Inlet and outlet valves, and the compressor driver with connected auxiliaries, are not included within the boundary. Driver units are recorded as separate inventories (electric motor, gas turbine or combustion engine) and the failures on the driver, if recorded, should be recorded separately for the driver. A number in the compressor inventory shall give a reference to the appropriate driver inventory.
Compression is normally done in stages where a number of subunits are connected into a train.
A compressor train is considered as one inventory. Each compressor train can consist of up to four compressor stages. Recompression trains on an offshore oil platform normally perform compression in four stages. Each compression stage is usually performed by one compressor unit (casing) but in some cases one compressor unit can perform two stages. Each compressor (stage) normally contains several impellers that are the physical assembly of rotating blades that raise the pressure one step in the compressor unit.
If there are subunits that are common to the driver (e.g. a gas turbine) and the driven unit (i.e. the compressor), these are regarded as a part of the driven unit. For compressors with common lubrication-oil and seal-oil systems, failures should, as a general rule, be assigned to the subunit that is assumed to be the one most affected. Otherwise, the failure should be assigned to the lubrication-oil system.
Table A.9 — Equipment subdivision — Compressors
Equipment class Compressors
Subunit Power transmission Compressor Control and
monitoring Lubrication
system Shaft seal
system Miscellaneous
Maintainable item/Part
Gearbox/ variable drive
Bearings
Coupling to the driver
Coupling to the driven unit
Lubrication
Seals
Casing
Rotor with impellers
Balance piston
Inter stage seals
Radial bearing
Thrust bearing
Shaft seals
Internal piping
Valves
Anti surge system b
Piston Cylinder liner
Packing
Actuating device
Control unit
Cables and junction boxes
Internal power supply
Monitoring
Sensors a
Valves
Wiring
Piping
Seals
Oil tank with heating system
Pump
Motor
Check valves
Coolers Filters
Piping
Valves
Lube oil
Oil tank with heating
Reservoir
Pump
Motor
Gear
Filters
Valves
Seal oil
Dry gas seal
Mechanical seal
Scrubber
Base frame
Piping, pipe support and bellows
Control valves
Isolation valves
Check valves
Coolers
Silencers
Purge air
Magnetic-bearing control system
Flange joints
a Specify type of sensor, e.g. pressure, temperature, level, etc. b Including recycle valve and controllers.

N.I.G.C April 2016 IGS-O-MN-001(0)
43
Table A.10 — Equipment-specific data — Compressors
Name Description Unit or code list Priority
Type of driver Driver unit (equipment class, type and identification code) Specify
High
Gas handled Average molar mass (specific gravity × 28,96) Grams per mole
Medium
Suction pressure Design – first stage Pascal (bar) Medium
Suction pressure Operating – first stage Pascal (bar) Low
Discharge pressure Design – last stage Pascal (bar) High
Discharge pressure Operating – last stage Pascal (bar) Medium
Flow rate Design Metres cubed per hour High
Flow rate Operating Metres cubed per hour Low
Discharge temperature Design Degrees Celsius Medium
Discharge temperature Operating Degrees Celsius Low
Power Design power Kilowatt High
Utilization Percent utilization compared to design Percent Medium
Polytrophic head — Kilojoules per kilogram Low
Number of casings Number of casings in the train Integer High
Number of stages Number of compressor stages (not impellers) in this train Integer
Medium
Body type Type Vertical split case (barrel type), axial split case
Low
Shaft sealing Type Mechanical, oil, dry gas-packed, dry gland, labyrinth, combined
Low
Intercooler fitted Specify if cooler is fitted Yes/no Medium
Shaft seal system Separate, combined, dry, etc. Separate, combined, dry High
Radial bearing Type Antifrictional, journal, magnetic Low
Thrust bearing Specify as relevant in comment field whether any thrust pressure regulator is installed
Antifrictional, journal, magnetic Low
Speed Design speed Revolutions per minute Low
Coupling Type Fixed, flexible, hydraulic, disconnect Low
Reciprocating compressors only Cylinder configuration — Inline, opposed, V, W Low
Cylinder orientation — Horizontal, vertical, inclined Low
Working principle — Single-acting, double-acting Low
Packing type — Lubricated, dry Low

N.I.G.C April 2016 IGS-O-MN-001(0)
44
A.2.2.3 Electric generators
Table A.11 — Type classification — Electric generators
Equipment class — Level 6 Equipment type
Description Code Description Code
Gas-turbine driven TD
Steam-turbine driven SD
Electric generator EG Turboexpander TE
Engine driven, e.g. diesel engine, gas engine
MD
Figure A.3 — Boundary definition — Electric generators

N.I.G.C April 2016 IGS-O-MN-001(0)
45
Table A.12 — Equipment subdivision — Electric generators
Equipment unit Electric generators
Subunit Power transmission
Electric generator
Control and monitoring a
Lubrication system
Cooling system
Miscellaneous
Maintainable items
Gearbox Radial bearing Thrust bearing Seals Lubrication Coupling to driver Coupling to driven unit
Stator Rotor Radial bearing Thrust bearing Excitation Cabling and junction boxes
Actuating device Control unit (e.g. AVR) Internal power supply Monitoring Sensors b Valves Wiring Piping Seals
Reservoir Pump Motor Filter Cooler Valves Piping Oil
Heat exchanger Fan Motor Filter Valves Piping Pump
Hood Purge air
a The automatic voltage regulator (AVR) is an element within “Control”. Temperature and vibration surveillance are elements within “Monitoring”. b Specify type of sensor, e.g. pressure, temperature, level, etc.
Table A.13 — Equipment-specific data — Electric generators
Name Description Unit or code list Priority Type of driver Equipment class, type and identification
code Specify High
Coupling Specify (fixed, flexible, etc.) Fixed, flexible, hydraulic, disconnect Low
Speed Synchronous Revolutions per minute Medium
Frequency Design frequency Hertz Low
Voltage Design voltage Kilovolts High
Power – design Design power Kilovolts High
Power factor cosϕ Number Low
Excitation control Type Automatic, manual Medium
Excitation type Brushless/slip-ring Brushless, slip-ring Medium Degree of protection Protection class in accordance with IEC
60529 IP Low
Insulation class – stator Insulation class in accordance with IEC 60034-1
Y, A, E, B, F, H Medium
Temperature rise – stator
Temperature rise in accordance with IEC 60034-1
Y, A, E, B, F, H Low
Insulation class – rotor Insulation class in accordance with IEC 60034-1
Y, A, E, B, F, H Medium
Temperature rise – rotor Temperature rise in accordance with IEC 60034-1
Y, A, E, B, F, H Medium
Radial bearing Type Antifrictional, journal, magnetic Low
Thrust bearing Type Antifrictional, journal, magnetic Low
Lubrication of bearings Type of bearing lubrication Grease, oil bath, pressurized oil, oil ring Low
Generator cooling Type Air/air, air/water, open ventilated Low

N.I.G.C April 2016 IGS-O-MN-001(0)
46
A.2.2.4 Electric Motors
Table A.14 — Type Classification — Electric Motors
Equipment class — Level 6 Equipment type
Description Code Description Code
Electric motor EM Alternating current AC
Direct current DC
Figure A.4 — Boundary definition — Electric motors

N.I.G.C April 2016 IGS-O-MN-001(0)
47
Table A.15 — Equipment subdivision — Electric motors
Equipment unit Electric motors
Subunit Electric motor Control and monitoring a
Lubrication system
Cooling system Miscellaneous
Maintainable items
Stator Rotor Excitation Radial bearing Thrust bearing
Actuating device Control unit Internal power supply Monitoring Sensors b Valves Wiring Piping Seals
Reservoir Pump Motor Filter Cooler Valves Piping Oil
Heat exchanger Filter Valves Piping Pump Motor Fan
Hood
a Normally, there is no extra control system for motors. For motors of Ex(p) class (pressurized), the internal pressure is monitored. Temperature can be monitored on large motors. b Specify type of sensor, e.g. pressure, temperature, level, etc.
Table A.16 — Equipment-specific data — Electric motors
Name Description Unit or code list Priority
Type of driven unit Equipment class, type and identification code Specify High
Power – design Max. output (design) Kilowatt Medium
Power – operating Specify the approximate power at which the unit has been operated for most of the surveillance time
Kilowatt Low
Variable speed Specify if installed or not Yes/No Low
Speed Design speed Revolutions per minute Medium
Voltage Design voltage Volts Medium
Motor type Type Induction, commutator (d.c.), synchronous
Medium
Insulation class – stator Insulation class in accordance with IEC 60034-1 Y, A, E, B, F, H Medium
Temperature rise – stator Temperature rise in accordance with IEC 60034-1 Y, A, E, B, F, H Low
Insulation class – rotor a Insulation class in accordance with IEC 60034-1 Y, A, E, B, F, H Medium
Temperature rise – rotor a Temperature rise in accordance with IEC 60034-1 Y, A, E, B, F, H Medium
Degree of protection Protection class in accordance with IEC 60529 Specify Medium
Type of Ex protection Explosion classification category, e.g. Ex(d), Ex(e) b
e.g. Ex(d), Ex(e) High
a Not relevant for induction motors.
b See IEC 60079 (all parts).

N.I.G.C April 2016 IGS-O-MN-001(0)
48
A.2.2.5 Gas turbines
Table A.17 — Type classification — Gas turbines
Equipment class — Level 6 Equipment type
Description Code Description Code
Gas turbine GT Industrial IN
Aero-derivative AD
Figure A.5 — Boundary definition — Gas turbines
NOTE This boundary drawing shows a typical layout frequently used for mechanical drive or power generation. However, gas turbines can be configured in different ways with regards to the layout of some subsystems. The compressor and the turbine can be mechanically coupled, single-shaft GT. Other alternatives are when one or more parts of the turbine are mechanically decoupled (multi-spool GT).

N.I.G.C April 2016 IGS-O-MN-001(0)
49
Table A.18 — Equipment subdivision — Gas turbines
Equipment unit
Gas turbines
Subunit Starting system
Air intake Combustion system
Compressor Power turbine H P turbine
Control and monitoring
Maintainable items
Starting motor
Start control
Piping Filter(s)
Valve(s)
Pump(s)
Start energy (e.g. battery, air)
Air cooling
Anti-icing
Filters
Intake duct
Inlet vanes
Combustor
Fuel nozzles
Seals
Rotor
Stator
Cooling system
VGV system
Anti-surge valve
Aux. bleeding system
Anti-icing valve
Casing
Radial bearing
Thrust bearing
Seals
Piping
Rotor
Stator
Casing
Radial bearing
Thrust bearing
Seals
Valves
Piping
Control unit
Sensors a
Wires
Actuating devices
Monitoring
Valves
Internal power supply
Seals
Lubrication system Fuel system Water/Stea
m injection b
Fire and gas protection
Accessory drive Exhaust Miscel-
laneous Heater
Reservoir(s)
Pump(s)
Motor
Filter Temperature control
Valves
Piping
Oil cooler
Oil
Sensors
Wires
Fuel control
Piping
Valves
Seals
Pump(s)/Gas compressor
Filter(s)/ Separators
Wires
Fuel properties measurement
Pump(s)
Piping
Valves
Filter(s)
Seals
Wires
Control unit
Pipes
Valves
Sensors
Wires
Tank(s)/ Storage
Gearbox
Bearing
Seals
Casing
Diffuser
Exhaust
collector
Compensator /bellows
Ducting
Emission
monitoring
Silencer
Thrust bearing
Valves
Waste heat
recovery unit
Enclosure
Hood
Purge air
Flange joints
Ventilation fan
Water-wash system
a Specify type of sensor, e.g. pressure, temperature, level, etc.
b Only relevant for gas turbines with NOx-abatement control with steam or water.

N.I.G.C April 2016 IGS-O-MN-001(0)
50
Table A.19 — Equipment-specific data — Gas turbines
Name Description Unit or code list Priority
Type of driven unit Characteristics of the driven subsystem Generator drive, mechanical drive, auxiliaries, other
High
Power – design ISO power rating Kilowatt High
Power – operating Specify the approximate power at which the unit has been operated for most of the surveillance time.
Kilowatt Medium
Operating profile Utilization profile Base load, peak load, load-sharing backup, emergency/reserve
High
De-rating Specify if permanently de-rated or not Yes/No Medium
Speed Design speed (power shaft) Revolutions per minute Medium
Number of shafts Specify number 1, 2, 3 Medium
Starting system Specify main starting system Electric, hydraulic, pneumatic High
Backup starting system Specify if relevant Electric, hydraulic, pneumatic Low
Fuel Fuel type Gas, oil-light, oil-medium, oil-heavy, dual
Medium
NOx abatement Type of abatement control Steam, water, dry (e.g. dry low emission), none (e.g. single annular combustor)
High
Air inlet filtration type Type Free text Low

N.I.G.C April 2016 IGS-O-MN-001(0)
51
A.2.2.6 Pumps Table A.20 — Type classification — Pumps
Equipment class Type Description Code Description Code
Pump PU Centrifugal CE
Reciprocating RE
Rotary RO
Equipment unit Pumps
Subunit Power transmission Pump unit Control and
monitoring Lubrication
system Miscellaneous
Maintainable items
Gearbox/ variable drive Bearing Seals Coupling to driver Coupling to driven unit
Support Casing Impeller Shaft Radial bearing Thrust bearing Seals Valves Piping Cylinder liner Piston Diaphragm
Actuating device Control unit Internal power supply Monitoring Sensors a Valves Wiring Piping Seals
Reservoir Pump Motor Filter Cooler Valves Piping Oil Seals
Purge air Cooling/heating system Cyclone separator Pulsation damper Flange joints
a Specify type of sensor, e.g. pressure, temperature, level, etc.

N.I.G.C April 2016 IGS-O-MN-001(0)
52
Table A.22 — Equipment-specific data — Pumps
Name Description Unit or code list Priority
Type of driver Equipment class, type and identification code
Specify High
Fluid handled Type Oil, gas, condensate, freshwater, steam, sea water, crude oil, oily water, flare gas, fuel gas, water/glycol, methanol, nitrogen, chemicals, hydrocarbon-combined, gas/oil, gas/condensate, oil/water, gas/oil/water, LNG
High
Fluid corrosive/erosive Classify as shown in footnote a Benign, moderate, severe Medium
Application – pump Where applied Booster, supply, injection, transfer, lift, dosage, disperse
Medium
Pump – design Design characteristic Axial, radial, composite, diaphragm, plunger, piston, screw, vane, gear, lobe
Medium
Power – design Design/rated power of pump Kilowatt High
Utilization of capacity Normal operating/design capacity Percent Medium
Suction pressure – design
Design pressure Pascal (bar) Medium
Discharge pressure – design
Design pressure Pascal (bar) High
Speed Design speed Revolutions per minute or strokes per minute
Medium
Number of stages Centrifugal: number of impellers (in all stages) Reciprocating: number of cylinders Rotary: number of rotors
Number Low
Body type Barrel, split casing, etc. Barrel, split case, axial split, cartridge, Low
Shaft orientation — Horizontal, vertical Low
Shaft sealing Type Mechanical, oil seal, dry gas, packed, gland, dry seal, labyrinth, combined
Low
Transmission type Type Direct, gear, integral Low
Coupling Coupling Fixed, flexible, hydraulic, magnetic, disconnect
Low
Environment Submerged or dry-mounted — Medium
Pump cooling Specify if separate cooling system is installed
Yes/No Low
Radial bearing Type Antifrictional, journal, magnetic Low
Thrust bearing Type Antifrictional, journal, magnetic Low
Bearing support Type Overhung, between bearings, pump casing, split sleeve
Low
a Benign (clean fluids, e.g. air, water, nitrogen).
Moderately corrosive/erosive (oil/gas not defined as severe, sea water, occasionally particles).
Severely corrosive/erosive [sour gas/oil (high H2S), high CO2, high sand content].

N.I.G.C April 2016 IGS-O-MN-001(0)
53
A.2.2.7 Steam turbines
Table A.23 — Type classification — Steam turbines
Equipment class — Level 6 Equipment type
Description Code Description Code
Steam turbines ST Multi-stage MS
Single-stage SS
T1 turbine stage 1 T2 turbine stage 2
Figure A.7 — Boundary definition — Steam turbines

N.I.G.C April 2016 IGS-O-MN-001(0)
54
Table A.24 — Equipment subdivision — Steam turbines
Equipment unit Steam turbines
Subunit Power turbine Condenser Regulating
system Lubrication
system Control and monitoring Miscellaneous
Maintainable items
Piping
Radial bearing
Rotor
Seals
Stator/casing
Steam reg. valves
Thrust bearing
Condenser
Reg. pump
Vacuum pump
Filter
Pump
Cooler
Filter
Oil
Oil seal pump
Piping
Pump
Motor
Reservoir
Valves
Actuating device
Control unit
Internal power supply
Monitoring Sensors a
Valves
Wiring
Piping
Seals
Cranking system
Hood
a Specify type of sensor, e.g. pressure, temperature, level etc.
Table A.25 — Equipment-specific data — Steam turbines
Name Description Unit or code list Priority
Driven unit Equipment class, type and identification code
Compressor, crane, generator, pump, winch, etc.
High
Power – design ISO power rating Kilowatt High
Power – operating Specify the approximate power at which the unit has been operated for most of the surveillance time.
Kilowatt Medium
Speed Design speed (power shaft) Revolutions per minute Medium
Number of shafts Specify number Number Medium
Regulating system Specify type Electronic, hydraulic Medium
Backup starting system Specify if relevant Electric, hydraulic, pneumatic Low
Fuel Fuel type Gas, oil-light, oil-medium, oil-heavy, dual Medium
Air inlet filtration type Type Free text Low
A.2.2.8 Turboexpanders
Table A.26 — Type classification — Turboexpanders
Equipment class — Level 6 Equipment type
Description Code Description Code
Turboexpander TE Centrifugal CE
Axial AX

N.I.G.C April 2016 IGS-O-MN-001(0)
55
NOTE Driven units other than recompressors (e.g. pumps or generators) are also outside the boundary.
Figure A.8 — Boundary definition — Turboexpanders
Table A.27 — Equipment subdivision — Turboexpanders
Equipment unit Turboexpanders Subunit Expander
turbine Control and monitoring
Lubrication system
Shaft seal system
Miscellaneous
Maintainable items
Rotor w/impellers
Inlet vanes
Casing
Radial bearing
Thrust bearing
Seals Inlet screen
Valves Piping
Actuating device
Control unit
Internal power supply
Monitoring
Sensors a
Valves
Wiring
Piping
Seals
Reservoir
Pump
Motor
Filter
Cooler
Valves
Piping
Oil
Seal-gas equipment
Seal gas
Others
a Specify type of sensor, e.g. pressure, temperature, level, etc.

N.I.G.C April 2016 IGS-O-MN-001(0)
56
Table A.28 — Equipment-specific data — Turboexpanders
Name Description Unit or code list Priority
Type of driven unit Equipment class, type and identification code
Specify High
Power – design Max. design output power Kilowatt High
Power – operating Specify the approximate power at which the unit has been operated for most of the surveillance time.
Kilowatt Low
Speed Design speed Revolutions per minute Medium
Inlet flow Design inlet flow, turbine Kilograms per hour Medium
Inlet temperature Design inlet temperature, turbine Degrees Celsius Medium
Inlet pressure Design inlet pressure, turbine Pascal (bar) Medium
Gas handled Average molar mass (specific gravity × 28,96)
Grams per mole Low
Gas corrosiveness/ erosiveness
Specify as shown in the footnote a Benign, moderate, severe Medium
Type of design Type Centrifugal, axial Medium
Number of stages Number of stages (in series) Number Low
Casing-split type Type Horizontal/vertical Low
Shaft sealing Type Mechanical, oil, seal, dry gas, packed, gland, dry seal, labyrinth, combined
Low
Flow-control turbine Type Variable nozzles, nozzle-group valves, throttle valve, fixed inlet
Low
Radial bearing Type Antifrictional, journal, magnetic Low
Thrust bearing Type Antifrictional, journal, magnetic Low a Benign (clean and dry gas).
Moderately corrosive/erosive (some particles or droplets, some corrosiveness).
Severe corrosive/erosive (sour gas, high CO2 content, high content of particles).
A.2.3 Mechanical Equipment
A.2.3.1 Cranes
Table A.29 — Type classification — Cranes
Equipment class — Level 6 Equipment type Description Code Description Code
Cranes CR Electro-hydraulic operated HO
Diesel hydraulic operated DO

N.I.G.C April 2016 IGS-O-MN-001(0)
57
Figure A.9 — Boundary definition — Cranes
Key
1 boundary 2 crane base (u/s slew ring)
a Power supply. b Communication signal in/out.
NOTE The boundary drawing illustrates one type of crane commonly used offshore. Several other categories exist, viz. traversing cranes, gantry cranes etc. It is necessary to adapt the taxonomy for these categories to each category.

N.I.G.C April 2016 IGS-O-MN-001(0)
58
Table A.30 — Equipment subdivision — Cranes
Equipment unit Cranes
Subunit Crane structure
Boom system
Hoist system
Swing system
Power system
Control and
monitoring Miscellaneous
Maintainable items
A-frame/king Drivers cabin Engine room Pedestal Crane frame
Boom Boom bearing Hydraulic cylinder Luffing winch Luffing wire Luffing sheaves Boom stop cylinder
Hoist winch Hoist sheaves Hook Lifting wire Shock damper
Slew bearing Slew ring Slew motor Slew pinion
Hydraulic pumps Electric engine Diesel engine Proportional valves Hydraulic tank Hydraulic filters Hydraulic oil
PC/PLS Control valves Internal power supply (UPS) Amplifiers Joysticks Load indicator
Others
Table A.31 — Equipment-specific data — Cranes
Name Description Unit or code list Priority Type of driver Driver unit (equipment class,
type and identification code) Specify High
Overall maximum height Specify Metres Low
Main boom length Specify Metres Medium
A-frame height Specify Metres Low
Boom, min. angle Specify Degrees Low
Boom, max. angle Specify Degrees Low
Slew bearing type Specify Conical, roller High
Hydraulic operating medium Hydraulic fluid type Oil-based, synthetic-based, water-based Low
Hydraulic operating pressure Specify Pascal (bar) Low
Total unit weight Specify Metric tonnes Medium
Boom total weight Specify Metric tonnes Low
Safe working load (SWL) Crane’s safe working load Metric tonnes High
Max. operating swing Turning range (total) Degrees Medium
Max. moment Crane’s max. moment Tonne·metre High
Hoist speed 1 At max. load Metres per second Medium
Hoist speed 2 At no load Metres per second Low
Slewing speed 1 At max. load Degrees per second Medium
Slewing speed 2 At no load Degrees per second Low
WHIP crane Installed or not Yes/No Low
Heave compensation system Installed or not Yes/No Low
Automatic overload protection system (AOPS)
Installed or not Yes/No High
Manual overload protection system (MOPS)
Installed or not Yes/No High
Constant tension Installed or not Yes/No Low

N.I.G.C April 2016 IGS-O-MN-001(0)
59
A.2.3.2 Heat exchangers
NOTE Heat exchangers include coolers, condensers and re-vaporizers, etc.
Table A.32 — Type classification — Heat exchangers Equipment class — Level 6 Equipment type
Description Code Description Code
Heat exchanger HE Shell and tube ST
Plate P
Plate fin PF
Double pipe DP
Bayonet BY
Printed circuit PC
Air-cooled AC
Spiral S
Spiral-wound SW
Figure A.10 — Boundary definition — Heat exchangers

N.I.G.C April 2016 IGS-O-MN-001(0)
60
Table A.33 — Equipment subdivision — Heat exchangers
Equipment unit Heat exchangers
Subunit External Internal Control and monitoring Miscellaneous
Maintainable items Support
Body/shell
Valves
Piping
Body/shell
Tubes
Plates
Seals (gaskets)
Actuating device
Control unit
Internal power supply
Monitoring Sensors b
Valves
Wiring
Piping
Seals
Fan a
Motor
a Applicable for air-cooled heat exchangers only.
b Specify type of sensor, e.g. pressure, temperature, level, etc.
Table A.34 — Equipment-specific data — Heat exchangers
Name Description Unit or code list Priority
Fluid, hot side Fluid type Oil, gas, condensate, freshwater, steam, sea water, crude oil, oily water, flare gas, water/glycol, methanol, nitrogen, chemicals, hydrocarbon, air
High
Fluid, cold side Fluid type Oil, gas, condensate, freshwater, steam, sea water, crude oil, oily water, flare gas, water/glycol, methanol, nitrogen, chemicals, hydrocarbon, air
High
Rated heat transfer Design value Kilowatt Medium
Heat-transfer area — Metres squared Medium
Utilization Used/rated heat transfer Percent Medium
Pressure, hot side Design pressure Pascal (bar) Medium
Pressure, cold side Design pressure Pascal (bar) Medium
Temperature drop, hot side Operating Degrees Celsius Low
Temperature rise, cold side Operating Degrees Celsius Low
Size – diameter External Millimeters Medium
Size – length External Metres Medium
Number of tubes/plates — Number Low
Tube/plate material Specify material type in tubes/plates.
Free text Medium

N.I.G.C April 2016 IGS-O-MN-001(0)
61
A.2.3.3 Heaters and boilers
A.2.3.3.1 Boundary definitions for heaters and boilers
The boundary definition applies to hydrocarbon- (HC-) fired heaters and boilers. The layout of heaters and boilers can vary considerably; however, they all apply the same principle supplying energy to heat or boil a medium. The energy can be supplied through combustion of hydrocarbons, through supply of a high-temperature medium (e.g. steam) or by electricity.
The heater and boiler components may vary significantly in design, but will typically include a vessel/shell in which the heating process is performed. For heaters and HC-fired boilers, a burner device and exhaust system are included. Unlike most boilers, the heaters contain a tube coil through which the medium being heated flows.
For HC-fired heaters and boilers, the fuel-control valve is inside the equipment boundary, while the fuel-conditioning equipment (e.g. scrubbers) and ESD/PSD valves are outside the boundary.
Inlet, outlet, pressure-relief and drain valves are specifically excluded. Valves and instruments included are those locally mounted and/or which form a pressure boundary (e.g. block valves, calibration valves, local indicators/gauges).
Table A.35 — Type classification — Heaters and boilers
Equipment class — Level 6 Equipment type Description Code Description Code
Heaters and boilers HB Direct-fired heater
Electric heater Indirect
HC-fired heater
Heater treater
DF EH IF HT
Non-HC-fired boiler
Electric boiler
HC-fired boiler
NF EB FB

N.I.G.C April 2016 IGS-O-MN-001(0)
62
Equipment unit Heaters and (re)boilers
Subunit Column Externals Internals Control and monitoring Miscellaneous
Maintainable items
Body/shell
Packing
Reflux coil/ condenser
Body/shell
Piping
Support
Valves
Body/shell
Burner
Firetube
Exhaust stack Tube coil
Support
Actuating device
Control unit
Internal power supply
Monitoring Sensors a
Valves
Wiring
Piping
Seals
Fan
Others
a Specify type of sensor, e.g. pressure, temperature, level, etc.

N.I.G.C April 2016 IGS-O-MN-001(0)
63
Table A.37 — Equipment-specific data — Heaters and boilers
Name Description Unit or code list Priority
Energy source Type of heating energy Electricity, exhaust gas, fuel gas, hot oil, liquid fuel, steam
High
Heated/boiled medium Type of fluid being heated/boiled MEG, TEG, HC-based heating medium, water, water/TEG
High
Rated heat transfer Design value Kilowatt High
Inlet temperature Design value Degrees Celsius Medium
Outlet temperature Design value Degrees Celsius Medium
Size – diameter Specify Millimetres Medium
Size – length Specify Metres Medium
Number of tubes Specify Number Medium
Tube material Specify Specify Low
Tube coil configuration Specify Helical, horizontal, single-pass, spiral, split-pass, vertical
Low
Packing type — Specify High
Heater type Direct-fired only Box, cabin, cylindrical Low
Number of burners — Number Low
A.2.3.4 Vessels NOTE Vessels include separators, scrubbers, cyclones, etc.
Table A.38 — Type classification — Vessels
Equipment class — Level 6 Equipment type Description Code Description Code
Vessel VE Stripper SP
Separator SE
Coalescer CA
Flash drum FD
Scrubber SB
Contactor CO
Surge drum SD
Hydrocyclone HY
Slug catcher SC
Adsorber AD
Dryer DR
Pig trap PT
Distillation column DC
Saturator SA
Reactor RE
De-aerator DA

N.I.G.C April 2016 IGS-O-MN-001(0)
64
Figure A.12 — Boundary definition — Vessels
Table A.39 — Equipment subdivision — Vessels
Equipment unit Vessels
Subunit External items Internal items Control and monitoring Miscellaneous
Maintainable items Support
Body/Shell
Valves
Piping
Body/Shell
Plates, trays, vanes, pads
Nozzle
Sand-trap system
Heater
Corrosion protection
Distributor
Coil
Actuating device
Control unit
Internal power supply
Monitoring
Sensors a
Valves
Wiring
Piping
Seals
Others
a Specify type of sensor, e.g. pressure, temperature, level, etc.

N.I.G.C April 2016 IGS-O-MN-001(0)
65
Table A.40 — Equipment-specific data — Vessels
Name Description Unit or code list Priority Fluid(s) Main fluid Oil, gas, condensate, freshwater, steam,
sea water, crude oil, oily water, flare gas, fuel gas, water/glycol, methanol, nitrogen, chemicals, hydrocarbon combined, gas/oil, gas/condensate, oil/water, gas/oil/water
High
Pressure – design Design pressure Pascal (bar) High
Temperature – design Design temperature Degrees Celsius Low
Pressure – operating Operating pressure Pascal (bar) Medium
Temperature – operating Operating temperature Degrees Celsius Low
Size – diameter External Millimeters Medium
Size – length External Metres Medium
Body material Specify type or code Free text Low
Orientation — Horizontal/vertical Low
Number of branches Pressurized connections only Number Low Internals Design principle Baffles, trays, grid plate, demister, heat coil,
diverter, de-sander, combined Low
A.2.3.5 Piping
Table A.41 — Type classification — Piping
Equipment class — Level 6 Equipment type Description Code Description Code
Piping PI Carbon steels CA
Stainless steels ST
High-strength low-alloy steels LO
Titanium TI
Polymers including fibre-reinforced PO

N.I.G.C April 2016 IGS-O-MN-001(0)
66
Figure A.13 — Boundary definition — Piping
Table A.42 — Equipment subdivision — Piping
Equipment unit Piping
Subunit Pipe Valve a Control and monitoring
Miscellaneous
Maintainable items
Fastener/ bolts
Fitting
Flange
Header
Lining
Pipe element
Plug
Valve body
Valve seals
Actuator Bonnet
Accessories
Actuating device
Control unit
Internal power supply
Monitoring
Sensors b
Valves
Wiring
Piping
Seals
Pipe support
Others
a It should be marked if the valve(s) is/are registered as (a) separate equipment units(s) in the database (see also A.2.5.4).
b Specify type of sensor, e.g. pressure, temperature, level, etc.

N.I.G.C April 2016 IGS-O-MN-001(0)
67
Table A.43 — Equipment-specific data — Piping
Name Description Unit or code list Priority
Diameter Outer diameter Millimeters High
Wall thickness Specify Millimeters Medium
Length Total length Metres High
Design pressure Max. allowable pressure Pascal (bar) High
Fluid handled Type Oil, gas, condensate, freshwater, steam, sea water, crude oil, oily water, flare gas, fuel gas, water/glycol, methanol, nitrogen, chemicals, hydrocarbon-combined, gas/oil, gas/condensate, oil/water, gas/oil/water
High
Fluid corrosive/erosive Classify as shown in the footnote a
Benign, moderate, severe Medium
Pipe material Specify Carbon steel, stainless steel, alloy type, composite, titanium etc.
Medium
Insulated Specify Yes/No Low
Number of valves Number of valves installed on the pipe length considered
Number Medium
Type of valves Specify valve category PSV, ESD, HIPPS, manual, etc. Low
Number of flanges Specify Number Low
a Benign (clean fluids, e.g. air, water, nitrogen).
Moderately corrosive/erosive (oil/gas not defined as severe, sea water, occasionally particles).
Severely corrosive/erosive [sour gas/oil (high H2S), high CO2, high sand content].
A.2.3.6 Winches
Table A.44 — Type classification — Winches
Equipment class — Level 6 Equipment type
Description Code Description Code
Winches WI Electric winch EW
Hydraulic winch

N.I.G.C April 2016 IGS-O-MN-001(0)
68
Figure A.14 — Boundary definition — Winches
Table A.45 — Equipment subdivision — Winches
Equipment unit Winches Subunit Winch Power
transmission Control and monitoring
Miscellaneous
Maintainable items
Bearing
Chain
Drum
Lubrication
Reel
Speedbrake
Spool
Structure
Tensioning and motion compensation
Wire
Bearing
Coupling
Gear Shaft
Actuating device
Control unit
Internal power supply
Monitoring Sensors a
Valves
Wiring
Piping
Seals
Hood
Others
a Specify type of sensor, e.g. pressure, temperature, level, etc.

N.I.G.C April 2016 IGS-O-MN-001(0)
69
Table A.46 — Equipment-specific data — Winches
Name Description Unit or code list Priority
Type of driver Equipment class, type and code Specify High
Wire/chain type Type of hoisting line Cable, chain, rope, umbilical, wire High
Max. output Max. input power – design Kilowatt High
Max. capacity Max. load capacity Metric tonnes Medium
Drum capacity Max. drum capacity Metres Low
Drum diameter — Metres Low
Wire diameter Wire/line thickness Millimeters Low
Speed – design Max. operating speed Revolutions per minute High
Transmission type Type Direct, gear, integral Low
Coupling Type Disconnect, fixed, flexible, hydraulic Low
Lubrication of bearings Type Specify Low
Radial bearing Type Antifrictional, journal, magnetic Low
No. of drums Number Number Low
Spooling device As applicable Yes/No Low
Constant tensioning system As applicable Yes/No Low
Heave compensation system As applicable Yes/No Low
Regeneration of power As applicable Yes/No Low
Remote control As applicable Yes/No Low
A.2.3.7 Turrets
Table A.47 — Taxonomy classification — Turrets
Equipment class — Level 6 Equipment type Description Code Description Code
Turrets TU Disconnect able turrets Permanent turrets
DT PT

N.I.G.C April 2016 IGS-O-MN-001(0)
70
A.2.3.7.1 Boundary definitions for turrets
A.2.3.7.1.1 The disconnectable turret boundary is defined as follows:
a) interfaces between the ship hull and the turret or buoy;
b) mooring lines and anchors down to seabed included within boundary;
c) interface between turret and turret compartment (boundary includes riser termination);
d) manifold piping and valves between the riser termination and the swivel or dragged chain outside the boundary;
e) Control and monitoring equipment excluded from the boundary.
The boundary definition for permanent turrets is focused on the marine structures and dedicated turret systems.
A.2.3.7.1.2 The permanent turret boundary is defined as follows.
a) The interface between the ship hull and the outer diameter of the turret defines the boundary between the
ship structure and the turret.
b) Mooring lines and anchors down to the seabed are included within the boundary.
c) The interface between turret and turret compartment defines the upper boundary of the turret.
d) The riser and umbilical termination is inside the equipment boundary.
e) The risers are outside the boundary (covered as a separate equipment class).

N.I.G.C April 2016 IGS-O-MN-001(0)
71
Key 1 boundary 6 anchor winches 2 swivel 7 riser 3 riser termination 8 mooring lines 4 production manifold 9 anchors 5 ship Figure A.15 — Boundary definition — Turrets
Table A.48 — Equipment subdivision — Turrets
Equipment unit Turrets Subunit Turret Mooring Riser and
umbilical termination
Utility systems
Maintainable items
Bearing-roller
Bearing-slide
Bearing-wheel
Structure
Turning and locking system
Anchor
Buoy a
Chain
Synthetic rope
Connection to structure
Winch
Wire
Bend-restrictor lock Hang-off
Ballast system
Bilge system
Lock buoy/ship system a
Power system
Pull-in a
Ventilation
a Only relevant for disconnectable turrets.

N.I.G.C April 2016 IGS-O-MN-001(0)
72
Table A.49 — Equipment-specific data — Turrets
Name Description Unit or code list Priority
Application Main use External loading, external production/injection, internal loading, internal production/injection
High
Turret location Where installed on the vessel Bow, stern, behind living quarter High
Fluid transmission Fluid-transfer method Dragged chain, jumper, swivel High
Rotation system — Active, passive High
Riser termination Type Flanged, quick connect, quick disconnect, welded
High
Number of risers — Number High
Number of umbilicals — Number High
Number of anchor lines — Number High
Wave height Significant height – design value Meters Medium
Vessel displacement — Metric tonnes Medium
A.2.3.8 Swivels
Table A.50 — Type classification — Swivels
Equipment class — Level 6 Equipment type
Description Code Description Code
Swivels SW Axial AX
Toroidal TO
Electric/signal ES
Figure A.16 — Boundary definition — Swivels

N.I.G.C April 2016 IGS-O-MN-001(0)
73
Table A.51 — Equipment subdivision — Swivels Equipment unit Swivels
Subunit Swivel Miscellaneous Maintainable items Dynamic seals
Bearing
Liquid barrier system
Bolting (incl. both structural and pressure connections) Casing
Brushes a
Tensioners
Common items
a Only for electric swivels.
Table A.52 — Equipment-specific data — Swivels
Name Description Unit or code list Priority Number of paths For power and signal swivels no. of paths is
defined as no. of services Number High
Design pressure — Pascal (bar) Medium
Design temperature — Degrees Celsius Low Enclosure Type of enclosure Closed compartment, naturally
ventilated Medium
Produced-fluid corrosiveness
Type of service Sweet service, sour service Medium
Sand production Measured or estimated sand production Grams per cubic metre Low
Electric power Power swivels only Kilowatt Medium
Voltage – power Power swivels only a Volt Medium
Voltage signal Signal swivels only a Volt Medium
a If several levels exist, record the most dominating and add further explanation as “Remarks”.

N.I.G.C April 2016 IGS-O-MN-001(0)
74
A.2.3.9 Storage tanks
Table A.53 — Type Classification — Storage Tanks
Figure A.17 — Boundary definition — Storage Tanks
Table A.54 — Equipment-subdivision — Storage Tanks

N.I.G.C April 2016 IGS-O-MN-001(0)
75
A.2.3.10 Filters & Strainers
Table A.55 — Type Classification — Filters & Strainers
Figure A.18 — Boundary definition — Filters
Table A.56 — Equipment-subdivision — Filters

N.I.G.C April 2016 IGS-O-MN-001(0)
76
A.2.4 Electrical equipment A.2.4 presents examples of typical plant/unit-level applications for electrical equipment.
A.2.4.1 Uninterruptible power supplies (UPS)
Table A.57 — Type classification — UPS
Equipment class — Level 6 Equipment type Description Code Description Code UPS UP Dual UPS with standby bypass
Rectifier supplied from emergency power Bypass from main power system
UB
Dual UPS without bypass Rectifier supplied from emergency power
UD
Single UPS with bypass Rectifier supplied from emergency power Bypass from main power system
US
Single UPS without bypass Rectifier supplied from emergency power
UT
a Make-before-break switch.
Figure A.19 — Boundary definition (typical) — UPS

N.I.G.C April 2016 IGS-O-MN-001(0)
77
Table A.58 — Equipment subdivision — UPS
Equipment unit UPSs
Subunit Battery unit Bypass unit Inverter unit Rectifier unit/ DC supply
Control and monitoring Miscellaneous
Maintainable items
Battery breaker
Battery bank
Cabling
Circuit breaker
Connection/ socket
Instrument
Bypass switch
Bypass transformer
Contactor feeder a
Fuse(s)
Instrument
Static switch
Bypass switch
Cabling
Connection/ socket
Fuse(s)
Instrument
Inverter
Static switch
Inverter transformer
Cabling
Contactor feeder a
Fuse(s)
Fused switch
Instrument
Rectifier
Rectifier transformer
Actuating device
Control unit
Internal power supply
Monitoring
Sensors b
Valves
Wiring
Piping
Seals
Cabinet
Insulation Cooling fans Others
a Normally located in the supplying switchboard. b Specify type of sensor, e.g. pressure, temperature, level, etc.
Table A.59 — Equipment-specific data — UPS
Name Description Unit or code list Priority
Application What equipment the UPS is applied for
Circuit breaker, control systems, safety systems, telecommunication
High
System input voltage Input voltage Volt High
Input frequency Rated input 50 Hz or 60 Hz High
Number of phases input voltage
1-phase or 3-phase Number High
Voltage variation Input voltage Percent Low
Frequency variation Input frequency Percent Low
System output voltage Output voltage Volt High
Output frequency Rated output 50 Hz, 60 Hz or DC High
Number of phases output voltage
1-phase or 3-phase Number High
Rated output load and power factor
Apparent power and power factor in nominal operations
Kilo volt· amperes/cos ϕ High
Degree of protection Protection class in accordance with IEC 60529
IP code Medium
Ambient temperature Operating temperature range Minimum and maximum temperature in degrees Celsius
Low
Cooling method Specify Water, air, others Medium UPS string system The numbers of UPS systems which
are working in parallel Dual, single, triple Medium
Rectifier/inverter bypass system
The type of bypass switch Manual, static Medium

N.I.G.C April 2016 IGS-O-MN-001(0)
78
Table A.59 (continued)
Name Description Unit or code list Priority
Battery backup time The time during which the battery can supply rated output power to the inverter
Minutes Medium
Recharge time The time to recharge the battery to 90 % capacity
Hours Medium
Battery technology Type of NiCd, Pb-acid, other Medium
Battery earth-fault monitoring Specify Common, individual, N.A. Low
Method of ventilation Specify Forced, natural Low
Number of battery banks Specify Number Medium
A.2.4.2 Power transformers
Table A.60 — Type classification — Power transformers
Equipment class — level 6 Equipment type Description Code Description Code
Power Transformer PT Oil immersed OT
Dry DT
Figure A.20 — Boundary definition (typical) — Power transformer

N.I.G.C April 2016 IGS-O-MN-001(0)
79
Table A.61 — Equipment Subdivision — Power transformers
Equipment Unit Power transformers Subunit Transformer unit Monitoring system Miscellaneous
Maintainable items Oil
Tank
Windings
Fan
Core
Expansion tank
Radiator
Tap changer
Neutral impedance
Outer tank a
Bucholz relay
Level indicator
Thermometer
Relief valve
Pressure relay
Current transformers
Bushing insulators
Terminal blocks
Connectors
Wiring
Grounding
Junction box
Silica-gel device
Dampers
Penetrator a
a Subsea application.
Table A.62 — Equipment-specific data — Power transformers
Name Description Unit or Code list Priority
Frequency Rated frequency Hertz Low
Primary voltage Rated voltage Kilovolts High
Secondary voltage Rated voltage Kilovolts High
Voltage additional windings
Rated voltage tertiary or further windings Kilovolts High
Power – design Rated power Kilo volt· amperes High
Power factor Cos φ Number Low
Efficiency Efficiency factor (η) Number < 1 Medium
Degree of protection
Protection class in accordance with IEC 60529 Code as in IEC 60529:2001, Clause 4
Low
Thermal class designation
Thermal class in accordance with IEC 62114 Y, A, E, B, F, H, 200, 220, 250 Medium
Temperature rise In accordance with IEC 60076-2 Degrees Celsius Low
Transformer cooling
Type in accordance with IEC 60076-2 Code as in IEC 60076-2:1993, Clause 3
High
Number of phases 1-phase or 3-phase Number High
Level of insulation Insulation in accordance with IEC 60076-3 Kilovolts High
Three-phase transformer connection
Type and combination of connections (vector groups) as star, delta, etc. in accordance with IEC 60076-1
Code as recommended in IEC 60076-1:2000, Annex D
High
Water depth a Water depth for location of subsea transformer Metres High
Type of dry transformer winding
Specify if the windings are encapsulated in solid insulation. Cast resin is an example of solid insulation.
Encapsulated/not encapsulated Medium
a Relevant for subsea installations only.

N.I.G.C April 2016 IGS-O-MN-001(0)
80
A.2.4.3 Switchgears/Switchboards/Distribution boards
Table A.63 Type classification- Switchgears/Switchboards/Distribution boards
Equipment type Equipment class-Level 6
Code Description Code Description
MG Main MV Switch Gear SD Switchgear Switchboard Distribution board LG Main LV Switch Gear
MC Motor Control Center
LP LV Panel Board
MB MV Capacitor Bank
LB LV Capacitor Bank
Table A.64 Equipment subdivision- Switchgears/Switchboards/Distribution boards
Switchgears/Switchboards/Distribution boards Equipment unit
Miscellaneous Protection Control and monitoring Power Subunit
Cabinet Insulation Cooling fans Heaters Thermostat Others
Protection relay Phase Control C.T. P.T. Fuse(s) Wiring
Relay Contactor Aux Contact Selector switch C.T. P.T. Wattmeter Ammeter Voltmeter Monitor Lamp signal Wiring Push Button Timer Voltage transducer Current transducer
Main C.B. M.C.B M.C.C.B Rotary switch Contactor Internal power supply Bus bar Cabling a
Maintainable item/Part
a Including cables and terminations

N.I.G.C April 2016 IGS-O-MN-001(0)
81
A.2.4.4 Power cables and terminations
Table A.65 Type classification- Power cables and terminations Equipment class - level 6 Equipment type
Description Code Description Code Cabling (Wiring) CB Low Voltage LV
Medium Voltage MV
High Voltage HV
Instrument IN
Electrical earth EE
Clean earth CE
Surge arresters earth SE
Telecommunication TL
Table A.66 Equipment Subdivision - Power cables and terminations Equipment Power cables and terminations
Subunit Cable/Wire Miscellaneous
Maintainable Item
cable element support wire element gland
terminal insulator cable show fuse cut out
bus duct others junction box
switch ports
Figure A.21 Boundary definition - Power cables and

N.I.G.C April 2016 IGS-O-MN-001(0)
82
A.2.4.5 Lighting tower
Table A.67 Type classification- Lighting tower Equipment class - level 6 Equipment type
Description Code Description Code Lighting tower LH Motorize Lighting tower MT
Fix Lighting tower FT
A.2.4.6 Surge arrester (Lightening protection)
Table A.68 Type classification- Surge Arrester(Lightening protection) Equipment class - level 6 Equipment type
Description Code Description Code Surge Arrester SA Active Lightening protection AL
Passive Lightening protection
PL

N.I.G.C April 2016 IGS-O-MN-001(0)
83
A.2.5 Safety and Control
A.2.5.1 Fire and gas detectors
Table A.69 — Type classification — Fire and gas detectors Equipment class — Level 6 Equipment type Description Code Description Code
Fire and gas detectors FG Fire detection
BS BH BF BM BA
Smoke/Combustion Heat Flame Manual pushbutton Others
Gas detection AB AS AO
Hydrocarbon Toxic gases Others
a Not applicable for all fire and gas sensors.
Figure A.22 — Boundary definition — Fire and gas detectors

N.I.G.C April 2016 IGS-O-MN-001(0)
84
A.2.5.1.1 Boundary definitions for fire and gas detectors
Field input devices such as fire and gas detectors are usually connected to a fire and gas control logic unit (CLU), which is not included in the boundary of fire and gas detectors (see Figure A.19). Monitoring/interface units may be used between detector and CLU, and this is part of the fire and gas detectors. The purpose of these units is, among others, to monitor the detectors, their interface connections and cables, analyzing the incoming data by different algorithms and initiating fault or alarm signals. The basic principle of data communication between field equipment and such interface systems can be based on multiplexing and sequential polling of data.
Table A.70 — Equipment subdivision — Fire and gas detectors
Equipment unit Fire and gas detectors
Subunit Sensor Interface unit a Miscellaneous Maintainable items Cabling
Cover Detector (incl. head and associated electronics) Mounting socket
Cabinet Control card Display
Others
a Not applicable for all fire and gas sensors.
Table A.71 — Equipment-specific data — Fire and gas detectors
Name Description Unit or code list Priority
Functional characteristics Location on installation
Where installed Drill floor, wellhead, process, auxiliary, mud processing, power generation, utility, control room, auxiliary room, living quarter
High
Environment Exposure Severe, moderate, low, unknown a High
Item characteristics Sensing principle Type Fire: Ionization, optical, IR, UV, IR/UV, rate rise,
rate comp., fixed temp., fusible plug, camera, multisensory (optical/heat) Gas: Catalytic, electrochemical, photo electrochemical, photoelectric beam, IR, UV, acoustic, camera, aspirating, optical beam, solid state
High
Detector communication
Type Conventional, addressable (one-way), smart (two-way)
Medium
Fault tolerance b Response at failure Yes/No Medium Self-test feature Degree of self-testing No self-test, automatic loop test, built-in test,
combined Medium
Type of Ex protection Explosion classification category, e.g. Ex(d), Ex(e) c
Ex(d), Ex(e), Ex( i ), none Low
a Environment classification: o severe not enclosed and/or outdoor; heavily exposed (vibration, heat, dust, salt); o moderate partly enclosed and/or moderately exposed (vibration, heat, dust, salt); naturally ventilated; o low enclosed and/or indoor; minor exposure (vibration, heat, dust, salt); mechanically ventilated.
b Design based on de-energized principle is compatible with fail-safe philosophy. A safety-instrumented system operating in “normally energized” mode can be designed to fail-safe on loss of power or signal. c See IEC 60079 (all parts).

N.I.G.C April 2016 IGS-O-MN-001(0)
85
A.2.5.2 Input devices
Input devices are, in general, sensors that convert process parameters into an electric signal that can be monitored. Typical main categories of input devices are the following:
a) transmitter: converts process parameter, e.g. pressure, into proportional electrical signals, typically 4 m A to 20 m A or 0 V to 10 V (see IEC 60381-2);
b) transducer: converts process parameters, e.g. pressure, into proportional electrical signals, typically unamplified output;
c) switch: converts process parameters, e.g. pressure, typically into on/off electrical signals.
Table A.72 — Type classification — Input devices
Equipment class — Level 6 Equipment type Description Code Description Code
Input devices IP Pressure PS
Level LS
Temperature TS
Flow FS
Speed SP
Vibration VI
Displacement DI
Analyzer AN
Weight WE
Corrosion CO
Limit switch LP
On/off (pushbutton) PB
Others OT

N.I.G.C April 2016 IGS-O-MN-001(0)
86
Figure A.23 — Boundary definition — Input devices
This boundary drawing does not apply for switches and pushbuttons.
Table A.73 — Equipment subdivision — Input devices
Equipment unit Input devices Subunit Sensor and electronics Miscellaneous
Maintainable items
Sensing element Conditioning (electronics)
Cabling Piping Others

N.I.G.C April 2016 IGS-O-MN-001(0)
87
Table A.74 — Equipment-specific data — Input devices
Name Description Unit or code list Priority
Functional characteristics Location on installation Where installed Drill floor, wellhead, process,
auxiliary, mud processing, power generation, utility, control room, auxiliary room, living quarter
High
Application Where applied Process control, emergency shutdown, process shutdown, pressure reduction, bypass, blowdown, monitoring, combined
High
Fluid/gas corrosiveness/ erosiveness
Classify as explained in footnote a Benign, moderate, severe Medium
Item characteristics Category Main category Transmitter, transducer, switch,
pushbutton High
Sensing principle Applicable for pressure sensors only Bonded strain, semiconductor, strain, piezoelectric, electromechanical, capacitance, reluctance, oscillating wire
High
Applicable for level sensors only Differential-pressure cell, capacitance, conductive, displacement, diaphragm, sonic, optical, microwave, radio frequency, nuclear
High
Applicable for temperature sensors only Resistance temperature detector (PT), thermocouple, capillary
High
Applicable for flow sensors only Displacement, differential head (closed conduit/pipe, open channel), velocity, mass
High
Insert additional types as relevant (e.g. speed, vibration)
To be defined by user as required High
Sensor voting, k out of Y (only as relevant)
At least k out of the total number, Y, of sensors shall provide signal to initiate control/safety action. k and Y shall be entered; if no voting, leave blank.
k = “xx” (integer) Y = “yy” (integer)
Low
Fault tolerance Response at failure Yes/No High
Detector communication
Type Conventional, addressable (one-way), smart (two-way)
Medium
Self-test feature Degree of self-testing No self-test, automatic loop test, built-in test, combined
High
Type of protection Explosion classification category, e.g. Ex(d), Ex(e) b
Ex(d), Ex(e), Ex(i), None Low
a Benign (clean fluids, e.g. air, water, nitrogen). Moderately corrosive/erosive (oil/gas not defined as severe, sea water, occasionally particles). Severely corrosive/erosive [sour gas/oil (high H2S), high CO2 content, high sand content]. b See IEC 60079 (all parts).

N.I.G.C April 2016 IGS-O-MN-001(0)
88
A.2.5.3 Control logic units (CLU)
Table A.75 — Type classification — Control logic units
Equipment class — Level 6 Equipment type Description Code Description Code
Control logic units CL Programmable logic controller (PLC)
LC
Computer PC
Distributed control unit DC
Relay RL
Solid state SS
Single-loop controller SL
Programmable automation controller (PAC)
PA
Figure A.24 — Boundary definition — Control logic units

N.I.G.C April 2016 IGS-O-MN-001(0)
89
Table A.76 — Equipment subdivision — Control logic units
Equipment unit
Control logic unit
Subunit Analog
input cards Digital
input cards
Analog output cards
Digital output cards
Logic solver
System bus
Power supply
Miscel- laneous
Maintainable items
Input card
Connection unit
Input card
Connection unit (X-wiring)
Output card
Connection unit (X-wiring)
Relay
Output card
Connection unit (X-wiring)
Relay
Central processor unit (CPU)
Random access memory (RAM)
Watchdog/ diagnostic
Software
No subdivision
No subdivision
Galvanic barriers
Others
Table A.77 — Equipment-specific data — Control logic units
Name Description Unit or code list Priority
Application – control logic Where used Centralized, distributed, man-machine interface
Medium
CLU redundancy configuration
Specify if there are redundant CLUs installed
Yes/No Low
Self-test feature Degree of self-testing No self-test, automatic-loop test, built-in test, combined
High
Fault tolerance Response at failure Yes/No High

N.I.G.C April 2016 IGS-O-MN-001(0)
90
A.2.5.4 Valves
NOTE: The valves described in the taxonomy classification given in Table A.68 do not apply for valves used for specific upstream purposes like subsea valves and valves used in Downhole completion. These valves are covered in the specific chapters in Annex A on this type of equipment (see A.2.6 and A.2.7). Dry Xmas trees and wellheads are, however, considered as topside valves.
Table A.78 — Type classification — Valves
Equipment class — Level 6 Type
Description Code Description Code
Valves VA Ball BA
Gate GA
Globe GL
Butterfly BP
Plug PG
Needle NE
Check CH
Diaphragm DI
Flapper FL
Multiple orifice MO
Three-way WA
PSV-conventional SC
PSV-conventional with bellow SB
PSV-pilot operated SP
PSV-vacuum relief SV
Plug and cage PC
External sleeve ES
Disc DI
Axial flow AF
Pinch PI
Others OH NOTE 1 Pilot valves are normally non-tagged components used for self-regulation. PSV solenoid valves are normally a sub-tag of a valve tag used for all ESD/PSD. Quick-exhaust dump valves are specific valves used if quick response is required (e.g. HIPPS function). Relief valves are normally PSV valves. NOTE 2 Valves of a specific type not defined in Table A.68 should be coded as “Others” with a comment specifying type description. Example: Clack- or Elastomer-type Deluge valves).

N.I.G.C April 2016 IGS-O-MN-001(0)
91
Figure A.25 — Boundary definition — Valves

N.I.G.C April 2016 IGS-O-MN-001(0)
92
Table A.79 — Equipment subdivision — Valves
Equipment unit Valves
Subunit Valves Actuator a Control and monitoring a
Miscellaneous
Maintainable items Valve body
Bonnet
Flange joints
Seat rings
Packing/stem seal
Seals
Closure member
Stem
Diaphragm
Spring
Case
Piston
Stem
Seals/gaskets
Electrical motor b
Gear
Travel stop
Wiring
Indicator
Instrument, general
Instrument, position
Monitoring
Solenoid valve
Pilot valve c
Quick exhaust dump valve
Internal power supply
Limit switch
Accumulator
Others
a Not applicable for all valve categories. b Electric-motor actuator only. c Applicable for hydraulic/pneumatically actuated valves.
Table A.80 — Equipment-specific data — Valves
Name Description Unit or code list Priority
Main function Main functional category Flow control, on/off, non-return, pressure safety valves, instrument or hydraulic control
High
Application Specify function in the process Annulus (Xmas tree), blowdown, bypass, injection, X-over, Deluge, ESD, ESD/PSD, PSD, HIPPS, swab, wing, relief, control, choke
High
Where mounted
Equipment on which the valve is installed
Wellhead, Xmas tree, wellhead flow line, wellhead injection line, pump, turbine, generator, separator, heat exchanger, vessel, header, electric motor, diesel motor, turboexpander, drilling, pipeline, mud process, utility, living quarter, air inlet, riser
High
Size Internal diameter Millimeters (inches) Medium
Fluid handled Main fluid only Oil, gas, condensate, freshwater, steam, sea water, crude oil, oily water, flare gas, fuel gas, water/glycol, methanol, nitrogen, chemicals, hydrocarbon combined, gas/oil, gas/condensate, oil/water, gas/oil/water, NGL, LPG, LNG, slurry, etc.
High
Fluid temperature
Operating temperature main fluid Degrees Celsius Medium
Fluid corrosiveness/ erosiveness
Classify as shown in the footnote a Benign, moderate, severe Medium
Flowing pressure
Normal operating pressure (inlet) Pascal (bar) Medium
Shut-off pressure
Maximum differential pressure when valve closed (design) For PSVs: set-point opening pressure
Pascal (bar) Low

N.I.G.C April 2016 IGS-O-MN-001(0)
93
Table A.80 (continued)
Name Description Unit or code list Priority
Valve material Type Carbon steel (CS), stainless steel (SST), duplex, alloy type, composite, titanium
High
Stem sealing Type Stuffing box, duplex, lip seal, O-ring High
Seat design Type of seat design Soft seated, metal-to-metal seated Medium
Actuation principle b
Actuator operating principle Single-acting, double-acting, actuation by line/process pressure, actuation by gravity
Medium
Actuation – opening
Type of actuation force Electrical, hydraulic, pneumatic, mechanical (spring), manual, combinations, none
High
Actuation – closing
Type of actuation force Electrical, hydraulic, pneumatic, mechanical (spring), manual, combinations, none
Medium
Manufacturer – actuator
Name of actuator manufacturer Specify Low
Manufacturer – pilot valve
Name of pilot-valve manufacturer Specify Low
Manufacturer – solenoid valve
Name of solenoid-valve manufacturer Specify Low
Pilot-valve configuration
Number and configuration (applicable for pilot-operated valves only)
Specify, e.g. 1 × 3/2 (= single 3/2 pilot valve), 2 × 4/3 (= double 4/3 pilot valve)
Low
Fail-safe principle pilot valve
Fail-safe principle Energized, de-energized Low
Solenoid-valve configuration
Number and configuration (applicable for solenoid-operated valves only)
Specify, e.g. 1 × 3/2 (= single 3/2 pilot valve), 2 × 4/3 (= double 4/3 pilot valve)
Low
Fail-safe principle solenoid valve
Fail-safe principle Energized, de-energized Low
Trim type Type (applicable for control valves only)
Noise reduction, anti cavitation, multi-stage, single-stage
High
Valve leakage class
Specify according to applicable reference standard (e.g. for valves complying with API 6D, see ISO 5208)
ISO 5208:1993, Annexes A, B, C and D High
a Benign (clean fluids, e.g. air, water, nitrogen). Moderately corrosive/erosive (oil/gas not defined as severe, sea water, occasionally particles). Severe corrosive/erosive [sour gas/oil (high H2S), high CO2 content, high sand content].
b Primary actuation principle: a) single-acting = actuation force by gas (air) or hydraulic fluid for either opening or closing the valve; b) double-acting = actuation force by gas (air) or hydraulic fluid for both opening and closing the valve; c) Actuation by line/process pressure or actuation by gravity = no actuation apart from possible backup actuation.

N.I.G.C April 2016 IGS-O-MN-001(0)
94
A.2.5.5 Nozzles
Table A.81 — Type classification — Nozzles
Equipment class — Level 6 Equipment type Description Code Description Code
Nozzles NO Deluge DN
Sprinkler SR
Water mist WM
Gaseous GA
Figure A.26 — Boundary definition — Nozzles
Table A.82 — Equipment subdivision — Nozzles
Equipment unit Nozzles Subunit Nozzle Mounting assembly Miscellaneous
Maintainable items Fusible bulb
Nozzle body with internals
Nozzle head
Protective coating
Screen
Solder
Mounting connector
Seals
Others

N.I.G.C April 2016 IGS-O-MN-001(0)
95
Table A.83 — Equipment-specific data — Nozzles
Name Description Unit or code list Priority
Application Where in the process applied Deluge, sprinkler High
Hazards protection
Type of protection Electrical, Ex, fuel oil, glycol, HC gas, hydrogen gas, lubricants, methanol, combustibles, radioactivity, toxic gas, toxic liquid
High
Location on plant
Where located in the plant Air inlet, compressor, diesel engine, drilling, electric motor, FW inlet, gas-metering, generator, header, heat exchanger, living qt., mud-processing, pigging station, pipeline, pump, separator, turbine, utility, vessel, wellhead, wellhead flow line, wellhead injection line, Xmas tree
High
Nozzle material
Specify Brass, chrome-plated, electrode-less nickel-plated, lead-coated, stainless steel
High
Nozzle length Specify Millimeters High
Nozzle width Specify Millimeters High
Installation category
How installed Concealed, horizontal sidewall, pendent, recessed, upright, vertical sidewall
Low
Fluid handled – nozzles
Main fluid only Potable water, sea water, Inergen, CO2 Medium
Fluid corrosiveness/ erosiveness
Classify as shown in the footnote a Benign, moderate, severe Medium
Discharge temperature
At operating condition Degrees Celsius Low
Flowing pressure
Specify Pascal (bar) Medium
Flow rate Specify Liters per minute Medium
Shut-off pressure
Maximum differential pressure when valve closed (design) For safety pressure-relief valves: set-point opening pressure
Pascal ( barg ) Low
Fluid temperature
Specify Degrees Celsius Low
Connection size
Specify Millimeters (inches) High
Type of nozzle end
Specify Bolted flange, clamped flange, screwed, welded Medium
Spray angle Specify Degrees Medium
Spray type Specify Droplets, mist Medium
Actuation Specify Fusible bulb, solder, external Medium
Nozzle screen Whether or not installed Yes/No Low a Benign (clean fluids, e.g. air, water, nitrogen). Moderately corrosive/erosive (oil/gas not defined as severe, sea water, occasionally particles). Severe corrosive/erosive [sour gas/oil (high H2S), high CO2 content, high sand content].

N.I.G.C April 2016 IGS-O-MN-001(0)
96
A.2.5.6 Firefighting equipment
Table A.84 — Type classification- Firefighting equipment Equipment class - level 6 Equipment type Description Code Description Code
Fire-fighting equipment FE Fire-fighting equipment FE
A.2.5.7 Paging
Table A.85 — Type classification- Paging Equipment class - level 6 Equipment type Description Code Description Code
Paging PA Paging PA
A.2.5.8 Emergency call
Table A.86 — Type classification- Emergency call Equipment class - level 6 Equipment type
Description Code Description Code
Emergency call EC Emergency call EC

N.I.G.C April 2016 IGS-O-MN-001(0)
97
A.2.6 Utilities
Table A.87 — Type classification- HVAC
Equipment class - level 6 Equipment type
Description Code Description Code
HVAC HC HVAC HC
Table A.88 — Type classification-Wastewater treatment package
Equipment class - level 6 Equipment type
Description Code Description Code
Wastewater treatment package
WP Wastewater treatment package
WP
NOTE Utilities can include anything from single equipment units (e.g. pumps) to more complex assemblies (packages).
EXAMPLES Fire water system, HVAC, hydraulic power supply, etc.
Depending on the application, data can be collected on single-unit level and the reliability estimated by calculating the total reliability for the utility assembly. Alternatively, data can be collected for the complete utility system as a whole. It is necessary to establish the taxonomic definition defined or adapted to the selected alternative.

N.I.G.C April 2016 IGS-O-MN-001(0)
98
A.2.7 MISCELLANEOUS
Table A.89 — Type classification- Building
Equipment class - level 6 Equipment type
Description Code Description Code
Building BD Unindustrial Building UL
Industrial Building IL
Table A.90 — Type classification- Land
Equipment class - level 6 Equipment type
Description Code Description Code
Land LN Land LN
Table A.91 — Type classification-Fence
Equipment class - level 6 Equipment type
Description Code Description Code
Fence FN Fence FN

N.I.G.C April 2016 IGS-O-MN-001(0)
99
ANNEX B
(NORMATIVE)
INTERPRETATION AND NOTATION OF FAILURE AND MAINTENANCE PARAMETERS
B.1 FAILURE INTERPRETATION
When planning to collect data (see 7.1.2 and B.2.6), be aware that a failure can occur in one of a number of failure modes, e.g. complete loss of function, function degradation below an acceptable limit or an imperfection in the state or condition of an item (incipient failure) that is likely to result in a functional failure if not corrected.
Also be aware that it can be useful to make a distinction between the collection of data for reliability purposes and for availability purposes as follows.
a) For reliability purposes, it is mainly the intrinsic failures of the equipment unit that are of interest, i.e. physical failures that occur on the equipment being considered and that normally require some restoration (corrective maintenance) that it is necessary to record.
b) For the full lifetime story of equipment, it is necessary to record all actual preventive maintenance actions in a way similar to that for the corrective maintenance.
c) For availability purposes, all failures that have caused some equipment outage should be recorded. This can include stoppages due to operational limits being exceeded (e.g. trips) where no physical failure of the equipment occurred.
d) Even if no failures are experienced within the surveillance time, it is possible to estimate the failure rate by properly censored data (see C.3.3). Hence, recording the reliability history may also be useful for equipment in periods with no failures.
Table B.1 gives some guidance on this issue by distinguishing between data collected as reliability data and additional data collected as availability data.
Annex F and IEC 61508 also give guidance on what to consider as a failure for safety equipment. Such definition can be related to functional loss, reduced capacity or operation outside prescribed limits.
The full description of a failure might not be possible before a corrective action is carried out. In some cases (incipient failures), the corrective action may deliberately be deferred (e.g. opportunity maintenance). In this case, it can be necessary to record both the date of failure detection and the date of the corrective action. For analysis purposes, the latter date should normally be used.

N.I.G.C April 2016 IGS-O-MN-001(0)
100
Table B.1 — Failure in relation to reliability and availability
Type of failure/maintenance to record Reliability Availability
Failures that require some corrective maintenance action to be carried out (repair, replacement) Yes Yes
Failure discovered during inspection, testing and/or preventive maintenance that requires repair or replacement of typically non-wear items (seals, bearings, impellers, etc.)
Yes Yes
Failure of safety devices or control/monitoring devices that necessitates shutdown (trip) or reduction of the items capability below specified limits
Yes Yes
Shutdown (trip) of the item (whether automatically or manually controlled) due to external conditions or operating errors, where no physical failure condition of the item is revealed
No Yes
Failure of the equipment caused by external impact (e.g. lack of power supply, structural impact, etc.)
No Yes
Periodic replacement of consumables and normal wear parts No No
Minor planned maintenance services, such as adjustments, lubrication, cleaning, oil replacement, filter replacement or cleaning, painting, etc.
No Yes
Testing and inspections No Yes
“On-demand” activations Yes Yes
Preventive or planned maintenance a Yes (No) Yes
Modifications, new work, upgrades b No Yes/No
a To get the full lifetime history of the equipment, the actual preventive maintenance should be recorded. For recording failures only, this can be skipped. b Modifications are normally not a part of maintenance but are frequently done by maintenance personnel.
B.2 FAILURE AND MAINTENANCE DATA NOTATIONS
B.2.1 General
In order to limit database size and make it easier to analyse the data, it is recommended that coded information be used wherever applicable. A drawback with codes is that potentially useful information can be lost and that selecting inappropriate codes can lead to non-informative information. The availability of too many codes can be confusing and the codes can overlap, while too few codes might not sufficiently describe the area one is aiming to cover. A unified definition and interpretation of codes is necessary for obtaining highly reliable information.
In all cases, it is recommended to supplement the coding with some additional free-text capability in order to improve interpretation of single events, both for quality purposes before the data are entered into the database and for subsequent detailed analysis of single records (e.g. failure events).
Annex B.2 presents a method of coding that has been found to be useful when collecting RM data within the petroleum and natural gas industry, and should be equally applicable for similar equipment classes in the petrochemical industry. For some specific equipment and/or specific uses, supplementary codes may be used.
Design a method of reporting failure (see 7.1.2) that records the time and date of failure together with details of the failure mode (see B.2.6), the failure mechanism (see B.2.2) and the failure cause (root cause) (see B.2.3). Also, record the detection method (see B.2.4) and the maintenance activity (see B.2.5). Use the codes given in the tables wherever practicable and additional free text where necessary.

N.I.G.C April 2016 IGS-O-MN-001(0)
101
Take care to distinguish between failure mechanism and failure mode.
Failure modes are presented in this Annex B in Tables B.6 to B.12 for those equipment examples included in Annex A as shown in Table A.4.
Subdivision codes for failure mechanisms and failure causes, e.g. numbers 1.1, 1.2, etc., should be preferred before the general category failure code, e.g. 1, and so on (see Tables B.2. and B.3).
How failure mode, failure mechanism and failure cause are related to different taxonomy levels is shown in Table 3.
B.2.2 Failure mechanism
The failure mechanism is the physical, chemical or other process or combination of processes that leads to the failure. It is an attribute of the failure event that can be deduced technically, e.g. the apparent, observed cause of the failure. The failure mechanism's root cause(s) is/are coded whenever this information is available. (A separate field for this is recommended in this Standard.)
The codes on failure mechanism are basically related to one of the following major categories of failure types:
a) mechanical failures;
b) material failures;
c) instrumentation failures;
d) electrical failures;
e) external influence;
f) Miscellaneous.
This categorization is rather coarse and within each category a more detailed categorization is recommended as shown in Table B.2. If there is not sufficient information to apply codes at this sublevel, then codes on the main level as listed above may be used. This implies that descriptive codes for mechanical failures, numbered 1.1, 1.2, etc., should be preferred to the general category failure code, 1.0, and so on (see Table B.2).
The failure mechanism should normally be related to a lower indenture level (subunit or maintainable-item level). In practical terms, the failure mechanism represents a failure mode at maintainable item level.
Care should be taken to distinguish between failure mechanism and failure mode.
EXAMPLE It is recorded that a valve started leaking hydrocarbons to the environment but no further causes are recorded. Here, the failure mode should be coded ELP (external leak of process medium) and the failure mechanism coded unknown (6.4), not leakage (1.1).
Failure mechanism is also related to the failure cause (see B.2.3); the latter aimed at revealing the underlying root cause of the failure.
Six categories of failure mechanism are identified in Table B.2, together with subdivisions and related codes to be used in data bases.

N.I.G.C April 2016 IGS-O-MN-001(0)
102
Table B.2 — Failure mechanism
Failure mechanism Subdivision of the failure mechanism
Description of the failure mechanism
Code number
Notation Code number
Notation
1 Mechanical failure
1.0 General A failure related to some mechanical defect but where no further details are known
1.1 Leakage External and internal leakage, either liquids or gases: If the failure mode at equipment unit level is coded as “leakage”, a more causally oriented failure mechanism should be used wherever possible.
1.2 Vibration Abnormal vibration: If the failure mode at equipment level is vibration, which is a more causally oriented failure mechanism, the failure cause (root cause) should be recorded wherever possible.
1.3 Clearance/ alignment failure
Failure caused by faulty clearance or alignment
1.4 Deformation Distortion, bending, buckling, denting, yielding, shrinking, blistering, creeping, etc.
1.5 Looseness Disconnection, loose items
1.6 Sticking Sticking, seizure, jamming due to reasons other than deformation or clearance/alignment failures
2 Material failure
2.0 General A failure related to a material defect but no further details known
2.1 Cavitation Relevant for equipment such as pumps and valves
2.2 Corrosion All types of corrosion, both wet (electrochemical) and dry (chemical)
2.3 Erosion Erosive wear
2.4 Wear Abrasive and adhesive wear, e.g. scoring, galling, scuffing, fretting
2.5 Breakage Fracture, breach, crack
2.6 Fatigue If the cause of breakage can be traced to fatigue, this code should be used.
2.7 Overheating Material damage due to overheating/burning
2.8 Burst Item burst, blown, exploded, imploded, etc.
3 Instrument failure
3.0 General Failure related to instrumentation but no details known
3.1 Control failure No, or faulty, regulation
3.2 No signal/ indication/alarm
No signal/indication/alarm when expected
3.3 Faulty signal/ indication/alarm
Signal/indication/alarm is wrong in relation to actual process. Can be spurious, intermittent, oscillating, arbitrary
3.4 Out of adjustment
Calibration error, parameter drift
3.5 Software failure Faulty, or no, control/monitoring/operation due to software failure
3.6 Common cause/ mode failure
Several instrument items failed simultaneously, e.g. redundant fire and gas detectors; also failures related to a common cause.

N.I.G.C April 2016 IGS-O-MN-001(0)
103
Table B.2 (continued)
Failure mechanism Subdivision of the failure mechanism
Description of the failure mechanism
Code number
Notation Code number
Notation
4 Electrical failure
4.0 General Failures related to the supply and transmission of electrical power, but where no further details are known
4.1 Short circuiting Short circuit
4.2 Open circuit Disconnection, interruption, broken wire/cable
4.3 No power/voltage Missing or insufficient electrical power supply
4.4 Faulty power/voltage
Faulty electrical power supply, e.g. overvoltage
4.5 Earth/isolation fault Earth fault, low electrical resistance
5 External influence
5.0 General Failure caused by some external events or substances outside the boundary but no further details are known
5.1 Blockage/plugged Flow restricted/blocked due to fouling, contamination, icing, flow assurance (hydrates), etc.
5.2 Contamination Contaminated fluid/gas/surface, e.g. lubrication oil contaminated, gas-detector head contaminated
5.3 Miscellaneous external influences
Foreign objects, impacts, environmental influence from neighbouring systems
6 Miscellaneous a
6.0 General Failure mechanism that does not fall into one of the categories listed above
6.1 No cause found Failure investigated but cause not revealed or too uncertain
6.2 Combined causes Several causes: If there is one predominant cause this should be coded.
6.3 Other No code applicable: Use free text.
6.4 Unknown No information available
a The data acquirer should judge which is the most important failure mechanism descriptor if more than one exist, and try to avoid the 6.3 and 6.4 codes.
B.2.3 Failure cause
The objective of these data is to identify the initiating event (“root causes”) in the sequence leading up to a failure of an equipment item. Five categories of failure cause are identified in Table B.3 together with sub divisions and related codes to be used in data bases.
The failure causes are classified in the following categories:
1) design-related causes;
2) fabrication/installation-related causes;
3) failures related to operation/maintenance;
4) failures related to management;
5) miscellaneous.

N.I.G.C April 2016 IGS-O-MN-001(0)
104
As for failure mechanism, the failure cause can be recorded at two levels depending on how much information is available. If the information is scarce, only a coarse classification, i.e. codes 1, 2, 3, 4 and 5, can be possible, while a more detailed subdivision code number can be recorded if more information is available.
Failure causes are commonly not known in depth when the failure is observed and, in order to reveal the root cause of a failure, a specific root cause analysis can be useful. This is in particular relevant for failures of a more complex nature and where the failure is important to avoid due to its consequences. Examples are failures with serious safety and/or environmental consequences, abnormally high failure rates compared to the average and failures with a high repair cost.
Due care is required so as not to confuse failure mechanism (describing the apparent, observed cause of failure) with failure cause (describing the underlying or “root” cause of a failure).

N.I.G.C April 2016 IGS-O-MN-001(0)
105
B.2.4 Detection method
This is the method or activity by which a failure is discovered. This information is vitally important when evaluating the effect of maintenance, e.g. to distinguish between failures discovered by a planned action (inspection, PM maintenance) or by chance (casual observation). Nine categories of detection methods are identified in Table B.4, together with related codes to be used in the databases.
Table B.4 — Detection method
Number Notation a Description Activity 1 Periodic maintenance Failure discovered during preventive service,
replacement or overhaul of an item when executing the preventive maintenance program
Scheduled activities
2 Functional testing Failure discovered by activating an intended function and comparing the response against a predefined standard. This is one typical method for detecting hidden failures
3 Inspection Failure discovered during planned inspection, e.g. visual inspection, non-destructive testing
4 Periodic condition monitoring b
Failures revealed during a planned, scheduled condition monitoring of a predefined failure mode, either manually or automatically, e.g. thermography, vibration measuring, oil analysis, sampling
5 Continuous condition monitoring b
Failures revealed during a continuous condition monitoring of a predefined failure mode Continuous
monitoring 6 Production interference
Failure discovered by production upset, reduction, etc.
7 Casual observation Casual observation during routine or casual operator checks, mainly by senses (noise, smell, smoke, leakage, appearance etc.)
Casual occurrences 8 Corrective
maintenance Failure observed during corrective maintenance
9 On demand Failure discovered during an on-demand attempt to activate an equipment unit (e.g. safety valve fails to close on ESD-signal, fail to start a gas turbine on demand, etc.)
10 Other Other observation method and/or combination of several methods Other
B.2.5 Maintenance activity
Twelve categories of maintenance activity are identified in Table B.5 together with related codes to be used in databases for both corrective maintenance and preventive maintenance.

N.I.G.C April 2016 IGS-O-MN-001(0)
106
Table B.5 — Maintenance activity
Code Number
Activity Description Examples Use a
1 Replace Replacement of the item by a new or refurbished item of the same type and make
Replacement of a worn-out bearing C, P
2 Repair Manual maintenance action performed to restore an item to its original appearance or state
Repack, weld, plug, reconnect, remake, etc.
C
3 Modify b Replace, renew or change the item, or a part of it, with an item/part of a different type, make, material or design
Install a filter with smaller mesh diameter, replace a lubrication oil pump with another type, reconfiguration etc.
C, P
4 Adjust Bringing any out-of-tolerance condition into tolerance
Align, set and reset, calibrate, balance
C, P
5 Refit Minor repair/servicing activity to bring back an item to an acceptable appearance, internal and external
Polish, clean, grind, paint, coat, lube, oil change, etc.
C, P
6 Check c The cause of the failure is investigated, but no maintenance action performed, or action is deferred. Able to regain function by simple actions, e.g. restart or resetting.
Restart, resetting, no maintenance action, etc. Particularly relevant for functional failures, e.g. fire and gas detectors, subsea equipment
C
7 Service Periodic service tasks: Normally no dismantling of the item
e.g. cleaning, replenishment of consumables, adjustments and calibrations
P
8 Test Periodic test of function or performance Function test of gas detector, accuracy test of flow meter
P
9 Inspection Periodic inspection/check: a careful scrutiny of an item carried out with or without dismantling, normally by use of senses
All types of general check. Includes minor servicing as part of the inspection task
P
10 Overhaul Major overhaul Comprehensive inspection/overhaul with extensive disassembly and replacement of items as specified or required
C, P
11 Combination Several of the above activities are included
If one activity dominates, this may alternatively be recorded
C, P
12 Other Maintenance activity other than specified above
may dominates C, P
For corrective maintenance, this information describes the type of restoration action that was performed. In general, the predominant restoration activity should be coded when several activities are involved. The code categories “repair”, “replace”, “overhaul” and “modify” should have a priority relative to the code categories “refit” and “adjust” when a combination of the two categories are involved (e.g. repair consisting of “repair” and “refit”

N.I.G.C April 2016 IGS-O-MN-001(0)
107
should be coded as “repair”). If there are several repair activities involved, none of which is predominant, the code “combined” may be used.
“Modify” means a modification of the original equipment unit where the original design has been altered or the item in question replaced with one of a different type/make. If the modification is of significant character, it is not considered as a maintenance action, but may be carried out by, or in co-operation with, the maintenance staff. A “repair” is meant to be an action to correct a single failure or a few failures, normally on-site. “Overhaul” means a comprehensive repair of several failures, or one major failure requiring extensive work, or complete refurbishment of an equipment subunit. Typically, such maintenance is undertaken in a workshop.
If the complete equipment unit has been replaced with a new and/or modified one, it is recommended to rewind the time parameters (e.g. operating time) for this unit. This does not apply if the equipment unit is of low complexity and a complete replacement is considered as a normal part of the maintenance.
For preventive maintenance, this information describes the type of preventive action being performed. In general, the most predominant maintenance activity should be coded when several activities are involved. If there is no predominant task, again this should be coded as “combined” and additional information on the various activities listed in a free-text field if provided.
NOTE These maintenance codes do not, as such, reflect the effectiveness of the maintenance action as to restoring the condition of the item (e.g. “good-as-new” or “bad-as-old” condition).
B.2.6 Failure modes
Failure modes should normally relate to the equipment-class level in the hierarchy. For subsea equipment, however, it is recommended to also record failure modes on lower levels in the equipment hierarchy (e.g. “maintainable-item” level). The failure modes can be categorized into three types:
a) Desired function is not obtained (e.g. failure to start);
b) Specified function lost or outside accepted operational limits (e.g. spurious stop, high output);
c) Failure indication is observed but there is no immediate and critical impact on the equipment-unit function [these are typically non-critical failures related to some degradation or incipient fault condition (e.g. initial wear)].
Failure modes are presented in Tables B.6 to B.12 for each main equipment category shown in Table A.4. Recommended failure modes are presented for each main equipment category (see also list of equipment presented in Table A.4): ⎯rotating (compressors, combustion engines, electric generators, gas turbines, etc.); ⎯mechanical (cranes, heat exchangers, heaters and boilers, vessels, storage tanks, piping, etc.); ⎯electrical (UPS, power transformers, frequency converters, etc.); ⎯safety and control (fire and gas detectors, sensors, valves, nozzles, firefighting equipment, etc.);

N.I.G.C April 2016 IGS-O-MN-001(0)
108

N.I.G.C April 2016 IGS-O-MN-001(0)
109

N.I.G.C April 2016 IGS-O-MN-001(0)
110

N.I.G.C April 2016 IGS-O-MN-001(0)
111

N.I.G.C April 2016 IGS-O-MN-001(0)
112

N.I.G.C April 2016 IGS-O-MN-001(0)
113

N.I.G.C April 2016 IGS-O-MN-001(0)
114

N.I.G.C April 2016 IGS-O-MN-001(0)
115
ANNEX C
(INFORMATIVE)
GUIDE TO INTERPRETATION AND CALCULATION OF DERIVED RELIABILITY AND MAINTENANCE PARAMETERS
C.1 INTERPRETATION RULES FOR COMMONLY USED FAILURE AND MAINTENANCE PARAMETERS
C.1.1 Introduction
Though this Standard does not cover data analysis in the broad sense, this annex includes some recommended interpretation rules and basic calculation equations commonly used when analyzing reliability and maintenance data. For a more in-depth assessment of this subject, we recommend textbooks on the subject and some of the standards listed in the Bibliography at the end of this Standard.
In addition to the definitions given in Clause 3, Annex C gives some interpretation rules for commonly used terms encountered in data collection and projects.
C.1.2 Redundancy definitions
Redundancy may be applied as follows:
a) passive (cold) standby:
redundancy wherein part of the means for performing a required function is needed to operate, while the remaining part(s) of the means are inoperative until needed;
b) active (hot) standby:
redundancy wherein all means for performing a required function are intended to operate simultaneously;
c) mixed:
redundancy where a part of the redundant means “is on standby” and another part is “active” (example: three means, one active, one in hot standby, one in
Cold standby ) . EXAMPLE 1 Redundancy can be expressed as a quantitative measure, viz. equipment redundancy factor (ERF). EXAMPLE 2 3 units times 50 % gives an ERF of 1,5. (See also definition of redundancy in Clause 3 and definitions of “hot” and “cold” standby versus “up time/down time” in 8.3.1). For redundant systems, parts can fail without a failure of the system. This should be taken into account when estimating required spare parts and repair capacity (where these failures are counted) and estimates of availability (where these failures are not counted).
C.1.3 On-demand data
For some equipment, collected reliability data are used to estimate the on-demand failure probability (e.g. start probability of an emergency generator). In this case, the total number of demands should be recorded including those where failures are experienced. Two types of demands should be included:
a) test activation of the item normally done as part of preventive maintenance (e.g. function test of a fire and gas detector);

N.I.G.C April 2016 IGS-O-MN-001(0)
116
b) automatic , or manual, activation of an on-demand function during operation (e.g. closure of an ESD valve).
The probability of failure on demand is calculated as the average fraction of time spent in the failed state, as shown in C.6.2.
C.1.4 Independent failures
Most of the basic probabilistic calculations and most of the models used in the reliability field are relevant only for independent events.
Two events, A and B, are independent if the occurrence of A is independent of that of B. Mathematically speaking, that means that the conditional probability of occurrence of B given the occurrence of A, P(B/A), is
simply equal to P(B).
Therefore, by using the definition of conditional probability:
P(B/A) = P(A ∩ B)/P(A) = P(B) (C.1)
This implies that
P(A ∩ B) = P(A) ⋅ P(B) (C.2)
When two events have the above property, that means that they behave independently from each other and they are said to be stochastically independent.
Independent failures are, of course, a particular case of independent events.
C.1.5 Dependent failures
When the occurrence of one event depends of the occurrence of one or several other events, these events are said to be dependent.
In this case, the above Equation (C.2) is no longer valid and it is necessary to replace it by Equation (C.3):
P(A ∩ B) > P(A) ⋅ P(B) (C.3)
Therefore, when the dependencies are not taken under consideration, the results are underestimated. As they are no longer conservative, this cannot be acceptable, especially for safety studies. This is why the concepts of common-cause failure and common-mode failure have been introduced.
Components that fail due to a shared cause normally fail in the same functional mode. The term common mode is, therefore, sometimes used. It is, however, not considered to be a precise term for communicating the characteristics that describe a common-cause failure.
C.1.6 Common-cause failure (CCF)
A common-cause failure is the simultaneous or concomitant failure of several components due to the same cause. Therefore, each time the failures are not completely independent there is a possibility of CCF. The CCF can be split into several categories:
a) Failure of utilities (electricity, compressed air, etc.) or external aggressions (environment, fire, etc.);
b) Internal failures (design error, installation error, bad set of components, etc.);
c) Cascade failures (the failure of A leads to the failure of B, which leads to the failure of C, etc.).

N.I.G.C April 2016 IGS-O-MN-001(0)
117
Items listed in a) are considered as CCF only if the level of analysis is not sufficient in order to identify them explicitly.
Items listed in b) are more difficult to analyse: experience proves their existence but their causes are generally not identified very easily.
Items listed in c) are generally related to the process itself and can be difficult for the reliability analyst to identify.
When the analysis is too difficult or not possible, a β-factor is generally introduced to split the basic failure rate, λ, of a component into an independent part, (1 −β) ×λ, and a CCF part, β×λ. This avoids an unrealistic result, but is only an estimate in order to take into account the existence of a potential CCF.
It should be noted that the individual failures due to a CCF arise not necessarily exactly at the same time but within a certain period of time.
C.1.7 Common-mode failure
The notion of common-mode failure, CMF, is often confused with the notion of CCF, although it is a little bit different: a CMF occurs when several components fail in the same way (same mode). Of course, this can be due, in turn, to a CCF.
C.1.8 Trip definitions
Shutdown of machinery refers to the situation when the machinery is shut down from normal operating condition to full stop. Two types of shutdown exist.
a) Trip The shutdown is activated automatically by the control/monitoring system: ⎯ real trip The shutdown is effectuated as a result of a monitored (or calculated) value in the control system exceeding a pre-set limit; ⎯ spurious trip Unexpected shutdown results from error(s) in the control/monitoring system or error(s) imposed on the control/monitoring system originating from the environment or people.
b) Manual shutdown The machinery is stopped by an intended action of the operator (locally or from the control room).
For some equipment, “spurious stop” is defined as a failure mode that can be either a real trip or a spurious trip as defined above depending on cause.
C.1.9 Failure consequence classification
Risk is a term in general usage to express the combination of the likelihood that a specific hazardous event will occur and the consequences of that event. Using this definition, the level of risk may be judged by estimating the likelihood of the hazardous event that can occur and the consequence that may be expected to follow from it.
Failure consequence ranking is an essential part of data applications used to assess the risk level (see Annex D). It is, therefore, useful to classify the consequence of failures as to overall impact. A classification of failure consequences, with classes represented by numbers I to XVI, is illustrated in Table C.1. Note that this classification is primarily intended for assessing the consequences of failures that have occurred. For more detailed recommendations on risk classification, see relevant standards, e.g. ISO 17776 and IEC 60300-3-9.

N.I.G.C April 2016 IGS-O-MN-001(0)
118
The recording of failure and maintenance impact data for failure events is addressed in Tables 6 and 8.
Table C.1 — Failure-consequence classification
Consequences Category
Catastrophic Failure that results in death or system loss
Severe Severe injury, illness or major system damage (e.g. < USD 1 000 000)
Moderate Minor injury, illness or
system damage (e.g. < USD 250 000)
Minor Less than minor injury, illness or system damage (e.g. < USD 50
000)
Safety I ⎯ Loss of lives ⎯ Vital safety-critical systems inoperable
V ⎯ Serious personnel injury ⎯ Potential for
loss of safety functions
IX ⎯ Injuries requiring medical treatment ⎯
Limited effect on safety functions
XIII ⎯ Injuries not requiring medical treatment ⎯ Minor effect on safety function
Environmental II Major pollution VI Significant pollution X Some pollution XIV No, or negligible, pollution
Production III Extensive stop in production/operation
VII Production stop above acceptable limit
a
XI Production stop below acceptable limit
a
XV Production stop minor
Operational IV Very high maintenance cost
VIII Maintenance cost above normal acceptable a
XII Maintenance cost at or below normal
acceptable a
XVI Low maintenance cost
a It is necessary to define acceptable limits for each application.
C.1.10 Analysis of failures
Failures that occur and that are judged to be in the unacceptable category in Table C.1 require that specific reporting and analyses be done in order to find measures to prevent such failure from re-occurring (e.g. improved maintenance, inspections, modifications, replacements etc.). Some useful analytical methods are summarized below.
a) Reliability system modeling (e.g. Monte Carlo simulation, Markov analysis, reliability growth modeling etc.) is recommended for all critical-service equipment for the comparison of reliability for various proposed system configurations to provide input to concept selection in the development of the design basis. Specifically, ⎯ Sensitivity studies to identify the component failures or human errors, or both, having the greatest
impact on system reliability (this information can be used to improve the reliability of individual components or to provide a basis for modifying the system configuration during the project proposal), ⎯ Evaluation of operational inspection intervals that have direct impact on predicted system reliability, ⎯ Establishment of the amount of inspection and testing required for certain system elements.
b) Pareto analysis can be utilized to establish the plant’s list of “bad actors” based on the highest failure rates or total maintenance cost.

N.I.G.C April 2016 IGS-O-MN-001(0)
119
c) Root-cause analysis is recommended in the following cases: ⎯ Failures of severity types I to VIII; ⎯ Systems defined as “bad actors” by the operating facility.
d) Equipment lifetime analysis, such as Weibull analysis, is recommended on equipment types having five or more common-mode failures with severity levels I to XII.
NOTE Common causes of failures can be classified as follows.
1) Infant-mortality failures (Weibull-shape parameter β< 1) are usually induced by external circumstances and are typically due to poor installation, solid-state electronic failures, manufacturing defects, misassembly, or incorrect start-up procedures.
2) Random failures (β= 1) most often result from maintenance errors, human errors, foreign-object failures or computational errors in the Weibull analysis (e.g. combining data from different failure modes, combining common failure modes from differing equipment types, etc.). Random failures are best addressed by improved predictive-maintenance programs (more rigorous condition monitoring).
3) Early wear-out failures (1,0 <β< 4,0) can occur in the normal design life of the equipment and most often include low cycle fatigue, most bearing failures, corrosion and erosion. Preventive maintenance resulting in repair or replacement of critical components can be cost effective. The period for overhaul is read off the Weibull plot at the appropriate β life.
4) Old age wear-out failures (β W4,0) most often occur outside the normal design life. The steeper the slope, β, the smaller the variation in the times to failure and the more predictable the results. Typical failure modes with old age wear include stress corrosion, erosion, material property issues, etc. Preventive maintenance to replace parts that produce significant failures can be cost effective. The period for overhaul is read off the Weibull plot at the appropriate β life.
C.1.11 Safety critical equipment
For some equipment, like safety-critical equipment, more specific definitions for a failure and its consequences can be useful. Some recommendations on this are given in Annex F.
C.2 AVAILABILITY
C.2.1 Normalized definition
Note that the definition of availability given in IEC 60050-191:1990, 3.1.1, can be misleading because it can lead one to think that “availability” and “reliability” are the same concepts. This is not true because the meaning of “over a given time interval” is not at all the same for the concepts of “availability” and “reliability”. Even if the definitions of “availability” and “reliability” seem very close, these concepts are completely different, specifically: ⎯ Availability: item working at a given instant (no matter what has happened before); ⎯ Reliability: item working continuously over a whole period of time.
“Availability” characterizes a function that can be interrupted without any problem and “reliability,” a function that cannot be interrupted over a whole period of time.
C.2.2 Mathematics of availability
It is with the mathematical definitions that the situation is clarified. In fact, there are several mathematical expressions for "availability" concepts. ⎯Point wise or instantaneous availability, A(t), is the probability that an item is in a state to perform a required
function under given conditions at a given instant of time, assuming that the required external resources are provided. (This is the definition given in IEC 61508.)

N.I.G.C April 2016 IGS-O-MN-001(0)
120
The instantaneous availability, A(t), at time, t, is given by Equation (C.4):
A(t) = PS(t) (C.4)
where PS(t) is the probability that item S does not have a critical failure at time, t. ⎯Mean availability for a given mission (over a given period of time), A
m(t1,t2), is the average of the point wise
availabilities over the time period, t1 ≤ t ≤ t
2. This is given mathematically by Equation (C.5):
( 1, 2) = ∫ ( ) (C.5) ⎯Mean availability is the limit of the mean availability for a given mission when the time period goes to infinity, as given by Equation (C.5):
lim → 1 ( ) (C.6)
These definitions show clearly the difference between the various “availabilities,” specifically:
a) For the point wise availability, we are interested only in the fact that the item works well when it is required (No matter if it has failed at some previous moment, provided it has been repaired since and has not failed again);
b) For the mean availability, we are interested in the same, but averaged over a given period of time. This corresponds to the ratio of the effective working time over the whole duration under interest.
Note that in most, but not all, of the cases, after a certain time, the point wise availability reaches an asymptotic value called “steady state” availability, which is equal to the above “mean availability”.
Example For a simple repairable item with only two reliability parameters [failure rate (λ; see Clause C.3) and repair rate (µ)], the point wise availability is equal to Equation (C.7): ( ) = 1 − + {1 − [−( + ) ]}
(C.7)
When t goes to infinity, w
= + (C.8)
e obtain the asymptotic value, as given by Equation (C.8), which is also the mean availability:
This availability is the “technical” or “intrinsic” or “inherent” availability of the item (see also C.2.3.2).
C.2.3 Measures and estimates of mean availability data records
C.2.3.1 Mathematics of measures and estimates of mean availability data records
The interest of the availability concept within the ISO 14224 application areas is the relationship existing between data collected in the field and the mathematical meaning of the mean availability over a given period.
When planning to collect measures and estimates of mean availability (see 3.1 and 7.1.2), two types of mean

N.I.G.C April 2016 IGS-O-MN-001(0)
121
availability and the sum of the two should be considered.
a) Operational availability, Ao, is given by Equation (C.9):
= tMUtMU + tMD (C.9)
Where tMU is the mean time, estimated by using actual up-time observed in field; tMD is the mean time, estimated by using actual up-time and down-times observed in field.
b) Intrinsic availability, AI, is given by Equation (C.10):
AI = t t + t (C.10)
Where tMTR is the mean time to repair, estimated by using actual repair time observed in field; tMTF is the mean time to failure, estimated by using actual up-time observed in field.
d) Mean time between failures, tMBF
, is given by Equation (C.11):
e)
tMBF =tMTF +tMTR
( C.11)
where tMTF
and tMTR
are as defined above.
C.2.3.2 Uses of measures and estimates of mean availability data records
AI and A
o are not equivalent, except when t
MD is equal to t
MTR. Generally, A
I is of interest to reliability engineers,
while Ao is of interest to maintenance people.
These estimations explain why the unit of availability is expressed as the proportion of time(s) the item is in the up state.
Be aware that through tMD
, which is made of several delays (detection, isolation, spare parts, stand-by, repair duration, re-instatement, etc.), and t
MU, which is normally close to the t
MTF, the operational availability depends
on the combined aspects of the reliability performance, the maintenance performance, the maintainability performance and the maintenance support performance. Therefore, this is not an intrinsic property of the item itself but a property of that item within the context (the whole installation, procedures, maintenance policy, etc.) where it is used.
Depending on the interest of the user, only a part of the down time may be considered. Extra delays due to required external resources other than maintenance resources may be excluded from the estimation in order to perform a more intrinsic estimation, such as given in Equation (C.12):
AI = t t + t (C.12)

N.I.G.C April 2016 IGS-O-MN-001(0)
122
which is an estimate of the theoretical equation given in Equation (C.13):
= + (C.13)
In the same way, the time spent for preventive maintenance can be included or not in the evaluations.
The above single equation for evaluating the two reliability parameters, λ and µ, is not sufficient. It is necessary to evaluate λ and µ separately based on the observed t
MTF (or t
MU) for the failure rate, and the observed t
MTR (a
part of the tMD
) for the repair rate.
As the amount of data collected increases, the estimations become closer and closer to the true mathematical values. The uncertainties can be managed through classical statistical analyses.
It is quite common to define the operational availability based on the down time related to the sum of both corrective and preventive maintenance. The term “technical availability” is also sometimes used as an alternative to “intrinsic availability.” In the latter case, down time related to corrective maintenance only shall be included in the calculations. The operational availability per year, A
o,y, and the technical availability per year,
AT,y
, can then be calculated as given in Equations (C.14) and (C.15), respectively:
where
Ao, y = 8760 − ( + )8760 (C.14)
AT, y = 8760 − 8760 (C.15)
tCM
is the time for condition monitoring
tPM
is the time for preventive maintenance
C.3 FAILURE RATE ESTIMATION
C.3.1 General
C.3.1.1 Mathematics for failure rate and hazard rate estimation
The “failure rate” is a classical reliability parameter traditionally denoted by the Greek letter, λ (lambda).
The failure rate is an average frequency, λ, of failure (i.e. a number of failures per unit of time). It is easy to calculate an estimator, λ
ˆ , of this frequency from historical RM data by dividing the number of observed failures,
n, of the considered item by its cumulative working time (operational time) during the same period of time, as given by Equation (C.16): = / (C.16)
Where n is the number of observed failures; tTFi is the ith time to fail (i.e. ithe duration of functioning observed from the field).

N.I.G.C April 2016 IGS-O-MN-001(0)
123
NOTE1 λ is a function of time t and it asymptotically approached 1/tMTF
In Equation (C.16), tTFi
means the ith “time to fail” (i.e. the ith duration of functioning) observed from the field. So, this is actually the estimator of 1/MTTF for a repairable item (component/system). This λ is usually a function of time t, but asymptotically it approaches 1/t
TFi.
In practice, the term ∑tTFi
in Equation (C.16) is often replaced by the total operational time of the units investigated; see the example below.
NOTE 2 Equation (C.16) is true only if an exponential failure distribution (constant hazard rate for the system) is assumed. In case a component does not have constant hazard rate, the asymptotic rate for the system is not reached until after several changes of the component (renewal process). Such an interpretation means that the number of failures over a (long) time period (0, t) “on the average” is equal to λx t. Or, more generally: if a number of items with the same constant “failure rate,” λ, are observed over a total operational time, t, then the mean number of failures observed over this period asymptotically equals λx t.
EXAMPLE A failure rate of 3 × 10− 4
failures per hour means that on the average 30 failures will occur during an operational period of 100 000 h. It is emphasized that we are talking here about repairable units, i.e. units that are repaired immediately after failure.
In the above example, we state that in the long run the mean time between two failures of a unit equals 1/λ= 3 333 h. It is important not to confuse this tTFi of 3 333 h with expected time to failure. Since the failure rate is assumed constant, the probability of a failure is the same from 0 h to 100 h, from 3 300 h to 3 400 h and from 9 900 h to 10 000 h.
However, the term “failure rate” is usually defined (e.g. in text books) quite differently. It is used synonymously with the term “hazard rate.” Also, this rate is generally a function of time, t, (since the start of operation of the unit). Then, λ(t)dt is the probability that the item fails between t and t + dt, provided that it is working at t. This function, λ(t), then defines the lifetime distribution of the units (i.e. the statistical distribution of the time to first failure). This distribution can also be expressed in terms of the probability, F(t), that the item will fail before it has been operating a time, t, as given in Equation (C.17):
F(t) = 1 − R(t) (C.17)
where
R(t) is the probability that the item will survive a time period, t.
Nevertheless, it can be demonstrated mathematically that when the hazard rate, λ(t), is constant over time, t, then the “failure rates,” λ, in both interpretations have the same estimator as given in Equations (C.16) and (C.17). In that case, we can use the term “failure rate” without causing too much confusion (but we still have two different interpretations).
The assumption that the failure rate (hazard rate) is constant (=λ) over the whole life of the concerned item means that the probability of the item to survive a period, t, is given by Equations (C.18) and (C.19):
R(t) = exp(− λ × t) (C.18)
F(t) = 1 − exp(− λ × t) (C.19) In this case, λ= 1/tMTF
C.3.1.2 Uses of failure rate and hazard rate estimation
In the general situation, the hazard rate, λ(t), of the item’s lifetime is often assumed to reflect three periods: early
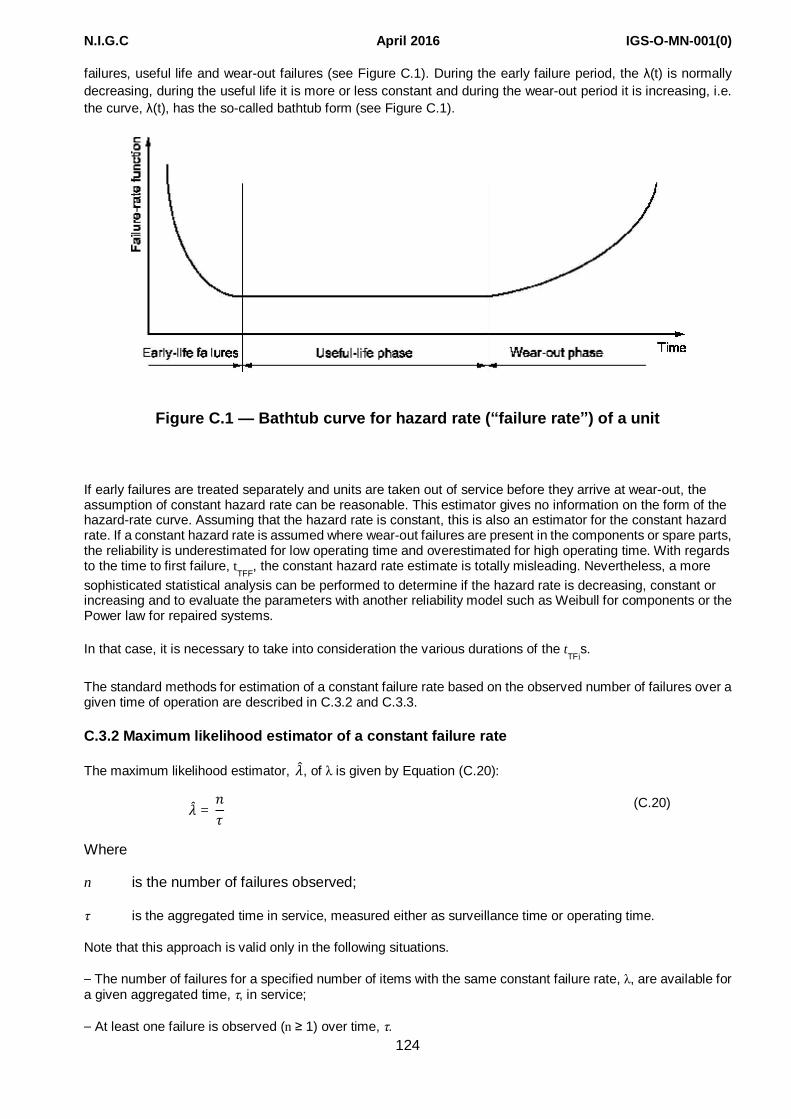
N.I.G.C April 2016 IGS-O-MN-001(0)
124
failures, useful life and wear-out failures (see Figure C.1). During the early failure period, the λ(t) is normally decreasing, during the useful life it is more or less constant and during the wear-out period it is increasing, i.e. the curve, λ(t), has the so-called bathtub form (see Figure C.1).
Figure C.1 — Bathtub curve for hazard rate (“failure rate”) of a unit
If early failures are treated separately and units are taken out of service before they arrive at wear-out, the assumption of constant hazard rate can be reasonable. This estimator gives no information on the form of the hazard-rate curve. Assuming that the hazard rate is constant, this is also an estimator for the constant hazard rate. If a constant hazard rate is assumed where wear-out failures are present in the components or spare parts, the reliability is underestimated for low operating time and overestimated for high operating time. With regards to the time to first failure, t
TFF, the constant hazard rate estimate is totally misleading. Nevertheless, a more
sophisticated statistical analysis can be performed to determine if the hazard rate is decreasing, constant or increasing and to evaluate the parameters with another reliability model such as Weibull for components or the Power law for repaired systems.
In that case, it is necessary to take into consideration the various durations of the tTFi
s.
The standard methods for estimation of a constant failure rate based on the observed number of failures over a given time of operation are described in C.3.2 and C.3.3.
C.3.2 Maximum likelihood estimator of a constant failure rate
The maximum likelihood estimator, , of λ is given by Equation (C.20): = (C.20)
Where
n is the number of failures observed;
τ is the aggregated time in service, measured either as surveillance time or operating time.
Note that this approach is valid only in the following situations. ⎯ The number of failures for a specified number of items with the same constant failure rate, λ, are available for a given aggregated time, τ, in service; ⎯ At least one failure is observed (n ≥ 1) over time, τ.

N.I.G.C April 2016 IGS-O-MN-001(0)
125
In “classical” statistical theory, the uncertainty of the estimate may be presented as a 95 % confidence
interval with a lower limit, LLower
, and an upper limit, LUpper
, as given by Equations (C.21) and C(22), respectively:
LLower=(1/2 τ)z0,95.v (C.21) LUpper=(1/2 τ)z0,05.v (C.22)
z0,95;ν is the upper 95th percentile of the χ
2-distribution (chi-square) with ν degrees of freedom;
z0,05;ν
is the lower 5th percentile of the χ2-distribution (chi-square) with ν degrees of freedom.
NOTE 1 The chi-square distribution can be found in most textbooks on statistics or in Reference [67].
NOTE 2 Other confidence limits can also be used depending on application.
EXAMPLE Assume that n = 6 failures have been observed during an aggregated time in service τ= 10 000 h. The failure rate estimate,
, expressed as failures per hour as given in Equation (C.20), is calculated as
= n /τ= 6 ×10
−4
The 95 % confidence interval, from Equations (C.21) and (C.22), is calculated as
12 0.95; 2 , 12 0.05; 2( + 1) = 120000 0.95; 12, 120000 0.05; 14 = (2.6 ∗ 10 − 4 , 11.8 ∗ 10 − 4 )
The estimated and confidence interval are illustrated in figure C.2.
Figure C.2 — Estimate and 95 % confidence interval for the example calculation of the failure rate
C.3.3 Estimation of failure rate with zero failures — Bayesian approach
C.3.3.1 General
NOTE The Bayesian approach is not always accepted by safety authorities (e.g. in the nuclear field).
The classical approach described above has difficulties when the observed number of failures is zero. An alternative approach which handles the situation with zero failures is to use a Bayesian approach with non-informative prior distribution. When n failures have been observed during time, t, the failure rate estimate, , in the posteriori distribution is given by Equation (C.23):
= 2n+12 (C.23)
which, in the case with zero failures, reduces to Equation (C.24):

N.I.G.C April 2016 IGS-O-MN-001(0)
126
= 12 (C.24)
C.3.3.2 Constant confidence-level estimator
The failure rate is estimated from Equation (C.25):
= n+0.7 (C.25)
C.3.3.3 Advantages
The advantages of this estimator are the following. ⎯ It works in the zero failure case. ⎯ It is homogeneous from a confidence level point of view. ⎯ It uses the median of the failure rate. ⎯ It is easy to use.
C.4 MAINTAINABILITY
C.4.1 Normalized definitions
Several normalized definitions of the concept of “maintainability” exist in normalization documents, specifically ⎯ Ability, under given conditions, of an item to be maintained in or restored to, over a given period of time, a state where it is able to perform its function when the maintenance is achieved under prescribed conditions, procedures and means; ⎯ Measure of the ability of an item to be maintained in or restored in specified conditions when the maintenance is achieved by personnel with a specified level of skill and using prescribed procedures and resources at all the prescribed levels of maintenance and repair.
C.4.2 Mathematical meaning
C.4.2.1 Maintainability concepts
There is a probabilistic version of “maintainability”, similar to that for the concepts of reliability and availability, as follows:
Probability that an item can be restored to a condition within a prescribed period of time when maintenance is performed by personnel having specific skill levels using prescribed procedures and resources.
C.4.2.2 Maintainability performance
This is a probability method to measure maintainability performance, in addition to a lot of other indicators. The maintainability, M(t), can be expressed by Equation (C.26):
M (t)=P(tTR≤t) (C.26)

N.I.G.C April 2016 IGS-O-MN-001(0)
127
where
tTR
is the time to repair item S;
P(tTR
≤t) is the probability that tTR
is less than time t.
Therefore, M(t) is the cumulative distribution function (CDF) of the tTR
s of item S. By definition of the CDFs, M(t) is a non-decreasing function varying from 0 to 1 as t varies from 0 to infinity. That means any repairable item is likely to be repaired (restored) if we wait long enough.
As a property of the CDF, it is possible to express M(t) by using the “hazard rate” of the distribution, which, in this case, is the so-called “repair rate” µ(t).
When this rate is constant, we obtain the classical equation for the maintainability, M(t), given in Equation (C.27):
M(t)= 1- exp (µxt ) (C.27)
where µ is the so-called repair rate, which is equivalent to the hazard rate and which is designated tMTR
.
Note that, depending on what we actually want to evaluate, the whole down time, a part of it or only the active maintenance time can be used as t
TR in Equation (C.26).
C.4.2.3 Repair rate
The repair rate, µ, is a reliability parameter that allows the evaluation of the probability that the item is repaired within a certain delay after having failed (this is the probabilistic version of the “maintainability” of the item).This parameter plays a role for the t
TR (time to repair) analogous to that of the failure rate for the t
TF (time to failure).
The estimate is given by Equation (C.28):
= ∑ TFi = 1 MTR
(C.28) Where n is the number of repairs; tTFi
is the length of the ith repairs tMTR
is the mean time to repair.
All data can be collected from the field. This parameter can be used to evaluate the maintainability of the item using an exponential law as given in Equation (C.29):
M(t)= 1- exp (µxt ) (C.29)
More sophisticated probabilistic laws are often used for modeling repairs. In these cases, the repair rate becomes a non-constant µ(t) and the simple estimate in Equation (C.29) no longer applies. For example, it is necessary to take into consideration the length of the various t
TRis in order to evaluate the parameter of a log-
normal law.
C.4.2.4 Measures and estimates
An indicator of the maintainability performance is the tMTR
(mean time to repair) of the concerned item. This tMTR
is the part of the t
MD (mean down time) due to the repair itself. It can be estimated from the sum of the observed

N.I.G.C April 2016 IGS-O-MN-001(0)
128
“times to repair” (from data feedback) divided by the number of repairs, as given in Equation (C.30):
MTR = TRi (C.30)
NOTE When the analytical form of M(t) is known or has been chosen, a link can be made between the parameters of the exponential law and the tMTRs estimated from the field.
The estimation in the classical case, when Equation (C.29) holds and when µ, the so-called “repair rate,” is constant, is easy. As the amount of data collected increases, the estimation becomes closer and closer to the true mathematical values. The uncertainties can be managed through classical statistical analyses.
For more complicated repair laws (e.g. log-normal), it is necessary to take into consideration the length of the various observed t
TFs and to do a statistical fitting.
When planning to collect data (see 7.1.2), it is necessary to consider the various methods of recording down times (see Table 4) and the appropriate parts of the down time to be included need to be chosen. Depending on what is done, several parts of the down time can be included within the t
MTR.
C.4.3 Maintainability — Intrinsic and extrinsic factors
For comparison purposes, it is important to identify what is intrinsic (only related to the item) and extrinsic (context-dependent) in the maintainability of single items. ⎯ Intrinsic maintainability considers only the built-in characteristics designed to help the maintenance of an
item. ⎯ Extrinsic maintainability considers all that is context-dependent: logistics, support, task organization, isolation, de-isolation.
“Extrinsic” maintainability changes from site to site while “intrinsic” maintainability does not. For reliability studies, it is very important to be able to analyze and model separately these two definitions of the maintainability.
For comparison purposes, it is useful to be able to identify those factors of maintainability that relate only to the item itself, e.g. lubrication or ease of dismantling, which can be called intrinsic maintainability, and those related to its location, e.g. logistics, support, task organization, isolation, de-isolation, which can be called extrinsic maintainability.
C.4.4 Procedure for compiling data records for maintainability
When planning to collect measures and estimates of failure maintainability (see 7.1.2), choose appropriate measures from Clause C.5 for the information required.
C.5 “MEAN TIME” DEFINITIONS
C.5.1 Principle
The mean time during which the item is in certain states can be measured by use of mean down time, mean time

N.I.G.C April 2016 IGS-O-MN-001(0)
129
between failures, mean time to failure, mean time to repair, mean up time, etc. Mean values are a good approximation when limited data are available or when there is no clear trend in the data. However, if there is a trend, as there often is, in maintenance data, e.g. increasing hazard rate (wear-out) or decreasing hazard rate (“run in”), mean values can be misleading and can result in incorrect decisions.
C.5.2 Mean down time (MDT)
Mean down time is defined as the mean time during which the item is in its down state.
This includes all the delays between the failure and the restoration of the function of the concerned item: detection, spare parts, logistics, stand-by, maintenance policy, active maintenance time, re-instatement, etc.
This is not an intrinsic parameter, as it depends on the context within which the item is used.
Therefore, only a specific part of this down time can be of interest to an analyst performing a reliability study
(i.e. tMTR
). See also Figure 4.
C.5.3 Mean time between failures (MTBF)
C.5.3.1 Definition
Mean time between failures is defined as the mean time between two consecutive failures.
C.5.3.2 Mathematics of MTBF
The general expression for the mean time between failures, tMBR
, can be expressed as given in Equation (C.31):
tMBF = tMU
+ tMD (C.31)
where
tMU
is the mean up time;
tMD
is the mean down time.
which, in simple cases, can be expressed as given in Equation (C.32):
tMBF = tMTF
+ tMTR (C.32)
where
tMTF
is the mean time to failure;
tMTR
is the mean time to repair.
Like the MDT, this is not an intrinsic parameter, but depends on the context within which the item is used.
C.5.3.3 Uses for MTBF
MTBFs are calculated and used for different purposes (for item and equipment, service, site, etc.). The “item” and “equipment” are of interest mainly to reliability engineers and the others to the maintenance people.
C.5.4 Mean time to failure (MTTF)
N.I.G.C April 2016 IGS-O-MN-001(0)
130
C.5.4.1 Definition
Mean time to failure is defined as the mean time before the item fails.
C.5.4.2 Mathematics of MTTF
This parameter, mean time to fail, tMTF
, is linked to the failure rate, λ, of the concerned item by Equation (C.33)
tMTF=
(C.33)
where λ is the failure rate.
C.5.4.3 Use of MTTF
Rigorously, this parameter concerns only the first failure of a new item before any maintenance task has been performed. If the repair is perfect, i.e. the repaired item is “as good as new”, t
MTF is exactly the same as t
MU.
Take care to understand this term and be aware that in practice, tMTF
and tMU
are often confused (see definition
of tMU
).
NOTE tMTF is normally associated with the assumption of an exponential distribution (e.g. a constant hazard rate). tMTF is also used for other distributions as, for example, the normal distribution or the Weibull distribution. Equations (C.31) to (C.33) are valid only for the assumption of an exponential distribution for both tMBF and tMTF. Further, it is a prerequisite that all the time is measured in the same time dimension (global or local time).
C.5.5 Mean time to repair (MTTR)
C.5.5.1 Definition
Mean time to repair is defined as the mean time before the item is repaired.
C.5.5.2 Mathematics of MTTR
This parameter, mean time to repair, tMTR
, is linked to the repair rate, µ, of the concerned item by Equation (C.34)
MTR = 1µ (C.34)
where µ is the repair rate.
C.5.5.3 Uses of MTTR
The name MTTR is generally related only to the active corrective maintenance time that is a part of the down time, but depending on the study, it can range from the active corrective maintenance time to the whole down time. In that case “restoration” can be used instead of “repair”. In the general case, however, “down time” is greater than “active maintenance time”.
If preventive maintenance is also included in addition to the corrective maintenance (repair) dealt with above, the mean time to maintain, t
MTM, expressed in hours, can be calculated as given in Equation (C.35):

N.I.G.C April 2016 IGS-O-MN-001(0)
131
MTM = ( . ) ( . ( ) (C.35)
where
tmc
is the total elapsed corrective maintenance or repair time, expressed in calendar hours;
tmp
is the total elapsed preventative maintenance time, expressed in calendar hours;
Mc is the total number of corrective maintenance actions (repairs);
Mp is the total number of preventative maintenance actions.
C.5.6 Mean up time (MUT)
Mean up time is defined as the mean time during which the item is in its up state.
If repairs are “perfect”, i.e. the repaired item is “as good as new,” tMU
is exactly the same as tMTF
. If repair is not perfect, or for equipment comprised of parts that have been repaired and others that have never failed, t
MU and
tMTF
are two different parameters (see also C.5.4).
C.5.7 Procedure for compiling data records for mean time
When planning to collect measures and estimates of mean time (see 7.1.2), choose appropriate measures from Clause C.5 for the information.
C.6 TESTING FOR HIDDEN FAILURES IN SAFETY SYSTEMS
C.6.1 General principles
There are two different principles that can be used to establish the necessary test interval for a safety function with hidden failures: ⎯ required availability
This approach is based on a risk analysis for which some absolute risk acceptance criteria have been established. Each safety function of a plant/system/item of equipment is allocated reliability requirements based on this. This approach is in line with the standards IEC 61508 (all parts) and IEC 61511 (all parts). ⎯ cost-benefit availability
Under some circumstances, the consequence of a safety-system failure in a hazardous situation can be reduced to economic consequences only. It is, then, appropriate to establish the preventive maintenance program by optimizing the total costs by weighing the cost of preventive maintenance against the cost of safety-system failure; see ISO 15663 (all parts).
C.6.2 Required availability
This situation is characterized by an upper limit, LPFD
, that the probability of failure on demand is not allowed to exceed. The necessary test interval, τ, to achieve this can be found by the approximation in Equation (C.36):

N.I.G.C April 2016 IGS-O-MN-001(0)
132
= (C.36)
where
LPFD
is the upper accepted limit for probability of failure on demand;
λ is the failure rate for on-demand failures.
C.6.3 Mathematics of cost-benefit availability
When we use the term cost-benefit availability, we are considering a safety system classified as SIL 0 as defined in IEC 61508 (all parts). This means that there are no absolute requirements with respect to the availability of the system. Still, this can be an important protective system with respect to potential economic loss. An example is a vibration trip on a pump that is supposed to stop the pump if the vibration exceeds a defined level. If the vibration trip fails, the material damage to the pump can be significant. The approach to use in such a situation is to perform an economic optimization where the cost of testing is weighed against the expected cost related to failures.
Mathematically, this idea can be formulated by the approximation in Equation (C.37) for total expected cost:
TEC = 12 ∗ ∗ ∗ + (C.37)
where
CTEC
is the total expected cost;
λfto
is the failure rate for failure mode “fail to operate”;
f is the frequency of events when the safety system is supposed to be activated;
EXAMPLE For a fire alarm, f is the frequency of fires.
Cf
is the difference in cost between the consequences of the hazardous situation when the safety system works and when it does not work;
EXAMPLE For an automatic fire-extinguishing system, Cf is the difference in damage if the extinguishing system
is automatically activated or not in case of a fire. In many cases, it is required to perform a coarse risk analysis to estimate C
f. In the case of a fire, for instance, one important aspect to evaluate is the probability of people being
present to discover the fire and being able to manually activate the fire extinguishing equipment).
Cm
is the cost of each preventive maintenance activity or test;
τ is the test interval.
The economic optimal test interval may be found by finding the derivative of the total expected cost and setting it equal to zero as given in Equation (C.38):
= ∗ ∗ (C.38)

N.I.G.C April 2016 IGS-O-MN-001(0)
133
where the parameters are the same as those for Equation (C.37).
ANNEX D
(INFORMATIVE)
TYPICAL REQUIREMENTS FOR DATA
D.1 GENERAL
There are different areas of application of RM data and it is necessary to consider carefully the collection of data (see Clause 7) so that the types of data are consistent with the intended purpose. The types of analyses considered are listed Table D.1, which also refers to other relevant and industry standards.
Table D.1 — Areas of application and types of analyses
Areas of application
Type of analysis to be applied Acronym Supported by ISO 14224
Reference
Safety A1 — Quantitative risk analysis QRA Yes IEC 60300-3-9 NORSOK Z-013 ISO 17776
A2 — Risk-based inspection RBI Yes API RP 580
A3 — Safety integrity level SIL Yes IEC 61508 (all parts) IEC 61511 (all parts)
A4 — Environmental- and social-impact assessment
ESIA Yes ISO 14001
LCC/Optimization/ Maintenance
B1 — Life cycle cost LCC Yes IEC 60300-3-3 ISO 15663 (all parts)
B2 — Production availability PA Yes NORSOK Z-016
B3 — Availability analysis AA Yes NORSOK Z-016
B4 — Reliability-centered maintenance
RCM Yes IEC 60300-3-11 NORSOK Z-008 SAE JA1011 SAE JA1012
B5 — Spare-parts analysis SPA Yes IEC 60706-4 IEC 60300-3-12
B6 — Failure mode, effect and criticality analysis
FME Yes IEC 60812
B7 — Statistical reliability data analysis
SDA Yes IEC 60300-3-1 IEC 60706-3
B8 — Structural reliability STR Yes ISO 19900 NORSOK N-001
General C1 — Manning-resource planning MRP Yes NORSOK Z-008
C2 — Six sigma 6Σ Partly —

N.I.G.C April 2016 IGS-O-MN-001(0)
134
C3 — Fault-tree analysis FTA Yes IEC 61025
C4 — Markov process analysis MPA Yes IEC 61165
C5 — Petri Net for Monte Carlo analysis PNA Yes N/A
D.2 BUSINESS VALUE OF DATA COLLECTION
During the different phases of a development project from concept selection to the operational phase, it is necessary to make a lot of decisions. Many of these decisions are supported by the analysis types listed in Table D.1. These decisions normally have large impact on the project economy and safety, and they should be based on good models and high quality data in order to reach the “best” decisions. Examples of areas where such decisions are taken are shown in Clause 6.
D.3 DATA REQUIREMENTS
During development of this Standard, a GAP analysis was performed to reveal the requirements for data in various types of RAMS analysis. The tables below show a summary of the GAP analyses identifying the required data to be recorded for each analysis type. The data requirements have been prioritized by each analyst using the following scores:
a) Normally needed; rated as 1 in Tables D.2 to D.4;
b) Needed optionally; rated as 2 in Tables D.2 to D.4.
A shaded row indicates parameters for which data are already covered in this Standard. Non-shaded rows indicate parameters identified by the GAP-analyses as possible new parameters to be included in future revisions of this Standard.
Some recommended parameters (e.g. failure rate) cannot be recorded directly, but are required to be calculated from other data. These have been termed “derived reliability parameters” (see Annex C).
The data elements in Tables D.2 and D.4 should be seen in conjunction with data elements shown in Tables 5, 6 and 8.
D.4 DESCRIPTION OF THE ANALYSES
A summary of analyses and relevant standards will be given in a new Standard, ISO 20815, under development as of the publication of this Standard.

N.I.G.C April 2016 IGS-O-MN-001(0)
135

N.I.G.C April 2016 IGS-O-MN-001(0)
136

N.I.G.C April 2016 IGS-O-MN-001(0)
137

N.I.G.C April 2016 IGS-O-MN-001(0)
138

N.I.G.C April 2016 IGS-O-MN-001(0)
139
ANNEX E
(INFORMATIVE)
KEY PERFORMANCE INDICATORS (KPIS) AND BENCHMARKING
E.1 GENERAL
Reliability and maintenance (RM) data can be used for developing and managing key performance indicators (KPIs) and for compiling Benchmark information. The objective of both Benchmarking and KPIs is to assist in the management of business improvement. This Annex gives some examples of KPIs, which can be extended, as deemed necessary, using the taxonomy classification in Figure 3. (Some of the principles described below are based on References [65] and [66].)
Figure E.1 — Process for using KPIs and benchmarking for improving business performance
The process depicted in Figure E.1 is a simplified version of how KPIs can be developed.
KPIs should be aligned to the objectives of the organization using them and, thus, the organization is free to define the KPIs in whatever way best contributes to the improved performance of the organization.
Improvement is an essential ingredient of successful companies. Performance indicators and benchmarking can be highly effective in identifying and improving areas of greatest opportunity.
For each of the activities in the process represented in Figure E.1 a brief description is given in the list items a) to e).
a) Benchmark performance:
Use is made of benchmarking data to determine the performance of the organization in key areas. These benchmarks can then be used for comparison, usually external, against organizations in the same or similar industry, or against organizations in different industries that have similar business processes.
However, measuring performance gaps with the better performers in a peer group is only half the value of benchmarking. Analyses that can be made of differences of plant profile, practices and organization (the causal factors) explaining these performance gaps are also invaluable knowledge for benchmarking study participants.
b) Identify areas for improvement:
Based on the external benchmarks and the objectives of the organization, areas for improvement can be identified. The areas for improvement are not necessarily the areas where the performance is poor against the other benchmarks, as the areas of poor performance might not correspond with the areas that are critical for the business objectives.
In addition, benchmarking is a tool to prove the business case for the necessary up-front management commitment and investment of the resources to be mobilized for the successful implementation of a performance-improvement project. Benchmarking can be conducted inside the company, within the industry or across industries (as long as the same business process is being dealt with). In the former case, a “best of the best” networking-type process is effective in performance upgrades. Use of benchmarking within an industry allows a company to recalibrate its performance targets and to reexamine the justification of historic policies and practices in the light of those of the better industry performers.

N.I.G.C April 2016 IGS-O-MN-001(0)
140
c) Develop KPIs for improvement
In the areas where improvement is desired, KPIs should be developed. Each KPI should have a targeted performance level. The KPI and target should, where possible, be specific, measurable, achievable (but require stretch), realistic and time-based (i.e. can track performance improvement over time). The frequency at which the KPI is measured is determined by a realistic expectation of the amount of time required for any corrective action to have an impact on the performance level. Thus, one does not want to measure and analyze the parameters when there is no change from one measurement to the next, but it is necessary to balance this against not measuring often enough, resulting in the situation that parameters can be out of control for long periods. In addition, it is necessary to consider the time, cost and resources needed to develop, maintain and manage the KPIs, as this also determines how many robust KPIs can be used.
d) Measure KPI
The KPI should be measured and reported, where possible, within existing systems. In addition to measuring the KPI, it is necessary to compare the result against the target and to identify any causes for deviations.
e) Take corrective action
The causes for deviations should be addressed and corrective actions performed, and the process should be repeated many times.
E.2 ALIGNMENT TO BUSINESS OBJECTIVES
E.2.1 General
KPIs are aligned to the organization's objectives for the facility (or operations) and improvements are identified and implemented in order to achieve the organization's planned objectives. The alignment of KPIs to the business objectives can be represented as shown in Figure E.2.
Figure E.2 — Alignment of KPIs to the business objectives

N.I.G.C April 2016 IGS-O-MN-001(0)
141
E.2.2 Differences between benchmarks and KPIs
The differences between benchmarks and KPIs are rather subtle. The major difference between a KPI and a benchmark is related to the usage. In effect, a KPI is used for managing an improvement on an ongoing basis and for determining the progress towards a predetermined target. A benchmark is used as a one-off, or low-frequency, event to determine the present performance levels against other organizations involved in the same process.
The table below provides an overview of the major differences.
Table E.1 — KPIs versus benchmarking
Characteristic KPIs Benchmark
Purpose Track progress and effectiveness of management
Identify gaps in present performance level
Frequency Reasonable expectation of change occurring
One-off/infrequent
Source of data Internal systems External sources
Level of control Immediate to short-term Longer-term
Number of influencing parameters
One or few Many
Accuracy Interested in trend Interested in absolute value
Targets Set, based on objectives No target
E.3 USING BENCHMARKING
E.3.1 Benchmarking principles
Benchmarking helps determine the reference point and standard from which world-class performance can be measured. The process of benchmarking can be broken down into three steps.
a) Evaluate and measure your own operation or specific process to identify weaknesses and strengths using the data collected in accordance with Clauses 7, 8, and 9. Choose a set of KPIs (see Table E.3). Align them to the organization's objectives for the facility (or operations), identify areas for improvement, collect and analyze the data and implement improvements in order to achieve the organization's planned objectives.
b) Initiate a benchmarking study and document processes by referring to peer groups (see E.3.7) that are more productive or efficient than yours.
c) Identify best practices and implement them.
E.3.2 General
Benchmarking is most useful where there is an existing statistically significant sample population. It is necessary that those individuals involved in the exchange of information understand the inherent limitations imposed by the data they collect and the database where it is stored. For example, depending on the type, load, speed, mounting method, lubricant formulations, contamination levels, etc., a given bearing can last anywhere

N.I.G.C April 2016 IGS-O-MN-001(0)
142
from 18 months to 40 years; therefore, knowing the average MTTF of all bearings in a given plant would be of only limited usefulness to a reliability engineer. For company A, who is operating with a MTTF of 18 years, to approach the reliability of company B who is operating with a MTTF of 40 years, it is necessary that there be an underlying knowledge of all of the differences in the design and operating conditions. The development of best practices cannot occur where there is not already a sound knowledge of engineering principles.
A frequent misuse of benchmarking is to consider it merely as a scorecard, that is to say, for looking backward to measure past success or failure, rather than as a map to guide forward progress to achieve goals and continue improvement.
E.3.3 Taxonomy level
Benchmarking can occur at the plant, process-unit, equipment-class, sub unit or maintainable-item level. Key performance indicators for each hierarchical level (see Figure 3) provide different information. If a KPI set at one taxonomic level highlights a weakness, then the next lower taxonomy level of indicators should give further definition and clarification to the causes of the weakness. Benchmarking initiatives that rank plant or process-unit performance often look at relative levels of reliability, staffing, utilization and operating cost. KPIs for hierarchies at the level of equipment class and below include parameters that principally focus on the incidence of failure and repair. Where a “best practice” for continuous improvement on a process unit can, for example, involve the implementation of reliability-centered maintenance, the best practice at a lower hierarchy can be the implementation of more rigorous design specifications, balance or grouting requirements, etc.
E.3.4 Choice of benchmarks
KPIs that together can measure overall reliability and maintenance effectiveness within this Standard are the following:
a) equipment-class, subunit and maintainable-item MTBF (see C.5.3);
b) Availability (see C.2);
c) Cost of production losses caused by unreliability and by maintenance activity;
d) Direct costs (labor, contracts and materials) of maintenance work;
e) Costs of maintenance support staff and of maintenance consumables.
E.3.5 Alignment of benchmark and KPI parameters across peer groups
It is important that all benchmarking contributors supply a complete set of key performance indicators that are tied to the same frame of reference. To do this, the more successful benchmarking initiatives are the following. ⎯ Identify those elements that most affect the commercial success of the business. ⎯ Employ generic terms for each element: the descriptions of boundaries and the collection of data should be
chosen in accordance with this Standard. ⎯ Provide sufficiently detailed definitions to promote and enable a consistent response by each participant and ensure that all performance data apply to the same time frame.
E.3.6 Benefits of benchmarking
Benchmarking may be used to provide continuous improvement to key work-process elements of plant

N.I.G.C April 2016 IGS-O-MN-001(0)
143
maintenance and reliability including
a) strategy/leadership,
b) Maintenance work management,
c) Predictive and preventive maintenance,
d) Computerized maintenance management information systems (CMMIS), e) training,
f) Materials management,
g) Contractor management,
h) Reliability improvement,
i) Competitive technology/benchmarking.
Confidential industry benchmarking of the reliability and maintenance function has become an essential tool for performance-improvement programs. It has the primary objective of providing companies with useable comparative data that, at a level of detail that is actionable, helps them focus on credible opportunity targets to improve their performance.
To gain credibility and acceptance, it is necessary that these opportunity targets be seen as realistic, that is, they are understood by, and credible to, those responsible for achieving them.
Users of this Standard are cautioned against focusing on only one or two of the KPIs and neglecting others.
E.3.7 Selection of peer groups
E.3.7.1 General
The selection of the peer group against which a participating plant compares its performance data is important. If this peer-group selection is well made, personnel in the plant will have confidence that it has the same performance opportunity as the better-performing plants in the group. Furthermore, use of a suitable method of analysis of physical causal factors, of plant characteristics and of maintenance practices within the group provide explanations of variations in performance that have greater validity.
When a plant’s performance is seen to be poor compared with its peer group, the gap can be due both to differences in the plant’s physical features (even within the same peer group) and also to differences in the practices and organization of the site. The characteristics of both categories of causal factor should be benchmarked using a suitable method of benchmarking, so that the relative weight of each can be judged and realistic targets set.
E.3.7.2 Selection of peer groups
A peer group’s distinguishing factor is a feature of a plant that affects one or several aspects of performance and is common and intrinsic to the group of plants and also that a plant cannot change in the short/medium term.
The two peer-group distinguishing factors that have been found most significant in studies on reliability and maintenance are ⎯ Process family: for reasons of equipment types, process severity (corrosively, toxicity, etc.) and maintenance complexity; ⎯ Geographic region: for reasons of prevailing labor hourly costs, employment and contracting practices, safety
and environment-protection norms, climate, management culture and industrialization level of the region.

N.I.G.C April 2016 IGS-O-MN-001(0)
144
E.4 EXAMPLES OF BENCHMARKS AND KPIS USING RM DATA
There are a variety of benchmarks and KPIs available. Measurement of costs and failure rates provides indications of trends in the effectiveness of maintenance and reliability programs. KPIs can also be used to gauge an organization’s adherence to programs and procedures by recording compliance with preventive or predictive schedules.
No single KPI provides the complete picture and it is, therefore, necessary to define a basket of KPIs that together indicate progress and trends in the reliable operation of plant and equipment. Trends can be shown over a period of time and can require some special attention to allow for periodical as well as accumulative reporting, for example, “last-two-years average” in the latter case.
Table E.3 gives examples of KPIs that can be developed making use of RM or other reliability-related data. Other/more KPIs can be useful depending on industry and application. In Table E.3, reference is made to the same taxonomic levels (see 8.2) as are also summarized in Table E.2.
Table E.2 — Taxonomic levels
Main category
Taxonomic level
Taxonomic hierarchy Use/location
Use/location 1 Industry Type of main industry
2 Business category Type of business or processing stream
3 Installation category Type of facility
4 Plant/unit category Type of plant/unit
5 Section/system Main section/system of the plant
Equipment subdivision
6 Equipment (class/unit) Class of similar equipment units. Each equipment class contains similar pieces of equipment (e.g. compressors).
7 Subunit A subsystem necessary for the equipment unit to function.
8 Component/maintainable item
The group of parts of the equipment unit that are commonly maintained (repaired/restored) as a whole
9 Part a A single piece of equipment
a While this level may be useful in some cases, it is considered optional in this Standard.

N.I.G.C April 2016 IGS-O-MN-001(0)
145
Table E.3 — Examples of KPIs a
KPI parameter
Relevant taxonomic hierarchies
b
Units Explanation and calculation Purpose and value
Involved personnel
1) MTBF Mean time between failures
6 to 8 Time (hours, days, weeks, months, years) For different classes or types of equipment Trends are shown over a period of time
Indicates the average time between failure for components, equipment or units. Definition of failure is given in Annex C (general) and Annex F (safety equipment). Use of MTBF implies that down time/repair is included. Guidelines for calculating MTBF (and MTTF) are given in Annex C.
Indication of increasing or decreasing reliability of components, equipment or unit/plant
Equipment subject-matter experts (SMEs) Reliability engineers (REs) Middle management (MM) Inspection
2) MTTF Mean time to failure
6 to 8 As above Is similar to MTBF, but does not take into account the down time/repair time. MTBF is the sum of MTTR and MTTF. MTTF equals the reciprocal of the failure rate.
As above Note that MTTF, in principle, concerns only the first time to failure of a new item before any maintenance task has been performed
As above
3) MTBR Mean time between repairs
6 to 8 Time (hours, days, weeks, months, years) For different classes or types of equipment Trends are shown over a period of time
Indicates the average time between repairs for components, equipment or units. Although a failure typically results in a repair, this is not always the case. Repairs (e.g. major overhauls) can be undertaken on a time basis independent of failure. Calculation based on total up time between repairs divided by number of repairs over a specified time period or to date. Hence, MTBR can differ from MTBF. For subsea equipment, one may rename the KPI to “Mean time between interventions” (MTBI).
Indication of increasing or decreasing reliability of components or equipment within a plant/unit
SMEs REs MM Maintenance Inspection
4) MTTR Mean time to repair
6 to 8 Time usually in hours or days. For different classes or types of equipment Trends are shown over a period of time
The time taken to repair a component, equipment, system or unit. Total out-of-service time divided by the number of repairs. It is necessary to define the out-of-service parameters. It is necessary that MTTR follow timeline principles given in Figure 4. One may introduce MDT (Mean down time) if it is also of interest to monitor the preparation and delay times.
Indication of the productivity and work content of repair activities
SMEs and REs Maintenance

N.I.G.C April 2016 IGS-O-MN-001(0)
146
KPI parameter
Relevant taxonomic hierarchies
b
Units Explanation and calculation Purpose and value
Involved personnel
5) Worst actors List of frequently failed equipment
6 to 8 List of equipment List of frequent failure modes Frequency of failure
Clear definition of which failure types are covered is necessary (see Annex C). List of most frequently failed equipment can also be generated by frequency of repairs. Restructure as to plant impact.
Provides focus for reliability management and root cause failure analysis (RCFA) Product/quality development
As above
6) AO Operational availability
6 % time available for operation of the equipment when all maintenance (corrective and preventive) is included in the down time
Normally on equipment-unit level.
Shows trend in equipment availability when both corrective and preventive maintenance is covered Input for production planning
SME and REs MM Operations Maintenance Inspection
7) AT Technical availability
6 % time available for operation of the equipment when corrective maintenance only is included in the down time
Normally on equipment-unit level.
The key technical-availability indicator Shows trend in equipment availability focusing on intrinsic reliability (see C.2)
SM and MM Operations Maintenance Inspection SMEs and REs
8) Preventive maintenance (PM) man-hours ratio
4 to 6 % of total maintenance man-hours spent on PM (not including modifications)
Total PM work order (WO) man-hours divided by total WO man-hours, by equipment classification or types.
Indication of amount of proactive preventive maintenance work
SMEs and REs Operations Maintenance
9) Corrective maintenance man-hours ratio
4 to 6 % of total maintenance man-hours spent on corrective maintenance
Total CM WO man-hours divided by total WO man-hours, by equipment classification or types.
Indication of amount of corrective maintenance work
SMEs and REs Operations Maintenance
10) PMs overdue
4 to 6 Number or % of PM WOs overdue by category
Count of outstanding PM WOs by equipment classification or as a % of total PM WOs. One may also select only safety-critical equipment or production-critical equipment to differentiate into groups.
Indication of outstanding PM backlog
Operations Maintenance
11) Predictive maintenance (PdM) complete Completion of predictive maintenance (e.g. inspections, testing, periodic condition monitoring)
4 to 6 Number or % PdM data-collection activities completed
Define which predictive-maintenance activities to cover, individually or all. For example, number of data points, routes or equipment that have PdM NDT data collection carried out divided by total data points, routes or equipment, over a specified period of time. (Vibration analysis data, thickness readings, infrared scans, motor performance analysis).
Condition monitoring management
SMEs and REs Operations Maintenance Inspection

N.I.G.C April 2016 IGS-O-MN-001(0)
147
KPI parameter
Relevant taxonomic hierarchies
b
Units Explanation and calculation Purpose and value
Involved personnel
12) Predictive maintenance (PdM) overdue
4 to 6 Number or % overdue predictive maintenance (PdM) activities
Define which predictive maintenance activities to cover, individually or all. Count or % of PdM NDT data points, routes or equipment that are outstanding over a specified time period of time.
Indicates backlog of PdM type of activities, e.g. NDT
SMEs and REs Operations Maintenance Inspection
13) Turn-around duration
4 Time, usually in days
It is necessary to include run-down and start-up in connection with turn-arounds. Prolonged turn-arounds due to modifications may be separated out in order not to disturb comparison with year-to-year requirements for major maintenance.
Maintenance planning Modification opportunities Outage planning Production planning
Operations Maintenance
14) Time between turn-arounds
4 to 5 Measured on annual basis (number of months, years)
Time between turn-arounds. As above As above
15) Repair rework ratio
6 % of repairs where rework is required following repair
Number of WOs that are reworked divided by total number of WOs. Classified by equipment type. May be split into preventive and corrective maintenance.
Indication of work quality and productivity
REs Operations Maintenance
16) Repair workshop cycle time
6 to 8 Time, usually in hours or days
The time taken from when failed item is received at repair shop until it is ready for use again
Repair management
Maintenance
17) Total maintenance cost
4 to 6 Per plant, section or equipment for a given period (e.g. annually)
Total cost for both corrective and preventive maintenance including spare parts. Does not include costs related to down time with respect to lost production.
Trend analysis over a period of time
Plant management Operations Maintenance
18) Cost of repairs per work order
4 to 6 Cost by different equipment types for various geographical locations, units or plants.
The cost of repair to equipment as represented by the costs collected against equipment work orders. Typically, it includes labour (company and/or contract), materials and equipment hire. Overhead can also be included.
Trend in repair cost over a period of time Identification of worst actors by repair cost and/or equipment type
As above
a Other/more KPIs can be useful depending on industry and application. b See Table E.2.

N.I.G.C April 2016 IGS-O-MN-001(0)
148
ANNEX F
(INFORMATIVE)
CLASSIFICATION AND DEFINITION OF SAFETY-CRITICAL FAILURES
F.1 GENERAL
The purpose of this Annex is to make the user of this Standard aware of some specific definitions and classifications applied for safety-critical equipment. The IEC has developed the safety standards IEC 61508 (all parts) and IEC 61511 (all parts), which have been implemented by many industries including the natural gas, petroleum and petrochemical industries. The general principles described in IEC 61508 (all parts) and IEC 61511 (all parts) have been further developed by national initiatives into guidelines and analyzing methods for use in the petroleum industry, for example Reference [68].
F.2 CLASSIFICATION OF FAILURES OF INSTRUMENTED SAFETY SYSTEMS
F.2.1 General definitions
Instrumented safety systems are items that exert great influence on a plant's safety and integrity, and failure of these systems is, therefore, dealt with in a more dedicated way than for other equipment. As these systems are frequently “dormant” in normal use and expected to function when called upon, it is of the utmost importance to reveal any hidden failure before the function is called upon.
Further, it is also of prime interest to know the consequences of a failure of these systems with regard to impact on safety.
Some general definitions of commonly used terms in this area are given below.
a) Dangerous failures (or unsafe failures) are failures that have the potential to prevent the safety system from achieving its safety function when there is a true demand. A single dangerous failure is generally not sufficient to prevent a redundant safety system from performing its safety function (e.g. two dangerous failures are needed for a 2-out-of-3 voting system).
b) Non-dangerous failures are failures that do not have an immediate effect on the safety function, i.e. do not prevent the safety system from achieving its safety function or of not cause spurious trips;
c) Safe failures (spurious trip failures) are failures that have the potential to trigger the safety function when it is not needed. A single safe failure is generally not sufficient to actually trip unexpectedly a redundant safety system (e.g. 2 safe failures are needed for a 2-out-of-3 voting system).
d) The fail-safe system is based on a design which has reduced the effect of potentially dangerous failures as far as practically possible.
e) Non-fail safe is a safety system where there remains the possibility of dangerous failures.
f) Revealed failures are failures that are detected by the system itself as soon as they occur. Failures detected by the diagnostic test of a logic solver are also considered as revealed failures.
g) Hidden failures (dormant) are failures that are not detected by themselves and that need a specific action
(e.g. periodic test) to be identified.

N.I.G.C April 2016 IGS-O-MN-001(0)
149
F.2.2 Definitions from IEC 61508 (all parts) and IEC 61511 (all parts)
IEC 61508 (all parts) introduces a failure classification, as shown in Table F.1, that is adapted to instrumented safety systems.
Here the failures are first split into the two categories:⎯ random hardware failures (physical); ⎯ systematic failures (non-physical). The random hardware failures of components are further split into the failure modes: a) dangerous detected (DD): dangerous detected failures, i.e. failures detected either by the automatic self-
test or by personnel;
b) dangerous undetected (DU): dangerous undetected failures, i.e. failures detected neither by the automatic self-test nor the personnel (control-room operator or maintenance personnel). This failure type represents safety-critical failures detected only by trying to activate the function by a function test or by function demand during normal operation. This failure contributes to the probability-of-failure-on-demand (PFD) of the component/system (“loss of safety”);
c) safe detected (SD): safe failures (i.e. not causing loss of safety) “immediately” detected by the automatic
self-test;
d) safe undetected (SU): safe failures not detected by the automatic self-test.
When collecting data for safety systems, two categories of failures/events should be emphasized: ⎯ common-cause failures (see C.1.6);
NOTE IEC 61511 (all parts) contains definitions of common-cause/common-mode failures that are specific for instrumented safety systems. ⎯ test interval (periodic) for identifying dangerous undetected (DU) failures.
When a safety/reliability study is performed as described in IEC 61508 (all parts), it is important that the relevant failure modes be classified according to Table F.1. This supports the applicability of this Standard to the specific analyses as described in IEC 61508 (all parts).
When recording and/or analyzing failures for instrumented safety systems, it is recommended to consult IEC 61508 (all parts) and IEC 61511 (all parts) and additional national guidelines as deemed relevant.
F.3 DEFINITION OF CRITICAL/DANGEROUS FAILURES FOR SAFETY SYSTEMS
Some typical dangerous failures, mostly detectable, (see Table F.1) for some common safety systems/ components are given in Table F.2. The use by operators of the standard definitions given in Table F.2 would facilitate comparison and benchmarking to enhance safety levels in the industry.

N.I.G.C April 2016 IGS-O-MN-001(0)
150
Table F.2 — Definitions of critical/dangerous failures for some safety systems/components
System/ component Equipment class Recommended failure definitions Applicable failure modes a
Fire detection (smoke, flame, heat)
Fire and gas detectors b
Detector Fire and gas logic does not receive signal from detector, when detector is tested. NOO, LOO, FTF
Fire detection (manual call point)
Input devices b Manual call point Fire and gas logic does not receive a signal from the pushbutton when activated. NOO, LOO, FTF
Gas detection Fire and gas detectors b
Detector (catalytic, optical point, H2S and H2) Fire and gas logic does not receive signal equivalent to upper alarm limit when testing with prescribed test gas. NOO, LOO
Detector (optical line) Fire and gas logic does not receive signal equivalent to upper alarm limit when testing with prescribed test filter. NOO, LOO
Detector (acoustic) Fire and gas logic does not receive signal when tested. NOO, LOO
Active fire protection (deluge)
Valves b Deluge valve Deluge valve fails to open when tested. FTO, DOP
Nozzles Nozzle More than 3 % of the nozzles are plugged/choked. Failures are reported per skid/loop. PLU
Active fire protection (fire pump)
Pumps b Function Fire pump fails to start upon signal. FTS
Capacity Fire pump delivers less than 90 % of design capacity. LOO
Active fire protection (CO2/Inergen)
Valves b Function Release valve fails to open upon test. FTO
Active fire protection (water mist)
Valves b Function Release valve fails to open upon test. FTO
Active fire protection (AFFF)
Not defined Function Water/foam does not reach fire area upon test. —
Depressurization valves (blowdown)
Valves b Valve Valve fails to open upon signal or within specified time limit. FTO, DOP
ESD (sectioning valves defined as safety-critical)
Valves b Function Valve fails to close upon signal or within a specified time limit. FTC, DOP
Leakage Internal leakage higher than specified value. LCP, INL

N.I.G.C April 2016 IGS-O-MN-001(0)
151
System/ component
Equipment class Recommended failure definitions Applicable failure modes a
ESD (well isolation) Xmas tree b Function Valve fails to close upon signal or within a specified time limit. FTC, DOP
Leakage Internal leakage higher than specified value at first test. LCP, INL
ESD (downhole safety valve)
Well completion equipment b
Function Valve fails to close upon signal or within a specified time limit. FTC, DOP
Leakage Internal leakage higher than specified value. INL, LCP
ESD (riser) Valves b Function Valve fails to close upon signal or within a specified time limit. FTC, DOP
Leakage Internal leakage higher than specified value. INL, LCP
ESD (push button) Input devices b Function The ESD logic does not receive a signal from the push button when activated. NOO, LOO, FTF
Process safety (sectioning valves)
Valves b Function Valve fails to close upon signal or within a specified time. FTC, DOP, LCP,
INL
Process safety (PSV)
Valves Function Valve fails to open at the lesser of 120 % of set pressure or at 5 MPa (50 bar) above set pressure. FTO
Input devices (pressure, temperature, level, flow, etc.)
Input devices b Function Sensor does not give signal or gives erroneous signal (exceeding predefined acceptance limits).
NOO, ERO
Emergency power (emergency generator)
Electric Generator b Function Emergency generator fails to start or gives wrong voltage upon start.
FTS, LOO
Emergency power (central UPS for SIS)
Uninterruptible power supply b
Function Battery capacity too low.
LOC
Emergency power (UPS for emergency lighting)
Uninterruptible power supply b
Function Battery capacity too low. For emergency lights: When one or more emergency lights within one area or circuit fails to provide lighting for minimum 30 min. LOC
Fire damper Not defined b Function Damper fails to close upon signal. —
Ballast system (valves)
Valves b Function Valve fails to operate on signal. FTO, FTC, DOP
Ballast system (pumps)
Pumps b Function Pump fails to start/stop on signal. FTS
a See Tables B.6 to B.12 for definition of acrynoms. b IEC 61508 (all parts) and/or IEC 61511 is/are applicable.