ifm-geomar report - oceanoceanrep.geomar.de/6151/1/ifm-geomar_rep17.pdf · ifm-geomar report...
TRANSCRIPT
IFM
-GEO
MA
R R
EP
OR
T
Berichte aus dem Leibniz-Institut für Meereswissenschaften an der
Christian-Albrechts-Universität zu Kiel
Nr. 17Juli 2008
FS MARIA S. MERIANFahrtbericht / Cruise Report MSM04/1
Meridional Overturning Variability Experiment(MOVE 2006)
Fort de France – Fort de France02.12. – 21.12.2006
ISSN Nr.: 1614-6298
Berichte aus dem Leibniz-Institut für Meereswissenschaften an der
Christian-Albrechts-Universität zu Kiel
Nr. 17Juli 2008
FS MARIA S. MERIANFahrtbericht / Cruise Report MSM04/1
Meridional Overturning Variability Experiment(MOVE 2006)
Fort de France – Fort de France02.12. – 21.12.2006
Das Leibniz-Institut für Meereswissenschaften ist ein Institut der Wissenschaftsgemeinschaft Gottfried Wilhelm Leibniz (WGL)
The Leibniz-Institute of Marine Sciences is a member of the Leibniz Association (Wissenschaftsgemeinschaft Gottfried Wilhelm Leibniz).
Herausgeber / Editor:Thomas J. Müller
IFM-GEOMAR ReportISSN Nr.: 1614-6298
Leibniz-Institut für Meereswissenschaften / Leibniz Institute of Marine SciencesIFM-GEOMAR Dienstgebäude Westufer / West Shore BuildingDüsternbrooker Weg 20D-24105 KielGermany
Leibniz-Institut für Meereswissenschaften / Leibniz Institute of Marine SciencesIFM-GEOMAR Dienstgebäude Ostufer / East Shore BuildingWischhofstr. 1-3D-24148 KielGermany
Tel.: ++49 431 600-0Fax: ++49 431 600-2805www.ifm-geomar.de
R/V MARIA S. MERIAN cruise MSM04/1 02.12. – 21.12.2006 Fort de France – Fort de France Cruise Report Contents
1.1 Participants 1 1.2 Research Programme 2 1.3 Narrative of the Cruise 3 1.4 Preliminary Results 5 1.4.1 Hydrography and Upper Ocean Currents along 16°N 5 1.4.2 Variability of Currents and Hydrography in 2005 to 2006 8 1.4.3 Tomography 12 1.4.4 Pressure Sensor and Inverted Echo Sounder (PIES) 13 1.4.5 Calibration and Data Processing 17 1.4.5.1 Ship Borne CTD 17 1.4.5.2 Ship Borne ADCP 17 1.4.5.3 Lowered ADCP 17 1.4.5.4 Moored CTD (MicroCats) and Temperature-Depth Recorders (MTD) 18 1.4.5.5 Moored Current Meters (Aanderaa RCM8) 18 1.5 Underway Data 19 1.5.1 Ship’s Meteorological Station (DWD) 19 1.5.2 Radiation 19 1.5.3 Rainneter 19 1.5.4 Thermosalinograph 22 1.6 Station List MSM04/1 25 1.7 Acknowledgements 33 1.8 References 33

R/V MARIA S. MERIAN, cruise MSM04/1, 02.12. – 21.12.2006, cruise report 1
1 Leg MSM04/1 1.1 Participants
1. Müller, Dr. Thomas J. Principal Scientist IFM-GEOMAR 2. Begler, Christian, Dipl.-Oz. Physical
Oceanography SIO 3. Böke, Wolfgang Technician IUPUHB 4. Chavez, Gabriela Student SIO 5. Denker, Claudia Student IFM-GEOMAR 6. Karbe, Fritz Student IFM-GEOMAR 7. Karstensen, Dr. Johannes Physical
Oceanography IFM-GEOMAR 8. Krahmann, Dr. Gerd Physical Oceanography IFM-GEOMAR 9. Link, Rudolf Technician IFM-GEOMAR 10. Niehus, Gerd Technician IFM-GEOMAR 11. Nielsen, Martina Technician IFM-GEOMAR 12. Neumann, Uta Student IFM-GEOMAR 13. Neves-Silva, Pericles Student INDP 14. Passalacqua, Gino Technician SIO 15. Pinck, Andreas Technician IFM-GEOMAR 16. Semingson, Taylor Technician SIO
Institutes IFM-GEOMAR Leibniz-Institut für Meereswissenschaften, Kiel, Germany IUPUHB Institut für Umweltphysik, Universität Bremen, Germany INDP Fishery Research Institute of the Cape Verde Islands SIO Scripps Institution of Oceanography, La Jolla, CA, USA
Contact Dr. Thomas J. Müller Leibniz-Institut für Meereswissenschaften IFM-GEOMAR Geb. Westufer phone: +49-(0)431-600-4161 Düsternbrooker Weg 20 fax: +49-(0)-431-600-4152 24105 KIEL, Germany e-mail: [email protected]
R/V MARIA S. MERIAN, cruise MSM04/1, 02.12. – 21.12.2006, cruise report 2
1.2 Research Programme
The southward transported North Atlantic Deep Water (NADW) is the most important cold water branch of the world’s oceanic thermohaline circulation, and it is expected from numerical modelling that fluctuations or, in the worst, a break-down would have significant impact on climate (Clarke et al., 2001; Johns et al., 2005). It is well known that the strongest signal of associated currents within NADW transports can be observed in the deep western boundary current off the Americas. However, within the large deep basins, recirculation cells can induce large transport fluctuations even when currents are weak. IFM-GEOMAR in 2000 initially set up an instrumental array along 16°N in the western basin within the experiment MOVE (Meridional Overturning Variabilty Experiment) to measure such fluctuations using cross-basin integral methods, namely geostrophic moorings with a number of self recording Conductivity-Temperature-Depth (CTD) instruments (MicroCat, MC) and acoustic tomography (Kanzow et al., 2004). Surface elevations are measured using inverted echo-sounders in combination with high precision pressure sensors (PIES) which data are to be compared with gravity data from the GRACE satellite mission. Within the deep boundary current itself, recording current meters were moored to estimate directly transports. The geographical distribution of mooring sites and CTD stations during this cruise is shown in figure 1.1.
The main aim during cruise MSM04/1 was to recover or directly read out the
instruments which were moored during 2005 cruise on the French l’ATALANTE (Send, 2005), supplemented by a final an eddy-resolving CTD section along 16°N. The moored component of MOVE from MSM04/1 on is continued in the western basin by the Scripps Institution of Oceanography (SIO, La Jolla, CA, U.S.A.), and is complemented in the eastern basin by IFM-GEOMAR through its new time series station off the Cape Verde Islands. The scientific party during MSM04/1 consisted of 11 scientists and technicians from IFM-GEOMAR, three from SIO, one participant from the University of Bremen, and a guest from the Fishery Research Institute of the Cape Verde Islands (INDP).
R/V MARIA S. MERIAN, cruise MSM04/1, 02.12. – 21.12.2006, cruise report 3
1.3 Narrative of the Cruise
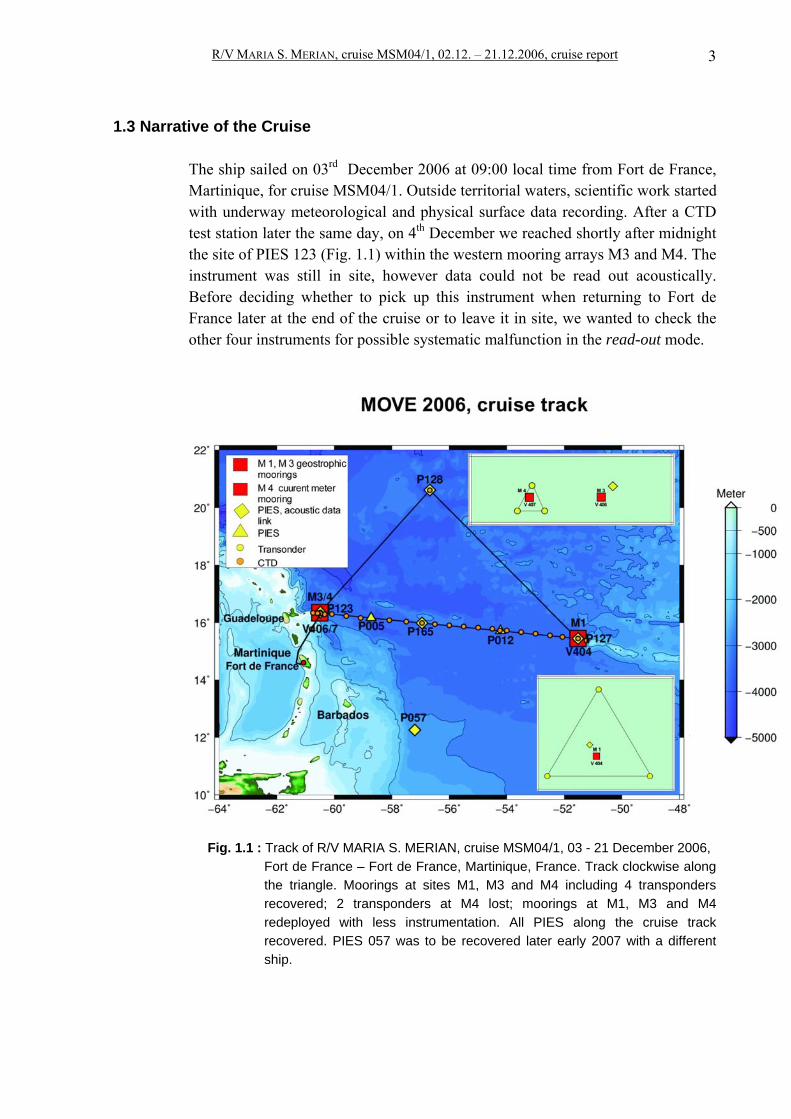
The ship sailed on 03rd December 2006 at 09:00 local time from Fort de France, Martinique, for cruise MSM04/1. Outside territorial waters, scientific work started with underway meteorological and physical surface data recording. After a CTD test station later the same day, on 4th December we reached shortly after midnight the site of PIES 123 (Fig. 1.1) within the western mooring arrays M3 and M4. The instrument was still in site, however data could not be read out acoustically. Before deciding whether to pick up this instrument when returning to Fort de France later at the end of the cruise or to leave it in site, we wanted to check the other four instruments for possible systematic malfunction in the read-out mode.
Fig. 1.1 : Track of R/V MARIA S. MERIAN, cruise MSM04/1, 03 - 21 December 2006,
Fort de France – Fort de France, Martinique, France. Track clockwise along the triangle. Moorings at sites M1, M3 and M4 including 4 transponders recovered; 2 transponders at M4 lost; moorings at M1, M3 and M4 redeployed with less instrumentation. All PIES along the cruise track recovered. PIES 057 was to be recovered later early 2007 with a different ship.
R/V MARIA S. MERIAN, cruise MSM04/1, 02.12. – 21.12.2006, cruise report 4
On the 4th and the 5th December both, the combined current meter and tomography mooring arrays at M4 and the geostrophic mooring at M3 at the western edge of the deep basin were recovered successfully besides two of three transponders. The current meters and all but one MC show good data. The tomograph transceiver in M4 had transmitted all the time. Moorings M4 and M3 were re-launched by SIO on 5th and 6th December with less instruments. Several CTD casts were taken in between the mooring work for calibration purposes.
When leaving sites M3 and M4 towards the site of PIES 128 in the north, the
multibeam echo-sounding and the ship mounted 75 kHz OCEAN SURVEYOR ADCP were switched on. The site of PIES 128 was reached on 9th December. As we faced the same problems in data read out mode as before, PIES 128 was released and recovered. Technical inspection showed that the main batteries had ceased 18 months after deployment in 2004. As turned out later during the cruise and was confirmed by the manufacturer, this was a general instrumental problem.
On 11th December, we reached the eastern array M1 where the geostrophic
mooring with tomography receiver, all three transponders and PIES 127 were recovered. The telemetry on top of the mooring had transmitted deep sea data via satellite ashore for all the time. With less instrumentation, the geostrophic mooring M1 was launched by SIO on 12th December.
After having finished the mooring work, the CTD section along ca. 16°N
started on 13th December (locations see map in Fig. 1.1). Most casts were down to 5000 m. Many casts also were used to calibrate in-situ some instruments recovered from moorings. On the way the remaining PIES 012, 165, 005 and 123 were recovered. Scientific work was finished after completion of the section off Guadeloupe on 19th December.
Overall data are complete and of high quality with the following exceptions:
two MCs showed malfunction; all PIES records are incomplete (ca. 18 of 33 months); data in the tomography receiver from the deep ray lack crrelation with the theoretical eigen-rays. For logistic reasons. PIES 057 off Barbados in the south was not recovered. Before the cruise. SIO has agreed that work at this site would be performed later in early 2007 by SIO with a different ship.
R/V MARIA S. MERIAN, cruise MSM04/1, 02.12. – 21.12.2006, cruise report 5
1.4 Preliminary Results (J. Karstensen, C. Begler, G. Krahmann, T.J. Müller) 1.4.1 Hydrography and Upper Ocean Currents along 16° N
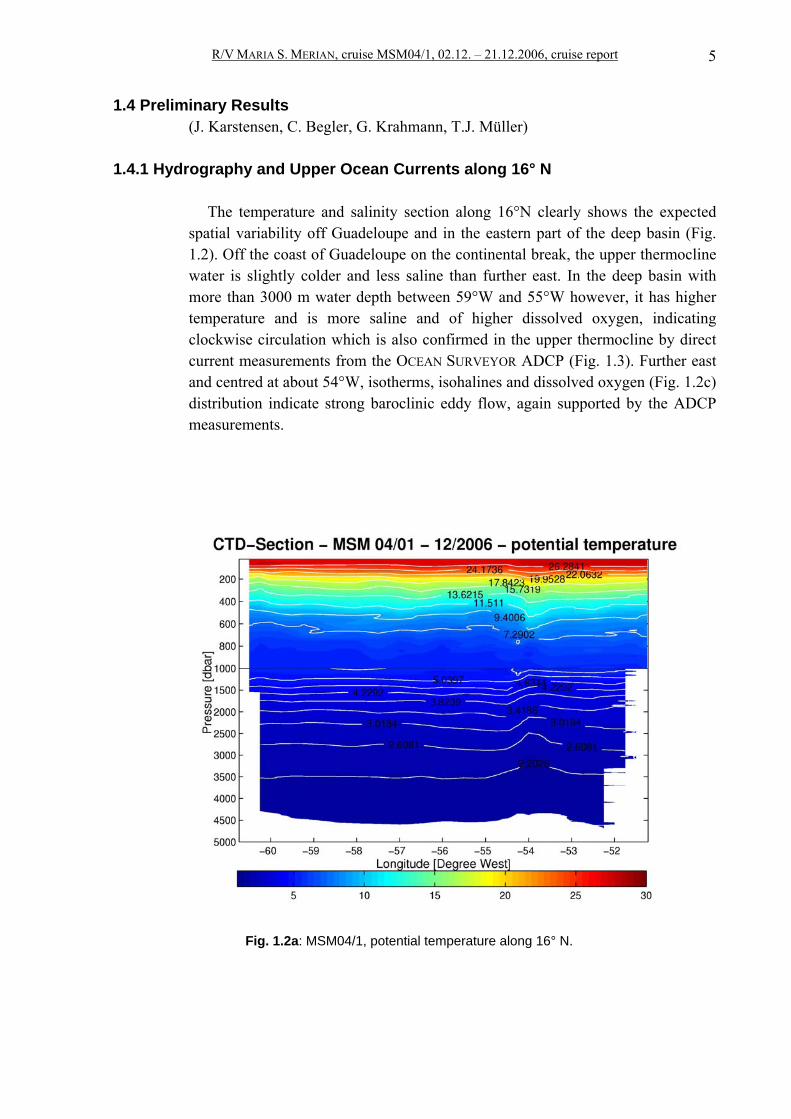
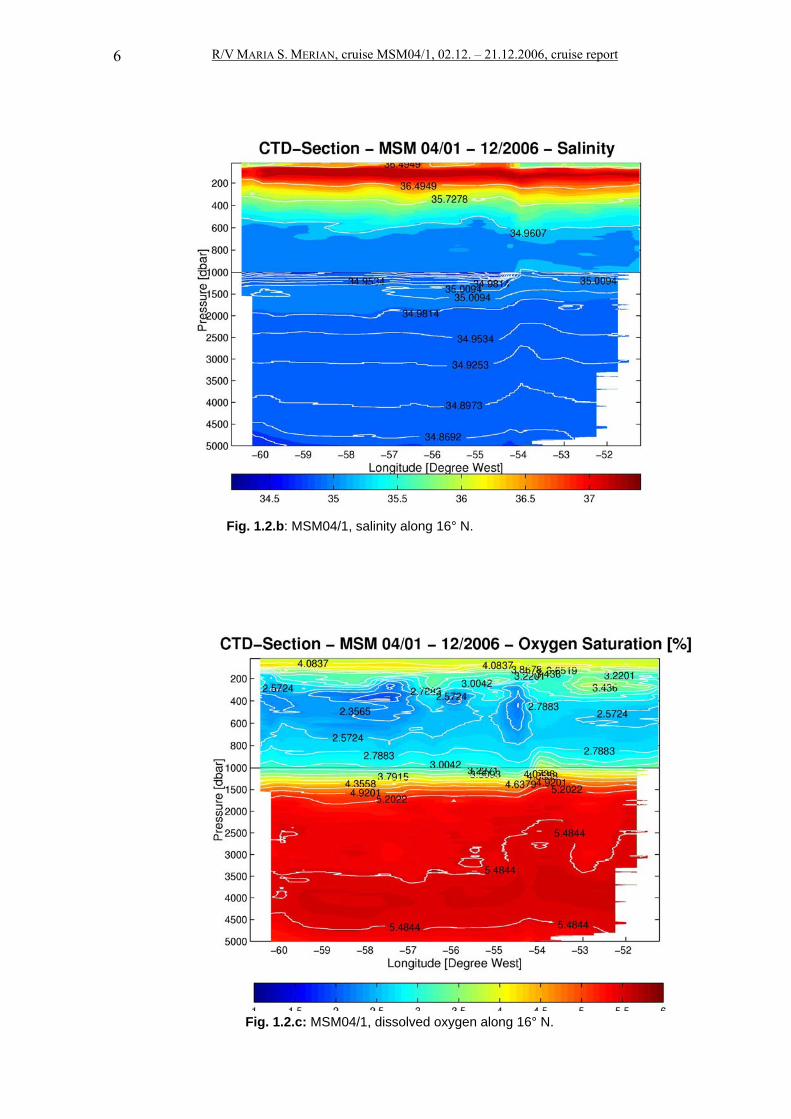
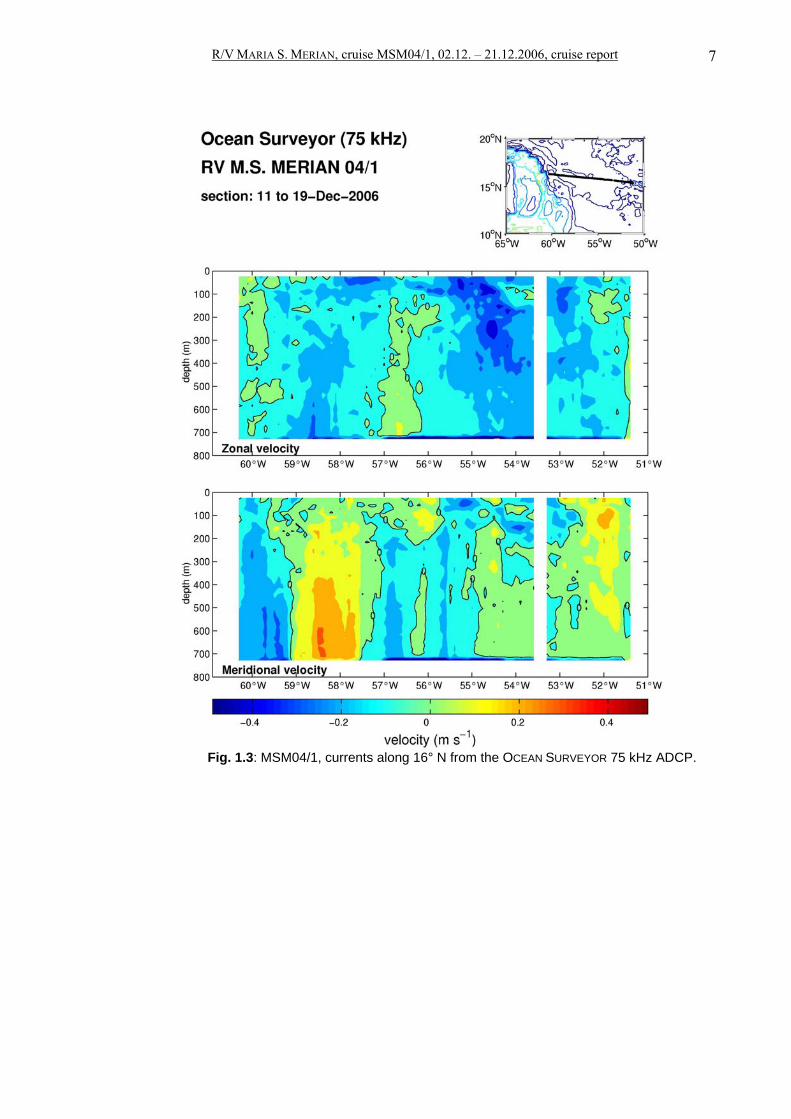
The temperature and salinity section along 16°N clearly shows the expected spatial variability off Guadeloupe and in the eastern part of the deep basin (Fig. 1.2). Off the coast of Guadeloupe on the continental break, the upper thermocline water is slightly colder and less saline than further east. In the deep basin with more than 3000 m water depth between 59°W and 55°W however, it has higher temperature and is more saline and of higher dissolved oxygen, indicating clockwise circulation which is also confirmed in the upper thermocline by direct current measurements from the OCEAN SURVEYOR ADCP (Fig. 1.3). Further east and centred at about 54°W, isotherms, isohalines and dissolved oxygen (Fig. 1.2c) distribution indicate strong baroclinic eddy flow, again supported by the ADCP measurements.
Fig. 1.2a: MSM04/1, potential temperature along 16° N.
R/V MARIA S. MERIAN, cruise MSM04/1, 02.12. – 21.12.2006, cruise report 6
Fig. 1.2.b: MSM04/1, salinity along 16° N.
Fig. 1.2.c: MSM04/1, dissolved oxygen along 16° N.
R/V MARIA S. MERIAN, cruise MSM04/1, 02.12. – 21.12.2006, cruise report 7
Fig. 1.3: MSM04/1, currents along 16° N from the OCEAN SURVEYOR 75 kHz ADCP.
R/V MARIA S. MERIAN, cruise MSM04/1, 02.12. – 21.12.2006, cruise report 8
1.4.2 Variability of Currents and Hydrography in 2005 to 2006
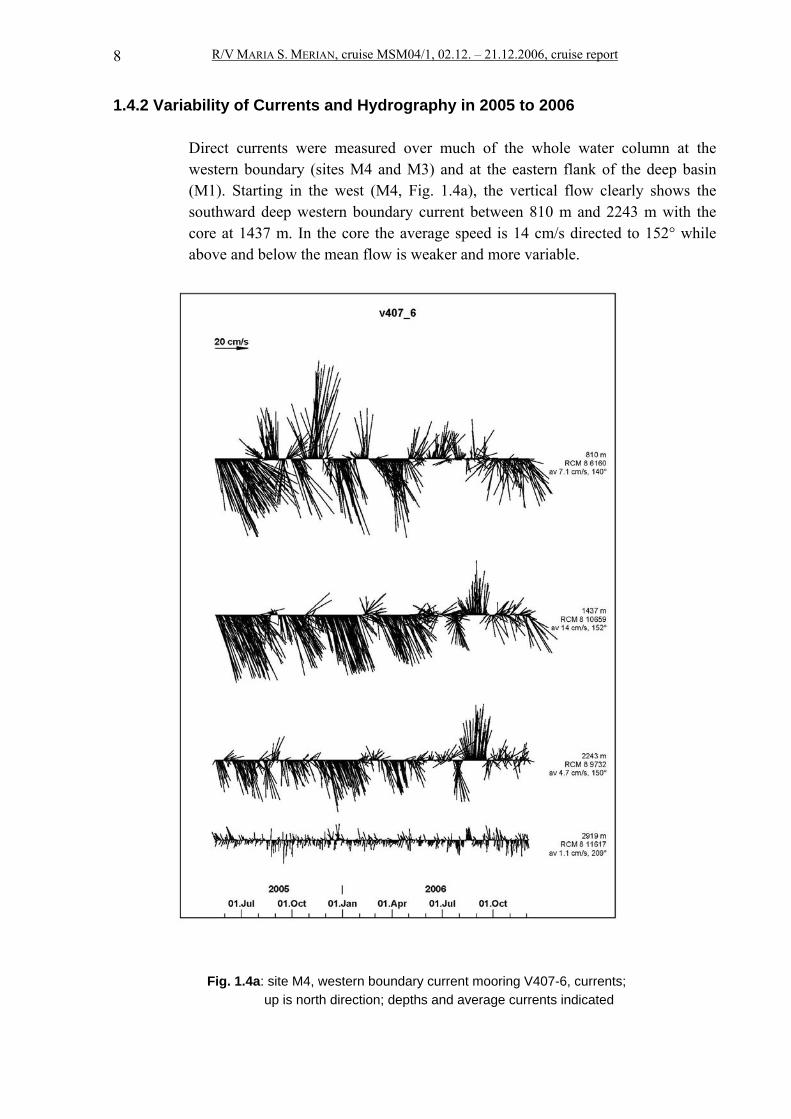
Direct currents were measured over much of the whole water column at the western boundary (sites M4 and M3) and at the eastern flank of the deep basin (M1). Starting in the west (M4, Fig. 1.4a), the vertical flow clearly shows the southward deep western boundary current between 810 m and 2243 m with the core at 1437 m. In the core the average speed is 14 cm/s directed to 152° while above and below the mean flow is weaker and more variable.
Fig. 1.4a: site M4, western boundary current mooring V407-6, currents;
up is north direction; depths and average currents indicated
R/V MARIA S. MERIAN, cruise MSM04/1, 02.12. – 21.12.2006, cruise report 9
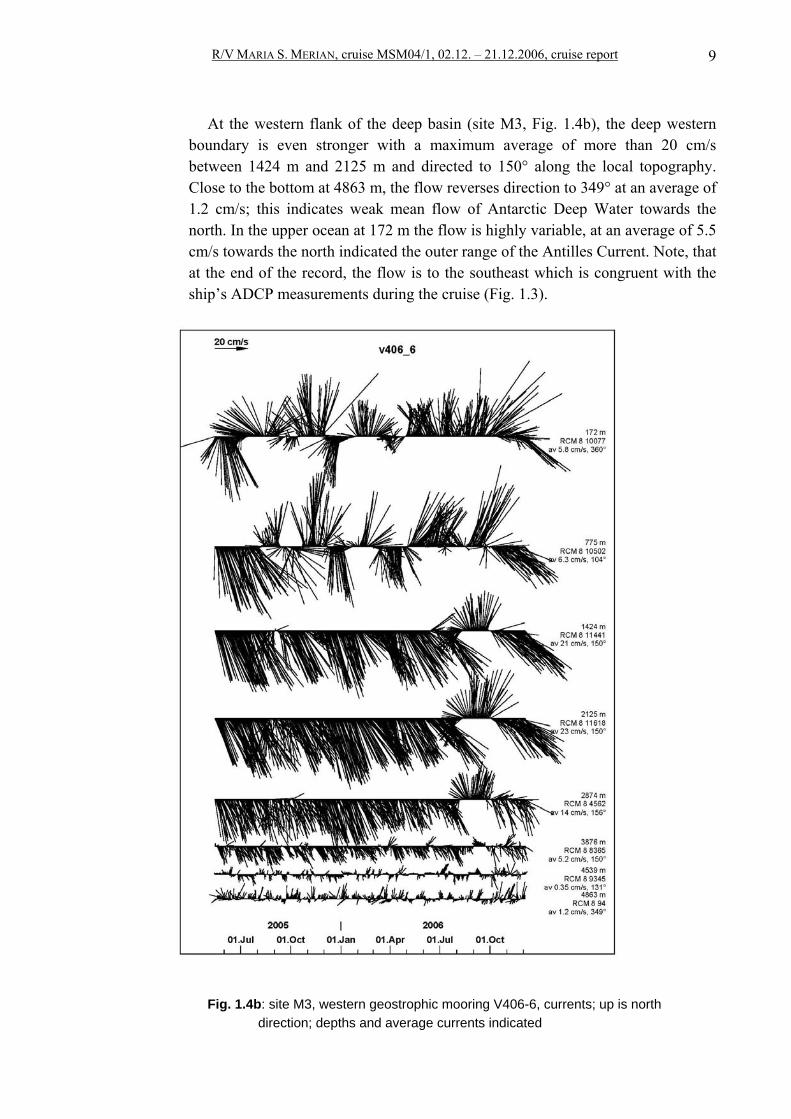
At the western flank of the deep basin (site M3, Fig. 1.4b), the deep western
boundary is even stronger with a maximum average of more than 20 cm/s between 1424 m and 2125 m and directed to 150° along the local topography. Close to the bottom at 4863 m, the flow reverses direction to 349° at an average of 1.2 cm/s; this indicates weak mean flow of Antarctic Deep Water towards the north. In the upper ocean at 172 m the flow is highly variable, at an average of 5.5 cm/s towards the north indicated the outer range of the Antilles Current. Note, that at the end of the record, the flow is to the southeast which is congruent with the ship’s ADCP measurements during the cruise (Fig. 1.3).
Fig. 1.4b: site M3, western geostrophic mooring V406-6, currents; up is north
direction; depths and average currents indicated
R/V MARIA S. MERIAN, cruise MSM04/1, 02.12. – 21.12.2006, cruise report 10
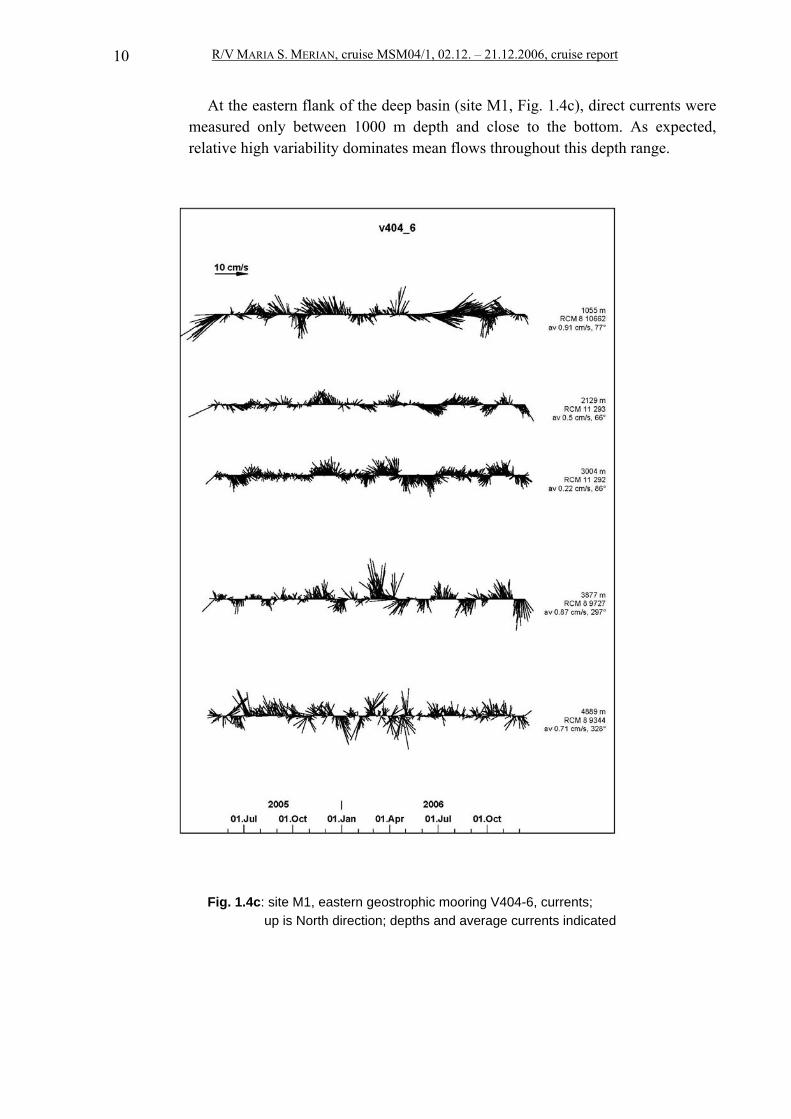
At the eastern flank of the deep basin (site M1, Fig. 1.4c), direct currents were measured only between 1000 m depth and close to the bottom. As expected, relative high variability dominates mean flows throughout this depth range.
Fig. 1.4c: site M1, eastern geostrophic mooring V404-6, currents;
up is North direction; depths and average currents indicated
R/V MARIA S. MERIAN, cruise MSM04/1, 02.12. – 21.12.2006, cruise report 11
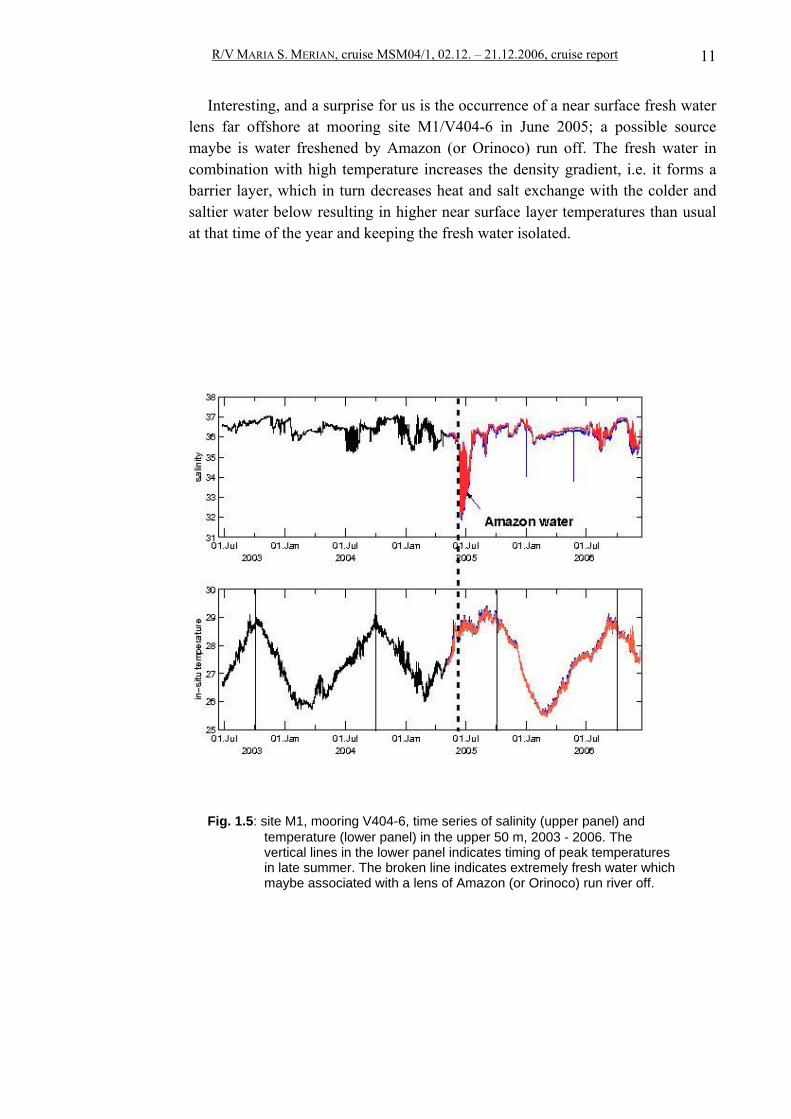
Interesting, and a surprise for us is the occurrence of a near surface fresh water lens far offshore at mooring site M1/V404-6 in June 2005; a possible source maybe is water freshened by Amazon (or Orinoco) run off. The fresh water in combination with high temperature increases the density gradient, i.e. it forms a barrier layer, which in turn decreases heat and salt exchange with the colder and saltier water below resulting in higher near surface layer temperatures than usual at that time of the year and keeping the fresh water isolated.
Fig. 1.5: site M1, mooring V404-6, time series of salinity (upper panel) and
temperature (lower panel) in the upper 50 m, 2003 - 2006. The vertical lines in the lower panel indicates timing of peak temperatures in late summer. The broken line indicates extremely fresh water which maybe associated with a lens of Amazon (or Orinoco) run river off.
R/V MARIA S. MERIAN, cruise MSM04/1, 02.12. – 21.12.2006, cruise report 12
1.4.3 Tomography
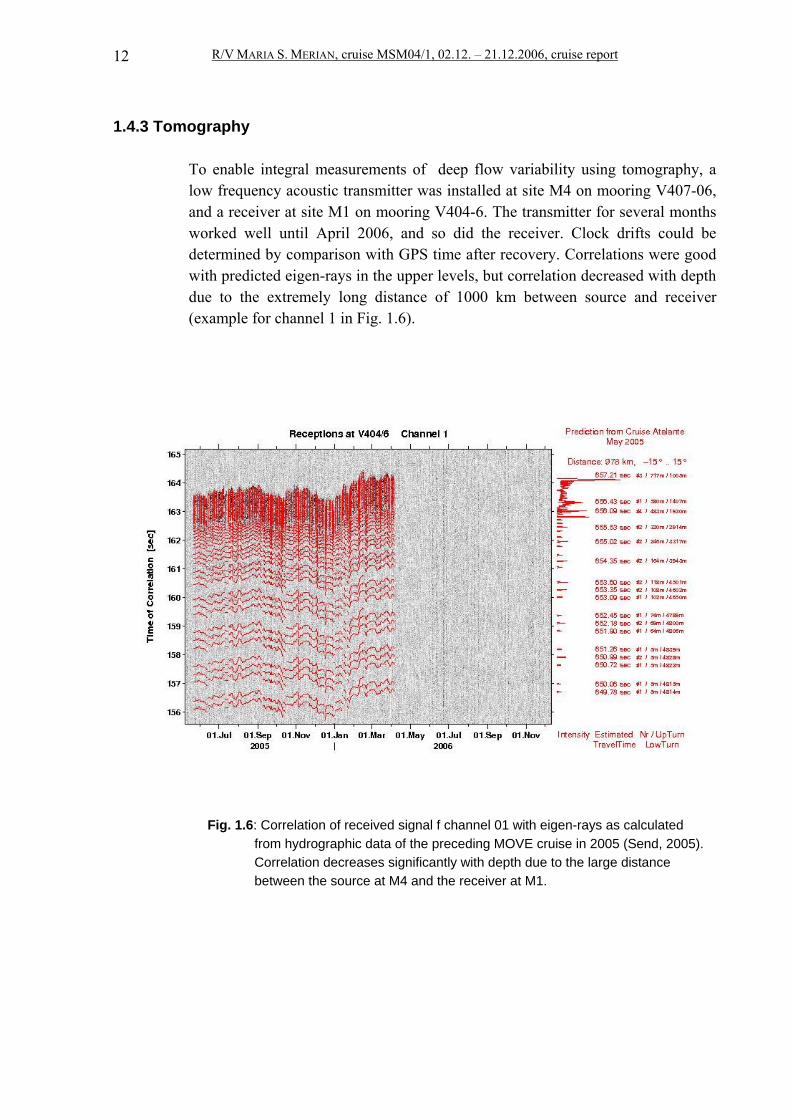
To enable integral measurements of deep flow variability using tomography, a low frequency acoustic transmitter was installed at site M4 on mooring V407-06, and a receiver at site M1 on mooring V404-6. The transmitter for several months worked well until April 2006, and so did the receiver. Clock drifts could be determined by comparison with GPS time after recovery. Correlations were good with predicted eigen-rays in the upper levels, but correlation decreased with depth due to the extremely long distance of 1000 km between source and receiver (example for channel 1 in Fig. 1.6).
Fig. 1.6: Correlation of received signal f channel 01 with eigen-rays as calculated
from hydrographic data of the preceding MOVE cruise in 2005 (Send, 2005). Correlation decreases significantly with depth due to the large distance between the source at M4 and the receiver at M1.
R/V MARIA S. MERIAN, cruise MSM04/1, 02.12. – 21.12.2006, cruise report 13
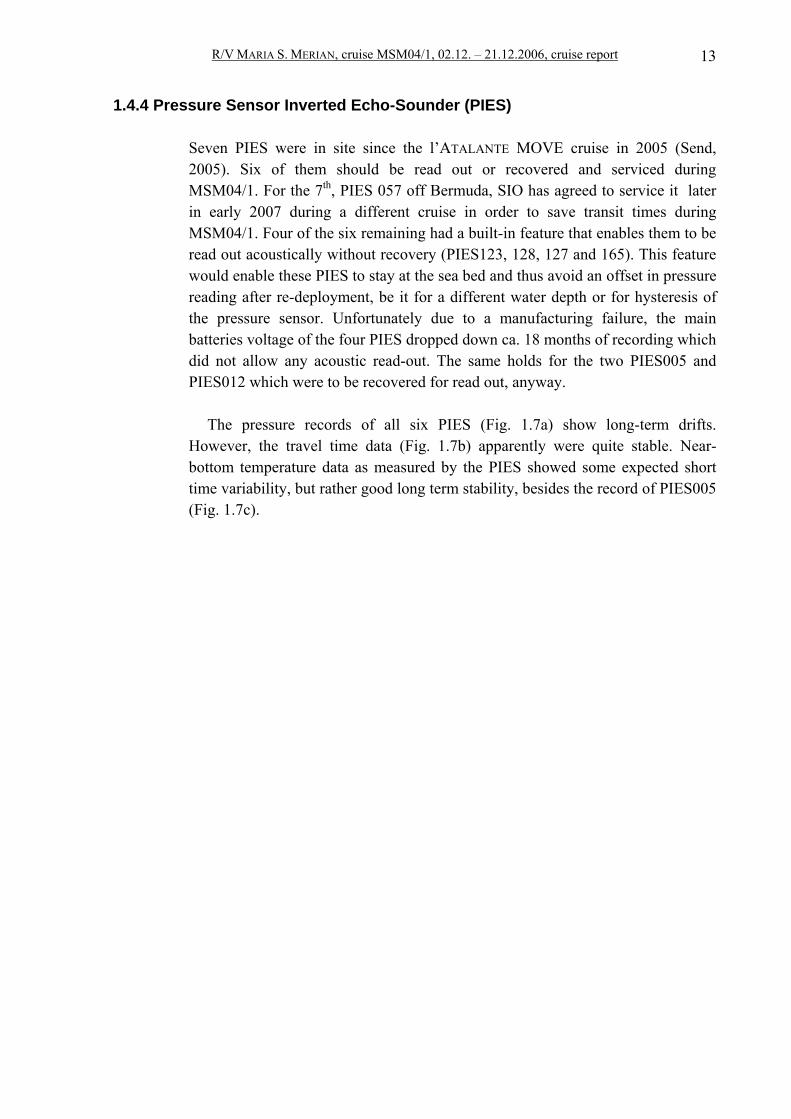
1.4.4 Pressure Sensor Inverted Echo-Sounder (PIES)
Seven PIES were in site since the l’ATALANTE MOVE cruise in 2005 (Send, 2005). Six of them should be read out or recovered and serviced during MSM04/1. For the 7th, PIES 057 off Bermuda, SIO has agreed to service it later in early 2007 during a different cruise in order to save transit times during MSM04/1. Four of the six remaining had a built-in feature that enables them to be read out acoustically without recovery (PIES123, 128, 127 and 165). This feature would enable these PIES to stay at the sea bed and thus avoid an offset in pressure reading after re-deployment, be it for a different water depth or for hysteresis of the pressure sensor. Unfortunately due to a manufacturing failure, the main batteries voltage of the four PIES dropped down ca. 18 months of recording which did not allow any acoustic read-out. The same holds for the two PIES005 and PIES012 which were to be recovered for read out, anyway.
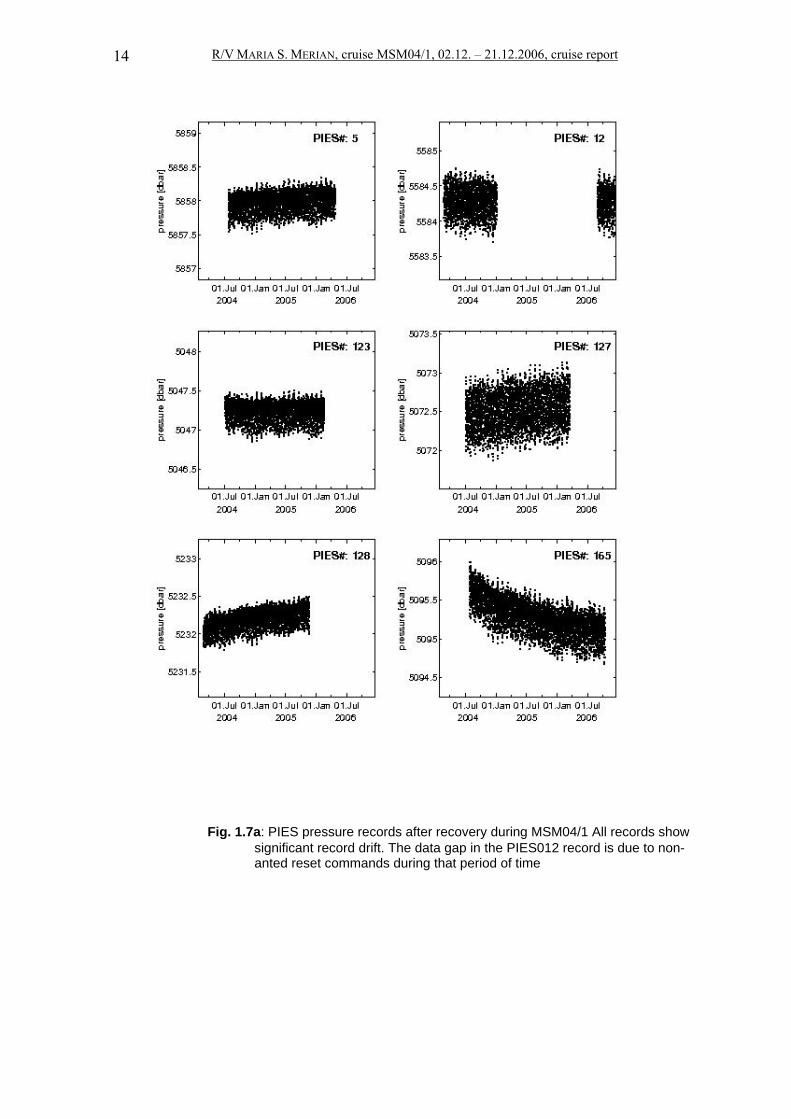
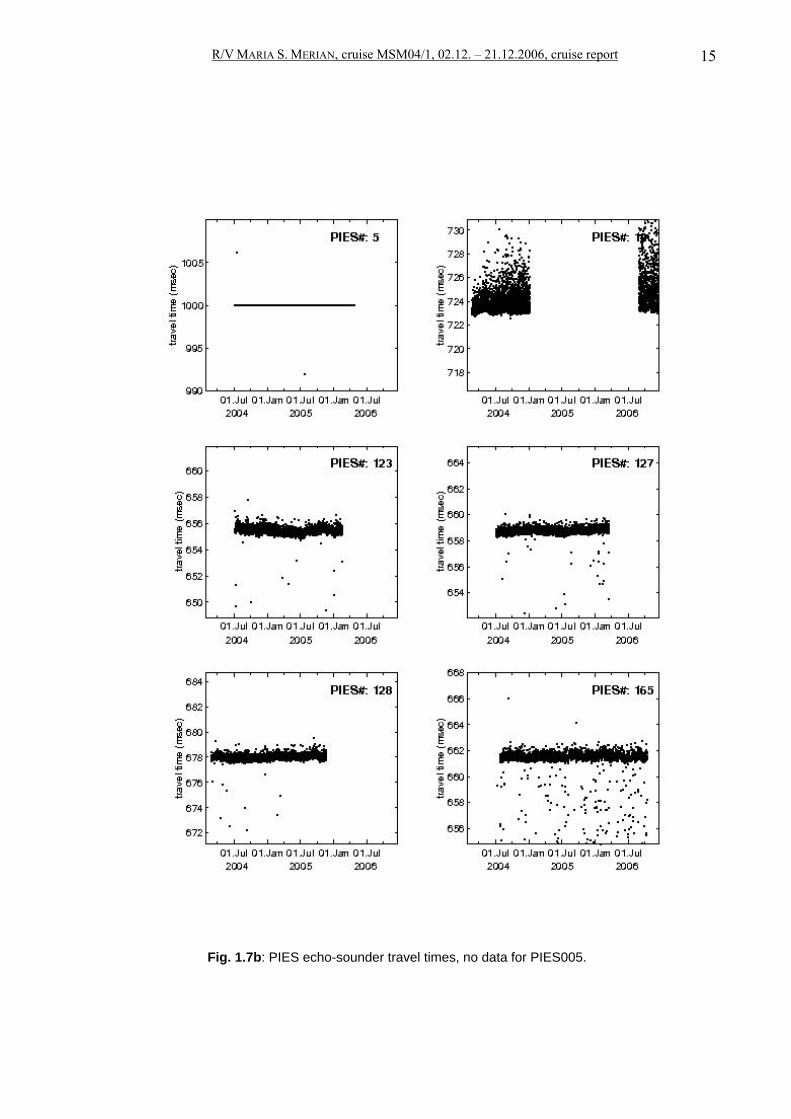
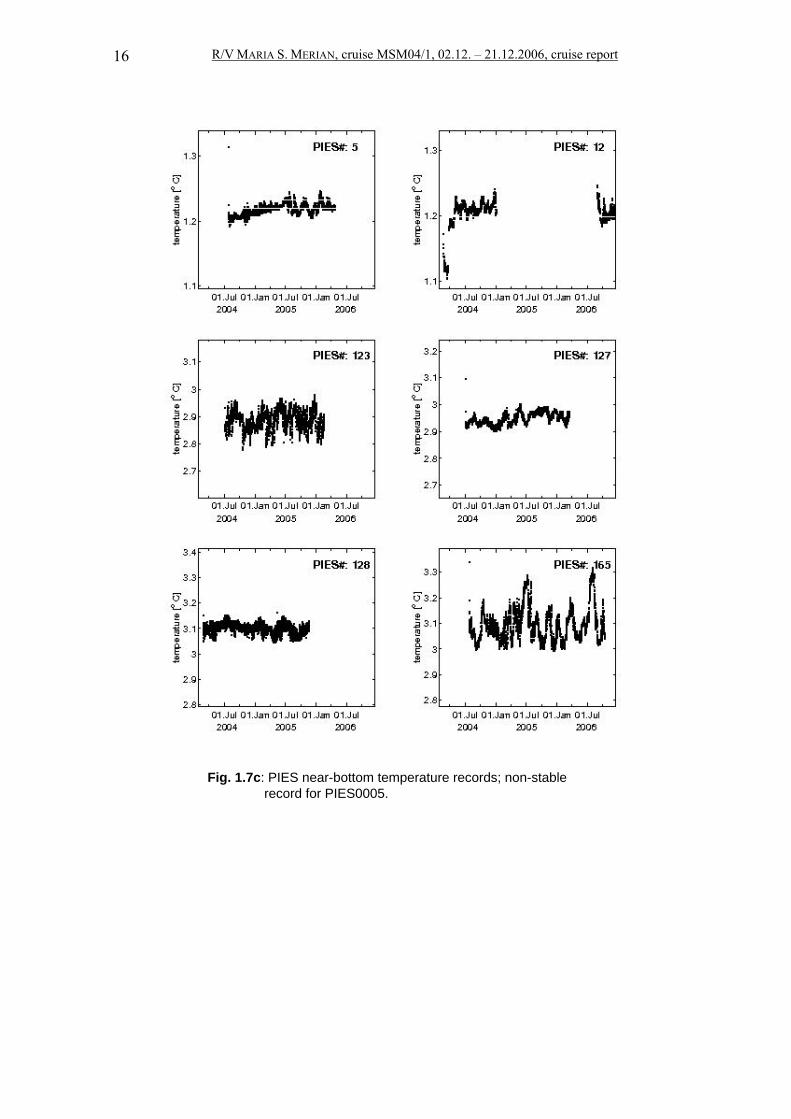
The pressure records of all six PIES (Fig. 1.7a) show long-term drifts. However, the travel time data (Fig. 1.7b) apparently were quite stable. Near-bottom temperature data as measured by the PIES showed some expected short time variability, but rather good long term stability, besides the record of PIES005 (Fig. 1.7c).
R/V MARIA S. MERIAN, cruise MSM04/1, 02.12. – 21.12.2006, cruise report 14
Fig. 1.7a: PIES pressure records after recovery during MSM04/1 All records show
significant record drift. The data gap in the PIES012 record is due to non- anted reset commands during that period of time
R/V MARIA S. MERIAN, cruise MSM04/1, 02.12. – 21.12.2006, cruise report 15
Fig. 1.7b: PIES echo-sounder travel times, no data for PIES005.
R/V MARIA S. MERIAN, cruise MSM04/1, 02.12. – 21.12.2006, cruise report 16
Fig. 1.7c: PIES near-bottom temperature records; non-stable
record for PIES0005.
R/V MARIA S. MERIAN, cruise MSM04/1, 02.12. – 21.12.2006, cruise report 17
1.4.5 Instrument Calibration and Data Processing 1.4.5.1 Ship borne CTD
The CTD used during MSM04/1 was a SeaBird 911 with pressure, temperature, conductivity and oxygen sensors. The pressure and temperature sensor were calibrated before the cruise at IFM-GEOMAR’s calibration lab to WOCE standard (WOCE, 1991). A 24x10 l bottle rosette (22 bottles attached only to have space of a lowered ADCP) served to sample water for in-situ calibration of conductivity (salinity) and dissolved oxygen. For salinity, an AUTOSAL 8400 Guildline salinometer was used with standard sea water batch P145, K15=0.99981, S=34.9926. The calibration and processing procedures followed that of the WOCE Hydrographic Office (WOCE, 1991; Müller, 1999). After applying pre-cruise laboratory calibrations for corrections and in-situ calibration with samples, we estimate the following accuracies of processed data interpolated to 1 dbar pressure intervals:
• Temperature : 0.002 K • Pressure : 0.1% of full range • Salinity : 0.003 psu • Dissolved oxygen : 5 μmol/l
1.4.5.2 Ship Borne ADCP
The hull mounted ship-borne ADCP is an RDI OCEAN SURVEYOR, 75 kHz. Several steps in processing were applied: first, raw data were converted for a convenient format. Next, navigational data were merged to ADCP data on the same time basis. The ship’s speed was estimated by differentiating GPS positions, and the misalignment of 48° was determined using time periods while the ship was ‘on station’, i.e. no large ship speeds are expected. Using the misalignment, data were converted to estimated true North and East components.
1.4.5.3 Lowered ADCP
From the beginning of the cruise on, two RDI WORKHORSE ADCP, 300 kHz, were mounted onto the rosette frame, one downward and one upward looking to measure the current profile on station (Fischer and Visbeck, 1993). Unfortunately the rosette during casts twisted extensively, and therefore and because of the lack of backscatter in the ‘blue’ ocean far offshore, no reliable data could be obtained. Only the last 5 casts, when the mechanical problems were overcome and the ship approached waters near the coast with better backscatter conditions, data quality increased and gave reliable data.
R/V MARIA S. MERIAN, cruise MSM04/1, 02.12. – 21.12.2006, cruise report 18
1.4.5.4 Moored CTD (MicroCats) and Temperature-Depth Recorders (MTD)
Instruments used are SeaBird made MicroCats (MC) and IFM-GEOMAR developed cheap and small Temperature-Depth-Recorder (MTD). Only three of all MCs had a non-complete data return. Data processing included to add artificial pressure records to those which lacked a pressure sensor a priori or had no reliable pressure measurements; all neighbouring instruments were used. Furthermore, all MCs and MTDs calibrations were corrected linearly using pre- and post-deployment calibration casts when attached to a CTD/rosette. At pre-determined pressure levels, the up-cast CTD was stopped for approximately 6 minutes allowing the MCs and MTDs sensors’ to adapt and thus allow data comparison at the chosen pressure level. Comparisons between pre- and post-cruise MC calibration casts show rather stable offsets which in return confirms the method.
1.4.5.5 Moored Current Meters (Aanderaa RCM8)
Aanderaa current meters RCM8 and the new generation RCM9 in addition to current speed and direction measure temperature (standard) and pressure (optional). In case of speed measurements with the RCM8, much of achievable accuracy depends on how the rotor movement is free of basic offset and trends due to fouling. As not much is known about the sensor’s behaviour during deployment, generally, the calibration sheets of the manufacturer were used to transfer 10-bit raw data to physical units. Nevertheless, experience shows that data are consistent in the vertical and therefore reliable. The same holds for current direction and for temperature measurements.
R/V MARIA S. MERIAN, cruise MSM04/1, 02.12. – 21.12.2006, cruise report 19
1.5 Underway data 1.5.1 Ship’s Meteorological Station (DWD)
The ship’s meteorological station is automated and non-manned. The station provides data to the underway data acquiring system DVS by WERUM and on an 2-hourly basis via METEOSAT into the Global Telecommunication System, GTS. The station is served and maintained by the German Weather Service (DWD) regularly on annual intervals. Sensors installed are
• Wind direction, located in the mast, 31 m above sea level, resolution 2.5 ° • Wind speed, location in the mast, 31 m above sea level, range 0 – 40 m/s. • Air pressure, mounted in the main box of the automated weather station on the
1st superstructure, separate inlet to sensor, temperature corrected, 0.5 hPa accuracy
• Air temperature, Pt-100 temperature sensor, located on the observational deck, 20 m above sea level
• Humidity, mounted in a shielded box close to the air temperature sensor, 20 m above sea level, electric sensor
• Water temperature, Pt-100 temperature sensor, located in the tank deck, 2 m below sea level
For more technical details see the ship’s handbook.
1.5.2 Radiation
Radiation is measured by three sensors: within the SMS-1A combined system made by MessSen Nord, Germany. Calibration and maintenance is surveyed by the Institut für Ostseeforschung, IOW, Warnemünde, Germany. The sensors are installed on the signal mast, 19.5 m above sea level in a hydraulically damped cardan suspension thus minimizing effects of pitch and roll in detecting the skyward looking spheric angle 180°. The sensors are
• Downward incoming global radiation (GS, shortwave) • Infrared radiation (IR, long-wave) • Photosysntetic available radiation (PAR)
1.5.3 Rain-meter
The rain-meter SRM 450/H is made by Eigenbrodt, Germany. It consists of a standard rain collecting funnel and a mass defining droplet counter (RAIN1). It is combined with a second cylindrical catching area including a second droplet counter (RAIN2). From RAIN2, the liquid water content can be estimated which
R/V MARIA S. MERIAN, cruise MSM04/1, 02.12. – 21.12.2006, cruise report 20
gives a correction for systematic errors in the RAIN1 measurement. The precipitation rate is then estimated from the guideline in the manual.
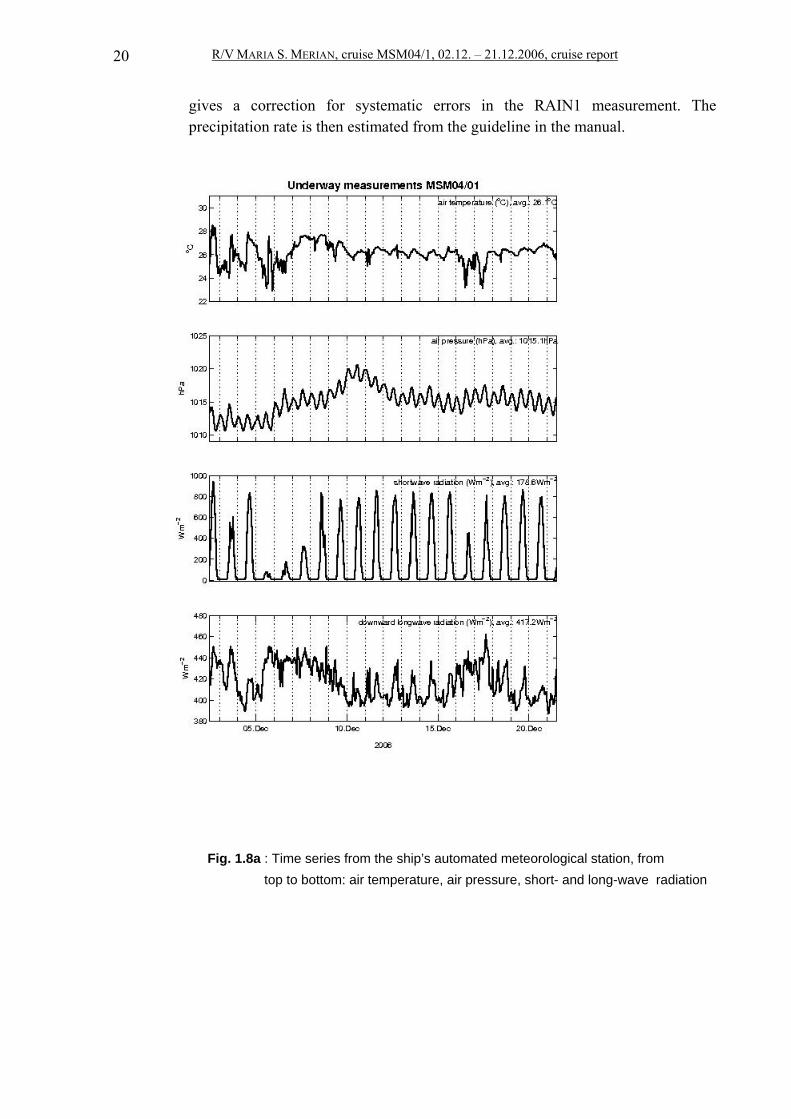
Fig. 1.8a : Time series from the ship’s automated meteorological station, from
top to bottom: air temperature, air pressure, short- and long-wave radiation
R/V MARIA S. MERIAN, cruise MSM04/1, 02.12. – 21.12.2006, cruise report 21
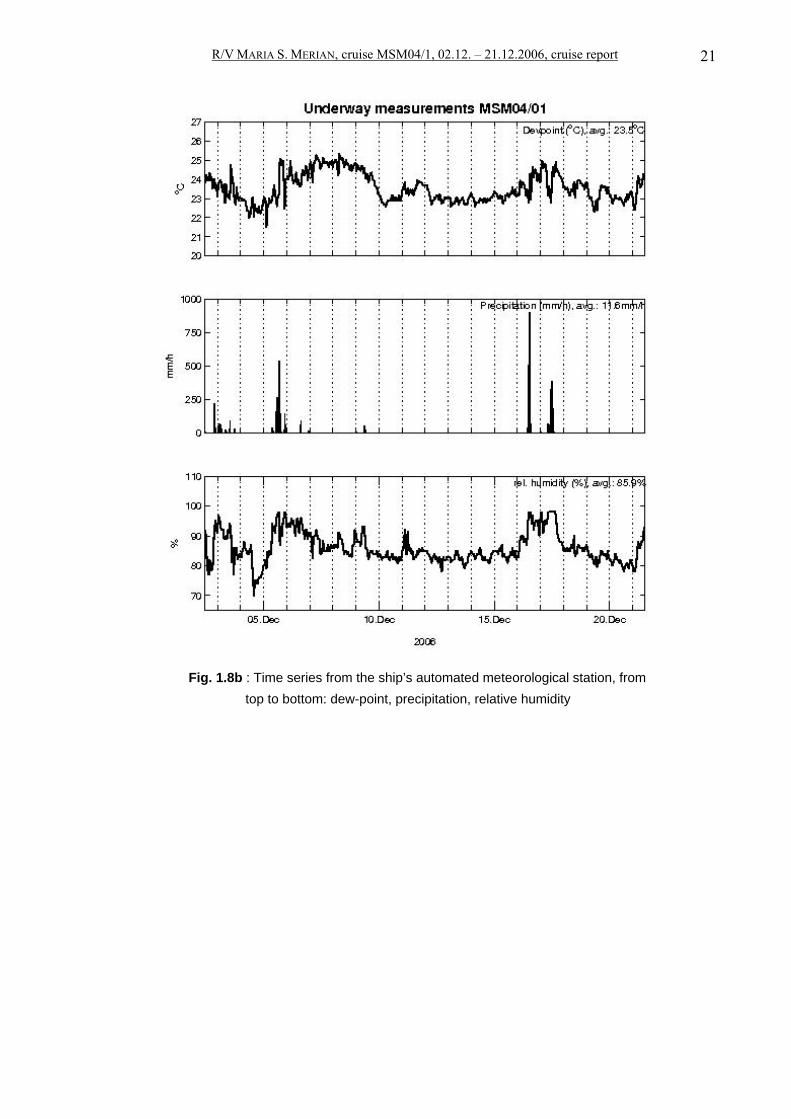
Fig. 1.8b : Time series from the ship’s automated meteorological station, from top to bottom: dew-point, precipitation, relative humidity
R/V MARIA S. MERIAN, cruise MSM04/1, 02.12. – 21.12.2006, cruise report 22
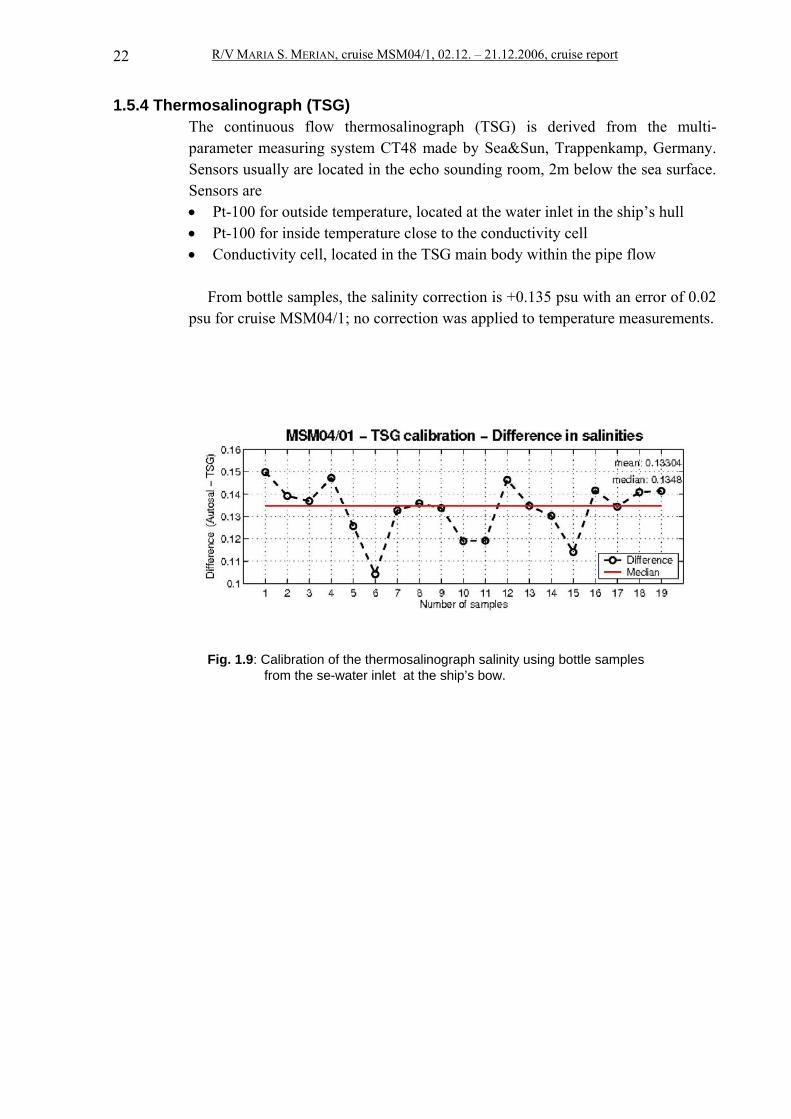
1.5.4 Thermosalinograph (TSG) The continuous flow thermosalinograph (TSG) is derived from the multi-parameter measuring system CT48 made by Sea&Sun, Trappenkamp, Germany. Sensors usually are located in the echo sounding room, 2m below the sea surface. Sensors are • Pt-100 for outside temperature, located at the water inlet in the ship’s hull • Pt-100 for inside temperature close to the conductivity cell • Conductivity cell, located in the TSG main body within the pipe flow
From bottle samples, the salinity correction is +0.135 psu with an error of 0.02
psu for cruise MSM04/1; no correction was applied to temperature measurements.
Fig. 1.9: Calibration of the thermosalinograph salinity using bottle samples
from the se-water inlet at the ship’s bow.
R/V MARIA S. MERIAN, cruise MSM04/1, 02.12. – 21.12.2006, cruise report 23
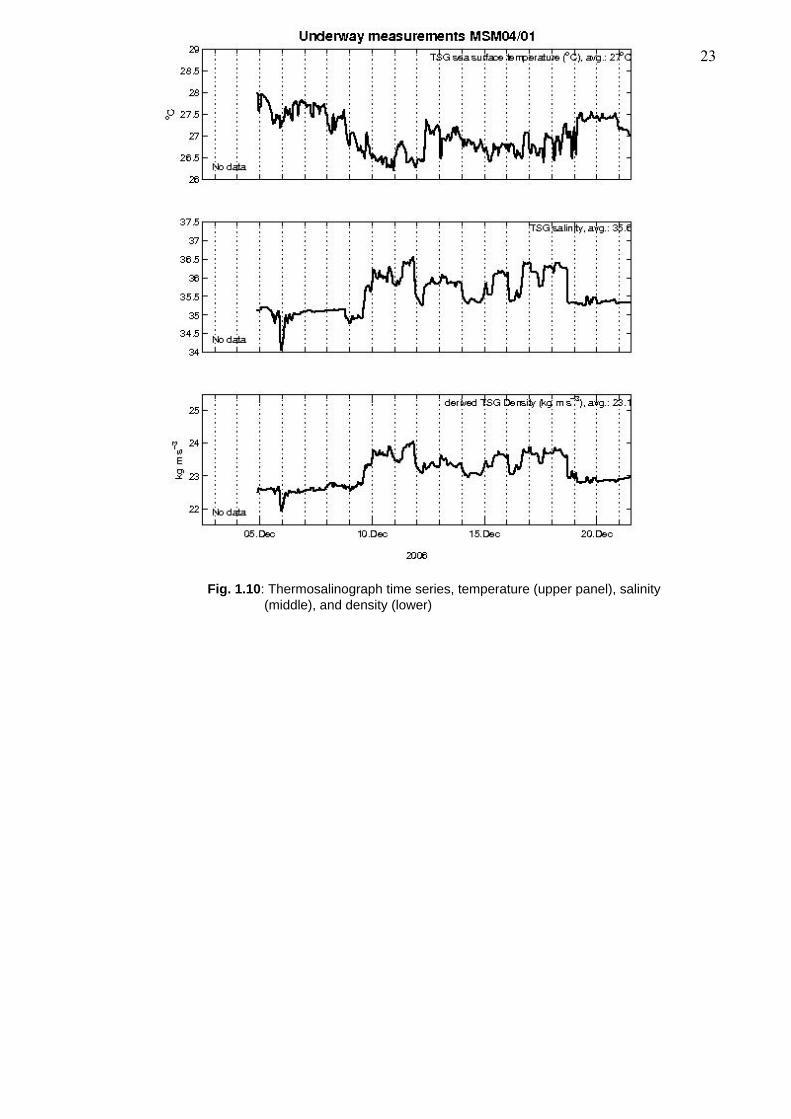
Fig. 1.10: Thermosalinograph time series, temperature (upper panel), salinity (middle), and density (lower)
R/V MARIA S. MERIAN, cruise MSM04/1, 02.12. – 21.12.2006, cruise report 24
R/V MARIA S. MERIAN, cruise MSM04/1, 02.12. – 21.12.2006, cruise report 25
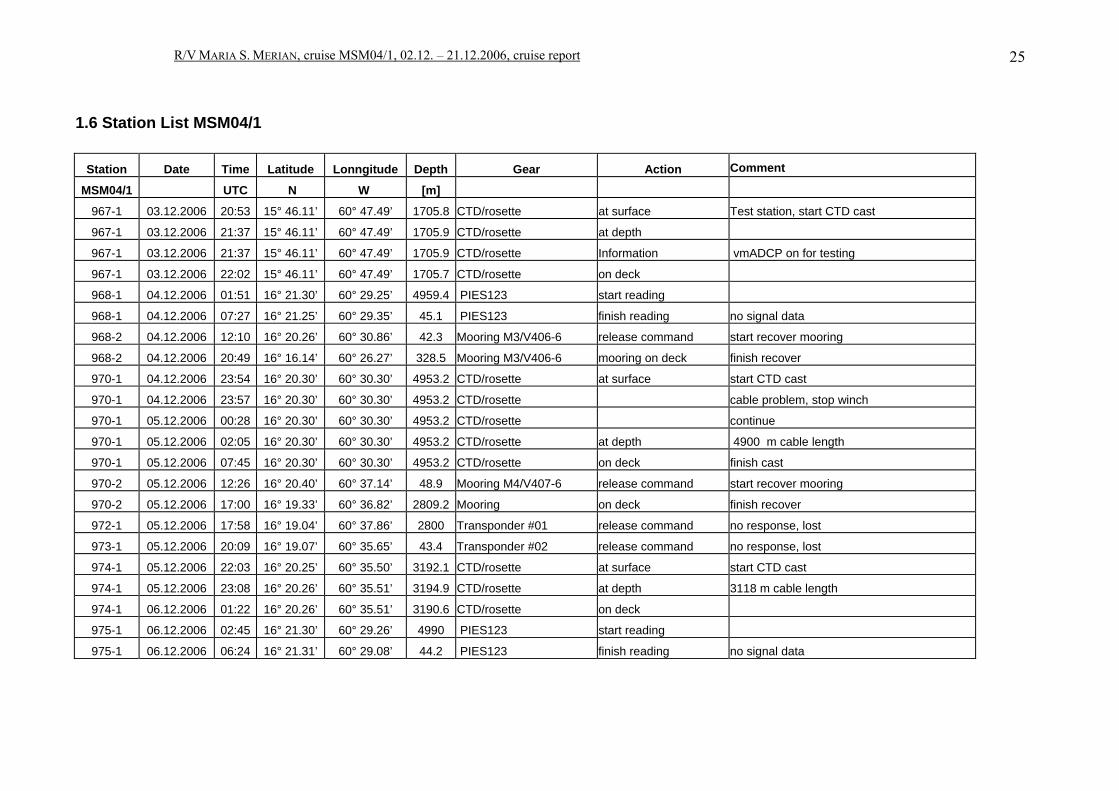
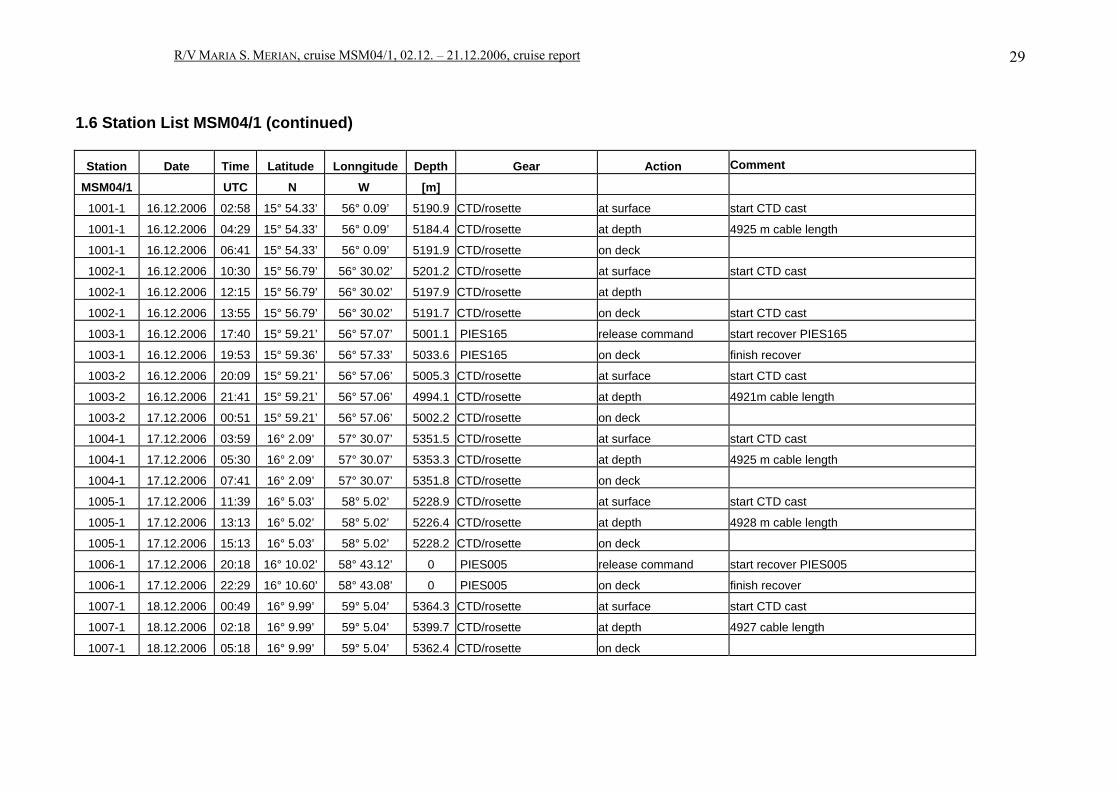
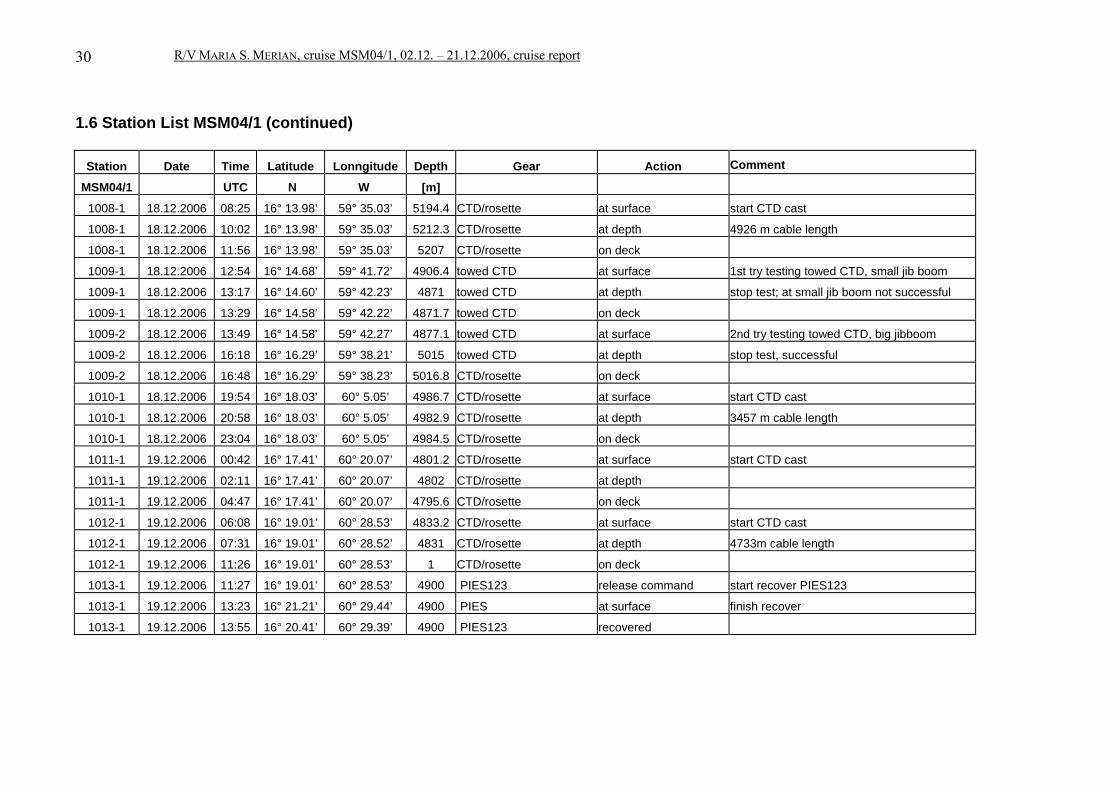
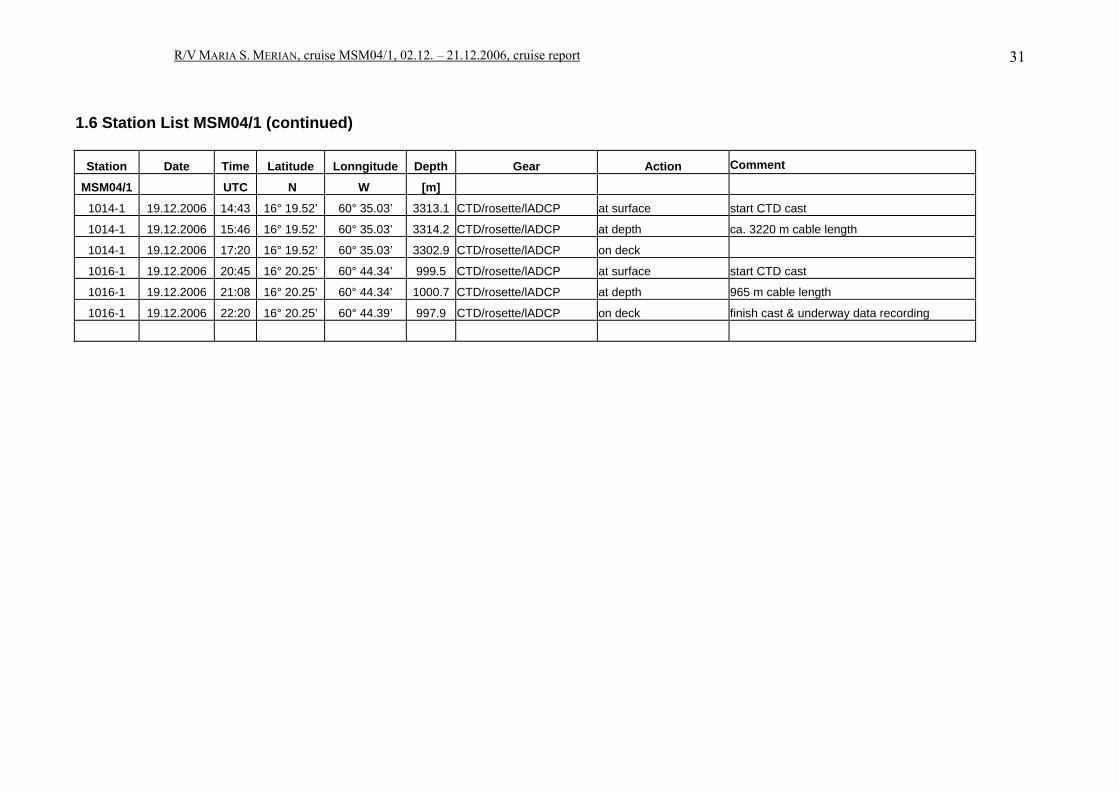
1.6 Station List MSM04/1
Station Date Time Latitude Lonngitude Depth Gear Action Comment
MSM04/1 UTC N W [m]
967-1 03.12.2006 20:53 15° 46.11’ 60° 47.49’ 1705.8 CTD/rosette at surface Test station, start CTD cast
967-1 03.12.2006 21:37 15° 46.11’ 60° 47.49’ 1705.9 CTD/rosette at depth
967-1 03.12.2006 21:37 15° 46.11’ 60° 47.49’ 1705.9 CTD/rosette Information vmADCP on for testing
967-1 03.12.2006 22:02 15° 46.11’ 60° 47.49’ 1705.7 CTD/rosette on deck
968-1 04.12.2006 01:51 16° 21.30’ 60° 29.25’ 4959.4 PIES123 start reading
968-1 04.12.2006 07:27 16° 21.25’ 60° 29.35’ 45.1 PIES123 finish reading no signal data
968-2 04.12.2006 12:10 16° 20.26’ 60° 30.86’ 42.3 Mooring M3/V406-6 release command start recover mooring
968-2 04.12.2006 20:49 16° 16.14’ 60° 26.27’ 328.5 Mooring M3/V406-6 mooring on deck finish recover
970-1 04.12.2006 23:54 16° 20.30’ 60° 30.30’ 4953.2 CTD/rosette at surface start CTD cast
970-1 04.12.2006 23:57 16° 20.30’ 60° 30.30’ 4953.2 CTD/rosette cable problem, stop winch
970-1 05.12.2006 00:28 16° 20.30’ 60° 30.30’ 4953.2 CTD/rosette continue
970-1 05.12.2006 02:05 16° 20.30’ 60° 30.30’ 4953.2 CTD/rosette at depth 4900 m cable length
970-1 05.12.2006 07:45 16° 20.30’ 60° 30.30’ 4953.2 CTD/rosette on deck finish cast
970-2 05.12.2006 12:26 16° 20.40’ 60° 37.14’ 48.9 Mooring M4/V407-6 release command start recover mooring
970-2 05.12.2006 17:00 16° 19.33’ 60° 36.82’ 2809.2 Mooring on deck finish recover
972-1 05.12.2006 17:58 16° 19.04’ 60° 37.86’ 2800 Transponder #01 release command no response, lost
973-1 05.12.2006 20:09 16° 19.07’ 60° 35.65’ 43.4 Transponder #02 release command no response, lost
974-1 05.12.2006 22:03 16° 20.25’ 60° 35.50’ 3192.1 CTD/rosette at surface start CTD cast
974-1 05.12.2006 23:08 16° 20.26’ 60° 35.51’ 3194.9 CTD/rosette at depth 3118 m cable length
974-1 06.12.2006 01:22 16° 20.26’ 60° 35.51’ 3190.6 CTD/rosette on deck
975-1 06.12.2006 02:45 16° 21.30’ 60° 29.26’ 4990 PIES123 start reading
975-1 06.12.2006 06:24 16° 21.31’ 60° 29.08’ 44.2 PIES123 finish reading no signal data
R/V MARIA S. MERIAN, cruise MSM04/1, 02.12. – 21.12.2006, cruise report 26
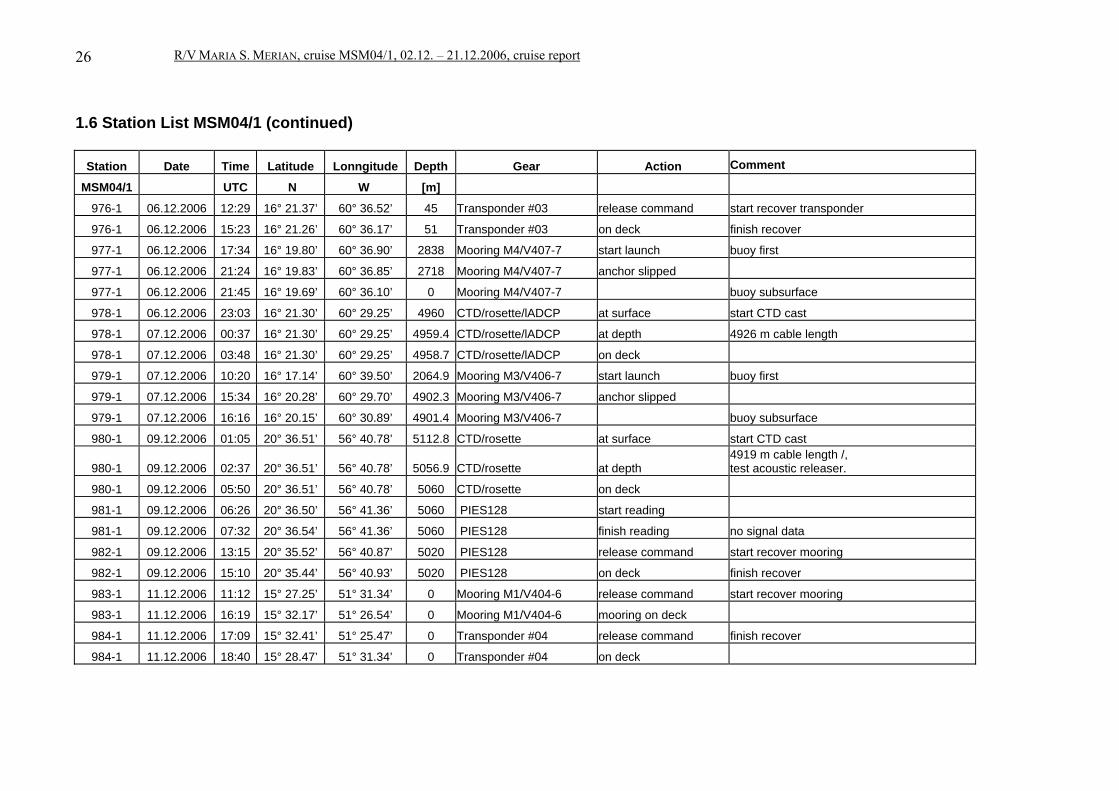
1.6 Station List MSM04/1 (continued)
Station Date Time Latitude Lonngitude Depth Gear Action Comment
MSM04/1 UTC N W [m]
976-1 06.12.2006 12:29 16° 21.37’ 60° 36.52’ 45 Transponder #03 release command start recover transponder
976-1 06.12.2006 15:23 16° 21.26’ 60° 36.17’ 51 Transponder #03 on deck finish recover
977-1 06.12.2006 17:34 16° 19.80’ 60° 36.90’ 2838 Mooring M4/V407-7 start launch buoy first
977-1 06.12.2006 21:24 16° 19.83’ 60° 36.85’ 2718 Mooring M4/V407-7 anchor slipped
977-1 06.12.2006 21:45 16° 19.69’ 60° 36.10’ 0 Mooring M4/V407-7 buoy subsurface
978-1 06.12.2006 23:03 16° 21.30’ 60° 29.25’ 4960 CTD/rosette/lADCP at surface start CTD cast
978-1 07.12.2006 00:37 16° 21.30’ 60° 29.25’ 4959.4 CTD/rosette/lADCP at depth 4926 m cable length
978-1 07.12.2006 03:48 16° 21.30’ 60° 29.25’ 4958.7 CTD/rosette/lADCP on deck
979-1 07.12.2006 10:20 16° 17.14’ 60° 39.50’ 2064.9 Mooring M3/V406-7 start launch buoy first
979-1 07.12.2006 15:34 16° 20.28’ 60° 29.70’ 4902.3 Mooring M3/V406-7 anchor slipped
979-1 07.12.2006 16:16 16° 20.15’ 60° 30.89’ 4901.4 Mooring M3/V406-7 buoy subsurface
980-1 09.12.2006 01:05 20° 36.51’ 56° 40.78’ 5112.8 CTD/rosette at surface start CTD cast
980-1 09.12.2006 02:37 20° 36.51’ 56° 40.78’ 5056.9 CTD/rosette at depth 4919 m cable length /, test acoustic releaser.
980-1 09.12.2006 05:50 20° 36.51’ 56° 40.78’ 5060 CTD/rosette on deck
981-1 09.12.2006 06:26 20° 36.50’ 56° 41.36’ 5060 PIES128 start reading
981-1 09.12.2006 07:32 20° 36.54’ 56° 41.36’ 5060 PIES128 finish reading no signal data
982-1 09.12.2006 13:15 20° 35.52’ 56° 40.87’ 5020 PIES128 release command start recover mooring
982-1 09.12.2006 15:10 20° 35.44’ 56° 40.93’ 5020 PIES128 on deck finish recover
983-1 11.12.2006 11:12 15° 27.25’ 51° 31.34’ 0 Mooring M1/V404-6 release command start recover mooring
983-1 11.12.2006 16:19 15° 32.17’ 51° 26.54’ 0 Mooring M1/V404-6 mooring on deck
984-1 11.12.2006 17:09 15° 32.41’ 51° 25.47’ 0 Transponder #04 release command finish recover
984-1 11.12.2006 18:40 15° 28.47’ 51° 31.34’ 0 Transponder #04 on deck
R/V MARIA S. MERIAN, cruise MSM04/1, 02.12. – 21.12.2006, cruise report 27
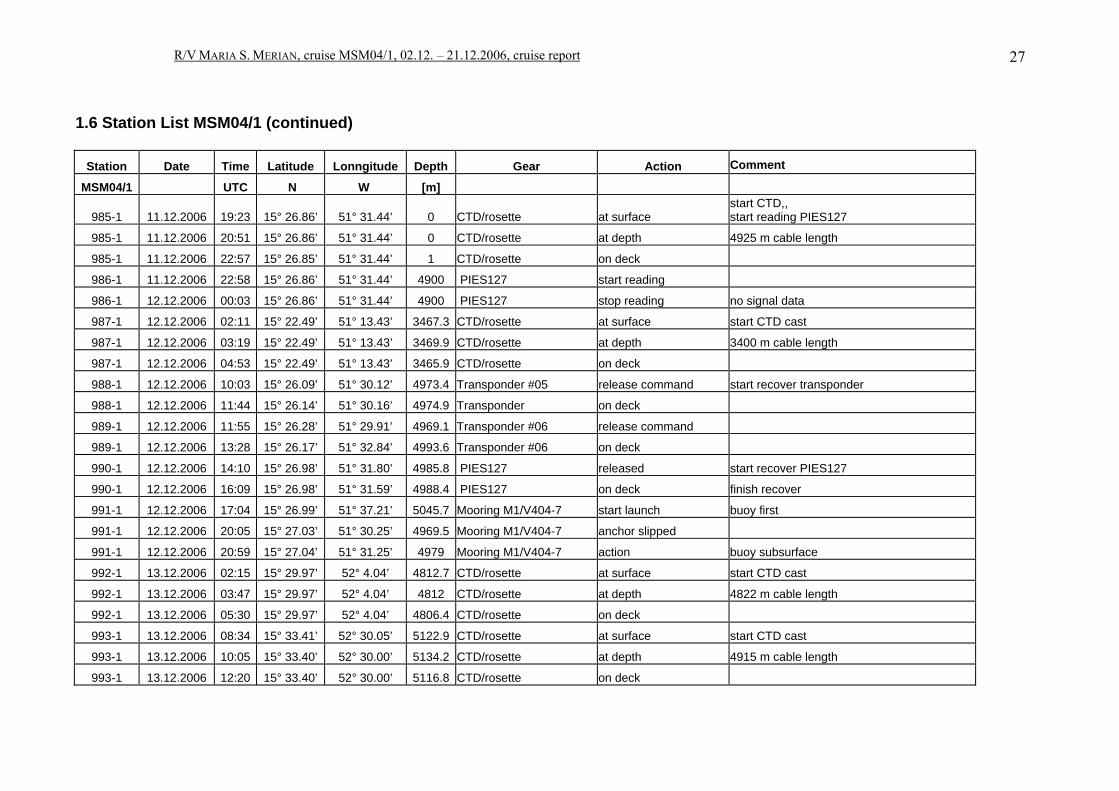
1.6 Station List MSM04/1 (continued)
Station Date Time Latitude Lonngitude Depth Gear Action Comment
MSM04/1 UTC N W [m]
985-1 11.12.2006 19:23 15° 26.86’ 51° 31.44’ 0 CTD/rosette at surface start CTD,, start reading PIES127
985-1 11.12.2006 20:51 15° 26.86’ 51° 31.44’ 0 CTD/rosette at depth 4925 m cable length
985-1 11.12.2006 22:57 15° 26.85’ 51° 31.44’ 1 CTD/rosette on deck
986-1 11.12.2006 22:58 15° 26.86’ 51° 31.44’ 4900 PIES127 start reading
986-1 12.12.2006 00:03 15° 26.86’ 51° 31.44’ 4900 PIES127 stop reading no signal data
987-1 12.12.2006 02:11 15° 22.49’ 51° 13.43’ 3467.3 CTD/rosette at surface start CTD cast
987-1 12.12.2006 03:19 15° 22.49’ 51° 13.43’ 3469.9 CTD/rosette at depth 3400 m cable length
987-1 12.12.2006 04:53 15° 22.49’ 51° 13.43’ 3465.9 CTD/rosette on deck
988-1 12.12.2006 10:03 15° 26.09’ 51° 30.12’ 4973.4 Transponder #05 release command start recover transponder
988-1 12.12.2006 11:44 15° 26.14’ 51° 30.16’ 4974.9 Transponder on deck
989-1 12.12.2006 11:55 15° 26.28’ 51° 29.91’ 4969.1 Transponder #06 release command
989-1 12.12.2006 13:28 15° 26.17’ 51° 32.84’ 4993.6 Transponder #06 on deck
990-1 12.12.2006 14:10 15° 26.98’ 51° 31.80’ 4985.8 PIES127 released start recover PIES127
990-1 12.12.2006 16:09 15° 26.98’ 51° 31.59’ 4988.4 PIES127 on deck finish recover
991-1 12.12.2006 17:04 15° 26.99’ 51° 37.21’ 5045.7 Mooring M1/V404-7 start launch buoy first
991-1 12.12.2006 20:05 15° 27.03’ 51° 30.25’ 4969.5 Mooring M1/V404-7 anchor slipped
991-1 12.12.2006 20:59 15° 27.04’ 51° 31.25’ 4979 Mooring M1/V404-7 action buoy subsurface
992-1 13.12.2006 02:15 15° 29.97’ 52° 4.04’ 4812.7 CTD/rosette at surface start CTD cast
992-1 13.12.2006 03:47 15° 29.97’ 52° 4.04’ 4812 CTD/rosette at depth 4822 m cable length
992-1 13.12.2006 05:30 15° 29.97’ 52° 4.04’ 4806.4 CTD/rosette on deck
993-1 13.12.2006 08:34 15° 33.41’ 52° 30.05’ 5122.9 CTD/rosette at surface start CTD cast
993-1 13.12.2006 10:05 15° 33.40’ 52° 30.00’ 5134.2 CTD/rosette at depth 4915 m cable length
993-1 13.12.2006 12:20 15° 33.40’ 52° 30.00’ 5116.8 CTD/rosette on deck
R/V MARIA S. MERIAN, cruise MSM04/1, 02.12. – 21.12.2006, cruise report 28
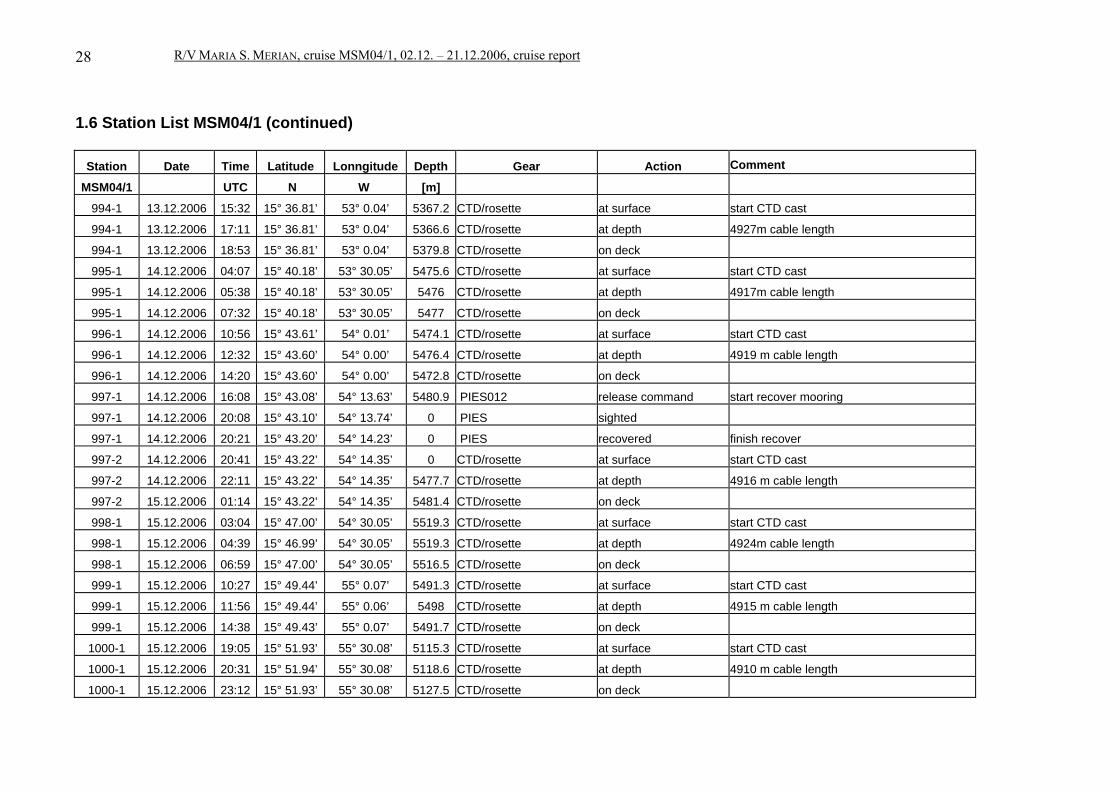
1.6 Station List MSM04/1 (continued)
Station Date Time Latitude Lonngitude Depth Gear Action Comment
MSM04/1 UTC N W [m]
994-1 13.12.2006 15:32 15° 36.81’ 53° 0.04’ 5367.2 CTD/rosette at surface start CTD cast
994-1 13.12.2006 17:11 15° 36.81’ 53° 0.04’ 5366.6 CTD/rosette at depth 4927m cable length
994-1 13.12.2006 18:53 15° 36.81’ 53° 0.04’ 5379.8 CTD/rosette on deck
995-1 14.12.2006 04:07 15° 40.18’ 53° 30.05’ 5475.6 CTD/rosette at surface start CTD cast
995-1 14.12.2006 05:38 15° 40.18’ 53° 30.05’ 5476 CTD/rosette at depth 4917m cable length
995-1 14.12.2006 07:32 15° 40.18’ 53° 30.05’ 5477 CTD/rosette on deck
996-1 14.12.2006 10:56 15° 43.61’ 54° 0.01’ 5474.1 CTD/rosette at surface start CTD cast
996-1 14.12.2006 12:32 15° 43.60’ 54° 0.00’ 5476.4 CTD/rosette at depth 4919 m cable length
996-1 14.12.2006 14:20 15° 43.60’ 54° 0.00’ 5472.8 CTD/rosette on deck
997-1 14.12.2006 16:08 15° 43.08’ 54° 13.63’ 5480.9 PIES012 release command start recover mooring
997-1 14.12.2006 20:08 15° 43.10’ 54° 13.74’ 0 PIES sighted
997-1 14.12.2006 20:21 15° 43.20’ 54° 14.23’ 0 PIES recovered finish recover
997-2 14.12.2006 20:41 15° 43.22’ 54° 14.35’ 0 CTD/rosette at surface start CTD cast
997-2 14.12.2006 22:11 15° 43.22’ 54° 14.35’ 5477.7 CTD/rosette at depth 4916 m cable length
997-2 15.12.2006 01:14 15° 43.22’ 54° 14.35’ 5481.4 CTD/rosette on deck
998-1 15.12.2006 03:04 15° 47.00’ 54° 30.05’ 5519.3 CTD/rosette at surface start CTD cast
998-1 15.12.2006 04:39 15° 46.99’ 54° 30.05’ 5519.3 CTD/rosette at depth 4924m cable length
998-1 15.12.2006 06:59 15° 47.00’ 54° 30.05’ 5516.5 CTD/rosette on deck
999-1 15.12.2006 10:27 15° 49.44’ 55° 0.07’ 5491.3 CTD/rosette at surface start CTD cast
999-1 15.12.2006 11:56 15° 49.44’ 55° 0.06’ 5498 CTD/rosette at depth 4915 m cable length
999-1 15.12.2006 14:38 15° 49.43’ 55° 0.07’ 5491.7 CTD/rosette on deck
1000-1 15.12.2006 19:05 15° 51.93’ 55° 30.08’ 5115.3 CTD/rosette at surface start CTD cast
1000-1 15.12.2006 20:31 15° 51.94’ 55° 30.08’ 5118.6 CTD/rosette at depth 4910 m cable length
1000-1 15.12.2006 23:12 15° 51.93’ 55° 30.08’ 5127.5 CTD/rosette on deck
R/V MARIA S. MERIAN, cruise MSM04/1, 02.12. – 21.12.2006, cruise report 29
1.6 Station List MSM04/1 (continued)
Station Date Time Latitude Lonngitude Depth Gear Action Comment
MSM04/1 UTC N W [m]
1001-1 16.12.2006 02:58 15° 54.33’ 56° 0.09’ 5190.9 CTD/rosette at surface start CTD cast
1001-1 16.12.2006 04:29 15° 54.33’ 56° 0.09’ 5184.4 CTD/rosette at depth 4925 m cable length
1001-1 16.12.2006 06:41 15° 54.33’ 56° 0.09’ 5191.9 CTD/rosette on deck
1002-1 16.12.2006 10:30 15° 56.79’ 56° 30.02’ 5201.2 CTD/rosette at surface start CTD cast
1002-1 16.12.2006 12:15 15° 56.79’ 56° 30.02’ 5197.9 CTD/rosette at depth
1002-1 16.12.2006 13:55 15° 56.79’ 56° 30.02’ 5191.7 CTD/rosette on deck start CTD cast
1003-1 16.12.2006 17:40 15° 59.21’ 56° 57.07’ 5001.1 PIES165 release command start recover PIES165
1003-1 16.12.2006 19:53 15° 59.36’ 56° 57.33’ 5033.6 PIES165 on deck finish recover
1003-2 16.12.2006 20:09 15° 59.21’ 56° 57.06’ 5005.3 CTD/rosette at surface start CTD cast
1003-2 16.12.2006 21:41 15° 59.21’ 56° 57.06’ 4994.1 CTD/rosette at depth 4921m cable length
1003-2 17.12.2006 00:51 15° 59.21’ 56° 57.06’ 5002.2 CTD/rosette on deck
1004-1 17.12.2006 03:59 16° 2.09’ 57° 30.07’ 5351.5 CTD/rosette at surface start CTD cast
1004-1 17.12.2006 05:30 16° 2.09’ 57° 30.07’ 5353.3 CTD/rosette at depth 4925 m cable length
1004-1 17.12.2006 07:41 16° 2.09’ 57° 30.07’ 5351.8 CTD/rosette on deck
1005-1 17.12.2006 11:39 16° 5.03’ 58° 5.02’ 5228.9 CTD/rosette at surface start CTD cast
1005-1 17.12.2006 13:13 16° 5.02’ 58° 5.02’ 5226.4 CTD/rosette at depth 4928 m cable length
1005-1 17.12.2006 15:13 16° 5.03’ 58° 5.02’ 5228.2 CTD/rosette on deck
1006-1 17.12.2006 20:18 16° 10.02’ 58° 43.12’ 0 PIES005 release command start recover PIES005
1006-1 17.12.2006 22:29 16° 10.60’ 58° 43.08’ 0 PIES005 on deck finish recover
1007-1 18.12.2006 00:49 16° 9.99’ 59° 5.04’ 5364.3 CTD/rosette at surface start CTD cast
1007-1 18.12.2006 02:18 16° 9.99’ 59° 5.04’ 5399.7 CTD/rosette at depth 4927 cable length
1007-1 18.12.2006 05:18 16° 9.99’ 59° 5.04’ 5362.4 CTD/rosette on deck
R/V MARIA S. MERIAN, cruise MSM04/1, 02.12. – 21.12.2006, cruise report 30
1.6 Station List MSM04/1 (continued)
Station Date Time Latitude Lonngitude Depth Gear Action Comment
MSM04/1 UTC N W [m]
1008-1 18.12.2006 08:25 16° 13.98’ 59° 35.03’ 5194.4 CTD/rosette at surface start CTD cast
1008-1 18.12.2006 10:02 16° 13.98’ 59° 35.03’ 5212.3 CTD/rosette at depth 4926 m cable length
1008-1 18.12.2006 11:56 16° 13.98’ 59° 35.03’ 5207 CTD/rosette on deck
1009-1 18.12.2006 12:54 16° 14.68’ 59° 41.72’ 4906.4 towed CTD at surface 1st try testing towed CTD, small jib boom
1009-1 18.12.2006 13:17 16° 14.60’ 59° 42.23’ 4871 towed CTD at depth stop test; at small jib boom not successful
1009-1 18.12.2006 13:29 16° 14.58’ 59° 42.22’ 4871.7 towed CTD on deck
1009-2 18.12.2006 13:49 16° 14.58’ 59° 42.27’ 4877.1 towed CTD at surface 2nd try testing towed CTD, big jibboom
1009-2 18.12.2006 16:18 16° 16.29’ 59° 38.21’ 5015 towed CTD at depth stop test, successful
1009-2 18.12.2006 16:48 16° 16.29’ 59° 38.23’ 5016.8 CTD/rosette on deck
1010-1 18.12.2006 19:54 16° 18.03’ 60° 5.05’ 4986.7 CTD/rosette at surface start CTD cast
1010-1 18.12.2006 20:58 16° 18.03’ 60° 5.05’ 4982.9 CTD/rosette at depth 3457 m cable length
1010-1 18.12.2006 23:04 16° 18.03’ 60° 5.05’ 4984.5 CTD/rosette on deck
1011-1 19.12.2006 00:42 16° 17.41’ 60° 20.07’ 4801.2 CTD/rosette at surface start CTD cast
1011-1 19.12.2006 02:11 16° 17.41’ 60° 20.07’ 4802 CTD/rosette at depth
1011-1 19.12.2006 04:47 16° 17.41’ 60° 20.07’ 4795.6 CTD/rosette on deck
1012-1 19.12.2006 06:08 16° 19.01’ 60° 28.53’ 4833.2 CTD/rosette at surface start CTD cast
1012-1 19.12.2006 07:31 16° 19.01’ 60° 28.52’ 4831 CTD/rosette at depth 4733m cable length
1012-1 19.12.2006 11:26 16° 19.01’ 60° 28.53’ 1 CTD/rosette on deck
1013-1 19.12.2006 11:27 16° 19.01’ 60° 28.53’ 4900 PIES123 release command start recover PIES123
1013-1 19.12.2006 13:23 16° 21.21’ 60° 29.44’ 4900 PIES at surface finish recover
1013-1 19.12.2006 13:55 16° 20.41’ 60° 29.39’ 4900 PIES123 recovered
R/V MARIA S. MERIAN, cruise MSM04/1, 02.12. – 21.12.2006, cruise report 31
1.6 Station List MSM04/1 (continued)
Station Date Time Latitude Lonngitude Depth Gear Action Comment
MSM04/1 UTC N W [m]
1014-1 19.12.2006 14:43 16° 19.52’ 60° 35.03’ 3313.1 CTD/rosette/lADCP at surface start CTD cast
1014-1 19.12.2006 15:46 16° 19.52’ 60° 35.03’ 3314.2 CTD/rosette/lADCP at depth ca. 3220 m cable length
1014-1 19.12.2006 17:20 16° 19.52’ 60° 35.03’ 3302.9 CTD/rosette/lADCP on deck
1016-1 19.12.2006 20:45 16° 20.25’ 60° 44.34’ 999.5 CTD/rosette/lADCP at surface start CTD cast
1016-1 19.12.2006 21:08 16° 20.25’ 60° 44.34’ 1000.7 CTD/rosette/lADCP at depth 965 m cable length
1016-1 19.12.2006 22:20 16° 20.25’ 60° 44.39’ 997.9 CTD/rosette/lADCP on deck finish cast & underway data recording
R/V MARIA S. MERIAN, cruise MSM04/1, 02.12. – 21.12.2006, cruise report 32
R/V MARIA S. MERIAN, cruise MSM04/1, 02.12. – 21.12.2006, cruise report 33
1.7 Acknowledgements
The MOVE project has been funded by the German government (BMBF) and the German Research Foundation (DFG). We thank the coastal states governments for their support. both with clearance and logistics. Last not least the new ship with its master and helpful crew let us feel well and look forward optimistically for the scientific evaluation in the future.
1.8 References
Clarke, A., J. Church, J. Gould (2001): Ocean processes and climate phenomena. In: Siedler, G. et al. (Hsg.) Ocean circulation and climate. Academic Press, San Diego, 11-30.
Fischer, J. and M. Visbeck, 1993: Deep velocity profiling with self-contained ADCPs, J. Atmosph. and Oceanic Technol., 10, 764-773. Johns, W.E., T. Kanzow , R. Zantopp, 2005: Estimating Ocean Transports with Dynamic Height Moorings: An Application in the Atlantic Deep Western Boundary Current at 26°N. Deep Sea Res. I, 52, 8, 1542-1657.
Kanzow , T., Send , U., Zenk , W., Rhein, M., Chave, A.D., 2004: Monitoring the integrated deep meridional flow in the tropical North Atlantic: Long-term performance of a geostrophic array. Deep-Sea Res. I.
Müller, T.J., 1999: Determination of Salinity. In: Methods of Seawater Analysis, Grasshoff, K., K. Kremling, M. Ehrhardt (editors), Wiley, 600 pp.
Send, U., 2005: MOVE (Meridional Overturning Variability Experiment). l’ATALANTE, 28.04.-16.05.2005); cruise report.
WOCE, 1991: World Ocean Circulation Experiment, WOCE Operations Manual, Vol. 3, Section 3.1 WOCE Hydrographic Programme, Part 3.1.3, WHP Operations and Methods. WOCE Rep. No. 68/91.
IFM-GEOMAR Reports No. Title
1 RV Sonne Fahrtbericht / Cruise Report SO 176 & 179 MERAMEX I & II (Merapi Amphibious Experiment) 18.05.-01.06.04 & 16.09.-07.10.04. Ed. by Heidrun Kopp & Ernst R. Flueh, 2004, 206 pp. In English
2 RV Sonne Fahrtbericht / Cruise Report SO 181 TIPTEQ (from The Incoming Plate to mega Thrust EarthQuakes) 06.12.2004.-26.02.2005. Ed. by Ernst R. Flueh & Ingo Grevemeyer, 2005, 533 pp. In English
3 RV Poseidon Fahrtbericht / Cruise Report POS 316 Carbonate Mounds and Aphotic Corals in the NE-Atlantic 03.08.–17.08.2004. Ed. by Olaf Pfannkuche & Christine Utecht, 2005, 64 pp. In English
4 RV Sonne Fahrtbericht / Cruise Report SO 177 - (Sino-German Cooperative Project, South China Sea: Distribution, Formation and Effect of Methane & Gas Hydrate on the Environment) 02.06.-20.07.2004. Ed. by Erwin Suess, Yongyang Huang, Nengyou Wu, Xiqiu Han & Xin Su, 2005, 154 pp. In English and Chinese
5 RV Sonne Fahrtbericht / Cruise Report SO 186 – GITEWS (German Indonesian Tsunami Early Warning System 28.10.-13.1.2005 & 15.11.-28.11.2005 & 07.01.-20.01.2006. Ed. by Ernst R. Flueh, Tilo Schoene & Wilhelm Weinrebe, 2006, 169 pp. In English
6 RV Sonne Fahrtbericht / Cruise Report SO 186 -3 – SeaCause II, 26.02.-16.03.2006. Ed. by Heidrun Kopp & Ernst R. Flueh, 2006, 174 pp. In English
7 RV Meteor, Fahrtbericht / Cruise Report M67/1 CHILE-MARGIN-SURVEY 20.02.-13.03.2006. Ed. by Wilhelm Weinrebe und Silke Schenk, 2006, 112 pp. In English
8 RV Sonne Fahrtbericht / Cruise Report SO 190 - SINDBAD (Seismic and Geoacoustic Investigations Along The Sunda-Banda Arc Transition) 10.11.2006 - 24.12.2006. Ed. by Heidrun Kopp & Ernst R. Flueh, 2006, 193 pp. In English
9 RV Sonne Fahrtbericht / Cruise Report SO 191 - New Vents "Puaretanga Hou" 11.01. - 23.03.2007. Ed. by Jörg Bialas, Jens Greinert, Peter Linke, Olaf Pfannkuche, 2007, 190 pp. In English
10 FS ALKOR Fahrtbericht / Cruise Report AL 275 - Geobiological
investigations and sampling of aphotic coral reef ecosystems in the NE- Skagerrak, 24.03. - 30.03.2006, Andres Rüggeberg & Armin Form, 39 pp. In English
11 FS Sonne / Fahrtbericht / Cruise Report SO 192-1: MANGO: Marine Geoscientific Investigations on the Input and Output of the Kermadec Subduction Zone, 24.03. - 22.04.2007, Ernst Flüh & Heidrun Kopp, 127 pp. In English
12 FS Maria S. Merian / Fahrtbericht / Cruise Report MSM 04-2: Seismic Wide-Angle Profiles, Fort-de-France – Fort-de-France, 03.01. - 19.01.2007, Ernst Flüh, 45 pp. In English
13 FS Sonne / Fahrtbericht / Cruise Report SO 193: MANIHIKI Temporal, Spatial, and Tectonic Evolution of Oceanic Plateaus, Suva/Fiji – Apia/Samoa 19.05. - 30.06.2007, Reinhard Werner and Folkmar Hauff, 201 pp. In English
14 FS Sonne / Fahrtbericht / Cruise Report SO195: TOTAL TOnga Thrust earthquake Asperity at Louisville Ridge, Suva/Fiji – Suva/Fiji 07.01. - 16.02.2008, Ingo Grevemeyer & Ernst R. Flüh, xx pp. In English
15 RV Poseidon Fahrtbericht / Cruise Report P362-2: West Nile Delta Mud Volcanoes, Piräus – Heraklion 09.02. - 25.02.2008, Thomas Feseker, 63 pp. In English
16 RV Poseidon Fahrtbericht / Cruise Report P347: Mauritanian Upwelling and Mixing Process Study (MUMP), Las-Palmas - Las Palmas, 18.01. - 05.02.2007, Marcus Dengler et al., 34 pp. In English
Das Leibniz-Institut für Meereswissenschaftenist ein Institut der WissenschaftsgemeinschaftGottfried Wilhelm Leibniz (WGL)
The Leibniz-Institute of Marine Sciences is a member of the Leibniz Association(Wissenschaftsgemeinschaft Gottfried Wilhelm Leibniz).
Leibniz-Institut für Meereswissenschaften / Leibniz-Institute of Marine SciencesIFM-GEOMAR Dienstgebäude Westufer / West Shore BuildingDüsternbrooker Weg 20D-24105 KielGermany
Leibniz-Institut für Meereswissenschaften / Leibniz-Institute of Marine SciencesIFM-GEOMAR Dienstgebäude Ostufer / East Shore BuildingWischhofstr. 1-3D-24148 KielGermany
Tel.: ++49 431 600-0Fax: ++49 431 600-2805www.ifm-geomar.de