idh: tea - lei wageningen impact study kenya (2012)
DESCRIPTION
Lei Wageningen study on the impact of Rainforest Alliance certification and Farmer Field School methodology in Kenya through measuring the difference of the difference methodology.TRANSCRIPT

Sustainable tea production in KenyaImpact assessment of Rainforest Alliance and Farmer Field School training

Sustainable tea production in Kenya Impact assessment of Rainforest Alliance and
Farmer Field School training
Yuca Waarts
Lan Ge
Giel Ton
Don Jansen Plant Research International, part of Wageningen UR
LEI report 2012-043
June 2012
Project code 2273000285
LEI Wageningen UR, The Hague

3
Sustainable tea production in Kenya: Impact assessment of Rainforest Alliance and Farmer Field School training Waarts, Y., L. Ge, G. Ton and D. Jansen LEI report 2012-043 ISBN/EAN: 978-90-8615-589-7 Price € 29,95 (including 6% VAT) 143 p., fig., tab., app.

4
This study was commissioned by the Netherlands Ministry of Economic Affairs, Agriculture and Innovation through the Royal Netherlands Embassy in Nairobi, Kenya under contract number NAI-04-03-01. The project title is: The Scalability of Sustainable Tea Value Chain in Kenya. The project is part of the implementation of the LNV-DGIS policy document 'Agriculture, Rural entrepreneurship and Food Security'.
Photo cover: Mr. Davies Onduru, ETC East Africa Orders +31 70 3358330 [email protected] This publication is available at www.lei.wur.nl/uk © LEI, part of Stichting Landbouwkundig Onderzoek (DLO foundation), 2012 Reproduction of contents, either whole or in part, is permitted with due reference to the source. LEI is ISO 9001:2008 certified.
5
Contents
List of acronyms 8
Preface 9
Summary 11 S.1 Key findings 11 S.2 Methodology 13
1 Introduction 15 1.1 Aim of KTDA 15 1.2 Aim of Rainforest Alliance 16 1.3 Information on FFS training and RA training and certification 17
1.3.1 Farmer Field School training 17 1.3.2 Training by RA 18 1.3.3 Difference between FFS training and RA training 19
1.4 Aim of the study 20 1.5 Logic model 20 1.6 Outline 21
2 Methodology 23 2.1 General approach 23 2.2 Sampling 24 2.3 Data analysis 28
3 Descriptive statistics 31 3.1 Group characteristics 31 3.2 Participation in training activities 32 3.3 Experiments 34

6
4 Knowledge of Good Agricultural Practices (GAPs) 37 4.1 Introduction 37 4.2 Knowledge scores 37 4.3 Focus group discussions on knowledge obtained from training activities 40 4.4 Knowledge sharing 41
5 Implementation of Good Agricultural Practices 43 5.1 Scores for the implementation of GAPs 43 5.2 Examples of adoption of production GAPs between training groups 46 5.3 Examples of adoption of social practices between training groups 49 5.4 Examples of adoption of environmental GAPs between training groups 51 5.5 Overall scores for implementation of sustainability practices 53 5.6 Focus group discussion results on adoption of GAPs 55
6 Production and income 56 6.1 Introduction 56 6.2 Production 56 6.3 Rejections as a proxy indicator for quality of tea 57 6.4 Fertilizer application and cost 59 6.5 Organic fertilizer application 60 6.6 Application of crop protection products 61 6.7 Labour 61 6.8 Input/output ratios 63 6.9 Income 64
7 Livelihood 69
8 Evaluation by farmers of impact of FFS and RA training 74 8.1 Evaluation by farmers of the impact of Farmer Field Schools 74 8.2 Evaluation by farmers of the impact of Rainforest Alliance 75

7
9 Conclusions 78 9.1 Impact of training activities on farmers' knowledge of GAPs 78 9.2 Impact of training activities on farmers' implementation of GAPs 79 9.3 Impact of training activities on farmers' use of inputs 80 9.4 Impact of training activities on farmers' production and income 81 9.5 Impact of training activities on farmers' livelihoods 82 9.6 Farmers' evaluation of FFS training 82 9.7 Farmers' evaluation of RA training 82
10 Recommendations 84 10.1 Methodology and data quality 84 10.2 A broader perspective on training outcomes 86
Appendices 89 1 Good Agricultural Practices recommended by KTDA 89 2 Impact assessment questionnaire 92 2b Focus group questionnaire 126 3 Sustainability questions and score 129 4 Experiments 131 5 Knowledge of Good Agricultural Practices (GAPs) 133 6 Scores on the different indicators for GAPs per training group 134 7 Self-assessment of livelihood aspects in the groups (pre-training) 138 8 Regression analysis on the changes in different indicators 139

8
List of acronyms FFS - Farmer Field School FSCs - Field Services Coordinators GAPs - Good Agricultural Practices IDH - The Sustainable Trade Initiative KSh - Kenyan shilling KTDA - Kenya Tea Development Agency M&E - Monitoring and evaluation PPE - Personal Protective Equipment RA - Rainforest Alliance SAN - Sustainable Agriculture Network TESAs - Tea Extension Services Assistants
9
Preface In 2006 the Kenya Tea Development Agency (KTDA) and Lipton jointly started a pilot project with funding from the UK government in Kenya. This pilot project introduced Farmer Field Schools (FFS) as extension method, which aimed to improve the sustainability of tea production by increasing the rate of adoption of Good Agricultural Practices (GAPs) and to improve the profitability of small-holder tea producers. Because this pilot was a success,1 the FFS approach was up-scaled from 2010 onwards throughout the KTDA factory system of 54 factory companies in 'the Scalability of Sustainable Tea Value Chain in Kenya' project. This activity was supported by the Netherlands Ministry of Economic Affairs, Agriculture and Innovation through the Royal Netherlands Embassy in Nairobi, Kenya. Early 2012, more than 500 Farmer Field Schools have been organized and implemented, reaching more than 15,000 smallholder farm households. Next to up-scaling Farmer Field Schools, KTDA, Unilever and Rainforest Alliance (RA), assisted by the Sustainable Trade Initiative (IDH), started with training farmers in 2010 so that the tea factories and the smallholders would become Rainforest Alliance certified under group certification schemes. Early 2012, 28 out of 54 factory companies have been audited and are now Rainforest Alliance certified, and 19 factories are preparing for certification. Within the RA training and certification programme (funded by IDH and other parties), 598 KTDA staff and 1669 Lead Farmers were trained up to June 2012, targeting more than 480,000 smallholder tea farmers Because all parties involved expressed an interest to track whether the FFS approach and the training for RA certification indeed makes a difference in sustainability outcomes for smallholder tea producers, LEI Wageningen UR has been asked to conduct an impact assessment of both activities. We are grateful that the Netherlands Ministry of Economic Affairs, Agriculture and Innovation through the Royal Netherlands Embassy in Nairobi, Kenya provided the funds to do this research as part of the 'the Scalability of Sustainable Tea Value Chain in Kenya' project.
1 See Hiller, S., D.D. Onduru and A. de Jager, 2008. Sustainable tea production; An assessment of Farmer Field Schools in Kenya. LEI report 2008-078.

10
LEI has conducted a baseline assessment in July 2010, and collected data for the impact assessment in February 2012. This report presents the rationale, methodology and results of the impact assessment study. We are greatly indebted to the information from and assistance of the farmers, KTDA factory staff and KTDA management and the hard work done by the enumerators to collect data. Without this, we would not have been able to do this study. We also wish to thank the Rainforest Alliance team in the UK and Kenya for providing us with information on the RA training and certification approach in Kenya and feedback to the questionnaire and reports. Special thanks go to Mr Davies Onduru from ETC-East Africa who has assisted us greatly with his knowledge of the developments in the tea sector since 2006 and in gathering good quality data. Last but not least, we are grateful for the opportunity to discuss sustainable tea production issues with Unilever Kenya Ltd-Tea Division and Egerton University staff en students. L.C. van Staalduinen MSc Managing Director LEI Wageningen UR

11
Summary
S.1 Key findings Knowledge on Good Agricultural Practices (GAPs) Farmers who participated in both Rainforest Alliance (RA) training and Farmer Field School (FFS) training had the highest increase in knowledge of GAPs between 2010 and 2012, followed by farmers who participated only in the RA training. Farmers trained for RA certification also had a significantly higher knowledge level in 2012 than the other groups. Farmers in the training groups experimented significantly more with agricultural activities than farmers in the comparison group. More farmers in the training groups, especially in the FFS training group, shared knowledge with other farmers than those in the comparison group (see Chapter 4). Implementation of GAPs Both RA training and FFS training improved production practices, as shown by the increased adoption of GAPs. Farmers who had received RA + FFS training and farmers who had received only FFS training improved their production practice significantly more than their non-trained counterparts. However, there is no significant difference in the post-training situation among the training groups. The application of environmental GAPs has increased in all trained groups; the greatest increase occurred in the RA + FFS trained group. The RA + FFS trained group also scored significantly higher than the non-trained group on the overall environmental indicator in the post-training situation. Farmers in all trained groups increased significantly the implementation of social practices between 2010 and 2012, while no significant difference was observed in the non-trained group. Furthermore, the group that had received RA + FFS training and the group that had received only FFS training scored significantly higher on social practices than the comparison group in the post-training situation (see Chapter 5).
12
Input, production and income Farmers in the trained groups (RA + FFS trained, RA trained, and FFS trained) increased their chemical fertilizer application compared to the pre-training situation, while overall crop protection product application decreased among all farmers. Furthermore, RA or FFS trained farmers used significantly more hired labour for pruning and applying fertilizer in the post-training situation than farmers in the comparison group. Productivity (yield in kilogram per bush) increased for all groups, but the increase in productivity was the highest among farmers who both are members of an FFS and trained for RA certification, followed by farmers with only RA training. Leaf rejections declined significantly for all groups (including the non-trained groups), although the percentage of farmers whose green leaves were never rejected increased significantly in the groups RA farmers and FFS farmers (see Chapter 6). Calculated net income from tea production increased significantly in all training groups between 2010 and 2012. The largest differences were found in the FFS trained group and in the FFS + RA trained group. The increase of income was, however, larger for the non-trained group than for RA farmers. Next to the influence of other (e.g. agro-climatic) factors, another plausible explanation for this could be the much higher input costs (labour, fertilizers) in the RA trained group than in the comparison group (see Chapter 6). We cannot draw conclusions whether participation in training has impacted on the number of other sources of income because we do not have such data for 2010. However, especially the training groups have indicated that that they earn more from other sources of income in 2012 than in 2010 while especially the non-trained indicated that they earn less. This would indicate that trained farmers indeed have increased their income from other sources than tea production between 2010 and 2012 (see Chapter 6). Impact of training activities on farmers' livelihood Overall, significant improvements were observed for all livelihood indicators in a self-assessment by the farmers, except for the indicators 'your relations with your neighbours' (satisfaction was already very high) and 'access to self-help activities'. When looking at the three training groups, the perceived improvement of livelihood was the highest in the RA + FFS trained group, followed by the group with only FFS training and the group with only RA training. All trained groups had more indicators showing livelihood improvement than the comparison group (see Chapter 7).

13
Evaluation of FFS and RA training activities Overall, the farmers were very happy with the FFS training activities, although a point of attention could be the development of commercial activities by the FFSs. Almost all farmers indicated they benefitted from the FFS training. Farmers also mentioned challenges, but most of them can be overcome. The FFS developments are thus evaluated as very positive by the farmers, and that there is a scope for the future. We cannot conclude yet, however, that the FFS system can and will be maintained in the future from the study since the analysis is based on a small sample size and limited data covering a period of two years (see Chapter 8). Almost all farmers who have participated in RA training activities have evaluated the training as very positive and have indicated that they benefitted from it. A number of farmers did not see benefits yet, and based this on the fact that their factory has not been certified yet. It seems from discussion with KTDA factory staff from the two RA factories in this study that RA certification is already embedded in their factory system (audit costs, lead farmer costs, a programme for continuous improvement). Issues mentioned by the farmers for the future are to continue training, also in other topics than addressed now, have the right people at training activities (both spouses) and motivating farmers to participate by communication, certificates and tokens/refreshments offered. Challenges mentioned by factory staff include upfront investment costs (i.e. PPE), and having no reward for farmers for their participation. Credit facilities and premium price for RA tea would also be helpful (see Chapter 8).
S.2 Methodology In Kenya, two streams of activities have been undertaken to support farmers connected to the KTDA to enhance sustainability of their tea production practices and to contribute to sustainable tea value chains, namely Farmer Field Schools training (FFS) and Rainforest Alliance (RA) training and certification. LEI Wageningen UR together with other project partners developed a monitoring and evaluation (M&E) plan to monitor the training modalities, and to generate data to track the impact of both of these training models on knowledge levels, implementation of GAPs, production, income and livelihood.

14
This impact assessment used the difference in difference approach which relies upon the analysis of two sources of variations. First of all, we compare the new situation (February 2012) with the baseline situation (July 2010) to characterize the evolution. Second, we analyse the differences between the comparison groups and the treatment groups to account for contextual factors other than the training that might influence the process as described in the logic model. The comparison groups provide information for assessing the counterfactual situation for the treatment groups, namely: 'What would have happened to the households without the treatment?' Three treatment groups were distinguished in this study: the group that had received both RA and FFS training, the group that had received only RA training and the group that had received only FFS training.
15
1 Introduction The 'Scalability of Sustainable Tea Value Chain in Kenya' project has been implemented in Kenya among smallholder tea farmers in the West and East of Rift Valley for the last two years (2010 -2012). This project has been imple-mented in an integrated and synergistic way with the IDH1 funded Rainforest Alliance–KTDA–Unilever Initiative under one umbrella project framework: 'Kenya Tea Development Agency Sustainable Agriculture Project'. It builds on experience gained in a pilot activity by Lipton and the Kenya Tea Development Agency (KTDA) which ran between 2006 and 2008, and creates synergy with Rainforest Alliance Certification which aims to enhance smallholder tea growers' access to niche markets and enhanced sustainable tea value chains. Under the project framework, two streams of activities have been under-taken to prepare farmers to enhance sustainability of tea practices and to contribute to sustainable tea value chains, namely Farmer Field Schools training (FFS) and Rainforest Alliance (RA) training and certification. LEI Wageningen UR together with other project partners developed a monitoring and evaluation (M&E) plan to monitor the training modalities, and to generate data to track the impact of both of these training models. This report is the second report in the M&E cycle, which compares the baseline situation of 2010 in which the households did not yet receive training, with the situation in 2012 in which the households have received training and have become Rainforest Alliance certified. This chapter explains the aim of this report and the overall project in which it is embedded.
1.1 Aim of KTDA Most smallholder tea farmers in Kenya are organized through the Kenya Tea Development Agency (KTDA) Ltd and deliver to one of the 65 KTDA processing tea plants (54 factory companies). KTDA's mission is to provide effective management services to the tea sector for efficient production, processing and marketing of high quality teas and investing in related profitable ventures for the
1 IDH the sustainable trade initiative.
16
benefit of shareholders and other stakeholders.1 KTDA is constantly on the lookout for new ways to promote smallholder tea production. KTDA aims to increase production quantity and quality of the tea without harming the environment by promoting better tea production practices. To do this KTDA developed a list of Sustainable Agriculture GAPs together with Unilever (see Appendix 1). The aim of these GAPs is to increase product quantity and quality, prepare the farmers for RA certification, and to enhance market recognition of responsible farming. Certification of tea is seen by KTDA to help maintain current markets and tap into new markets and is thus one of the ways KTDA uses to maintain and improve her market share. RA certification was introduced to KTDA by Lipton (a company of Unilever) who started a sustainable sourcing programme for their brands in 2007, with a target to source the tea in all Lipton yellow label teabags sold in Europe from RA certified farms by 2015. Four KTDA factories attained RA certification in 2009. Several KTDA factories are certified for Fairtrade (FLO) and another five KTDA factories were being prepared for the UTZ certification in 2011.
1.2 Aim of Rainforest Alliance Rainforest Alliance 'works to conserve biodiversity and ensure sustainable liveli-hoods by transforming land-use practices, business practices and consumer behaviour'.2 Within agriculture they aim for less water pollution, less soil erosion, reduced threats to the environment and human health, protection of wildlife habitat, less waste, less water use, more efficient farm management, improved conditions for farm workers, improved profitability and competitiveness for farmers, and more collaboration between farmers and conservationists.3 The RA seal can be used on processed tea products if at least 30% of the tea in the product comes from RA-certified farms. However, RA obtains commitments from companies and brands to scale up to 100% certified content over time. Smallholders are usually certified as a group and not individually for cost and capacity reasons. Auditing bodies check the compliance by examining the groups' internal management system, the processing unit and other
1 KTDA website 2011: http://www.ktdateas.com/ 2 RA website 2011: http://www.rainforest-alliance.org/ 3 RA website 2011: http://www.rainforest-alliance.org/
17
infrastructure as well as a random sample of selected farms (usually the square-root of the total number of farmers) against the Sustainable Agriculture Network (SAN) group and farm standards.1
1.3 Information on FFS training and RA training and certification This study focused on the effect of two training modalities for smallholder tea producers: 1. Training through Farmer Field Schools (FFS) in all factories to eventually
reach all farmers. The FFS facilitators are KTDA extension staff who work intensively with FFS groups.
2. Direct training of Lead Farmers (training of trainers) by RA and their implementing partner, Partner Africa,2 for the factories to achieve the RA Certified Status according to market demands. For the RA programme, the facilitators are Lead Farmers supported by KTDA extension staff, RA and Partner Africa staff. Lead Farmers in their turn train farmers in the SAN standard, and conduct internal inspections at farm level before the audits take place. It is envisaged that eventually all KTDA factories will be RA certified by the end of 2013.
1.3.1 Farmer Field School training
Every KTDA tea factory was expected to start a minimum of six FFSs in 2010. FFS are organized by Field Services Coordinators (FSCs) and Tea Extension Services Assistants (TESAs) employed by KTDA. FFS training covers a large range of aspects, including GAPs for tea production, empowerment, diversifi-cation, as well as social issues (such as health). SAN principles are also partly covered. Some of the training is given by the TESAs, while some is given by invited resource persons. The FFS approach is based on learning by doing through experiments, special topic sessions, group dynamic activities, field days and study tours, experiential learning, etc. Farmers are not taught which practices are best, but are assisted in experimenting with different practices and making comparisons between the outcomes. The FFS approach has proven to be effective in the KTDA setting: in the pilot project organized under four
1 SAN standards are available on the SAN website: www.sanstandards.org 2 Partner Africa website: www.partnerafrica.org

18
factory catchments, FFS farmers adopted GAPs that increased their knowledge. Knowledge of GAPs was also transferred to non-FFS farmers.1 The quantity of green leaf produced also increased, but this increase was not significantly higher for FFS than for non-FFS farms. These four pilot factories were RA certified in 2009. Even though effective, the FFS approach is also very intensive and requires much time from the TESAs. FFS groups meet for two hours twice a month over a 12-month period (26 sessions) and a TESA is a member of the FFS group. Compared to the previous extension system at KTDA, this approach needs much more time to reach a large number of farmers. Dissemination of knowl-edge by the FFS farmers ('FFS farmer facilitators') to other farmers in the area could overcome part of this problem. A difference of the current FFS approach from the pilot experience also lies in the possibility to use external resource persons. With only four FFSs on tea in Kenya in 2008, people felt honoured to be resource persons and contribute to FFS special topic sessions. However with the expansion of FFS on tea to other factories beginning 2010, FFS activities were more and more facilitated by KTDA extension staff (TESAs and FSCs) and management staff, complimented with external resource persons when required.
1.3.2 Training by RA RA is working with a number of factories, agreed between KTDA and Unilever/ Lipton, where all farmers in the factory’s catchment area are or have been prepared for RA certification within 6–12 months. Since the beginning of the programme in 2010, other tea buyers have increasingly shown interest in the programme. After Lead Farmers are trained as trainers by RA and Partner Africa, they train the farmers, assisted by the TESAs and FSCs. Lead Farmers are farmers from the same factory with above-average tea management capacities who volunteer to support their neighbouring farmers to prepare for the RA audit, and are compensated for the time they spent on training through a 'lunch allowance' (USD 2.5 per day). As the RA training model aims to reach every single farmer in each factory, the training is limited to applying the Sustainable Agriculture Network (SAN) standard. This approach is less compre-hensive than the FFS approach. Due to the requirement for all farmers from a
1 Hiller, S., D. Onduru and A. the Jager, 2009. Sustainable tea production: an assessment of farmer field schools in Kenya. LEI report 2009-078, LEI Wageningen UR.

19
factory to be included under the certification, and the need for farmers to be trained to enhance their operations with regard to the SAN standard, the training is completed as a one-time effort over the course of a few months.
1.3.3 Difference between FFS training and RA training The two training approaches have different objectives: 1. The FFS training is designed to deliver comprehensive and participatory
training on GAPs, farmer empowerment issues, and social and non-social issues, and to initiate collective action activities. As such, the training is more comprehensive than the RA training. The training in the different topics may help with complying with the SAN standard in the future, but will not in itself deliver the requirements for certification. Since much of the curriculum focuses on tea production techniques (e.g. plucking, tipping in), it is expected that productivity and green leaf quality will increase on the farms, and that farmers should obtain a higher income.
2. The RA training is specifically designed to assist farmers to achieve RA cer-tification. This involves both compliance at farm level and an internal management system at group (= factory) level to provide training and internal auditing services. Since the SAN standard is based on general GAPs, RA certification is expected to increase the productivity of farms over time, while in the meantime ensuring that practices on the farm are not harmful to the environment (watercourse and other natural ecosystems) or the people (including members of the farmer’s family and workforce). According to Rainforest Alliance, a higher market demand for certified products may translate into higher tea prices, which should get passed on to farmers as the KTDA operates a transparent pricing system. The combination of these two elements makes Rainforest Alliance believe that the training activities and certification will also lead to higher farm incomes over time.
It is expected that both training models are effective for meeting the standards for RA certification. However, it is also expected that the RA training will translate into less knowledge by the farmers involved than the FFS model on an individual basis, for example on the ecological and agronomical reasons why they should implement the sustainability practices. On the other hand, more farmers will be reached by the RA training activities in the short term than by the FFS, as the FFS can be up-scaled only slowly because of limitations to the capacity of KTDA's extension services and because FFS farmers take up to a
20
year to implement and test techniques and graduate from their schools. To reach all 560,000 farmers through FFSs of 30 members, KTDA would need to start 18,667 FFSs in total. It is an open question which of the two models will lead to a better adoption of sustainable GAPs in tea production in the short to medium term. In a longer term, RA and the KTDA plan to work on merging the two approaches for a comprehensive and efficient farmer-led training programme.
1.4 Aim of the study The objective of this impact assessment study was to measure the progress made by project interventions by conducting household surveys with tea farmers in four factories, and to analyse the impact of differing training modalities on GAPs, by: 1. Measuring the outcomes of the respective training models (RA and FFS) on
farmers' livelihoods (knowledge levels, sustainability practices and income from tea).
2. Testing the assumptions in the logic models that provide the rationale behind the two training models.
3. Assessing the 'trickle-out' impact of training of FFS farmers on surrounding farmers.
4. Comparing the 2012 household survey data with the baseline situation in 2010, and to test for differences between the groups ('selection bias').
More information on the research methodology is presented in Chapter 2.
1.5 Logic model The rationale ('programme theory') behind the two training modalities was developed by the project team in 2010. It has been depicted in a logic model with the two training models that aim to change agricultural practices. One strategy is the RA training with special emphasis on those practices that are required for RA certification and compliance with SAN standards. The other model is based on a more intensive FFS training with a broader impact on GAPs besides those required for RA certification. The logic model for the two training models is shown in Figure 1.1. The model depicts the relationship between the two types of training and the expected outcomes and impacts.

21
It should be noted that the logic model describes a dynamic process in which time plays an important role: it takes time for farmers to gain knowledge from the training and to put the knowledge gained into practice. This means, in the short run, effects that are expected at the right end of the logic model might not yet be observable for the evaluation. Furthermore, differences in factory characteristics and baseline situation knowledge levels could influence the outcome of tea production. To simplify the presentation of the logic model, these implications are not included in Figure 1.1. However, these factors are taken into account in the impact assessment. Figure 1.1 The logic model behind FFS training and RA training
1.6 Outline In Chapter 2, we explain the methodology used for this study. The character-istics of the interviewed households are described in Chapter 3, with a special focus on the training the households received prior to the start of RA and FFS training. In Chapter 4, we describe the knowledge level of the different groups of households on GAPs (blocks 2 and 3 in the logic model). In Chapter, 5 we present an analysis of the implementation of these GAPs by the farmers (block 4 in the logic model). In Chapter 6, we focus on production indicators in tea production (input, production, productivity, etc.; block 5). Chapter 7
FFS- Training
Model
RA- Training
Field experiments and field
observations
Field days and study tours
Topical training by TESAs, FSCs,
and invited resource persons
Training of Lead Farmers, TESAs and other staff
Training of farmers in collection centres and
community meetings (1)
More knowledge
in FFS promoters
(2) More
knowledge at farmer level
(3)
Farmers apply Good Agricultural
Practices (4)
Tea production more sustainable
(5) Ecological
sustainable tea production (Planet)
(6)
Socially sustainable tea
production (People)
Economic sustainable tea
production (Profit) (6)
22
presents an analysis of the impact of training activities on farmers' livelihood (block 6). In Chapter 8, we present the results of the farmer's evaluation of FFS training and RA training. In Chapter 9, we draw conclusions regarding the impact assessment analyses and in Chapter 10 we give recommendations.
23
2 Methodology This chapter describes the methodological approach employed to assess the impact of training modalities on various aspects of sustainable tea production. This is followed by a detailed description of the sampling strategy and data analysis.
2.1 General approach This impact assessment used the difference in difference approach, which relies upon the analysis of two sources of variations. First, we compared the new situation (February 2012) with the baseline situation (July 2010) to characterize the evolution. Second, we analysed the differences between the comparison groups and the treatment groups to account for contextual factors other than the training that might influence the process as described in the logic model. The comparison groups provided information for assessing the counterfactual situation for the treatment groups, that is: 'What would have happened to the households without the treatment?' This counterfactual analysis is vulnerable to contextual differences between treatment and comparison groups. To control for these contextual differences, we analysed the basic characteristics between and within these groups, for example the organization of the factory, farm size, history of training, agro-ecological conditions, etc. In conducting quantitative analyses with data from a closed-ended question-naire, it is challenging to ask numerous follow-up questions and reasons why respondents answered a question in a certain way. We therefore held focus group discussions in all four factories in the post-training situation (2012). We had discussions with two FFS groups, and with two groups that have undergone training to become RA certified. We selected the groups/farmers to be inter-viewed as randomly as possible to avoid having only positive-minded farmers in the discussion groups. The questions asked during the focus group discussions are listed in Appendix 2. One of the issues that could have influenced the answers to our queries was that factory staff who were responsible for implementing extension through FFS, were present during the discussions. But looking at the answers to our queries on challenges or issues that need to be improved, we think the farmers spoke their minds independently, because they openly mentioned improvements to be made. We also had discussions with
24
KTDA staff to ask them about sustainability of FFS and RA certification. The information from this qualitative research is therefore complementary to the quantitative data. Data were collected for the baseline in July 2010 and for the impact assess-ment in February 2012 to evaluate the immediate impact of the training. The impact assessment questionnaire and focus group discussion questionnaire are presented in Appendix 2. Statistical analyses were conducted using STATA 10.
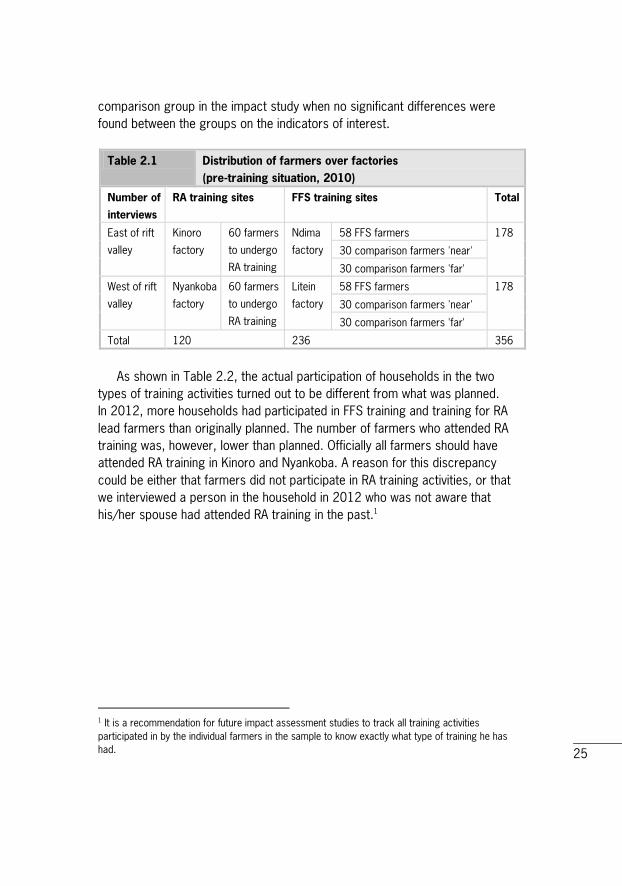
2.2 Sampling This research analysed survey data from households that supply tea (green leaf) to four KTDA managed factories. From all these four factories, households that were to undergo training activities were randomly selected for the baseline interview (2010). Households in the comparison group, which were not to undergo the FFS training, were also randomly selected to be interviewed. The interviews were repeated in 2012. The number of households interviewed in the pre-training situation (i.e. July 2010) per factory is presented in Table 2.1 below. The evolution of RA training and FFS-membership of the households in different factories is shown in Table 2.2. As shown in Table 2.1, households can be distinguished on several grounds. First, a distinction is made between east of the Rift Valley and west of the Rift Valley, due to spatial differences. Second, in the baseline study households were divided into two groups: a group to be trained directly by Rainforest Alliance to prepare for certification, and a group to be trained through the Farmer Field School system. In factories selected for FFS training (Ndima and Litein), the households were randomly selected from two leaf collection centres. Similarly for factories selected for RA (undertaking both RA and FFS activities), households were selected from two leaf collection centres within the factories where there were no FFS activities. Table 2.1 also presents the number of interviewed farmers belonging to the comparison groups. As one of the aims of the FFS is to disseminate knowledge to non-FFS farmers, we split the group of comparison farmers into two groups to help us assess the impact of FFS 'trickle-out': farmers in the same leaf collection centre (collection area) as the FFS (comparison group 'near') and farmers from other leaf collection centres (comparison group 'far'). In the factories where farmers had been trained directly by RA, no comparison group of untrained farmers was available because all the farmers had been certified/ prepared for certification. The two comparison groups were merged into one
25
comparison group in the impact study when no significant differences were found between the groups on the indicators of interest.
Table 2.1 Distribution of farmers over factories (pre-training situation, 2010)
Number of
interviews
RA training sites FFS training sites Total
East of rift
valley
Kinoro
factory
60 farmers
to undergo
RA training
Ndima
factory
58 FFS farmers 178
30 comparison farmers 'near'
30 comparison farmers 'far'
West of rift
valley
Nyankoba
factory
60 farmers
to undergo
RA training
Litein
factory
58 FFS farmers 178
30 comparison farmers 'near'
30 comparison farmers 'far'
Total 120 236 356
As shown in Table 2.2, the actual participation of households in the two types of training activities turned out to be different from what was planned. In 2012, more households had participated in FFS training and training for RA lead farmers than originally planned. The number of farmers who attended RA training was, however, lower than planned. Officially all farmers should have attended RA training in Kinoro and Nyankoba. A reason for this discrepancy could be either that farmers did not participate in RA training activities, or that we interviewed a person in the household in 2012 who was not aware that his/her spouse had attended RA training in the past.1
1 It is a recommendation for future impact assessment studies to track all training activities participated in by the individual farmers in the sample to know exactly what type of training he has had.
26
Table 2.2 Distribution of farms over different training sites and factories in 2010 and 2012
RA training sites FFS training sites
Factory RA
training
2010 2012 Factory FFS
membership
2010 2012
Kinoro RA lead
farmers
(RA lead)
6
(Planned)
19 Ndima FFS farmers
(FFS)
57
(Planned
79
Ex-FFS
farmers
(Ex-FFS)
0 11
Attending
farmers
(RA
attend)
45
(Planned)
25 Control
farmers near
(Non-FFS
near)
30 20
No
training
(Non-RA)
0 7 Control
farmers far
(Non-FFS far)
27 4
Total 51 (15.4%) Total 114 (34.5%)
Nyankoba RA lead
farmer
(RA lead)
19
(Planned)
36 Litein FFS farmers
(FFS)
55
(Planned)
82
Ex-FFS
farmers
(Ex-FFS)
0 3
Attending
farmer
(RA
attend)
41
(Planned)
18 Control
farmers near
(Non-FFS
near)
23 7
No
training
(Non-RA)
0 6 Control
farmers far
(Non-FFS far)
28 14
Total 60 (18.1%) Total 106 (32.0%)
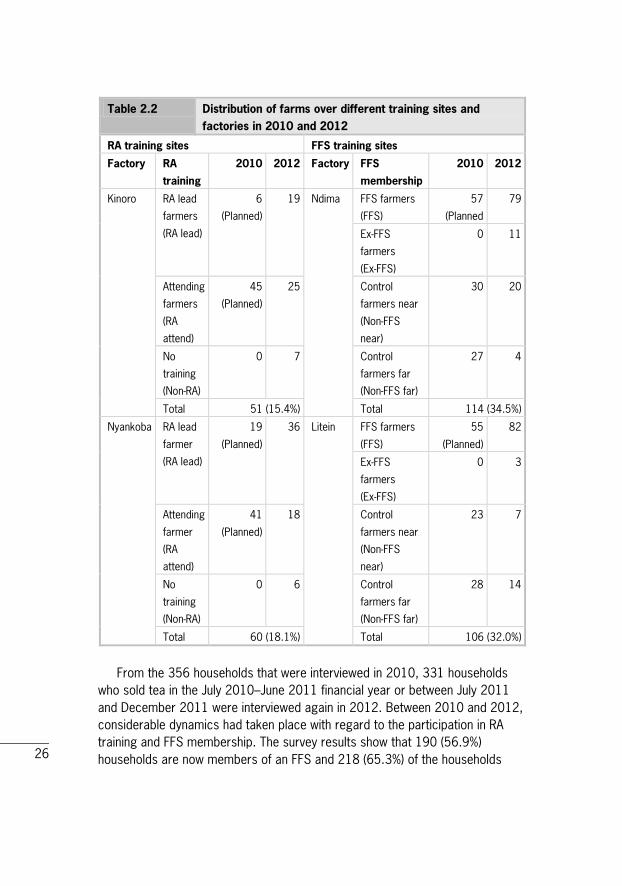
From the 356 households that were interviewed in 2010, 331 households who sold tea in the July 2010–June 2011 financial year or between July 2011 and December 2011 were interviewed again in 2012. Between 2010 and 2012, considerable dynamics had taken place with regard to the participation in RA training and FFS membership. The survey results show that 190 (56.9%) households are now members of an FFS and 218 (65.3%) of the households

27
have had RA training. The results of the second survey also indicated that a number of farmers connected to factories that have undergone RA training also became members of FFSs (28 in Kinoro and 1 in Nyankoba). Similarly, many farmers on the FFS training sites also received RA training (97 in Litein) (see also Table 2.3). Some farmers from Ndima factory had indicated in 2012 that they had participated in RA training. This is not entirely correct as Ndima has not officially started with RA training. However, although Ndima had yet to officially undergo full-scale RA training, there were some topics in RA training that were internally covered in FFS sessions due to the on-going FFS activities. Awareness creation for RA training has also taken place. Since farmers interact with each other (such as with others in the immediate neighbouring catchment of Mununga tea factory, which is RA certified), it is likely that some of the farmers might have some knowledge of RA issues. This could also be why farmers indicated that they had received training for RA certification. When allocating farmers to the training activities, we placed none of the Ndima farmers in the RA training group, however. Based on their participation in the two types of training activities (namely FFS training and RA training), households were divided into four groups as shown in Table 2.3. The group differences were analysed.
Table 2.3 Distribution of farms in different combinations of training in 2012
Training type 1 2 3 4 Total
RA training Yes Yes No No
FFS training Yes No Yes No
Factory Training site
Kinoro RA 25 19 3 4 51
Nyankoba RA 1 53 0 6 60
Litein FFS 76 21 6 3 106
Ndima FFS 0 0 79 35 114
Total 102 93 88 48 331

28
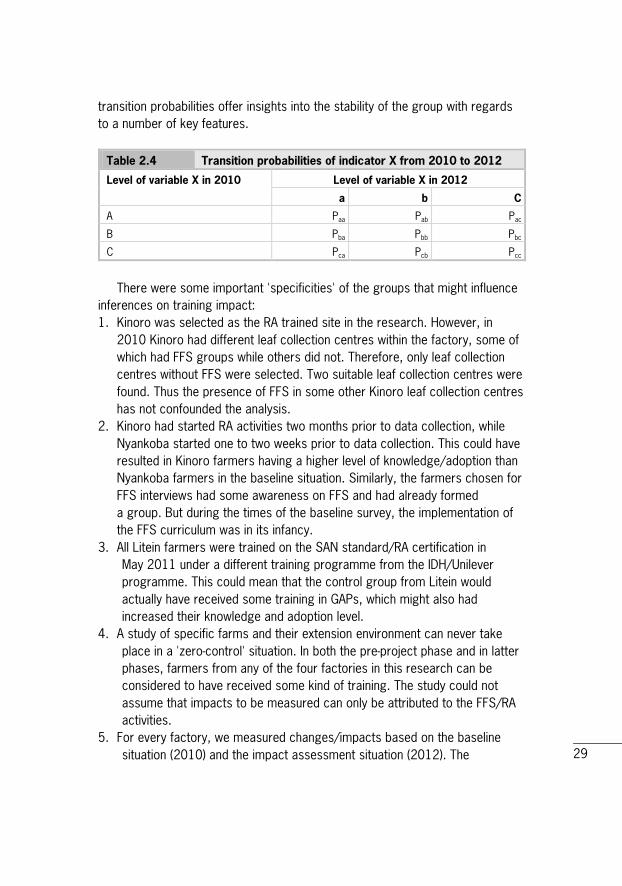
2.3 Data analysis Since the dataset contains repeated observations on the same households, we used panel data techniques1 to analyse the changes in each household and the impact of FFS and RA training on these changes. Each household in the dataset, which is uniquely identified by the grower number, is one panel about which information was collected on various indicators in different periods, that is, the baseline situation (July 2010) and February 2012. Changes in each individual household were calculated as the differences in values of various variables or indicators between 2010 and 2012. Regression analysis was then performed using these differences as the dependent variables, and training and other characteristics of the households as the explanatory variables. Dummy variables were constructed to indicate farmers' participation in various training activities, namely both RA and FFS training (training type 1), only RA training (training type 2), only FFS training (training type 3) and no RA or FFS training (training type 4). Dummy variables were also created for characteristics such as factory and the location. The use of differences in the regression analysis made it possible to assess the impact of training activities that took place between 2010 and 2012 on the indicators of interest by 'differencing out' the influence of persistent factors on which no information is available. In general, the tables presented in this report give mean, median and standard deviations, and sometimes minimum and maximum values. Differences are considered statistically significant using a confidence interval of 95%, indicating that there is no more than a 5% chance that the difference registered in the sample has happened by chance. Whether the difference is significant depends on the variations both between and within the groups. To describe the changes that had taken place between 2010 and 2012 among different groups of households, we computed the tables of transition probabilities for the indicators of interest that take a limited number of discrete values (levels). The transition probability table for an indicator/variable X is illustrated in Table 2.4. The probability Pij shows the proportion of households whose indicator had changed from level i in 2010 to level j in 2012. The table of
1 In statistics and econometrics, the term panel data refers to multidimensional data that contain observations on multiple phenomena observed over multiple time periods for the same firms or individuals. A basic introduction to panel data techniques can be found in Verbeek (2000), A Guide to Modern Econometrics. John Wiley & Sons, Ltd Chichester.
29
transition probabilities offer insights into the stability of the group with regards to a number of key features.
Table 2.4 Transition probabilities of indicator X from 2010 to 2012
Level of variable X in 2010 Level of variable X in 2012
a b C
A Paa Pab Pac
B Pba Pbb Pbc
C Pca Pcb Pcc
There were some important 'specificities' of the groups that might influence inferences on training impact: 1. Kinoro was selected as the RA trained site in the research. However, in
2010 Kinoro had different leaf collection centres within the factory, some of which had FFS groups while others did not. Therefore, only leaf collection centres without FFS were selected. Two suitable leaf collection centres were found. Thus the presence of FFS in some other Kinoro leaf collection centres has not confounded the analysis.
2. Kinoro had started RA activities two months prior to data collection, while Nyankoba started one to two weeks prior to data collection. This could have resulted in Kinoro farmers having a higher level of knowledge/adoption than Nyankoba farmers in the baseline situation. Similarly, the farmers chosen for FFS interviews had some awareness on FFS and had already formed a group. But during the times of the baseline survey, the implementation of the FFS curriculum was in its infancy.
3. All Litein farmers were trained on the SAN standard/RA certification in May 2011 under a different training programme from the IDH/Unilever programme. This could mean that the control group from Litein would actually have received some training in GAPs, which might also had increased their knowledge and adoption level.
4. A study of specific farms and their extension environment can never take place in a 'zero-control' situation. In both the pre-project phase and in latter phases, farmers from any of the four factories in this research can be considered to have received some kind of training. The study could not assume that impacts to be measured can only be attributed to the FFS/RA activities.
5. For every factory, we measured changes/impacts based on the baseline situation (2010) and the impact assessment situation (2012). The

30
'difference in difference' approach, comparing these changes with changes in the comparison group, needs additional parametric statistical analyses to control for some of the above issues of selection bias.

31
3 Descriptive statistics This chapter presents the general characteristics of the interviewed farmers and their households. Of the 356 households that were interviewed in 2010, 331 households that sold tea in the July 2010–June 2011 financial year or between July 2011 and December 2011 were interviewed again in 2012. The number of farmers was lower in Kinoro factory in 2012 than in 2010 because of the diffi-culty in tracking the individual farmers.
3.1 Group characteristics Most of the household heads (87%) of the surveyed households were male. Enumerators were instructed to speak to the person (the respondent) in the household who was most knowledgeable on tea production. Table 3.1 shows the distribution of respondents by gender and position in 2010 and 2012. In more than two thirds (68.9%) of the surveyed households, the respondent was the household head. In at least 20% of the surveyed households, the 2012 respondent was not the same as the 2010 respondent. There were more female respondents in the second survey than in the first survey. Table 3.1 Gender and position of the respondents
Position 2010 2012
Female Male Female Male
Household head 27 195 47 181
Spouse 90 7 35 2
Other 7 5 55 11
Total 124 207 137 194
We also looked at various responsibilities for tea production within the house-hold. The survey results show that the household head (usually a man) is responsible for most activities with regard to tea production, and is usually the owner of the land/plot and receives the income from tea production. In about 40% of the households, the spouse shares the responsibility of management or supervision of work in the tea fields. However, in more than 50% of the

32
households, the spouse (who in about 80% of cases is a woman) shares the highest workload in tea plucking.
3.2 Participation in training activities In the baseline situation, 111 (33.5%) of the 331 households were selected to undertake RA training and 112 (33.8%) households were to attend FFS. Within the two KTDA factories where the FFS treatment groups were selected, 108 (32.6%) households were also selected as control group. After the start of the training in 2010, considerable dynamics took place with regard to the participation in RA training and FFS membership. Based on the 2012 survey results, 190 (57.4%) households are now member of an FFS and 219 (66.2%) of the households participated in the RA training, either as lead farmer or as participant. The evolution of RA training and FFS membership of the farmers in different factories is summarized in Table 3.2. As shown in Table 2.3, a number of farmers in the original control groups have received FFS or RA training and some of the farmers who were selected to undergo FFS or RA training did not participate in the training. We therefore used all farmers in training type 4 (no FFS training and no RA training) as the new control group to assess the impact of RA or FFS training. Besides RA training and FFS training, more than 42% of the farmers indicated that they had also received training or attended workshops for another certification scheme. Ndima is one of the factories that have undergone Fair Trade (Flo-Cert). More than two thirds (69.2%) of the farmers said they participated in non-certification scheme training or workshops, for instance, one-on-one training, group training, workshop, demonstration, training during TESA visit. The majority (80.7%) of the farmers had participated in more than one training activity; of these farmers, about 20% had participated in more than five training activities. We were surprised to see that such a high percentage of farmers had partic-ipated in training activities. This means either that the farmers have received many forms of training other than FFS or RA training, possibly influencing the impacts calculated in this study, or that the farmers confused the training activities and gave information about FFS or RA training instead of information about other training activities (either certification or non-certification). We treated this as follows in our study: a dummy variable was created to represent the participation in other training activities and used as a contextual variable in
33
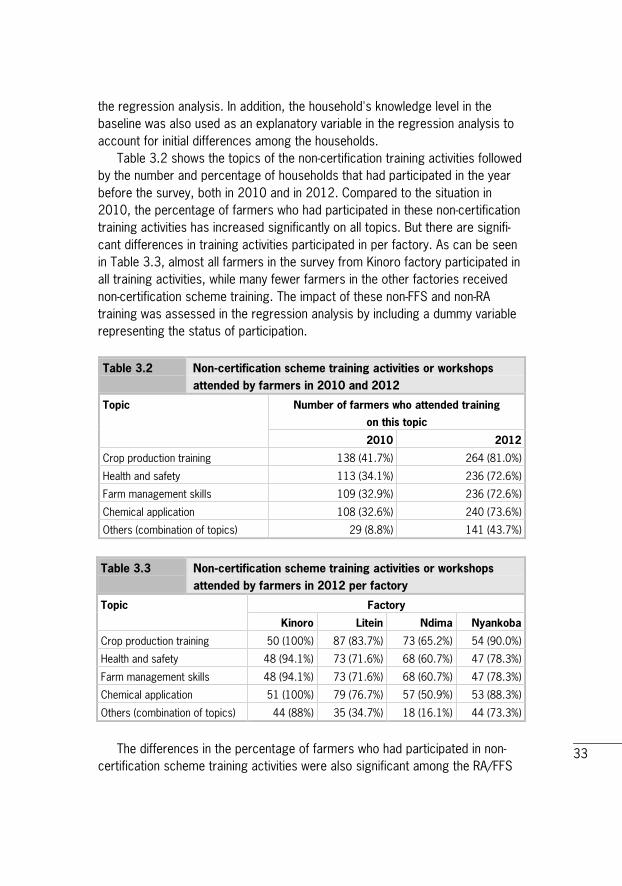
the regression analysis. In addition, the household's knowledge level in the baseline was also used as an explanatory variable in the regression analysis to account for initial differences among the households. Table 3.2 shows the topics of the non-certification training activities followed by the number and percentage of households that had participated in the year before the survey, both in 2010 and in 2012. Compared to the situation in 2010, the percentage of farmers who had participated in these non-certification training activities has increased significantly on all topics. But there are signifi-cant differences in training activities participated in per factory. As can be seen in Table 3.3, almost all farmers in the survey from Kinoro factory participated in all training activities, while many fewer farmers in the other factories received non-certification scheme training. The impact of these non-FFS and non-RA training was assessed in the regression analysis by including a dummy variable representing the status of participation. Table 3.2 Non-certification scheme training activities or workshops
attended by farmers in 2010 and 2012
Topic Number of farmers who attended training
on this topic
2010 2012
Crop production training 138 (41.7%) 264 (81.0%)
Health and safety 113 (34.1%) 236 (72.6%)
Farm management skills 109 (32.9%) 236 (72.6%)
Chemical application 108 (32.6%) 240 (73.6%)
Others (combination of topics) 29 (8.8%) 141 (43.7%)
Table 3.3 Non-certification scheme training activities or workshops
attended by farmers in 2012 per factory
Topic Factory
Kinoro Litein Ndima Nyankoba
Crop production training 50 (100%) 87 (83.7%) 73 (65.2%) 54 (90.0%)
Health and safety 48 (94.1%) 73 (71.6%) 68 (60.7%) 47 (78.3%)
Farm management skills 48 (94.1%) 73 (71.6%) 68 (60.7%) 47 (78.3%)
Chemical application 51 (100%) 79 (76.7%) 57 (50.9%) 53 (88.3%)
Others (combination of topics) 44 (88%) 35 (34.7%) 18 (16.1%) 44 (73.3%)
The differences in the percentage of farmers who had participated in non-certification scheme training activities were also significant among the RA/FFS

34
training groups. In general, a higher percentage of farmers in the RA/FFS training groups (i.e. groups 1 to 3) had participated in non-certification scheme training activities compared to the farmers in the comparison group (i.e. group 4). As shown in Table 3.4, the group receiving only RA training had the highest percentage of farmers who had also participated in the non-certification scheme training activities on the four main topics, while group 4 (no RA or FFS training) had the lowest percentage. The differences in received non-certification scheme training were therefore considered an important contextual factor to be accounted for in the impact assessment. However, based on these results and discussions with experts working in the FFS and RA training projects, it was considered possible that farmers had been confused when giving information about the FFS and RA training activities they had participated in, and instead gave information about other training activities (certification and non-certification). However, as Table 3.4 shows, it was exactly the training groups that indicated that they had participated in other training activities; the control group had participated much less in such other training activities. Since this result reflects the training situation of the four training groups, the impact of this possible confusion on the results was considered to be very limited. Table 3.4 Non-certification scheme training activities or workshops
attended by farmers in 2012 per RA/FFS training group
Topic RA/FFS training group
FFS + RA RA FFS No FFS or RA
Crop production training 88.2% 93.5% 76.7% 47.8%
Health and safety 77.5% 84.9% 72.6% 37.0%
Farm management skills 77.2% 87.1% 71.8% 32.6%
Chemical application 81.4% 92.5% 62.4% 39.1%
Others (combination of topics) 53.0% 64.1% 23.8% 19.1%
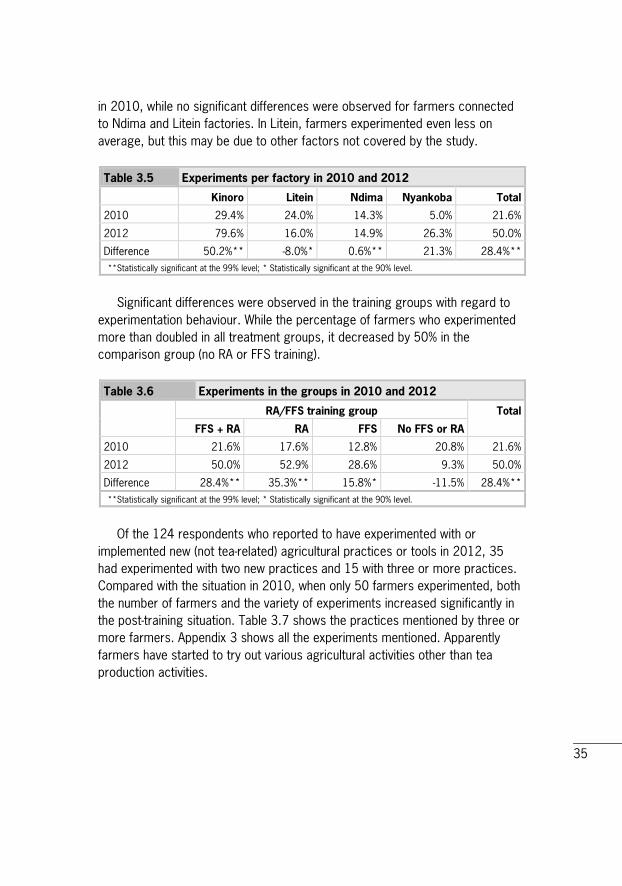
3.3 Experiments The respondents from the households were asked whether they had experi-mented with or implemented any new agricultural practice or tools in the year before the survey. The results (percentage of farmers who answered yes) are shown in Table 3.5 per factory. Based on the answers given, farmers in Kinoro and Nyankoba factory catchments experimented significantly more in 2012 than
35
in 2010, while no significant differences were observed for farmers connected to Ndima and Litein factories. In Litein, farmers experimented even less on average, but this may be due to other factors not covered by the study. Table 3.5 Experiments per factory in 2010 and 2012 Kinoro Litein Ndima Nyankoba Total
2010 29.4% 24.0% 14.3% 5.0% 21.6%
2012 79.6% 16.0% 14.9% 26.3% 50.0%
Difference 50.2%** -8.0%* 0.6%** 21.3% 28.4%** **Statistically significant at the 99% level; * Statistically significant at the 90% level.
Significant differences were observed in the training groups with regard to experimentation behaviour. While the percentage of farmers who experimented more than doubled in all treatment groups, it decreased by 50% in the comparison group (no RA or FFS training). Table 3.6 Experiments in the groups in 2010 and 2012 RA/FFS training group Total
FFS + RA RA FFS No FFS or RA
2010 21.6% 17.6% 12.8% 20.8% 21.6%
2012 50.0% 52.9% 28.6% 9.3% 50.0%
Difference 28.4%** 35.3%** 15.8%* -11.5% 28.4%** **Statistically significant at the 99% level; * Statistically significant at the 90% level.
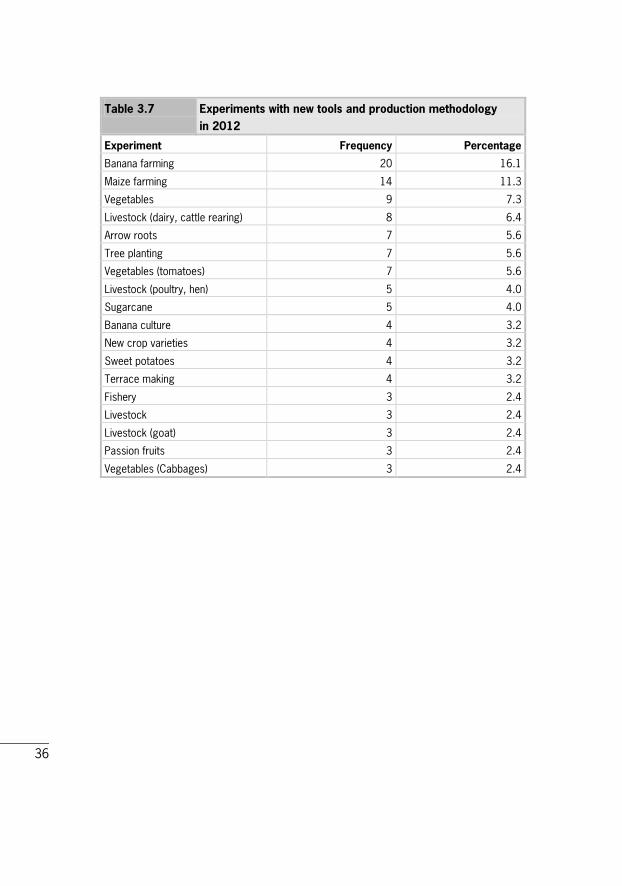
Of the 124 respondents who reported to have experimented with or implemented new (not tea-related) agricultural practices or tools in 2012, 35 had experimented with two new practices and 15 with three or more practices. Compared with the situation in 2010, when only 50 farmers experimented, both the number of farmers and the variety of experiments increased significantly in the post-training situation. Table 3.7 shows the practices mentioned by three or more farmers. Appendix 3 shows all the experiments mentioned. Apparently farmers have started to try out various agricultural activities other than tea production activities.
36
Table 3.7 Experiments with new tools and production methodology in 2012
Experiment Frequency Percentage
Banana farming 20 16.1
Maize farming 14 11.3
Vegetables 9 7.3
Livestock (dairy, cattle rearing) 8 6.4
Arrow roots 7 5.6
Tree planting 7 5.6
Vegetables (tomatoes) 7 5.6
Livestock (poultry, hen) 5 4.0
Sugarcane 5 4.0
Banana culture 4 3.2
New crop varieties 4 3.2
Sweet potatoes 4 3.2
Terrace making 4 3.2
Fishery 3 2.4
Livestock 3 2.4
Livestock (goat) 3 2.4
Passion fruits 3 2.4
Vegetables (Cabbages) 3 2.4

37
4 Knowledge of Good Agricultural Practices (GAPs)
4.1 Introduction The logic model of training for GAP and certification assumes a positive link between the training and the knowledge of farmers, and between the knowledge and the implementation of practices. The RA certificate is issued when farmers and the factory have achieved an overall score of over 80% compliance to the standards, 50% compliance to all principles and 100% compliance to the critical criteria. FFS participants graduate when they have completed a curriculum of learning designed in a participatory way between them and FFS facilitators. This chapter presents an analysis of the knowledge level of the farmers in the various groups that was carried out to compare knowledge levels between 2010 and 2012.
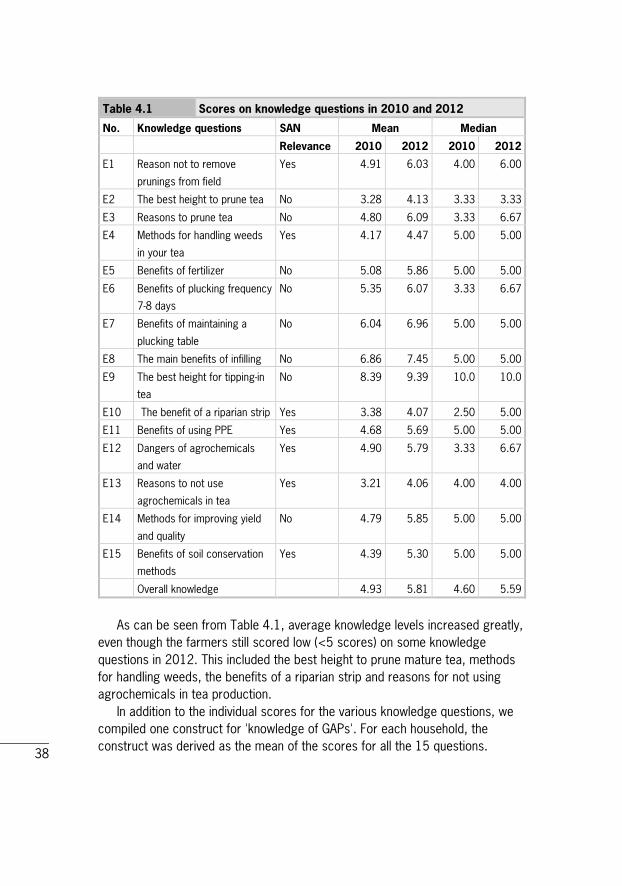
4.2 Knowledge scores The farmers were asked 15 questions on sustainable production. The questions covered topics on GAPs and are part of either RA or FFS training, or both. The farmers scored points on each question by the number of predefined correct answers. Many of the questions were multiple response type and gave different sets of motivations for the particular sustainability practice. The answers to each question were recalculated so that the maximum score on each question was 10. The higher the score, the more knowledge the farmer has. Table 4.1 shows the scores for the questions for 2010 and 2012 for all farmers. The actual questions can be found in Appendix 2a.
38
Table 4.1 Scores on knowledge questions in 2010 and 2012
No. Knowledge questions SAN Mean Median
Relevance 2010 2012 2010 2012
E1 Reason not to remove
prunings from field
Yes 4.91 6.03 4.00 6.00
E2 The best height to prune tea No 3.28 4.13 3.33 3.33
E3 Reasons to prune tea No 4.80 6.09 3.33 6.67
E4 Methods for handling weeds
in your tea
Yes 4.17 4.47 5.00 5.00
E5 Benefits of fertilizer No 5.08 5.86 5.00 5.00
E6 Benefits of plucking frequency
7-8 days
No 5.35 6.07 3.33 6.67
E7 Benefits of maintaining a
plucking table
No 6.04 6.96 5.00 5.00
E8 The main benefits of infilling No 6.86 7.45 5.00 5.00
E9 The best height for tipping-in
tea
No 8.39 9.39 10.0 10.0
E10 The benefit of a riparian strip Yes 3.38 4.07 2.50 5.00
E11 Benefits of using PPE Yes 4.68 5.69 5.00 5.00
E12 Dangers of agrochemicals
and water
Yes 4.90 5.79 3.33 6.67
E13 Reasons to not use
agrochemicals in tea
Yes 3.21 4.06 4.00 4.00
E14 Methods for improving yield
and quality
No 4.79 5.85 5.00 5.00
E15 Benefits of soil conservation
methods
Yes 4.39 5.30 5.00 5.00
Overall knowledge 4.93 5.81 4.60 5.59
As can be seen from Table 4.1, average knowledge levels increased greatly, even though the farmers still scored low (<5 scores) on some knowledge questions in 2012. This included the best height to prune mature tea, methods for handling weeds, the benefits of a riparian strip and reasons for not using agrochemicals in tea production. In addition to the individual scores for the various knowledge questions, we compiled one construct for 'knowledge of GAPs'. For each household, the construct was derived as the mean of the scores for all the 15 questions.

39
As suggested by the scores on the knowledge questions in Table 4.1, the overall knowledge of GAPs increased significantly (at 99% confidence level) between 2010 and 2012. The changes among the groups are shown in Table 4.2. These groups were based on the training activities they were supposed to have undergone. The increase in knowledge is especially significant among the group of FFS farmers and the FFS control group 'Non-FFS near' (both at 99% confidence level). The increase is also significant among the group RA farmers (90% confidence), but not significant among the group 'Non-FFS far'. This suggests that knowledge may have been transferred from FFS trained farmers to control group farmers who deliver to the same leaf collection centre. Table 4.2 Mean knowledge score for the groups of farmers in 2010
and 2012
Group FFS
farmers
RA
farmers
Non-FFS
near
Non-FFS
far
Total
2010 4.91 5.21 4.33 5.00 4.93
2012 6.40 5.51 5.82 5.20 5.81
Difference (% of 2010) 30.3** 5.8 34.4** 4.0 17.8**
The knowledge scores for the four groups according to actual training activities are shown in Table 4.3. All training groups had a higher level of knowledge than the non-trained group. However, this cannot be directly attributed to the training due to initial differences in knowledge among the farmers. The increase in knowledge in the training groups was however significantly higher than the increase in the comparison group (i.e. no FFS and no RA training). Table 4.3 Mean score on knowledge questions in 2010 and 2012
Training groups FFS + RA RA FFS No FFS or RA Total
2010 4.79 4.91 5.16 4.87 4.93
2012 6.09 5.63 5.87 5.46 5.81
Difference (% of 2010) 27.1** 14.7** 13.8* 12.1 17.8** **Statistically significant at the 99% level; *Statistically significant at the 95% level.
To assess the impact of various training activities on the change in knowledge level, a regression analysis was performed using the differences in the knowledge score in the households as the dependent variable. The outputs
40
of the regression analysis are shown in Appendix 7. Besides the dummy variables representing the training, we also looked at the effect of previous knowledge level on the changes using the lagged variable of knowledge. The coefficients for dummies representing the training groups are all significantly positive, suggesting a positive impact of the training on the increase in knowledge. The regression results showed that the contribution of FFS training plus RA training to the increase in knowledge was the highest, followed by FFS training only and RA training only. The coefficient for the lagged variable for knowledge level was significantly negative, which could be expected since the previous knowledge level determines the potential to improve: the higher the pre-training knowledge score of a farmer, the less room for improvement.
4.3 Focus group discussions on knowledge obtained from training activities With regard to the topics addressed in their training, focus group discussions showed that FFS farmers had learnt about many more topics than farmers trained for RA certification. Both groups learnt about recordkeeping, the benefit of leaving prunings in the field (soil conservation), weeding practices, safe use of agrochemicals and the use of Personal Protective Equipment, wetland/riparian strip management, water harvesting, tree planting and soil erosion. In addition to the topics addressed by both FFS training and RA training, FFS farmers learnt many tea husbandry practices, such as infilling, tipping in, plucking interval, pruning, and pest and disease management. But they also had sessions on non-tea related subjects such as animal husbandry, home economics, leadership, kitchen garden and maize planting. According to the farmers, the issues that were addressed in the RA training but not in the FFS training were: the storage of chemicals, which chemicals are banned and may not be applied, and various waste management practices. These results confirm the knowledge increase of the trained farmers on the various indicators as well as on the knowledge score increase for the three training groups.
41
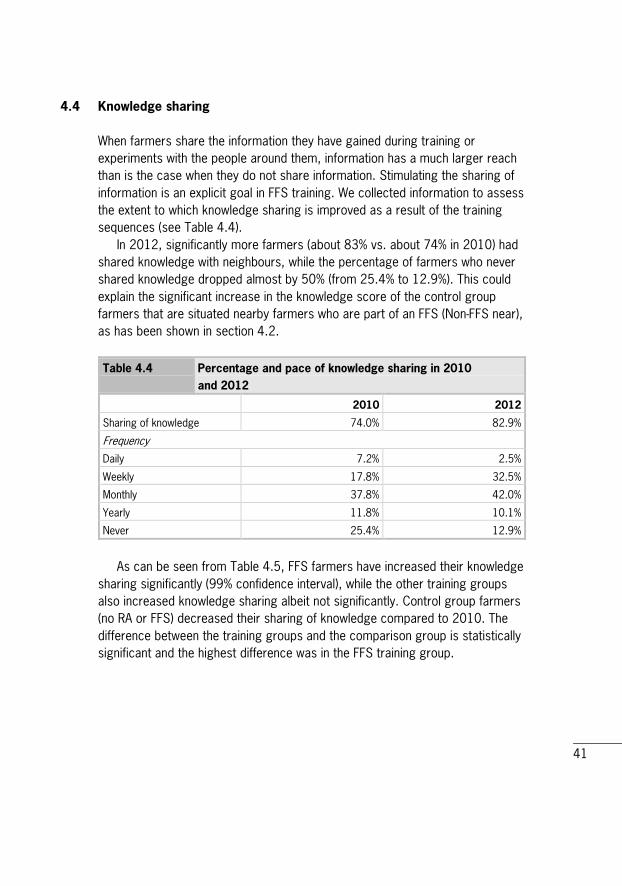
4.4 Knowledge sharing When farmers share the information they have gained during training or experiments with the people around them, information has a much larger reach than is the case when they do not share information. Stimulating the sharing of information is an explicit goal in FFS training. We collected information to assess the extent to which knowledge sharing is improved as a result of the training sequences (see Table 4.4). In 2012, significantly more farmers (about 83% vs. about 74% in 2010) had shared knowledge with neighbours, while the percentage of farmers who never shared knowledge dropped almost by 50% (from 25.4% to 12.9%). This could explain the significant increase in the knowledge score of the control group farmers that are situated nearby farmers who are part of an FFS (Non-FFS near), as has been shown in section 4.2. Table 4.4 Percentage and pace of knowledge sharing in 2010
and 2012
2010 2012
Sharing of knowledge 74.0% 82.9%
Frequency
Daily 7.2% 2.5%
Weekly 17.8% 32.5%
Monthly 37.8% 42.0%
Yearly 11.8% 10.1%
Never 25.4% 12.9%
As can be seen from Table 4.5, FFS farmers have increased their knowledge sharing significantly (99% confidence interval), while the other training groups also increased knowledge sharing albeit not significantly. Control group farmers (no RA or FFS) decreased their sharing of knowledge compared to 2010. The difference between the training groups and the comparison group is statistically significant and the highest difference was in the FFS training group.

42
Table 4.5 Percentage of knowledge sharing in the groups in 2010 and 2012
Training type RA + FFS RA FFS No RA or FFS Total
2010 89.2% 76.3% 54.5% 72.9% 74.0%
2012 92.2% 81.3% 88.7% 52.4% 82.9%
Difference 3.0% 5.0% 34.2%** -20.5%* 8.9% **Statistically significant at the 99% level; * Statistically significant at the 90% level.
In the focus group discussions, we also asked the farmers whether they share knowledge with their neighbours and people from other leaf collection centres. RA and FFS farmers disseminated information to other farmers in their own leaf collection centre, which confirmed the quantitative data above. They specifically mentioned that they disseminated information on practices that they themselves had adopted (see section 5.6 for an overview of practices adopted by farmers in the focus group discussion). The farmers we talked to indicated that their neighbours adopted the following practices: correct fertilizer usage, 7–8 day plucking interval and tree planting. The practices 'correct fertilizer usage' and the '7-8 day plucking interval' were mentioned as being adopted by the farmers in the focus group discussions.
43
5 Implementation of Good Agricultural Practices This chapter presents the practices resulting from the farmers' acquired knowledge, using production, environmental and social indicators that were developed to measure the practice. The score for the indicators was calculated using the answers given by the farmers to practice-related questions. For some questions, enumerators were instructed to ask and observe to verify the answer. For each indicator, a score of between 0 and 1 was assigned to each possible answer to the relevant question according to its compliance with SAN and GAPs. The questions and the corresponding scores to the possible answers are listed in in Part B of the questionnaire (Appendix 2a) and in Appendix 2b.
5.1 Scores for the implementation of GAPs Table 5.1 presents an overview of the scores on all the indicators. The higher the score, the more farmers implemented the GAPs. The GAP questions are grouped into three blocks that represent sustainability practices related to intended impacts on production ('profit'), the environment ('planet') and social wellbeing ('people'). Group scores are the mean of the scores from individual questions.

44
Table 5.1 Scores on the indicators for all farmers in the survey (1.0 = maximum score)
Production indicators Mean Difference
2010 2012
Production indicators (Profit) 0.58 0.65 0.07**
How often do you pluck per month? 0.62 0.75 0.13**
Experience leaf spillage at farm or leaf collection centre? 0.43 0.47 0.04
Use plucking stick/wand, is the table firm? 0.48 0.65 0.17**
Success rate your nursery? 0.54 0.58 0.04**
When do you plant VP plants? 0.50 0.53 0.03**
What is the % of crop cover? 0.85 0.77 -0.08**
At what height do you prune? 0.61 0.85 0.24**
In what period do you prune? 0.87 0.72 -0.15**
How often do you prune the same tea plot/ block? 0.97 0.95 -0.02
What tools are used to prune your tea? 0.52 0.57 0.05**
Who prunes the tea & have they been trained? 0.54 0.83 0.29**
At what height do you tip in? 0.77 0.83 0.06*
How often do you apply composted manure? 0.13 0.24 0.11**
How frequently do you apply fertilizer? 0.53 0.56 0.03
Do you keep records? 0.29 0.50 0.21**
Social indicators (People) 0.65 0.73 0.09**
Who plucks your tea? 0.64 0.61 -0.03
Do you have a fixed agreement with employees? 0.77 0.81 0.04
Do your workers have access to easily accessible water for
drinking and latrines?
0.83 0.90 0.07**
How often did your family or workers need medical
attention?
0.75 0.87 0.12**
Do you use any personal protective equipment (PPE)? 0.31 0.59 0.28**
Do you group together with others farmers to carry out
activities?
0.75 0.61 -0.14**
Do you turn to KTDA if you experience any problems in your
tea production?
0.82 0.89 0.07**
Do your children go to school? 0.76 0.8 0.04*
Do you use locally manufactured farm inputs/mplements? 0.24 0.53 0.29** **Statistically significant at the 99% level; * Statistically significant at the 95% level.

45
Table 5.1 (continued)
Scores on the indicators for all farmers in the survey (1.0 = maximum score)
Production indicators Mean Difference
2010 2012
Environmental indicators (Planet) 0.55 0.66 0.11**
Do you collect prunings from the tea field? 0.83 0.93 0.10**
Do you infill open areas? 0.68 0.73 0.05**
When do you apply fertilizer to your tea? 0.92 0.92 0.00**
How do you spray? 0.90 0.89 -0.01**
Does your farm border a river or water body? 0.47 0.49 0.02**
Do you have indigenous trees on you farm? 0.48 0.59 0.11**
How many eucalyptus trees grow within 10 metres of
water?
0.57 0.52 -0.05
If your farm borders a water body, at what distance do you
spray from the water?
0.49 0.65 0.16**
How much of the total farm area is conservation area? 0.49 0.66 0.17**
What is your main source of energy for domestic use? 0.62 0.64 0.02
What is your main source of water for domestic use? 0.51 0.47 -0.04**
How do you manage household wastewater and effluent
from livestock?
0.40 0.68 0.28**
How do you manage household solid waste? 0.21 0.62 0.41**
Is waste collected and taken elsewhere for recycling? 0.16 0.51 0.35** **Statistically significant at the 99% level; * Statistically significant at the 95% level.
As can be seen from the table above, most farmers improved their practices between 2010 and 2012. Large and significant positive differences between 2010 and 2012 can be found for most of the indicators in all three categories. Some of the practices, however, were implemented much less in 2012 than in 2010. These include: the percentage of crop cover, the period in which pruning takes place and grouping together with other farmers to carry out activities. We found some explanations for this: In 2012, the number of farmers who indicated that pruning took place in the wet season (April–May/October–December) almost doubled, which lowers the score, as the recommended pruning period is the cold season (June–August). A possible explanation for this change in pruning period could be climate change. We were furthermore surprised to see that fewer farmers group together with others to carry out

46
activities. An explanation could be that participation in FFS may prevent interactions with others in the short term. No score was assigned to the question about the clones planted in the household's nursery, because the question was included in the assessment for information purposes only and to help in exploring the tea clones that farmers grow. All the clones mentioned in the questionnaire (a) 6/8; b) 31/8; c) 303/577; d) SFS 15/10) meet all the criteria of the Product Value Indicator of Sustainability Assessment Framework. In 2012, about 4.6% of the farmers used the clones 6/8, about 8.6% used the clones 31/8, less than 1% used the clones 303/577, and 4.9% used the clones SFS 15/10. About 34% did not know which clones they used and about 47% had no nursery. The percentage of farmers having no nursery decreased significantly compared to that in 2010 (82%). In addition to looking at the differences in implementing GAPs between 2010 and 2012, we also explored the differences in the implementation of GAPs between the various training types. In Appendix 5, a full overview of the scores for all indicators per training group is given. Some indicators are presented more graphically in the next section.
5.2 Examples of adoption of production GAPs between training groups Three indicators were selected to analyse the impact of training on 'profit'-related sustainability practices: plucking frequency, application rate of com-posted manure and recordkeeping. Figure 5.1 shows the plucking frequency per month of farmers before and after training in the four groups. A higher plucking frequency increases the quality and quantity of production, as younger leaves are plucked and fewer tea leaves need to be thrown away. As expected, the percentage of farmers with higher plucking frequency increased significantly in the post-training situation, which is particularly the case in the group that had RA + FFS training and the group with RA training only.

47
Figure 5.1 Plucking frequency per month (pre- and post-training situation in the groups)
To obtain more insight into the changes that took place between 2010 and 2012, the transition probabilities were calculated for the plucking frequency. As shown in Table 5.2, all farmers who had a plucking frequency lower than twice a month have increased the frequency to either 3 times or more than 3 times a month. Farmers having the highest plucking frequency (4 times a month) in 2010 are more likely (65%) to have high plucking frequency in 2012. Table 5.2 Transition probabilities of plucking frequency per month
from 2010 to 2012
Frequency/Month 2012
<2 times 2 times 3 times 4 times
2010
<2 times | 0.00 0.00 50.00 50.00
2 times | 1.04 33.33 45.83 19.79
3 times | 0.00 7.38 53.02 39.60
4 times | 2.50 1.25 31.25 65.00
Total | 0.91 13.37 45.59 40.12
Figure 5.2 show the application rate of composted manure for the four groups of farmers in 2010 and 2012. It is recommended by KTDA that farmers
0% 20% 40% 60% 80% 100%
Both - BeforeBoth - After
RA- BeforeRA- After
FFS-BeforeFFS-After
Control -BeforeControl -After
Less than twice 2 times 3 times 4 times

48
apply composted manure after every pruning. Pruning is recommended every three years by KTDA. Even though many farmers still do not apply manure, the figure shows that farmers with RA + FFS training and farmers with RA training scored significantly better than the two other groups. Figure 5.2 Application of composted manure in the groups
Recordkeeping is important for the learning and understanding of farm management practices and is a prerequisite for RA certification. Especially when applying new practices the farmer needs to be able to see the change in outcome by keeping clear records of inputs and output. Most trained farmers adopted the practice of recordkeeping, while non-trained farmers did not. The largest positive change is seen for farmers who were trained for n RA. But even though farmers trained for RA increased recordkeeping significantly, about 18% of these farmers did not keep any records.
0% 20% 40% 60% 80% 100%
Both - Before
Both - After
RA- Before
RA- After
FFS-Before
FFS-After
Control -Before
Control -After
NeverLess than once every three yearsEvery three yearsMore often than once per three years

49
Figure 5.3 Recordkeeping (pre- and post-training in the treatment groups and the comparison group)
5.3 Examples of adoption of social practices between training groups Two social indicators for GAPs linked to social sustainability were selected in the baseline study: the usage of Personal Protection Equipment (PPE) and the use of local suppliers. The results are shown in Figures 5.4 and 5.5, respectively. For tea production, the use of gum boots and an apron is prescribed. One of the requirements of the RA programme is that no agrochemicals (including fertilizers) should be applied without protection. As Rainforest Alliance only certifies if farmers adhere to this practice in all relevant activities in their entire production system, all tea factories encourage farmers to have full PPE sets. The percentage of farmers using all forms of PPE increased significantly in all groups, but the highest in the group with RA + FFS training. Moreover, the decrease in the percentage of farmers without PPE was the highest in the groups with FFS training and RA training.
0% 20% 40% 60% 80% 100%
Both - Before
Both - After
RA- Before
RA- After
FFS-Before
FFS-After
Control -Before
Control -After
Only records on production siteOnly records on inputsRecords on input use and productionNo records kept

50
Figure 5.4 Recordkeeping (pre- and post-training in the training groups and the comparison group)
Usage of Personal Protective Equipment (PPE)
Relationships and trust are important prerequisites for building sustainable trading relationships, as they can reduce transaction costs and thus increase efficiency. In the training groups, the percentage of farmers who said that they always use local supplies has increased significantly, which differs significantly from the comparison group.
0% 20% 40% 60% 80% 100%
Both - BeforeBoth - After
RA- BeforeRA- After
FFS-BeforeFFS-After
Control -BeforeControl -After
All PPE Some No PPE N/A ( don't spray)

51
Figure 5.5 Reliable local suppliers (relationships)
5.4 Examples of adoption of environmental GAPs between training groups According to the Rainforest Alliance standard, farmers have to manage three main waste streams: one for organic waste, one for plastic and one for empty chemical containers (on farms that use chemicals). Farmers are encouraged to collect their waste in a waste pit and to separate organic waste to create compost. The changes that took place with regard to the management of household solid waste are shown in Figure 5.6. In all four groups, the percentage of farmers who have no waste management decreased significantly. Significant changes were observed in the FFS + RA trained group, in which the percentage of farmers who use one pit for organic waste and one pit for other waste has more than doubled.
0% 20% 40% 60% 80% 100%
Both - BeforeBoth - After
RA- BeforeRA- After
FFS-BeforeFFS-After
Control -BeforeControl -After
Always Sometimes Never
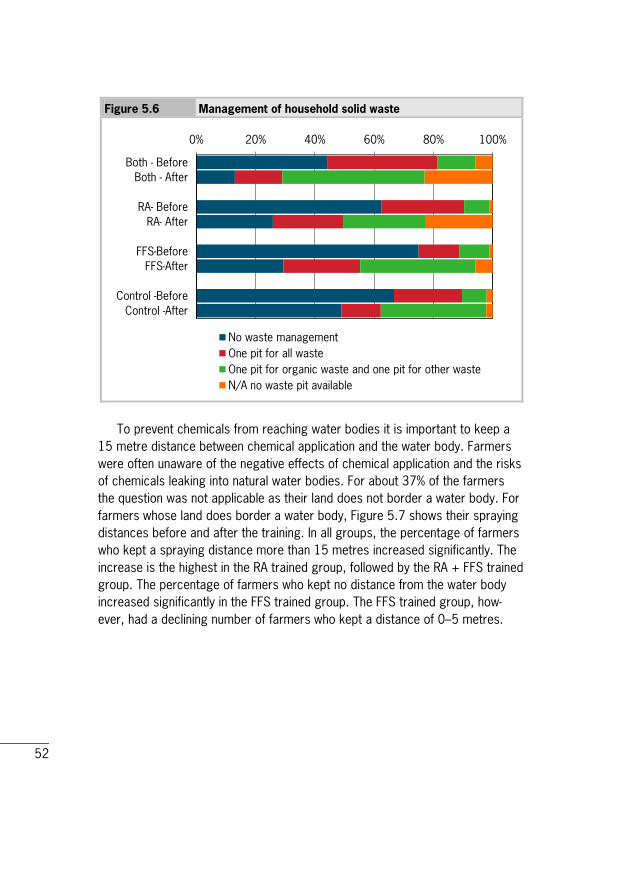
52
Figure 5.6 Management of household solid waste
To prevent chemicals from reaching water bodies it is important to keep a 15 metre distance between chemical application and the water body. Farmers were often unaware of the negative effects of chemical application and the risks of chemicals leaking into natural water bodies. For about 37% of the farmers the question was not applicable as their land does not border a water body. For farmers whose land does border a water body, Figure 5.7 shows their spraying distances before and after the training. In all groups, the percentage of farmers who kept a spraying distance more than 15 metres increased significantly. The increase is the highest in the RA trained group, followed by the RA + FFS trained group. The percentage of farmers who kept no distance from the water body increased significantly in the FFS trained group. The FFS trained group, how-ever, had a declining number of farmers who kept a distance of 0–5 metres.
0% 20% 40% 60% 80% 100%
Both - BeforeBoth - After
RA- BeforeRA- After
FFS-BeforeFFS-After
Control -BeforeControl -After
No waste managementOne pit for all wasteOne pit for organic waste and one pit for other wasteN/A no waste pit available
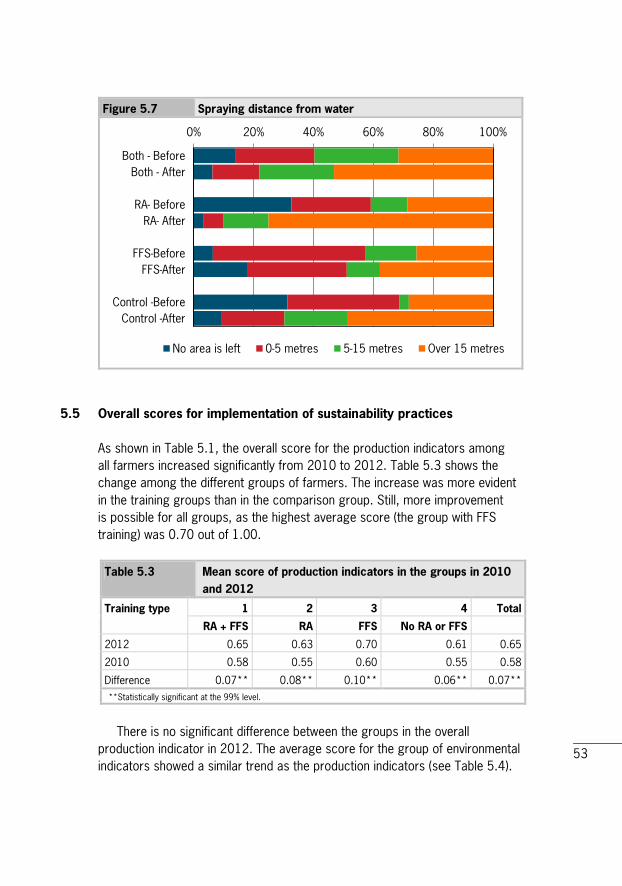
53
Figure 5.7 Spraying distance from water
5.5 Overall scores for implementation of sustainability practices As shown in Table 5.1, the overall score for the production indicators among all farmers increased significantly from 2010 to 2012. Table 5.3 shows the change among the different groups of farmers. The increase was more evident in the training groups than in the comparison group. Still, more improvement is possible for all groups, as the highest average score (the group with FFS training) was 0.70 out of 1.00. Table 5.3 Mean score of production indicators in the groups in 2010
and 2012
Training type 1 2 3 4 Total
RA + FFS RA FFS No RA or FFS
2012 0.65 0.63 0.70 0.61 0.65
2010 0.58 0.55 0.60 0.55 0.58
Difference 0.07** 0.08** 0.10** 0.06** 0.07** **Statistically significant at the 99% level.
There is no significant difference between the groups in the overall production indicator in 2012. The average score for the group of environmental indicators showed a similar trend as the production indicators (see Table 5.4).
0% 20% 40% 60% 80% 100%
Both - BeforeBoth - After
RA- BeforeRA- After
FFS-BeforeFFS-After
Control -BeforeControl -After
No area is left 0-5 metres 5-15 metres Over 15 metres

54
There is no significant difference between the training groups for the overall environmental indicator in 2012. Table 5.4 Mean score of environmental indicators in the groups in
2010 and 2012
Training type 1 2 3 4 Total
RA + FFS RA FFS No RA or FFS
2012 0.70 0.67 0.64 0.64 0.67
2010 0.56 0.55 0.56 0.54 0.55
Difference
(2012- 2010)
0.14** 0.12** 0.08** 0.10** 0.12**
**Statistically significant at the 99% level.
Table 5.5 shows the evolution of the social indicators in the training groups from 2010 to 2012. While the score for the comparison group showed no significant change, the scores in all training groups increased significantly. But again, there is no significant difference between the training groups in the overall social indicator in 2012. Table 5.5 Mean score of social indicators in the groups in 2010
and 2012
Training type 1 2 3 4 Total
RA + FFS RA FFS No RA or FFS
2012 0.75 0.71 0.75 0.69 0.73
2010 0.66 0.62 0.63 0.68 0.65
Difference
(2012- 2010)
0.09** 0.09** 0.12** 0.01 0.08**
**Statistically significant at the 99% level; * Statistically significant at the 95% level.
To assess the possible effect of training and other factors on the changes in the sustainability indicators, regression analysis was performed. The regression outputs are shown in Appendix 7. Statistically, the effect of the RA + FFS training was positive on all three general indicators, namely 'profit', 'people', and 'planet'. FFS training showed a more positive effect on the 'profit' and 'people' indicators, while RA training seemed to have a more positive effect on the 'planet' indicator. In the baseline study, knowledge level was found to be influenced by participation in other training activities. Similar to the regression on knowledge score, the historical score on the indicator was used to see

55
the effect of autocorrelation. To account for other effects, such as historical training, the lagged knowledge score (i.e. score from 2010) was also used. The lagged knowledge score representing historical knowledge level has a positive effect on the implementation indicator on 'profit' and 'planet'. This suggests that the effect of increased knowledge of sustainable production may lie in the future, as it takes time for farmers to experiment with and implement the knowledge gained.
5.6 Focus group discussion results on adoption of GAPs When we asked the focus group participants which practices they had adopted, it became clear that the FFS farmers had adopted very different practices from those adopted by the farmers trained for RA certification, apart from the prac-tice 'soil conservation by leaving prunings in the field' (which was adopted by all FFS and RA farmers). It also seemed that many fewer practices were adopted than were taught, as the farmers mentioned fewer topics adopted than topics learnt. However, some farmers also said that they had adopted all practices mentioned, so perhaps they did not want to mention the practices twice. Of the 16 practices adopted, only three were adopted by the FFS farmers from both groups: the correct use of fertilizers, the 7–8 day plucking interval and leaving prunings in the field. Apparently, all FFS farmers found these practices very important, which led to their adoption. Farmers trained for RA certification adopted practices that are directly important for complying with the SAN standard: safe use of agrochemicals/use of Personal Protective Equipment, various waste management activities, planting indigenous trees, proper working conditions for workers, riverine management, avoidance of using banned chemicals and no use of fertilizer bags for storage of food items. The farmers had apparently adopted many of the practices that they learnt in their training. This confirms the results of the quantitative survey that indicated an overall increase in the implementation of GAPs.
56
6 Production and income
6.1 Introduction During the FFS training activities, a lot of attention is paid to improving the quantity and quality of green leaf production. Production increase on each farm, however, cannot all be attributed to the training and associated implementation of practices. For example, rainfall patterns, which differ among the factories, can have an effect. Therefore, differences between groups may be only partly attributed to training. However, monitoring the production levels can give us food for thought. In this chapter we present data on production quantities, input use, costs of production and income earned from tea production, comparing 2010 with 2012 and the four training groups.
6.2 Production Table 6.1 presents an overview of the production indicators in the training groups in 2010 and 2012. For all the farmers, there was a significant increase in tea acreage in 2012 compared with the situation in 2010. However, the number of bushes and the total yield in kilograms do not differ significantly from the baseline situation. On average, productivity (yield in kilogram per bush) has increased the highest for farmers who are both members of an FFS and are trained for RA certification. However, the difference was not statistically significant due to high variation within each group. As can be seen in Table 6.1, there is little variation in the basic price of tea, but the bonus received differed between the groups. This could be determined by the payment scheme used by the factories. Official figures from KTDA show that the in the 2010–11 financial year, total payment scheme for green leaf consisted of an initial payment of 12 KSh/kg plus a bonus. The total payments from the four factories were 42.5 KSh/kg in Nyankoba; 43.25 KSh/kg in Litein, 53.50 KSh/kg in Kinoro, and 48.60 KSh/kg in Ndima. Kinoro therefore had the highest green leaf price in 2011. Focus group discussions confirmed that the training activities were benefi-cial with regard to production and productivity increase, and especially so for FFS farmers. Farmers who were trained for RA certification mentioned produc-
57
tivity as the last benefit, after benefits with regard to waste management (cleaner house) and fewer ailments because of the safe use of agrochemicals. For a full overview of the benefits mentioned by FFS and RA farmers, see Chapter 8.
6.3 Rejections as a proxy indicator for quality of tea We asked farmers about rejections of their green leaves at the leaf collection centres, because we can use this indicator at household level as a proxy for green leaf (tea) quality. Only when the green leaves have been processed into tea at the factory is the final tea quality established. Table 6.2 presents the number of times the farmers' green leaves were rejected by the leaf collection centre in 2011 and in 2009, respectively. The percentage of farmers whose green leaves were never rejected increased significantly in the groups RA farmers and FFS farmers, and the percentage of farmers whose tea was rejected more than 3 times declined significantly in all groups.

58
Table 6.1 Production indicators (mean values) in the groups in 2010 and 2012
Training types
RA + FFS RA FFS No RA or FFS Total
2012 /
2010
2012 /
2010
2012 /
2010
2012 /
2010
2012 /
2010
Tea area in acres 0.96 /
0.87
0.73 /
0.71
0.99 /
0.74
0.79 /
0.53
0.88 /
0.74
Number of tea
bushes
2615.9 /
2646.2
1843.3 /
1795.3
2470.0 /
2473.3
1887.1 /
1776.3
2259.1 /
2233.8
Kg green tea leaves 3094.1 /
2938.8
2338.4 /
2219.6
3064.5 /
3132.7
2274.9 /
2243.4
2761.9 /
2691.4
Kg per acre 3008.1 /
3121.7
2794.4 /
2708.4
3077.9 /
3401.3
3036.2 /
3591.0
2971.6 /
3148.0
Kg per bush 1.5 / 1.16 1.35 /
1.24
1.44 /
1.44
1.42 /
1.41
1.43 /
1.29
Price per kg (in KSh) 12 / 12 12.05 /
11.99
12.08 /
11.91
11.96 / 11.98 12.03 /
11.97
Bonus per kg (in KSh) 33.24 /
28.85
32.81 /
29.35
36.29 /
29.53
35.97 /
29.71
34.33 /
29.3
Table 6.2 Number of times tea was rejected by the leaf collection
centre in 2011 and 2009
Training type RA + FFS RA FFS No RA or FFS Total
2012 /
2010
2012 /
2010
2012 /
2010
2012 /
2010
Never 86.3% /
88.4%
80% /
74.7%
96.6% /
97.3%
88.9% /
90%
87.7% /
86.7%
Less than 3 times 10.8% /
6.3%
14.4% /
17.6%
3.4% /
2.7%
8.9% / 5
%
9.6% /
8.6%
More than 3 times 2.9% /
5.3%
5.6% /
7.7%
0% /
0%
2.2% /
5%
2.8% /
4.7%
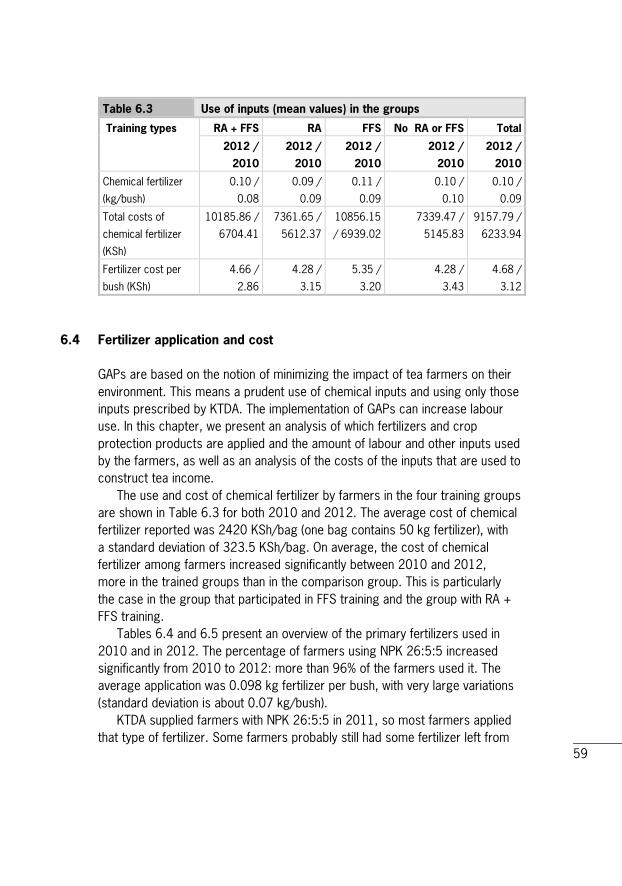
59
Table 6.3 Use of inputs (mean values) in the groups
Training types
RA + FFS RA FFS No RA or FFS Total
2012 /
2010
2012 /
2010
2012 /
2010
2012 /
2010
2012 /
2010
Chemical fertilizer
(kg/bush)
0.10 /
0.08
0.09 /
0.09
0.11 /
0.09
0.10 /
0.10
0.10 /
0.09
Total costs of
chemical fertilizer
(KSh)
10185.86 /
6704.41
7361.65 /
5612.37
10856.15
/ 6939.02
7339.47 /
5145.83
9157.79 /
6233.94
Fertilizer cost per
bush (KSh)
4.66 /
2.86
4.28 /
3.15
5.35 /
3.20
4.28 /
3.43
4.68 /
3.12
6.4 Fertilizer application and cost GAPs are based on the notion of minimizing the impact of tea farmers on their environment. This means a prudent use of chemical inputs and using only those inputs prescribed by KTDA. The implementation of GAPs can increase labour use. In this chapter, we present an analysis of which fertilizers and crop protection products are applied and the amount of labour and other inputs used by the farmers, as well as an analysis of the costs of the inputs that are used to construct tea income. The use and cost of chemical fertilizer by farmers in the four training groups are shown in Table 6.3 for both 2010 and 2012. The average cost of chemical fertilizer reported was 2420 KSh/bag (one bag contains 50 kg fertilizer), with a standard deviation of 323.5 KSh/bag. On average, the cost of chemical fertilizer among farmers increased significantly between 2010 and 2012, more in the trained groups than in the comparison group. This is particularly the case in the group that participated in FFS training and the group with RA + FFS training. Tables 6.4 and 6.5 present an overview of the primary fertilizers used in 2010 and in 2012. The percentage of farmers using NPK 26:5:5 increased significantly from 2010 to 2012: more than 96% of the farmers used it. The average application was 0.098 kg fertilizer per bush, with very large variations (standard deviation is about 0.07 kg/bush). KTDA supplied farmers with NPK 26:5:5 in 2011, so most farmers applied that type of fertilizer. Some farmers probably still had some fertilizer left from

60
2009 or 2010 (e.g. 25:5:5) or fertilizer that they usually apply on other crops, which they applied on tea in 2011. Table 6.4 Chemical fertilizers used by farmers on tea
(post-training situation)
Fertilizer Frequency Percentage
NPK 26:5:5 318 96.1
NPK 17:17:17 3 0.9
NPK 25:5:5 5 1.5
NPK 18:46:0 1 0.3
None 1 0.3
Unknown 3 0.9
Total 331 100
Table 6.5 Chemical fertilizers used by farmers on tea
(pre-training situation)
Fertilizer Frequency Percentage
NPK: 26:5:5 244 73.7
NPK: 25:5:5 82 24.8
NPK: 10:26:10 1 0.3
NPK: 26:0:0 1 0.3
None 3 0.9
Total 331 100
6.5 Organic fertilizer application Although organic fertilizer is widely available, it is not widely applied by farmers in tea production. Opportunities for applying manure to mature tea are when such tea is pruned. Pruning usually takes place every three years. In 2012, about 27% of the farmers reported to have used organic fertilizer for tea production, of which about 17% was manure or animal waste and about 10% was compost, maize stalks or mulches. The percentage of farmers using organic fertilizer, however, increased significantly from 2010 to 2012.

61
6.6 Application of crop protection products The percentage of farmers using crop protection products on tea decreased significantly between 2010 (22%) and 2012 (11.8%). Table 6.6 provides an overview of the chemical brand names used by farmers in 2012. They all consist of the same ingredient, namely glyphosate. The use of the herbicides is probably because of weed management in young tea. Note that the use of glyphosate is prohibited under the SAN standard. Table 6.6 Chemicals used by farmers on tea (post-training situation)
Name chemical mentioned Frequency Percentage
Round-up 33 10.0%
Mamba 3 0.9%
Weed all 2 0.6%
GRAMAZONE 1 0.3%
None/Unknown 292 88.2%
Total 331 100%
6.7 Labour Questions on the labour costs of weeding and pruning were not asked in the baseline survey. Instead, reference costs were used in which the cost of plucking per kg of green leaves was 6 KSh per kg of green leaves, the weeding cost was 150 KSh per day and the cost of pruning was assumed to be 3 KSh per bush. The mean costs of hired labour and related labour days in the post-training situation are shown in Table 6.7. Costs of family labour were set at zero in the questionnaire and were not included in the calculation of mean labour costs below. The survey results show that training groups used significantly more hired labour in weeding and applying fertilizer than the group without training. Farmers in the group with only RA training had on average the highest hired labour cost per kg tea, while the group with RA + FFS training had on average the lowest hired labour cost. We do not know, however, whether extra weeding and pruning has always been done by hired labour or whether the farmer himself used to do the weeding and pruning but now hires people to do so. Even though this is an interesting result in itself, we cannot establish the difference from the pre-

62
training situation. Hired labour costs per kilogram of green leaf have increased over time but does not differ significantly between the four training groups. Table 6.7 Labour costs (mean values) for tea-related activities in the
groups (post-training situation)
Training type RA + FFS RA FFS No RA
or FFS
Total
Plucking
Labour cost per kg of green leaves (KSh) 5.8 5.8 7.7 7.0 6.5
Weeding
Days per year weeding 9.5 7.4 7.3 3.4 7.4
Labour cost per day weeding (KSh) 176.3 213.8 171.0 192.5 188.5
Pruning
Number of bushes pruned in 2011 739.3 673.6 694.9 495.3 676.2
Labour costs per pruned bush (KSh) 2.3 3.0 2.2 2.5 2.5
Applying fertilizer
Number of bags 4.7 3.0 4.7 2.7 3.9
Labour cost per bag applied (KSh) 51.2 81.3 48.5 46.5 52.1
Total costs of hired labour per kg tea 7.2 10.0 9.1 9.3 8.6
Table 6.7 shows considerable variations in worker's wages for different activities and between farmers. Worker's pay is negotiated between the farmer and a labourer, and the price paid per day thus can differ. Reasons given for such differences are scarcity/availability of labour: when more workers are available, they may receive a lower daily wage/price for plucking a kilo of green leaf. The minimum wage for hired labour in tea (agriculture) in Kenya is 150 KSh per 8-hour working day. The average expenditure on hired labour as indicated by the farmers was higher than the minimum wage. However, about 11% of the farmers reported to have paid less than the minimum wage to the hired labour. This could be explained by the different interpretation with regard to how many hours are included in 'a working day'. About 5% of the respondents indicated that they hired more than 5 more people. Almost 44% did not hire more people than two years ago for plucking, weeding, pruning and fertilizer application. About 31% of the farmers said that they themselves spend more time on fertilizer application than two years ago, while 24% spend less time. About 41% spend the same amount of time on

63
fertilizer application as two years ago. As more fertilizers were applied in 2012 than in 2010, hired workers have probably assisted in their application.
6.8 Input/output ratios Based on the information on the use of inputs and their corresponding costs, we calculated input/output ratios in agronomic and economic terms to obtain insight into the productivity and profitability of tea farming. The agronomic input/output ratios were calculated as the total amount of tea (kg) divided by the amount of N, P and K used in the chemical fertilizer. The economic input ratio was the ratio between the total revenue from tea and variable input costs, which were calculated as the sum of fertilizer, chemicals and labour costs. The results are shown in Table 6.8. The economic ratios improved signify-cantly between 2010 and 2012 in all groups, while no significant differences were observed in the agronomic ratios. This suggests that the improvement of profitability result more from price/quality effect than from the increase in physical production. The increase in economic ratios was the highest in the group with RA + FFS training and the group with only RA training. No significant differences in the increase in economic ratios were observed between the training groups and the comparison group. This was a result of the large variances in the calculated ratios and the relative small differences in the developments between the groups. Table 6.8 Input/output ratios of tea production in the groups
(post-training)
RA + FFS RA FFS No RA or FFS Total
2012 2010 2012 2010 2012 2010 2012 2010 2012 2010
Revenue/
input costs
6.23 3.09 5.78 3.28 6.13 3.56 3.52 4.72 6.11 3.33
Kg/N 78.7 67.5 69.4 69.2 60.6 66.3 63.8 67.8 68.5 67.2
Kg/P 382.8 397.5 360.7 366.9 317.0 348.9 283.1 353.5 349.9 357.6
Kg/K 382.8 397.5 360.7 366.9 317.0 348.9 279.7 353.3 349.9 357.1

64
6.9 Income The gross income from tea production was calculated as the price and the bonus received (KSh/kg) from the factories multiplied by the production quantity given by the farmers. The costs comprise labour costs and the costs of other inputs like fertilizer. Net income is calculated as the gross income from tea minus the input costs, which means that the costs of plucking, weeding, pruning and applying fertilizer are deducted from the income derived from tea. To include the input household labour, the average prices paid to workers for the same task were used as an approximation to account for the costs of household labour. Table 6.9 presents the calculated net income in 2012 and 2010 for farmers in the training groups. Table 6.9 Calculated net income (in 1000 KSh) from tea production
in 2012 and 2010 in the groups
Training group Year Mean Sd Median Min Max
RA + FFS 2012 178.7 126.1 147.9 15.6 579.0
2010 99.5 98.2 78.4 1.0 645.3
Difference 79.2
RA only 2012 133.8 125.3 100.1 5.9 611.0
2010 75.7 76.7 48.5 8.4 457.8
Difference 58.1
FFS only 2012 188.8 127.9 150.5 50.9 623.9
2010 107.1 74.2 85.5 24.8 337.1
Difference 81.7
No RA or FFS 2012 148.4 102.4 123.1 16.7 459.5
2010 78.0 54.5 60.5 7.8 282.5
Difference 70.4
Total 2012 164.8 124.9 128.5 5.9 623.9
2010 91.9 81.6 71.3 1.0 645.3
Difference 72.9
As can be seen from Table 6.9, the calculated net income from tea pro-duction increased significantly in all groups between 2010 and 2012. Next to the increase of productivity (yield in kilograms per bush), another reason for this, as given by project team members, is that market prices increased
65
between 2010 and 2012. They also indicated that the exchange rates played a role too.1 It should be noted that the calculated income shown in Table 6.9 is likely to be an overestimation of the actual income since not all costs were included in the calculation. The largest differences were found for the FFS group and the FFS + RA group. Remarkably, the increase in average income was higher in the control group (no RA or FFS training: 70,400 KSh) than for RA farmers (58,100 KSh). In addition to agro-climatic conditions that may influence income in the geographically 'far' situated control group, another plausible explanatory factor for this could be the much higher input costs (labour, fertilizers) of RA farmers than of control group farmers. A point of discussion is that RA certification requires farmers to put aside some of their land for native trees and for the protection of waterways. This might have a negative impact on net income, since more trees other than tea (space and shadow) and more area beside the waterways being protected may lead to less income earning capacity from tea production. The focus group discussion partly confirmed this result: the FFS farmers indicated a higher income as a benefit of the FFS training, while the farmers trained for RA certification did not mention a higher income as a benefit. To assess the impact of various training activities on the change in net income, a regression analysis was performed using the changes in net income as the dependent variable. The outputs of the regression analysis are shown in Appendix 7 (A7.5). Besides the dummy variables representing the training and the factories, we also looked at the effect of previous knowledge level on the changes using the lagged variable of knowledge. Results showed significant effects of the Kinoro factory on the increase of net income, which could possibly be explained by the higher level of bonus in the factory. To put these net income figures in perspective, some of the data in Table 6.9 are in euros.2 The average net income earned from tea for all farmers increased from about 850 euros to about 1500 euros between 2010 and 2012. This amounts to about 2.3 euros a day in 2010 and about 4.1 euros a day in 2012.
1 We were not able to track market prices because they differ greatly between the various tea qualities and the farmers' influence on tea quality is indirect, because most of the tea quality is determined by processing. 2 Exchange rates used were for the 2010 assessment: 1 euro= 108 KSh (31/12/2009) and for the 2012 assessment: 1 euro =110 KSh (31/12/2011).

66
As well as analysing income from tea production, we also explored information on income from other sources to obtain insights into total household income. As can be seen in the table below, the majority of the farmers had one to three sources of income. There is not much variance in the number of other sources of income between the four training groups, except for the farmers who have undergone RA training: they have a much larger percentage in the category '4 or more income sources' than the other groups, and none of those farmers relies solely on tea for his income compared to around 11–18% of the farmers of the other groups. The number of other sources of income may, however, have no significant impact on the total income of the household, as income from each source could be very small.
Table 6.10 Total number of other sources of income in the groups
Training type
RA + FFS RA FFS No RA or FFS Total
Number of other
sources of income
0 16.7% 0.0% 17.0% 10.9% 11.2%
1 32.4% 10.8% 25.0% 28.3% 23.7%
2 40.2% 35.5% 22.7% 32.6% 33.1%
3 7.8% 20.4% 23.9% 17.4% 17.0%
4 or more 2.9% 33.3% 11.4% 10.9% 14.9%
This is confirmed when we look at the percentage of income earned from tea production in the last year before the survey: none of the farmers who participated only in RA training earned 100% of their income from tea. As shown in Table 6.11, none of the 'no RA or FFS' farmers earned 100% of their income from tea. This shows an inconsistency with answers given to the questions on the number of other sources of income (Table 6.10) since there were 'no RA or FFS' farmers with other sources of income. The reason could be that the income from other sources was very small. Significantly more farmers in the no RA or FFS group and the RA + FFS group said that they earned 80–100% of their income from tea, while the other two groups receive much more of their income from sources other than tea.
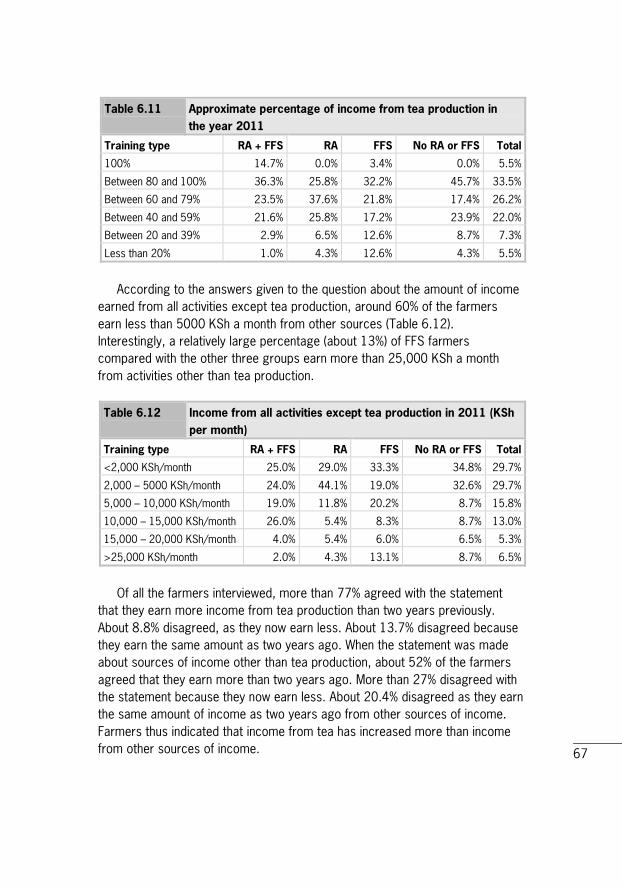
67
Table 6.11 Approximate percentage of income from tea production in the year 2011
Training type RA + FFS RA FFS No RA or FFS Total
100% 14.7% 0.0% 3.4% 0.0% 5.5%
Between 80 and 100% 36.3% 25.8% 32.2% 45.7% 33.5%
Between 60 and 79% 23.5% 37.6% 21.8% 17.4% 26.2%
Between 40 and 59% 21.6% 25.8% 17.2% 23.9% 22.0%
Between 20 and 39% 2.9% 6.5% 12.6% 8.7% 7.3%
Less than 20% 1.0% 4.3% 12.6% 4.3% 5.5%
According to the answers given to the question about the amount of income earned from all activities except tea production, around 60% of the farmers earn less than 5000 KSh a month from other sources (Table 6.12). Interestingly, a relatively large percentage (about 13%) of FFS farmers compared with the other three groups earn more than 25,000 KSh a month from activities other than tea production. Table 6.12 Income from all activities except tea production in 2011 (KSh
per month)
Training type RA + FFS RA FFS No RA or FFS Total
<2,000 KSh/month 25.0% 29.0% 33.3% 34.8% 29.7%
2,000 – 5000 KSh/month 24.0% 44.1% 19.0% 32.6% 29.7%
5,000 – 10,000 KSh/month 19.0% 11.8% 20.2% 8.7% 15.8%
10,000 – 15,000 KSh/month 26.0% 5.4% 8.3% 8.7% 13.0%
15,000 – 20,000 KSh/month 4.0% 5.4% 6.0% 6.5% 5.3%
>25,000 KSh/month 2.0% 4.3% 13.1% 8.7% 6.5%
Of all the farmers interviewed, more than 77% agreed with the statement that they earn more income from tea production than two years previously. About 8.8% disagreed, as they now earn less. About 13.7% disagreed because they earn the same amount as two years ago. When the statement was made about sources of income other than tea production, about 52% of the farmers agreed that they earn more than two years ago. More than 27% disagreed with the statement because they now earn less. About 20.4% disagreed as they earn the same amount of income as two years ago from other sources of income. Farmers thus indicated that income from tea has increased more than income from other sources of income.

68
A comparison of the agreements with the statements between the groups shows that significantly fewer RA farmers agreed with the statement that they earn more from tea now than two years ago (Table 6.13), although about 61% still agreed. It is unlikely that these differences are related to the training received or the requirements of the certification. It may have to do with the payment structure for tea in the various factories, as suggested during the focus group discussions. Some factories may pay a lower bonus because they have higher costs. In general, fewer farmers agreed with the statement about other sources of income than with the statement about income from tea production. This is especially the case in the comparison group: about 20% of these respondents indicated that they earned the same as two years ago, while more than 40% earned less from other sources of income. Table 6.13 Agreement with the statement about income from tea
production or other sources
Training type 1 2 3 4 Total
RA + FFS RA FFS No RA or FFS
'I earn more income from tea production'
I do not agree, as I earn less 2.9% 12.9% 9.2% 13.0% 8.8%
I do not agree, I earn the same 12.7% 25.8% 5.7% 6.5% 13.7%
I agree 84.3% 61.3% 85.1% 80.4% 77.4%
'I earn more income from other sources of income'
I do not agree, as I earn less 19.6% 31.2% 25.3% 41.3% 27.5%
I do not agree, I earn the same 17.6% 26.9% 16.9% 19.6% 20.4%
I agree 62.7% 41.9% 57.8% 39.1% 52.2%

69
7 Livelihood It is plausible that the training and application of GAPs translate into better income and wellbeing. However, direct attribution is difficult, as the influence of other intervening factors is important. We used a set of questions to try to capture the subjective valuation of wellbeing. The differences indicate the change in this subjective valuation. Questions about these issues are difficult to ask in a questionnaire. However, the indicators below allowed us to measure how the farmers themselves judged their situation on certain aspects. Farmers were asked to judge their situation with regard to 13 livelihood aspects. All of the indicators are relevant to FFS. The relevance to SAN principles is indicated separately in Table 7.2. The responses in 2012 are summarized in Table 7.1. More than 90% of the respondents said they were satisfied or very satisfied with their relations with their neighbours and their relations with their family members. As for the remaining indicators, the majority (more than 70%) of the respondents said that they were satisfied or very satisfied. This, however, is not the case for the indicators 'Access to information on production price', 'The number of different income sources', and 'Family income'. In particular, about 26% of the respondents said they were unsatisfied or very unsatisfied with the access to information on production prices, even though this had improved since 2010 (see Table 7.2).

70
Table 7.1 Social indicators of livelihood (post-training situation)
How satisfied are you with Very
unsatisfied
Unsatisfied Neutral Satisfied Very
satisfied
Your relations with your
neighbours
0.6% 1.5% 4.9% 57.0% 36.0%
Your relations with your family
members
0.3% 0.3% 2.4% 35.3% 61.7%
Your relations with the tea
factory
0.6% 4.0% 13.5% 58.5% 23.4%
Your ability to help and advise
your neighbours
0.6% 3.1% 18% 52.3% 26.0%
Your ability to talk in front of
a group
1.5% 2.2% 21.5% 54.8% 20.0%
Access to information on
production prices
5.9% 21.0% 24.1% 38.0% 11.1%
Access to self-help activities 3.4% 5.8% 19.6% 51.7% 19.6%
The number of different
income sources
1.8% 15.1% 22.5% 43.4% 17.2%
Your homestead 3.7% 11.9% 14.3% 48.8% 21.3%
Your family's health 0.3% 2.2% 9.9% 50.9% 36.7%
Possibility to send children
to school
0.3% 7.1% 13.2% 46.3% 33.1%
Family welfare 0.9% 2.8% 15.3% 51.4% 29.7%
Family income 2.7% 15.2% 20.1% 43.3% 18.6%
Table 7.2 presents the mean and median scores of the pre-training and post-training situations using a scale of 1 ('very unsatisfied') to 5 ('Very satisfied'). Significant improvement was observed on all indicators except 'Your relations with your neighbours' and 'Access to self-help activities'. For these two indicators, the scores from both assessments were close to each other and the differences are not statistically significant.
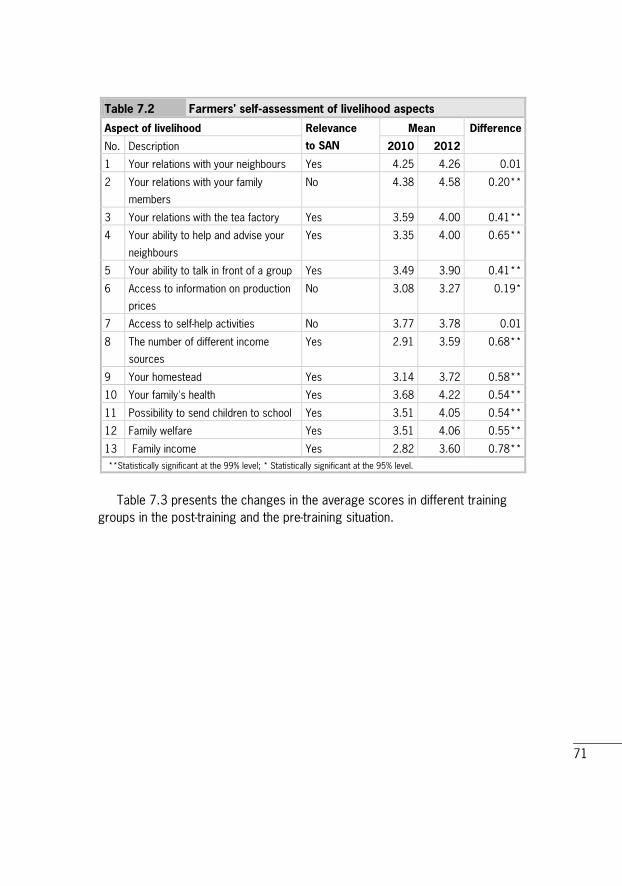
71
Table 7.2 Farmers' self-assessment of livelihood aspects
Aspect of livelihood Relevance
to SAN
Mean Difference
No. Description 2010 2012
1 Your relations with your neighbours Yes 4.25 4.26 0.01
2 Your relations with your family
members
No 4.38 4.58 0.20**
3 Your relations with the tea factory Yes 3.59 4.00 0.41**
4 Your ability to help and advise your
neighbours
Yes 3.35 4.00 0.65**
5 Your ability to talk in front of a group Yes 3.49 3.90 0.41**
6 Access to information on production
prices
No 3.08 3.27 0.19*
7 Access to self-help activities No 3.77 3.78 0.01
8 The number of different income
sources
Yes 2.91 3.59 0.68**
9 Your homestead Yes 3.14 3.72 0.58**
10 Your family's health Yes 3.68 4.22 0.54**
11 Possibility to send children to school Yes 3.51 4.05 0.54**
12 Family welfare Yes 3.51 4.06 0.55**
13 Family income Yes 2.82 3.60 0.78** **Statistically significant at the 99% level; * Statistically significant at the 95% level.
Table 7.3 presents the changes in the average scores in different training groups in the post-training and the pre-training situation.
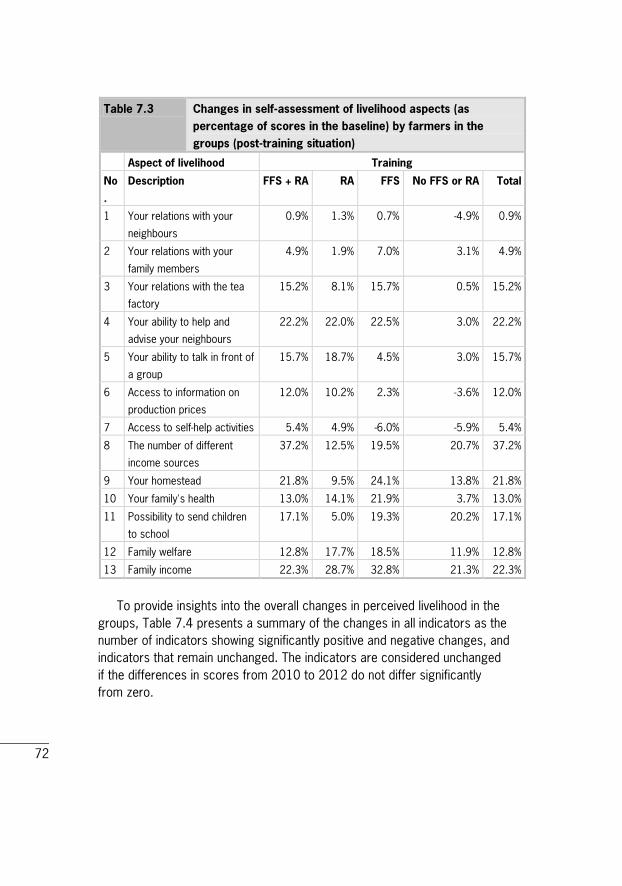
72
Table 7.3 Changes in self-assessment of livelihood aspects (as percentage of scores in the baseline) by farmers in the groups (post-training situation)
Aspect of livelihood Training
No
.
Description FFS + RA RA FFS No FFS or RA Total
1 Your relations with your
neighbours
0.9% 1.3% 0.7% -4.9% 0.9%
2 Your relations with your
family members
4.9% 1.9% 7.0% 3.1% 4.9%
3 Your relations with the tea
factory
15.2% 8.1% 15.7% 0.5% 15.2%
4 Your ability to help and
advise your neighbours
22.2% 22.0% 22.5% 3.0% 22.2%
5 Your ability to talk in front of
a group
15.7% 18.7% 4.5% 3.0% 15.7%
6 Access to information on
production prices
12.0% 10.2% 2.3% -3.6% 12.0%
7 Access to self-help activities 5.4% 4.9% -6.0% -5.9% 5.4%
8 The number of different
income sources
37.2% 12.5% 19.5% 20.7% 37.2%
9 Your homestead 21.8% 9.5% 24.1% 13.8% 21.8%
10 Your family's health 13.0% 14.1% 21.9% 3.7% 13.0%
11 Possibility to send children
to school
17.1% 5.0% 19.3% 20.2% 17.1%
12 Family welfare 12.8% 17.7% 18.5% 11.9% 12.8%
13 Family income 22.3% 28.7% 32.8% 21.3% 22.3%
To provide insights into the overall changes in perceived livelihood in the groups, Table 7.4 presents a summary of the changes in all indicators as the number of indicators showing significantly positive and negative changes, and indicators that remain unchanged. The indicators are considered unchanged if the differences in scores from 2010 to 2012 do not differ significantly from zero.

73
Table 7.4 Overview of changes in self-assessment of all livelihood aspects in the groups (post-training)
RA + FFS RA FFS No RA or FFS Total
Positive 5.8 5.0 5.6 4.9 5.4
Unchanged 5.7 6.0 5.7 5.7 5.8
Negative 1.5 2.0 1.7 2.4 1.8
As can be seen in Table 7.4, the number of livelihood indicators that showed significant improvement was the highest in the group with RA + FFS training, followed by the group with only FFS training. Similarly, the number of livelihood indicators that showed significantly negative changes was the lowest in the group with RA + FFS training. In all training groups, the number of indicators showing significantly positive changes was higher than in the comparison group, confirming a positive effect of the training on perceived livelihood improvement. Difference between the groups on these indicators might be influenced by the intervention, but also by other factors. In addition to the statistical test to test for correlations, we used qualitative interviews and focus groups to support these inferences.
74
8 Evaluation by farmers of impact of FFS and RA training
8.1 Evaluation by farmers of the impact of Farmer Field Schools During the interviews in 2012, farmers were asked to rate various aspects of the FFS training according to their expectations and the training's usefulness. Table 8.1 presents an overview of the evaluation by respondents who participated in FFS and provided answer to the evaluation questions. The responses show that most farmers were satisfied with most aspects of FFS training. In particular, more than 90% of the respondents reported to be satisfied or very satisfied with curriculum development, the role of facilitators and the special topic sessions. Except for 'FFS commercial activities', more than 80% of the respondents said they were satisfied or very satisfied with the other aspects. The percentage of respondents who were unsatisfied or very unsatisfied was far lower than 10% for all aspects except 'FFS commercial activities'. In the future, such commercial activities may thus need more attention. About 40% of the farmers indicated that they preferred trials to special topic sessions in the training; only about 15% had their preference the other way around. About 45% of the farmers would like to participate in both activities. When asked about the benefits of FFS, more than 96% of the farmers who participated in FFS training indicated that they or their household benefitted from it. The benefits realized by the households include knowledge of better farming skills and farm management, the acquisition of new skills to earn more income, new farming methods, new crop varieties, use of sustainable energy, knowledge of soil conservation, food and diet, waste management. This is confirmed by the focus group discussions where mostly the effects on production (green leaf quality improvement) and productivity (tea, maize, kitchen garden) and income were mentioned. Connected to these issues were less fights over money, a better ability to pay school fees and increased self-sufficiency in food (rabbit meat, fruit and vegetables). The kitchen gardens adopted also increased the empowerment of women, as they were responsible for kitchen gardens and thus had their own 'projects'. They also mentioned social benefits: they now visit other FFS farmers when ill, and talk to each other instead of being shy. The relation with the factory also improved.

75
About 91% of the farmers expected that the FFS group would continue to exist after they had graduated. This was confirmed during the focus group discussions, as both FFS groups we talked to indicated that they had registered as a Self Help Group with the Kenyan government. They also started Merry-go-rounds, to enable larger investments to be made by individual members.1 The FFS groups have also started group projects such as a chicken hatching/ rearing/marketing project in which all members participate. Although most farmers were content with the current programme, they suggested a number of changes such as increasing the duration of the training activities (they want to increase the time per session), the frequency and scope of the training activities, and organizing tours to other factories to see how others are following their FFS. Other challenges mentioned in the focus group discussion are the age of FFS members (they are relatively old; young farmers think they know everything so do not participate), illiteracy levels, poor time-keeping and the slow rate of dissemination to other farmers. FFS farmers indicated that better communication about the goals and benefits of FFS will stimulate more farmers to participate. Examples are field days and seminars (at times when farmers are available), study tours and visits to leaf collection centres. These communication means can also help to maintain and increase knowledge and to reach more farmers. Graduated FFS farmers can also teach new FFS farmers, in addition to an increased number of field staff. Credit facilities would also be of assistance for making investments and enhancing the adoption of practices.
8.2 Evaluation by farmers of the impact of Rainforest Alliance Of the 219 households that had participated in RA training activities, 199 (90.9%) respondents provided evaluation of the training. More than 97% of these respondents said they were satisfied with the training and about 80% of them would recommend it to their neighbours. This was confirmed by the focus group discussions. In 2012, more than 46% of the farmers said that their factories were Rainforest Alliance certified. Of these farmers, more than 52% indicated that
1 In a Merry-go-round, FFS members lay down a small amount of money each time they meet. And each time they meet, one FFS member receives the total sum laid down by the group which is a considerable amount for them.
76
they received a better price or an additional bonus because the factory they deliver tea to has been certified by Rainforest Alliance. An explanation for this given by project team members is that there is a lot of demand for certified tea and thus there may have been a higher market price for certified tea. Among the farmers who received RA training, more than 84% said they had benefitted from participating in the RA certification activities. The benefits mentioned include improved waste management, soil conservation, water management, knowledge of health and safety, and wildlife protection. A number of farmers attributed their negative answer to the fact that the factory has not yet been certified. These benefits were confirmed by the focus group discussion, during which benefits were mentioned that could be expected from implementing the SAN standard: a cleaner house with fewer flies because of waste management and fewer ailments because of the safer use of agrochemicals. They also mentioned that the increase in trees led to more shade and the provision of fuel wood, and that water conservation actions may have increased water flows. Last but not least, they mentioned that their relations with the factory had improved, as had their tea productivity and the green leaf quality. When asked about the changes they would like to see in the organization of RA certification activities, most farmers expressed their satisfaction with the current way of working and insisted that the training be continued to 'keep the fire burning'. Many farmers would like to have more frequent training and more RA trainers to hold seminars with farmers to improve crop production and farm management. Some expressed the wish to extend the training to more or all farmers. This is surprising as we expect that all farmers supplying a factory that is in the process of acquiring RA certification would receive training in the SAN standard. This could be explained by the ratio between Lead Farmers and attending farmers (1 Lead Farmer to 300 member farmers) diluting visiting frequency, which may lead to some farmers thinking that others are not trained. The RA farmers in the focus group discussions mentioned that they would like to see fewer farmers per Lead Farmer, and that the Lead Farmer should be able to cover a wider range of topics. A number of farmers suggested awarding certificates to farmers after the training and giving a token/refreshments to participants in the training activities. This would increase the motivation of the farmers to participate. When asked about the sustainability of RA certification within their factories, factory staff indicated that the Lead Farmer costs have been taken over by the factory, as have the audit costs, embedding the costs for RA certification in the factory budget. They also indicated that there is a programme for continuous

77
improvement, and that they organize field days to sensitize farmers on RA issues. They see that farmers have already changed their practices to comply with SAN standard, so they expect no difficulties in the future. Challenges mentioned by factory staff include financial challenges in investing in PPE and storage. Recommendations are to include competitions/rewards for farmers for their participation, include credit/initial seed money and increase the payment for RA certified tea to cover certification costs. Training activities should also cover the expected benefits of RA certification. For small farmers, furthermore, complying with river protection was a challenge. Perhaps alternative practices for small farms can be developed/included? Furthermore, it is a challenge that newly planted trees start to produce only after some time, so it takes a long time before benefits are reaped. Another issue mentioned by the farmers in the focus group discussions was that RA training activities were often not attended by both the husband and wife; thus the person who attended the training found it challenging to explain some of the concepts and practices to his/her spouse. This led to practices being adopted more slowly than possible, according to the farmers. They recommend including both spouses in future training activities.
Table 8.1 Satisfaction with aspects of the FFS training
Aspect of
training Cur
ricu
lum
de
velo
pmen
t
Rol
e of
fa
cilit
ator
s
Gro
up
orga
niza
tion
Freq
uenc
y of
m
eetin
gs
Tim
e ne
cess
ary
Spec
ial t
opic
se
ssio
ns
FFS
com
mer
cial
ac
tiviti
es
Gro
up
dyna
mic
s
Very unsatisfied 0.6% 0.6% 0.6% 1.2% 1.2% 0.6% 2.5% 1.2%
Unsatisfied 1.2% 0.6% 4.1% 4.1% 4% 0.6% 9.8% 3.6%
Neutral 4.6% 4.6% 12.3% 8.1% 8.1% 7.1% 20.9% 15.8%
Satisfied 46.2% 48% 56.1% 59.9% 56.1% 57.4% 35.6% 53.3%
Very satisfied 47.4% 46.2% 26.9% 26.7% 30.6% 34.3% 31.3% 26.1%
Total responses 173 173 171 172 173 169 163 165
Finally, some farmers ran away from lead farmers during inspections because they were afraid they would be reprimanded. Enhancing awareness of the benefits of RA prior to inspections/ training activities would be a solution to this.
78
9 Conclusions
9.1 Impact of training activities on farmers' knowledge of GAPs With regard to the impact of farmers' knowledge of GAPs, we present conclusions on the experimentation behaviour, on the overall knowledge scores of the training groups and on knowledge sharing among farmers. Experimentation RA and FFS training activities contributed to farmers experimenting more with non-tea agricultural activities. Compared with the situation in 2010, both the number of farmers and the variety of experiments increased significantly in the post-training situation for all farmers. Significant differences were observed among the groups: while the percentage of farmers who experimented more than doubled in all treatment groups, it decreased by 50% in the comparison group (no RA or FFS training). Knowledge of GAPs Both the FFS and the RA training had a positive impact on the farmers' knowledge levels. The combination FFS + RA training had the greatest impact, followed by the RA training. The overall knowledge of GAPs increased significantly between 2010 and 2012. All trained groups had a higher level of knowledge than the non-trained group, with the RA + FFS training group having the highest level of knowledge increase. Results of the regressions analysis showed significantly positive effect of FFS training and RA training on the increase in knowledge and the synergetic effect of the two training programmes on the increase on knowledge scores. The survey results therefore confirmed the logic model, in which an increase in knowledge as a result of the training was assumed. Focus group discussions confirmed that farmers learnt a lot in their RA and FFS training. Farmers who had lower knowledge scores before the training showed significantly more improvement in knowledge scores than those who had higher knowledge scores before the training. Knowledge sharing Both RA and FFS training had a positive impact on the sharing of knowledge between farmers. This applies especially to the FFS training. In 2012, significantly more farmers have shared knowledge with neighbours, while the

79
percentage of farmers who never share knowledge dropped almost by 50%. FFS farmers, for whom knowledge sharing is a central feature of the extension model, increased knowledge sharing significantly, while the other training groups also increased knowledge sharing albeit not significantly. Farmers in the comparison group (no RA or FFS training) have decreased their level of knowledge sharing since 2010. The sharing of knowledge was confirmed during focus group discussions, and the farmers specifically mentioned that they disseminated information on practices that they themselves had adopted.
9.2 Impact of training activities on farmers' implementation of GAPs Overall developments Most farmers improved their implementation of GAPs between 2010 and 2012, although much improvement is still possible (one quarter of the indicators have a score of less than 6 out of 10 in 2012). Large and significant positive differences between 2010 and 2012 can be found for most of the individual indicators in all three categories (production, environmental and social indicators). The increase in the value of the indicators was significantly higher among farmers with relatively low values in the pre-training situation. Production indicators (profit) Training activities, especially the FFS training activities, improved the production practices of the trained farmers. There was a significant increase in the overall score for the production indicators between 2010 and 2012 in all groups of farmers. However, there was no significant difference among the four training groups in the overall production indicator in 2012. The increase in the overall score for the production indicators was the highest in the group with only FFS training, followed by the group with RA + FFS training. Environmental indicators (planet) Training activities, especially the RA training activities, had a significantly positive impact on the increase in the application of environmental GAPs. The average score for the group of environmental indicators showed a similar trend as the production indicators. All four groups show a significant increase in the application of environmental GAPs; the increase for FFS farmers was the lowest and the increase in the group with RA + FFS training was clearly the highest. The group with RA + FFS training and the group with only RA training also

80
scored significantly higher than the comparison group on the overall environmental indicator in 2012. Social indicators (people) Training activities, especially the FFS training activities, had a significantly positive impact on the implementation of social practices. While the score for the comparison group showed no significant change between 2010 and 2012, the scores in all three trained groups increased significantly. In particular, the group with RA + FFS training and the group with only FFS training scored significantly higher than the comparison group in the post-training situation.
9.3 Impact of training activities on farmers' use of inputs Fertilizer Training may have increased the application of fertilizers. On average, the cost of chemical fertilizer per kg tea increased significantly between 2010 and 2012 for all farmers; this is particularly the case in the group with FFS training, followed by the group with RA + FFS training. Organic fertilizer was applied by about 27% of all farmers in the post-training situation. Crop protection products The percentage of farmers using crop protection products on tea has decreased significantly from 2010. Only 12% of all farmers said they applied crop protection products in 2012, and the products indicated that they mainly use herbicide (8%). Labour Training seems to have resulted in an increase in the hiring of labour for pruning and fertilizer application. The training groups used significantly more hired labour in weeding and applying fertilizer than the group without training in the 2012 situation. Total costs for hired labour per kilogram of green leaf have increased over time but did not differ significantly among the four training groups. Farmers in the group with only RA training had on average the highest hired labour cost per kg tea, while the group with RA + FFS training had on average the lowest hired labour cost.
81
9.4 Impact of training activities on farmers' production and income Production and productivity For all the farmers, there has been a significant increase in tea acreage since 2010. However, the number of bushes and the total yield in kilograms do not differ significantly from the baseline situation. On average, productivity (yield in kilogram per bush) has increased the most for farmers who are both members of an FFS and are trained for RA certification. However, the difference is not statistically significant due to high variation within each group. Training has impacted positively on the quality of the leaf supplied to the leaf collection centres, leading to fewer rejections. The percentage of farmers whose green leaves were never rejected increased significantly in the groups RA farmers and FFS farmers, and the percentage of farmers whose tea was rejected more than three times declined significantly in all groups. Net income from tea production Training may have contributed in a wider constellation of factors to the increase in net income from tea production. Note that this conclusion needs a cautious use and will be further explored in subsequent measurements. All training groups increased significantly their net income from tea production between 2010 and 2012. The highest increases were found for the FFS group and the FFS + RA group. Remarkably, the increase of income was larger for the comparison group than for the group with only RA training. This may indicate that some differences in agro-climatic conditions due to different locations of the plantations might be a factor we cannot discount. This is also corroborated by statements made by the training groups concerning whether they earn more or less from tea production than in 2010. Around 80% of the farmers in the training groups FFS + RA, the training group FFS and the comparison group said they had earned more, while only 61% of the farmers in the RA training group indicated the same. Other sources of income We cannot conclude whether participation in training has impacted on the number of other sources of income because we do not have such data for 2010. However, especially the training groups indicated that that they now earn more from other sources than they did two years ago, while especially the non-trained indicated that they now earn less. This would indicate that trained farmers have increased their income from sources other than tea production,

82
and that the knowledge of GAPs could have spin-off effects on the other agricultural activities of the farmer.
9.5 Impact of training activities on farmers' livelihoods Overall, significant improvements were observed for all livelihood indicators except 'Your relations with your neighbours' (which was already very high) and 'Access to self-help activities'. The perceived improvement of livelihood was the highest in the group receiving RA + FFS training, followed by the group with only FFS training and the group with only RA training. All trained groups had more indicators showing livelihood improvement than the comparison group.
9.6 Farmers' evaluation of FFS training Overall, farmers who had FFS training were very happy with their training, although a point of attention could be the development of commercial activities by the FFSs. Almost all farmers indicated they that benefitted from the FFS training. Benefits ranged from a higher income to higher productivity, leading to fewer fights over money in the household as well as the implementation of activities other than tea, leading to more self-sufficiency in food, and empowerment for women. Farmers also said that their relations with the factory had improved. Challenges mentioned are the age of the members (youngsters seem to know it all and thus do not become members), illiteracy and a slow rate of rolling out the FFS to others. Graduated farmers could assist in this by teaching other farmers. FFS groups we spoke to indicated that the sustainability of their groups is facilitated by their registration as a self-help group. We can thus conclude that the FFS developments are evaluated very positively by the farmers, and that there is scope for the future. We cannot yet conclude, however, that the FFS system can and will be maintained in the future, as it has been implemented only relatively shortly.
9.7 Farmers' evaluation of RA training Almost all the farmers who had participated in RA training activities evaluated the activities as very positive and indicated that they had benefitted from them. Benefits mentioned are mainly environmental and social, although the

83
improvement of productivity and green leaf quality was also mentioned. They also said that their relations with the factory had improved. It seems from discussions with KTDA factory staff from the two RA factories in this study, that RA certification is already embedded in their factory system (audit costs, lead farmer costs, a programme for continuous improvement). Issues mentioned by the farmers for the future are to continue the training activities, also on other topics than addressed now, to have the right people at the training activities (both spouses), and to motivate farmers to participate by communication, certificates and offering tokens/refreshments. Challenges mentioned by factory staff include upfront investment costs (PPE) and having no rewards to give to farmers for participating. Credit facilities and a premium price for RA tea would also be helpful. Lastly, some farmers ran away from lead farmers during inspections because they were afraid they would be reprimanded. Enhancing awareness of the benefits of RA prior to inspections/training activities would be a solution to this and some of the other challenges.
84
10 Recommendations The following recommendations are clustered around two themes: the methodological and data quality issues, and taking a broader perspective on training outcomes than only using household level analyses.
10.1 Methodology and data quality We have established several methodological and data quality recommendations that can be used for future impact assessment using household level analyses. Recording data on training activities of surveyed households The KTDA system is an almost ideal system on which to do such an impact assessment study, because all the farmers and their production data are known by the factories, and information was available on the training given in the factory catchments. Even so, we had some difficulties in grouping the farmers according to the training they had received. For instance, some farmers from Ndima indicated that they had participated in RA training activities, while no official RA training had taken place in the Ndima factory catchment. Thus, these farmers initially belonged to the group of farmers who were trained for RA, or were trained for RA as well as being a member of an FFS. We changed this after receiving feedback from the project team, and this impacted heavily on the results and the conclusions. We should have checked these descriptive statistics much earlier with KTDA or project staff to see whether the information given by the farmers was correct. Recommendation 1: Farmers or staff working with the farmers should record as much information as possible about which training the farmers have attended. Taking into account the quality of the training activities With regard to the quality and quantity of various training activities, we compared two types: the FFS as a very intensive extension method, and training for RA certification as a less intensive method. We had much information about the quality of these trainings, so could compare the training groups with each other, even though the farmers in the groups were trained in different FFS/
85
factory catchments. To be able to do better assessments in other assess-ments, especially to be better able to attribute the outcomes to the training activities, it would be best to have detailed data recorded of the activities evaluated. Such information could be used to establish an indicator of the quality of the training activities evaluated, which could be used in analyses. The following information would be minimally needed to construct such an indicator: 1) frequency of the training activities, 2) time per training activity and actual time spent on the training per training activity, 3) content of the training activities, 4) knowledge, experience and skills of the facilitator (including expertise in adult education), and 5) the knowledge, experience and skills of resource persons. Recommendation 2: Take into account the characteristics of the training activities analysed, by gathering detailed information about the quality of the training activities and using this 'training quality' indicator for analyses to better attribute the outcomes of the analyses to the quality of the training interventions. Collecting good quality data When you ask farmers about what they have done in the past year, the inputs they have used and how much they have produced, it is very likely that you do not get the most reliable results. People all over the world, including farmers, have problems recollecting exactly what has happened in the past (recollection bias). Results based on survey data should therefore be interpreted with caution. In addition, it can be the case that farmers simply do not know the information we assumed them to have, or that detailed information is available but not used for the study. We have had the experience in this study that farmers indeed gave information that appeared to be incorrect. Examples are farmers who said they had received a particular training, but had not received it. Other examples are that farmers did not know how much the chemical fertilizer they applied costs (because the KTDA supplies the fertilizer and deducts fertilizer costs from the payment for green leaf supplied) and that the KTDA records the green leaf supplied to them at factory level. It would be best for the analyses to have the information that is important for the study recorded when it becomes clear. For example, when a farmer plucks in a certain week, it would be best to record for that week how much he plucked, how much time he or hired labour spent on plucking, how much he paid the worker, and what he received for the green leaf supplied to the factory.
86
To do such recordings may cost farmers a lot of time, but possibly far fewer farmers would need to be in the sample were such detailed and high quality data available. Moreover, it would greatly enhance the power of such studies were data from multiple sources gathered, cross-checked with each other and combined where necessary before conducting analyses. Recommendation 3: Record detailed data on the activities, inputs and production of each household in the survey every week/few weeks to avoid recollection bias. This could be done by the farmers themselves (although illiteracy may be a problem here) or by factory or project staff. Recommendation 4: Combine household data with data from other sources (such as factory data) to cross-check the household data, and add information to the analyses, such as factory data, rainfall data and market information (price fluctuations), because they could have an impact on the results.
10.2 A broader perspective on training outcomes In addition to issues related to conducting impact assessments based on household surveys, we also analysed ways forward in assessing the impact of interventions by analysing information from other actors in the tea value chain. Analyse the changes in tea quality and quantity over time at the factory level For tea, there is a big determinant in the price received per unit. Therefore it would be best to have the development of the tea quality over time tracked in order to see whether the interventions in the factory catchment have had an impact on overall tea quality. This could be done by documenting the volumes produced and sold of the various quality classes, and the price they receive on the market over a longer period of time. We think that such information is already available at KTDA. In doing the analyses, exchange rate influences and overall market price fluctuation should be taken into account in order to be able to draw conclusions. Recommendation 5: Use factory and market data on qualities and quantities of tea sold over a longer period of time and market price fluctuations to establish impact of the intervention on the factory level.
87
Conduct a cost-benefit analysis and cost-effectiveness analysis of the intervention Surprisingly, many extension and certification initiatives have very little insight into the costs and benefits of their interventions. We think that it is important to do an upfront analysis of the estimated costs and benefits of such intervention programmes, to be communicated to the farmers who will most probably (finally) benefit from or bear the cost of such programmes. If stakeholders know exactly what is in store for them from the beginning and make an informed decision whether and, if so, how to implement an intervention, this could also ensure the future sustainability of the programmes. The results in this study are very interesting as they entail the benefits of the RA and FFS training programmes. Although both programmes have quite some positive impacts, their costs are not clear yet. It would be highly relevant to know how much the implementation of these training activities has cost as this would allow calculation of their cost-effectiveness. Here, discussions would need to take place to decide which costs and benefits to include in the study, as there are quite some differences in opinion in this regard (e.g. include farmers' time spent on training and their opportunity costs in the calculations, even though there may not be any other opportunities). Recommendation 6: Conduct a cost–benefit analysis with estimated costs and benefits at implementation level prior to implementing an intervention, and discuss this with all stakeholders involved for informed decision-making. Such decision could be, for example, whether the intervention should be a one-off investment or continuous investment (e.g. life-long learning). The cost–benefit analysis could also be done for individual intervention elements in a larger programme (e.g. separate for a certification programme within an overall agricultural development programme) so that involved stakeholders can decide whether they want to start such an intervention. Assess the costs, benefits and impact of interventions for all actors in the value chain Not only farmers may benefit from interventions such as the FFS and RA certification analysed in this study. Factories may see the quality and quantity of tea produced increase, and tea packers and retailers may be able to earn a better income (improved profit-margins) from the 'intervention' tea sold than from non-intervention tea (e.g. by using labels, or because of overall quality increase for which they can ask a better price). There are probably also costs involved for more actors in the chain than just the farmers and the factories they

88
supply (e.g. a fee paid by tea packers to standard setting bodies for using their label). These costs may even outweigh monetary benefits, such that profit margins for 'intervention' tea can be even lower than for 'non-intervention' tea. Therefore, it would be good to map out the cost, profit-margins and benefits for all actors in the tea value chain in order to obtain a complete view of the impacts of the intervention. Recommendation 7: Conduct a cost–benefit and impact analysis of intervention for all actors in the value chain, including the calculation of profit margins.

89
Appendix 1 Good Agricultural Practices recommended by KTDA ID SUSTAINABLE TEA FARMING GUIDE FOR SMALL-SCALE TEA FARMERS
SOIL FERTILITY
1 Retain prunings in the field
2 Keep ground covered by a crop (beans) or mulch in young tea fields
3 Add composted manure every 3–4 years (after pruning) at the rate of a debe per
20 bushes
4 Maintain plant cover on unpaved paths and tractor ways
5 Avoid using heavy machinery on the land especially when it is wet
6 Maintain soil pH at 4.5–5.6
7 Do not apply ash to your tea farm
SOIL LOSS
8 Practice soil conservation measures (micro-catchments/retention ditches, terraces,
cut-off drains, etc.)
9 Source nursery soils from areas to be planted
10 Replant gaps in tea
11 Retain prunings in the field
12 Keep ground covered by a crop (beans) or mulch
NUTRIENTS
13 Use local fertiliser recommendations
14 Broadcast the fertiliser under the tea canopy (or ring application where gaps are high)
15 Avoid applying fertiliser within 3-4 meters of water courses
16 Apply fertiliser during moderate rains
17 Add composted manure every 3 years at the rate of a 'debe' /20 bushes
DISEASES, PESTS AND WEED MANAGEMENT
18 Use Integrated Pest Management (IPM)
19 Avoid chemical application within mature tea fields
20 Use recommended herbicides and rates in young tea
21 Do not spray close to water courses/bodies
22 Spot spray with proper targeting, do not spray areas unnecessarily
23 Use correct Personal Protective Equipment (PPE) to protect operator
24 Use manual weed control

90
ID SUSTAINABLE TEA FARMING GUIDE FOR SMALL-SCALE TEA FARMERS
BIODIVERSITY
25 Avoid clonal monocultures, at least two tea clones for less than 1 acre and at least 1
clone for every additional 2 acres
26 Grow other crops and trees especially indigenous
27 Plant woodlots with appropriate firewood
28 Ensure that riparian strips are protected and maintained with native species
PRODUCT VALUE (THINGS TO DO TO ENHANCE TEA YIELD & INCOME)
29 Pluck 3-4 rounds per month
30 Minimize spillage on the farm and collection centre
31 Maintain a firm plucking table
32 Pluck only 2L+B and soft banjhi
33 For planting and infilling use clones with the following qualities: hardened, high yielding,
robust and good quality
34 Nursery plant survival rate: Over 80% is high: Under 80% is low.
35 Ensure a closed tea table
36 Infill at the onset of the long rains, use experienced labour, make large holes and use a
table spoonful of TSP/DAP
37 Practice good bringing into bearing (marking, watering, opening up, mulching,
decentering, formative pruning etc)
38 Prune at 20 inches and above
39 Prune 2 inches above the previous pruning height
40 Prune every 3-4 years
41 Use the recommended pruning knife or pruning machine
42 Tip in at 4 to 6 inches above the pruning height
43 Keep records of important farm activities and transactions e.g. inputs, yield/production
and earnings
44 Maximize productivity of the farm (Yield)
45 Ensure no pesticides in mature tea
46 Ensure no foreign matter in harvested tea
ENERGY
47 Use renewable energy (solar, hydroelectric, biogas, renewable fuel wood)
WATER
48 Harvest and store rainwater for domestic use
49 Use rainwater & minimize use of river water
50 Avoid effluent flow into water courses/bodies
51 Use soak pits to dispose wastes

91
ID SUSTAINABLE TEA FARMING GUIDE FOR SMALL-SCALE TEA FARMERS
SOCIAL AND HUMAN CAPITAL
52 Reduce turnover rates among employees to high maintain skill levels
53 Group together with other farmers to obtain bulk discounts and joint transport for inputs
54 Encourage use of KTDA/TRFK/UTK facilities
LOCAL ECONOMY
55 Reduce use imported goods
56 Use reliable local suppliers
57 Use local employees as much as possible.
58 Encourage employees to send earnings home

92
Appendix 2a Impact assessment questionnaire KTDA Sustainable Agriculture Project A: Household identification A Date of interview (dd-mm-yyyy) ……………… Start time: ……………..
End time: ……………… B Name of enumerator………………………………………………………... 1 Factory grower number (2 letters for the factory, 3 numbers for buying
centre, 4 numbers for grower number) ………………………………………………….......................................... 2 Name of the household head ………………………………………………... 3 Name of the respondent, when he/she is not the household head (Interview
the person who attended training offered on tea (RA or FFS) or the person in charge of tea production):
………………………………………………………………........................
4 Gender of respondent? (Circle correct number)
0 Female 1 Male
5 Members of the household # Person in
household
Full name Gender
(M/F)
Year of birth Education
no. of years
(‘do not know’: 0 years)
1 Household head
2 Spouse

93
5b Which persons have responsibilities for tea? (tick, multiple ticks in a row are possible)
Responsibilities for tea 1: Household
head 2: Spouse 3: Other, please specify
(child, other family
member, farm worker)
Management / Supervision
of work in the tea plot
Highest workload in tea
(plucking)
Owns the land / tea plot
Receives the tea
income/payment
6 Did you sell tea in the July 2010/ June 2011 financial year?
0 No 1 Yes
6b Did you sell tea between July 2011 and December 2011?
0 No 1 Yes
If the answers to both questions 6 and 6b are NO, then stop with the interview and go to another farmer on your list 7 Name of Factory: ………………………………………………………….. 8 Are you a member of a FFS?
0 No please continue with question 9 and skip 8b until 8d 1 Yes 2 Not anymore
8b If you participated in FFS training how do you value the training?
Unsatisfied please go to 8d Neutral please go to 8d Satisfied please go to 8d I did not participate in FFS training

94
8c If you did not participate in the FFS training but other person(s) from your household did participate, how did he/she/they value(s) the training? 0 Unsatisfied 1 Neutral 2 Satisfied 3 I Do not know
8d Would you recommend the FFS training to your neighbour?
0 No 1 Yes 2 N/A - I don’t know
9 Have you been trained as a lead farmer by Rainforest Alliance?
0 No 1 Yes
10 If you are not a lead farmer, have you, or any person from your household
attended Rainforest Alliance certification training? 0 Nobody please continue with question 10d 1 Yes, me 2 Yes, somebody else (……….........................................................)
10a By whom was the Rainforest Alliance certification training given?
(Mention the organization)
…………………………………………………………........................ 10b If you participated in Rainforest Alliance certification training, how do you
value the training? 0 Unsatisfied please go to 10d 1 Neutral please go to 10d 2 Satisfied please go to 10d 3 I did not participate in Rainforest Alliance training
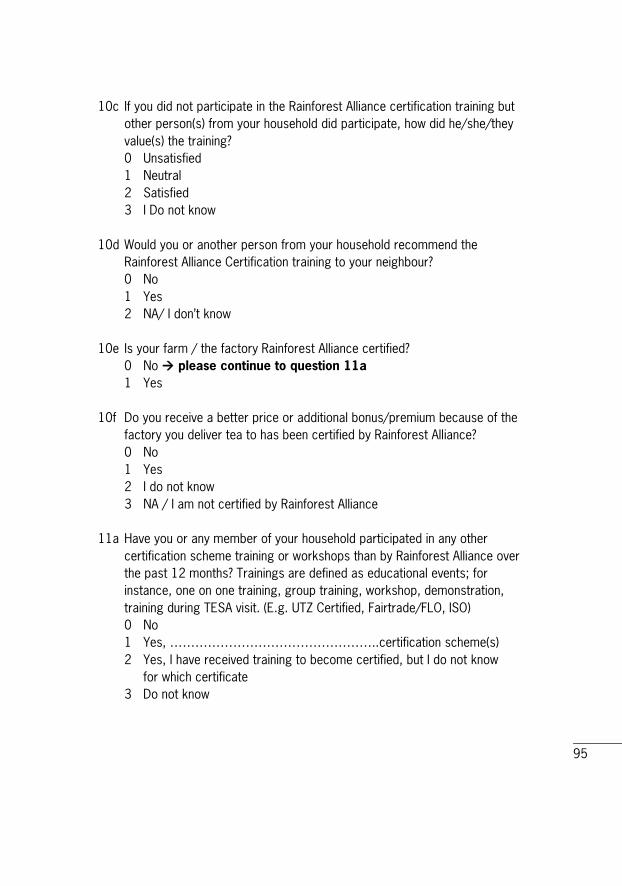
95
10c If you did not participate in the Rainforest Alliance certification training but other person(s) from your household did participate, how did he/she/they value(s) the training? 0 Unsatisfied 1 Neutral 2 Satisfied 3 I Do not know
10d Would you or another person from your household recommend the
Rainforest Alliance Certification training to your neighbour? 0 No 1 Yes 2 NA/ I don’t know
10e Is your farm / the factory Rainforest Alliance certified?
0 No please continue to question 11a 1 Yes
10f Do you receive a better price or additional bonus/premium because of the
factory you deliver tea to has been certified by Rainforest Alliance? 0 No 1 Yes 2 I do not know 3 NA / I am not certified by Rainforest Alliance
11a Have you or any member of your household participated in any other
certification scheme training or workshops than by Rainforest Alliance over the past 12 months? Trainings are defined as educational events; for instance, one on one training, group training, workshop, demonstration, training during TESA visit. (E.g. UTZ Certified, Fairtrade/FLO, ISO) 0 No 1 Yes, …………………………………………..certification scheme(s) 2 Yes, I have received training to become certified, but I do not know
for which certificate 3 Do not know

96
11b Have you or any member of your household participated in any non-certification scheme training or workshops over the past 12 months (trainings defined as educational events; for instance, one-on-one training, group training, workshop, demonstration, training during TESA visit)? 0 No 1 Yes Skip question 12
12 If no, what was the reason?
a) No training offered b) Offered, but could not get to training, no transportation or resources c) Offered, but other reasons for not attending (no time, not interested
in topic). 13 If yes, how many trainings (trainings defined as educational events; for
instance, one on one training, group training, workshop, demonstration, training during TESA visit) have you and other persons from your household attended in the past 12 months? a) 1 training b) Between 1-5 trainings c) More than 5 trainings d) I do not know
14 Did the person(s) that participated in training follow the following topics?
(one-on-one training, group training, workshop, demonstration, training during TESA visit)? Fill in 1 for yes or 0 for no in column 1. (If yes, who gave the training? Fill in number 1 to 6).
Topics Attended training
on this topic?
[1 = Yes; 0 = No;
2= Do not know]
Who gave the
training?
(mention
organization name)
Name the type
of organization
(see below for
options)
Crop production (for
instance new crops)
a1………
a2…………………
Health and safety (for
instance HIV/AIDS,
housekeeping, food)
b1………
b2……………………
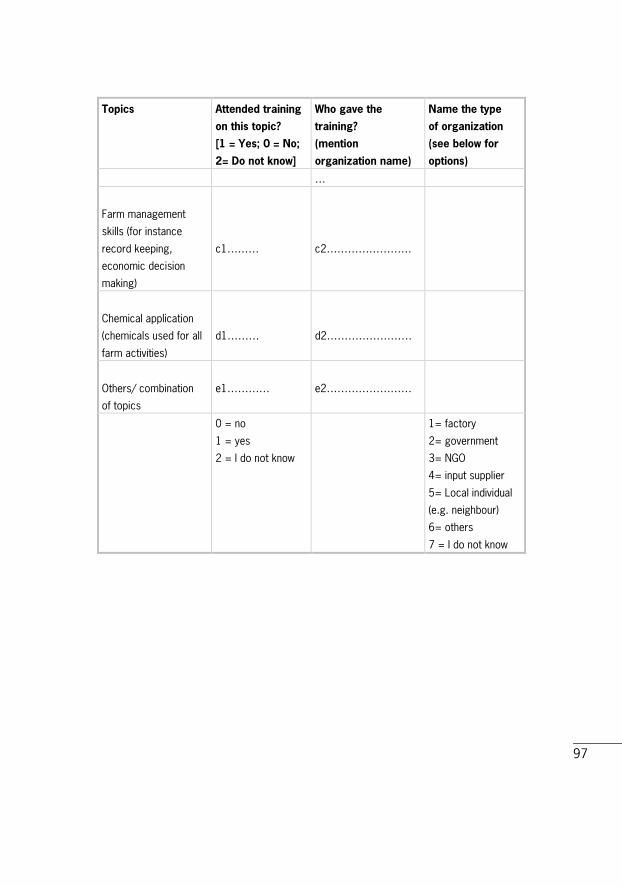
97
Topics Attended training
on this topic?
[1 = Yes; 0 = No;
2= Do not know]
Who gave the
training?
(mention
organization name)
Name the type
of organization
(see below for
options)
…
Farm management
skills (for instance
record keeping,
economic decision
making)
c1………
c2……………………
Chemical application
(chemicals used for all
farm activities)
d1………
d2……………………
Others/ combination
of topics
e1…………
e2……………………
0 = no
1 = yes
2 = I do not know
1= factory
2= government
3= NGO
4= input supplier
5= Local individual
(e.g. neighbour)
6= others
7 = I do not know

98
B: Implementation of sustainable practices 1. Answering options should not be read out to the households, options are
for enumerators’ convenience only! 2. Select one answer option per question by circling the corresponding letter,
apart from questions with questions which state multiple answers can be given
3. Do not give any additional information about the ‘right’ answers as we will be questioning knowledge later on.
Profit (questions are all related to tea) 1 How many times does your household pluck tea in the same tea plot per
month (this refers to a normal month- when there is no drought and it is not very cold)? a) 4 times (every 7-8 days) b) 3 times (every 10 days) c) 2 times (every 2 weeks) d) Less than twice (less than once every 2 weeks)
2 Where does your household experience leaf spillage at the farm, during
transport to buying centre or at the buying centre? a) No spillage at all places b) Spillage in all three places c) Spillage at home only d) Spillage at BC only e) Spillage during transport
3 Does your household use a plucking stick/wand? Is the table firm
(Interviewer to observe) a) Use stick & table firm b) Use stick table not firm c) No stick table firm d) No stick table not firm
4 If you or your household raise your own planting material: what is the
success rate in your nursery? a) High (More than 80% success rate) b) Mediate (Between 80% and 50% success rate)
99
c) Low (Less than 50% success rate) d) N/A – i.e. no planting or infilling in the last few years, used external
source, or farmer does not want to tell. 5 What clones have been planted in your household’s nursery? (Enumerator: multiple answers can be circled)
a) 6/8 b) 31/8 c) 303/577 d) SFS 15/10 e) Any other/ do not know which clones f) N/A, no nursery
6 When are VP plants in-filled in the tea plots? (Enumerator: multiple answers can be circled)
a) During heavy rains. b) During moderate/light rains. c) During dry season. d) None of the above.
7 What is the percentage crop cover (absence of gaps in the tea) on your
farm (interviewer to ask and observe)? a) 90-100% b) 75%- 90% c) Less than 75%
8 At what height is mature tea pruned?
a) 20 inches and above b) Below 20 inches c) N/A d) Do not know
9 At what period are tea bushes pruned?
a) Dry season (January – March) b) Wet season (April – May/ October - December) c) Cold season (June – August) d) Warm season (September)
100
10 How often is the same tea plot/block pruned? a) Prune every 6 (or more) years b) Prune every 3-5 years c) Prune every 1 or 2 years
11 What is the major tool used to prune the tea your household produces?
a) Use pruning knife b) Use pruning machine c) Other tools
12 Who prunes the tea bushes and have they been trained?
a) Untrained family member. b) Trained family member. c) Untrained non family member. d) Trained non family member
13 At what height are your bushes tipped in?
a) More than 6 inches above pruning height b) 4 to 6 inches above pruning height c) Less than 4 inches above pruning height
14 How frequently do you apply composted manure (= organic fertilizer)?
a) Never / do not apply b) Less than once every three years c) Every three years d) More often than once every three years
15 How frequently do you apply chemical fertilizer?
a) Once per year b) Twice a year c) More than twice per year d) Never / Do not apply
16 Do you keep records on input use and production?
a) Only records on production/sales b) Only records on inputs c) Records on input use and production d) No records kept
101
People (question 17 about tea, other questions about the whole production system) 17 Who plucks your tea?
a) Only household members b) Regular workers c) Seasonal workers d) Mixture of household members and workers
18 Do you hire workers? Do you have agreements with hired workers about
pay and timing of payment? a) Yes, agreement in writing b) Yes, oral agreements c) No d) I do not hire workers, only family members work on the farm
please go to question 19b 19 Do your workers have access to easily accessible water for drinking and
latrines? a) Access to potable water b) Access to latrines c) Both d) Neither
19b Does your household have access to easily accessible water for drinking
and latrines? a) Access to potable water b) Access to latrines c) Both d) Neither
20 How often did your family or any of your workers need medical attention
after injury on the farm for example fractures or wounds requiring stitches, in the last 12 months? a) More than three occasions b) On one or two occasions c) No occasions
102
21 When chemicals are sprayed, which personal protective equipment (PPE) does your family or your workers use? a) All PPE (Mask, gloves, boots, overall, goggles) b) Some of the above PPE c) No PPE d) N/A (don’t spray)
22 Do you group together with other farmers to carry out certain activities
e.g. sourcing of fertilizer, leaf transport, plucking etc.? a) Yes b) No continue with question 23
22b If yes, do you group together with other farmers more frequent than
2 years ago? 0 Less frequent 1 Neutral 2 More frequent 3 I do not know
23 Do you turn to KTDA if you experience any problems in your tea
production? a) Yes b) No
24 Do your children go to school?
a) N/A, no, the children are too young or too old to go to school b) No, some children are not going to school although they have the age
to attend primary or secondary school c) Yes, all children in the age to attend primary or secondary school are
attending school d) Yes, all children in the age to attend primary or secondary school are
attending school and one or more children are following college or university
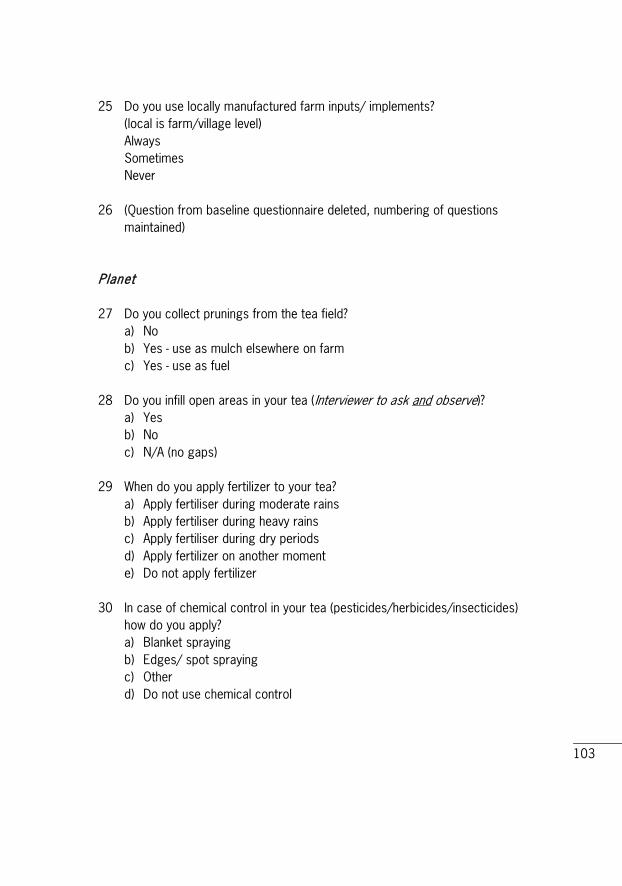
103
25 Do you use locally manufactured farm inputs/ implements? (local is farm/village level) Always Sometimes Never
26 (Question from baseline questionnaire deleted, numbering of questions
maintained) Planet 27 Do you collect prunings from the tea field?
a) No b) Yes - use as mulch elsewhere on farm c) Yes - use as fuel
28 Do you infill open areas in your tea (Interviewer to ask and observe)?
a) Yes b) No c) N/A (no gaps)
29 When do you apply fertilizer to your tea?
a) Apply fertiliser during moderate rains b) Apply fertiliser during heavy rains c) Apply fertiliser during dry periods d) Apply fertilizer on another moment e) Do not apply fertilizer
30 In case of chemical control in your tea (pesticides/herbicides/insecticides)
how do you apply? a) Blanket spraying b) Edges/ spot spraying c) Other d) Do not use chemical control

104
31 Does your farm border a river or water body? If so, do you have a Riparian strip covered by indigenous vegetation and how wide is it A Riparian strip is a strip of indigenous vegetation between rivers or other water bodies and cultivated field (Interviewer to ask and observe)? a) No; farm does not border a river or water body b) Yes, farm borders a river/ water body, but no Riparian strip c) Yes, a strip less than 10 meter d) Riparian strip wider than10 meters, but smaller than 30 meters e) Riparian strip wider than 30 meter
32 Do you have indigenous trees on your farm? If so how many in total on
your land? a) More than 10 indigenous trees b) Between 5 and 10 c) Less than 5 d) No native trees
33 If your farm borders a water stream, how many eucalyptus trees are
growing within 10 meters of the water stream? a) More than 50 trees b) Between 20 and 50 trees c) Between 5 and 20 trees d) Zero to 5 trees e) N/A farm does not border river
33a Have you changed the number of eucalyptus trees within 10 meters of
the water stream in the last 2 years? a) We have no eucalyptus tree within 10 meters of the water stream b) Reduced c) Maintained d) Increased e) Do not know

105
34 if your farm borders a water body, what distance do you leave out without applying agrochemicals and chemical fertilizer, compost and organic matter? a) No area is left b) 0 – 5 metres c) 5 – 15 metres d) Over 15 metres e) N/A farm does not border a river
35 How much area of the total farm is conservation area (area under
indigenous trees/ natural vegetation)? a) More than 10% b) Between 2 % and 10% c) Zero to 2 %
36 What is your main source of energy for domestic purposes?
a) Renewable firewood from Eucalyptus and Grivellia trees, electricity, solar, biogas (= sustainable sources)
b) A mixture of sustainable and unsustainable (petroleum products, bottled gas, ….) sources
c) Cutting down of indigenous trees (= unsustainable) d) Petroleum products (= unsustainable)
37 What is your main source of water for domestic use?
a) River/ stream or spring b) Tap c) Harvested rainwater
38 How do you manage household waste water and effluent from livestock
(interviewer to observe if possible)? a) Presence of soak pits/ waste pits; b) Other ways of filtering water c) Part of the waste in soak pits, part runs directly into farm d) Discharge direct onto the farm or into waterways
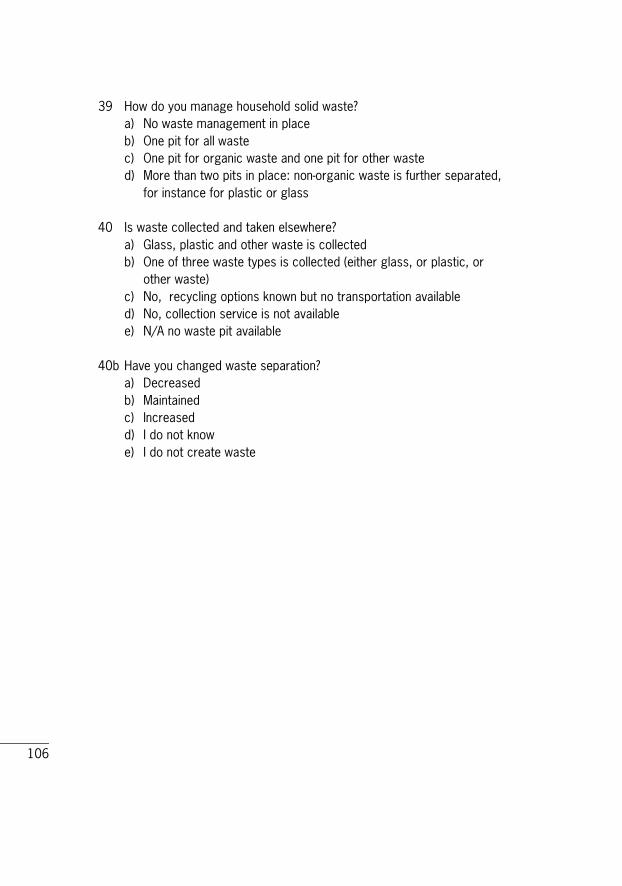
106
39 How do you manage household solid waste? a) No waste management in place b) One pit for all waste c) One pit for organic waste and one pit for other waste d) More than two pits in place: non-organic waste is further separated,
for instance for plastic or glass 40 Is waste collected and taken elsewhere?
a) Glass, plastic and other waste is collected b) One of three waste types is collected (either glass, or plastic, or
other waste) c) No, recycling options known but no transportation available d) No, collection service is not available e) N/A no waste pit available
40b Have you changed waste separation?
a) Decreased b) Maintained c) Increased d) I do not know e) I do not create waste

107
C: Tea production We would like to know more about your tea production. 1. Tea production Product What is the
area in
acre on
which you
grow tea?
What is
the total
number of
bushes
owned?
What is the
total amount
of green leaf
you produced
in the last 12
months in
kilograms?
Average Price
paid by the
factory per
kilogram in the
July 2010 –
June 2011
financial year? (without bonus)
Last bonus
paid by the
factory per
kilogram?
(July 2010-
June 2011)
Tea 1a……….. 1b………. 1c………….. 1d…………….. 1e…………..
1f How many times was your tea rejected by the buying centre the last
12 months? 0 Never please skip question 1h 1 Less than 3 times 2 More than 3 times 3 I do not know
1g How many times was your tea rejected by the buying centre 2 years ago?
0 Never please skip question 1i 1 Less than 3 times 2 More than 3 times 3 I do not know
1h How many kilograms of your tea was rejected by the buying centre in
the last 12 months?
……………………………………………………………........................ 1i How many kilograms of your tea was rejected by the buying centre
2 years ago? …………………………………………………………….........................

108
2. Labour for tea (tea production within your household, not work for someone else)
1) How much time is spent on tea production? This can be both family and
hired labour. We ask these questions for plucking weeding and pruning. The unit is different per activity. Example: for weeding we ask the days per year spent on weeding.
2) The cost of hired labour are in different units. Tea plucking is cost per kg of green leaves, while for other activities the costs per day or per bush should be stated.
If the labour is family labour the costs are zero. Activity Quantity Unit of
measurement Cost (Family
labour cost = 0) Per unit:
Plucking 1b……………… KSh/Kg green
tea leaves
Weeding 3a……………….. Days last year 3b……………… Per day
Pruning 4a………………. Number of
bushes last year 4b…………….. KSh/ bush
Applying
fertilizer 5a………………. Number of bags
applied last year 5b……………… KSh/bag
applied
6a. Do you hire more people than 2 years ago for plucking, weeding, pruning,
fertilizer application? 0 No 1 Yes, less than 2 2 Yes, between 2 and 5 3 Yes, more than 5
6b. Do you spend more time on fertilizer application than two years ago?
0 Yes, I spend more time on fertilizer application than two years ago 1 No, I spend less time on fertilizer than two years ago 2 No, I spend the same time on fertilizer application than two years ago
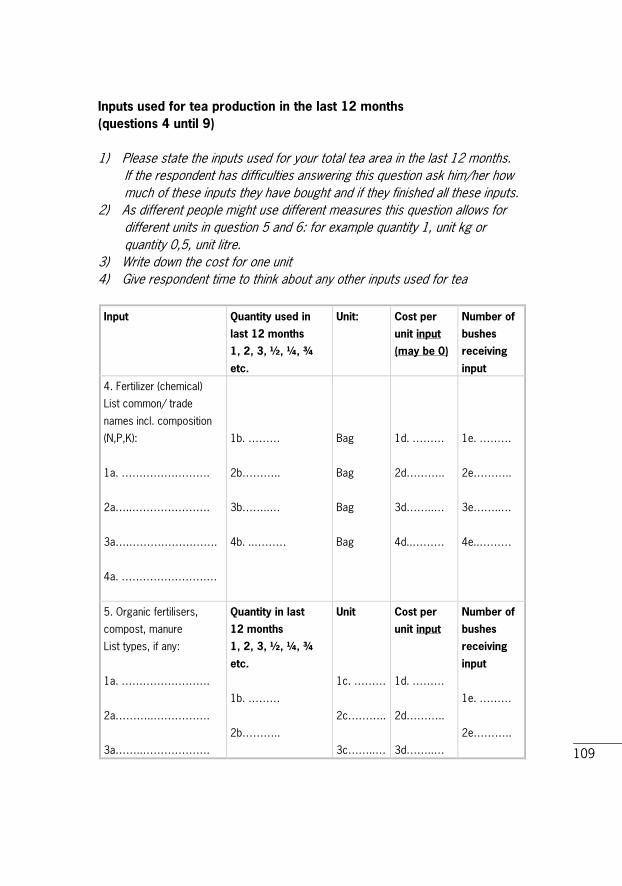
109
Inputs used for tea production in the last 12 months (questions 4 until 9) 1) Please state the inputs used for your total tea area in the last 12 months.
If the respondent has difficulties answering this question ask him/her how much of these inputs they have bought and if they finished all these inputs.
2) As different people might use different measures this question allows for different units in question 5 and 6: for example quantity 1, unit kg or quantity 0,5, unit litre.
3) Write down the cost for one unit 4) Give respondent time to think about any other inputs used for tea
Input Quantity used in
last 12 months
1, 2, 3, ½, ¼, ¾
etc.
Unit:
Cost per
unit input
(may be 0)
Number of
bushes
receiving
input
4. Fertilizer (chemical)
List common/ trade
names incl. composition
(N,P,K):
1a. …………………….
2a…..………………….
3a….…………………….
4a. ………………………
1b. ………
2b………..
3b……..…
4b. ..………
Bag
Bag
Bag
Bag
1d. ………
2d………..
3d……..…
4d..………
1e. ………
2e………..
3e……..…
4e..………
5. Organic fertilisers,
compost, manure
List types, if any:
1a. …………………….
2a………..…………….
3a……..……………….
Quantity in last
12 months
1, 2, 3, ½, ¼, ¾
etc.
1b. ………
2b………..
Unit
1c. ………
2c………..
3c……..…
Cost per
unit input
1d. ………
2d………..
3d……..…
Number of
bushes
receiving
input
1e. ………
2e………..

110
Input Quantity used in
last 12 months
1, 2, 3, ½, ¼, ¾
etc.
Unit:
Cost per
unit input
(may be 0)
Number of
bushes
receiving
input
4a. .…………………
3b……..…
4b. ..………
4c. ..…….
4d. ..………
3e……..…
4e..………
6. Other chemicals
(pesticides/ herbicides/
insecticides), if any:
List common/ trade
names:
1a. ………………….
2a………..…………….
3a……..…………….
4a. ..……………………..
Quantity in last
12 months
1, 2, 3, ½, ¼, ¾
etc.
1b. ………
2b………..
3b……..…
4b. ..………
Unit:
1c. ………
2c………..
3c……..…
4c. ..…….
Cost per
unit input
1d. ………
2d………..
3d……..…
4d. ..………
Number of
bushes
receiving
input
1e. ………
2e………..
3e……..…
4e..………
7. New tea plants, if any
b…………….
Number in
last year:
d……………
8. Other input used:
8a…………………………
…………………………
b…………….. c………… d……………
.
9. Other input used:
9a…………………………
…………………………..
b……………… c………. d………….
10 Do you use bio-pesticides/ organic pesticides?
0 No skip question 11 1 Yes
11 If yes, do you use bought or home- made bio-pesticides?
1 Bought bio pesticides (include pesticide in question 6) 2 Home-made

111
Cost for other crop production than tea production Please state the inputs used for your production system (excluding inputs for tea) in the last 12 months. If the respondent has difficulties answering this question ask him/her how much of these inputs they have bought and if they finished all these inputs. 1) As different people might use different measures this question allows for
different units in question 13: for example quantity 1, unit kg or quantity 0,5, unit litre.
2) Write down the cost for one unit Input Quantity in last
12 months
1, 2, 3, ½, ¼, ¾ etc
Unit Cost per unit
of input
12. Fertilizer (chemicals)
List common/ trade names
incl. composition (N, P, K):
1a………………………….
2a………..………………….
3a……..…………………….
4a...……………………….
1b………
2b………..
3b……..…
4b..………
Bag
Bag
Bag
Bag
1d. ………
2d………..
3d……..…
4d..………
13. Other chemicals
(pesticides/ herbicides/
insecticides)
List common/trade name:
1a. ………………………….
2a………..………………….
3a……..…………………….
4a..……………………......
Quantity in last 12
months
1, 2, 3, ½, ¼, ¾ etc
1b………
2b………..
3b……..…
4b.………
5b………
Unit
1c………….
2c………….
3c………….
4c………….
5c………….
Cost per unit
1d. ………
2d………..
3d……..…
4d..………
5d………….

112
Input Quantity in last
12 months
1, 2, 3, ½, ¼, ¾ etc
Unit Cost per unit
of input
5a………………………….
6a………..………………….
7a……..…………………….
8a..……………………......
9a……………………………
10a…………………………..
6b………..
7b……..…
8b. ..………
9b………….
10b………….
6c………….
7c………….
8c………….
9c………….
10c………...
6d………….
7d………….
8d………….
9d………….
10d………...
14. Personal protective
equipment bought by your
household in the last
12 months, if any:
1 Overall
2 Hat
3 Mask/respirator
4 Gumboots
5 Goggles
6 Apron/plucking cape
7 Full PPE set
(Answer will often be 1)
1a…………..
2a…………..
3a…………..
4a…………..
5a…………..
6a…………..
7a…………..
Piece
Piece
Piece
Piece
Piece
Piece
Piece
1d.…………
2d………….
3d………….
4d………….
5d………….
6d…………..
7d………….

113
15 Does your household have any loans at this moment? 0 No please skip question 16 1 Yes
16 If yes, did the amount of money your household borrows change between
now and 2 years ago? 0 The amount decreased 1 the amount staid the same 2 the amount increased

114
D: Other sources of income in the last 12 months 1 Can you state the total number of other sources of income for your family
other than from tea production, in the last 12 months? 0 Zero 1 1 2 2 3 3 4 4 or more
2 Can you give an approximation of the percentage of income from tea
production in household income, in the last 12 months? 0 100% 1 Between 80 and 100% 2 Between 60 and 79% 3 Between 40 and 59% 4 Between 20 and 39% 5 Less than 20%
3. Has the area of your farmland used for tea production changed between
now and 2 years ago? 0 The area used for tea production decreased 1 the area used for tea production stayed the same 2 The area used for tea production has increased
4 Can you indicate the monthly income earned from all your activities except
tea production over the last 12 months?
0 <2000 KSh per month 1 2000–5000 KSh per month 2 5000–10,000 KSh per month 3 10,000–15,000 KSh per month 4 15,000–20,000 KSh per month 5 >20,000 KSh per month
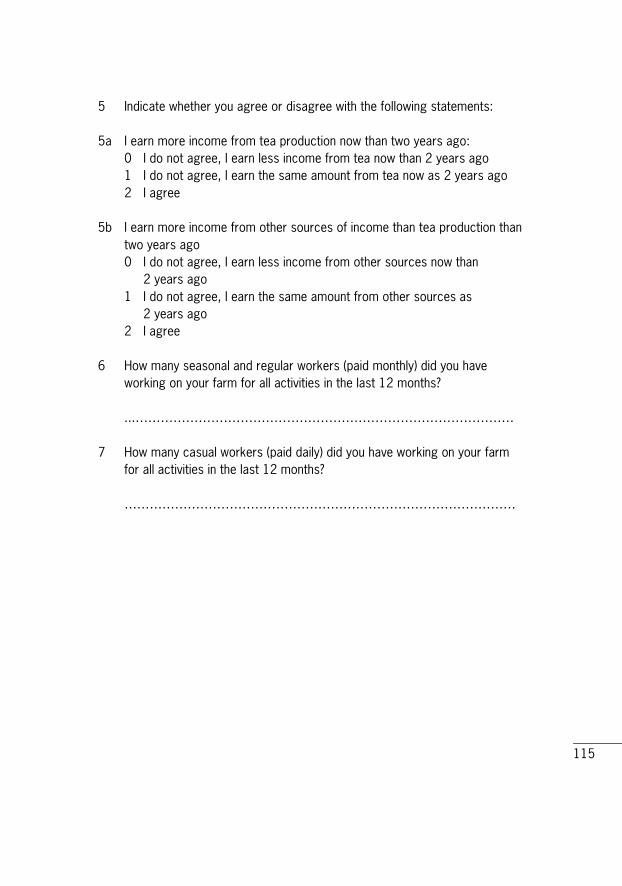
115
5 Indicate whether you agree or disagree with the following statements: 5a I earn more income from tea production now than two years ago:
0 I do not agree, I earn less income from tea now than 2 years ago 1 I do not agree, I earn the same amount from tea now as 2 years ago 2 I agree
5b I earn more income from other sources of income than tea production than
two years ago 0 I do not agree, I earn less income from other sources now than
2 years ago 1 I do not agree, I earn the same amount from other sources as
2 years ago 2 I agree
6 How many seasonal and regular workers (paid monthly) did you have
working on your farm for all activities in the last 12 months?
...……………………………………………………………………………… 7 How many casual workers (paid daily) did you have working on your farm
for all activities in the last 12 months?
…………………………………………………………………………………

116
E: Knowledge and skills learned 1. Answering options should not be read out to the households, options are
for enumerators’ convenience only! 2. In this part it is encouraged that the enumerators stimulate the farmers to
give more options (time to think), but never mention the options! 3. Select the given option by circling the corresponding letter, more answer
options can be selected 1 Can you mention some benefits of leaving prunings in the field?
a) To suppress weeds b) To prevent soil erosion c) To improve soil structure d) Releases nutrients into the top soil at decomposition e) Reduces loss of water by evaporation (mulch) f) None of the above/I do not know
2 Can you mention the best height to prune mature tea?
a) Never below 20 inches b) 2 inches above the former height c) After reaching 28 inches, the bush should be down pruned to 21 inches d) None of the above/I do not know
3 Can you mention reasons to prune tea?
a) To maintain a manageable plucking table b) To rejuvenate the bush/increase production c) To remove diseased, dead and knotted branches d) None of the above/I do not know
4 Can you mention some recommended methods for handling weeds in tea?
a) Slashing using panga b) Use of plain jembe c) Uprooting using hands d) Use of round up for perennial weeds such as couch grass (new fields
and young tea only) e) None of the above/I do not know
5 Can you mention benefits of fertilizer application to tea?
a) Get better yields of green leaf. b) Get better quality of green leaf
117
c) Maintain the tea bush for a long time d) Increase nutrients to soil/improve soil fertility. e) None of the above/I do not know
6 Can you mention any benefits of plucking tea every 7 to 8 days (during normal weather)? a) To maintain good quality (older tea is of less quality; more than 2
leaves per bud) b) To maintain enough yield (if leaves are plucked too early this leads to
less yield; less than 2 leaves per bud) c) To maintain good plucking table d) None of the above/I do not know
7 Can you mention any benefits of maintaining a plucking table? (A plucking
table is the surface of the tea bush from which the farmer plucks the tea, 2 leaves and a bud.) a) Yields increase when shoots can grow because they are not hindered
by shade b) Shoots are missed during plucking/plucking goes faster with an even
plucking table c) None of the above/I do not know
8 Can you mention any benefits of infilling?
a) Maximizes the yield of land in tea production/increases yield b) Reduces weeding efforts c) None of the above/I do not know
9 Can you mention the best height for tipping-in tea?
a) 4 inches above pruning height b) None of the above/I do not know
10 A riparian strip is a strip of indigenous vegetation between rivers or other
water bodies and cultivated field. Can you mention any benefits of a riparian strip? a) A riparian strip helps protect and conserve wetlands b) A riparian strip helps prevent soil erosion c) A riparian strip enriches biodiversity d) A riparian strip forms a buffer so that pollution cannot reach the water e) None of the above/I do not know
118
11 What are the benefits of personal protective equipment (PPE)? a) Protects your skin from chemicals b) Protects you from inhaling chemicals c) Protects your feet from chemicals d) Prevents illness e) None of the above/I do not know
12 What are the potential dangers of applying agrochemicals and fertilizer
near the natural water bodies like rivers, streams, pools, ponds, etc.? a) Kill the aquatic life (water plants and animals) b) Kill the plants growing near the water body c) Poison the people drinking water downstream d) None of the above/I do not know
13 Why is application of agrochemicals discouraged in tea?
a) High cost of agrochemicals b) Harmful effect on people c) Risk of getting into made tea d) Loss of market for tea e) Harmful effect on the environment f) None of the above/I do not know
14 What methods can you use to improve the yield and quality of tea in your
farm? a) Application of the correct fertilizer at the right time. b) Regular plucking rounds c) Maintaining the plucking table. d) Training of pluckers e) None of the above/I do not know
15 What are the benefits applying soil conservation measures?
a) Preserve soil fertility b) Prevent loss of soil c) Get high production d) Prevent siltation in water bodies e) None of the above/I do not know
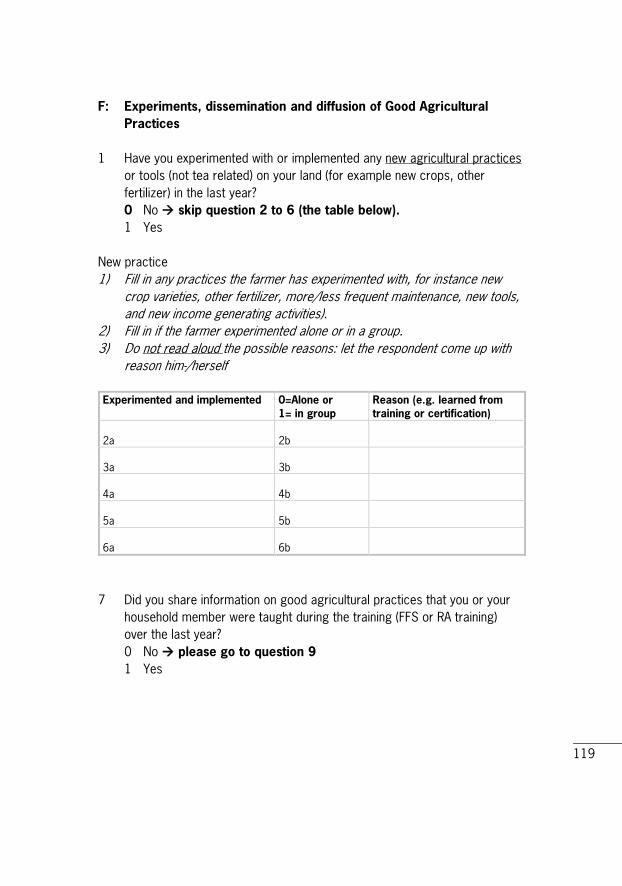
119
F: Experiments, dissemination and diffusion of Good Agricultural Practices
1 Have you experimented with or implemented any new agricultural practices
or tools (not tea related) on your land (for example new crops, other fertilizer) in the last year? 0 No skip question 2 to 6 (the table below). 1 Yes
New practice 1) Fill in any practices the farmer has experimented with, for instance new
crop varieties, other fertilizer, more/less frequent maintenance, new tools, and new income generating activities).
2) Fill in if the farmer experimented alone or in a group. 3) Do not read aloud the possible reasons: let the respondent come up with
reason him-/herself
Experimented and implemented 0=Alone or 1= in group
Reason (e.g. learned from training or certification)
2a
2b
3a
3b
4a
4b
5a
5b
6a
6b
7 Did you share information on good agricultural practices that you or your
household member were taught during the training (FFS or RA training) over the last year? 0 No please go to question 9 1 Yes

120
8 If yes, did any of your friends, relatives or neighbours that you shared information with (about RA/FFS training) changed their tea production practices due to the information they got from you? 0 No 1 Yes 2 I do not know
9 How often do your neighbours share information on good practices with
you or your household members? 1 Daily 2 Weekly 3 Monthly 4 Yearly 5 Never
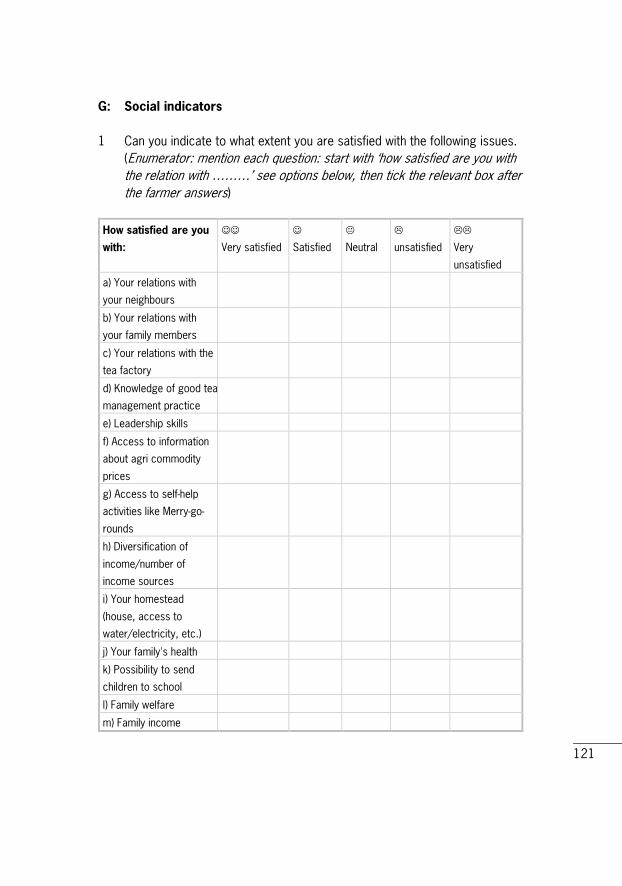
121
G: Social indicators 1 Can you indicate to what extent you are satisfied with the following issues. (Enumerator: mention each question: start with ‘how satisfied are you with
the relation with ………’ see options below, then tick the relevant box after the farmer answers)
How satisfied are you
with:
Very satisfied
Satisfied
Neutral
unsatisfied
Very
unsatisfied
a) Your relations with
your neighbours
b) Your relations with
your family members
c) Your relations with the
tea factory
d) Knowledge of good tea
management practice
e) Leadership skills
f) Access to information
about agri commodity
prices
g) Access to self-help
activities like Merry-go-
rounds
h) Diversification of
income/number of
income sources
i) Your homestead
(house, access to
water/electricity, etc.)
j) Your family's health
k) Possibility to send
children to school
l) Family welfare
m) Family income

122
H1: The Farmer Field School (for respondents where a household member has participated
in FFS) 1 Rate the various aspects of the FFS according to your expectations and
the aspects' usefulness. How satisfied were you with the following aspects of the FFS? (Enumerator: put a tick in the square that corresponds with the given answer)
Aspect: how
satisfied are
you with…?
Very
satisfied
Satisfied
Neutral
unsatisfied
Very
unsatisfied
Not
applicable
Curriculum
development
Role of facilitators
Group organization
(officials, subgroup)
Frequency of
meetings
Time necessary
Special topic
sessions
FFS commercial
activities
Group dynamics
2 FFS consist of trials and special topic sessions. Do you prefer to
participate in trials or special topic session? a) Trials b) Special topic sessions c) Both
3 Do you feel you learned more from the topic session or from the trials?
a) Trials b) Special topic sessions c) Both

123
4a Have you or your household benefitted from participating in the Farmer Field School a) Yes please go to question 4c b) No please skip question 4c
4b If you have not benefitted from participating in the Farmer Field School,
why not?
………………………………………………………………………………… 4c What benefits have you or your household realized from participating in the
Farmer Field School? (Enumerator: write down maximum 3 benefits)
…………………………………………………………………………………
…………………………………………………………………………………
………………………………………………………………………………… 5 What would you like to see changed in the organization of the Farmer Field
Schools to improve its functioning in the future? (Enumerator: write down maximum 3 changes)
…………………………………………………………………………………
…………………………………………………………………………………
…………………………………………………………………………………
6 Do you think your FFS group will continue to exist after you have
graduated? 0 No 1 Yes

124
H2: Rainforest Alliance certification (for respondents where a household member has participated in
RA training, or for households whose farm/factory has become RA certified (see questions 9, 10, 10d))
7a Have you or your household benefitted from participating in the RA
certification activities 0 Yes please go to question 7c 1 No please skip question 7c
7b If you have not benefitted from participating in the Farmer Field School,
why not?
………………………………………………………………………………… 7c What benefits have you or your household realized from participating in RA
certification activities? (Enumerator: write down maximum 3 benefits)
…………………………………………………………………………………
…………………………………………………………………………………
…………………………………………………………………………………
………………………………………………………………………………… 8 What would you like to see changed in the organization of RA certification
activities to improve on its functioning in the future? (Enumerator: write down a maximum of 3 changes)
…………………………………………………………………………………
…………………………………………………………………………………
…………………………………………………………………………………
125
That was the last question in this questionnaire. Thank you very much for your time and effort to help us understand more about tea production. Is there anything else you would like to tell us or ask us? Do you have any comments? ……………………………………………………………………………………….. ……………………………………………………………………………………….. ……………………………………………………………………………………….. Enumerator: please read through questionnaire to make sure no questions were left unanswered before leaving your farmer! Thank you!

126
Appendix 2b Focus group questionnaire KTDA Sustainable Agriculture Project Conditions: farmers should have sold tea in the June 2010–July 2011 financial year and between July 2011 and December 2011. Farmers should have been either members of FFSs or trained for RA/RA certified. A: Background information A Date of focus group discussion (dd-mm-yyyy) B Name of facilitator 1. Name of factory 2. Name of the FFS(s) of which the farmers are part 3. Number of FFS members in focus group
a) number of females b) number of males
4. Number of farmers trained for RA/certified RA in focus group a) number of females ………….. b) number of male ………………
5. Total number of people in the focus group B: FFS evaluation Training 1. Group history 2. Topics they have learnt at an FFS 3. Adoption: implementation of practices 4. Perception of usefulness of various training

127
Dissemination and diffusion 5. Information and technologies disseminated to immediate neighbours in same
BC 6. Adoption by people receiving information from FFS members 7. Information and technologies disseminated to people from other BC 8. Adoption by people receiving information from FFS members Benefits 9. What benefits from participating in FFS (household level, FFS group level,
community level) (Social benefits, environmental, production at farm level, financial)
Sustainability of FFS 10. How they will continue FFS after graduation or what they have been doing
since graduation (group (registration, bylaws), financial, social: leadership) 11. Impression: scale up to thousands of farmers, what do they propose that
can be done to scale up? Challenges and recommendations 12. Challenges/pressing issues 13. What would you like see changed in the organization of the FFS to improve
its functioning in the future? C: RA evaluation Training 14. Training topics: what they have learnt 15. Adoption: implementation of practices (compliance) 16. Perception of usefulness of training activities Dissemination and diffusion 17. Discussion with neighbours about what they have learnt during the training Benefits 18. What benefits from factory undergoing RA certification/being RA certified
(household level, FFS group level, community level). (Social benefits, environmental, production at farm level, financial.)

128
Sustainability of RA certification compliance 19. Continuous improvement (better to discuss with FSCs like Mr Lee: Kinoro) Challenges and recommendations 20. Challenges/pressing issues 21. What would you like see changed in the organization of the RA
training/certification to improve its functioning in the future? That was the last question in this focus group discussion. Thank you very much for your time and effort to help us understand more about FFS and RA certification. Is there anything else you would like to tell us or ask us?

129
Appendix 3 Sustainability questions and score B1_Pluc ('a'=1) ('b'=0.7) ('c'=0.2) ('d'=0) B2_Spil ('a'=1) ('b'=0) ('c'=0.3) ('d'=0.3) ('e'=0.3) B3_Stic ('a'=1) ('b'=0.5) ('c'=0.8) ('d'=0). B4_Rais ('a'=1) ('b'=0.5) ('c'=0) ('d'=0.5) B6_VP ('a'=0.5) ('b'=1) ('c'=0) ('d'=0) B7_Cove ('a'=1) ('b'=0.8) ('c'=0.4) ('d'=0) B8_Pru1 ('a'=1) ('b'=0) ('c'=0) B9_prun2 ('a'=0) ('b'=0) ('c'=1) ('d'=0) B10_Pru3 ('a'=0.4) ('b'=1) ('c'=0.6) ('d'=0) B11_tool ('a'=0.6) ('b'=1) ('c'=0) b12_trai ('a'=0) ('b'=1) ('c'=0) ('d'=1) B13_tip ('a'=0.2) ('b'=1) ('c'=0.2) ('d'=0) B14_manu ('a'=0) ('b'=0.4) ('c'=1) ('d'=0.6) B15_fert ('a'=1) ('b'=0) ('c'=0) B16_reco ('a'=0.5) ('b'=0.5) ('c'=1) ('d'=0) B17_pluck ('a'=0.8) ('b'=1) ('c'=0) ('d'=0.5) B18_agre ('a'=1) ('b'=1) ('c'=0)(‘d’=0.5) B19_sani ('a'=0.5) ('b'=0.5) ('c'=1) ('d'=0) B20_med ('a'=0) ('b'=0.2) ('c'=1) B21_ppe ('a'=1) ('b'=0.5) ('c'=0) ('d'=1) B22_grou ('a'=1) ('b'=0) B23_ktda ('a'=1) ('b'=0) B24_edu ('a'=0.5) ('b'=0) ('c'=0.8) ('d'=1) B25_loca ('a'=1) ('b'=0.5) ('c'=0) B26_Suppl ('a'=1) ('b'=0.5) ('c'=0) B27_prun ('a'=1) ('b'=0.5) ('c'=0) B28_infil ('a'=1) ('b'=0) ('c'=0.5) B29_When ('a'=1) ('b'=0) ('c'=0) ('d'=0) ('e'=0) B30_Spr ('a'=0) ('b'=1) ('c'=0.2) ('d'=1) B31_river ('a'=0.5) ('b'=0) ('c'=0.8) ('d'=1) B32_indi ('a'=1) ('b'=0.6) ('c'=0.3) ('d'=0) B33_Euca ('a'=0) ('b'=0.2) ('c'=0.4) ('d'=1) ('e'=0.5) B34_chem ('a'=0) ('b'=0.2) ('c'=0.8) ('d'=1) ('e'=0.5)

130
B35_cons ('a'=1) ('b'=0.8) ('c'=0.4) B36_ener ('a'=1) ('b'=0.5) ('c'=0) ('d'=0.4) B37_wate ('a'=0.4) ('b'=0.5) ('c'=1) B38_effl ('a'=1) ('b'=0.8) ('c'=0.5) ('d'=0) B39_wast ('a'=0) ('b'=0.4) ('c'=0.8) ('d'=1) B40_coll ('a'=1) ('b'=0.7) ('c'=0.1) ('d'=0.2) ('e'=0)
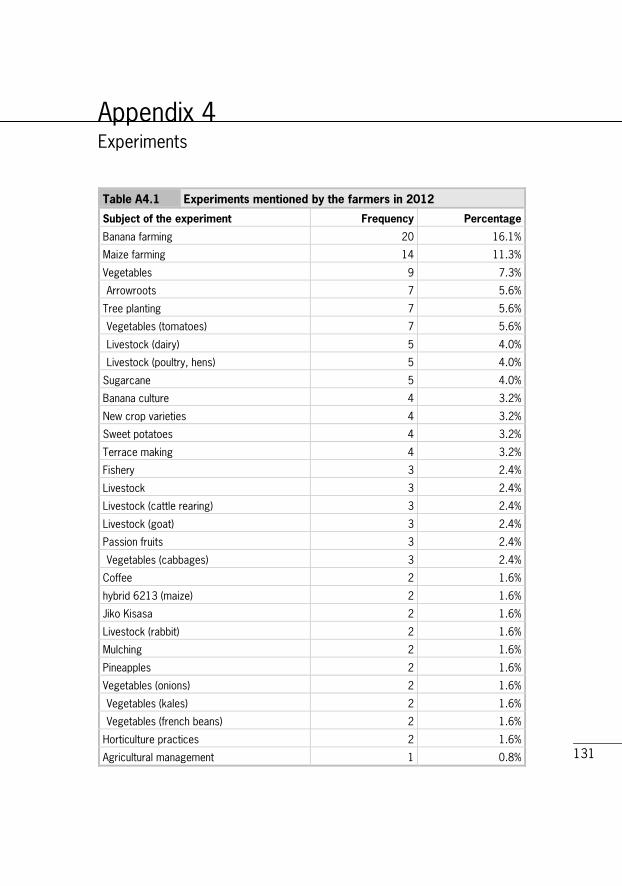
131
Appendix 4 Experiments Table A4.1 Experiments mentioned by the farmers in 2012
Subject of the experiment Frequency Percentage
Banana farming 20 16.1%
Maize farming 14 11.3%
Vegetables 9 7.3%
Arrowroots 7 5.6%
Tree planting 7 5.6%
Vegetables (tomatoes) 7 5.6%
Livestock (dairy) 5 4.0%
Livestock (poultry, hens) 5 4.0%
Sugarcane 5 4.0%
Banana culture 4 3.2%
New crop varieties 4 3.2%
Sweet potatoes 4 3.2%
Terrace making 4 3.2%
Fishery 3 2.4%
Livestock 3 2.4%
Livestock (cattle rearing) 3 2.4%
Livestock (goat) 3 2.4%
Passion fruits 3 2.4%
Vegetables (cabbages) 3 2.4%
Coffee 2 1.6%
hybrid 6213 (maize) 2 1.6%
Jiko Kisasa 2 1.6%
Livestock (rabbit) 2 1.6%
Mulching 2 1.6%
Pineapples 2 1.6%
Vegetables (onions) 2 1.6%
Vegetables (kales) 2 1.6%
Vegetables (french beans) 2 1.6%
Horticulture practices 2 1.6%
Agricultural management 1 0.8%

132
Table A4.1 Experiments mentioned by the farmers in 2012 (continued)
Subject of the experiment Frequency Percentage
Biogas 1 0.8%
Bought gas 1 0.8%
Bought new panga 1 0.8%
Coffee (Batian) 1 0.8%
Collecting waste 1 0.8%
Compost 1 0.8%
Cowpeas 1 0.8%
Crop management 1 0.8%
Fruit farming 1 0.8%
Good healthy/safety 1 0.8%
Good tea plucking practices 1 0.8%
Kitchen gardening 1 0.8%
Livestock (sheep) 1 0.8%
Beans 1 0.8%
Meco gas 1 0.8%
New crop varieties (beans) 1 0.8%
New crop varieties (butternut) 1 0.8%
New income-generating activities 1 0.8%
Organic fertilizers 1 0.8%
Planting riparian 1 0.8%
Potatoes 1 0.8%
PPE 1 0.8%
Pruning in coffee 1 0.8%
Pumpkin 1 0.8%
Soil erosion control 1 0.8%
Steria 1 0.8%
Sukuma wiki 1 0.8%
Tea infilling 1 0.8%
Tea management 1 0.8%
Vegetables (greenhouse tomatoes) 1 0.8%
Yams 1 0.8%
Zero grazing 1 0.8%

Appendix 5 Knowledge of Good Agricultural Practices (GAPs) Table A5.1 Knowledge scores on GAPs in the groups before and after the training
No.
Knowledge questions
RA + FFS RA FFS No RA or FFS Total
2010 2012 2010 2012 2010 2012 2010 2012 2010 2012
E1 Reason not to remove prunings from field 4.53 6.25 4.82 5.81 5.36 6.11 5.04 5.83 4.91 6.03
E2 The best height to prune tea 3.23 4.41 3.37 3.98 3.60 4.13 2.64 3.84 3.28 4.13
E3 Reasons to prune tea 4.51 6.57 4.98 6.06 4.85 5.91 5.00 5.43 4.80 6.09
E4 Methods for handling weeds in your tea 4.41 4.95 3.82 4.65 4.32 4.06 4.06 3.80 4.17 4.47
E5 Benefits of fertilizer 4.66 5.98 4.73 5.94 5.54 5.85 5.78 5.43 5.08 5.86
E6 Benefits of plucking frequency 7-8 days 4.90 5.95 5.56 6.27 5.68 6.20 5.28 5.65 5.35 6.07
E7 Benefits of maintaining a plucking table 5.93 7.45 6.45 6.88 6.14 6.59 5.31 6.74 6.04 6.96
E8 The main benefits from infilling 6.67 7.65 7.15 7.04 6.70 8.07 6.98 6.63 6.86 7.45
E9 The best height for tipping-in tea 8.04 9.80 8.82 10.00 8.75 8.02 7.66 9.78 8.39 9.39
E10 The benefit of a riparian strip 3.60 4.46 3.49 3.41 3.15 4.60 3.07 3.53 3.38 4.07
E11 Benefits PPE 4.66 5.47 4.35 5.62 4.97 6.11 4.79 5.54 4.68 5.69
E12 Dangers of agrochemicals and water 5.23 5.92 4.44 5.02 4.92 6.40 5.07 5.87 4.90 5.79
E13 Reasons to not use agrochemicals in tea 3.12 4.65 2.84 3.20 3.41 4.41 3.75 3.83 3.21 4.06
E14 Methods for improving yield and quality 4.63 6.05 4.41 5.91 5.17 6.01 5.16 4.95 4.79 5.85
E15 Benefits of soil conservations methods 4.00 5.83 4.35 4.68 4.80 5.49 4.53 5.00 4.39 5.30
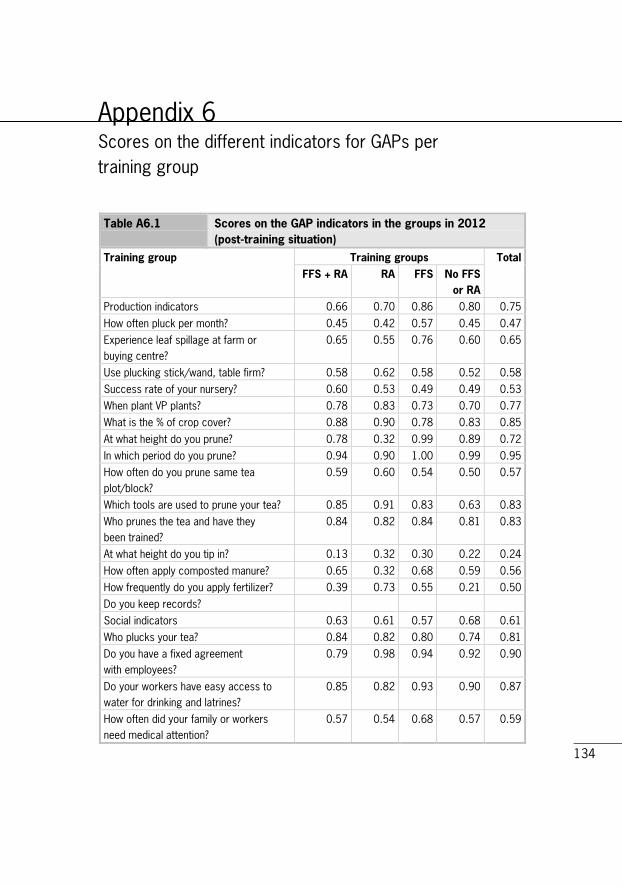
134
Appendix 6 Scores on the different indicators for GAPs per training group Table A6.1 Scores on the GAP indicators in the groups in 2012
(post-training situation) Training group Training groups Total
FFS + RA RA FFS No FFS or RA
Production indicators 0.66 0.70 0.86 0.80 0.75
How often pluck per month? 0.45 0.42 0.57 0.45 0.47
Experience leaf spillage at farm or buying centre?
0.65 0.55 0.76 0.60 0.65
Use plucking stick/wand, table firm? 0.58 0.62 0.58 0.52 0.58
Success rate of your nursery? 0.60 0.53 0.49 0.49 0.53
When plant VP plants? 0.78 0.83 0.73 0.70 0.77
What is the % of crop cover? 0.88 0.90 0.78 0.83 0.85
At what height do you prune? 0.78 0.32 0.99 0.89 0.72
In which period do you prune? 0.94 0.90 1.00 0.99 0.95
How often do you prune same tea plot/block?
0.59 0.60 0.54 0.50 0.57
Which tools are used to prune your tea? 0.85 0.91 0.83 0.63 0.83
Who prunes the tea and have they been trained?
0.84 0.82 0.84 0.81 0.83
At what height do you tip in? 0.13 0.32 0.30 0.22 0.24
How often apply composted manure? 0.65 0.32 0.68 0.59 0.56
How frequently do you apply fertilizer? 0.39 0.73 0.55 0.21 0.50
Do you keep records?
Social indicators 0.63 0.61 0.57 0.68 0.61
Who plucks your tea? 0.84 0.82 0.80 0.74 0.81
Do you have a fixed agreement with employees?
0.79 0.98 0.94 0.92 0.90
Do your workers have easy access to water for drinking and latrines?
0.85 0.82 0.93 0.90 0.87
How often did your family or workers need medical attention?
0.57 0.54 0.68 0.57 0.59

135
Table A6.1 (continued)
Scores on the GAP indicators in the groups in 2012 (post-training situation)
Training group Training groups Total FFS + RA RA FFS No FFS
or RA Do you use any personal protective equipment (PPE)?
0.77 0.48 0.64 0.48 0.61
Do you group together with others farmers to carry out activities?
0.93 0.82 0.95 0.84 0.89
Do you turn to KTDA if you experience any problems in your tea production?
0.83 0.82 0.79 0.72 0.80
Do your children go to school? 0.55 0.57 0.52 0.46 0.53
Do you use locally manufactured farm inputs/implements?
Environmental indicators 0.92 0.89 0.98 0.93 0.93
Do you collect prunings from the tea field?
0.83 0.57 0.78 0.71 0.73
Do you infill open areas? 0.91 0.88 0.93 0.98 0.92
When do you apply fertilizer to your tea? 0.78 0.88 0.99 0.98 0.89
How do you spray? 0.48 0.52 0.50 0.40 0.49
Does your farm border a river or water body?
0.74 0.61 0.44 0.54 0.59
Do you have indigenous trees on you farm?
0.50 0.39 0.60 0.67 0.52
How many eucalyptus trees grow within 10 metres of water?
0.67 0.76 0.52 0.64 0.65
If your farm borders a water body, distance spray from water?
0.69 0.76 0.53 0.68 0.66
How much area of the total farm is conservation area?
0.60 0.74 0.61 0.61 0.64
What is your main source of energy for domestic use?
0.45 0.45 0.52 0.48 0.47
What is your main source of water for domestic use?
0.79 0.68 0.64 0.50 0.68
How do you manage household wastewater and effluent from livestock?
0.78 0.60 0.55 0.44 0.62
How do you mange household solid waste?
0.61 0.64 0.35 0.35 0.51
Waste collected and taken elsewhere for recycling?
0.66 0.70 0.86 0.80 0.75

136
Table A6.2 Scores on the GAP indicators in the groups in 2010 (pre-training situation)
Training group Training groups Total
FFS + RA RA FFS No FFS
or RA
Production indicators 0.50 0.54 0.77 0.75 0.62
How often pluck per month? 0.47 0.32 0.46 0.52 0.43
Experience leaf spillage at farm or buying
centre?
0.55 0.42 0.48 0.46 0.48
Use plucking stick/wand, table firm? 0.59 0.52 0.52 0.51 0.54
Success rate of your nursery? 0.52 0.42 0.52 0.52 0.50
When plant VP plants? 0.90 0.76 0.87 0.85 0.85
What is the % of crop cover? 0.63 0.65 0.63 0.46 0.61
At what height do you prune? 0.85 0.74 0.99 0.92 0.87
In which period do you prune 0.97 0.96 0.98 0.96 0.97
How often do you prune same tea
plot/block?
0.60 0.53 0.44 0.49 0.52
Which tools are used to prune your tea? 0.47 0.71 0.56 0.35 0.54
Who prunes the tea and have they been
trained?
0.75 0.75 0.83 0.72 0.77
At what height do you tip in? 0.09 0.14 0.14 0.15 0.13
How often apply composted manure? 0.57 0.53 0.51 0.50 0.53
How frequently do you apply fertilizer? 0.29 0.31 0.34 0.15 0.29
Do you keep records?
Social indicators 0.65 0.65 0.62 0.67 0.64
Who plucks your tea? 0.80 0.72 0.81 0.76 0.77
Do you have a fixed agreement with
employees?
0.77 0.78 0.93 0.89 0.83
Do your workers have easy access to
water for drinking and latrines?
0.62 0.75 0.86 0.79 0.75
How often did your family or workers
need medical attention?
0.34 0.24 0.31 0.33 0.31
Do you use any personal protective
equipment (PPE)?
0.85 0.82 0.56 0.77 0.75
Do you group together with others
farmers to carry out activities?
0.88 0.74 0.81 0.85 0.82
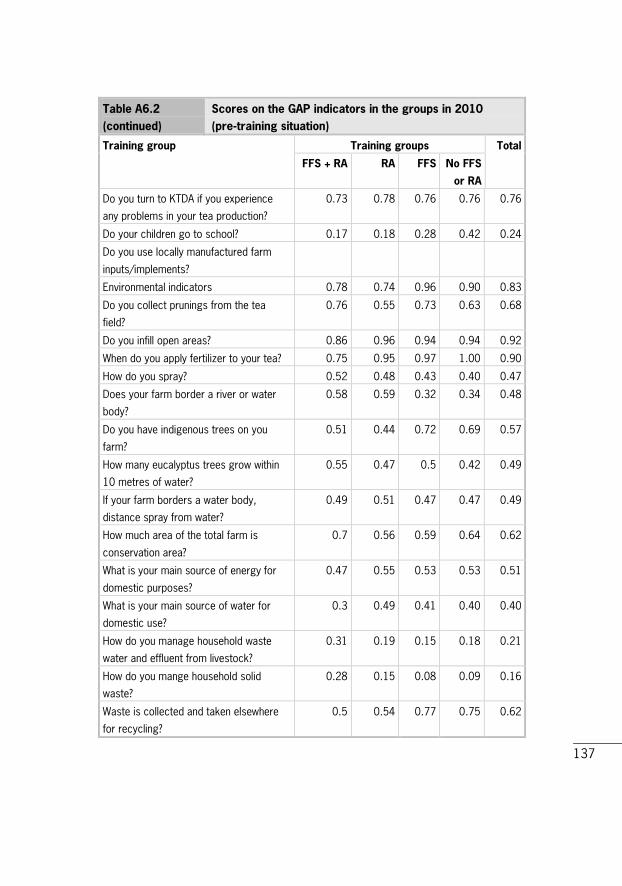
137
Table A6.2 (continued)
Scores on the GAP indicators in the groups in 2010 (pre-training situation)
Training group Training groups Total
FFS + RA RA FFS No FFS
or RA
Do you turn to KTDA if you experience
any problems in your tea production?
0.73 0.78 0.76 0.76 0.76
Do your children go to school? 0.17 0.18 0.28 0.42 0.24
Do you use locally manufactured farm
inputs/implements?
Environmental indicators 0.78 0.74 0.96 0.90 0.83
Do you collect prunings from the tea
field?
0.76 0.55 0.73 0.63 0.68
Do you infill open areas? 0.86 0.96 0.94 0.94 0.92
When do you apply fertilizer to your tea? 0.75 0.95 0.97 1.00 0.90
How do you spray? 0.52 0.48 0.43 0.40 0.47
Does your farm border a river or water
body?
0.58 0.59 0.32 0.34 0.48
Do you have indigenous trees on you
farm?
0.51 0.44 0.72 0.69 0.57
How many eucalyptus trees grow within
10 metres of water?
0.55 0.47 0.5 0.42 0.49
If your farm borders a water body,
distance spray from water?
0.49 0.51 0.47 0.47 0.49
How much area of the total farm is
conservation area?
0.7 0.56 0.59 0.64 0.62
What is your main source of energy for
domestic purposes?
0.47 0.55 0.53 0.53 0.51
What is your main source of water for
domestic use?
0.3 0.49 0.41 0.40 0.40
How do you manage household waste
water and effluent from livestock?
0.31 0.19 0.15 0.18 0.21
How do you mange household solid
waste?
0.28 0.15 0.08 0.09 0.16
Waste is collected and taken elsewhere
for recycling?
0.5 0.54 0.77 0.75 0.62
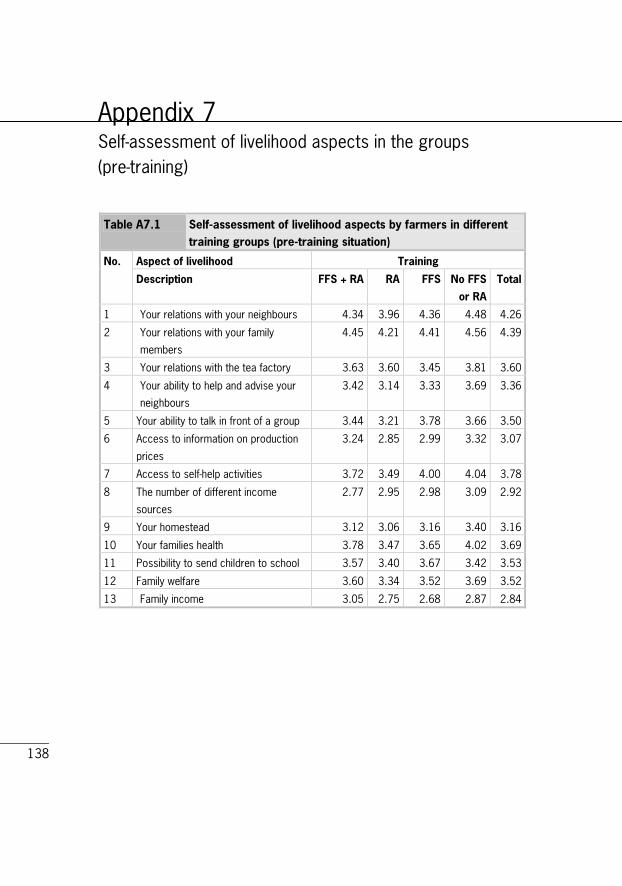
138
Appendix 7 Self-assessment of livelihood aspects in the groups (pre-training) Table A7.1 Self-assessment of livelihood aspects by farmers in different
training groups (pre-training situation)
No. Aspect of livelihood Training
Description FFS + RA RA FFS No FFS
or RA
Total
1 Your relations with your neighbours 4.34 3.96 4.36 4.48 4.26
2 Your relations with your family
members
4.45 4.21 4.41 4.56 4.39
3 Your relations with the tea factory 3.63 3.60 3.45 3.81 3.60
4 Your ability to help and advise your
neighbours
3.42 3.14 3.33 3.69 3.36
5 Your ability to talk in front of a group 3.44 3.21 3.78 3.66 3.50
6 Access to information on production
prices
3.24 2.85 2.99 3.32 3.07
7 Access to self-help activities 3.72 3.49 4.00 4.04 3.78
8 The number of different income
sources
2.77 2.95 2.98 3.09 2.92
9 Your homestead 3.12 3.06 3.16 3.40 3.16
10 Your families health 3.78 3.47 3.65 4.02 3.69
11 Possibility to send children to school 3.57 3.40 3.67 3.42 3.53
12 Family welfare 3.60 3.34 3.52 3.69 3.52
13 Family income 3.05 2.75 2.68 2.87 2.84

139
Appendix 8 Regression analysis on the changes in different indicators Table A8.1 Regression of changes in knowledge scores on training and
knowledge prior to training
Independent variable Coefficient
Training RA + FFS 0.622**
(0.27)
Training RA 0.124
(0.28)
Training FFS 0.266
(0.28)
Previous knowledge -0.620***
(0.058)
Constant 3.642***
(0.36)
Observations 327
R-squared 0.28 Standard errors in parentheses: *** p<0.01, ** p<0.05, * p<0.1

140
Table A8.2 Regression of changes in sustainability score ‘profit’ on RA/FFS training and initial scores
Independent variable Coefficient
Training RA + FFS 0.0549**
(0.023)
Training RA 0.0606**
(0.024)
Training FFS 0.0672***
(0.017)
Previous knowledge 0.0181***
(0.0035)
Previous 'profit' score -0.910***
(0.049)
Litein factory -0.0664***
(0.016)
Ndima factory -0.0220
(0.024)
Nyankoba factory -0.105***
(0.019)
Constant 0.508***
(0.041)
Observations 327
R-squared 0.54 Standard errors in parentheses: *** p<0.01, ** p<0.05, * p<0.1

141
Table A8.3 Regression of changes in sustainability score ‘people’ on RA/FFS training and initial scores
Independent variable Coefficient
Training RA + FFS 0.0778**
(0.032)
Training RA 0.0101
(0.032)
Training FFS 0.0702***
(0.023)
Previous knowledge -0.00323
(0.0048)
Previous 'people' score -0.944***
(0.060)
Litein factory -0.0197
(0.022)
Ndima factory -0.000623
(0.032)
Nyankoba factory 0.0310
(0.027)
Constant 0.664***
(0.056)
Observations 327
R-squared 0.50 Standard errors in parentheses: *** p<0.01, ** p<0.05, * p<0.1
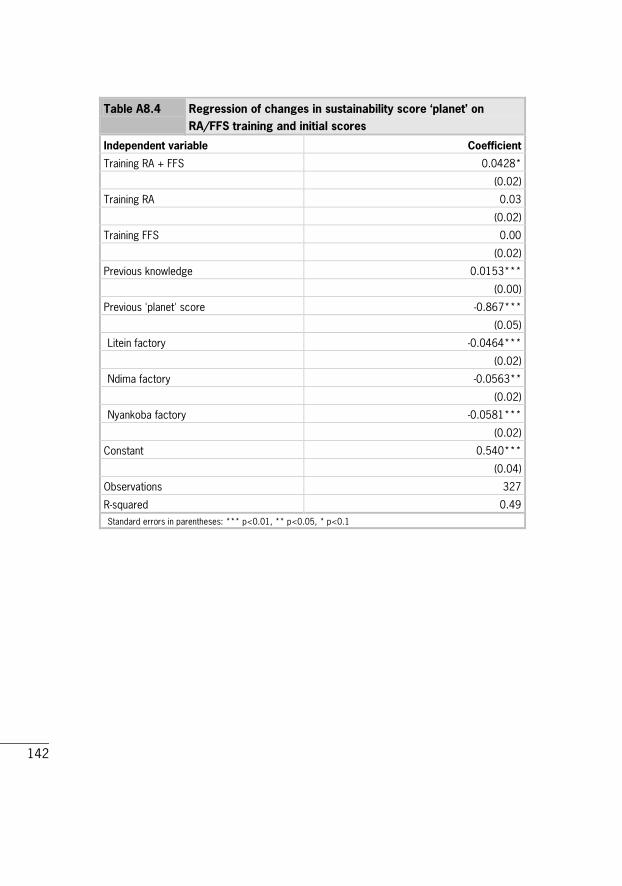
142
Table A8.4 Regression of changes in sustainability score ‘planet’ on RA/FFS training and initial scores
Independent variable Coefficient
Training RA + FFS 0.0428*
(0.02)
Training RA 0.03
(0.02)
Training FFS 0.00
(0.02)
Previous knowledge 0.0153***
(0.00)
Previous 'planet' score -0.867***
(0.05)
Litein factory -0.0464***
(0.02)
Ndima factory -0.0563**
(0.02)
Nyankoba factory -0.0581***
(0.02)
Constant 0.540***
(0.04)
Observations 327
R-squared 0.49 Standard errors in parentheses: *** p<0.01, ** p<0.05, * p<0.1

143
Table A8.5 Regression of the changes in income on RA/FFS training and factory
Independent variable Coefficient
RA + FFS training -9723
(26335)
RA -26012
(26622)
FFS 23296
(18935)
Litein factory -48296***
(18330)
Ndima factory -75872***
(27011)
Nyankoba factory -71396***
(22073)
Previous knowledge 1922
(3985)
Constant 128340***
(34280)
Observations 314
R-squared 0.07 Standard errors in parentheses: *** p<0.01, ** p<0.05, * p<0.1

LEI report 2012-043
LEI develops economic expertise for government bodies and industry in the field of food, agriculture and the natural environment. By means of independent research, LEI offers its customers a solid basis for socially and strategically justifiable policy choices.
LEI is part of Wageningen UR (University & Research centre), forming the Social Sciences Group with the department of Social Sciences and Wageningen UR Centre for Development Innovation.
More information: www.lei.wur.nl