identifying pallet management strategies and improving...
TRANSCRIPT
Department of Technology Management and Economics Division of Service Management and Logistics CHALMERS UNIVERSITY OF TECHNOLOGY Gothenburg, Sweden 2017 Report No. E 2017:084
Identifying Pallet Management Strategies and Improving Warehouse Capacity
A Case Study of the Pallet Logistics at
SCA’s Paper Mill in Lilla Edet Master’s Thesis in the Supply Chain Management programme
KARL ABDALLAH

MASTER’S THESIS E 2017:084
Identifying Pallet Management Strategies and
Improving Warehouse Capacity
A Case Study of the Pallet Logistics at SCA’s Paper Mill
in Lilla Edet
KARL ABDALLAH
Tutor, Chalmers: Ivan Sanchez Diaz
Tutor, SCA: Martin Drobena
Department of Technology Management and Economics
Division of Service Management and Logistics
CHALMERS UNIVERSITY OF TECHNOLOGY
Gothenburg, Sweden 2017
Identifying Pallet Management Strategies and Improving Warehouse Capacity
A Case Study of the Pallet Logistics at SCA’s Paper Mill in Lilla Edet
KARL ABDALLAH
© KARL ABDALLAH, 2017.
Master’s Thesis E 2017:084
Department of Technology Management and Economics Division of Service Management and Logistics Chalmers University of Technology
SE-412 96 Gothenburg, Sweden
Telephone: + 46 (0)31-772 1000
Chalmers Reproservice Gothenburg, Sweden 2017

i
Abstract
A rather new area identified by managers as a potential for increasing returns has received
great attention. Industry analysts predicts that approximately 450 million EPAL Euro pallets
are in constant circulation in the world. Traditionally, pallets have been disregarded and
perceived as a source of cost with the single mean to transport products to customers. Lately,
actors in supply chains have started to perceive pallets in a total cost approach and, hence, as
significant for the overall result of the supply chain. In parallel with an increased attention of
the pallets importance on the supply chain performance, a shift towards an increased
utilization of pallet pooling systems has been indicated. This is related to the constant increase
in raw material prices as well as costs associated with repair, maintenance and recovery of
pallets.
This study aims to answer two issues. The first issue relates to investigating the pallet
logistics process at SCA’s paper mill in Lilla Edet, which includes the mapping of flows to
the Danish and Norwegian markets as well as reviewing the design of the pallet warehouse.
The second issue concerns evaluating the current inspection control process related to
inbound deliveries of pallets. Established standards and routines will be reviewed in order to
clarify whether these are complied with.
A case study approach has been selected as a method in order to fulfil the aim of this thesis.
Since a mixed methods approach is considered useful, both qualitative and quantitative data is
collected. Interviews, observations and access to internal documents are the major sources of
information. Further, the empirical findings were analysed based on the theoretical framework
in order to provide solutions that addressed the stated issues. Improvement suggestions can be
grouped in two major measures that should be considered. Firstly, three errors associated with
defective pallets are correlated with the temperature. Consequently, during winter months’
pallets should be stored in the pallet warehouse in order to avoid rising defect levels.
Secondly, a redesign of the current pallet warehouse should be performed since the current
design is not optimal from wooden pallet’s perspective. Further, it should be noted that an
increased information sharing between pallet suppliers and the SCA Edet mill is a huge
facilitator for improving the studied issues.
Key words: Pallet logistics, pallet management strategies, warehouse capacity, reverse
logistics, visual inspection, information sharing, inventory.

ii
Acknowledgements
This master thesis has been conducted at the division of Service Management and Logistics at
Chalmers University of Technology in Gothenburg, Sweden. The project has been carried out
at SCA’s paper mill in Lilla Edet during the time period January 2017 to June 2017.
The author would like to express his sincere gratitude to all the helpful and caring people who
dedicated their time for this thesis. Thank you to all the employees at the case company who
helped me during this journey. Your insight and experience have contributed to the achieved
results. Further, my supervisors at SCA Edet mill, Martin Drobena and Amit Dhokia, deserves
a special thanks for all the support, feedback and discussions during this thesis.
A huge thank you to Ivan Sanchez Diaz, my supervisor at Chalmers University of
Technology, who guided me through the project and provided valuable feedback.
Finally, I would also like to thank friends and family for all the support, positive feedback and
engaging attitude during my study.
Gothenburg, June 2017
Karl Abdallah
iii
Table of Contents List of Figures……………………………………………………………………………....v
List of Tables……………………………………………………………………………….vi
List of Abbreviations……………………………………………………………………..vii
1. INTRODUCTION.................................................................................................. 1
1.1 Background ...................................................................................................................... 1
1.1.1 Company description ............................................................................................ 2
1.2 Problem description ..................................................................................................... 2
1.3 Aim and research questions ......................................................................................... 4
1.4 Scope and delimitations ............................................................................................... 5
1.5 Outline ......................................................................................................................... 6
2. THEORETICAL FRAMEWORK........................................................................... 7
2.1 Supply chain management ........................................................................................... 7
2.1.1 Supply chain management and reverse logistics ....................................................... 8
2.2 Return reasons for reverse logistics ............................................................................. 8
2.2.1 Realizing value in reverse logistics ...................................................................... 9
2.2.2 Implications related to return flows...................................................................... 9
2.3 Reverse logistics network design .............................................................................. 10
2.3.1 Return logistics systems ..................................................................................... 10
2.3.2 Design a pallet management system .................................................................. 13
2.4 Quality control ........................................................................................................... 15
2.4.1 Visual inspection ................................................................................................ 16
2.5 Supply chain coordination ......................................................................................... 17
3. METHODOLOGY ............................................................................................... 19
3.1 Research design ......................................................................................................... 19
3.1.1 Hermeneutic approach ........................................................................................ 19
3.1.2 Abductive approach ............................................................................................ 19
3.2 Data collection methods ............................................................................................ 20
3.2.1 Qualitative data collection .................................................................................. 20
3.2.2 Quantitative data collection ................................................................................ 21
3.2.3 Literature review ................................................................................................ 21
3.3 Interview structure ..................................................................................................... 22
3.3.1 Sample of interviews .......................................................................................... 22
iv
3.4 Reliability .................................................................................................................. 24
3.5 Validity of data .......................................................................................................... 24
3.6 Methods for data analysis .......................................................................................... 25
3.6.1 Regression analysis ............................................................................................ 25
3.6.2 Decision making process in pallet logistics ....................................................... 26
4. EMPIRICAL FINDINGS ..................................................................................... 27
4.1 Pallet demand at SCA Edet mill ................................................................................ 27
4.2 Ordering of pallets ..................................................................................................... 28
4.3 Pallet handling process .............................................................................................. 29
4.3.1 Standardized pallet handling process ................................................................. 29
4.3.2 Errors associated with defective pallets ............................................................. 31
4.3.3 Current inspection control process ..................................................................... 32
4.4 Storage and warehouse capacity ................................................................................ 34
4.5 Export pallet process ................................................................................................. 36
5. ANALYSIS ......................................................................................................... 38
5.1 Storing locations not complying with standards ........................................................ 38
5.1.1 Information sharing in the pallet handling process ............................................ 39
5.1.2 Providing opportunities for feedback ................................................................. 40
5.1.3 Improving the process of detecting defective pallets ......................................... 41
5.2 Future pallet demand ................................................................................................. 42
5.2.1 Restructuring the pallet warehouse .................................................................... 42
5.2.2 Increased warehouse capacity ................................................................................. 44
5.3 Mapping of the flow to Norway ................................................................................ 45
5.4 Mapping of the flow to Denmark .............................................................................. 48
6. CONCLUSIONS................................................................................................. 49
6.1 Future work ................................................................................................................ 50
REFERENCES ......................................................................................................... 51
APPENDIX A ............................................................................................................ 55
APPENDIX B ............................................................................................................ 56
v
List of Figures Figure 1: Illustrates the percentage of purchased pallets compared to consumption over the
year of 2016. ............................................................................................................................... 3
Figure 2: Pallet process for Euro pallets. ................................................................................... 4
Figure 3:An illustration of a circular supply chain network as described by Nuss et al. (2015).
.................................................................................................................................................... 6
Figure 4: Illustration of a supply chain network (Simchi-Levi et al., 2003). ............................. 7
Figure 5: Reverse logistics network structure (Fleischmann et al., 2003). .............................. 10
Figure 6: The decision making process in pallet logistics design (Elia and Gnoni, 2015). ..... 13
Figure 7: The closed loop pallet management system according to a LSP point of view (Elia
and Gnoni, 2015). ..................................................................................................................... 14
Figure 8: Direct and postponed pallet interchange schemes (Elia and Gnoni, 2015). ............. 14
Figure 9: Illustration of a regression analysis, where the line emphasizes the relationship
between two variables (Gallo, 2015) ........................................................................................ 25
Figure 10: Ordered number of pallets per week, during 2016. ................................................ 27
Figure 11: A comparison between ordered and consumed pallets, during 2016. The blue line
represents ordered pallets, while the orange line represents consumed pallets........................ 28
Figure 12: The structure of the pallet warehouse. The illustration above shows the supposed
storage area of the warehouse. The actual storage of wooden pallets is depicted below. ........ 30
Figure 13: 12 errors that identifies a defective pallet, according to the Vocational Training and
Working Environment Council in Sweden. ............................................................................. 31
Figure 14: The result of an investigation regarding the accuracy level of the sorting machine.
.................................................................................................................................................. 33
Figure 15: Structure of the pallet warehouse with stored finished goods. ............................... 35
Figure 16: An illustration of the time spent on pallet handling in relation to the total working
time. .......................................................................................................................................... 36
Figure 17:Cost aspects considered when establishing the internal pallet price. ...................... 37
Figure 18: A correlation between defect levels and weather is indicated for three errors. ...... 39
Figure 19: The dashed red line shows the consumption rate the calculations have been based
on. ............................................................................................................................................. 42
Figure 20: New structure of the pallet warehouse. ................................................................... 43

vi
List of Tables Table 1: A summary of the different logistics return systems, adapted by (Kroon and Vrijens,
1994). ........................................................................................................................................ 12
Table 2: Factors that affect the outcome of visual inspections. Adapted from Marie et al.,
2016. ......................................................................................................................................... 16
Table 3: A summary of the literature used. .............................................................................. 22
Table 4: A summary of interviewees contributing to this study and the data collection
methods used in interviews. ..................................................................................................... 23
Table 5: Numbers describing the different errors. ................................................................... 32
Table 6: The delivery of pallets to SCA Edet mill during week 13, 2017. .............................. 34
Table 7: Handling process related to inbound deliveries of pallets. ........................................ 36
Table 8: The correlation of determination stated for the three errors presented in Figure 18.. 39
Table 9: Activities related to the pallet handling process regarding the new design of the pallet
warehouse. ................................................................................................................................ 44
Table 10: A comparison between the capacity levels for the different staffing alternatives. .. 45

vii
List of Abbreviations
AfH – Away from home, a business segment defined by SCA
IDC – International distribution center
LSP – Logistics service provider
SCM – Supply chain management
1
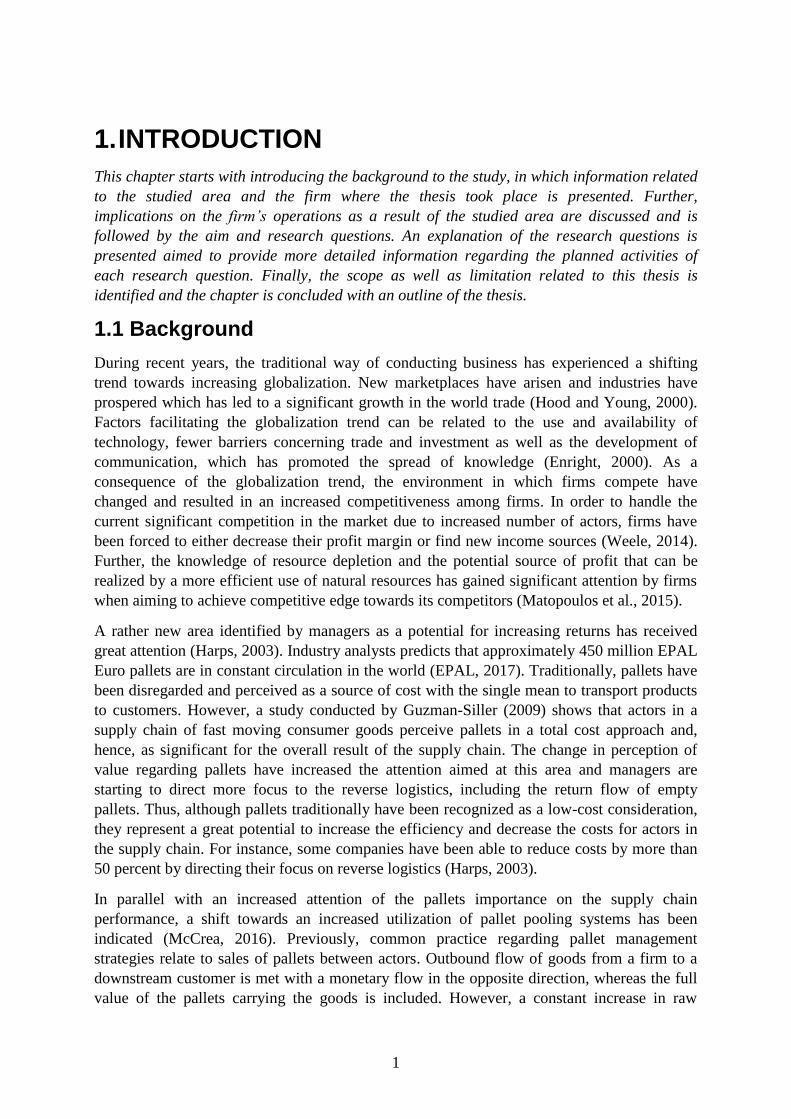
1. INTRODUCTION
This chapter starts with introducing the background to the study, in which information related
to the studied area and the firm where the thesis took place is presented. Further,
implications on the firm’s operations as a result of the studied area are discussed and is
followed by the aim and research questions. An explanation of the research questions is
presented aimed to provide more detailed information regarding the planned activities of
each research question. Finally, the scope as well as limitation related to this thesis is
identified and the chapter is concluded with an outline of the thesis.
1.1 Background
During recent years, the traditional way of conducting business has experienced a shifting
trend towards increasing globalization. New marketplaces have arisen and industries have
prospered which has led to a significant growth in the world trade (Hood and Young, 2000).
Factors facilitating the globalization trend can be related to the use and availability of
technology, fewer barriers concerning trade and investment as well as the development of
communication, which has promoted the spread of knowledge (Enright, 2000). As a
consequence of the globalization trend, the environment in which firms compete have
changed and resulted in an increased competitiveness among firms. In order to handle the
current significant competition in the market due to increased number of actors, firms have
been forced to either decrease their profit margin or find new income sources (Weele, 2014).
Further, the knowledge of resource depletion and the potential source of profit that can be
realized by a more efficient use of natural resources has gained significant attention by firms
when aiming to achieve competitive edge towards its competitors (Matopoulos et al., 2015).
A rather new area identified by managers as a potential for increasing returns has received
great attention (Harps, 2003). Industry analysts predicts that approximately 450 million EPAL
Euro pallets are in constant circulation in the world (EPAL, 2017). Traditionally, pallets have
been disregarded and perceived as a source of cost with the single mean to transport products
to customers. However, a study conducted by Guzman-Siller (2009) shows that actors in a
supply chain of fast moving consumer goods perceive pallets in a total cost approach and,
hence, as significant for the overall result of the supply chain. The change in perception of
value regarding pallets have increased the attention aimed at this area and managers are
starting to direct more focus to the reverse logistics, including the return flow of empty
pallets. Thus, although pallets traditionally have been recognized as a low-cost consideration,
they represent a great potential to increase the efficiency and decrease the costs for actors in
the supply chain. For instance, some companies have been able to reduce costs by more than
50 percent by directing their focus on reverse logistics (Harps, 2003).
In parallel with an increased attention of the pallets importance on the supply chain
performance, a shift towards an increased utilization of pallet pooling systems has been
indicated (McCrea, 2016). Previously, common practice regarding pallet management
strategies relate to sales of pallets between actors. Outbound flow of goods from a firm to a
downstream customer is met with a monetary flow in the opposite direction, whereas the full
value of the pallets carrying the goods is included. However, a constant increase in raw
2
material prices as well as costs associated with repair, maintenance and recovery of pallets has
increased the utilization of pallet pooling systems (Pierce, 2011).
Historically, articles and journals published in this area has been focused on three major
topics (Elia and Gnoni, 2015). Studies related to the design problem of pallets have frequently
been conducted, where different materials impact on the performance of material handling
activities is analysed (Soury et al., 2009; Bush et al., 2002). Subsequently, several methods
have been presented to evaluate different materials in pallet designs as well as methods
facilitating the use of technology for monitoring and ensuring the quality of the pallets (Kim
et al., 2009; Patricio and Maravall, 2007). Publications related to the loading problem of
pallets represent the second major topic. Here, studies regarding how pallets should be loaded
as well as optimization of the loading levels in order to decrease operations and transportation
costs are covered (Kocjan and Holmström, 2010; Lau et al., 2009). Lastly, the third major
topic relates to the logistics system design and covers issues regarding reverse flows of pallets
as well as whether an open or closed loop logistics network should be implemented (Gnoni
and Rollo, 2010; Silva et al., 2013; Kim and Glock, 2014). Further, this thesis will contribute
to the area of logistics system design related to pallets.
1.1.1 Company description
This thesis will take place at SCA Hygiene in Lilla Edet, which is a subsidiary of the global
SCA brand. The parent company operates in the hygiene and forest products market with
approximately 44 000 employees worldwide. Total sales in 2016 amounted to SEK 117bn and
the holding company is divided into three business areas. The Personal Care business area
develops, produces and sells incontinence care products, baby diapers and feminine care
products. In relation to these product segments, wet wipes, soap, lotion, baby oil and cotton
pads are offered by SCA. Forest Products are comprised by solid-wood products, pulp,
kraftliner, publication papers. Also, this business area supplies products to the energy sector,
such as pellets and other biofuels, district heating and green electricity. The third business
area is Tissue which is divided into the two sub segments of consumer tissue and Away-from-
Home tissue (AfH). The product portfolio of the consumer tissue segment includes toilet
paper, household towels, handkerchiefs, facial tissues, wet wipes and napkins. These products
are marketed and sold under the SCA Hygiene Group’s global and regional brands, such as
Lotus, Regio, Tempo and Zewa as well as under retailer’s own brands. The AfH segment
comprises toilet paper, paper towels, napkins, hand soap, hand lotion, hand sanitizers,
dispensers, cleaning and wiping products, sensor technology, services and maintenance for
institutions and companies under the brand Tork. Further, the distribution of the tissue
business segment can be divided into the three major channels of retail trade, online sales and
distributors (SCA, 2017). The SCA Hygiene’s mill in Lilla Edet, or the SCA Edet mill as it
often is referred to, supplies the market with products related to the Tissue business area.
1.2 Problem description
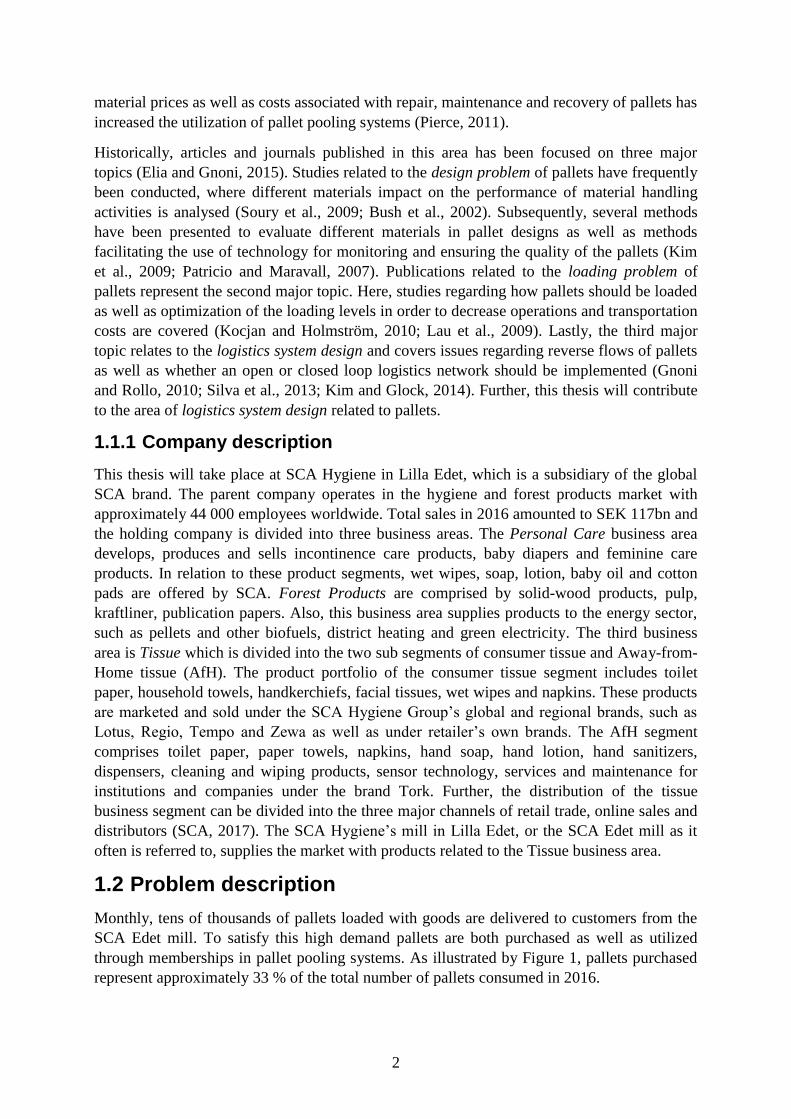
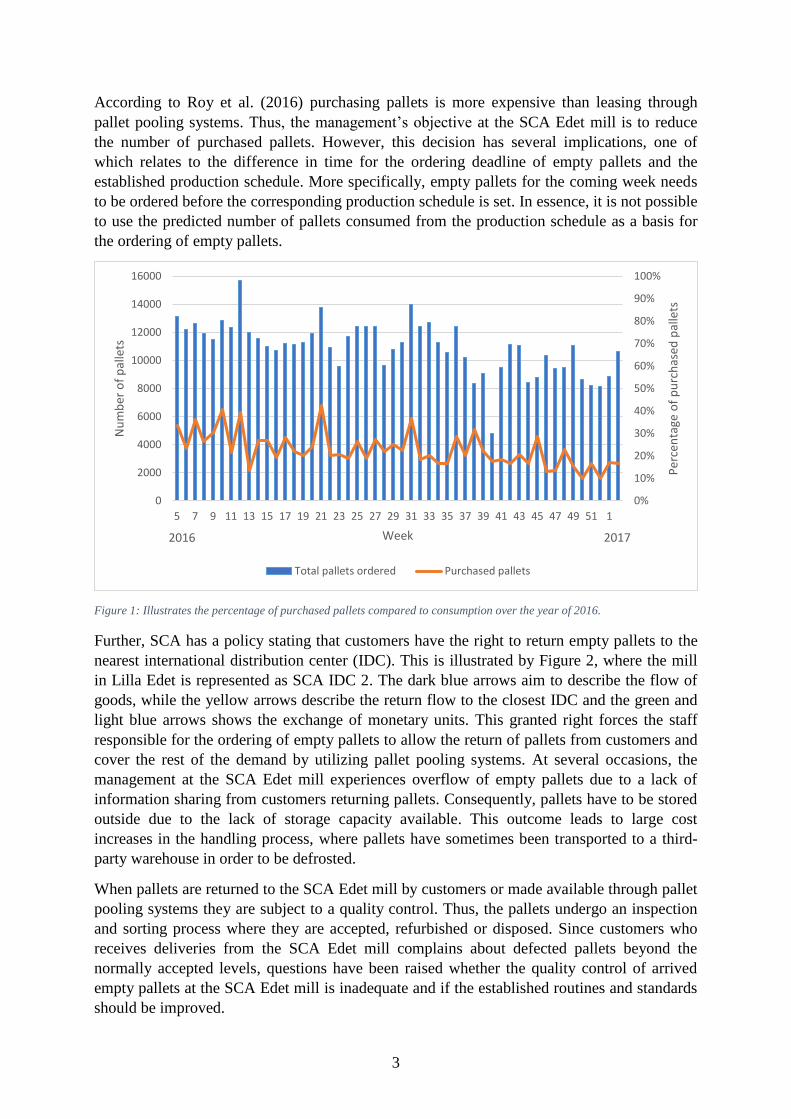
Monthly, tens of thousands of pallets loaded with goods are delivered to customers from the
SCA Edet mill. To satisfy this high demand pallets are both purchased as well as utilized
through memberships in pallet pooling systems. As illustrated by Figure 1, pallets purchased
represent approximately 33 % of the total number of pallets consumed in 2016.
3
According to Roy et al. (2016) purchasing pallets is more expensive than leasing through
pallet pooling systems. Thus, the management’s objective at the SCA Edet mill is to reduce
the number of purchased pallets. However, this decision has several implications, one of
which relates to the difference in time for the ordering deadline of empty pallets and the
established production schedule. More specifically, empty pallets for the coming week needs
to be ordered before the corresponding production schedule is set. In essence, it is not possible
to use the predicted number of pallets consumed from the production schedule as a basis for
the ordering of empty pallets.
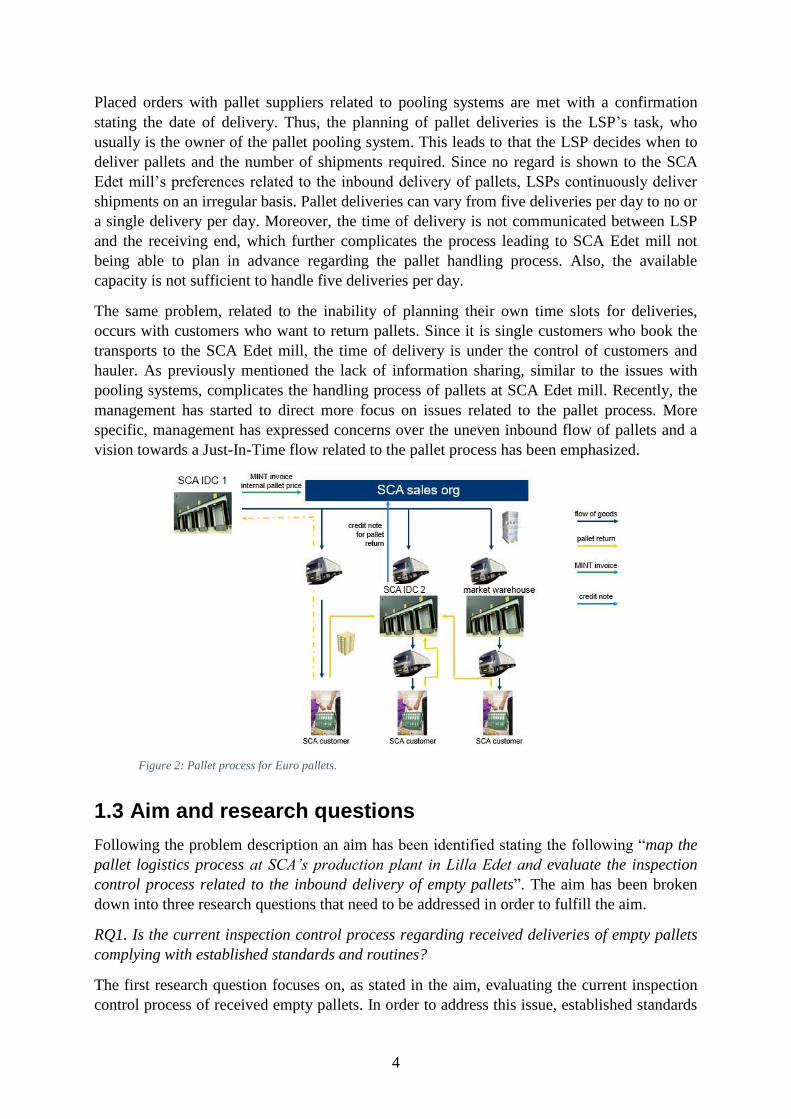
Further, SCA has a policy stating that customers have the right to return empty pallets to the
nearest international distribution center (IDC). This is illustrated by Figure 2, where the mill
in Lilla Edet is represented as SCA IDC 2. The dark blue arrows aim to describe the flow of
goods, while the yellow arrows describe the return flow to the closest IDC and the green and
light blue arrows shows the exchange of monetary units. This granted right forces the staff
responsible for the ordering of empty pallets to allow the return of pallets from customers and
cover the rest of the demand by utilizing pallet pooling systems. At several occasions, the
management at the SCA Edet mill experiences overflow of empty pallets due to a lack of
information sharing from customers returning pallets. Consequently, pallets have to be stored
outside due to the lack of storage capacity available. This outcome leads to large cost
increases in the handling process, where pallets have sometimes been transported to a third-
party warehouse in order to be defrosted.
When pallets are returned to the SCA Edet mill by customers or made available through pallet
pooling systems they are subject to a quality control. Thus, the pallets undergo an inspection
and sorting process where they are accepted, refurbished or disposed. Since customers who
receives deliveries from the SCA Edet mill complains about defected pallets beyond the
normally accepted levels, questions have been raised whether the quality control of arrived
empty pallets at the SCA Edet mill is inadequate and if the established routines and standards
should be improved.
0%
10%
20%
30%
40%
50%
60%
70%
80%
90%
100%
0
2000
4000
6000
8000
10000
12000
14000
16000
5 7 9 11 13 15 17 19 21 23 25 27 29 31 33 35 37 39 41 43 45 47 49 51 1
Per
cen
tage
of
pu
rch
ased
pal
lets
Nu
mb
er o
f p
alle
ts
Week
Total pallets ordered Purchased pallets
2016 2017
Figure 1: Illustrates the percentage of purchased pallets compared to consumption over the year of 2016.
4
Placed orders with pallet suppliers related to pooling systems are met with a confirmation
stating the date of delivery. Thus, the planning of pallet deliveries is the LSP’s task, who
usually is the owner of the pallet pooling system. This leads to that the LSP decides when to
deliver pallets and the number of shipments required. Since no regard is shown to the SCA
Edet mill’s preferences related to the inbound delivery of pallets, LSPs continuously deliver
shipments on an irregular basis. Pallet deliveries can vary from five deliveries per day to no or
a single delivery per day. Moreover, the time of delivery is not communicated between LSP
and the receiving end, which further complicates the process leading to SCA Edet mill not
being able to plan in advance regarding the pallet handling process. Also, the available
capacity is not sufficient to handle five deliveries per day.
The same problem, related to the inability of planning their own time slots for deliveries,
occurs with customers who want to return pallets. Since it is single customers who book the
transports to the SCA Edet mill, the time of delivery is under the control of customers and
hauler. As previously mentioned the lack of information sharing, similar to the issues with
pooling systems, complicates the handling process of pallets at SCA Edet mill. Recently, the
management has started to direct more focus on issues related to the pallet process. More
specific, management has expressed concerns over the uneven inbound flow of pallets and a
vision towards a Just-In-Time flow related to the pallet process has been emphasized.
1.3 Aim and research questions
Following the problem description an aim has been identified stating the following “map the
pallet logistics process at SCA’s production plant in Lilla Edet and evaluate the inspection
control process related to the inbound delivery of empty pallets”. The aim has been broken
down into three research questions that need to be addressed in order to fulfill the aim.
RQ1. Is the current inspection control process regarding received deliveries of empty pallets
complying with established standards and routines?
The first research question focuses on, as stated in the aim, evaluating the current inspection
control process of received empty pallets. In order to address this issue, established standards
Figure 2: Pallet process for Euro pallets.
5
and routines associated with the inbound delivery of empty pallets as well as the pallet
warehouse will be reviewed and examined. Interviews will be held with employees directly
responsible for the inspection control process of received empty pallets. The interviews
should also include employees responsible of the administrative tasks related to the empty
pallets. Visual inspections of the storage area as well as of the handling process will be
conducted. Further, additional data will be collected from electronic files and paper
documents.
RQ2. When based on actual demand, how should the inbound delivery of empty pallets be
structured and managed?
To address this issue, the pallet demand at SCA Lilla Edet needs to be calculated as well as
the number of empty pallets needed in storage to cover for the demand during the weekends,
since no shipments are delivered during the weekends. Further, the warehouse capacity
related to the staffing and inventory levels will be analysed. The solution of this should result
in a suggested design of the process regarding empty pallets. Data needed to address this task
will be gathered from computer files, paper documents as well as interviews.
RQ3. How is the current pallet logistics designed regarding the tissue business segment to the
Norwegian and Danish markets?
To answer the third research question data needs to be collected both internally from SCA and
from the SCA sales organizations in Norway and Denmark. Data regarding the invoicing of
pallets to the different markets will be gathered and compiled. Also, information
corresponding to the number of credited pallets related to the return flow from the different
markets will be collected from SCA Edet mill. Moreover, the design of the pallet logistics will
be reviewed and mapped based on information collected from SCA and third parties
responsible of both the pallet pooling systems and the transportations. This research question
will be focused on the design, costs and policies associated with the different flows to the
Norwegian and Danish markets.
1.4 Scope and delimitations
The expressed desire, by the management at SCA Edet mill, to achieve a more even flow
related to the pallet logistics defines this thesis. Focus will be directed on creating the right
conditions internally in order to facilitate a future Just-In-Time flow. Studying the pallet
logistics requires studying both the inbound and outbound flow since many of the pallets are
often linked to return systems. However, this thesis emphasizes the inbound delivery and
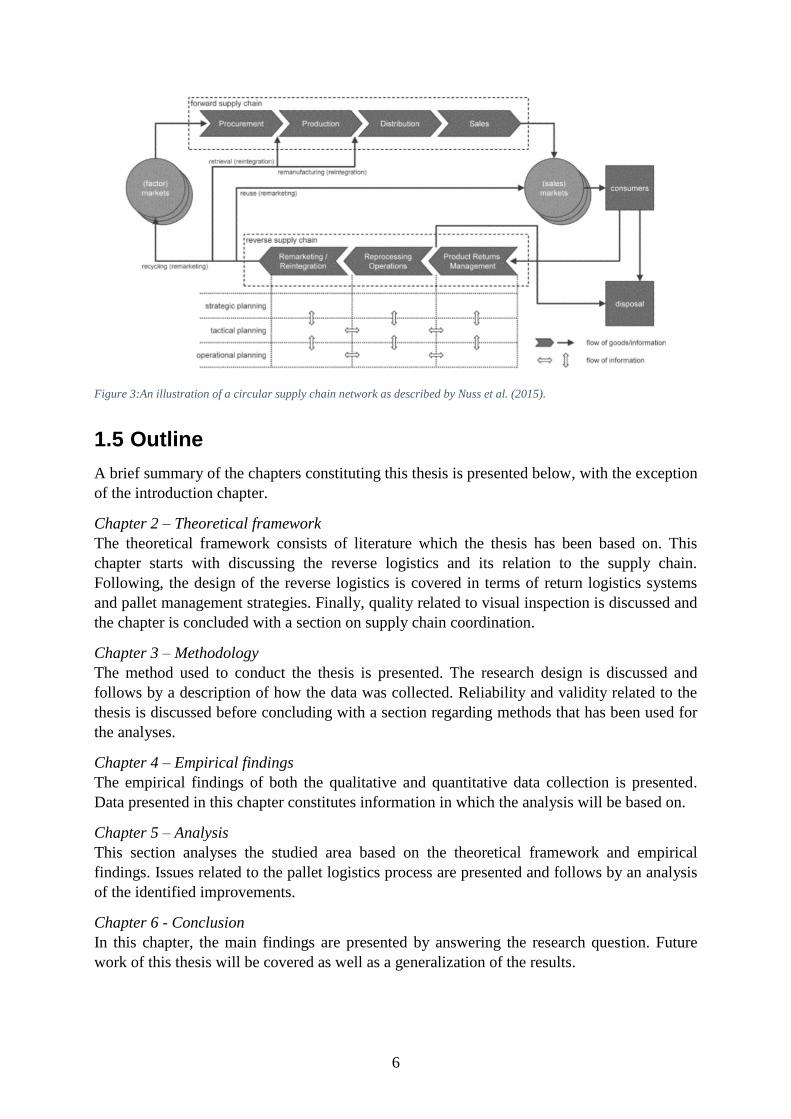
improvement measures will be focused at the inbound delivery of empty pallets. Nuss et al.
(2015) argues that forward supply chains and reverse supply chains are to some degree
interdependent which forms the basis for circular supply chain networks, as illustrated in
Figure 3. According to this illustration, the scope of the thesis includes the Distribution in the
forward supply chain and both the Product Return Management and Reprocessing Operations
of the reverse supply chain. Further, wooden pallets are subject of this study and the pallet
management strategies used in the flows related to the Norwegian and Danish markets will be
emphasized. The decision to why the Norwegian and Danish markets will be highlighted in
this study is based on the experienced difficulties in managing these particular flows at the
SCA’s mill in Lilla Edet.
6
1.5 Outline
A brief summary of the chapters constituting this thesis is presented below, with the exception
of the introduction chapter.
Chapter 2 – Theoretical framework
The theoretical framework consists of literature which the thesis has been based on. This
chapter starts with discussing the reverse logistics and its relation to the supply chain.
Following, the design of the reverse logistics is covered in terms of return logistics systems
and pallet management strategies. Finally, quality related to visual inspection is discussed and
the chapter is concluded with a section on supply chain coordination.
Chapter 3 – Methodology
The method used to conduct the thesis is presented. The research design is discussed and
follows by a description of how the data was collected. Reliability and validity related to the
thesis is discussed before concluding with a section regarding methods that has been used for
the analyses.
Chapter 4 – Empirical findings
The empirical findings of both the qualitative and quantitative data collection is presented.
Data presented in this chapter constitutes information in which the analysis will be based on.
Chapter 5 – Analysis
This section analyses the studied area based on the theoretical framework and empirical
findings. Issues related to the pallet logistics process are presented and follows by an analysis
of the identified improvements.
Chapter 6 - Conclusion
In this chapter, the main findings are presented by answering the research question. Future
work of this thesis will be covered as well as a generalization of the results.
Figure 3:An illustration of a circular supply chain network as described by Nuss et al. (2015).
7
2. THEORETICAL FRAMEWORK
This section presents the theoretical framework and models in which the study is based on.
The framework starts with introducing the reverse logistics role in the supply chain
management as well as issues related to the reverse logistics. A brief description regarding
the design of reverse logistics is covered which is followed by detailed theories and models of
pallet logistics and pallet management strategies. The section is concluded with highlighting
theories related to visual inspection and a description associated with supply chain
coordination.
2.1 Supply chain management
In general, a supply chain can be described as at least two independent organizations that are
linked together by material, information and financial flows (Stadtler, 2015). In practice, this
statement relates to the forward movement of products and services from suppliers to
manufacturers, distributors and wholesalers, retailers and finally to the end-customers
involving activities of transportation, information exchange as well as exchange of funds.
Accordingly, Chopra and Meindl (2016) states that a supply chain consists of several actors,
as stated above. Simchi-Levi et al. (2003) support this argument by analysis of case studies
showing that firms integrated in a supply chain have increased from 2,2 firms in the mid-70’s
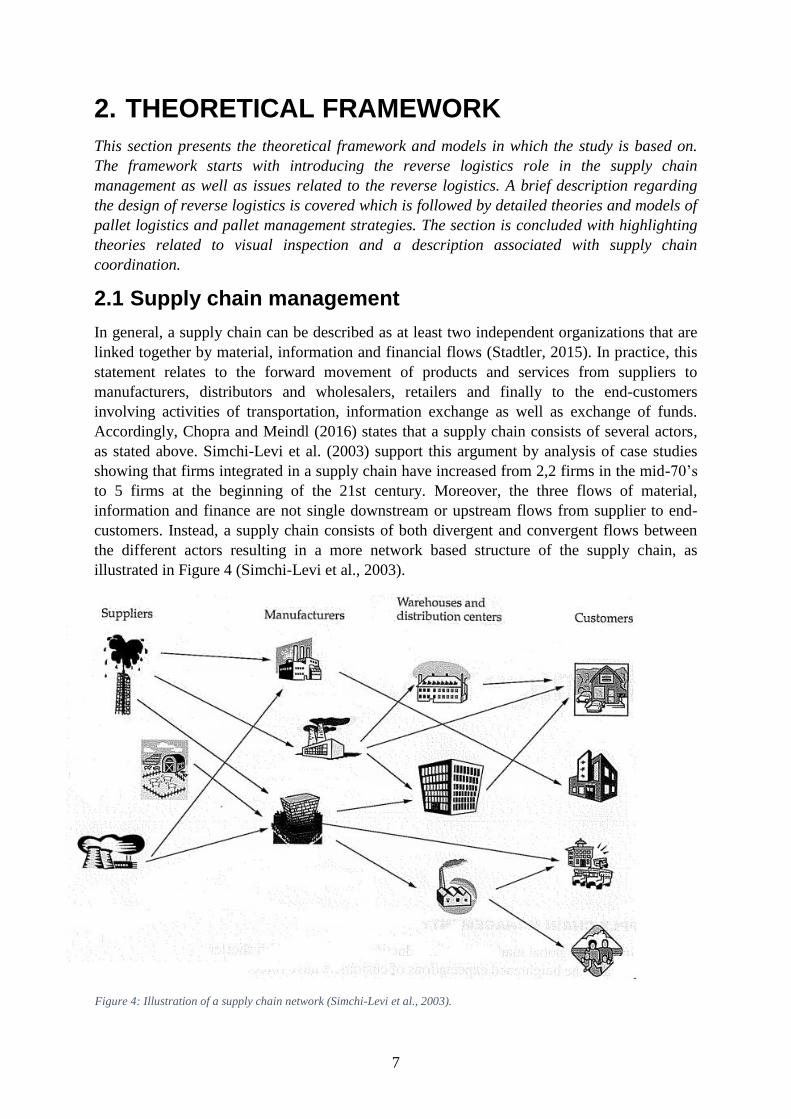
to 5 firms at the beginning of the 21st century. Moreover, the three flows of material,
information and finance are not single downstream or upstream flows from supplier to end-
customers. Instead, a supply chain consists of both divergent and convergent flows between
the different actors resulting in a more network based structure of the supply chain, as
illustrated in Figure 4 (Simchi-Levi et al., 2003).
Figure 4: Illustration of a supply chain network (Simchi-Levi et al., 2003).
8
The overall objective of a supply chain is to maximize the supply chain surplus, hence the
profitability of an individual stage in the supply chain will not result in a maximized surplus
unless it results in profits for all stages involved in the chain (Chopra and Meindl, 2016). As a
result of this, a network level approach is emphasized when aiming to increase efficiency and
profitability in the supply chain since all facilities impacting costs needs to be considered.
Interdependency between actors in a supply chain is significant and managing the
relationships between these is of essence to enhance value and reduce costs.
2.1.1 Supply chain management and reverse logistics
Supply chain concepts have traditionally been described as a single downstream flow from
supplier and manufacturer to end customer (Dekker et al., 2004; Cohen and Roussel, 2013).
Therefore, focus has been directed on the forward logistics in which a firm’s outbound
distribution is designed to allow the forward movement of goods in an efficient and effective
way (Harps, 2003). Since the emphasis previously has been on the forward logistics it has
resulted in reverse logistics being perceived as lower priority and, hence, receiving low
attention from management (ibid.). The supply chains of today include reverse flows or
upstream flows from customers and retailers to manufacturer and supplier. These flows have
not been mentioned in traditional supply chain definitions, however, since these processes
affects the supply chain it is vital to apply a comprehensive approach in order to optimize the
value creation. Thus, as a result of the importance of the reverse logistics the term “closed-
loop supply chains” has arised (Lebreton, 2007).
Since reverse logistics being perceived as a significant element of supply chain management,
Dekker et al. (2004) claims that it should be analysed in the same way as when a traditional
supply chain is investigated. Further, the authors argue that a trade-off is present when firms
design their supply chains and a decision must be made whether it should be based on a cost
approach or service approach. The correlation between the two approaches can be described
as a supply chain that is responsive incurs higher costs. Which direction to lean towards in the
trade-off is ultimately decided by the customer who determines if a higher service level is
justified (ibid.).
2.2 Return reasons for reverse logistics
Reasons concerning returns through the reverse logistics system have been discussed by
several authors (de Brito and Dekker, 2002; Jack et al., 2010; Lambert et al., 2011) who
describes reasons related to the senders.
Return reasons related to the sender are divided into manufacturing returns, distribution
returns, and customer returns (de Brito and Dekker, 2002). Manufacturing returns relates to
the recovered components and products from production. Specifically, such recoveries are
defined in terms of surplus of raw materials, components or products that have not passed
quality checks and needs to be returned, or production leftovers (Vercraene et al., 2014).
Further, distribution returns aim to describe the returns that arise during the distribution, such
as product recalls, commercial returns among business-to-business firms, stock adjustments,
and functional returns (Kleindorfer et al., 2005). The type of return mentioned last is of
essence in this thesis since it concerns packaging, carriers, and other types of distribution
items. Finally, the reasons for customer returns are expressed as business-to-customer
9
commercial returns, warranty returns, service returns, end of use- or life returns (Barky,
2016).
2.2.1 Realizing value in reverse logistics
Toktay et al. (2004) claims that in order to increase the value realized from returned items
firms need to manage the quantity and timing of the returns. In practice, this means that
managers responsible for the reverse flow of returned items should design the reverse chain
with the aim to enhance visibility and increase speed throughout the chain, which ultimately
would result in an increase in the value potential being realized (Guide and Van Wassenhove,
2001). In response to how to design a reverse logistics chain Toktay et al. (2004) describe two
modelling approaches that can be utilized to study the interdependence between return flow
characteristics and system structure. The first approach relates to analysing the value of
incentives in terms of return allowance, trade-in offers, and buybacks through creating
principle-agent models (Debo et al., 2001). The second approach aim to assess the influence
of several relevant factors through a regression analysis (Toktay et al., 2004).
Further, the trade-off between cost and service level, as mentioned in the previous sub
chapter, is of significance when considering returned items (Chopra and Meindl, 2016).
Return policies are usually a response to the competitive environment firms experience that
aims to increase the customer satisfaction levels (Mukhopadhyay and Setaputra, 2011). A
consequence of return policies is that they could lead to high costs since they are associated
with direct transportation costs and inspection costs. Thus, when studying and examining the
return policies it is of essence to evaluate other return policies alternatives (Setaputra, 2005).
2.2.2 Implications related to return flows
Implications arise when goods are returned to its sender due to insufficient quality control of
the goods which results in significant uncertainty. To handle these issues, it becomes of
essence to establish a dynamic ability of the flow and to adjust to different markets and
customers. Thus, developing knowledge and insight on how the various markets works and
how the goods are handled in each market is vital (Blumberg, 2005). Also, when addressing
these issues, and more specifically managing return flows, relevant information must be used
meaning that outdated or irrelevant information does not have a purpose in these contexts.
Regarding the handling of information difficulties emerge in terms of the design of the
distribution of information across different actors. In order for the return flow of materials to
be as effective as possible the different processes need to be coordinated between the actors
involved in the return flow. To handle the high uncertainty of the return flow high flexibility
in facilities and transport systems becomes evident (Fleischmann, 2001). Thus, the quality of
the information available is of significant importance and results in a better decision making
process of the transports, staffing, and facilities which ultimately leads to a cost-efficient
handling of return flows (Blumberg, 2005). Further, Fleischmann (2001) highlights some
differences between return flows and traditional logistic flows. The author argues that
uncertainty and variation related to the forecasts impedes on the quality and quantity of
materials returned. This is the reason that the uncertainty in the forecasts are perceived as a
complex area. Further, due to the large number of actors that are involved in the supply chain
network, the return flow becomes more complicated as the risk for a lack of information
sharing increases (Fleischmann, 2001).
10
2.3 Reverse logistics network design
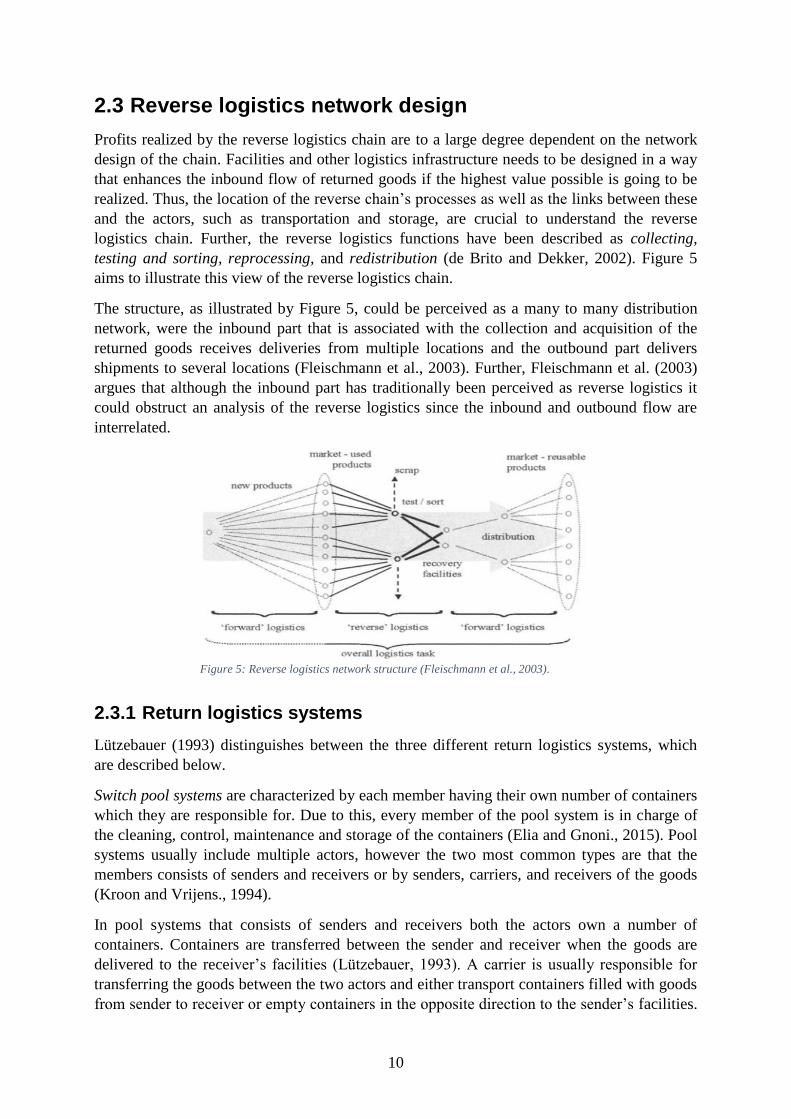
Profits realized by the reverse logistics chain are to a large degree dependent on the network
design of the chain. Facilities and other logistics infrastructure needs to be designed in a way
that enhances the inbound flow of returned goods if the highest value possible is going to be
realized. Thus, the location of the reverse chain’s processes as well as the links between these
and the actors, such as transportation and storage, are crucial to understand the reverse
logistics chain. Further, the reverse logistics functions have been described as collecting,
testing and sorting, reprocessing, and redistribution (de Brito and Dekker, 2002). Figure 5
aims to illustrate this view of the reverse logistics chain.
The structure, as illustrated by Figure 5, could be perceived as a many to many distribution
network, were the inbound part that is associated with the collection and acquisition of the
returned goods receives deliveries from multiple locations and the outbound part delivers
shipments to several locations (Fleischmann et al., 2003). Further, Fleischmann et al. (2003)
argues that although the inbound part has traditionally been perceived as reverse logistics it
could obstruct an analysis of the reverse logistics since the inbound and outbound flow are
interrelated.
2.3.1 Return logistics systems
Lützebauer (1993) distinguishes between the three different return logistics systems, which
are described below.
Switch pool systems are characterized by each member having their own number of containers
which they are responsible for. Due to this, every member of the pool system is in charge of
the cleaning, control, maintenance and storage of the containers (Elia and Gnoni., 2015). Pool
systems usually include multiple actors, however the two most common types are that the
members consists of senders and receivers or by senders, carriers, and receivers of the goods
(Kroon and Vrijens., 1994).
In pool systems that consists of senders and receivers both the actors own a number of
containers. Containers are transferred between the sender and receiver when the goods are
delivered to the receiver’s facilities (Lützebauer, 1993). A carrier is usually responsible for
transferring the goods between the two actors and either transport containers filled with goods
from sender to receiver or empty containers in the opposite direction to the sender’s facilities.
Figure 5: Reverse logistics network structure (Fleischmann et al., 2003).
11
For the carriers to achieve economic benefits from these transportations and not drive with
empty trailers on the way back, the sender in the end need to ensure the carrier that the
volume of the number of containers transported to the receiver is the same number of
containers that is shipped back from the receiver to the sender (ibid.).
In the second alternative of switch pool systems the carrier also has a number of containers. In
this case, when containers containing goods at the sender’s facility are loaded onto the carriers
truck empty pallets corresponding the number of pallets loaded are provided to the sender
(Kroon and Vrijens, 1994). Thus, the sender is not responsible for the managing the return
flow of shipped containers. A pallet exchange like the one described is the norm in this type
of switch pool systems.
In systems with return logistics all the containers belong to a central agency which is
responsible for the containers also after they have been emptied by the recipient (Lutzebauer,
1993). Thus, the central agency is responsible for transferring all containers between different
actors, however, the agency require that the empty containers are bundled and stored by the
receiver until a sufficient number of containers has been accumulated which enables a cost
efficient collection by the agency (Elia and Gnoni, 2015). Lützenbauer (1993) distinguishes
between the following two systems:
• Transfer system. This system is characterized by the sender constantly utilizes the
same type of containers since the transfer system only manage the return flow of
empty containers from receiver to sender. Instead the tracking and tracing of
containers, cleaning, maintenance, and storage are under the sender’s responsibility.
Further, the sender also manages the flow of containers ensuring a sufficient number
(Lützebauer, 1993).
• Depot system. The overall idea of this system is that containers are stored at
predetermined depots. The depot provides the sender with the required number of
containers and when the containers have been transported to the receiver empty
containers are transported back to the depot and stored until needed again by the
sender. During the time of storage, the containers are maintained if required. This
system can further be divided into two sub groups (Cobb, 2016).
o The book system is characterized by the central agency conducting a thorough
review of the flow of containers. When the agency delivers a certain number of
containers to the sender the corresponding amount of the containers are then
debited in the sender’s account by the agency. On the other hand, when the
sender ships containers to a receiver the sender’s account is credited for the
number of containers shipped, while the receiver’s account is debited (Roy et
al., 2016). Thus, the agency requires the sender to provide complete
information on shipments, place of receiver, and the number of containers
involved in the shipment. This information combined enables the agency to
monitor the flow of containers (Yang et al., 2016).
o In the deposit system, the sender is required to pay for every container that is
utilized and the deposit reflects at least the value of the containers (Lutzebauer,
1993). When the sender sends a shipment to the receiver the containers are
debited to the receiver who in turn debits them to their customers. At the end
of the chain, when the goods have arrived at the end customers, the containers
are collected by the agency which in turn pays the value of the collected pallets
12
to the actor they are collected from (Roy et al., 2016). The deposit in a system
like the one described should be sufficient to cover loss, theft, and damages to
the containers which in turn results in a monitoring track and trace system to
manage the flow of containers is not required. Further, since the deposit system
includes cash flows between different actors it enables a fast return rate of the
containers as a result of the actors need to get their money back (Kroon and
Vrijens, 1994).
In systems without return logistics the containers in the system are also under the central
agency’s ownership. When the sender requires containers, they are rented from the agency
and returned back when they are not needed. The system is characterized by the sender having
the full responsibility of the containers when it comes to controlling, cleaning, maintenance,
and storage as well as return logistics (Elia and Gnoni, 2015). An advantage with systems
without return logistics is that it possesses a potential for the sender to reduce its costs by
renting containers instead of purchasing them (Roy et al., 2016).
The type of return system a sender chooses to use is dependent on the goods involved. For
instance, the type, weight, structure, and quantity of the goods affects the selection of return
system. However, other factors do also affect this decision. The scope of the return system
(international, regional, national), coordination between actors, willingness to invest,
available storage space, control possibilities, size of the organization as well as the acceptance
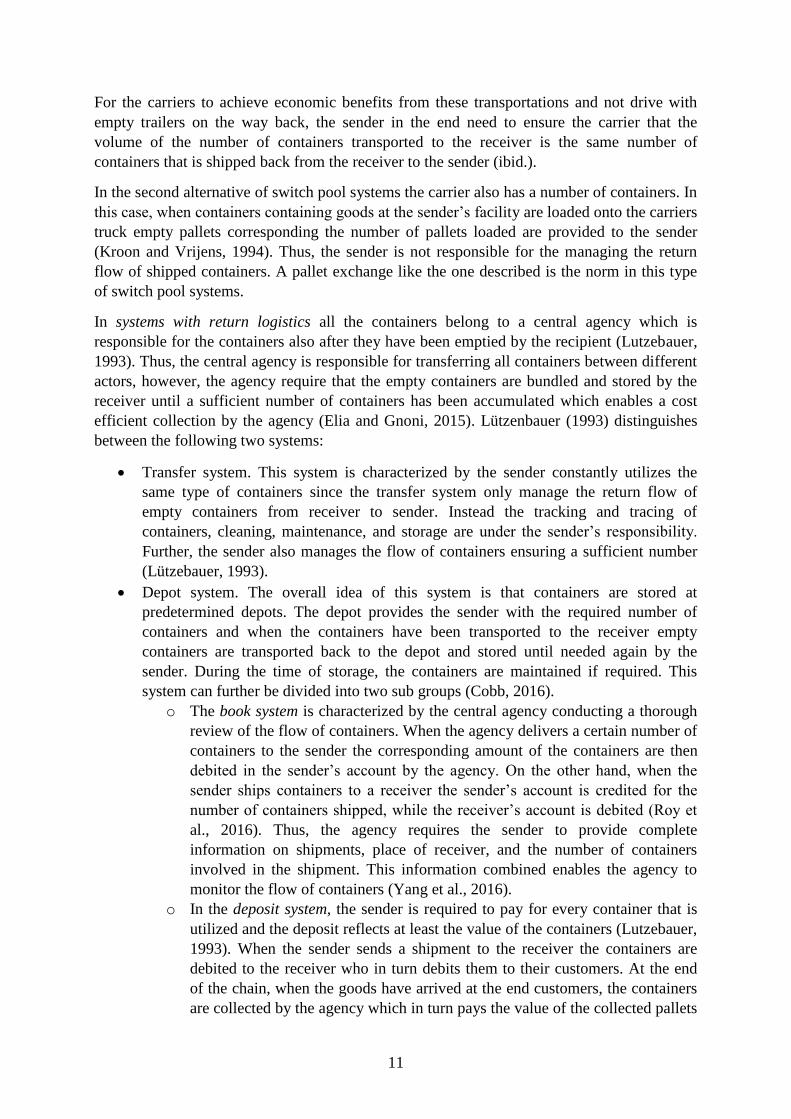
in the market are all factors that have an impact on the selection of return systems. Further,
Table 1 summarizes the different logistics return systems that have been described (Kroon and
Vrijens, 1994).
Table 1: A summary of the different logistics return systems, adapted by (Kroon and Vrijens, 1994).
Systems Essence Partners Responsibility Possibilities
Switch pool Every partner has
an allotment
Sender, recipient Every partner is
responsible for his
own allotment
Direct switch
Sender, carrier
and recipient
Exchange-per-
exchange switch
With return
logistics
Return logistics by
agency
Agency, sender,
carrier, recipient
Agency Transfer system
Depot system with
booking
Depot system with
deposit
Without return
logistics
Rental of the
containers
Agency, sender Sender, also for the
return logistics
Rental of the
containers
13
2.3.2 Design a pallet management system
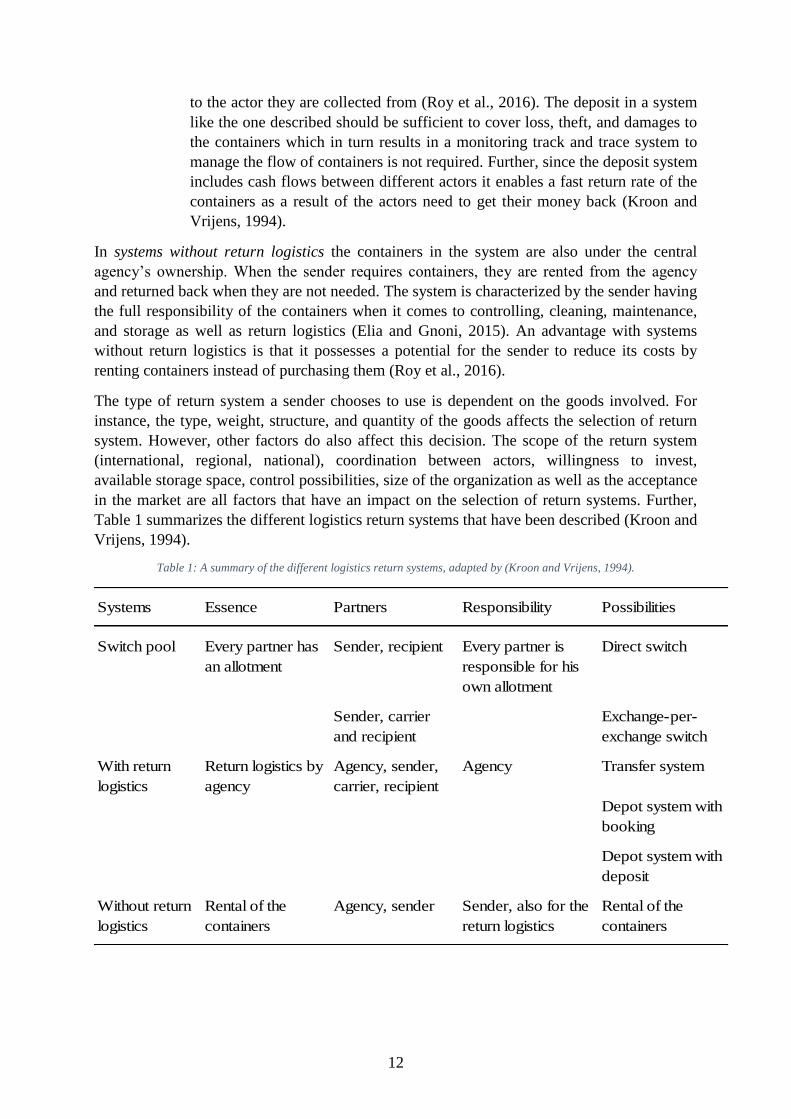
Figure 6: The decision making process in pallet logistics design (Elia and Gnoni, 2015).
Elia and Gnoni (2015) presents a decision-making framework concerning the design of a
pallet logistics process which is divided into three steps, as illustrated by Figure 6. The first
step relates to defining the structure of the logistics network regarding pallets. Two different
models are used to describe pallet logistics processes (ibid.). An open network is characterized
by an upstream firm sending goods loaded in pallets to a downstream firm, which in turn do
not return the empty pallets to the upstream firm. Instead, the downstream firm credits the
upstream firm, not only for the goods, but also for the pallets carrying the goods (Hariga et al.,
2016). On the other hand, if a closed loop network is in place, the pallet logistic process is
characterized by the need to manage empty pallets between downstream and upstream firms
in a reverse flow (Roy et al., 2016).
Both the open network and the closed loop network has their benefits. For instance, closed
loop networks are more complex and requires larger resources to manage the reverse flow of
empty pallets from customers. This affects the inventory and logistics activities for the
companies involved since it results in the decision initiating the reverse flow is made by the
downstream firm. Thus, the inventory levels at the upstream firm is volatile to the reverse
flow of the empty pallets from the downstream firm since these return deliveries are not
notified in advance (Glock, 2017). However, the costs associated with the replenishment of
the pallet logistics process can be reduced with the closed loop network and managing the
inventory of the empty pallets becomes easier. This is achieved since the empty pallets related
to the closed loop network is utilized several times in the system (Elia and Gnoni, 2015).
14
Has an open network been selected in the first step of Figure 6, the next step is to set up the
management system of the inventory and design the empty pallet storage warehouse, in terms
of replenishment models and warehouse capacity (Elia and Gnoni, 2015).
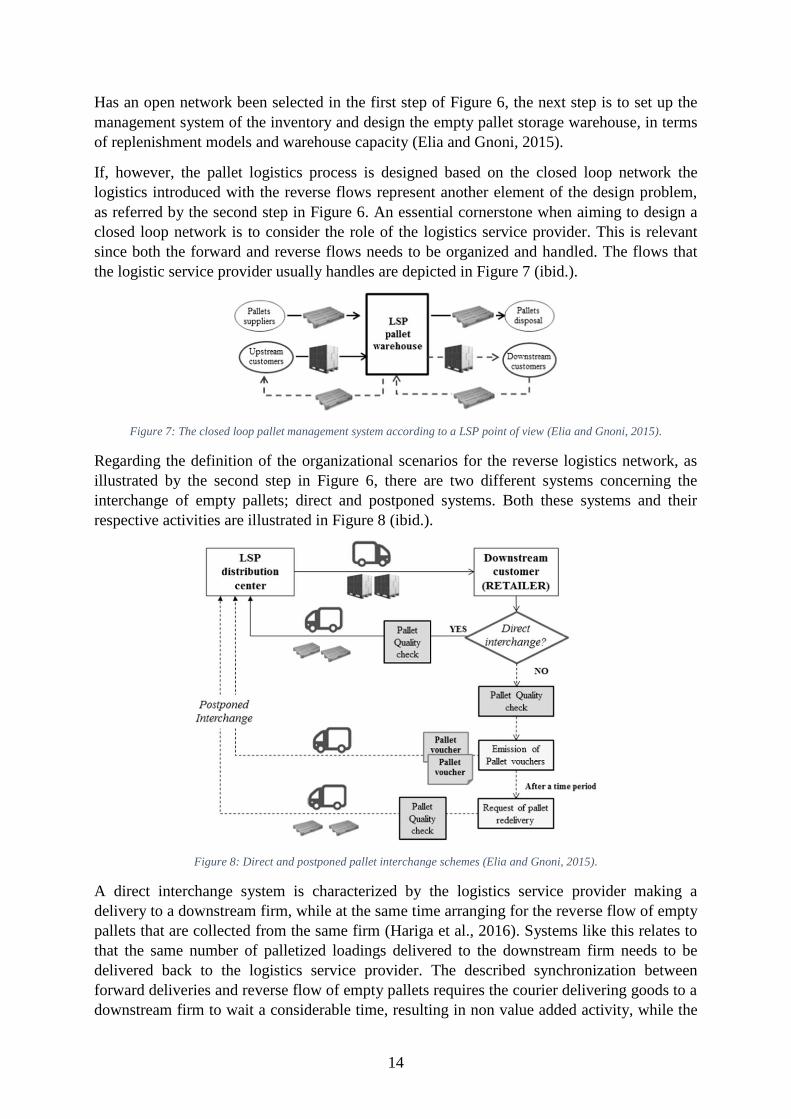
If, however, the pallet logistics process is designed based on the closed loop network the
logistics introduced with the reverse flows represent another element of the design problem,
as referred by the second step in Figure 6. An essential cornerstone when aiming to design a
closed loop network is to consider the role of the logistics service provider. This is relevant
since both the forward and reverse flows needs to be organized and handled. The flows that
the logistic service provider usually handles are depicted in Figure 7 (ibid.).
Figure 7: The closed loop pallet management system according to a LSP point of view (Elia and Gnoni, 2015).
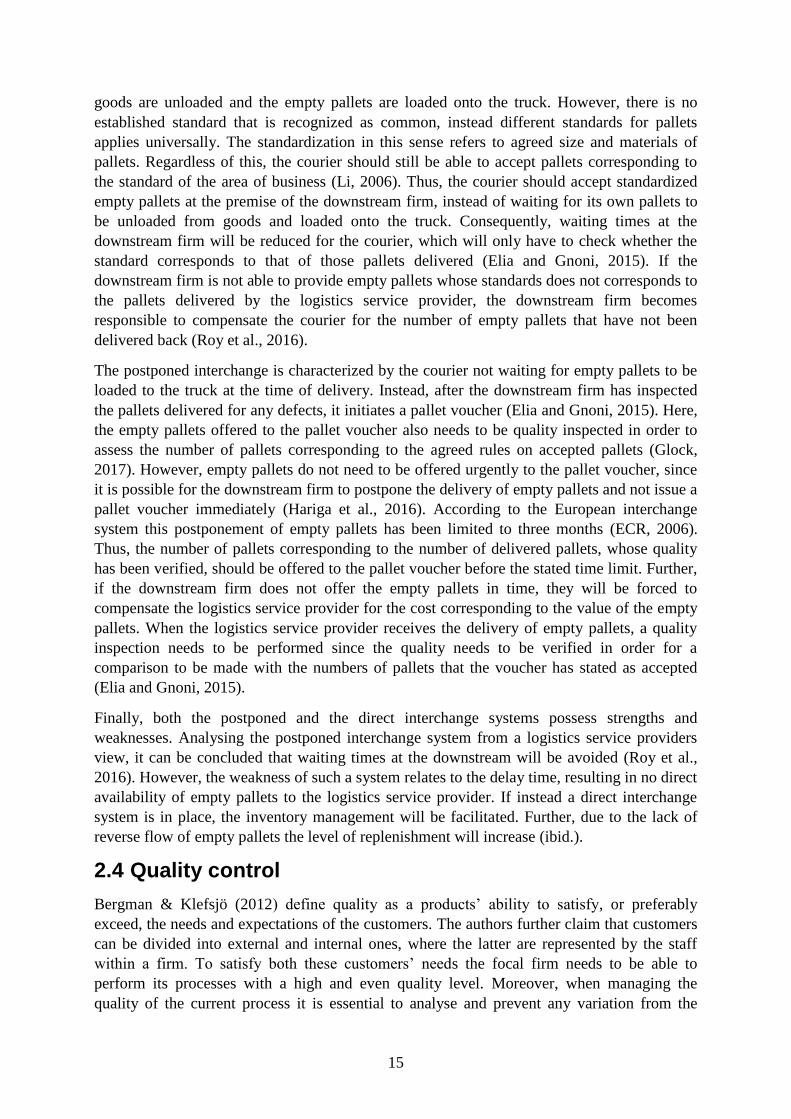
Regarding the definition of the organizational scenarios for the reverse logistics network, as
illustrated by the second step in Figure 6, there are two different systems concerning the
interchange of empty pallets; direct and postponed systems. Both these systems and their
respective activities are illustrated in Figure 8 (ibid.).
Figure 8: Direct and postponed pallet interchange schemes (Elia and Gnoni, 2015).
A direct interchange system is characterized by the logistics service provider making a
delivery to a downstream firm, while at the same time arranging for the reverse flow of empty
pallets that are collected from the same firm (Hariga et al., 2016). Systems like this relates to
that the same number of palletized loadings delivered to the downstream firm needs to be
delivered back to the logistics service provider. The described synchronization between
forward deliveries and reverse flow of empty pallets requires the courier delivering goods to a
downstream firm to wait a considerable time, resulting in non value added activity, while the
15
goods are unloaded and the empty pallets are loaded onto the truck. However, there is no
established standard that is recognized as common, instead different standards for pallets
applies universally. The standardization in this sense refers to agreed size and materials of
pallets. Regardless of this, the courier should still be able to accept pallets corresponding to
the standard of the area of business (Li, 2006). Thus, the courier should accept standardized
empty pallets at the premise of the downstream firm, instead of waiting for its own pallets to
be unloaded from goods and loaded onto the truck. Consequently, waiting times at the
downstream firm will be reduced for the courier, which will only have to check whether the
standard corresponds to that of those pallets delivered (Elia and Gnoni, 2015). If the
downstream firm is not able to provide empty pallets whose standards does not corresponds to
the pallets delivered by the logistics service provider, the downstream firm becomes
responsible to compensate the courier for the number of empty pallets that have not been
delivered back (Roy et al., 2016).
The postponed interchange is characterized by the courier not waiting for empty pallets to be
loaded to the truck at the time of delivery. Instead, after the downstream firm has inspected
the pallets delivered for any defects, it initiates a pallet voucher (Elia and Gnoni, 2015). Here,
the empty pallets offered to the pallet voucher also needs to be quality inspected in order to
assess the number of pallets corresponding to the agreed rules on accepted pallets (Glock,
2017). However, empty pallets do not need to be offered urgently to the pallet voucher, since
it is possible for the downstream firm to postpone the delivery of empty pallets and not issue a
pallet voucher immediately (Hariga et al., 2016). According to the European interchange
system this postponement of empty pallets has been limited to three months (ECR, 2006).
Thus, the number of pallets corresponding to the number of delivered pallets, whose quality
has been verified, should be offered to the pallet voucher before the stated time limit. Further,
if the downstream firm does not offer the empty pallets in time, they will be forced to
compensate the logistics service provider for the cost corresponding to the value of the empty
pallets. When the logistics service provider receives the delivery of empty pallets, a quality
inspection needs to be performed since the quality needs to be verified in order for a
comparison to be made with the numbers of pallets that the voucher has stated as accepted
(Elia and Gnoni, 2015).
Finally, both the postponed and the direct interchange systems possess strengths and
weaknesses. Analysing the postponed interchange system from a logistics service providers
view, it can be concluded that waiting times at the downstream will be avoided (Roy et al.,
2016). However, the weakness of such a system relates to the delay time, resulting in no direct
availability of empty pallets to the logistics service provider. If instead a direct interchange
system is in place, the inventory management will be facilitated. Further, due to the lack of
reverse flow of empty pallets the level of replenishment will increase (ibid.).
2.4 Quality control
Bergman & Klefsjö (2012) define quality as a products’ ability to satisfy, or preferably
exceed, the needs and expectations of the customers. The authors further claim that customers
can be divided into external and internal ones, where the latter are represented by the staff
within a firm. To satisfy both these customers’ needs the focal firm needs to be able to
perform its processes with a high and even quality level. Moreover, when managing the
quality of the current process it is essential to analyse and prevent any variation from the

16
quality levels that has been established (Grigori et al., 2001). A method commonly used to
analyse the quality of a firm’s processes is through visual inspection (Marie et al., 2016).
2.4.1 Visual inspection
The essence of visual inspection on incoming deliveries is emphasized by several scholars
within the quality control as well as total quality management areas (Klefsjö and Bergman,
2012; Marie et al., 2016; Peris-Ortiz et al., 2015). Sablatnig (1997) defines visual inspection
as a process that determines whether a product differs from the given specifications. There are
multiple existing methods that comprise the concept of visual inspection, for instance
automated machines, machines that require an operator, and human inspections. The latter one
is the most common method used and Marie et al. (2016) claims it to be the best method for
detecting deteriorated products. Although visual inspections being performed by humans are
reported to be effective there are still limitations as well as complications to this method
(Klefsjö and Bergman, 2012; Shilling, 1982; Liker, 2009). For instance, Table 2 provides
references to some studies concerning the complication that arises from the result of visual
inspections performed by humans. Accordingly, Hendricks and Singhal (2001) states that
investing in relevant tools and systems can reduce the errors from visual inspections, but it
cannot completely eliminate the errors. Further, literature on different types of visual
inspections reports error rates of 20-30 percent (Hendricks and Singhal, 2001; Marie et al.,
2016; Klefsjö and Bergman, 2012). In order to manage the high error rates, firms are directing
their focus towards the opportunity to train controllers that performs the inspections rather
than allocating this activity to manufacturing workers. Moreover, studies show that training
employees to detect deferring products results in a lower error rates while improves the
operator’s decision making ability (Wiener, 1975; Marie et al., 2016).
Table 2: Factors that affect the outcome of visual inspections. Adapted from Marie et al., 2016.
Visual acquity McCormick (1950), Courtney (1985)
Eye movement Findlay (1997), Näsänen et al. (2001)
Age Ball et al. (1988), Cerella (1985)
Tiredness Jebaraj et al. (1999a), Lin et al. (2009)
Concentration (Sagi, 2010)
Training/Feedback Chabukswar et al. (2003), Wang et al. (1997), Rebsamen et al. (2010)
Memory Shore and Klein (2001), Maxwell et al. (2003)
Motivation Rousseau (1977), Hays and Hill (2001)
Further, the outcome of visual inspections is affected by the repeatability and reproducibility
of the performed inspection (Marie et al., 2016). Repeatability is the difference in
measurement that results from measuring the same feature on a specific part, while
reproducibility is the average variation in measurement caused by workers when measuring
the same feature on a specific part (Klefsjö and Bergman, 2012). These terms are
interdependent on the worker’s capacity to detect defected products and to evaluate these
defects. Marie et al. (2016) claims the repeatability and reproducibility to be closely related to
the exploration and evaluation of defects. Despite visual inspection has been subject to several
studies, still the exploration of studies or the detection of defects are perceived as the major
part of the concept of visual inspections. Factors that affects the number of detected defects
has been argued and visual acuity, lighting, inspection time, and feedback are aspects reported
17
to have an impact of the detection of defects (Courtney, 1985; Näsänen et al., 2001; Ball et
al., 1988; Megaw, 1979; Lin et al., 2009; Sagi, 2010; Chabukswar et al., 2003; Hays and Hill,
2001).
Marie et al. (2016) claims that defects are often known and that the workers performing the
visual inspections have knowledge of the defects they are supposed to detect. Further, the
authors mention that the controllers can have easy access to pictures illustrating the defects.
The overall objective of performed visual inspections is to detect any defects and at the same
time fulfill the expectations imposed by customers. This could be achieved by not only
detecting any defects but to also identify any irregularities that can be perceived as a defect by
customers. Given the difference between extensive and limited inspection controls, some
customers might detect defects that has not been detected by other customers (ibid.).
2.5 Supply chain coordination
Traditional supply chains as well as supply chains that considers the reverse flow are
characterized by multiple interactions and extensive involvement by decision makers within
and across firms regarding the efficiency and profitability of the supply chain (Debo et al.,
2001). Despite extensive interactions across firms within the supply chain, decision makers
might still pursue their own local objective without considering the overall profitability of the
supply chain. Thus, some level of coordination between firms within a supply chain is of vital
importance in order to align all decision makers with the same objective of creating highest
possible overall efficiency of the supply chain. According to Debo et al. (2001), supply chain
coordination can be achieved by focusing on incentive alignment, information sharing, and
functional integration.
Multiple firms are usually included in a supply chain, where each firm has its own objectives.
In order for the supply chain to achieve high levels of customer service and become cost
effective it is necessary for all the members of the chain to work toward the same goal. Thus,
overall profitability of the supply chain can be maximized if the goals and incentives of the
members in the chain are aligned. This means that risks and rewards as well as costs of
conducting business are fairly shared between the different actors in the supply chain
(Narayanan and Raman, 2004). However, in case the incentives are not aligned the overall
profitability of the chain will not be optimized, resulting in excess inventory, stock outs,
incorrect forecasts, inadequate sale efforts, and poor customer service.
Narayanan and Raman (2004) claims that there are three reasons why issues related to
incentives appears in the supply chain. The first reason concerns firms’ lack of insight and
knowledge related to other firm’s activities, making it difficult to ensure these firms activities
are in line with those of the supply network. Further, the authors emphasize that actions that
cannot be observed are present all along the supply chain. Moreover, aligning objectives when
firms in the supply chain have access to different information and knowledge is another
reason to incentive obstacles appear in the chain. This is illustrated in situations where
suppliers do not want to share their cost data with the manufacturer in fear of the data being
used by the manufacturer against the suppliers to reduce their profit margins (Debo et al.,
2001). Consequently, the suppliers will be unwilling to share data and involve in activities
with the manufacturer if it implies that the supplier’s data would be gathered. As long as the
conditions for sharing information between supplier and manufacturer are not fair the supply
chain will not be as efficient as possible. The third reason, as described by Narayanan and
18
Raman (2004), relates to that incentive schemes often are not designed properly. Chopra and
Meindl (2016) illustrate this by describing badly designed sales force incentives as a major
limitation to achieve coordination in the supply chain. A manufacturer usually measures sales
as the amount of sold products to the distributors (sell-in) instead of the amount sold to the
end customer (sell-through) which represents the real demand. Measuring the sell-in instead
of the sell-through is characterized by the manufacturers sales force not managing the sell-
through. Sales force incentives that are structured based on sell-in instead of sell-through give
rise to higher fluctuations of placed orders than the actual variability of customer demand
(Chopra and Meindl, 2016).
Three measures can be taken to achieve supply chain coordination; rewrite contracts, reveal
hidden information, or develop trust (Narayanan and Raman, 2004). By rewriting contracts
with members of the supply chain that are based on the actual outcome of the chain instead of
outcomes between single stages lead to aligned incentives. Rewriting contracts is essential
when sales force incentives are improperly structured. For instance, contracts based on sell-
through instead of sell-ins would stop sales staff from pushing products and stimulate forward
buying resulting in reduced order variability (Chopra and Meindl, 2016). Incentives within a
supply chain can also be aligned by reveal hidden information through sharing information
across the chain. If a member in the supply chain share information of the actual demand with
the rest of the chain, it becomes possible for the other members to forecast future demand
based on the actual customer demand. With all stages sharing information it leads to less
information being distorted since the available information creates opportunities for each
member of the supply chain to respond to the same information. Further, by developing trust
within the supply chain incentive obstacles can be reduced. Trust is a precondition for
facilitating the process of achieving coordination between the stages across the supply chain.
For instance, an upstream actor in the supply chain does not need to allocate resources to
establish and maintain forecasts if it trusts the information received from an actor
downstream. Also, an actor can reduce its inspection quality control if it trusts the quality and
quantity delivered by its supplier.
19
3. METHODOLOGY
The following chapter describes the methods used for this thesis. A presentation of the
research design is followed by a description regarding how the data was gathered. Further,
the literature review and the interview sample is presented. The reliability and validity of the
study is described before the section concludes with a presentation of the methods used for
analysis.
3.1 Research design
A case study approach on SCA Edet mill was used to conduct this thesis and the topic used in
the study is pallet logistics. According to Bell (2010) the benefits of a case study is presented
in its ability to provide individual researchers an opportunity to study a specific area in detail
during a limited time period. Further, in order to achieve a good understanding of the studied
area it is essential to gather information from different sources (Patel and Davidson, 2003).
3.1.1 Hermeneutic approach
Various approaches and methods of analysis can be used to make interpretations and gain
knowledge of the studied event. A hermeneutic research approach is based on this concept
and aims to study the meaning of thinking, actions, experiences, culture, and texts by
subjectively assessing and interpreting the researched phenomena. According to (Patel and
Davidson, 2003) the ultimate goal of a hermeneutic research design is to examine and
understand individuals subjectively experienced world, by collecting information through the
use of a qualitative approach and non-directive interview techniques. Further, the distance
between the subject who conducts the study and the object of study is not clear since gaining
understanding of experiences cannot be accessed through a true/false analysis (Hunter, 2004).
Instead, the researcher adopts a comprehensive approach in which broad knowledge of the
field of study is obtained. According to Wallen (1996) four principles defines a hermeneutic
research approach. The first principle concerns interpreting the meaning of thinking, actions,
experiences, culture, and texts. Secondly, the researcher should have some knowledge relating
to linguistics and culture before performing the study. The third principle relates to the fact
that the researchers often switch between interpreting the field of study based on a
comprehensive view and a more specific view. Finally, Wallen (1996) emphasizes the essence
of conducting an interpretation based on a context.
Adopting a hermeneutic research approach is necessary in answering the first research
question. When answering if standards and routines are being complied with regarding
received deliveries of empty pallets, it is necessary to study the thinking and actions of the
concerned staff, which is why a hermeneutic approach were deemed relevant. Further,
interviews with staff responsible for this inspection quality control will be held since their
professional experience in that area will be of significance later when presenting solutions
aiming at improving the current situation.
3.1.2 Abductive approach
Abductive research methodology aims to address the weaknesses of associated with deductive
and inductive approaches and is thus perceived as a combination of these two approaches.
Deduction approach takes its starting point in established theories and concepts to lead to
20
observations and later on a confirmation of the original theory. Thus, utilizing this approach
has a strong impact on the type of information to be collected. Since theories and concepts are
highly valued in deductive approaches it reduces the scientist’s potential to include own
thoughts which constrains the possibility to realize new findings (Trochim, 2006).
An inductive approach differs considerably from deductive approaches and are often
perceived as the opposite to deductive approaches (Trochim, 2006; Patel and Davidson, 2003;
Kvale, 1996). This type of research approach takes its starting point in specific observations
and ends in generalizations and new theories. As understood, inductive approaches are more
exploratory in nature leading to addressing certain issues without a base of established
theories and concepts. In contrary to the deductive approach, inductive research is
characterized by that the scientist’s own thoughts are significant in the creation of new
theories (Trochim, 2006).
The research approaches mentioned in this section have often been described as opposites to
each other in research approach literature. However, since deductive and inductive approaches
are the inverse of each other they can be combined into a process that continuously shifts
from theories to observations and back to theories again. A process, that combines deductive
and inductive approaches, is defined as an abductive approach (Thagard and Shelley, 1997).
Since this thesis combines both established theories within reverse- and inbound logistics and
aims to realize new opportunities within these areas, the abductive approach becomes useful
to apply. Thus, the abductive research of this thesis can be described as utilized theories of
reverse and inbound logistics, which corresponds to the deductive approach, as well as
collected data and information based on the author’s ideas and thoughts, which relates to the
inductive approach.
3.2 Data collection methods
The data collection methods used will be discussed in this thesis. A mixed methods approach
was used, implying that both qualitative and quantitative methods were utilized when
collecting data.
3.2.1 Qualitative data collection
Collecting data using a qualitative approach is essential when studying the underlying
processes and causes of a specific field of study or behind stated results. Thus, a qualitative
data collection provides information more complex than the objective and accurate
information retrieved from standardized methods (Patton, 2005). Further, Eklund (2013)
claims that qualitative data collection should be characterized by researchers aiming at using
triangulation to achieve a higher credibility of the study. The objective with using
triangulation is to collect data from several sources in order to verify the accuracy of the data
(Trochim, 2006). Specifically, this can be translated to interviewing multiple people from
various positions and responsibilities, which is why forklift drivers, team leaders, transport
planners, warehouse managers, and factory logistics managers have been chosen.
The operators handling the empty pallets, which is the forklift drivers, were interviewed with
the objective to gain an understanding of the everyday operations and to get an insight of their
thought regarding the current inspection quality process of received deliveries of empty
pallets. Team leaders, transport planners and warehouse managers were chosen to gain

21
knowledge of established standards and routines regarding the empty pallet process as well as
to gather information regarding the administrative part of the process. Finally, it was
considered important to give the factory logistics manager the opportunity to express thoughts
and ideas of the vision regarding the empty pallet process.
Relating the quantitative data collection to the research questions, it can be stated that the
quantitative method was found useful in answering all three research questions. However, the
main goal with the qualitative data collection was to address the first research question, in
which this method had a major contribution to the presented results. Further, by giving
multiple employees the opportunity to express their thoughts the collected data could easily be
verified which ultimately contributed to securing the accuracy of the collected data.
3.2.2 Quantitative data collection
The objective with quantitative data collection is to make use of information expressed in
numbers to measure or assess a certain field of study (Eklund, 2013). Collecting data with this
method is characterized by the use of structured and standardized methods, making it easy for
others interested in the field of study to achieve the same results (Björklund and Paulsson,
2012). Information gained from a quantitative data collection presents rather objective and
considerably accurate results compared to the qualitative data collection. In order verify the
collected data, researchers that adopts a quantitative approach uses internal validity which
represents the level of which obstacles to internal validity have been considered (Trochim,
2006). The major obstacles to internal validity relates to the history of data, in which the data
collected should be relevant in time, and selection of data, meaning that the data collected
should represent the actual field of study (Eklund, 2006).
A majority of the quantitative data utilized in this thesis were collected from SAP, which is
the ERP system the firm uses, and from Microsoft Excel files. The latter source of
information constituted a variety of reports regarding the number of empty pallets delivered,
the stock of empty pallets, number of empty pallets per delivery, number of empty pallets per
truck, etc. Also, a business intelligence software tool was used to access data regarding
volumes relating to certain countries. The countries were restricted to Norway and Denmark
and the data collected represented figures from the previous year (2016) until the present year
(2017). Further, data were collected from different pallet pooling systems in order to
understand the various conditions of each pooling system.
3.2.3 Literature review
The majority of the literature review was accessed through Chalmers library databases and
Google Scholar. Additional information could be gathered from lectures of professors at the
SCM programme at Chalmers and from the intranet of SCA. The references used in this thesis
are mainly based on scientific journals and edited books from different publishers, as
illustrated in Table 3. Further, the various search terms used to find journals and books can
also be found in the table.
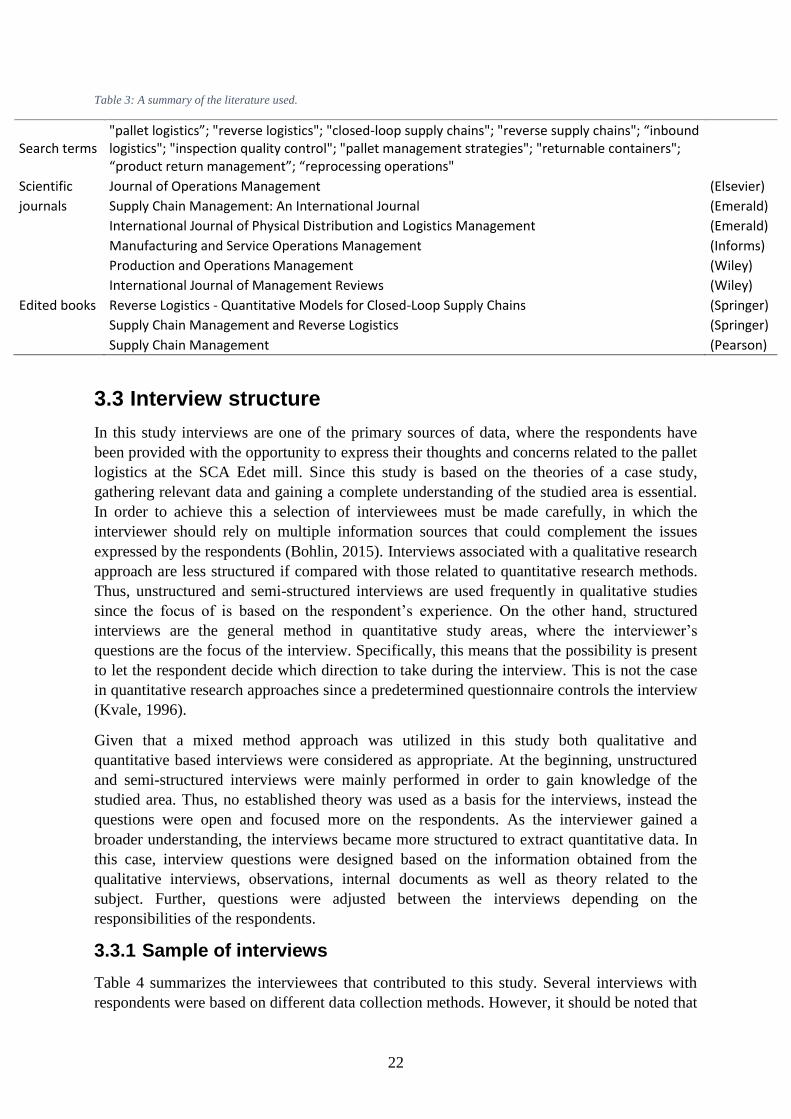
22
Table 3: A summary of the literature used.
Search terms "pallet logistics”; "reverse logistics"; "closed-loop supply chains"; "reverse supply chains"; “inbound logistics"; "inspection quality control"; "pallet management strategies"; "returnable containers"; “product return management”; “reprocessing operations"
Scientific Journal of Operations Management (Elsevier)
journals Supply Chain Management: An International Journal (Emerald)
International Journal of Physical Distribution and Logistics Management (Emerald)
Manufacturing and Service Operations Management (Informs)
Production and Operations Management (Wiley)
International Journal of Management Reviews (Wiley)
Edited books Reverse Logistics - Quantitative Models for Closed-Loop Supply Chains (Springer)
Supply Chain Management and Reverse Logistics (Springer)
Supply Chain Management (Pearson)
3.3 Interview structure
In this study interviews are one of the primary sources of data, where the respondents have
been provided with the opportunity to express their thoughts and concerns related to the pallet
logistics at the SCA Edet mill. Since this study is based on the theories of a case study,
gathering relevant data and gaining a complete understanding of the studied area is essential.
In order to achieve this a selection of interviewees must be made carefully, in which the
interviewer should rely on multiple information sources that could complement the issues
expressed by the respondents (Bohlin, 2015). Interviews associated with a qualitative research
approach are less structured if compared with those related to quantitative research methods.
Thus, unstructured and semi-structured interviews are used frequently in qualitative studies
since the focus of is based on the respondent’s experience. On the other hand, structured
interviews are the general method in quantitative study areas, where the interviewer’s
questions are the focus of the interview. Specifically, this means that the possibility is present
to let the respondent decide which direction to take during the interview. This is not the case
in quantitative research approaches since a predetermined questionnaire controls the interview
(Kvale, 1996).
Given that a mixed method approach was utilized in this study both qualitative and
quantitative based interviews were considered as appropriate. At the beginning, unstructured
and semi-structured interviews were mainly performed in order to gain knowledge of the
studied area. Thus, no established theory was used as a basis for the interviews, instead the
questions were open and focused more on the respondents. As the interviewer gained a
broader understanding, the interviews became more structured to extract quantitative data. In
this case, interview questions were designed based on the information obtained from the
qualitative interviews, observations, internal documents as well as theory related to the
subject. Further, questions were adjusted between the interviews depending on the
responsibilities of the respondents.
3.3.1 Sample of interviews
Table 4 summarizes the interviewees that contributed to this study. Several interviews with
respondents were based on different data collection methods. However, it should be noted that
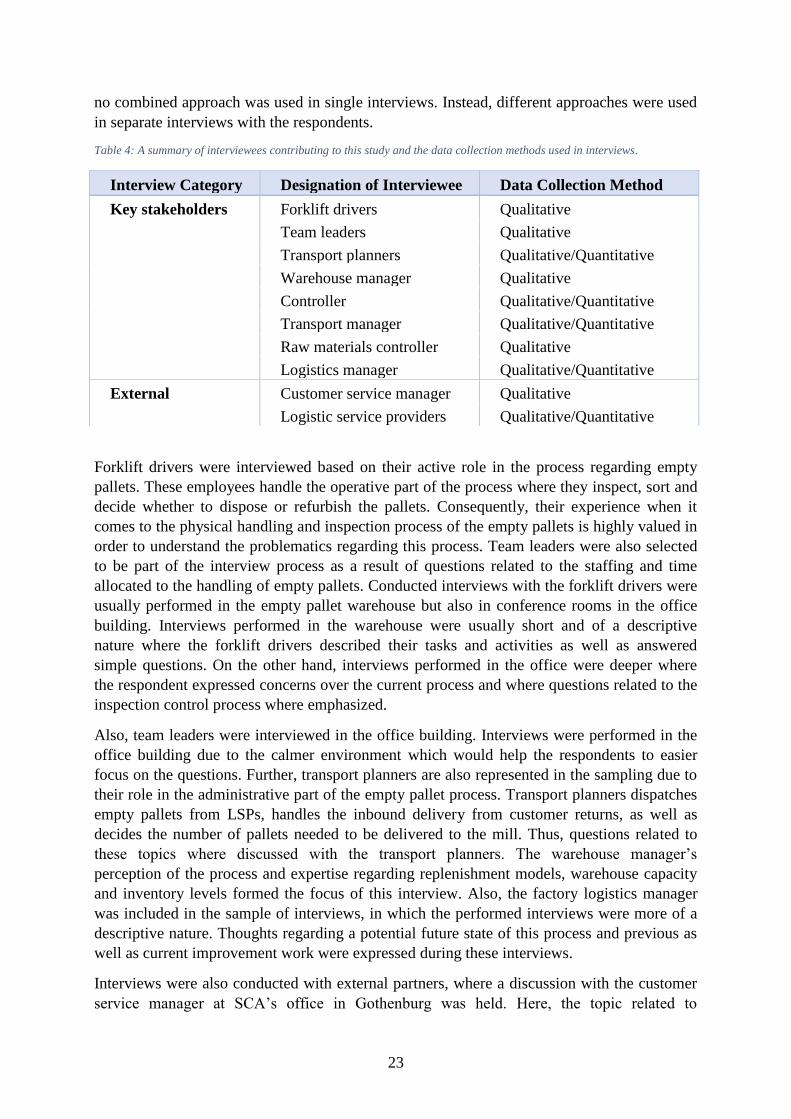
23
no combined approach was used in single interviews. Instead, different approaches were used
in separate interviews with the respondents.
Table 4: A summary of interviewees contributing to this study and the data collection methods used in interviews.
Forklift drivers were interviewed based on their active role in the process regarding empty
pallets. These employees handle the operative part of the process where they inspect, sort and
decide whether to dispose or refurbish the pallets. Consequently, their experience when it
comes to the physical handling and inspection process of the empty pallets is highly valued in
order to understand the problematics regarding this process. Team leaders were also selected
to be part of the interview process as a result of questions related to the staffing and time
allocated to the handling of empty pallets. Conducted interviews with the forklift drivers were
usually performed in the empty pallet warehouse but also in conference rooms in the office
building. Interviews performed in the warehouse were usually short and of a descriptive
nature where the forklift drivers described their tasks and activities as well as answered
simple questions. On the other hand, interviews performed in the office were deeper where
the respondent expressed concerns over the current process and where questions related to the
inspection control process where emphasized.
Also, team leaders were interviewed in the office building. Interviews were performed in the
office building due to the calmer environment which would help the respondents to easier
focus on the questions. Further, transport planners are also represented in the sampling due to
their role in the administrative part of the empty pallet process. Transport planners dispatches
empty pallets from LSPs, handles the inbound delivery from customer returns, as well as
decides the number of pallets needed to be delivered to the mill. Thus, questions related to
these topics where discussed with the transport planners. The warehouse manager’s
perception of the process and expertise regarding replenishment models, warehouse capacity
and inventory levels formed the focus of this interview. Also, the factory logistics manager
was included in the sample of interviews, in which the performed interviews were more of a
descriptive nature. Thoughts regarding a potential future state of this process and previous as
well as current improvement work were expressed during these interviews.
Interviews were also conducted with external partners, where a discussion with the customer
service manager at SCA’s office in Gothenburg was held. Here, the topic related to
Interview Category Designation of Interviewee Data Collection Method
Key stakeholders Forklift drivers Qualitative
Team leaders Qualitative
Transport planners Qualitative/Quantitative
Warehouse manager Qualitative
Controller Qualitative/Quantitative
Transport manager Qualitative/Quantitative
Raw materials controller Qualitative
Logistics manager Qualitative/Quantitative
External Customer service manager Qualitative
Logistic service providers Qualitative/Quantitative
24
agreements with pallet pooling systems. Further, LSPs were included in the interviews in
order to gain an understanding of the pallet logistics from their point of view.
3.4 Reliability
Reliability relates to the quality of a study and is perceived as a measure on how repeatable or
consistence a performed measurement is (Trochim, 2006). Thus, the field of study is thought
to be reliable if the result of the study is not affected by random variables that have a negative
impact on the expected result (Eklund, 2013). More specific, this means that if the study is
performed during similar conditions an identical outcome should be expected. Random
variables affecting the result of the study can be divided into human factors and
environmental factors (Trochim, 2006). The human factors relate to the person’s mood, if
they are tired or fell ill. While the environmental factors relate to the light, noise and other
environmental factors that could have an impact on the outcome. Further, Ejvegård (2003)
claims that the outcome of a study does not have any value if it is not reliable.
Relating the qualitative data collection to the concept of reliability it can be stated that noise
could be perceived as a valid concern to the reliability of this study. Handling empty pallets in
the warehouse exposes the employees to loud noises from other forklifts, the sorting machine
and other warehouse related activities. However, these environmental factors are not
continuously present. For instance, the sorting machine give rise to loud noises only when it is
operating. Still, it may be difficult to understand the forklift driver’s expressions. Due to this,
interviews with forklift drivers where held in a more peaceful environment. These interviews
were then combined with observations of the activities when handling the empty pallets. By
first listening to the forklift drivers and then observe them increases the reliability of this
thesis since the observations provide some kind of assurance to how much of data collected
during the interviews corresponds to the actual situation.
Regarding the quantitative data collection reliability could be ensured through repeated
measurements which provides an overview to how much the different measurements differ
from each other. Also, by double checking calculated figures and receiving response from
employees further increased the reliability. Specifically, this can be related to the calculation
on the number of empty pallets, storage space required and calculations of the sorting
machines capacity were double checked by observations and measurements in the warehouse
and through the feedback from employees directly involved with these tasks.
3.5 Validity of data
Validity refers to how well the researcher has been able to study the intended problem and
relates to the validity of the measurement (Ejvegård, 2003). In order to achieve a high
validity, it is essential to ensure the observation of the actual problem and not the observation
of an adjacent problem (Eklund, 2013). Thus, validity is a measurement of the ability to study,
analyse and interpret the intended and relevant objects of the study. Obstacles affecting the
validity is described as systematic errors and is perceived as bias in a performed measurement
(Trochim, 2006).
There were two activities that helped ensure the validity of this thesis. Firstly, the initial
interviews that were held with concerned staff guided the researcher to study and observe the
actual problem. For instance, as presented in subchapter 4.1, forklift drivers expressed
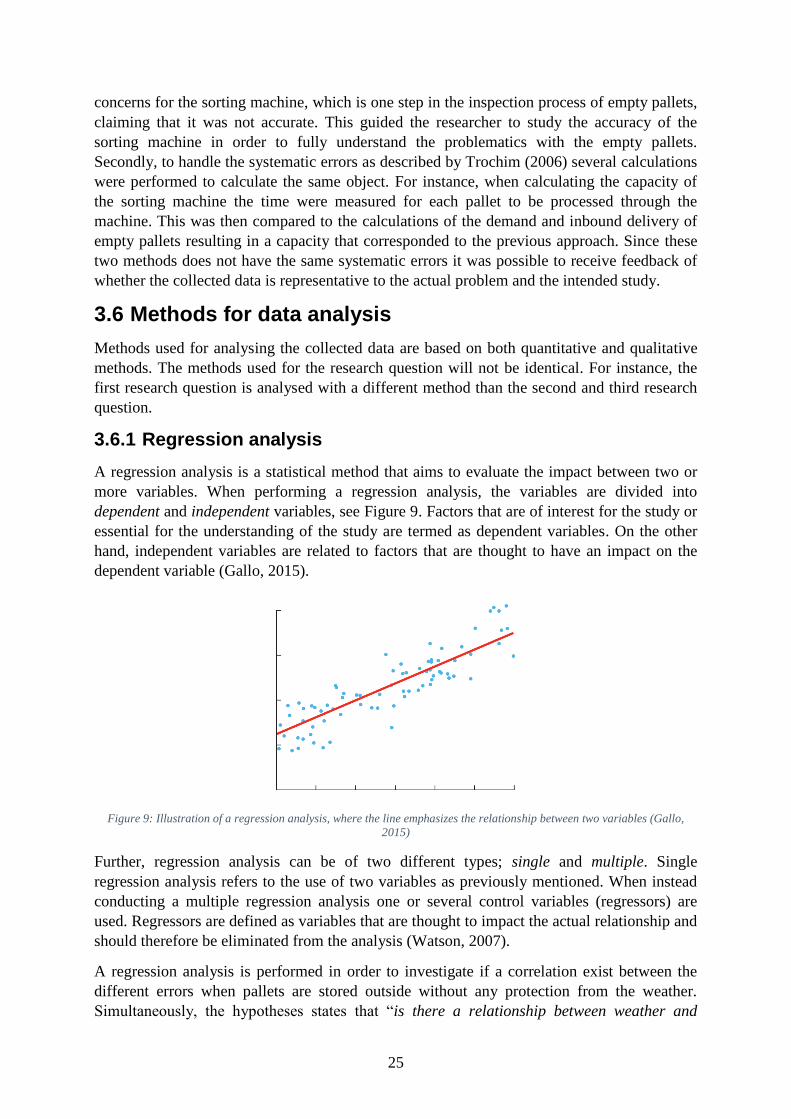
25
concerns for the sorting machine, which is one step in the inspection process of empty pallets,
claiming that it was not accurate. This guided the researcher to study the accuracy of the
sorting machine in order to fully understand the problematics with the empty pallets.
Secondly, to handle the systematic errors as described by Trochim (2006) several calculations
were performed to calculate the same object. For instance, when calculating the capacity of
the sorting machine the time were measured for each pallet to be processed through the
machine. This was then compared to the calculations of the demand and inbound delivery of
empty pallets resulting in a capacity that corresponded to the previous approach. Since these
two methods does not have the same systematic errors it was possible to receive feedback of
whether the collected data is representative to the actual problem and the intended study.
3.6 Methods for data analysis
Methods used for analysing the collected data are based on both quantitative and qualitative
methods. The methods used for the research question will not be identical. For instance, the
first research question is analysed with a different method than the second and third research
question.
3.6.1 Regression analysis
A regression analysis is a statistical method that aims to evaluate the impact between two or
more variables. When performing a regression analysis, the variables are divided into
dependent and independent variables, see Figure 9. Factors that are of interest for the study or
essential for the understanding of the study are termed as dependent variables. On the other
hand, independent variables are related to factors that are thought to have an impact on the
dependent variable (Gallo, 2015).
Figure 9: Illustration of a regression analysis, where the line emphasizes the relationship between two variables (Gallo,
2015)
Further, regression analysis can be of two different types; single and multiple. Single
regression analysis refers to the use of two variables as previously mentioned. When instead
conducting a multiple regression analysis one or several control variables (regressors) are
used. Regressors are defined as variables that are thought to impact the actual relationship and
should therefore be eliminated from the analysis (Watson, 2007).
A regression analysis is performed in order to investigate if a correlation exist between the
different errors when pallets are stored outside without any protection from the weather.
Simultaneously, the hypotheses states that “is there a relationship between weather and
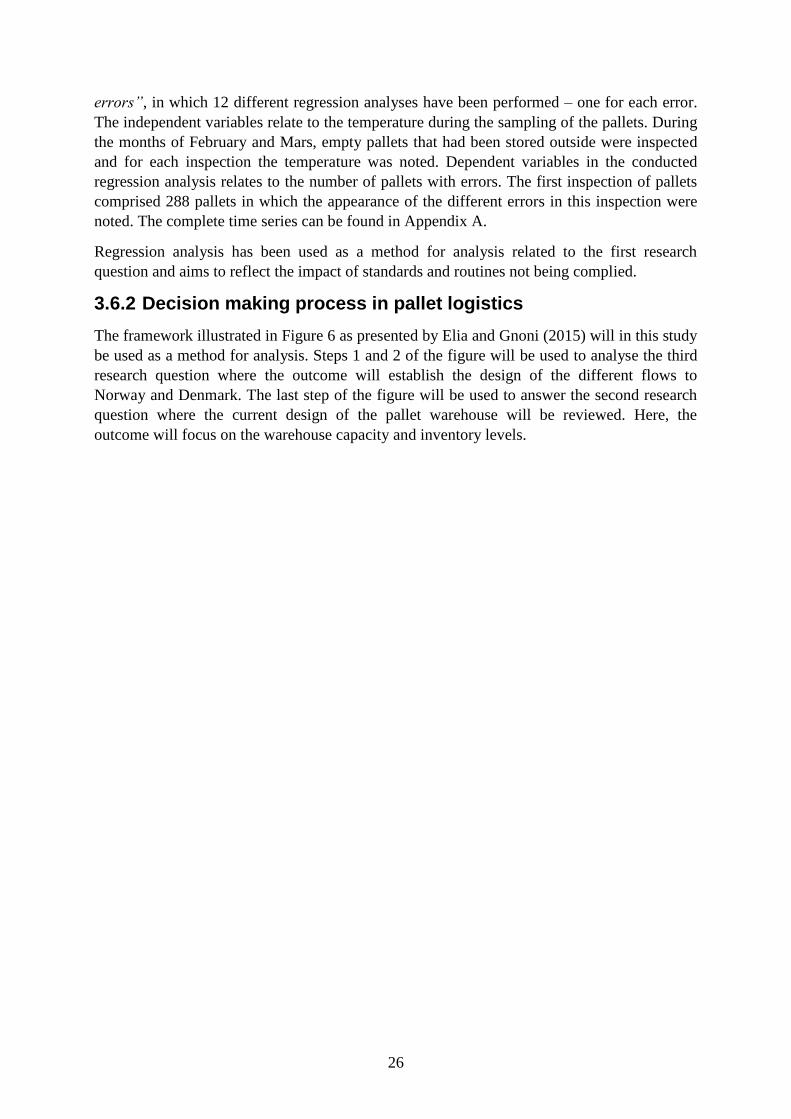
26
errors”, in which 12 different regression analyses have been performed – one for each error.
The independent variables relate to the temperature during the sampling of the pallets. During
the months of February and Mars, empty pallets that had been stored outside were inspected
and for each inspection the temperature was noted. Dependent variables in the conducted
regression analysis relates to the number of pallets with errors. The first inspection of pallets
comprised 288 pallets in which the appearance of the different errors in this inspection were
noted. The complete time series can be found in Appendix A.
Regression analysis has been used as a method for analysis related to the first research
question and aims to reflect the impact of standards and routines not being complied.
3.6.2 Decision making process in pallet logistics
The framework illustrated in Figure 6 as presented by Elia and Gnoni (2015) will in this study
be used as a method for analysis. Steps 1 and 2 of the figure will be used to analyse the third
research question where the outcome will establish the design of the different flows to
Norway and Denmark. The last step of the figure will be used to answer the second research
question where the current design of the pallet warehouse will be reviewed. Here, the
outcome will focus on the warehouse capacity and inventory levels.
27
4. EMPIRICAL FINDINGS
This section presents the empirical findings from the collected data. It starts with describing
the pallet demand at the SCA Edet mill and continuous with the ordering process of pallets.
The pallet handling is then described and followed with a presentation of the current storage
and warehouse capacity. Finally, the section is concluded with a description of SCA’s export
pallet process.
4.1 Pallet demand at SCA Edet mill
A declining trend in the number of ordered pallets has been present during the majority of
previous year, see Figure 10. Such a large variation in the ordered quantity of pallets is rare at
SCA Edet mill and is not indicated by a decrease in customer demand. Instead, it can be
related to an initiated project which included exchanging a producing machine with a more
effective machine. Thus, the disassembly of the machine resulted in a reduced capacity at the
mill leading to less pallets needed. The increase in ordered number of pallets, starting from
week 40, relates to when the new machine was assembled and started producing. However,
the machine will not reach its fullest capacity during the first periods of use since all the
settings need to be adjusted gradually.
Figure 10: Ordered number of pallets per week, during 2016.
A comparison between the number of ordered pallets and consumed pallets is illustrated in
Figure 11. It should be noted that consumed pallets between week 28 and 33 is not associated
with a sudden drop and increase in demand. Rather this deviation is explained as the lack of
documentation of the consumption during these weeks. Nevertheless, the figure clearly
indicates the difference between ordered and consumed pallets, in which the number of
ordered pallets does not follow the graph of consumption. Further, the two graphs contradict
each other at times when the consumption decreases while the ordered pallets increases.
Specifically, the graphs can be related to both overflow as well as lack of pallets at the SCA
Edet mill.
0
2000
4000
6000
8000
10000
12000
14000
16000
18000
5 7 9 11 13 15 17 19 21 23 25 27 29 31 33 35 37 39 41 43 45 47 49 51
Nu
mb
er o
f p
alle
ts
Week
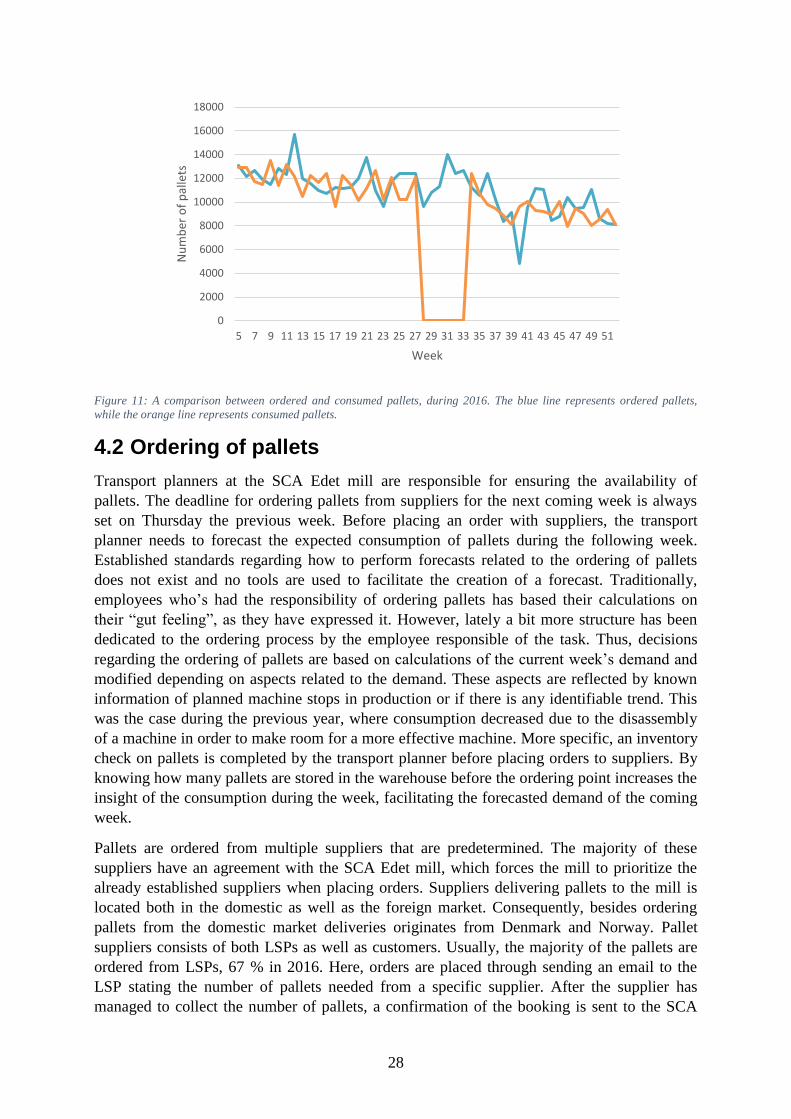
28
Figure 11: A comparison between ordered and consumed pallets, during 2016. The blue line represents ordered pallets,
while the orange line represents consumed pallets.
4.2 Ordering of pallets
Transport planners at the SCA Edet mill are responsible for ensuring the availability of
pallets. The deadline for ordering pallets from suppliers for the next coming week is always
set on Thursday the previous week. Before placing an order with suppliers, the transport
planner needs to forecast the expected consumption of pallets during the following week.
Established standards regarding how to perform forecasts related to the ordering of pallets
does not exist and no tools are used to facilitate the creation of a forecast. Traditionally,
employees who’s had the responsibility of ordering pallets has based their calculations on
their “gut feeling”, as they have expressed it. However, lately a bit more structure has been
dedicated to the ordering process by the employee responsible of the task. Thus, decisions
regarding the ordering of pallets are based on calculations of the current week’s demand and
modified depending on aspects related to the demand. These aspects are reflected by known
information of planned machine stops in production or if there is any identifiable trend. This
was the case during the previous year, where consumption decreased due to the disassembly
of a machine in order to make room for a more effective machine. More specific, an inventory
check on pallets is completed by the transport planner before placing orders to suppliers. By
knowing how many pallets are stored in the warehouse before the ordering point increases the
insight of the consumption during the week, facilitating the forecasted demand of the coming
week.
Pallets are ordered from multiple suppliers that are predetermined. The majority of these
suppliers have an agreement with the SCA Edet mill, which forces the mill to prioritize the
already established suppliers when placing orders. Suppliers delivering pallets to the mill is
located both in the domestic as well as the foreign market. Consequently, besides ordering
pallets from the domestic market deliveries originates from Denmark and Norway. Pallet
suppliers consists of both LSPs as well as customers. Usually, the majority of the pallets are
ordered from LSPs, 67 % in 2016. Here, orders are placed through sending an email to the
LSP stating the number of pallets needed from a specific supplier. After the supplier has
managed to collect the number of pallets, a confirmation of the booking is sent to the SCA
0
2000
4000
6000
8000
10000
12000
14000
16000
18000
5 7 9 11 13 15 17 19 21 23 25 27 29 31 33 35 37 39 41 43 45 47 49 51
Nu
mb
er o
f p
alle
ts
Week
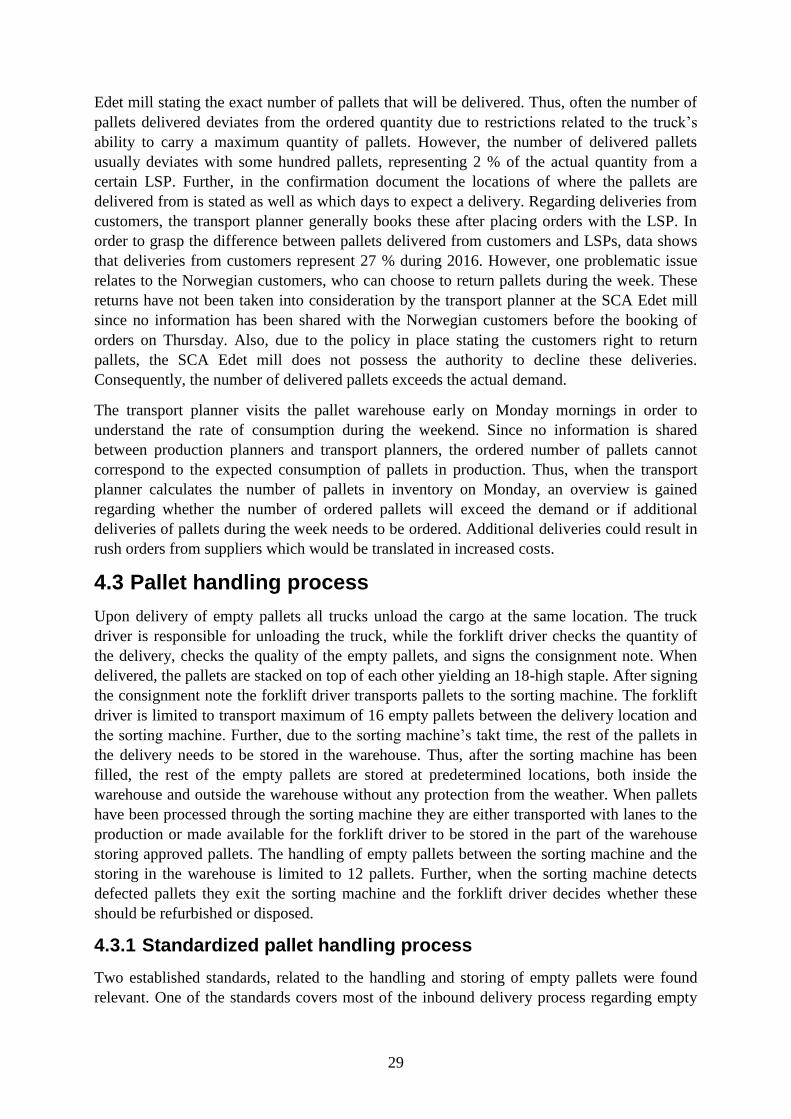
29
Edet mill stating the exact number of pallets that will be delivered. Thus, often the number of
pallets delivered deviates from the ordered quantity due to restrictions related to the truck’s
ability to carry a maximum quantity of pallets. However, the number of delivered pallets
usually deviates with some hundred pallets, representing 2 % of the actual quantity from a
certain LSP. Further, in the confirmation document the locations of where the pallets are
delivered from is stated as well as which days to expect a delivery. Regarding deliveries from
customers, the transport planner generally books these after placing orders with the LSP. In
order to grasp the difference between pallets delivered from customers and LSPs, data shows
that deliveries from customers represent 27 % during 2016. However, one problematic issue
relates to the Norwegian customers, who can choose to return pallets during the week. These
returns have not been taken into consideration by the transport planner at the SCA Edet mill
since no information has been shared with the Norwegian customers before the booking of
orders on Thursday. Also, due to the policy in place stating the customers right to return
pallets, the SCA Edet mill does not possess the authority to decline these deliveries.
Consequently, the number of delivered pallets exceeds the actual demand.
The transport planner visits the pallet warehouse early on Monday mornings in order to
understand the rate of consumption during the weekend. Since no information is shared
between production planners and transport planners, the ordered number of pallets cannot
correspond to the expected consumption of pallets in production. Thus, when the transport
planner calculates the number of pallets in inventory on Monday, an overview is gained
regarding whether the number of ordered pallets will exceed the demand or if additional
deliveries of pallets during the week needs to be ordered. Additional deliveries could result in
rush orders from suppliers which would be translated in increased costs.
4.3 Pallet handling process
Upon delivery of empty pallets all trucks unload the cargo at the same location. The truck
driver is responsible for unloading the truck, while the forklift driver checks the quantity of
the delivery, checks the quality of the empty pallets, and signs the consignment note. When
delivered, the pallets are stacked on top of each other yielding an 18-high staple. After signing
the consignment note the forklift driver transports pallets to the sorting machine. The forklift
driver is limited to transport maximum of 16 empty pallets between the delivery location and
the sorting machine. Further, due to the sorting machine’s takt time, the rest of the pallets in
the delivery needs to be stored in the warehouse. Thus, after the sorting machine has been
filled, the rest of the empty pallets are stored at predetermined locations, both inside the
warehouse and outside the warehouse without any protection from the weather. When pallets
have been processed through the sorting machine they are either transported with lanes to the
production or made available for the forklift driver to be stored in the part of the warehouse
storing approved pallets. The handling of empty pallets between the sorting machine and the
storing in the warehouse is limited to 12 pallets. Further, when the sorting machine detects
defected pallets they exit the sorting machine and the forklift driver decides whether these
should be refurbished or disposed.
4.3.1 Standardized pallet handling process
Two established standards, related to the handling and storing of empty pallets were found
relevant. One of the standards covers most of the inbound delivery process regarding empty
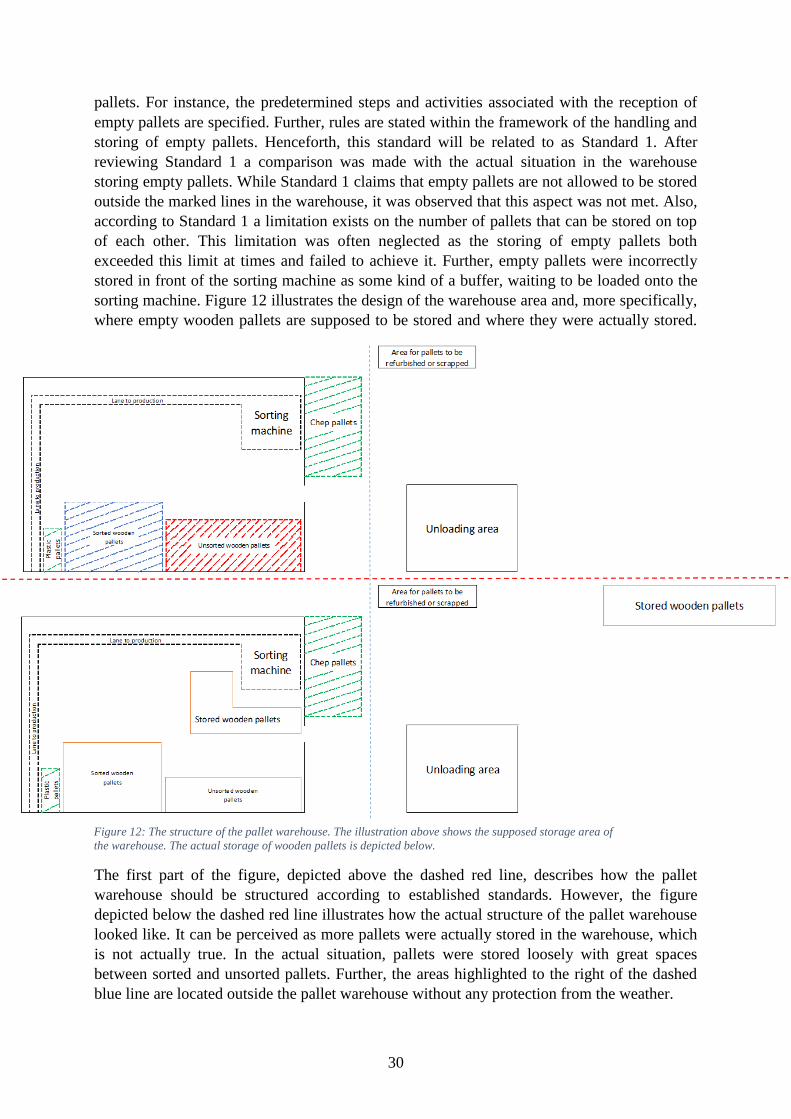
30
pallets. For instance, the predetermined steps and activities associated with the reception of
empty pallets are specified. Further, rules are stated within the framework of the handling and
storing of empty pallets. Henceforth, this standard will be related to as Standard 1. After
reviewing Standard 1 a comparison was made with the actual situation in the warehouse
storing empty pallets. While Standard 1 claims that empty pallets are not allowed to be stored
outside the marked lines in the warehouse, it was observed that this aspect was not met. Also,
according to Standard 1 a limitation exists on the number of pallets that can be stored on top
of each other. This limitation was often neglected as the storing of empty pallets both
exceeded this limit at times and failed to achieve it. Further, empty pallets were incorrectly
stored in front of the sorting machine as some kind of a buffer, waiting to be loaded onto the
sorting machine. Figure 12 illustrates the design of the warehouse area and, more specifically,
where empty wooden pallets are supposed to be stored and where they were actually stored.
The first part of the figure, depicted above the dashed red line, describes how the pallet
warehouse should be structured according to established standards. However, the figure
depicted below the dashed red line illustrates how the actual structure of the pallet warehouse
looked like. It can be perceived as more pallets were actually stored in the warehouse, which
is not actually true. In the actual situation, pallets were stored loosely with great spaces
between sorted and unsorted pallets. Further, the areas highlighted to the right of the dashed
blue line are located outside the pallet warehouse without any protection from the weather.
Figure 12: The structure of the pallet warehouse. The illustration above shows the supposed storage area of
the warehouse. The actual storage of wooden pallets is depicted below.
31
On the other hand, the second standard describes the sorting rules associated with the quality
control of empty pallets, where various failure reasons corresponding to defective pallets are
mapped, see Figure 13. This standard will further be related to as Standard 2. Observations on
sorted and pallets were also performed to understand how well Standard 2 were complied.
Further, the observations concluded that multiple defective pallets had been sorted and cleared
as accepted. The lack of compliance with Standard 1 and 2 constitutes a major problem to the
current inspection control process. Interviews were held to deal with this issue.
4.3.2 Errors associated with defective pallets
Inspected pallets at SCA Edet mill are perceived as defected if any of the errors, as illustrated
in Figure 13, are present. The Vocational Training and Working Environment Council has
created this guideline in order to achieve some form of standardization related to pallet
exchange between a sender and receiver. Some of the largest operating haulers and LSPs in
Sweden are connected to the council and follows its recommendations. However, these
sorting rules are not enforced by law, allowing each receiver to ultimately set up their own
rules regarding the acceptance of pallets.
Figure 13: 12 errors that identifies a defective pallet, according to the Vocational Training and Working Environment
Council in Sweden.
According to Table 5, the different errors have been given a number to facilitate the
illustrations in figures related to this study.
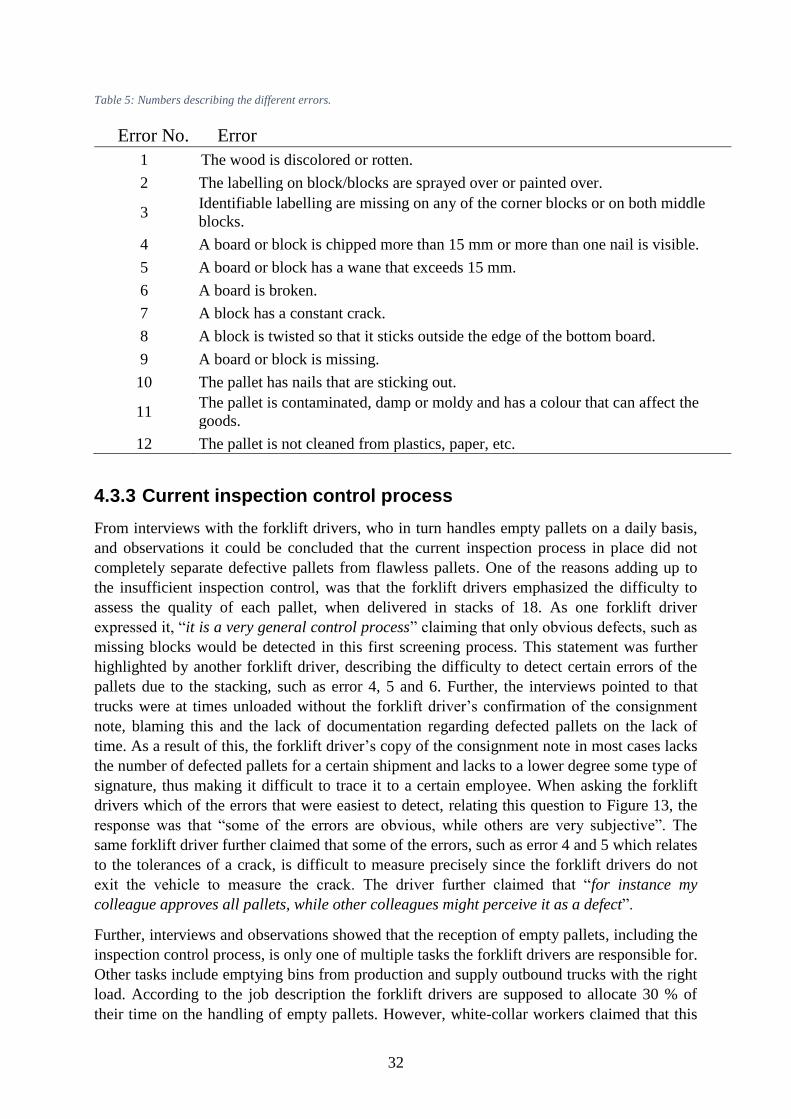
32
Table 5: Numbers describing the different errors.
Error No. Error
1 The wood is discolored or rotten.
2 The labelling on block/blocks are sprayed over or painted over.
3 Identifiable labelling are missing on any of the corner blocks or on both middle
blocks.
4 A board or block is chipped more than 15 mm or more than one nail is visible.
5 A board or block has a wane that exceeds 15 mm.
6 A board is broken.
7 A block has a constant crack.
8 A block is twisted so that it sticks outside the edge of the bottom board.
9 A board or block is missing.
10 The pallet has nails that are sticking out.
11 The pallet is contaminated, damp or moldy and has a colour that can affect the
goods.
12 The pallet is not cleaned from plastics, paper, etc.
4.3.3 Current inspection control process
From interviews with the forklift drivers, who in turn handles empty pallets on a daily basis,
and observations it could be concluded that the current inspection process in place did not
completely separate defective pallets from flawless pallets. One of the reasons adding up to
the insufficient inspection control, was that the forklift drivers emphasized the difficulty to
assess the quality of each pallet, when delivered in stacks of 18. As one forklift driver
expressed it, “it is a very general control process” claiming that only obvious defects, such as
missing blocks would be detected in this first screening process. This statement was further
highlighted by another forklift driver, describing the difficulty to detect certain errors of the
pallets due to the stacking, such as error 4, 5 and 6. Further, the interviews pointed to that
trucks were at times unloaded without the forklift driver’s confirmation of the consignment
note, blaming this and the lack of documentation regarding defected pallets on the lack of
time. As a result of this, the forklift driver’s copy of the consignment note in most cases lacks
the number of defected pallets for a certain shipment and lacks to a lower degree some type of
signature, thus making it difficult to trace it to a certain employee. When asking the forklift
drivers which of the errors that were easiest to detect, relating this question to Figure 13, the
response was that “some of the errors are obvious, while others are very subjective”. The
same forklift driver further claimed that some of the errors, such as error 4 and 5 which relates
to the tolerances of a crack, is difficult to measure precisely since the forklift drivers do not
exit the vehicle to measure the crack. The driver further claimed that “for instance my
colleague approves all pallets, while other colleagues might perceive it as a defect”.
Further, interviews and observations showed that the reception of empty pallets, including the
inspection control process, is only one of multiple tasks the forklift drivers are responsible for.
Other tasks include emptying bins from production and supply outbound trucks with the right
load. According to the job description the forklift drivers are supposed to allocate 30 % of
their time on the handling of empty pallets. However, white-collar workers claimed that this
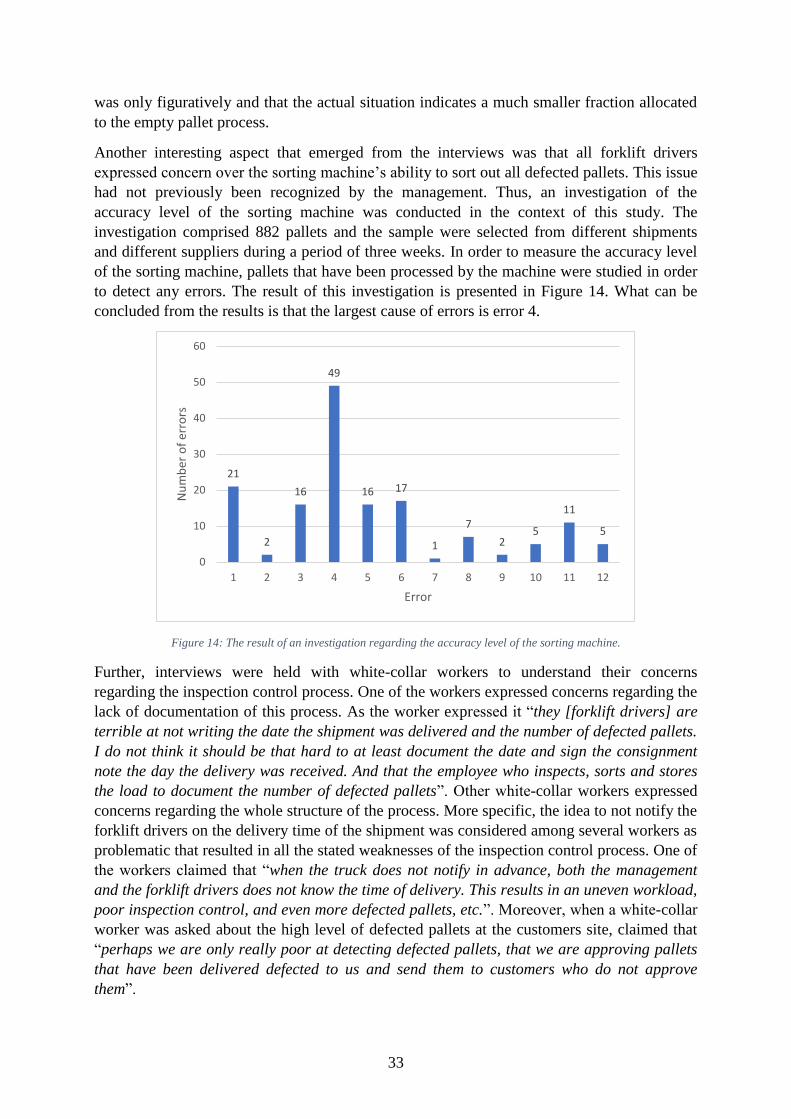
33
was only figuratively and that the actual situation indicates a much smaller fraction allocated
to the empty pallet process.
Another interesting aspect that emerged from the interviews was that all forklift drivers
expressed concern over the sorting machine’s ability to sort out all defected pallets. This issue
had not previously been recognized by the management. Thus, an investigation of the
accuracy level of the sorting machine was conducted in the context of this study. The
investigation comprised 882 pallets and the sample were selected from different shipments
and different suppliers during a period of three weeks. In order to measure the accuracy level
of the sorting machine, pallets that have been processed by the machine were studied in order
to detect any errors. The result of this investigation is presented in Figure 14. What can be
concluded from the results is that the largest cause of errors is error 4.
Figure 14: The result of an investigation regarding the accuracy level of the sorting machine.
Further, interviews were held with white-collar workers to understand their concerns
regarding the inspection control process. One of the workers expressed concerns regarding the
lack of documentation of this process. As the worker expressed it “they [forklift drivers] are
terrible at not writing the date the shipment was delivered and the number of defected pallets.
I do not think it should be that hard to at least document the date and sign the consignment
note the day the delivery was received. And that the employee who inspects, sorts and stores
the load to document the number of defected pallets”. Other white-collar workers expressed
concerns regarding the whole structure of the process. More specific, the idea to not notify the
forklift drivers on the delivery time of the shipment was considered among several workers as
problematic that resulted in all the stated weaknesses of the inspection control process. One of
the workers claimed that “when the truck does not notify in advance, both the management
and the forklift drivers does not know the time of delivery. This results in an uneven workload,
poor inspection control, and even more defected pallets, etc.”. Moreover, when a white-collar
worker was asked about the high level of defected pallets at the customers site, claimed that
“perhaps we are only really poor at detecting defected pallets, that we are approving pallets
that have been delivered defected to us and send them to customers who do not approve
them”.
21
2
16
49
16 17
1
7
25
11
5
0
10
20
30
40
50
60
1 2 3 4 5 6 7 8 9 10 11 12
Nu
mb
er o
f er
rors
Error
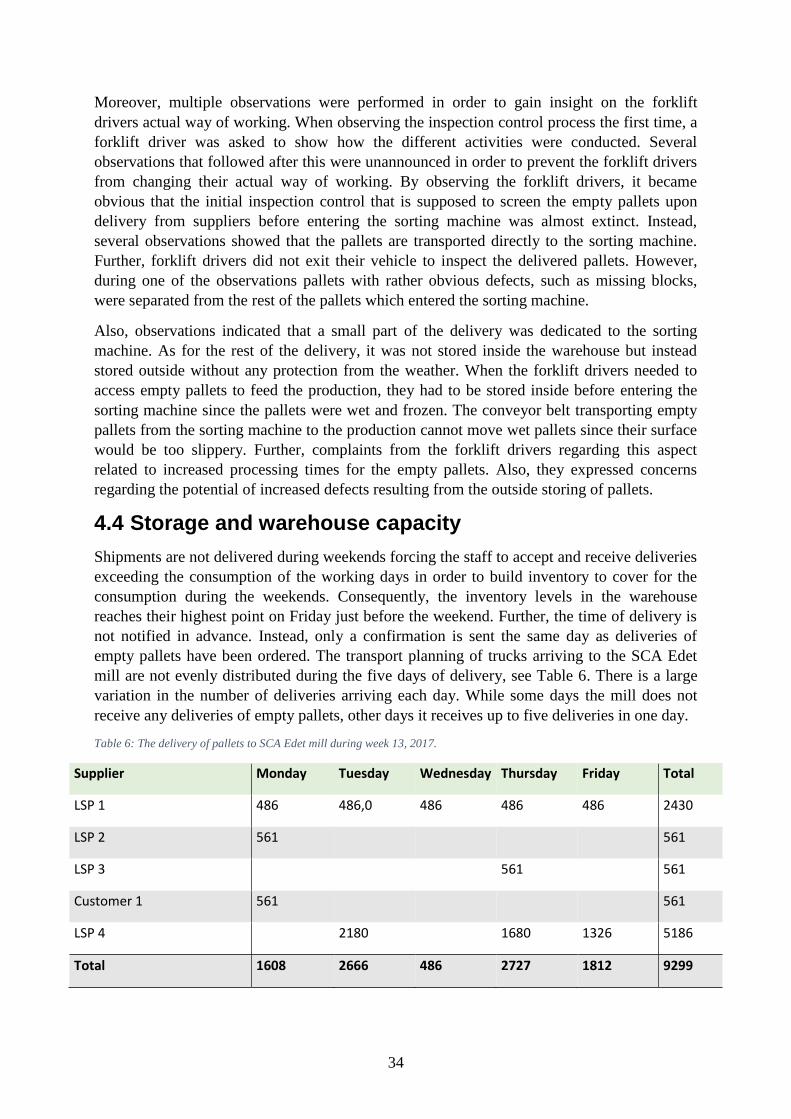
34
Moreover, multiple observations were performed in order to gain insight on the forklift
drivers actual way of working. When observing the inspection control process the first time, a
forklift driver was asked to show how the different activities were conducted. Several
observations that followed after this were unannounced in order to prevent the forklift drivers
from changing their actual way of working. By observing the forklift drivers, it became
obvious that the initial inspection control that is supposed to screen the empty pallets upon
delivery from suppliers before entering the sorting machine was almost extinct. Instead,
several observations showed that the pallets are transported directly to the sorting machine.
Further, forklift drivers did not exit their vehicle to inspect the delivered pallets. However,
during one of the observations pallets with rather obvious defects, such as missing blocks,
were separated from the rest of the pallets which entered the sorting machine.
Also, observations indicated that a small part of the delivery was dedicated to the sorting
machine. As for the rest of the delivery, it was not stored inside the warehouse but instead
stored outside without any protection from the weather. When the forklift drivers needed to
access empty pallets to feed the production, they had to be stored inside before entering the
sorting machine since the pallets were wet and frozen. The conveyor belt transporting empty
pallets from the sorting machine to the production cannot move wet pallets since their surface
would be too slippery. Further, complaints from the forklift drivers regarding this aspect
related to increased processing times for the empty pallets. Also, they expressed concerns
regarding the potential of increased defects resulting from the outside storing of pallets.
4.4 Storage and warehouse capacity
Shipments are not delivered during weekends forcing the staff to accept and receive deliveries
exceeding the consumption of the working days in order to build inventory to cover for the
consumption during the weekends. Consequently, the inventory levels in the warehouse
reaches their highest point on Friday just before the weekend. Further, the time of delivery is
not notified in advance. Instead, only a confirmation is sent the same day as deliveries of
empty pallets have been ordered. The transport planning of trucks arriving to the SCA Edet
mill are not evenly distributed during the five days of delivery, see Table 6. There is a large
variation in the number of deliveries arriving each day. While some days the mill does not
receive any deliveries of empty pallets, other days it receives up to five deliveries in one day.
Table 6: The delivery of pallets to SCA Edet mill during week 13, 2017.
Supplier Monday Tuesday Wednesday Thursday Friday Total
LSP 1 486 486,0 486 486 486 2430
LSP 2 561
561
LSP 3
561
561
Customer 1 561
561
LSP 4
2180
1680 1326 5186
Total 1608 2666 486 2727 1812 9299
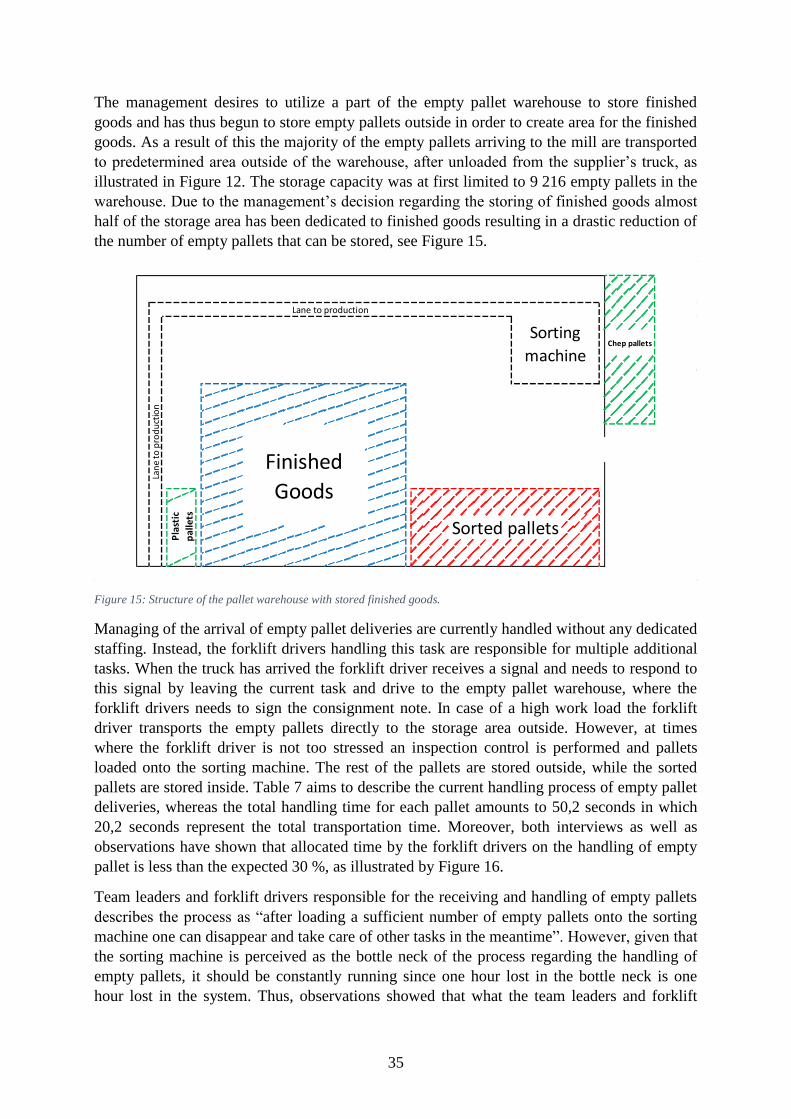
35
The management desires to utilize a part of the empty pallet warehouse to store finished
goods and has thus begun to store empty pallets outside in order to create area for the finished
goods. As a result of this the majority of the empty pallets arriving to the mill are transported
to predetermined area outside of the warehouse, after unloaded from the supplier’s truck, as
illustrated in Figure 12. The storage capacity was at first limited to 9 216 empty pallets in the
warehouse. Due to the management’s decision regarding the storing of finished goods almost
half of the storage area has been dedicated to finished goods resulting in a drastic reduction of
the number of empty pallets that can be stored, see Figure 15.
Figure 15: Structure of the pallet warehouse with stored finished goods.
Managing of the arrival of empty pallet deliveries are currently handled without any dedicated
staffing. Instead, the forklift drivers handling this task are responsible for multiple additional
tasks. When the truck has arrived the forklift driver receives a signal and needs to respond to
this signal by leaving the current task and drive to the empty pallet warehouse, where the
forklift drivers needs to sign the consignment note. In case of a high work load the forklift
driver transports the empty pallets directly to the storage area outside. However, at times
where the forklift driver is not too stressed an inspection control is performed and pallets
loaded onto the sorting machine. The rest of the pallets are stored outside, while the sorted
pallets are stored inside. Table 7 aims to describe the current handling process of empty pallet
deliveries, whereas the total handling time for each pallet amounts to 50,2 seconds in which
20,2 seconds represent the total transportation time. Moreover, both interviews as well as
observations have shown that allocated time by the forklift drivers on the handling of empty
pallet is less than the expected 30 %, as illustrated by Figure 16.
Team leaders and forklift drivers responsible for the receiving and handling of empty pallets
describes the process as “after loading a sufficient number of empty pallets onto the sorting
machine one can disappear and take care of other tasks in the meantime”. However, given that
the sorting machine is perceived as the bottle neck of the process regarding the handling of
empty pallets, it should be constantly running since one hour lost in the bottle neck is one
hour lost in the system. Thus, observations showed that what the team leaders and forklift
Chep palletsSorting
machine
Lane to production
Lan
e to
pro
du
ctio
n
Finished
Goods
Sorted pallets
Pla
stic
pal
lets
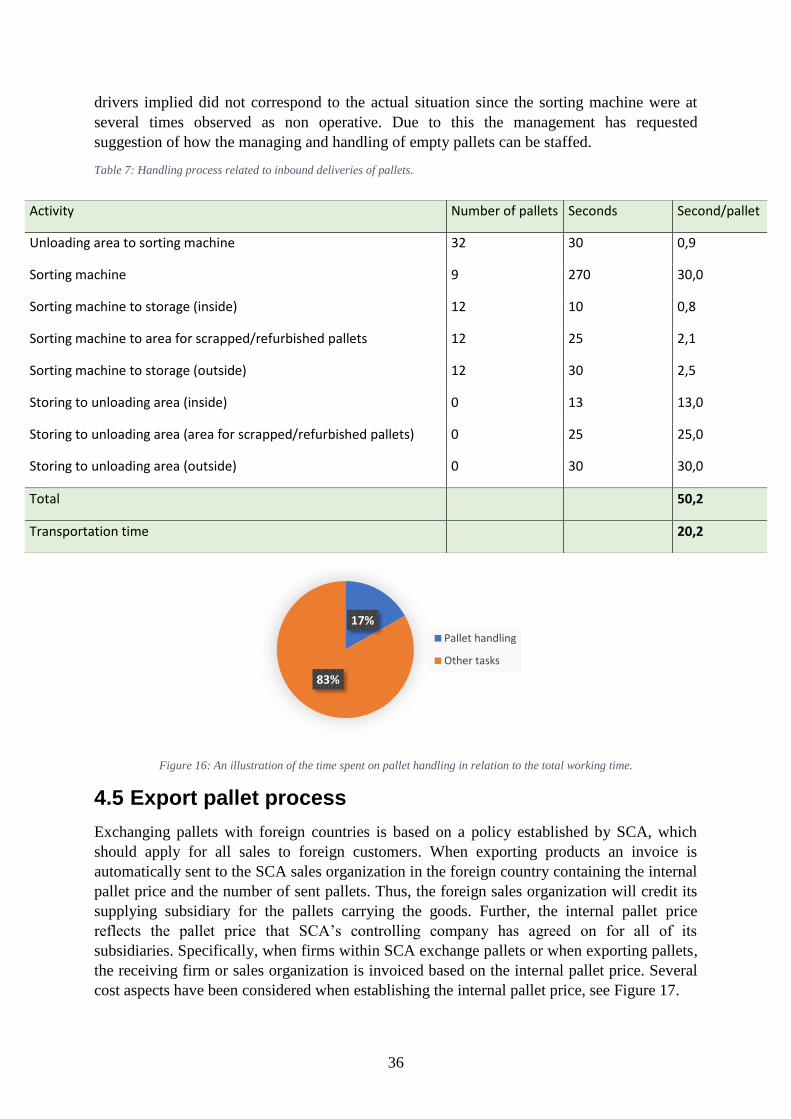
36
drivers implied did not correspond to the actual situation since the sorting machine were at
several times observed as non operative. Due to this the management has requested
suggestion of how the managing and handling of empty pallets can be staffed.
Table 7: Handling process related to inbound deliveries of pallets.
Figure 16: An illustration of the time spent on pallet handling in relation to the total working time.
4.5 Export pallet process
Exchanging pallets with foreign countries is based on a policy established by SCA, which
should apply for all sales to foreign customers. When exporting products an invoice is
automatically sent to the SCA sales organization in the foreign country containing the internal
pallet price and the number of sent pallets. Thus, the foreign sales organization will credit its
supplying subsidiary for the pallets carrying the goods. Further, the internal pallet price
reflects the pallet price that SCA’s controlling company has agreed on for all of its
subsidiaries. Specifically, when firms within SCA exchange pallets or when exporting pallets,
the receiving firm or sales organization is invoiced based on the internal pallet price. Several
cost aspects have been considered when establishing the internal pallet price, see Figure 17.
17%
83%
Pallet handling
Other tasks
Activity Number of pallets Seconds Second/pallet
Unloading area to sorting machine 32 30 0,9
Sorting machine 9 270 30,0
Sorting machine to storage (inside) 12 10 0,8
Sorting machine to area for scrapped/refurbished pallets 12 25 2,1
Sorting machine to storage (outside) 12 30 2,5
Storing to unloading area (inside) 0 13 13,0
Storing to unloading area (area for scrapped/refurbished pallets) 0 25 25,0
Storing to unloading area (outside) 0 30 30,0
Total
50,2
Transportation time
20,2
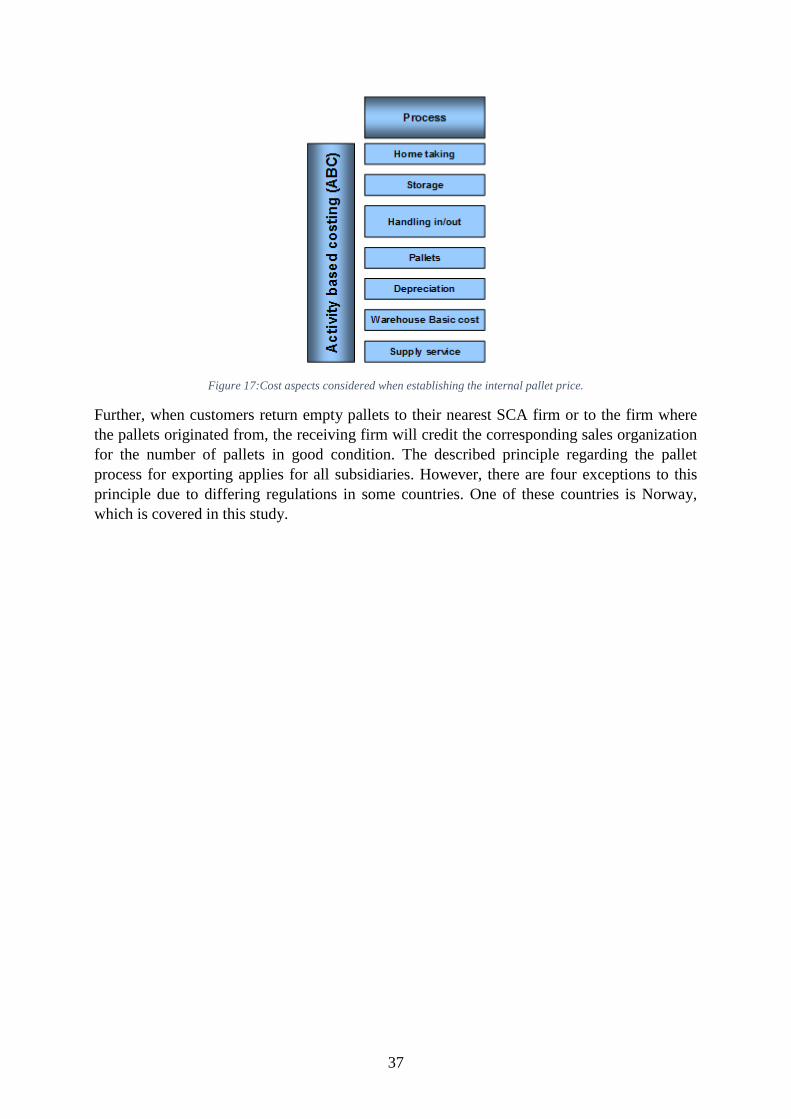
37
Figure 17:Cost aspects considered when establishing the internal pallet price.
Further, when customers return empty pallets to their nearest SCA firm or to the firm where
the pallets originated from, the receiving firm will credit the corresponding sales organization
for the number of pallets in good condition. The described principle regarding the pallet
process for exporting applies for all subsidiaries. However, there are four exceptions to this
principle due to differing regulations in some countries. One of these countries is Norway,
which is covered in this study.
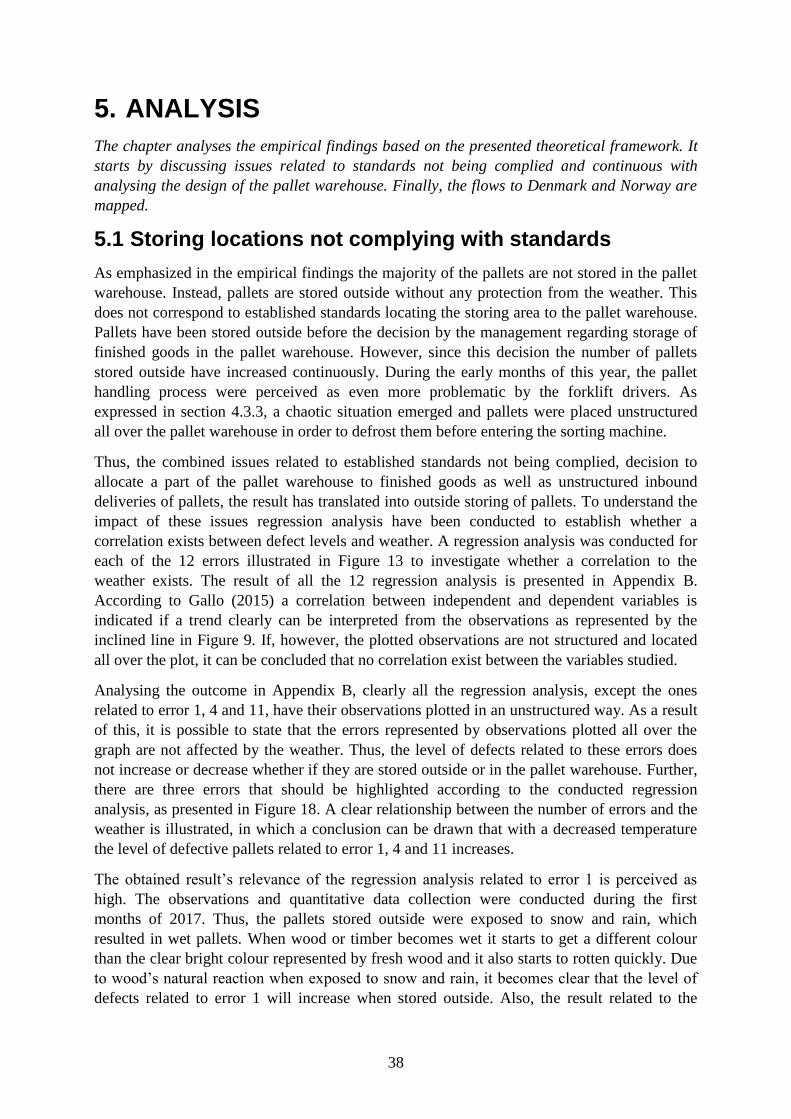
38
5. ANALYSIS
The chapter analyses the empirical findings based on the presented theoretical framework. It
starts by discussing issues related to standards not being complied and continuous with
analysing the design of the pallet warehouse. Finally, the flows to Denmark and Norway are
mapped.
5.1 Storing locations not complying with standards
As emphasized in the empirical findings the majority of the pallets are not stored in the pallet
warehouse. Instead, pallets are stored outside without any protection from the weather. This
does not correspond to established standards locating the storing area to the pallet warehouse.
Pallets have been stored outside before the decision by the management regarding storage of
finished goods in the pallet warehouse. However, since this decision the number of pallets
stored outside have increased continuously. During the early months of this year, the pallet
handling process were perceived as even more problematic by the forklift drivers. As
expressed in section 4.3.3, a chaotic situation emerged and pallets were placed unstructured
all over the pallet warehouse in order to defrost them before entering the sorting machine.
Thus, the combined issues related to established standards not being complied, decision to
allocate a part of the pallet warehouse to finished goods as well as unstructured inbound
deliveries of pallets, the result has translated into outside storing of pallets. To understand the
impact of these issues regression analysis have been conducted to establish whether a
correlation exists between defect levels and weather. A regression analysis was conducted for
each of the 12 errors illustrated in Figure 13 to investigate whether a correlation to the
weather exists. The result of all the 12 regression analysis is presented in Appendix B.
According to Gallo (2015) a correlation between independent and dependent variables is
indicated if a trend clearly can be interpreted from the observations as represented by the
inclined line in Figure 9. If, however, the plotted observations are not structured and located
all over the plot, it can be concluded that no correlation exist between the variables studied.
Analysing the outcome in Appendix B, clearly all the regression analysis, except the ones
related to error 1, 4 and 11, have their observations plotted in an unstructured way. As a result
of this, it is possible to state that the errors represented by observations plotted all over the
graph are not affected by the weather. Thus, the level of defects related to these errors does
not increase or decrease whether if they are stored outside or in the pallet warehouse. Further,
there are three errors that should be highlighted according to the conducted regression
analysis, as presented in Figure 18. A clear relationship between the number of errors and the
weather is illustrated, in which a conclusion can be drawn that with a decreased temperature
the level of defective pallets related to error 1, 4 and 11 increases.
The obtained result’s relevance of the regression analysis related to error 1 is perceived as
high. The observations and quantitative data collection were conducted during the first
months of 2017. Thus, the pallets stored outside were exposed to snow and rain, which
resulted in wet pallets. When wood or timber becomes wet it starts to get a different colour
than the clear bright colour represented by fresh wood and it also starts to rotten quickly. Due
to wood’s natural reaction when exposed to snow and rain, it becomes clear that the level of
defects related to error 1 will increase when stored outside. Also, the result related to the
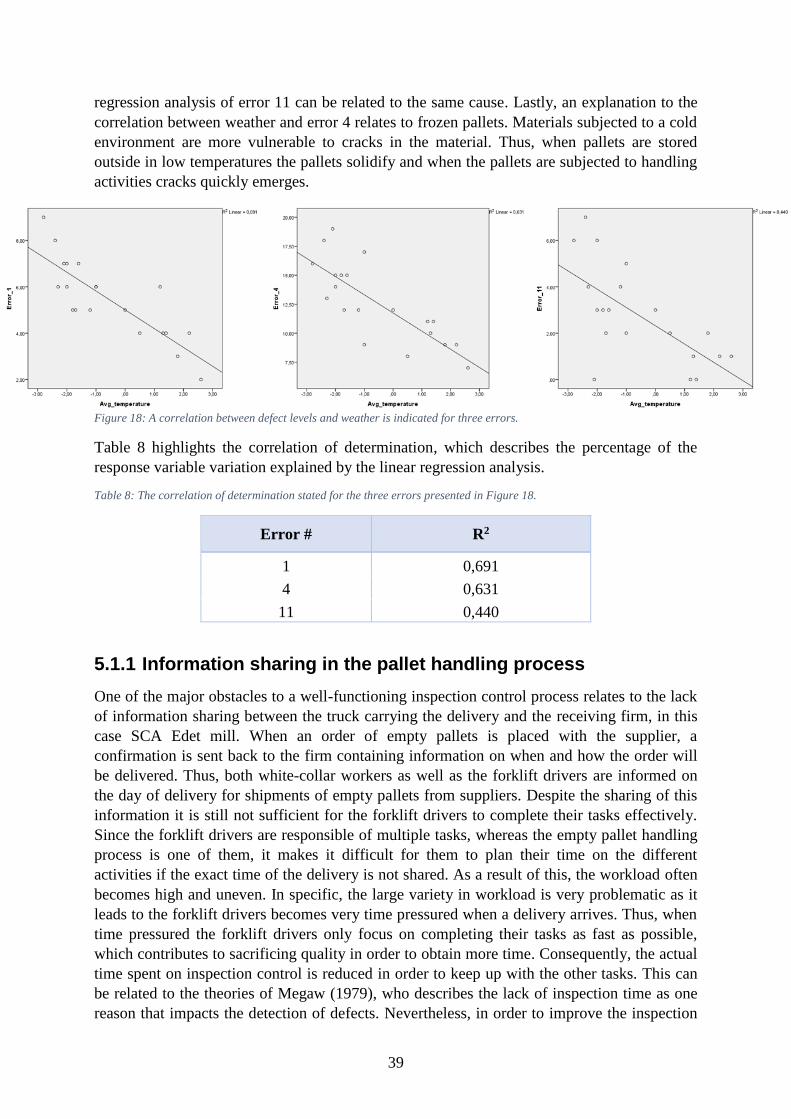
39
regression analysis of error 11 can be related to the same cause. Lastly, an explanation to the
correlation between weather and error 4 relates to frozen pallets. Materials subjected to a cold
environment are more vulnerable to cracks in the material. Thus, when pallets are stored
outside in low temperatures the pallets solidify and when the pallets are subjected to handling
activities cracks quickly emerges.
Figure 18: A correlation between defect levels and weather is indicated for three errors.
Table 8 highlights the correlation of determination, which describes the percentage of the
response variable variation explained by the linear regression analysis.
Table 8: The correlation of determination stated for the three errors presented in Figure 18.
Error # R2
1 0,691
4 0,631
11 0,440
5.1.1 Information sharing in the pallet handling process
One of the major obstacles to a well-functioning inspection control process relates to the lack
of information sharing between the truck carrying the delivery and the receiving firm, in this
case SCA Edet mill. When an order of empty pallets is placed with the supplier, a
confirmation is sent back to the firm containing information on when and how the order will
be delivered. Thus, both white-collar workers as well as the forklift drivers are informed on
the day of delivery for shipments of empty pallets from suppliers. Despite the sharing of this
information it is still not sufficient for the forklift drivers to complete their tasks effectively.
Since the forklift drivers are responsible of multiple tasks, whereas the empty pallet handling
process is one of them, it makes it difficult for them to plan their time on the different
activities if the exact time of the delivery is not shared. As a result of this, the workload often
becomes high and uneven. In specific, the large variety in workload is very problematic as it
leads to the forklift drivers becomes very time pressured when a delivery arrives. Thus, when
time pressured the forklift drivers only focus on completing their tasks as fast as possible,
which contributes to sacrificing quality in order to obtain more time. Consequently, the actual
time spent on inspection control is reduced in order to keep up with the other tasks. This can
be related to the theories of Megaw (1979), who describes the lack of inspection time as one
reason that impacts the detection of defects. Nevertheless, in order to improve the inspection
40
control process, some conditions that aims to increase the ability to plan in advance needs to
be established. It is of essence to agree with the logistics service provider to let the truck
notify in advance the expected time of delivery. If this is achieved, the forklift drivers will be
able to spend more of their time on the handling and inspection of empty pallets, which
ultimately would result in an improved inspection control.
Despite that the information already shared is not sufficient for the forklift drivers, it often is
enough for the white-collar workers responsible for the administrative part of the process.
This can be related to that white-collar workers, after placing the order of empty pallets, have
completed their task of the process and it becomes the forklift drivers’ responsibility now to
receive, inspect and handle the process. Thus, the white-collar workers are not directly
affected if the truck does not notify in advance the expected time of delivery. However, since
these workers have started raising awareness of this issue due to the high level of defects on
pallets reported by customers, managers have realized that the lack of information regarding
the exact time of delivery, might not have a direct impact on them but an indirect impact
instead. As emphasized by Narayanan and Raman (2004), if a firm does not have any insight
in another firm’s activities, who operates in the same supply chain, it becomes problematic to
ensure an alignment of the supply chain. Further, Debo et al. (2001) relates to this by claiming
that it is not only firms to firms, but often firms within themselves. Consequently, in relation
to these theories this has presented incentives for the white-collar workers to actively be
involved in increasing the information sharing between pallet suppliers and receiving firm in
order to improve the alignment within the firm and the forklift drivers.
5.1.2 Providing opportunities for feedback
Another obstacle affecting the outcome of the inspection control process relates to the lack of
documentation on received deliveries of empty pallets as well as on the consignment note.
The number of defected pallets delivered are not constantly documented, in fact, only a
fraction on the number of defected pallets per delivery are documented by the forklift drivers.
As a result of the incomplete documentation any comparison between shipments from
suppliers becomes difficult. If the management wishes to compare the level of defected pallets
from two different shipments from the same supplier it becomes difficult due to the
incomplete documentation. The same goes for shipments from different suppliers. Thus,
without any complete documentation that the management can base their decisions on, the
allocation of resources will not fulfill the demand. This will be the case since the lack of
documentation leads to managers not being able to focus their efforts on actual problems.
Consequently, suppliers repeatedly sending deliveries with a high level of defective pallets
will be addressed in the same way as suppliers who delivers approved shipments. Chabukswar
et al. (2003) emphasizes the essence of feedback as a driving force to an improved visual
inspection process, claiming that gathering and documenting of data works as a facilitator for
reducing the level of defects. As can be retrieved from the theories of Chabukswar et al.
(2003) the essence of feedback in terms of continuous documentation of a certain process
reveals great opportunities to allocate resources effectively and address problematic issues.
Both managers and forklift drivers could benefit from receiving feedback on their efforts. By
continuously documenting each delivery with the number of defects managers will be able to
compare and track the quality of each delivery as well as deliveries between different
suppliers. This will allow the management to address suppliers with repeatedly high level of
defective units and provide opportunities for measures that can be aimed at the suppliers,
41
leading to suppliers being subjected to an evaluation. Further, a continuous feedback will
allow managers to monitor the quality level of the deliveries making the process more
controllable and hence preventing it from getting out of hand. Firstly, by monitoring the
process deliveries within a certain level will be approved. In case deliveries deviates from the
agreed level, they will be detected directly and addressed. Secondly, a continuous data
gathering provides opportunities for improving the process. With a continuous feedback
regarding the quality level managers can use this to jointly work with the suppliers towards a
reduced level of defected units. By sharing such information with suppliers will not only raise
awareness of the process but also emphasize the essence of improvements, ultimately leading
to an increased quality level.
From the perspective of the forklift drivers, continuous feedback will allow the drivers to
evaluate their effort of detecting defective pallets. By monitoring the level of defective units
per shipments and comparing these to the maximum level of defective units as has been
agreed between firm and suppliers, forklift drivers can use this information to improve their
efforts in order to reduce the defect level to the agreed level. Having the data documentation
continuously presented to the forklift drivers, in real time mode, will provide constant
feedback as well as present opportunities to continuously improve the detection of defects.
Further, as claimed by Narayanan and Raman (2004) incentives from the management aimed
to facilitate the improvement work needs to be present. In order to involve the forklift drivers
into actively working towards continuous improvement, only presenting real time feedback is
not sufficient, instead management needs to establish goals and rewards for the forklift
drivers.
5.1.3 Improving the process of detecting defective pallets
Further, Marie et al. (2015) claims that providing controllers with access to illustrations of the
defects can help improve the inspection control process. Due to forklift drivers does not exit
their vehicle to evaluate potential errors of the pallets, any assessment of errors relating to
cracks that are bigger than a certain minimum becomes difficult. This increases the variation
in reproducibility among forklift drivers leading to that the same errors are approved at times
and not approved by others. An easy access to illustrations of the errors would facilitate the
detection of errors and foremost the evaluation of errors, while improving the understanding
of the errors among forklift drivers. Thus, in case of difficulties in deciding whether to
approve a certain pallet or not, the illustration will help make the decision as it includes all the
possible errors resulting in a defective pallet, see Figure 13. Moreover, it will reduce the
hesitation of whether to approve pallets or not as well as reduce the variation between
different forklift drivers. However, a complete elimination of the variation will not be
achieved due to that different drivers still interpret illustrations, words, symbol, etc.
differently. Regardless, an illustration such as the one described is the first step towards
gaining more control over the process as well as increasing the understanding of the forklift
drivers relating to the different errors. An illustration of the errors should be placed in an
easily accessible area near the area of inspection control. Thus, the pallet warehouse is a
recommended place for it, making it easily accessible through placing it on one of the walls. It
should be noted that the forklift drivers’ as well as team leaders and warehouse manager’s
opinions were included in deciding where to place the illustration. The illustration will be
represented in a large plate, making it accessible across the whole pallet warehouse. Thus,
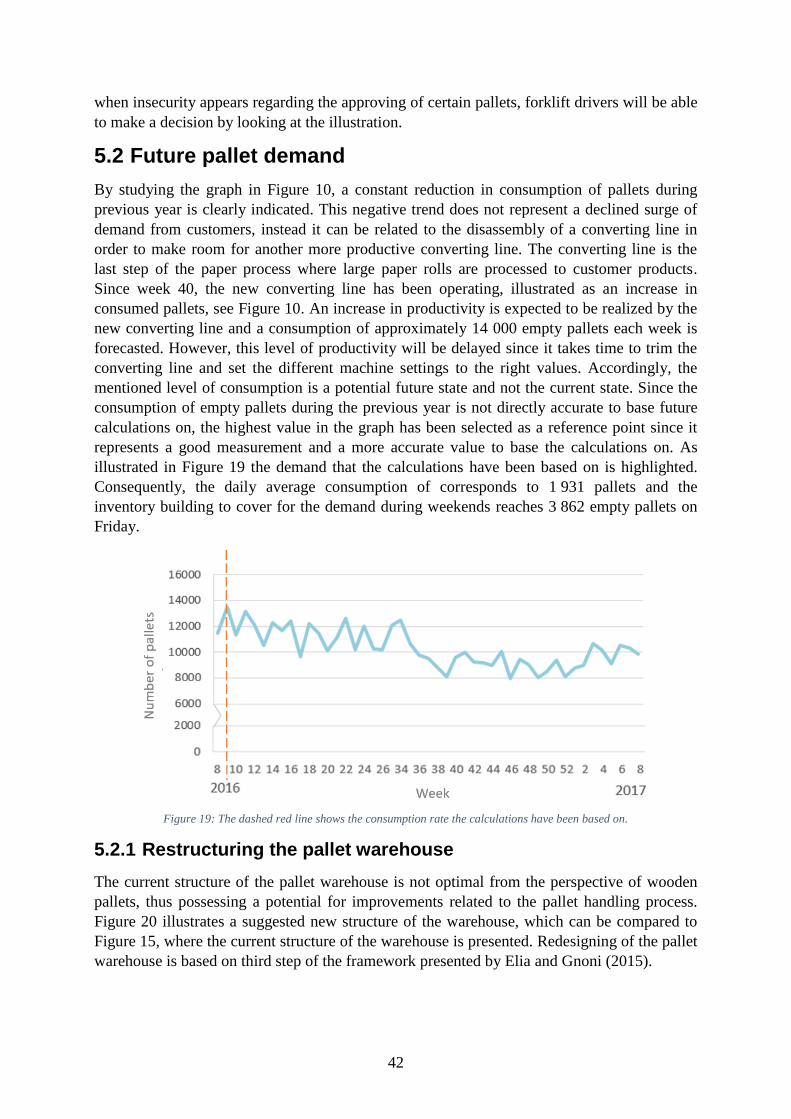
42
when insecurity appears regarding the approving of certain pallets, forklift drivers will be able
to make a decision by looking at the illustration.
5.2 Future pallet demand
By studying the graph in Figure 10, a constant reduction in consumption of pallets during
previous year is clearly indicated. This negative trend does not represent a declined surge of
demand from customers, instead it can be related to the disassembly of a converting line in
order to make room for another more productive converting line. The converting line is the
last step of the paper process where large paper rolls are processed to customer products.
Since week 40, the new converting line has been operating, illustrated as an increase in
consumed pallets, see Figure 10. An increase in productivity is expected to be realized by the
new converting line and a consumption of approximately 14 000 empty pallets each week is
forecasted. However, this level of productivity will be delayed since it takes time to trim the
converting line and set the different machine settings to the right values. Accordingly, the
mentioned level of consumption is a potential future state and not the current state. Since the
consumption of empty pallets during the previous year is not directly accurate to base future
calculations on, the highest value in the graph has been selected as a reference point since it
represents a good measurement and a more accurate value to base the calculations on. As
illustrated in Figure 19 the demand that the calculations have been based on is highlighted.
Consequently, the daily average consumption of corresponds to 1 931 pallets and the
inventory building to cover for the demand during weekends reaches 3 862 empty pallets on
Friday.
Figure 19: The dashed red line shows the consumption rate the calculations have been based on.
5.2.1 Restructuring the pallet warehouse
The current structure of the pallet warehouse is not optimal from the perspective of wooden
pallets, thus possessing a potential for improvements related to the pallet handling process.
Figure 20 illustrates a suggested new structure of the warehouse, which can be compared to
Figure 15, where the current structure of the warehouse is presented. Redesigning of the pallet
warehouse is based on third step of the framework presented by Elia and Gnoni (2015).
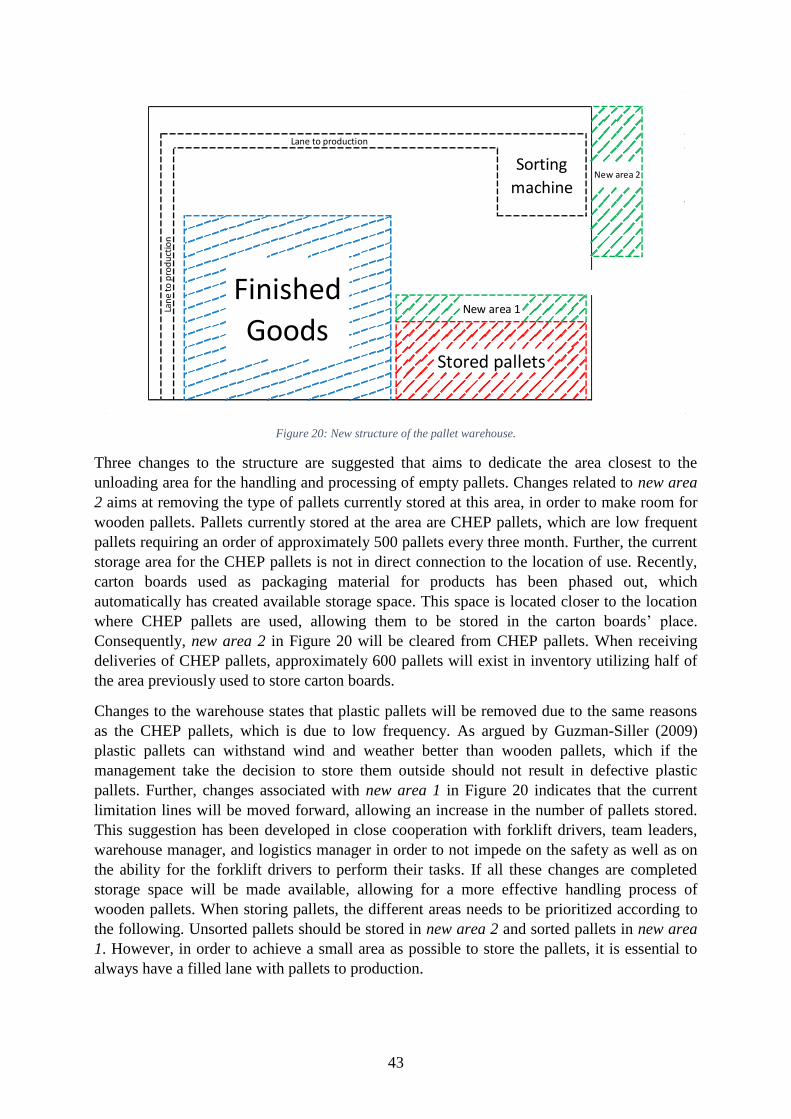
43
Figure 20: New structure of the pallet warehouse.
Three changes to the structure are suggested that aims to dedicate the area closest to the
unloading area for the handling and processing of empty pallets. Changes related to new area
2 aims at removing the type of pallets currently stored at this area, in order to make room for
wooden pallets. Pallets currently stored at the area are CHEP pallets, which are low frequent
pallets requiring an order of approximately 500 pallets every three month. Further, the current
storage area for the CHEP pallets is not in direct connection to the location of use. Recently,
carton boards used as packaging material for products has been phased out, which
automatically has created available storage space. This space is located closer to the location
where CHEP pallets are used, allowing them to be stored in the carton boards’ place.
Consequently, new area 2 in Figure 20 will be cleared from CHEP pallets. When receiving
deliveries of CHEP pallets, approximately 600 pallets will exist in inventory utilizing half of
the area previously used to store carton boards.
Changes to the warehouse states that plastic pallets will be removed due to the same reasons
as the CHEP pallets, which is due to low frequency. As argued by Guzman-Siller (2009)
plastic pallets can withstand wind and weather better than wooden pallets, which if the
management take the decision to store them outside should not result in defective plastic
pallets. Further, changes associated with new area 1 in Figure 20 indicates that the current
limitation lines will be moved forward, allowing an increase in the number of pallets stored.
This suggestion has been developed in close cooperation with forklift drivers, team leaders,
warehouse manager, and logistics manager in order to not impede on the safety as well as on
the ability for the forklift drivers to perform their tasks. If all these changes are completed
storage space will be made available, allowing for a more effective handling process of
wooden pallets. When storing pallets, the different areas needs to be prioritized according to
the following. Unsorted pallets should be stored in new area 2 and sorted pallets in new area
1. However, in order to achieve a small area as possible to store the pallets, it is essential to
always have a filled lane with pallets to production.
New area 2Sorting
machine
Lane to production
Lan
e to
pro
du
ctio
n
Finished
GoodsStored pallets
New area 1
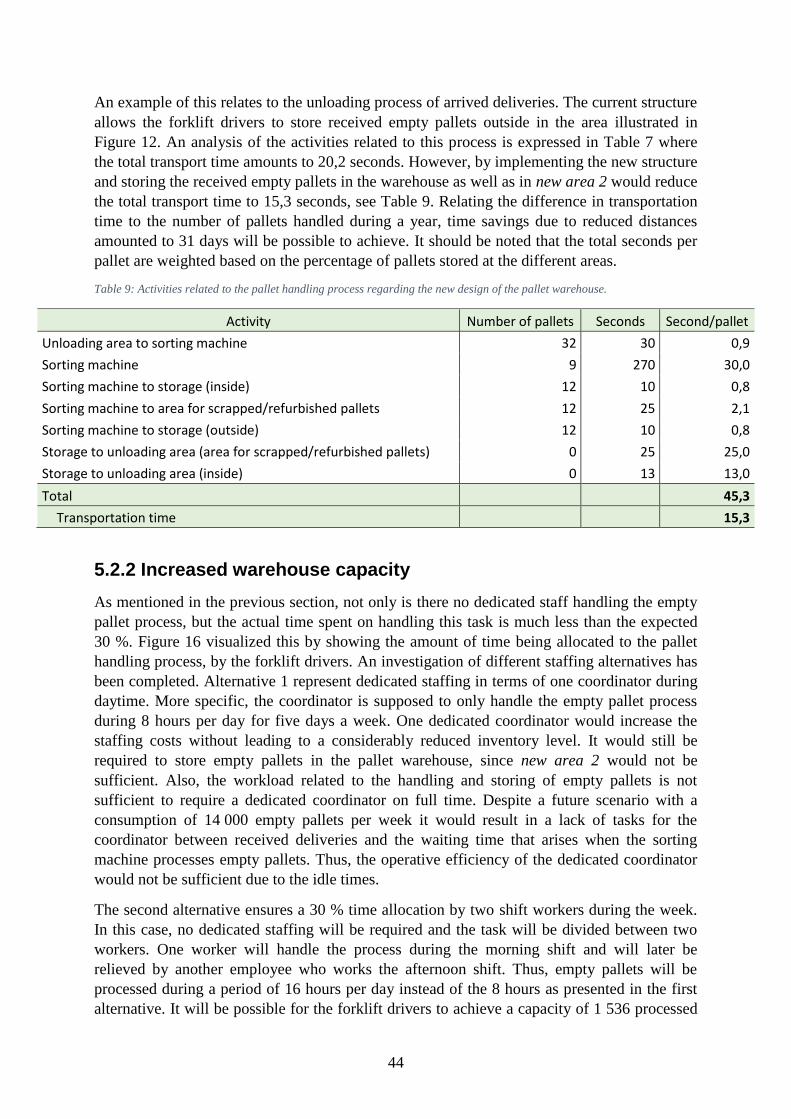
44
An example of this relates to the unloading process of arrived deliveries. The current structure
allows the forklift drivers to store received empty pallets outside in the area illustrated in
Figure 12. An analysis of the activities related to this process is expressed in Table 7 where
the total transport time amounts to 20,2 seconds. However, by implementing the new structure
and storing the received empty pallets in the warehouse as well as in new area 2 would reduce
the total transport time to 15,3 seconds, see Table 9. Relating the difference in transportation
time to the number of pallets handled during a year, time savings due to reduced distances
amounted to 31 days will be possible to achieve. It should be noted that the total seconds per
pallet are weighted based on the percentage of pallets stored at the different areas.
Table 9: Activities related to the pallet handling process regarding the new design of the pallet warehouse.
Activity Number of pallets Seconds Second/pallet
Unloading area to sorting machine 32 30 0,9
Sorting machine 9 270 30,0
Sorting machine to storage (inside) 12 10 0,8
Sorting machine to area for scrapped/refurbished pallets 12 25 2,1
Sorting machine to storage (outside) 12 10 0,8
Storage to unloading area (area for scrapped/refurbished pallets) 0 25 25,0
Storage to unloading area (inside) 0 13 13,0
Total
45,3
Transportation time
15,3
5.2.2 Increased warehouse capacity
As mentioned in the previous section, not only is there no dedicated staff handling the empty
pallet process, but the actual time spent on handling this task is much less than the expected
30 %. Figure 16 visualized this by showing the amount of time being allocated to the pallet
handling process, by the forklift drivers. An investigation of different staffing alternatives has
been completed. Alternative 1 represent dedicated staffing in terms of one coordinator during
daytime. More specific, the coordinator is supposed to only handle the empty pallet process
during 8 hours per day for five days a week. One dedicated coordinator would increase the
staffing costs without leading to a considerably reduced inventory level. It would still be
required to store empty pallets in the pallet warehouse, since new area 2 would not be
sufficient. Also, the workload related to the handling and storing of empty pallets is not
sufficient to require a dedicated coordinator on full time. Despite a future scenario with a
consumption of 14 000 empty pallets per week it would result in a lack of tasks for the
coordinator between received deliveries and the waiting time that arises when the sorting
machine processes empty pallets. Thus, the operative efficiency of the dedicated coordinator
would not be sufficient due to the idle times.
The second alternative ensures a 30 % time allocation by two shift workers during the week.
In this case, no dedicated staffing will be required and the task will be divided between two
workers. One worker will handle the process during the morning shift and will later be
relieved by another employee who works the afternoon shift. Thus, empty pallets will be
processed during a period of 16 hours per day instead of the 8 hours as presented in the first
alternative. It will be possible for the forklift drivers to achieve a capacity of 1 536 processed
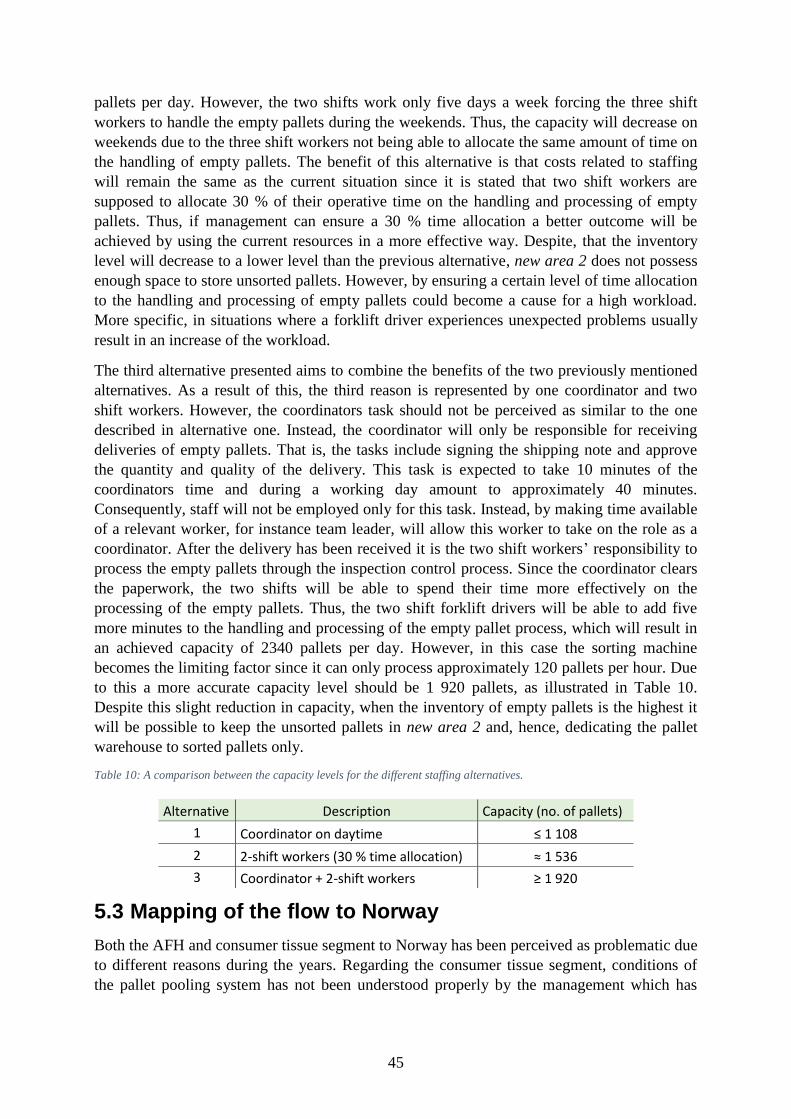
45
pallets per day. However, the two shifts work only five days a week forcing the three shift
workers to handle the empty pallets during the weekends. Thus, the capacity will decrease on
weekends due to the three shift workers not being able to allocate the same amount of time on
the handling of empty pallets. The benefit of this alternative is that costs related to staffing
will remain the same as the current situation since it is stated that two shift workers are
supposed to allocate 30 % of their operative time on the handling and processing of empty
pallets. Thus, if management can ensure a 30 % time allocation a better outcome will be
achieved by using the current resources in a more effective way. Despite, that the inventory
level will decrease to a lower level than the previous alternative, new area 2 does not possess
enough space to store unsorted pallets. However, by ensuring a certain level of time allocation
to the handling and processing of empty pallets could become a cause for a high workload.
More specific, in situations where a forklift driver experiences unexpected problems usually
result in an increase of the workload.
The third alternative presented aims to combine the benefits of the two previously mentioned
alternatives. As a result of this, the third reason is represented by one coordinator and two
shift workers. However, the coordinators task should not be perceived as similar to the one
described in alternative one. Instead, the coordinator will only be responsible for receiving
deliveries of empty pallets. That is, the tasks include signing the shipping note and approve
the quantity and quality of the delivery. This task is expected to take 10 minutes of the
coordinators time and during a working day amount to approximately 40 minutes.
Consequently, staff will not be employed only for this task. Instead, by making time available
of a relevant worker, for instance team leader, will allow this worker to take on the role as a
coordinator. After the delivery has been received it is the two shift workers’ responsibility to
process the empty pallets through the inspection control process. Since the coordinator clears
the paperwork, the two shifts will be able to spend their time more effectively on the
processing of the empty pallets. Thus, the two shift forklift drivers will be able to add five
more minutes to the handling and processing of the empty pallet process, which will result in
an achieved capacity of 2340 pallets per day. However, in this case the sorting machine
becomes the limiting factor since it can only process approximately 120 pallets per hour. Due
to this a more accurate capacity level should be 1 920 pallets, as illustrated in Table 10.
Despite this slight reduction in capacity, when the inventory of empty pallets is the highest it
will be possible to keep the unsorted pallets in new area 2 and, hence, dedicating the pallet
warehouse to sorted pallets only.
Table 10: A comparison between the capacity levels for the different staffing alternatives.
5.3 Mapping of the flow to Norway
Both the AFH and consumer tissue segment to Norway has been perceived as problematic due
to different reasons during the years. Regarding the consumer tissue segment, conditions of
the pallet pooling system has not been understood properly by the management which has
Alternative Description Capacity (no. of pallets)
1 Coordinator on daytime ≤ 1 108
2 2-shift workers (30 % time allocation) ≈ 1 536
3 Coordinator + 2-shift workers ≥ 1 920
46
resulted in increased costs. On the other hand, issues related to the AFH segment concerns the
lack of information between customers who return empty pallets and the mill.
When mapping the consumer tissue segment, it can be stated that a hauler and a LSP are
involved in this flow. No pallets are ever under the ownership of the LSP, instead it only
manages wooden pallets on the behalf of its customers. Regarding the cost structure of this
flow the internal pallet price of 66,40 SEK is not used, instead the foreign sales organization
receives an invoice of 27,91 SEK per pallet. This corresponds to the administrative fee of
using the LSP as well as the internal handling cost related to the mill in Lilla Edet. A further
specification is that the administrative fee is related to the sender fee required by the LSP.
Further, the foreign sales organization is subject to a recipient fee that amounts to
approximately 8,90 SEK, according to the terms of the LSP. Both the sender and recipient fee
relates to the outgoing and incoming stream of goods, in which the fee is paid for each pallet.
The LSP collects pallets from customers after they have made them available for collection
through the IT system. Further, by ordering empty pallets from the LSP in standard quantity
and terms does not translate in a fee. However, since the LSP is located in Norway, a
transportation cost needs to be paid by the SCA Edet mill, which in turn is reinvoiced to the
foreign sales organization. Upon delivery of empty pallets by the LSP, SCA Edet mill credits
the foreign sales organization with the total sum of 66,40 SEK per pallet. Under normal
circumstances the total sum that is credited to the sales organization amount to the same sum
that is being covered by the sales organization during the process. Figure 1 aims to describe
the relationship between the mill, LSP and sales organization.
Since the agreement with the LSP is represented by a pallet pooling system, balance
settlements are used to keep track of whether the customer, in this case SCA Edet mill, have
ordered more or less pallets compared to the number of dispatched pallets. Customers who,
during the period between two balance settlements, have provided a net addition of wooden
pallets to the NLP system by registering more wooden pallets out of its account than into its
account, will have a negative balance. Customers who, during the period between two balance
settlements, have received a net addition of wooden pallets from the NLP system by
registering more wooden pallets into its account than out of its account, will have a positive
balance.
Balance settlements are made at the end of every two calendar months, i.e. the last business
day of February, April, June, August, October and December. When balance settlements are
carried, settlements of accounts are calculated. For a negative balance, this means that the
Customer will sell to NLP the number of wooden pallets corresponding to the size of the
balance. For a positive balance, this means that the Customer will pay NLP for the number of
wooden pallets corresponding to the size of the balance. In connection with the above
settlement, a credit note or invoice will be issued to the Customer.
The wooden pallet surplus fee is calculated monthly. In case of a negative balance, for
Wholesalers this means that the Wholesaler has supplied the NLP system with a greater
quantity of wooden pallets than the Wholesaler has received with the flow of goods from
Suppliers that are Customers, or from NLP. For this wooden pallet surplus, no Sender or
Recipient fee has been paid. There are costs for NLP related to these wooden pallets, and to
compensate therefore, Wholesalers with a negative balance have to pay a fee for each surplus
pallet, corresponding to the total of Sender and Recipient fees (referred to as Surplus fee). The
47
surplus fee is invoiced monthly. If a Wholesaler has accrued a positive balance, this may be
set off against a later negative balance before the calculation of the surplus fee.
The flow regarding the consumer tissue segment can be related to the theories of Lützenbauer
(1993). The current system fulfills the conditions associated with a system which includes
return logistics. The sender is not responsible for handling the return flow of empty pallets.
Instead the central agency, which is the LSP in this case, carries the responsibility to transfer
pallets between the senders and receivers. Specifically, the system in place reflects a depot
system with a book system, despite monetary flow in the system. As understood from
Lutzenbauer (1993) the deposit system includes monetary flow based on the value of the
pallets. This is not the case for the system related to the consumer tissue segment to Norway.
Indeed, there are monetary flows between the actors in the network. However, these are
related to the fees required by the LSP and based on the administrative, handling and
transporting costs and not on the value of the empty pallets. Due to this, the system is
perceived as a depot system with booking.
Further, according to Gnoni and Elia (2015), the pallet management system can be described
as a closed loop network. Due to the agreement with the LSP establishing that SCA Edet mill
needs to dispatch empty pallets in order to keep the balance in check, a return flow arises
resulting in the design of a closed loop network. Further, the return flow of empty pallets is
not offered urgently, instead the downstream firm decides when to make empty pallets
available for collection by reporting them in the IT system of the LSP. Thus, the structure of
the return flow is based on a postponed interchange since the downstream firm does not issue
a pallet voucher immediately. According to ECR (2006), the LSP states time limitations for
when the downstream firm needs to make empty pallets available for collection as well as
penalty costs related to the inability to supply the LSP with a correct number of empty pallets.
The AFH business segment, on the other hand, is not represented by a pure pooling system.
Instead the pallets are sold to customers and after unloaded from goods the receiver decides
whether to return the empty pallets back to the mill. The Norwegian customers place their
order with their corresponding sales organization, who in turn communicates them to the mill
in Lilla Edet. Products are then transported to customers who are invoiced for the goods and
pallets. Due to the policy SCA has regarding empty pallets customers have the right to
transport pallets back to customers, in which the receiving firm compensates the customers
for the price of the pallets. The complexity in this flow is rather low in comparison to the
pallet pooling system as the one established with the consumer tissue segment, as emphasized
by (Elia and Gnoni, 2015).
As stated the system related to the AFH segment to the Norwegian market is not associated
with an established return flow of empty pallets. The receivers decide whether to keep their
pallets or to use the option to return the empty pallets to the sender. Since the return flow is
not mandatory for the customers and instead an opportunity offered by SCA the system
cannot be reflected by a pallet pooling system. Instead this pallet management strategy can be
related to the open loop system as described by Elia and Gnoni (2015). When goods are
shipped to customers the sender invoices the receiver for the full value of the pallets. Further,
in case empty pallets are returned to the sender the receiver is credited for the full value of the
empty pallets returned. Thus, the pallets are sold to the receivers and repurchased by the

48
sender based on the receivers’ decision to return pallets. Following this statement, the system
should be perceived as a sales system and not a pallet pooling system.
5.4 Mapping of the flow to Denmark
According to the management as well as white-collar workers the flow related to the Danish
market is less complicated compared to the flow to Norway. Both the consumer tissue
segment as well as the AFH segment to Denmark are handled by the same LSP, which is
responsible for maintaining a balance between pallets ordered from the LSP and pallets
shipped to the Danish market. Thus, a contact person at the LSP continuously communicates
the balance and suggests the number of pallets to be ordered by SCA Edet mill in order to
keep the balance under control. Further, this pallet management system is not a pure pallet
pooling system since monetary flows are involved. The sender invoices the outgoing pallets to
the sales organization in Denmark and credits the incoming empty pallets. Following, a
transaction is made between the sales organization and the LSP. Since this market is not
subject to the exceptions of the export process as emphasized in section 4.5, the internal pallet
price is used. Thus, transactions between the different actors in the network are based on the
value of the empty pallets. Ownership of the pallets are transferred between the SCA Edet
mill and the sales organization in response to the transactions. Consequently, the LSP only
manages the transportation, storing, and collection of empty pallets in this system.
Since this pallet management strategy is rather similar to the consumer tissue segment to
Norway, in terms of the type of structure it can be reflected in a system which includes
reverse logistics as described by Lutzenbauer (1993). In this case, the LSP provides storage of
empty pallets at predetermined locations and from these locations empty pallets are delivered
to the sender based on orders. Further, after the collection of empty pallets from the receiver
they are transported back to the location by the LSP and stored until needed by the sender.
This corresponds to Lützenbauer’s (1993) studies of depot systems, where empty pallets are
stored in depots awaiting orders from the sender. Due to the monetary transfers between the
actors on the value of the empty pallets makes this system corresponding to the deposit
system. However, an exception to Lutzenbauer’s (1993) description of the deposit system is
that these flows does not represent monetary flows to the LSP since they do not take over the
ownership of the empty pallets. Clearly, there exist transactions between the LSP and the
sales organizations but these are not based on the value of the empty pallets and should be
perceived as fees or costs for performed activities.
Relating both these flows to the theories of Elia and Gnoni (2015) a clear reference to the
closed loop network can be drawn. Here, a closed loop is relevant due to the existing of a
return flow of empty pallets to the sender. When the senders’ ships pallets carrying goods to
receivers they are not obliged by the LSP to dispatch empty pallets in connection with the
outgoing flow of pallets. Instead, the LSP allows for a postponed interchange leading to that
the sender decides when to dispatch deliveries. Also, as described by ECR (2006) time
limitations regarding when the sender needs to dispatch empty pallets from the LSP is present
in the agreement related to the flows to Denmark.
49
6. CONCLUSIONS
RQ1. Is the current inspection control process regarding received deliveries of empty pallets
complying with established standards and routines?
There are major weaknesses in the adherence of standards and routines associated with the
inspection control process. Pallets are not stored according to established areas and instead
stored outside, where they are exposed to the weather. Information is not shared between
suppliers delivering pallets and the SCA Edet mill, which leads to resources not being used
effectively. Further, the documentation of the deliveries is insufficient and the number of
defective pallets from suppliers are not noted. In order to improve, management needs to
realize the impact of not complying with established standards and, hence, storing empty
pallets outside during the winter months. Conducted regression analysis indicates that some
errors related to pallets are directly correlated to the temperature.
RQ2. When based on actual demand, how should the inbound delivery of empty pallets be
structured and managed?
The pallet warehouse is not optimal from wooden pallets point of view, which leads to longer
transportation distances and, hence, a less efficient pallet handling process. A redesign of the
pallet warehouse has been completed, in which the areas closest to the unloading area have
been dedicated to the wooden pallet handling process. New areas in the pallet warehouse have
been created by the redesign allowing the pallets to be stored using 70 square meters less in
the pallet warehouse. Further, the issue related to insufficient staffing capacity has been
addressed and different staffing suggestions have been elaborated.
RQ3. How is the current pallet logistics designed regarding the tissue business segment to the
Norwegian and Danish markets?
Regarding the consumer tissue segment to Norway, the current system fulfills the conditions
associated with a system which includes return logistics. Specifically, the system in place
reflects a depot system with a book system. Due to the agreement with the LSP establishing
that SCA Edet mill needs to dispatch empty pallets in order to keep the balance in check, a
return flow arises resulting in the design of a closed loop network. Further, the return flow of
empty pallets is not offered urgently. Thus, the structure of the return flow is based on a
postponed interchange since the downstream firm does not issue a pallet voucher
immediately. Further, the AFH segment to the Norwegian market is not associated with an
established return flow of empty pallets. The receivers decide whether to keep their pallets or
to use the option to return the empty pallets to the sender. Since the return flow is not
mandatory for the customers and instead an opportunity offered by SCA the system cannot be
reflected by a pallet pooling system and should be perceived as a sales system.
Both the consumer tissue segment and AfH segment can be reflected in a system which
includes reverse logistics. These flows correspond to a system characterized by a depot
system, which is based on a deposit system. A clear reference to the closed loop network can
be drawn and a postponed interchange is allowed in these flows leading to that the sender
decides when to dispatch deliveries from the LSP.
50
6.1 Future work
In practice, this thesis contributes to the area of logistics system design related to pallets.
SCA’s reverse flow of pallets has been improved and issues regarding the implementation of
open or closed loop logistics network has been addressed. Additionally, this thesis has
contributed to the theory by providing data regarding the effect of storing wooden pallets
outside without protection from the weather.
Suggested future work could be aimed at two different subjects. Firstly, further research
would be relevant in the area of information sharing within SCA as well as with pallet
suppliers. Currently, pallets are ordered for the next coming week before the production
schedule for that week is set. As a result, fluctuations between ordered and consumed pallets
will differ. It would be of interest to investigate this issue and together with pallet suppliers
agree to either shift the deadline regarding ordering of pallets or to outsource this ordering
process to the production department.
Secondly, from a theoretical perspective, potential future work could be aimed at
investigating the correlation between storing pallets outside and the time they have been
stored outside. According to this thesis, the outcome from performed regression analysis
states that correlations exist between certain errors and the temperature. However, the time
pallets have been stored outside is perceived as an essential factor in the outcome of approved
or defective pallets. Thus, investigating the relation between these variables could enhance the
current theory related to this topic.

51
REFERENCES
Barky, S. S. E. (2016). Impact of reverse logistics application in terms of return policy and
remanufactured product quality on customer satisfaction. International Journal of Supply
Chain and Operations Resilience, 2(2), 95.
Bell, J. (2010). Doing your research project: A guide for first-time researchers in education,
health and social science (5.th ed.). Maidenhead: Open University Press.
Bergman, B., & Klefsjö, B. (2010). Quality from customer needs to customer satisfaction, 5th
edition. Studentlitteratur, Lund.
Björklund, M. and Paulsson, U. (2012). Seminarieboken: att skriva, presentera och opponera.
Studentlitteratur AB.
Blumberg, D. F. (2005). Introduction to Management of Reverse Logistics and Closed Loop
Supply Chain Processes, CRC Press, Florida USA.
Bohlin, E. (2015). Metod i kandidatarbetet [Powerpoint slides]. Retrieved from Chalmers
University of Technology.
Bush, R.J., Bejune, J.J., Hansen, B.G. & Araman, P.A. (2002). Trends in the use of materials
for pallets and other factors affecting the demand for hardwood products. In: Proceedings of
the 30th Hardwood Symposium, Fall Creek Falls, Tennessee, May 30–June 1, pp 76–81.
Cohen, S. and Roussel, J. (2013). Strategic supply chain management (Second ed.). New
York: McGraw-Hill.
Chopra, S., & Meindl, P. (2016). Supply chain management: Strategy, planning, and
operation (6., Global ed.). Harlow, Essex: Pearson Education.
Guzman-Siller, C. F. (2009). Perception of value of grocery pallet systems: The retailer's
point of view. ProQuest Dissertations Publishing.
Debo, L.G., Savaskan, R.C., & Van Wassenhove, L.N. (2001). Coordination in Closed-Loop
Supply Chains.
de Brito, M.P., & Dekker, R. (2002). A Framework for Reverse Logistics. Econometric
Institute Report EI2002-38, Erasmus University Rotterdam, The Netherlands.
Dekker, R., Fleischmann, M., Inderfurth, K., & Van Wassenhove, L. N. (2004). Reverse
logistics: Quantitative models for closed-loop supply chains (1st ed.). Berlin, Heidelberg:
Springer Berlin Heidelberg.
Eklund, G. (2013). Forskningsmetodik II - Kvalitativa metoder. Pedagogiska fakulteten, Åbo
Akademi, Vasa.
Elia, V., & Gnoni, M. G. (2015). Designing an effective closed loop system for pallet
management. International Journal of Production Economics, 170, 730-740.
Enright, M. J. (2000). The globalization of competition and the localization of competitive
advantage: policies towards regional clustering. In The globalization of multinational
enterprise activity and economic development (pp. 303-331). Palgrave Macmillan UK.
52
European Pallet Association (EPAL), 2017. EPAL Euro Pallet. Retrieved February 10, 2017,
from
https://www.epal-
pallets.org/fileadmin/user_upload/ntg_package/images/mediathek/DU_GB_EPAL_1_Produkt
datenblatt_low.pdf.
Fleischmann, M. (2001). Quantitative Models for Reverse Logistics. Springer-Verlag, Berlin.
Fleischmann, M., Bloemhof-Ruwaard, J.M., Beullens, P., & Dekker, R. (2003). Reverse
Logistics Network Design.
Gnoni, M.G., Rollo, A. (2010). A scenario analysis for evaluating RFID investments in pallet
management. International Journal of RF Technologies: Research and Application, 2(1), 1-
21.
Guide, Jr., V.D.R., & Van Wassenhove, L.N. (2001). Managing product returns for
remanufacturing. Production and Operations Management, 10(2):142-155.
Harps, L.H. (2003). Revving Up Returns. Retrieved February 12, 2017, from
http://www.inboundlogistics.com/cms/article/revving-up-returns/.
Hood, N. and Young, S. (2000). The Globalization of Multinational Enterprise Activity and
Economic Development. Palgrave Macmillan, Macmillan Publishers Limited.
Hunter, Colin, 2004. Hermeneutics and phenomenology in research. John Mark Ministries.
Jack, E. P., Powers, T. L., & Skinner, L. (2010). Reverse logistics capabilities: Antecedents
and cost savings. International Journal of Physical Distribution & Logistics Management,
40(3), 228-246.
Kim, T., & Glock, C. H. (2014). On the use of RFID in the management of reusable
containers in closed-loop supply chains under stochastic container return quantities.
Transportation Research Part E: Logistics and Transportation Review, 64, 12-27.
Kim, H., Kim, S., & Park, J. C. (2009). Application of recycled paper sludge and biomass
materials in manufacture of green composite pallet. Resources, Conservation & Recycling,
53(12), 674-679.
Kleindorfer, P. R., Singhal, K., & Wassenhove, L. N. (2005). Sustainable operations
management. Production and Operations Management, 14(4), 482-492.
Kocjan, W., Holmström, K., Mälardalens högskola, & Akademin för innovation, design och
teknik. (2010). Computing stable loads for pallets. European Journal of Operational
Research, 207(2), 980-985.
Kroon, L., & Vrijens, G. (1995). Returnable containers: An example of reverse logistics.
International Journal of Physical Distribution & Logistics Management, 25(2), 56-68.
Kvale, S. (1996). InterViews: An Introduction to Qualitative Research Interviewing. Sage
Publications Inc.
Lambert, S., Riopel, D., & Abdul-Kader, W. (2011). A reverse logistics decisions conceptual
framework. Computers & Industrial Engineering, 61(3), 561-581.
53
Lau, H. C. W., Chan, T. M., Tsui, W. T., Ho, G. T. S., & Choy, K. L. (2009). An AI approach
for optimizing multi-pallet loading operations. Expert Systems with Applications, 36(3), 4296-
4312.
Lebreton, B. (2007). Strategic closed-loop supply chain management (1st ed.). New York;
Berlin; Springer.
Lützebauer, M. (1993). Systems for Returnable Transport Packaging. Deutscher Fachverlag
Gmbh.
Matopoulos, A., Barros, A. C., & van der Vorst, J.G.A.J. (Jack). (2015). Resource-efficient
supply chains: A research framework, literature review and research agenda. Supply Chain
Management: An International Journal, 20(2), 218-236.
McCrea, B. (2016). Pallet Usage Report: Pallets Remain Critical in the Modern-Day
Warehouse. Retrieved May 10, 2017 from
http://www.supplychain247.com/article/pallets_remain_critical_in_the_modern_day_warehou
se/pallets
Megaw, E.D. (1979). Factors affecting visual inspection accuracy. Applied Ergonomics,
10(1), pp. 27-32.
Mukhopadhyay, S. K., & Setaputra, R. (2011). Return policy in product reuse under
uncertainty. International Journal of Production Research, 49(17), 5317-5332.
Nuss, C., Sahamie, R., & Stindt, D. (2015). The reverse supply chain planning matrix: A
classification scheme for planning problems in reverse logistics: The reverse supply chain
planning matrix. International Journal of Management Reviews, 17(4), 413-436.
Patel, R., Davidson, B. (2003). Forskningsmetodikens grunder: Att planera, genomföra och
rapportera en undersökning. (3., [uppdaterade] uppl. ed.). Lund: Studentlitteratur.
Patricio, M. A., & Maravall, D. (2007). A novel generalization of the gray-scale histogram
and its application to the automated visual measurement and inspection of wooden pallets.
Image and Vision Computing, 25(6), 805-816.
Patton, M.Q. (2005). Qualitative Research. Copyright © 2005 John Wiley & Sons, Ltd.
Pierce, F. (2011). Pallet pooling makes warehousing sense. Retrieved May 10, 2017 from
http://www.supplychaindigital.com/warehousing/pallet-pooling-makes-warehousing-sense
Roy, D., Carrano, A.L., Pazour, J.A., & Gupta, A. (2016). Cost-effective pallet management
strategies. Transportation Research Part E: Logistics and Transportation Review, 93, 358-
371.
SCA. (2017). Annual report. Retrieved January 30, 2017 from
http://www.sca.com/Documents/en/Annual_Reports/SCA_Hygiene_AR16_ENG.pdf?epslang
uage=en
Setaputra, R. (2005). Role of return policy in reverse logistics: Issues and Optimum policies.
Retrieved from ProQuest Digital Dissertations. (3185618).
54
Silva, D. A. L., Santos Renó, G. W., Sevegnani, G., Sevegnani, T. B., & Serra Truzzi, O. M.
(2013). Comparison of disposable and returnable packaging: A case study of reverse logistics
in Brazil. Journal of Cleaner Production, 47, 377-387.
Simchi-Levi, D., Simchi-Levi, E., & Kaminsky, P. (2007). Designing and managing the
supply chain: Concepts, strategies, and case studies (3.th ed.). Boston, Mass: McGraw-Hill.
Soury, E., Behravesh, A. H., Rouhani Esfahani, E., & Zolfaghari, A. (2009). Design,
optimization and manufacturing of wood–plastic composite pallet. Materials and Design,
30(10), 4183-4191.
Stadtler, H. (2015). Supply chain management: An overview. In Supply chain management
and advanced planning (pp. 3-28). Berlin: Springer.
Thagard, P. and Shelley, C. (1997). Abductive reasoning: Logic, visual thinking, and
coherence. Philosophy Department, University of Waterloo.
Toktay, B.L., van der Laan, E.A., & de Brito, M.P. (2004). Managing Product Returns: The
Role of Forecasting.
Trochim, W.M.K. (2006). Research Methods. Retrieved Mars, 10 from
https://www.socialresearchmethods.net/kb/dedind.php.
Vercraene, S., Gayon, J., & Flapper, S. S. D. (2014). Coordination of manufacturing,
remanufacturing and returns acceptance in hybrid manufacturing/remanufacturing systems.
International Journal of Production Economics, 148, 62-70.
Wallen, G. (1996). Vetenskapsteori och forskningsmetodik. Studentlitteratur AB, Lund.
Weele, v., AJ Arjan, & Raaij, v., EM Erik. (2014). The future of purchasing and supply
management research: About relevance and rigor. Journal of Supply Chain Management,
50(1), 56-72.
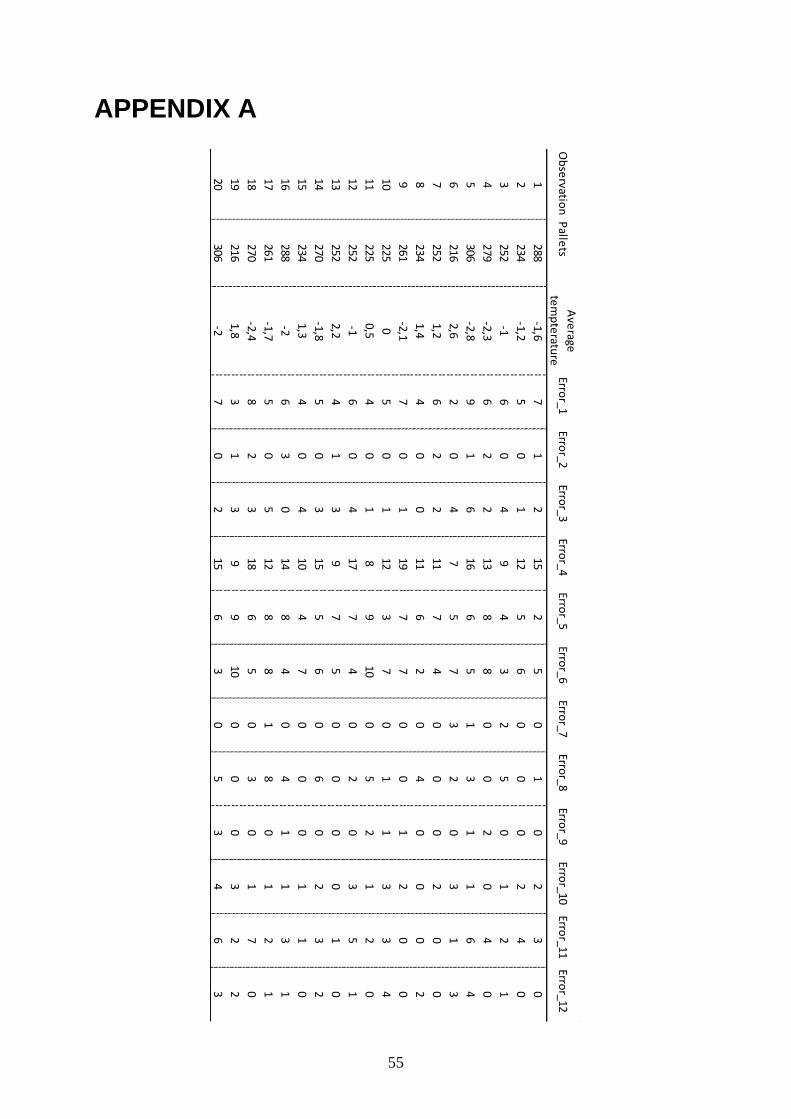
55
APPENDIX A
Ob
servatio
nP
allets
Ave
rage
tem
pte
rature
Error_1
Error_2
Error_3
Error_4
Error_5
Error_6
Error_7
Error_8
Error_9
Error_10
Error_11
Error_12
1288
-1,67
12
152
50
10
23
0
2234
-1,25
01
125
60
00
24
0
3252
-16
04
94
32
50
12
1
4279
-2,36
22
138
80
02
04
0
5306
-2,89
16
166
51
31
16
4
6216
2,62
04
75
73
20
31
3
7252
1,26
22
117
40
00
20
0
8234
1,44
00
116
20
40
00
2
9261
-2,17
01
197
70
01
20
0
10225
05
01
123
70
11
33
4
11225
0,54
01
89
100
52
12
0
12252
-16
04
177
40
20
35
1
13252
2,24
13
97
50
00
01
0
14270
-1,85
03
155
60
60
23
2
15234
1,34
04
104
70
00
11
0
16288
-26
30
148
40
41
13
1
17261
-1,75
05
128
81
80
12
1
18270
-2,48
23
186
50
30
17
0
19216
1,83
13
99
100
00
32
2
20306
-27
02
156
30
53
46
3
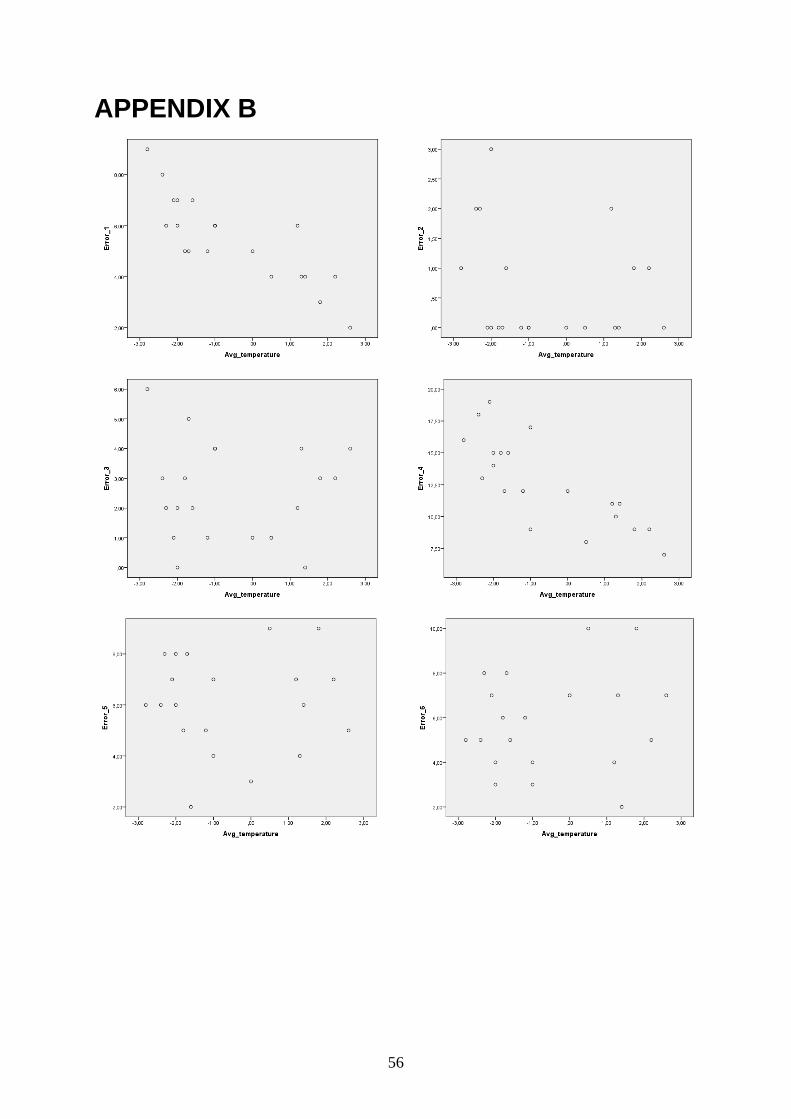
56
APPENDIX B
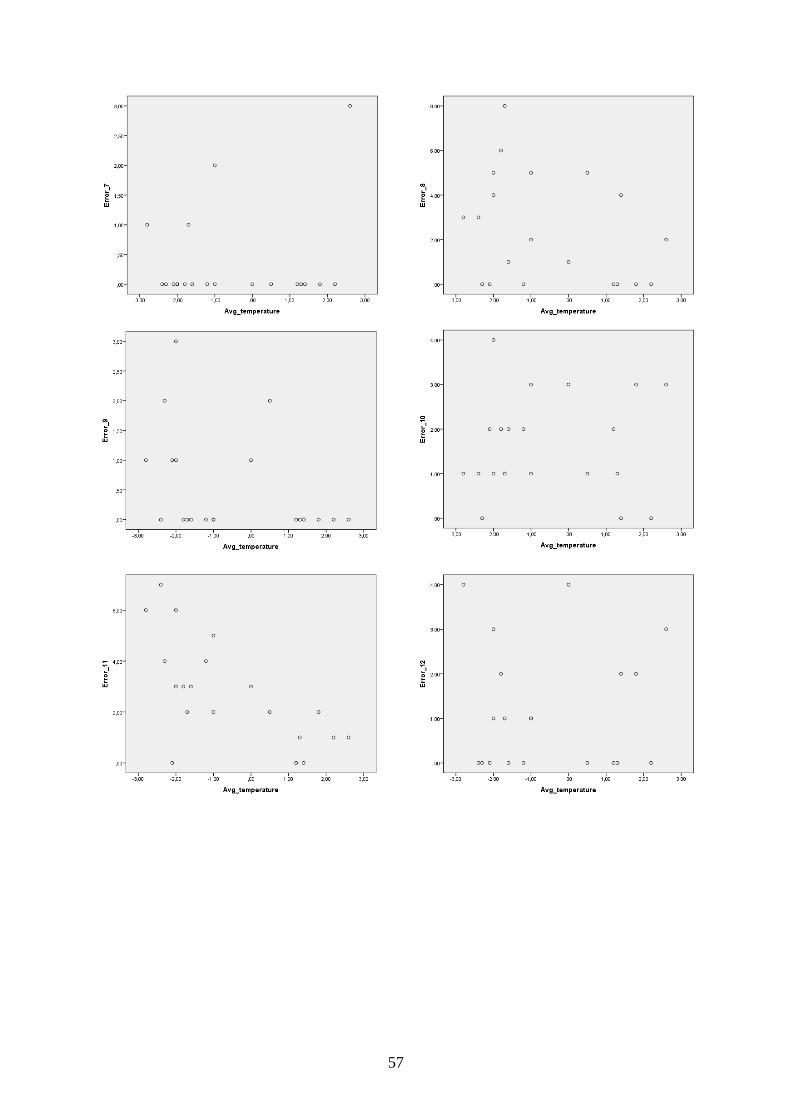
57