identifying lineage relationships in human t cell...
TRANSCRIPT
Identifying lineage relationships in human T cell populations
by
Celia Lara Menckeberg
A thesis submitted to The University of Birmingham
for the degree of DOCTOR OF PHILOSOPHY
School of Immunity and Infection College of Medical and Dental Sciences
The University of Birmingham December 2010

University of Birmingham Research Archive
e-theses repository This unpublished thesis/dissertation is copyright of the author and/or third parties. The intellectual property rights of the author or third parties in respect of this work are as defined by The Copyright Designs and Patents Act 1988 or as modified by any successor legislation. Any use made of information contained in this thesis/dissertation must be in accordance with that legislation and must be properly acknowledged. Further distribution or reproduction in any format is prohibited without the permission of the copyright holder.

ii
ABSTRACT
CD4+ and CD8+ T cell populations can be divided into subpopulations based on expression of
surface markers CCR7 and CD45RA. The resulting populations are referred to as naive,
central memory, effector memory and effector memory RA+ (EMRA). The aim of this study
was to identify potential lineage relationships between these subpopulations for both CD4+
and CD8+ T cells through microarray analysis. The genes found to distinguish between these
subpopulations include many molecules with known functions in T cell differentiation,
including CCR7, CD45RA, granzymes, L-selectin and TNF receptors. Several genes from the
tetraspanin family of proteins were found to be differentially expressed at mRNA and protein
level; suggesting a possible role for these genes in CD4+ and CD8+ T cell activation,
migration and lysosomal function. Other genes identified, such as LRRN3 and CXCR5 which
were expressed highest on naive and CM T cells respectively, provide interesting gene targets
to follow up on their function in these T cell populations. Microarray data was validated
through Real Time PCR and suggests that both CD4+ and CD8+ T cells differentiate along a
linear pathway of naive to central memory to effector memory. The transcriptional
programmes responsible for these differentiation steps were distinct between CD4+ and CD8+
T cells, although additional elements were common to both subsets.

iii
Dedicated to Mama en Papa

iv
ACKNOWLEDGEMENTS
First I would like to thank my supervisor Dr. John Curnow for guiding me through this project and for adopting me when it was very much needed. The encouragement and advice he has given have helped me grow as a scientist and as a person. I would also like to thank Professor Mike Salmon, without whom this project would not have been possible.
Huge thanks to Steve (Stev) Kissane for all his help throughout these years, not only was he my microarray specialist but also a source of knowledge in many different topics. Thanks for always being there to help with any questions I had and for the countless lab bench and lunch time chats. I would like to thank Dr. Graham Wallace for all his support throughout and helpful discussions along the way and Dr. Ewan Ross for being a source of knowledge and always ready to help.
Also I want to thank all my lovely friends that I made working on the 3rd floor IBR. You were my family away from home and made living in Brum for four years so very special. Fern (Barry) Barrington, thank you for being my Harborne and vacation buddy; I loved our movie and Sunday cooking nights! Dr. Sarah (Chuckles) Essex thank you so much for being the smiling face I saw sitting across from me for almost four years, as well as for introducing me to the wonder that is a lemon drizzle cake. Katherine (Kaaath) Howlett for being my gym and pub buddy and subsequent fellow Harbonite! And for the many, many, many excellent cakes in these past four years. Lorraine (Lore) Yeo thank you for taking over from Sarah when it was needed and of course for the excellent white chocolate and raspberry muffins. To all my other friends, Dr. Peter Hampson, Dr. Jason Lee, Dr. Sian Lax, Siobhan Restorick, Hema Chahal, Emma Yates and many others, thank you for being a huge part in why the department of Rheumatology was such a nice place to work. I would like to acknowledge Professor Janet Lord and Professor Chris Buckley in their roles as head of the Marie Curie TRIFID project and head of the Department of Rheumatology respectively.
To my lovely friends and family back home, Ranjeeta Bendter, Francis Saridin and Serge Parabirsing, thank you for always supporting me and for always being only a phone call away. Jeeta, thank you for sticking with me for almost 25 years (playground buddies for life!) and Francis, my study-buddy, 10 years and counting! Serrie thanks for staying positive throughout everything that has happened.
I want to thank my sister Tanja and her husband Rodney for all their help along the way and for giving me the best gift ever by making me the proud auntie of Rafaël. Mostly I would like to thank my parents for always believing in me and encouraging me; for instilling in me a thirst for knowledge from a very young age and for being my rock to fall back on. You are my heroes.
v
ABBREVIATIONS
ADD2 Beta-adducin
AEBP1 Adipocyte Enhancer Binding Protein 1
ANOVA Analysis of Variance
APC Antigen Presenting Cell
BCR B Cell Receptor
BHLHB2 Basic Helix-Loop-Helix protein B2
BM Bone Marrow
BSA Bovine Serum Albumin
CLIP Class-II-associated Ii peptide
CLP Common Lymphoid Progenitor
CM Central Memory
CMP Common Myeloid Progenitor
Cn Calcineurin
CTLA-4 Cytotoxic T lymphocyte antigen-4
Cy3/Cy5 Cyanine 3 or 5
DAG Diacylglycerol
DC Dendritic Cells
DN Double Negative
DP Double Positive
EAE Experimental Autoimmune Encephalomyelitis
EBV Epstein-Barr virus
EDTA Ethylenediaminetetraacetic acid
EM(RA) Effector Memory (RA)
ER Endoplasmic Reticulum
vi
ETP Early Thymic Progenitor
FACS Fluorescent Activated Cell Sort
FDC Follicular Dendritic Cell
FDR False Discovery Rate
GPS Glutamine Penicilin Streptomycin
GZM Granzyme
HCL Hierarchical Clustering
HEV High Endothelial Venules
HLA Human Leukocyte Antigen
HSC Hematopoietic Stem Cell
HVEM Herpesvirus entry mediator
ICAM1 Intracellular Cell Adhesion Molecule 1
IFNγ Interferon γ
Ig Immunoglobulin
Ii MHC-II specific chaperone invariant chain
IL Interleukin
IP3 Inositol 1,4,5-triphospahate
IS Immunological synapse
KLRB1 Killer Cell Lectin-like Receptor subfamily B member 1
KLRC4 Killer Cell Lectin-like Receptor subfamily C member 4
KLRF1 Killer Cell Lectin-like Receptor subfamily F member 1
LAT Linker for T cell Activation
LFA-1 Lymphocyte Function-associated Antigen-1
LIGHT homologous to LTs, exhibits inducible expression, and competes with HSV gD for herpesvirus entry mediator, a receptor expressed by T lymphocytes or TNSF14
(p)LN (peripheral) Lymph Node
Lo/Ld Liquid order/Liquid disorder
vii
LRRN3 Leucine Rich Repeat Neuronal protein 3
LTα1β2 Lymphotoxinα1β2
LTβR Lymphotoxinβ Receptor
LTi Lymphotoxin inducer
LTo Lymphotoxin organiser
MAdCAM-1 Mucosal Addressin Cell Adhesion Molecule-1
MALT Mucosal-Associated Lymphoid Tissue
MHC Major Histocompatibility Complex
MLP Multilymphoid Progenitor
MTMR8 Myotubularin related protein 8
MVB Multivesicular Body
MTUS1 Mitochondrial Tumor Suppressor 1 isoform 3
MYBL1 Myb-related protein A
MYO1F Myosin-If
NFAT Nuclear factor of activated T cells
NGFRAP1 Nerve Growth Factor Receptor (TNFRSF16) Associated Protein 1
NK cell Natural Killer cell
NKG7 Natural Killer Cell protein 7
PALS Periarteriolar lymphoid sheath
PAMP Pathogen Associated Molecular Patterns
PBMC Peripheral Blood Mononuclear Cells
PBS Phosphate Buffered Saline
PCA Principal Component Analysis
PCR Polymerase Chain Reaction
PF Primary Follicles
PIP2 Phospholipid phosphatidylinositol-4,5-biphosphate
PLEKHK1 Pleckstrin homology domain containing family K member 1
viii
PKC Protein Kinase C
PLC1 Phospholipase C-1
PNAd Peripheral Lymph Node Addressin
PP Peyer’s Patches
PRDM8 PR domain zinc finger protein 8
PRR Pattern Recognition Receptor
RORγt RAR-related orphan receptor gamma
RT Reverse Transcription
SAM Significance Analysis of Microarrays
SH3BP5 SH3 domain-Binding Protein 5
SLC22A17 Solute carrier family 22 member 17
SLO Secondary Lymphoid Organs
SLP-76 SH2 domain containing leukocyte protein of 76 kDa
SMAC (c/p-) Central/peripheral supramolecular activation cluster
SP Single Positive
TAP Transporter associated with antigen processing
TCR T Cell Receptor
TEM Tetraspanin Enriched Membrane
TFH T follicular helper
Th T helper
TLR Toll like Receptor
TNFα Tumour Necrosis Factor α
TRANCE(R) TNF-related activation-induced cytokine (receptor)
(n/i) Treg (Natural/inducible) T regulatory cell
VCAM1 Vascular Cell Adhesion Molecule 1
ZAP70 -associated protein of 70kDa
ZNF Zinc Finger

ix
TABLE OF CONTENTS
ABSTRACT............................................................................................................................................ii
ACKNOWLEDGEMENTS................................................................................................................... iv
ABBREVIATIONS ................................................................................................................................v
TABLE OF CONTENTS....................................................................................................................... ix
LIST OF FIGURES ..............................................................................................................................xii
LIST OF TABLES..............................................................................................................................xvii
1 INTRODUCTION ..........................................................................................................................2
1.1 Innate Immunity......................................................................................................................2
1.2 Adaptive Immunity .................................................................................................................4
1.3 Hematopoiesis.........................................................................................................................5
1.4 Lymphoid organs ....................................................................................................................8
1.5 T cell development................................................................................................................12
1.6 T cell memory .......................................................................................................................16
1.7 T cell activation.....................................................................................................................18
1.8 CD4+ T cells..........................................................................................................................23
1.9 CD8+ T cells..........................................................................................................................26
1.10 Tetraspanins ..........................................................................................................................28
1.11 Transcriptome analysis .........................................................................................................36
1.12 AIMS.....................................................................................................................................38
2 MATERIAL AND METHODS....................................................................................................40
2.1 Peripheral blood ....................................................................................................................40
2.1.1 Cell isolation .................................................................................................................40
2.2.1 Antibody Dilutions for flow cytometry.........................................................................41
2.2.2 Flow cytometry .............................................................................................................42
2.2.3 Flow cytometry intracellular cytokine staining of stimulated CD4+ and CD8+ T cell populations....................................................................................................................................42
2.2.4 FACS sorting of CD8+ CCR7/CD45RA populations ...................................................43
2.2.5 FACS sorting of CD4+ CCR7/CD45RA populations ...................................................44
2.2.6 Sorting CD9 subsets from CD4+ T cells .......................................................................44
2.3 RNA extraction .....................................................................................................................45
2.3.1 DNase I treatment .........................................................................................................46
2.3.2 Reverse transcription.....................................................................................................46
2.3.3 PCR product purification ..............................................................................................47
x
2.4 Real Time PCR .....................................................................................................................47
2.5 Microarray spotting...............................................................................................................48
2.5.1 CyDye labelling ............................................................................................................48
2.5.2 Hybridisation.................................................................................................................49
2.5.3 Microarray data analysis ...............................................................................................50
2.5.4 Statistical tests...............................................................................................................51
3 EXAMINING GENE EXPRESSION PROFILES OF CD4+ AND CD8+ T CELL POPULATIONS DURING DIFFERENTIATION...............................................................................53
3.1 Introduction...........................................................................................................................53
3.2 Results...................................................................................................................................55
3.2.1 Sorting CCR7 and CD45RA based CD4+ and CD8+ T cell populations for gene expression analysis on microarrays...............................................................................................55
3.2.2 Microarray analysis of sorted CD4+ and CD8+ T cell populations ...............................58
3.2.3 Comparing the four differentiation states without distinguishing between CD4+ and CD8+ T cell populations................................................................................................................59
3.2.4 Comparing three differentiation states within the CD4+ compartment .........................62
3.2.5 Comparing four differentiation states within the CD8+ compartment ..........................73
3.2.6 Comparing between CD4+ and CD8+ differentiation states ..........................................84
3.2.7 Shared and unique genes in CD4+ and CD8+ differentiation pathways ........................92
3.3 Discussion. ............................................................................................................................99
4 VALIDATING GENE EXPRESSION PROFILES OF CD4+ AND CD8+ T CELL POPULATIONS BY REAL TIME PCR ANALYSIS .......................................................................115
4.1 Introduction.........................................................................................................................115
4.2 Results.................................................................................................................................117
4.2.1 Sorting CD4+ and CD8+ T cell populations based on CCR7 and CD45RA for gene expression analysis on microfluidic cards ..................................................................................117
4.2.2 Gene expression profiles identified through microarray correspond with the expression found through Real Time PCR analysis......................................................................................119
4.2.3 Comparing the three differentiation states without distinguishing between the CD4+ and CD8+ T cell compartment.....................................................................................................121
4.2.4 Comparing the three differentiation states within the CD4+ T cell compartment .......123
4.2.5 Comparing the three differentiation states within the CD8+ T cell compartment .......128
4.2.6 Comparing between CD4+ and CD8+ differentiation states ........................................132
4.2.7 Shared and unique genes in CD4+ and CD8+ differentiation pathways ......................135
4.3 Discussion ...........................................................................................................................138
5 EXPRESSION OF TETRASPANIN FAMILY MEMBERS ON CD4+ AND CD8+ T CELL POPULATIONS .................................................................................................................................148
5.1 Introduction.........................................................................................................................148
xi
5.2 Results.................................................................................................................................150
5.2.1 Expression of tetraspanin CD9 on human CD4+ and CD8+ T cell populations is biphasic 150
5.2.2 CD37 is not expressed on CD4+ and CD8+ T cell populations ...................................154
5.2.3 CD53 and CD63 expression on CD8+ T cell populations increases during differentiation..............................................................................................................................156
5.2.4 CD81 is expressed at high levels in both CD4+ and CD8+ T cell populations...........161
5.2.5 CD82 is expressed at very high levels on CD4+ T cell populations and its expression decreases on CD8+ T cells as they differentiate..........................................................................164
5.2.6 CD151 expression is highest on CD4+ and CD8+ EM T cell populations ..................167
5.2.7 Expression of tetraspanins on the cell surface of CD4+ or CD8+ T cell populations is not altered when comparing populations based on CD27 and CD45RA or CCR7 and CD45RA 170
5.2.8 CD9 negative and CD9 positive cells within CD4+ and CD8+ T cell populations do not differ in the ability to produce cytokines ....................................................................................173
5.2.9 CD9 expression on sorted CD4+ CM and EM T cell populations...............................177
5.3 Discussion ...........................................................................................................................183
6 GENERAL DISCUSSION .........................................................................................................193
6.1 Introduction.........................................................................................................................193
6.2 A shared differentiation pathway for CD4+ and CD8+ T cell populations based on CCR7 and CD45RA .........................................................................................................................................195
6.3 Differential expression of tetraspanin family members on CD4+ and CD8+ T cell populations......................................................................................................................................198
6.4 Future work leading from this study ...................................................................................200
7 REFERENCE LIST ....................................................................................................................205
8 APPENDIX.................................................................................................................................225
xii
LIST OF FIGURES
Chapter One: Introduction Figure 1.1 Schematic overview of hematopoiesis 6 Figure 1.2 Osteoblastic and vascular niches in bone marrow 8 Figure 1.3 Structure of secondary lymphoid organs 9 Figure 1.4 Models of positive selection of double positive thymocytes 14 Figure 1.5 Model of CD4+ effector cell differentiation, based on the
production of cytokines 25 Figure 1.6 Representation of tetraspanins 29 Chapter Three: Examining gene expression profiles of CD4+ and CD8+ T cell
populations during differentiation Figure 3.1 Sorting populations based on the expression of CD4, CCR7 and
CD45RA 56 Figure 3.2 Sorting populations based on the expression of CD8, CCR7 and
CD45RA 57 Figure 3.3 Comparing naive, CM, EM and EMRA T cell populations from
both the CD4+ and CD8+ T cell compartment 61 Figure 3.4 Comparing naive, CM, EM and EMRA T cell populations from
both the CD4+ and CD8+ T cell compartment PCA analysis 62 Figure 3.5 Comparing naive, CM and EM T cell populations from the CD4+
T cell compartment 63 Figure 3.6 Comparing naive and CM T cell populations from the CD4+ T
cell compartment 65 Figure 3.7 Genes with the highest fold difference from the gene list
generated when comparing naive and CM T cell populations from the CD4+ T cell compartment 66
Figure 3.8 Comparing naive and EM T cell populations from the CD4+ T cell compartment 68
Figure 3.9 Genes with the highest fold difference from the gene list generated when comparing naive and EM T cell populations from the CD4+ T cell compartment 69
Figure 3.10 Comparing CM and EM T cell populations from the CD4+ T cell compartment 71
Figure 3.11 Genes with the highest fold difference from the gene list generated when comparing CM and EM T cell populations from the CD4+ T cell compartment 72
Figure 3.12 Comparing naive, CM, EM and EMRA T cell populations from the CD8+ T cell compartment 74
Figure 3.13 Comparing naive and CM T cell populations from the CD8+
xiii
T cell compartment 75 Figure 3.14 Genes with the highest fold difference from the gene list
generated when comparing naive and CM T cell populations from the CD8+ T cell compartment 76
Figure 3.15 Comparing naive and EM T cell populations from the CD8+ T cell compartment 77
Figure 3.16 Genes with the highest fold difference from the gene list generated when comparing naive and EM T cell populations from the CD8+ T cell compartment 78
Figure 3.17 Comparing naive and EMRA T cell populations from the CD8+ T cell compartment 79
Figure 3.18 Genes with the highest fold difference from the gene list generated when comparing naive and EMRA T cell populations from the CD8+ T cell compartment 80
Figure 3.19 Comparing CM and EM T cell populations from the CD8+ T cell compartment 81
Figure 3.20 Genes with the highest fold difference from the gene list generated when comparing CM and EM T cell populations from the CD8+ T cell compartment 82
Figure 3.21 Comparing EM and EMRA T cell populations from the CD8+ T cell compartment 83
Figure 3.22 Comparing CD4+ naive and CD8+ naive T cell populations 85 Figure 3.23 Genes with the highest fold difference from the gene list
generated when comparing CD4+ naive and CD8+ naive T cell populations 86
Figure 3.24 Comparing CD4+ CM and CD8+ CM T cell populations 88 Figure 3.25 Genes with the highest fold difference from the gene list
generated when comparing CD4+ CM and CD8+ CM T cell populations 89
Figure 3.26 Comparing CD4+ EM and CD8+ EM T cell populations 90 Figure 3.27 Genes with the highest fold difference from the gene list
generated when comparing CD4+ EM and CD8+ EM T cell populations 91
Figure 3.28 Unique and shared genes can be found when comparing the three differentiation states between the CD4+ and CD8+ T cell compartments 93
Figure 3.29 Venn diagram of seven conserved genes can be found when comparing the gene lists generated to find the biggest difference between the differentiation states within the CD4+ and CD8+ compartments 97
Figure 3.30 Seven conserved genes can be found when comparing the gene lists generated to find the biggest difference between the differentiation states within the CD4+ and CD8+ compartments 98
xiv
Figure 3.31 Linear model of T cell differentiation based on gene expression profiles 110
Figure 3.32 Non-linear model of T cell differentiation based on gene expression profiles 111
Chapter Four: Validating gene expression profiles of CD4+ and CD8+ T cell populations
by Real Time PCR Figure 4.1 Sorting CD4+ and CD8+ T cell populations based on the expression
of CCR7 and CD45RA 118 Figure 4.2 Comparing the log 2 fold differences from the Real Time PCR
data to the log 2 fold differences from the array analysis 120 Figure 4.3 Comparing the gene expression of sorted naive, CM and EM
CD4+ T cell populations 125
Figure 4.4 Nine shared genes can be found when comparing the
differentiation of CD4+ and CD8+ T cell populations 136
Figure 4.5 One shared gene can be found when comparing the
differentiation states of CD4+ and CD8+ T cells 137
Figure 4.6 Comparing microarray analysis to Real Time PCR analysis 140
Figure 4.7 KLRC4 gene expression is highest in CD8+ T cell populations 142
Figure 4.8 NGFRAP1 gene expression is lowest in EM CD4+ and CD8+ T cell populations 143
Figure 4.9 SLC22A17 gene expression is lowest in EM CD4+ and CD8+ T cell populations 144
Figure 4.10 CXCR5 gene expression is highest in CM CD4+ and CD8+ T cell Populations 146
Chapter Five: Expression of tetraspanin family members on CD4+ and CD8+ T cell
populations Figure 5.1 CD9 expression on CD4+ T cell populations is varied between
donors as well as differentiation states 151 Figure 5.2 CD9 expression on CD8+ T cell populations is varied between
donors as well as differentiation states 153 Figure 5.3 CD9 expression on CD4+ and CD8+ T cell populations is
varied between differentiation states 154 Figure 5.4 CD37 is not expressed on CD4+ and CD8+ T cell populations 155
xv
Figure 5.5 CD53 expression on CD4+ and CD8+ T cell populations 157 Figure 5.6 CD53 expression on CD4+ T cell populations stays similar as
the cell differentiate, but the expression increases during differentiation on CD8+ T cell populations 158
Figure 5.7 CD63 is expressed at low levels on CD4+ and CD8+ T cell Populations 159
Figure 5.8 CD63 expression on CD4+ T cell populations stays similar as the cell differentiate, but the expression increases during differentiation on CD8+ T cell populations 160
Figure 5.9 CD81 is expressed at high levels on both CD4+ and CD8+ T cell population 162
Figure 5.10 CD81 is expressed at high levels on both CD4+ and CD8+ T cell populations 163
Figure 5.11 CD82 is expressed at high levels on both CD4+ and CD8+ T cell populations 165
Figure 5.12 CD82 is expressed at very high levels on CD4+ T cell populations and its expression decreases on CD8+ T cell populations as they differentiate 166
Figure 5.13 CD151 is expressed at low levels on both CD4+ and CD8+ T cell populations 168
Figure 5.14 CD151 expression goes up in both CD4+ and CD8+ T cell populations as they differentiate. 169
Figure 5.15 Tetraspanin expression on CD4+ T cell populations based on CCR7 and CD27 does not differ 171
Figure 5.16 Tetraspanin expression on CD8+ T cell populations based on CCR7 and CD27 does not differ 172
Figure 5.17 No difference between CD9 negative and CD9 positive cells IFNγ production in CD4+ T cell populations 174
Figure 5.18 No difference between CD9 negative and CD9 positive cells IFNγ production in CD8+ T cell populations 176
Figure 5.19 Sorted CD4+ CM CD9 negative populations 178 Figure 5.20 Percentage positive cells of sorted CD4+ CM CD9 negative
populations in culture 179 Figure 5.21 Sorted CD4+ EM CD9 negative populations 181 Figure 5.22 Percentage positive cells of sorted CD4+ EM CD9 negative
populations in culture 182 Figure 5.23 Summary of tetraspanin expression on CD4+ and CD8+
T cell populations 184 Figure 5.24 Model of CD9 involvement on recently activated CD4+
T cell populations 189 Figure 5.25 Model of analysin CD9 involvement on recently activated
CD4+ T cell populations 190

xvi
Chapter Six: General Discussion Figure 6.1 Adapted linear and non-linear models of T cell differentiation to
reflect active inflammation and resolved inflammation conditions 196 Figure 6.2 Graphical representation of how gene expression analysis of
peripheral blood cells can be important in identifying disease related transcriptional changes, adapted from Pascual et al (2010) 198
xvii
LIST OF TABLES
Chapter Three: Examining gene expression profiles of CD4+ and CD8+ T cell populations during differentiation
Table 1 Genes shared between the comparison CD4+ naive versus
CD8+ naive and CD4+ CM versus CD8+ CM 94
Table 2 Genes shared between the comparison CD4+ naive versus
CD8+ naive and CD4+ EM versus CD8+ EM 95
Table 3 Genes shared between the comparison CD4+ CM versus
CD8+ CM and CD4+ EM versus CD8+ EM 96
Chapter Four: Validating gene expression profiles of CD4+ and CD8+ T cell populations by Real Time PCR
Table 1 Comparing the gene expression of sorted naive, CM and
EM CD4+ and CD8+ T cell populations 122
Table 2 Comparing the gene expression of sorted naive, CM and
EM CD4+ T cell populations 124
Table 3 Comparing the gene expression of sorted naive and CM
CD4+ T cell populations 126
Table 4 Comparing the gene expression of sorted naive and EM
CD4+ T cell populations 127
Table 5 Comparing the gene expression of sorted CM and EM
CD4+ T cell populations 128
Table 6 Comparing the gene expression of sorted naive, CM
and EM CD8+ T cell populations 129
Table 7 Comparing the gene expression of sorted naive and CM

xviii
CD8+ T cell populations 130
Table 8 Comparing the gene expression of sorted naive and EM
CD8+ T cell populations 131
Table 9 Comparing the gene expression of sorted CM and EM
CD8+ T cell populations 131
Table 10 Comparing the gene expression of sorted CD4+ naive and
CD8+ naive T cell populations 132
Table 11 Comparing the gene expression of sorted CD4+ CM and
CD8+ CM T cell populations 134
Table 12 Comparing the gene expression of sorted CD4+ EM and
CD8+ EM T cell populations 135

Chapter One Introduction 1
Chapter One
Introduction
Chapter One Introduction 2
1 INTRODUCTION
The immune system consists of many different cell types and organs, all of which work
together to protect the body from infection. The cells of the immune system are constantly
communicating with their surroundings by sending and receiving signals and by responding
to those signals. The immune system itself has several levels of protection which a pathogen
has to breach in order to cause damage. First there are external and chemical barriers, such as
the skin and stomach acids. And then there are two branches of immune responses, the innate
and adaptive 1. Innate immunity is the first line of defence against pathogens and depends on
a fixed number of germline encoded receptors. The adaptive immune response requires some
time after activation to clonally expand, but it is capable of specifically recognising a wider
variety of pathogens and of forming immunological memory 1-3.
1.1 Innate Immunity
As mentioned above the innate immune system is the first cellular defence mechanism the
body has to protect itself from pathogens. It consists of cells which can be tissue residing
(e.g. dendritic cells and macrophages) or patrolling (e.g. neutrophils and monocytes) and
display immediate and non-specific effector functions 1;4. The cells classified as innate
immune cells are neutrophils, monocytes, macrophages, dendritic cells (DCs) and natural
killer cells. These cells have several ways of detecting and clearing a pathogen. They express
receptors on their cell surface, referred to as pattern recognition receptors (PRRs) which
recognise several evolutionary conserved molecular structures, referred to as pathogen
associated molecular patterns (PAMPs) 5. Toll-like receptors (TLRs) are very important to

Chapter One Introduction 3
innate immune cells, since they are capable of recognising a variety of organisms. There are
ten human TLRs described so far and these can be expressed on the cell surface (such as
TLR1, 2, 4, 5 and 6) or within intracellular compartments (such as TLR3, 7, 8 and 9). The
nucleotide organisation domain (NOD) family of receptors are mostly expressed in the
cytoplasm and react to intracellular pathogen derived molecules. Through phagocytosis
innate immune cells are capable of engulfing a pathogen and trapping it within a vesicle, in
which the pathogen is destroyed by digestive enzymes or reactive oxygen species 1. Almost
all cells of the innate immune system are capable of phagocytosis. Innate immunity can also
activate a humoral response through the complement system 6;7. The complement system uses
antimicrobial peptides and opsonins to target and lyse the pathogen, and produces
chemoattractants. The result of this is that more cells are attracted to the site of inflammation
and cause the classical signs of inflammation, such as swelling, redness, pain and heat 7.
Chapter One Introduction 4
1.2 Adaptive Immunity
In contrast to the cells in the innate immune system, cells of the adaptive immune system (T
and B cells) are capable of recognising specific antigens due to the expression of antigen
specific receptors on their cell surface 6. B cells express on their cell surface a B cell receptor
(BCR), which is an antibody unique for an antigen. When a B cell recognises its antigen, it is
stimulated to proliferate and differentiate into plasma cells and memory B cells. Plasma cells
produce large amounts of soluble antibodies (immunoglobulins) of a defined specificity,
these antibodies are then released into the blood 1. Immunoglobulins are produced through
somatic recombination and mutation of a limited set of gene segments, resulting in an almost
infinite diversity. Immunoglobulins are Y shaped molecules consisting of two heavy chains
and two light chains which are linked together by disulfide bonds. Both the heavy and light
chains have a constant and a variable region. The class of antibody (isotype) is determined by
the heavy chain, of which there are five resulting in five isotypes IgA, IgD, IgE, IgG and
IgM. IgM antibodies are low affinity and are produced in the primary response. In a
secondary response, resulting from B cell activation through T cell help, the higher affinity
IgG antibodies are produced. Antibodies will bind to their antigen and neutralise them in this
way 1.
T cells are divided into a CD4+ and a CD8+ compartment, both CD4+ and CD8+ T cells
express an antigen specific T cell receptor (TCR) on their cell surface. The TCR is very
similar to an immunoglobulin, being composed of immunoglobulin-like domains, however a
different set of genes is involved in producing the TCR. When the TCR is activated the T
cells can be induced to produce cytokines as well as exert effector functions. CD8+ T cells are
cytotoxic through the secretion of perforin and granzymes resulting in the death of an

Chapter One Introduction 5
infected cell. CD4+ T cells upon activation can secrete cytokines and differentiate into several
subsets which can exert either effector or regulatory functions 1. DCs are classically innate
immune cells, but they provide an important link between innate and adaptive immunity 5.
When residing in tissue, DCs are capable of taking up antigens, which they then present on
their cell surface. They subsequently migrate to lymphoid organs where they can present the
antigen to T cells initiating the adaptive response 1;5
1.3 Hematopoiesis
Hematopoiesis is the process in which the cells of the blood are generated in the bone
marrow. This process is classically thought to start out with a hematopoietic stem cell (HSC)
which divides and gives rise to progenitor cells which will differentiate into one of the blood
lineages 8-10. A linear model for hematopoiesis was adopted after Kondo et al (1997)
described a clonogenic common lymphoid progenitor (CLP) in mice and Akashi et al (2000)
found a clonogenic common myeloid progenitor (CMP) 11;12. This classical model of
hematopoiesis starts with an HSC which differentiates into either of the multipotent
progenitors CLP or a CMP committed to either the lymphoid or myeloid lineage (Fig. 1.1A).
With the identification of mouse progenitors capable of giving rise to both lymphoid and
myeloid lineages the question arose whether the split between the progenitors capable of
giving rise to these distinct lineages was as clear cut as suggested in the classical model.
Doulatov et al (2010) compared the developmental potential of seven progenitor populations
in humans and suggested an adapted model of hematopoiesis in humans (Fig. 1.1B) 10. They
found that the CLP which was thought to only give rise to cells of lymphoid origin, was also
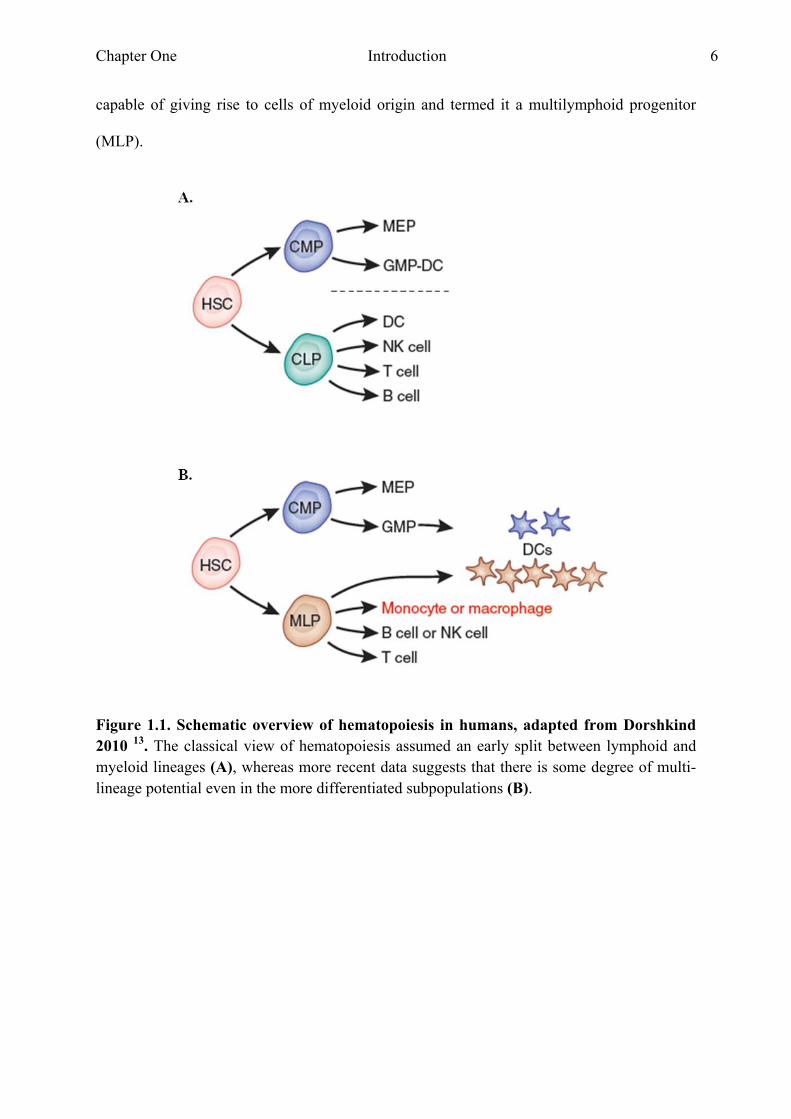
Chapter One Introduction 6
capable of giving rise to cells of myeloid origin and termed it a multilymphoid progenitor
(MLP).
Figure 1.1. Schematic overview of hematopoiesis in humans, adapted from Dorshkind 2010 13. The classical view of hematopoiesis assumed an early split between lymphoid and myeloid lineages (A), whereas more recent data suggests that there is some degree of multi-lineage potential even in the more differentiated subpopulations (B).
Chapter One Introduction 7
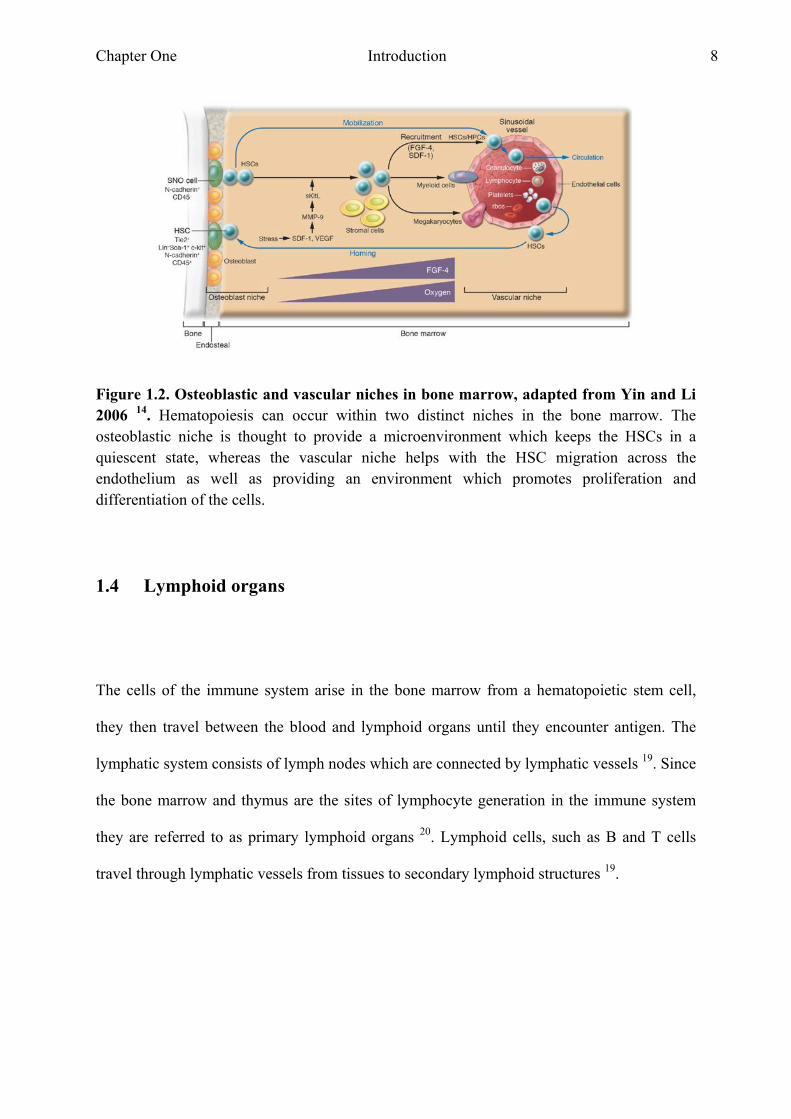
It is thought that hematopoiesis occurs in two specialised stem cell niches in the bone
marrow, namely the osteoblastic niche and the vascular niche 14;15. A stem cell niche is
thought to provide a microenvironment to stem cells, which supports self renewal and
proliferation (Fig. 1.2). The development of adult blood lineages from HSCs is dependent on
a balance between the self renewal capacity of the cells and the capacity to differentiate. One
way in which this is achieved is by asymmetric division of the HSC; when dividing one
daughter cell will become an HSC whereas the second daughter cell will differentiate along a
pathway. The other factor influencing this balance is thought to be the microenvironment
provided to the HSCs. Among HSCs there are long term (LT) and short term (ST) HSCs, in
which the LT HSCs are mainly kept in a quiescent state and ST HSCs are proliferating cells
14. Several mouse studies have shown that an increase in osteoblastic cells in the bone
marrow correlates to an increase in the number of LT HSCs found, suggesting a role for the
osteoblastic niche in the generation and maintenance of LT HSCs 16;17. The vascular niche
does so by providing a nutrient rich environment, which is less hypoxic compared to the
osteoblastic niche 14;18. The vascular niche also provides stimuli which help the HSC migrate
across the endothelium (e.g. SDF-1) and migrate to peripheral sites as well as home back to
the bone marrow.
Chapter One Introduction 8
Figure 1.2. Osteoblastic and vascular niches in bone marrow, adapted from Yin and Li 2006 14. Hematopoiesis can occur within two distinct niches in the bone marrow. The osteoblastic niche is thought to provide a microenvironment which keeps the HSCs in a quiescent state, whereas the vascular niche helps with the HSC migration across the endothelium as well as providing an environment which promotes proliferation and differentiation of the cells.
1.4 Lymphoid organs
The cells of the immune system arise in the bone marrow from a hematopoietic stem cell,
they then travel between the blood and lymphoid organs until they encounter antigen. The
lymphatic system consists of lymph nodes which are connected by lymphatic vessels 19. Since
the bone marrow and thymus are the sites of lymphocyte generation in the immune system
they are referred to as primary lymphoid organs 20. Lymphoid cells, such as B and T cells
travel through lymphatic vessels from tissues to secondary lymphoid structures 19.
Chapter One Introduction 9
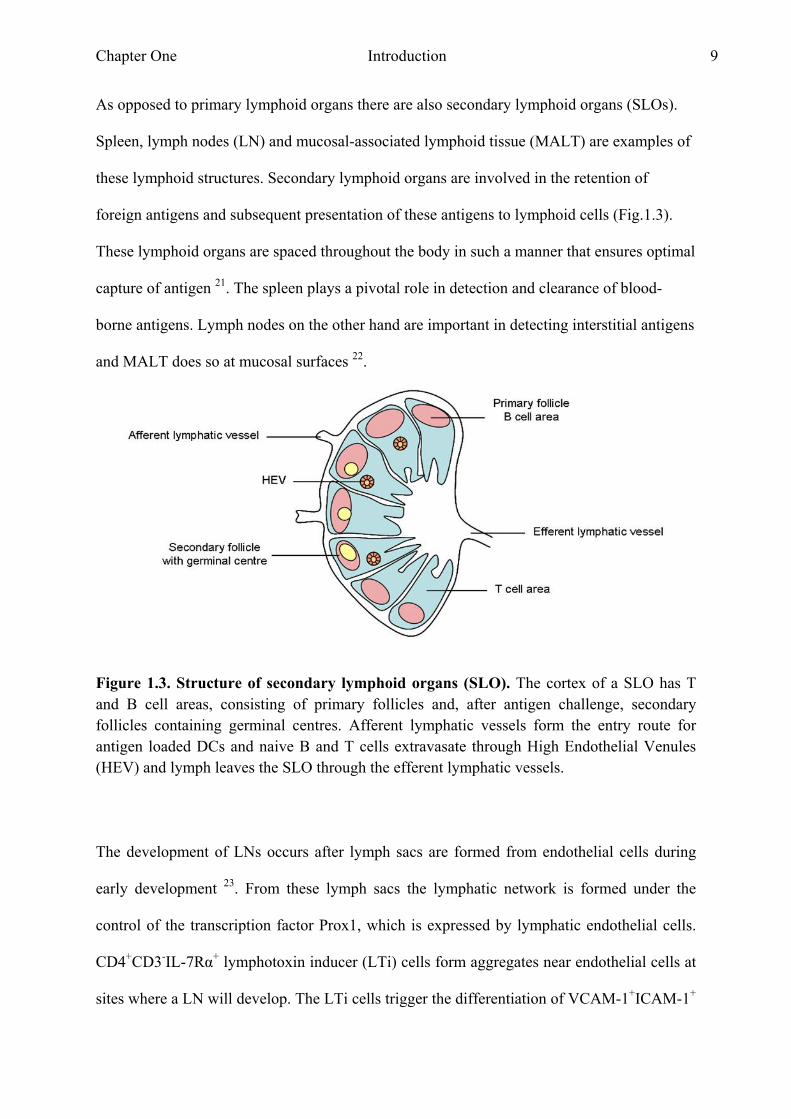
As opposed to primary lymphoid organs there are also secondary lymphoid organs (SLOs).
Spleen, lymph nodes (LN) and mucosal-associated lymphoid tissue (MALT) are examples of
these lymphoid structures. Secondary lymphoid organs are involved in the retention of
foreign antigens and subsequent presentation of these antigens to lymphoid cells (Fig.1.3).
These lymphoid organs are spaced throughout the body in such a manner that ensures optimal
capture of antigen 21. The spleen plays a pivotal role in detection and clearance of blood-
borne antigens. Lymph nodes on the other hand are important in detecting interstitial antigens
and MALT does so at mucosal surfaces 22.
Figure 1.3. Structure of secondary lymphoid organs (SLO). The cortex of a SLO has T and B cell areas, consisting of primary follicles and, after antigen challenge, secondary follicles containing germinal centres. Afferent lymphatic vessels form the entry route for antigen loaded DCs and naive B and T cells extravasate through High Endothelial Venules (HEV) and lymph leaves the SLO through the efferent lymphatic vessels.
The development of LNs occurs after lymph sacs are formed from endothelial cells during
early development 23. From these lymph sacs the lymphatic network is formed under the
control of the transcription factor Prox1, which is expressed by lymphatic endothelial cells.
CD4+CD3-IL-7Rα+ lymphotoxin inducer (LTi) cells form aggregates near endothelial cells at
sites where a LN will develop. The LTi cells trigger the differentiation of VCAM-1+ICAM-1+
Chapter One Introduction 10
(vascular cell adhesion molecule 1, intracellular cell adhesion molecule 1) lymphotoxin
organiser (LTo) cells by binding to the lymphotoxin beta receptor (LTβR) on these cells. This
results in the production of the chemokines CXCL13, CCL19 and CCL21 which attract
circulating hematopoietic cells resulting in the formation of an early lymph node anlagen 24.
From the 12th week of gestation T cells are starting to appear in the periphery and the number
of circulating cells that enter the lymph node increases 25. After week 14 CD4+ T cells can be
found in the lymph node anlagen, whereas very few CD8+ T cells can be found. The B cells
that are present at this stage are not organised into lymphoid follicles yet, this occurs during
the subsequent weeks when primary follicles (PF) are formed. In these PF precursors for
follicular DCs (FDCs) are present. The first fibroblastic reticulum cells (FRC) are found in
the paracortical regions of the lymph node after the 16th week, this marks the formation of a T
cell zone 25. FRCs form a reticular network together with reticular fibres and fibrous
extracellular matrix, the reticular network functions as a scaffold for the structure of a lymph
node 26;27.
An adult lymph node consists of B and T cells and APCs arranged into specific
compartments; an outer cortex and inner medulla which are surrounded by a capsule and a
lymphatic sinus 28. The B cells and follicular dendritic cells can be found in the cortex,
whereas T cells and dendritic cells can be found in the paracortical region. The subcapsular
sinus and medullary cord contain the macrophages (Fig. 3) 29;30.
The B cells are organised into primary follicles, which can form germinal centres when a B
cell is activated with its antigen. Within the paracortex near the border with the B cell area
there are high endothelial venules (HEVs), through which B and T cells enter from the
Chapter One Introduction 11
circulation, if they do not get activated the cells leave the LN via the efferent lymphatic
vessels 28;31.
The spleen can be divided into two areas, the splenic red pulp and white pulp. The red pulp
functions primarily as a filter where aged or damaged erythrocytes are removed from the
blood. The white pulp is organised into T and B cell areas and has a single vascular supply,
the splenic artery. The splenic artery branches into central arterioles which enter the white
pulp.
The central arterioles are surrounded by a T cell compartment called the periarteriolar
lymphoid sheath (PALS). After the central arteriole leaves the PALS it forms a marginal
sinus which contains endothelial cells expressing mucosal addressin cell adhesion molecule-1
(MAdCAM-1). The B cells in the white pulp are organised into two compartments, one
which consists of naive B cells and the other consists of follicle associated cells, which are
organised into primary follicles 28.
Chapter One Introduction 12
1.5 T cell development
The development of T cells in the thymus can be divided into several distinct phases. The
first phase entails thymic colonisation and committing to the T cell lineage. The second phase
sees the development of two distinct T cell lineages based on the T cell receptor (TCR)
expressed on their cell surface. T cells which express a αβ TCR respond to antigen presented
on MHC molecules and require the co-receptors CD4 and CD8, whereas T cells with a γδ
TCR can recognise antigen which is not presented on an MHC molecule. During the third
phase both the αβ and γδ lineages complete their differentiation 32;33. Early thymic
progenitors (ETPs) are thought to colonise the thymus while retaining some myeloid
potential. The environment in the thymus is thought to drive the cells to become committed T
cells in a gradual process in which the cells become less multipotent in each subsequent
stage. The double negative (DN) stage in which the cells do not express CD4 or CD8 on their
cell surface, can be divided into four stages based on the expression of CD44 and CD25. The
ETPs are cells in the DN1 stage and exhibit a CD44+CD25- phenotype, these cells can give
rise to T cells, B cells, NK cells and DCs. ETPs and DN2 (CD44+CD25+) cells undergo a
burst of proliferation, they may also initiate some V(D)J rearrangement but this does not
result in the full rearrangement required for expression of a functional TCR on the cell
surface. When the cells reach the DN3 stage (CD44-CD25+) they stop proliferating and the
TCR gene rearrangement is increased resulting in the first fully rearranged TCR loci. The
DN3 stage can be further divided into a DN3a and DN3b stage, the DN3a cells have not yet
successfully rearranged the TCR gene, whereas DN3b cells have. The DN3b cells
subsequently undergo TCR dependent selection, referred to as β-selection, after which the
cells switch on CD4 and CD8 expression and become double positive (DP) TCR αβ cells. If
Chapter One Introduction 13
the DN3b cells express a γδ TCR they are selected as γδ T cells, which do not express the co-
receptors CD4 or CD8 32;33.
DP cells are subjected to a process called positive selection, in which cells are presented with
self antigen expressed on MHC molecules. DP cells are the first to express a fully assembled
αβ TCR and the ligand specificity of this TCR will determine their fate during positive
selection. The generation of αβ TCRs through V(D)J rearrangements results in a huge
repertoire of antigen specific TCRs, most of which will not be able to recognise self antigen
and therefore result in the death of the cell expressing this TCR during positive selection. DP
cells undergoing positive selection are required to only respond to survival signals
downstream from TCR ligation and remain unresponsive to other survival signals, such as IL-
7. The CD4 and CD8 co-receptors are transmembrane molecules whose extracellular domain
binds to the MHC-II or MHC-I molecules respectively. Their intracellular domain binds to
protein tyrosine kinase Lck, which initiates TCR signalling when activated. The progression
from the DP stage to the SP stage is a result of positive selection, in which thymic epithelial
cells express self antigen on MHC molecules and trigger TCR signalling 34;35. The TCR
binding with self antigen on MHC is required to be a low affinity bond otherwise the cells
undergo programmed cell death.
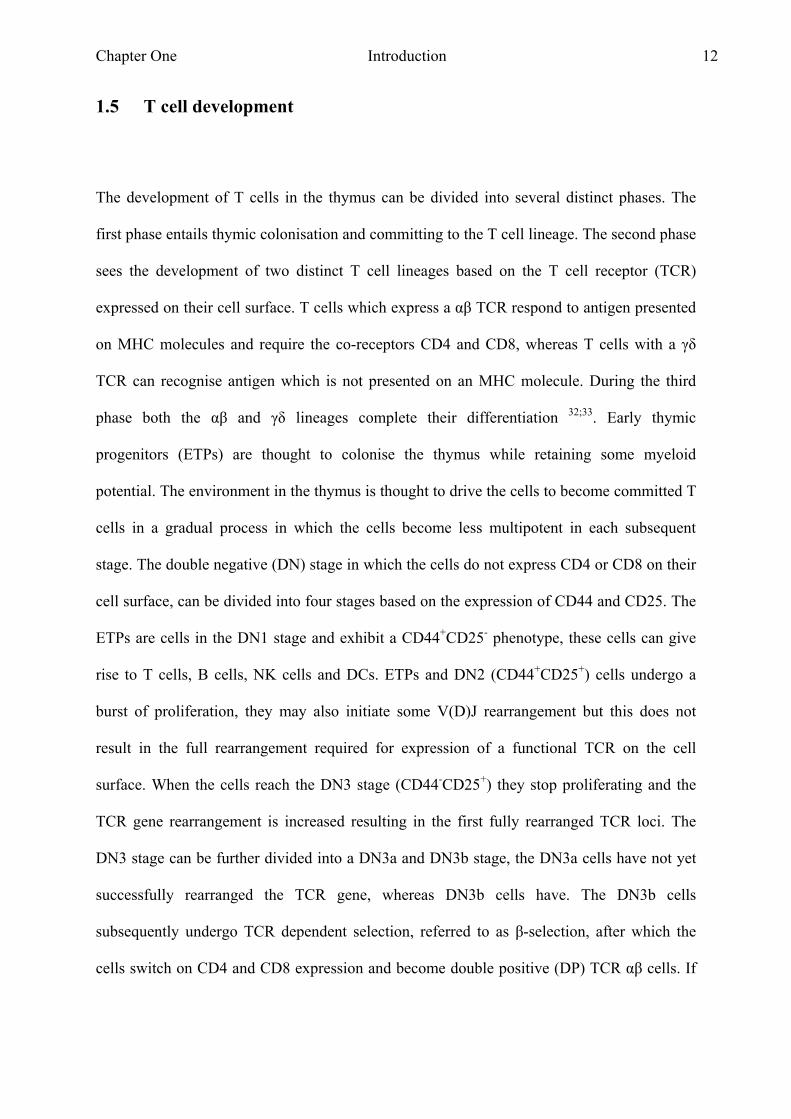
There are several models on how TCR specificity determines whether a DP cell will become
a CD4+ or a CD8 + single positive (SP) T cell. In the classical stochastic model it was thought
that the lineage choice was random and would result in halted gene expression of one or the
other co-receptor as a consequence of the same signalling event (Fig. 1.4A). After this first
step a second TCR rescue step would be needed to assure that only SP cells with matched
TCR and co-receptor survive 36. This model requires the new SP cells to be short lived if their
TCR and co-receptor do not match, however this has been contradicted by experiments that
Chapter One Introduction 14
show SP cells with mismatched TCRs and co-receptors are in fact not short lived but capable
of differentiating into mature T cells.
Figure 1.4. Models of positive selection of double positive (DP) thymocytes, adapted from Singer et al 2010 36. During positive selection DP αβ T cells are presented with antigen on MHC-I or MHC-II molecules, depending on which co-receptor gets activated during positive selection the cell differentiates into either a CD4+ T cell or a CD8+ T cell. A) The classical stochastic model assumes that positive selecting T cell receptor (TCR) signals randomly stop the expression of one or the other co-receptor molecule, creating short lived intermediate cells which require a second TCR signal for their rescue. B) The strength of signal model suggests that a weak TCR signal halts Cd4 expression, whereas a strong TCR signal halts Cd8 expression. C) The kinetic signalling model postulates that regardless of the specificity of their TCR, a TCR signal induces the DP cell to become CD4+CD8- intermediate cells. If the TCR signal persists in this intermediate cell it will differentiate into a CD4+ T cell, if not it will become a CD8+ T cell.
Chapter One Introduction 15
The strength of signal model assumes that CD4 and CD8 co-receptors provide signals of a
different strength during positive selection (Fig. 1.4B). The intracellular tail of CD4 is
capable of binding more Lck than that of CD8 therefore the engagement of TCR and CD4
generates stronger signals than TCR engagement along with CD8. When engineering a CD8α
gene in mice to express the cytosolic tail of CD4, it was shown that expression of this
engineered gene resulted in more MHC-I T cells being rescued, but that there was no effect
on CD4/CD8 lineage choice because all the MHC-I T cells in the engineered mice were
CD8+ T cells 36.
The kinetic signalling model suggests that TCR signal duration and cytokines of the common
γ chain family acting as sensors to detect the duration of the TCR signal determine CD4
versus CD8 lineage choice. Based on experimental observations it was proposed that in the
kinetic signalling model DP cells switch off CD8 gene expression and then assess the effect
of a lack of CD8 on TCR signalling (Fig. 4C). If a TCR signal persists in the absence of CD8,
the cell differentiates into a CD4+ T cell, if no signal is detected then the cell becomes a CD8+
T cell. This model proposes that persistence of the TCR signal stops IL-7 signalling allowing
the differentiation of CD4+ T cells, whereas a lack of TCR signalling leads to IL-7 signalling
allowing the differentiation of CD8+ T cells 36. A round of negative selection occurs in which
cells which have migrated to the cortico-medullary junction are exposed to self antigen. Cells
which bind with high affinity to the self antigen, hence are auto-reactive, will then undergo
apoptosis 35;37.
Chapter One Introduction 16
1.6 T cell memory
Before antigen activation naive T cells circulate through the body between secondary
lymphoid organs via the blood and lymph. This circulation of naive cells is necessary to
increase their chances of encountering antigen 38. Without antigen activation naive T cells
have a prolonged lifespan, this is a result of continuous recognition of several ligands which
deliver sufficient signals to keep the T cells from dying. The main survival factor for naive T
cells is the cytokine IL-7, in vitro culture of naive T cells showed IL-7 kept the cultured naive
cells alive, whereas naive cells cultured without IL-7 died 26. Three subsequent events occur
when a naive cell homes to peripheral lymph nodes (pLN), first the cell starts rolling due to
interaction of CD62L with its ligand PNAd (Peripheral Lymph Node Addressin). The cell
then adheres by the ligation of CCR7 with its ligand CCL21, resulting in the activation of the
integrin LFA-1. LFA-1 binding to ICAM-1 results in firm adhesion of the cell, allowing
extravasation of the cell 39;40. After recognising antigen presented on APCs the naive T cells
undergo clonal expansion and differentiate into effector cells. CD8+ T cells differentiate into
cells capable of producing IFN-γ, TNF-α and several chemokines as well as directly killing
their target cells. CD4+ T cells differentiate into either of several subsets of T helper cells,
Th1, Th2, Th17, T follicular helper (TFH) and regulatory T cells (Treg).
The immune response is divided into several phases based on the accumulation and/or
disappearance of antigen specific cells during the response 41. After antigen stimulation
occurs, a lag phase in which antigen specific cells are stimulated to become activated, but do
not divide. During the expansion phase that follows the antigen specific cells expand and
differentiate. The cells eventually reach a plateau stage which is followed by a contraction
phase 41. After clearance of the antigen the majority of effector cells are removed since they

Chapter One Introduction 17
are no longer required 38;39. A small number of T cells persists after antigen clearance and
become long-lived memory cells. Memory T cells provide long-term protection to re-
exposure to antigen, resulting in a faster and stronger response after re-exposure 38;39;42. As
opposed to the naive T cell pool, the memory T cell pool has a narrower TCR repertoire.
Another striking difference between memory T cells and naive T cells is that memory cells
are able to produce a wider variety of cytokines than naive cells. The exact route of memory
T cell formation is not yet clearly understood, one possibility is that memory cells are
descendants from the effector population. There might also be a group of activated cells
which are either predestined to become memory cells or driven to become memory cells 42.
Memory T cells can be further divided into two subsets of memory cells (central and
effector), based on their rate of proliferation and surface marker expression 38. Sallusto et al
(1999) describe four T cell populations based on the expression of CCR7 and CD45RA;
naive, central memory (CM), effector memory (EM) and EMRA populations 43. The EMRA
population (CCR7-CD45RA+) shares many of the features of the EM cells but are thought to
be terminally differentiated cells.
The naive population described by Sallusto et al (1999) is double positive for both CCR7 and
CD45RA, whereas the central memory population expresses CCR7+CD45RA- and has a
lower rate of proliferation 43. The effector memory cells have a fast turnover and exert
cytotoxic effector functions. These cells express the activation markers CD69 and CD25 and
have lost expression of lymph node homing receptors CCR7 and CD62L expressing a CCR7-
CD45RA- phenotype. Memory T cells are more metabolically active than naive T cells,
suggesting that these cells receive constant signals essential for providing a survival stimulus.
Even though memory T cells show a higher rate of proliferation total numbers of memory T
cells remain fairly constant through life. Moreover after each infection a new memory subset
Chapter One Introduction 18
is formed, resulting in a redistribution of the number of memory T cells already present, so as
to maintain a similar total number of memory cells 44.
1.7 T cell activation
When a T cell recognises its antigen on the surface of an APC an adaptive immune response
is initiated. Antigen, in the form of peptides, is presented to the T cells on a major
histocompatibility complex (MHC) molecule present on the cell surface of an APC, such as
DCs or B cells. DCs express several molecules needed for efficient activation of T cells,
especially naïve cells, such as the costimulatory molecules CD80 and CD86, the adhesion
molecules ICAM-1 and ICAM-3 as well as high levels of MHC class I and MHC class II
molecules 45;46. As described above, a TCR present on a CD4+ T cell will recognise antigen
presented on MHC-II whereas a CD8+ T cell will recognise antigen presented on MHC-I.
CD4 and CD8 are coreceptors which will directly bind to non-polymorphic regions of MHC-
II or MHC-I respectively, thereby strengthening the interaction between the T cell and APC.
T cell activation is a direct result of the recognition by the TCR of antigen presented in the
peptide binding groove of MHC-I and MHC-II molecules. The way in which peptide is
acquired differs between MHC-I and MHC-II. MHC-I is primarily thought to present
intracellularly acquired peptides, as a result of the presence of a viral infection, an
intracellular bacteria or changes within the cell. In comparison MHC-II is thought to present
extracellular antigens. There is also the process of cross-presentation by certain specialised
APC particularly plasmacytoid DC, where extracellular antigens are presented by MHC-I.
MHC molecules are heterodimeric proteins, consisting of an and chain and which span
the plasma membrane 47;45. Newly synthesised MHC-II dimers are chaperoned by binding
Chapter One Introduction 19
with the MHC-II specific chaperone invariant chain (Ii), this prevents the MHC-II
heterodimer from forming aggregates which is a result of not having bound peptide in the
binding groove. The Ii protein has a classII-associated Ii peptide (CLIP) which occupies the
binding groove as well as sorting signals which direct the MHC-II molecule to the endocytic
system 45. Within an endosome the Ii protein is degraded by proteases, except for the CLIP
region, which stays bound to MHC-II. CLIP can be removed by non-classical MHC-II
protein HLA-DM, when HLA-DM colocalises with MHC-II in an endosome it catalyses the
dissociation of CLIP from the MHC-II molecule 45.
MHC-II molecules encounter their antigen after APCs take it up from the extracellular
milieu, the antigen is then contained within a phagosome. The phagosome fuses with a
lysosome, giving rise to a phagolysosome, in which the contents of the phagosome are
degraded by lysosomal acid hydrolases and cathepsins. In the phagolysosome the degraded
contents of the phagosome can be loaded onto the MHC-II molecules which were present in
the lysosome. MHC-II molecules loaded with antigen are then transported to the cell surface
where they can present their load to circulating CD4+ T cells 47.
The MHC-I molecule consists of an (heavy chain) and 2 microglobulin chain, of which
the chain is membrane spanning. MHC-I molecules present antigen derived from cytosolic
proteins that they encounter in the endoplasmatic reticulum (ER) where both chains are
synthesised. Proteins which are destined for degradation are ubiquitinated and processed by a
proteasome within the cytosol. The degraded proteins are then transported into the ER by the
transporter associated with antigen processing (TAP) complex. In the ER the peptides can
interact with the newly synthesised MHC-I molecule 47.
Chapter One Introduction 20
As described above (1.5 T cell development) a TCR can consist of either or chains.
The TCR forms a complex together with CD3. CD3 consists out of four subunits of , ,
and and these subunits associate with the TCR as three dimers, namely , and
48When a TCR binds to its antigen on an MHC molecule, the TCR:CD3 complex undergoes
a conformational change, resulting in CD3 protein intracellular domains becoming accessible
to phosphorylation. When several TCRs on the same T cell are engaged in binding to antigen,
TCR clustering occurs. This creates the possibility for the CD4 or CD8 coreceptors, which
are associated with the Src kinase Lck, and the membrane protein Fyn to phosphorylate
ITAM motifs on the CD3 chains 49. Phosphorylation of the chain creates docking sites for
the -associated protein of 70 kDa (ZAP70) and subsequent phosphorylation of ZAP70 by
Lck activates ZAP70, which in turn phosphorylates the membrane protein linker for T cell
activation (LAT) as well as the SH2 domain containing leukocyte protein of 76 kDa (SLP-
76). Together SLP-76 and LAT form a docking site for phospholipase C-1 (PLC1), PLC1
is activated by the kinase Itk and activated PLC1 cleaves phospholipid phosphatidylinositol-
4,5-biphosphate (PIP2) to form inositol 1,4,5-triphosphate (IP3) and diacylglycerol (DAG).
IP3 binds to IP3 receptors on the endoplasmic reticulum (ER) resulting in the release of
intracellular calcium stores. Calcium itself is involved in many biological processes and the
rise in calcium concentration in the cell results in cell membrane calcium released activated
calcium channels (CRACs) allowing extracellular calcium to enter the cell 49;50. Calcineurin
(Cn) is a serine-threonine protein phosphatase which can transduce the calcium signal. The
nuclear factor of activated T cells (NFAT) family of transcription factors are principal targets
of Cn. When a cell is activated the NFAT proteins are dephosphorylated by Cn, this results in
a conformational change which exposes a nuclear localisation signal. NFAT is then
translocated to the nucleus where it can activate gene transcription.

Chapter One Introduction 21
It has been shown that during the interaction between T cells and APCs the surface molecules
are organised in a specific manner, forming what is referred to as an immunological synapse
(IS). The IS on the surface of a T cell consists of two concentric rings, the centre ring or
central supramolecular activation cluster (c-SMAC) contains the TCR:CD3 complex, the
costimulatory molecule CD28 and the kinase Lck. In the outer ring or peripheral
supramolecular activation cluster (p-SMAC) there are high levels of the integrin leukocyte
function-associated antigen 1 (LFA-1), the p-SMAC thus provides anchoring of the T cell to
the APC 45. There is another ring of proteins formed outside of the p-SMAC, where proteins
such as CD43 and CD45 accumulate. These proteins are quite big and therefore stick out of
the plasma membrane which would make it impossible for the much smaller TCR to stay in
contact with the MHC molecule 45;50. Optimal T cell activation requires there to be a second
signal from co-stimulatory molecules in addition to TCR recognition of antigen. CD28 is a
potent co-stimulatory molecule and it binds to its ligands CD80 (B7-1) and CD86 (B7-2)
present on the cell surface of APCs 51. As mentioned before, CD28 co-localises with the TCR
within the c-SMAC, where together with the TCR signal it enhances the gathering of lipid
rafts as well as tyrosine phosphorylation of molecules involved in T-cell activation 51;52. The
actual signalling pathways used by both the TCR and CD28 have common characteristics and
this suggests that CD28 signalling can lower the threshold for T cell activation. Cytotoxic T
lymphocyte antigen-4 (CTLA-4) structurally resembles CD28 and also binds to CD80 and
CD86, but ligation of CTLA-4 leads to an inhibitory signal limiting T cell activation 51;52.
CTLA-4 is not normally expressed on the cell surface of a resting T cell, but its expression is
induced by T cell stimulation via the TCR; the one exception is on the surface of regulatory T
cells. CTLA-4 has a much higher affinity for binding to CD80 and CD86, thus making it
possible to inhibit further T cell activation as a result of TCR and CD28 signalling. Since
CD86 is constitutively expressed on the cell surface of APCs, whereas CD80 is induced upon

Chapter One Introduction 22
stimulation, it is thought that CD86 functions primarily as a ligand for CD28 and CD80 as a
ligand for CTLA-4. PD-1 (CD279) is another inhibitory protein related to CD28 and it is
expressed on activated T and B cells. The ligands for PD-1 are PD-L1 and PD-L2 and both
ligands have different expression patterns. PD-L2 expression can be induced on DCs and
monocytes, while PD-L1 expression is constitutive on T cells, APCs as well as on non-
hematopoietic cell types such as vascular endothelial cells 51.
Chapter One Introduction 23
1.8 CD4+ T cells
CD4+ T cells are classically described as helper T cells, since they provide several signals to
activate other immune cells. They promote isotype switching and somatic hypermutation in B
cells. They also induce B cell differentiation to plasma cells and memory cells in germinal
centres 53. Another role attributed to CD4+ T cells is helping naive CD8+ T cells to allow
differentiation into effector and memory cells 54-56. CD4+ T cells also provide help to
macrophages and APCs 53.
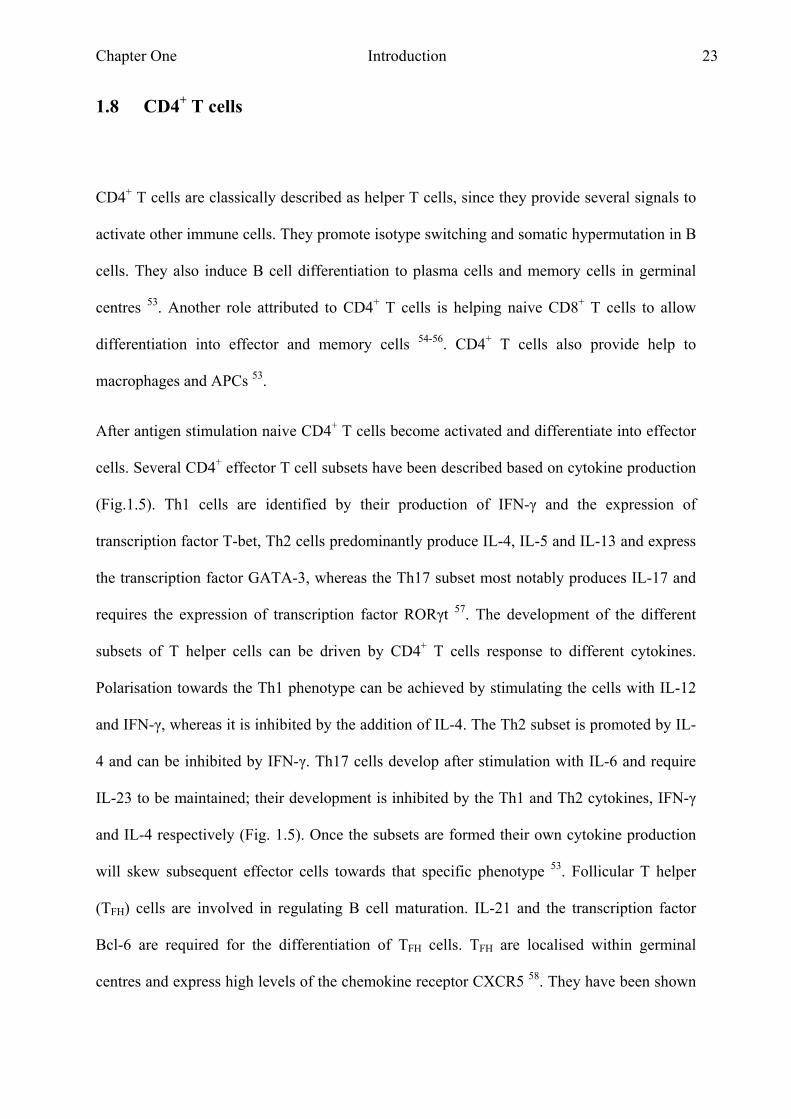
After antigen stimulation naive CD4+ T cells become activated and differentiate into effector
cells. Several CD4+ effector T cell subsets have been described based on cytokine production
(Fig.1.5). Th1 cells are identified by their production of IFN-γ and the expression of
transcription factor T-bet, Th2 cells predominantly produce IL-4, IL-5 and IL-13 and express
the transcription factor GATA-3, whereas the Th17 subset most notably produces IL-17 and
requires the expression of transcription factor RORγt 57. The development of the different
subsets of T helper cells can be driven by CD4+ T cells response to different cytokines.
Polarisation towards the Th1 phenotype can be achieved by stimulating the cells with IL-12
and IFN-γ, whereas it is inhibited by the addition of IL-4. The Th2 subset is promoted by IL-
4 and can be inhibited by IFN-γ. Th17 cells develop after stimulation with IL-6 and require
IL-23 to be maintained; their development is inhibited by the Th1 and Th2 cytokines, IFN-γ
and IL-4 respectively (Fig. 1.5). Once the subsets are formed their own cytokine production
will skew subsequent effector cells towards that specific phenotype 53. Follicular T helper
(TFH) cells are involved in regulating B cell maturation. IL-21 and the transcription factor
Bcl-6 are required for the differentiation of TFH cells. TFH are localised within germinal
centres and express high levels of the chemokine receptor CXCR5 58. They have been shown
Chapter One Introduction 24
to be able to produce the Th2 cytokine IL-4, which promotes isotype switching to IgG. IL-21
and IL-6 can induce TFH differentiation as well as Th17 differentiation, but TFH produce very
low levels of IL-17. It was shown that overexpression of Bcl-6 led to suppression of IL-17
production by non-polarised and Th17 polarised CD4+ T cells in vitro 58.
Regulatory T cells are another subset of CD4+ T cells which are involved in regulating the
effector responses of the T helper subsets and are thought to be important in controlling
autoimmunity, by their suppressive action on self-reactive T cells 59-61. Tregs are
characterised by the expression of the transcription factor Foxp3. There are two subsets of
Tregs which can be described, the naturally occurring Tregs (nTregs), which develop in the
thymus and express CD25 and the inducible Tregs (iTregs) which develop in the periphery
induced by TGF-β expression 57;59.
Chapter One Introduction 25
Figure 1.5. Model of CD4+ effector cell differentiation, based on the production of cytokines. A naive CD4+ T cell recognises its antigen and becomes activated, depending on the cytokines produced by the micorenvironment, it can give rise to one of five effector lineages.
As described above CD4+ T cell populations have not only been described based on their
cytokine production profiles, but also on the expression of cell surface markers. Frequently
used markers are the chemokine receptor CCR7, the costimulatory molecules CD27 and
CD28, CD62L and CD45RA 62-64. Amyes et al (2005) described the CD4+ T cell
compartment using CCR7, CD45RA and CD28 63. They described the eight possible
populations when using these three markers and looked at the relative numbers of cells in
each population and also analysed their cytokine production. Using CCR7 and CD45RA four
populations can be described, a naive population that is CCR7+CD45RA+, a central memory
population which is CCR7+CD45RA-, an effector memory population of CCR7-CD45RA-
cells and a terminally differentiated subset of cells which re-expresses CD45RA (CCR7-
CD45RA+, also called EMRA population). When adding in CD28 these four populations
Chapter One Introduction 26
were further subdivided into either CD28+ or CD28- cells. The authors found that the naive
and central memory populations consisted of mostly CD28+ cells. When analysing the
cytokine production of these populations, it was found that the naive and central memory
cells could produce cytokines but did this to a limited extent compared to the effector
memory and EMRA populations. Naive and central memory cells preferrentially expressed
IL-2 and TNF-α, while effector memory cells were more likely to produce IFN-γ than the
EMRA population.
The study by Amyes et al (2005) and other studies have described CD4+ T cell populations
based on different strategies, either looking at cytokine production or expression of cell
surface markers 63. These studies have resulted in the description of various CD4+ T cell
populations, such as Th1, Th2, CM and EM.
1.9 CD8+ T cells
CD8+ T cells are important mediators in protection against virally infected cells, tumour cells
and other damaged cells. Most CD8+ T cells are cytotoxic, capable of directly killing the
target cell and producing cytokines, some are found to have regulatory functions 65;66;67. As
mentioned above the CD8+ T cell compartment can be divided into four T cell populations
based on the expression of CCR7 and CD45RA (Sallusto et al 1999), however as was the
case in the CD4+ compartment other markers can be used to describe CD8+ T cell populations
68;69.
Chapter One Introduction 27
Hamann et al (1997) describe that using an array of surface molecules, including CD45RA,
CD27 and CD28; they were able to find three CD8+ T cell populations, a naive
(CD45RA+CD27+CD28+), a memory (CD45RA-CD27+CD28+) and an effector subset
(CD45RA+CD27-CD28-) 68. The naive subset expressed high levels of CD62L, whereas the
effector subset downregulated CD62L expression. The three cell populations also differed in
their ability to produce cytokines, with the naive population producing the narrowest
repertoire of cytokines. Appay et al (2002) also describe three populations of CD8+ T cells
using only CD27 and CD28 as markers, an early population of CD27+CD28+, a late
population of CD27+CD28- cells and an intermediate population of CD27-CD28- cells 69;70.
They suggest that these three subsets overlap with the CM, EM and EMRA populations
respectively.
A subpopulation of CD8+ Treg cells has been described using a mouse model 65;71, this Treg
was capable of binding to Qa-1 (HLA-E in humans) on B cells which resulted in the
suppressive activity of CD8+ T cells; CD4+ T cells were subsequently inhibited in their
response. There are no good surface markers to distinguish CD8+ Tregs from effector CD8+ T
cells, however CD28 expression has been implicated with CD8+ Tregs. It was shown that
depletion of CD8+ T cells from CD28 deficient mice resulted in experimental autoimmune
encephalomyelitis (EAE), adoptive transfer of CD8+CD28- T cells into CD8 knockout mice
resulted in disease suppression 72. The CD8+ Treg which is based on Qa-1 recognition
suppresses EAE development 65. The exact mechanisms through which CD8+ Tregs work or
are induced are not known.
Chapter One Introduction 28
1.10 Tetraspanins
Tetraspanins are a family of membrane spanning proteins, consisting of 33 family members
in humans and mice 73;74. Tetraspanins can be found in a wide range of multicellular
organisms, such as plants, schistosomes and Drosophila melanogaster 75. Drosophila
melanogaster has 36 known tetraspanins, whereas Schistosoma has 25 76. Unicellular fungi
do not express tetraspanins, compared to multicellular fungi which do express tetraspanins.
The presence of tetraspanins in such a wide range of organisms suggests that they play a very
fundamental role in the organisation of the cell membrane. Mammalian tetraspanins consist
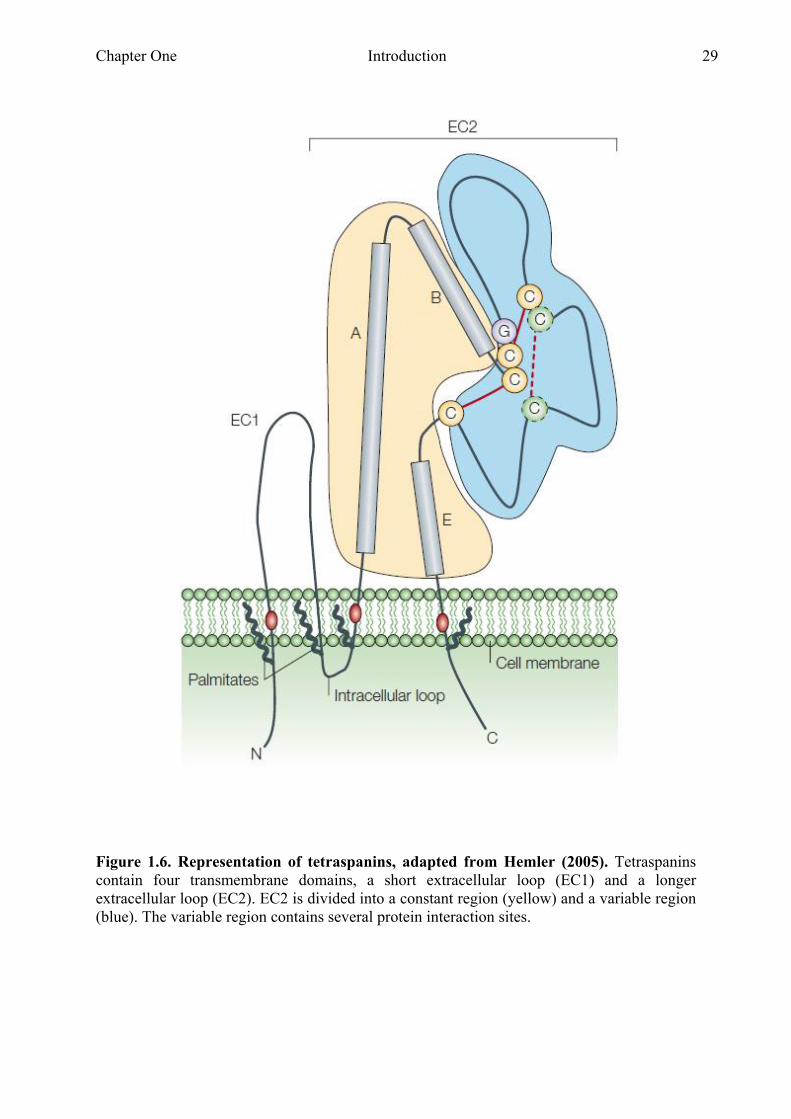
of four transmembrane domains, a small and a large extracellular loop and two short
intracellular amino and carboxyl tails (Fig.1.6). The large extracellular loop (EC2) consists of
a constant region, containing three α-helices (A, B and E) and a variable region. The variable
region contains most of the known tetraspanin protein-protein interaction sites 77.
Many tetraspanins are postranslationally modified by the addition of palmitate to the cysteine
residues closest to the membrane. This addition of palmitate allows the formation of
tetraspanin-enriched microdomains (TEMs) at the cell surface. Tetraspanins have been
implicated in having a role in many biological functions, such as cell activation, membrane
fusion, adhesion, differentiation and metastasis 78-82.
Several tetraspanins have been shown to have a widespread expression, such as CD81 on
almost all cell types and CD151 on epithelial, endothelial and fibroblastic cells. Other
tetraspanins such as CD37 have been shown to have a narrower expression pattern only on
lymphocytes. Tetraspanins are thought to be involved in many cellular processes as master
organisers of the cell membrane, through the formation of TEMs 77.
Chapter One Introduction 29
Figure 1.6. Representation of tetraspanins, adapted from Hemler (2005). Tetraspanins contain four transmembrane domains, a short extracellular loop (EC1) and a longer extracellular loop (EC2). EC2 is divided into a constant region (yellow) and a variable region (blue). The variable region contains several protein interaction sites.
Chapter One Introduction 30
The tetraspanin CD9 has been described to be involved in membrane fusion, metastasis
suppression and sperm-egg fusion 80;81;83 and CD81 in cell migration, hepatitis C infection
and also membrane fusion 80;84-86. CD63 is highly expressed on late endosomes and exosomes
78. It has been suggested that there are several levels of interaction which can occur in the
‘tetraspanin web’ 76;87. It was shown that when using different detergents to extract
tetraspanin complexes direct or first level interactions can be revealed by using stronger
detergents, whereas using more gentle detergents results in identifying second level
interactions 81;87. The first level interactions are quite rare and these include tetraspanin
homodimers and homotrimers as well as heterointeractions between tetraspanins. The second
level interactions are mostly between tetraspanins and integrins. Yanez-Mo et al (2008)
showed direct association of CD9 with ICAM-1 as well as recruitment of VCAM-1 into
TEMs by its association with CD151 87;88. CD151 is also described to associate with α3β1
and α6β4 and by doing so is involved in regulating integrin-dependent cell morphology,
migration and adhesion 89.
As mentioned above CD9 has been implicated in several cellular reactions and several
binding partners for CD9 have been described. Among these are several integrins, proteins of
the EWI family and the epidermal growth factor receptor (EGFR) 90. Miyado et al (2000)
generated a CD9-/- mouse and found that male and female CD9-/- mice were born healthy and
showed no developmental differences with their wild type controls 91. They did, however,
find that CD9-/- females produced smaller litter sizes (less than 2%) than the wild type
females did. No difference was found between the CD9-/- males, as well as no difference
could be found in the frequency of copulation vaginal plugs between CD9-/- and wild type
females. The knockout females also showed no histochemical changes compared to the wild
type females and when treated with hormones, no difference in ovulation could be found.
Chapter One Introduction 31
They then isolated oocytes from both wild type and knockout females and applied in vitro
fertilisation with wild type sperm. Analysing the cells 6 hours after insemination revealed that
for both the wild type and the knockout cells the sperm had penetrated the zona pellucida of
the eggs. A difference in the ability of the CD9-/- eggs to fuse with the sperm and from
pronuclei was found, since almost all of these eggs failed to fuse with sperm 91. Recently
Jégou et al (2011) suggested that CD9 could be providing adhesion sites where fusion of
sperm and egg will take place 92.
CD9 and CD81 seem to be very closely related in several of their functions, as exhibited by
the exacerbation of the phenotype of CD9 and CD81 double knockout mice compared to the
respective single knock outs 93. CD9 and CD81 double knockout mice were found to
spontaneously develop pulmonary emphysema and as the mice aged, symptoms outside of
the pulmonary tract could be identified, such as weight loss and osteopenia. Takeda et al
(2008) show that CD9 and CD81 expression is reduced in the macrophage cell line
RAW264.7 after smoking-related stimuli. Since smoking reduces the expression as well as
the activity of histone deacetylases (HDACs) in the macrophages of chronic obstructive
pulmonary (COPD) patients, they analysed the effect of HDACs on the expression of both
CD9 and CD81 in RAW264.7 cells. Using the HDAC inhibitor TSA they found that protein
levels for both CD9 and CD81 were lower after treatment with TSA. An increase in matrix
metalloproteinase production in macrophages of COPD patients is involved in the pathology
seen in these patients and Takeda et al found that the downregulation of CD9 and CD81 by
TSA correlated with the upregulation of MMP-2 and MMP-9. They further supported this
finding by using specific siRNA’s for CD9 or CD81, which led to a similar increase in MMP
production. They analysed the phenotype of CD9/CD81 double knockout mice and found that
these mice developed pulmonary emphysema and showed signs of alveolar destruction and
Chapter One Introduction 32
remodelling. More inflammatory cells could be isolated out of the lungs from the double
knockouts and there was a higher activity of MMPs found in these lungs. Macrophages from
the double knockout mice showed impaired motility compared to those from wild type mice.
CD63 has been described as a marker for exosomes, these vesicles can be formed when
endosomes fuse with the plasma membrane and release their contents into the extracellular
space 94. Recent data suggests that exosomes are not just a way for cells to rid themselves of
unwanted contents, but that exosomes are important for intercellular communication, cellular
adhesion and migration. Koumangoye et al showed that the detachment of cells to their
surroundings induces the release of CD63 positive exosomes 94. A vector encoding a GFP-
tagged CD63 was transfected into a human breast cancer cell line (BT-549) and the uptake
and release of CD63 positive exosomes was analysed. Firstly cells which were kept in a cell
suspension were found to release 5 to 6 times more exosomes compared to cells which were
kept in an adherent culture for 16 hours. They then analysed the effect of detaching the cells
from the culture dishes, by adding ethylenediaminetetraacetic acid (EDTA) to the culture. The
addition of EDTA to the cells results in contraction of the cells followed by the release of
CD63-GFP positive exosomes, seen under the microscope as green vesicles projecting out of
the plasma membranes of the cells 94. Exosomes are also described to express MHC
molecules as well as some co-stimulatory molecules, such as CD86. CD63 is expressed on
endosomes positive for MHC-II and it could be involved in regulating peptide loading of
MHC-II 95. Petersen et al (2011) knocked down CD63 expression in both the Epstein-Barr
virus (EBV) transformed B lymphoblastoid cell line and the HeLa-CIITA (Class II major
histocompatibility complex transactivator) cervical cancer cell line. Surprisingly they found
that loading both CD63 deficient cell lines with EBV synthetic peptides resulted in better T
cell recognition of the peptide compared to the control cells. They then analysed the effect of
Chapter One Introduction 33
CD63 deficiency on the surface expression of MHC-II peptide complexes and found that this
was not affected. They concluded that CD63 may very well be involved in the trafficking and
fusion of endosomes as well as exosomes, but not in the formation of these vesicles, since
they can still form in the absence of CD63 95.
CD81 has been described in both B and T cell activation. It associates with the B cell
signalling complex consisting of CD19, CD21 and Leu-13. CD19 expression has been shown
to be reduced in CD81 deficient B cells. Shoham et al (2003) show that this reduction in
CD19 expression is especially pronounced on CD81-/- small pre-BII cells 96. The CD81-/-
small pre-BIII cells did express mRNA for CD19 at levels which were similar to those
expressed in wild type cells, this suggests that CD81 may be regulating normal cell surface
expression of CD19. The CD19 defect could be rescued by transfecting human CD81 back
into the CD81-/- cells, restoring CD19 surface expression back to wild type levels. CD81
binding to CD19 is thought to lower the threshold for B cell activation by linking two
processes on the cell surface of the B cell; namely antigen recognition and CD21 mediated
complement activation 79. Boismenu et al described a role for CD81 in T cell development in
the thymus 97. Using a monoclonal antibody which was generated against a, at that time still
unknown, surface marker of the PAM 212 epithelial cell line, they found that addition of this
antibody led to halted T cell development in fetal thymus organ cultures. The ligand for this
monoclonal antibody was found to be CD81. In the fetal thymus organ cultures no
development of CD4+CD8+ TCR thymocytes could be found 97. After 7 days of cell
culture in the presence of either medium alone or a control monoclonal antibody 80%
CD4+CD8+ cells could be found in the culture. This compared to 0.5% of CD4+CD8+ cells
found when the cells were cultured in the presence of the anti-CD81 antibody. No effect was
Chapter One Introduction 34
found on the development of T cells. Todd et al (1996) analysed CD81 expression on
thymocytes and found that it was expressed at all stages of thymocyte development. Using
co-immunoprecipitation, they found that CD81 on thymocytes was strongly associated with
both CD4 and CD8, but more weakly associated with CD3 98. When CD81 was ligated on
these cells by the addition of an antibody against CD81, this resulted in cell adhesion and cell
aggregation. This cellular adhesion and aggregation could be blocked by antibodies against
both LFA-1 and ICAM-1. The upregulated cellular adhesion and aggregation is thought to aid
in T cell-APC contact; strengthening the contact between the two cells will enhance the
ability for the APC to stimulate the T cell 98.
CD151 expression can be found on epithelial cells and muscle cells, as well as on platelets 75.
In endothelial cells CD151 is found in the cell-cell junctions. CD151 is also the tetraspanin
with the most pronounced interaction with laminin binding integrins, such as 31 and 61
99. Interactions between CD151 and laminin binding integrins are necessary to recruit these
integrins into TEMs 100. Through these interactions with integrins CD151 is thought to
regulate cell motility and adhesion 101. Wright et al (2004) were the first to generate and
describe the phenotype of a CD151-/- mouse 102. Analysing the blood and bone marrow
compartments of these mice, Wright et al found that compared to wild type mice a significant
increase of immature myeloid cells could be found in the bone marrow. This increase of
immature myeloid cells corresponded with a decrease in the number of lymphocytes.
Histological analysis of tissues from the mice showed that there was no significant difference
between tissues from wild type mice and those from the CD151-/- mice. Absence of CD151
also did not seem to result in reduced expression of the 3, 6, 1 and 4 integrin chains on
the cell surface. A difference in the ability of CD151-/- keratinocytes to migrate was seen,

Chapter One Introduction 35
however these cells had the same proliferative capacity as their wild type counterparts. Based
on tail bleeding experiments these mice were found to display abnormal hemostasis, signified
by longer bleeding times of the tails, as well as the amount of blood lost during the tail
bleeding time. They concluded that this bleeding effect indicates an underlying defect in
endothelium and/or platelet function 102.
Chapter One Introduction 36
1.11 Transcriptome analysis
DNA microarrays provide a useful strategy to analyse the gene expression of cells.
Microarrays allow the analysis of thousands of genes or even the whole genome at the same
time. This results in microarray analysis producing large data sets and it is therefore
important to utilise appropriate statistical analysis to be able to draw any conclusions 103.
Depending on the aims of the study microarray analysis can be sorted into three groups,
namely class comparison, class discovery and class prediction. Class comparison studies try
to identify genes that are differentially expressed between two or more groups; this can be
used when wanting to compare two cell types to each other. Class discovery tries to classify
groups using the samples or genes examined; one can envisage using this when analysing
samples from patients who have yet to be diagnosed. Class prediction tries to predict whether
a sample belongs to a certain group, by comparing gene expression profiles 104.
Several groups have used microarrays to try and delineate different cell populations in
humans. Most groups have sorted cells based on the expression of surface markers and
subsequently taken the mRNA of these sorted cells and used this to analyse on an array.
Holmes et al (2005) used microarray analysis to investigate the relationship between naive,
effector and memory CD8+ T cells 105. They sorted these three populations based on CD27
and CD45RA expression and analysed the samples on arrays. Identification of genes which
were differentially expressed between the populations found that memory cells show gene
expression patterns intermediate between naive and effector T cells. Du et al (2006) used
microarray analysis to compare gene expression between CD4+ T cells, CD8+ T cells, CD19+
B cells, CD56+ natural killer (NK) cells and CD14+ monocytes. They also selected a number
Chapter One Introduction 37
of genes that have previously been reported to be involved in ischemic stroke, Tourette
syndrome and migraine and used these genes to analyse if cell specific expression of these
genes could be found 106. They concluded that most blood cells express a similar pattern of
genes but that there are also genes which seem specific to a certain cell type. Palmer et al
(2006) also looked at cell type specific gene expression in blood cells. They compared B
cells, CD4+ T cells, CD8+ T cells, granulocytes and lymphocytes on microarrays containing
18,000 human genes 107. Their analysis showed that differentially expressed genes could be
found when comparing the different populations to each other, resulting in gene expression
signatures for each cell type. Haining et al (2008) identified an evolutionary conserved gene
expression pattern for CD8+ memory differentiation which was shared by B cells. The gene
expression of CD4+ and CD8+ naive and memory T cell populations in human and mouse
were analysed 108. Comparing the results from these analyses resulted in a list of genes which
were conserved in mouse and human memory T cell differentiation. When comparing this
conserved gene list to the gene expression of human B cells it was found that the expression
of these genes were also conserved in B cells. These studies show that microarray analysis is
a useful strategy to utilise when trying to identify differences between cell populations sorted
based on expression of surface markers.
Quantitative Real Time polymerase chain reaction (PCR) is a more accurate way of utilising
PCR analysis to quantify the expression level of a certain gene in a sample. The addition of
fluorescent probes to Real Time PCR allows accurate measurement of a fluorescent signal
during the PCR reaction, hence the addition Real Time 109. Real Time PCR has been used to
validate gene expression results obtained from microarray analysis because it allows the
researcher to focus on several specific genes without the costs associated with microarray
analysis. Wang et al (2008) used Real Time PCR to validate their microarray results, when
Chapter One Introduction 38
comparing the gene expression levels of the bulk CD3 population to the bulk CD4+ and CD8+
T cell populations. They found that the Real Time PCR data corresponded very well with the
microarray data 110. Chtanova et al (2001) validated the gene expression results from their
microarray experiment through Real Time PCR as well and the data from the Real Time PCR
corresponded with the data from the microarrays 111. To this date Real Time PCR remains the
gold standard for validating microarray results 109;112.
1.12 AIMS
The separation of T cell populations based on cell surface marker expression is a relatively
blunt tool. We therefore formed the working hypothesis that microarray analysis of purified
populations of human blood cell populations will further extend our understanding of T cell
subsets and provide novel targets to control immune responses.
The main aim of this study was to examine lineage relationships between human CD4+ and
CD8+ T cell populations. To address this specifically:
(a) The gene expression patterns of T cell populations based on the cell surface markers
CCR7 and CD45RA will be examined by microarray to identify genes shared between
the CD4+ and CD8+ T cell compartments as well as genes which are unique;
(b) The microarray analysis will be validated by Real Time PCR;
(c) The role of genes of interest in CD4+ and CD8+ T cells will be examined.

Chapter Two Material and Methods 39
Chapter Two
Material and Methods
Chapter Two Material and Methods 40
2 MATERIAL AND METHODS
2.1 Peripheral blood
Samples from peripheral venous blood from healthy controls were collected with
informed consent, into a 50 ml Falcon tube with Heparin (CD Pharmaceutical Ltd).
2.1.1 Cell isolation
Peripheral Blood Mononuclear Cells (PBMC) were isolated from fresh, heparinised,
venous blood from healthy controls using ficoll (GE Healthcare) density
centrifugation. Peripheral blood was diluted 1:1 in RPMI-1640 (Sigma) 1% GPS
(Sigma, 2 mM Glutamine, 100 u/ml penicillin, 100 µg/ml streptomycin), 1% HEPES
(Sigma) and 10 ml were layered onto 15 ml of ficoll and centrifuged at 320 g for 30
minutes at 20ºC. The resulting buffy layer of mononuclear cells was removed by
Pasteur pipette and washed 3 times in RPMI-1640 1% GPS, 1% HEPES. The cells
were then counted on a haemocytometer and used in staining for flow cytometry.

Chapter Two Material and Methods 41
2.2.1 Antibody Dilutions for flow cytometry
CD3 FITC 1:20 Immunotools
CD3 PE 1:20 Immunotools
CD4 PECy7 1:10 BD Pharmingen
CD8β PECy5 1:20 Beckman Coulter
CD8α FITC 1:20 Immunotools
CD8α PE 1:20 Immunotools
CD9 PE 1:20 Biolegend
CD14 PE 1:50 Immunotools (dilution used for sorts)
CD14 PE 1:100 Immunotools (dilution used for FACS)
CD14 PECy5 1:100 Immunotools
CD27 FITC 1:20 BD Pharmingen
CD37 PE 1:20 ImmunoTools
CD45RA ECD 1:80 Beckman Coulter
CD53 PE 1:20 BD Pharmingen
CD63 PE 1:20 Biolegend
CD62L PE 1:50 BD Biosciences
CD69 FITC 1:10 Beckton Dickinson
CD81 PE 1:20 BD Pharmingen
CD82 PE 1:20 Biolegend
CD151 PE 1:20 BD Pharmingen
CCR7 FITC 1:10 R&D systems
TCR γ/δ 1:20 BD Biosciences
IgG1 FITC 1:20 Dakocytomation
Chapter Two Material and Methods 42
IgG1 PE 1:20 BD Biosciences
IgG2a PECy5 1:20 Immunotools
IgG2a PE 1:20 eBioscience
2.2.2 Flow cytometry
PBMC were used for flow cytometry, 2 x 10⁵ cells were seeded per tube in 5 ml
polypropylene tubes (Falcon 352063). The tubes were spun for 3 min at 320 g at 4 ºC,
after which the supernatant was discarded and the tubes were briefly vortexed to
resuspend the cells. Subsequently 50 µl of antibody dilution was added and the cells
were incubated on ice for 20 minutes. The cells were then washed twice, by adding
500 µl of PBS (Sigma) 2% BSA (Sigma) and centrifuging the tubes for 4 minutes at
320 g and 4 ºC. Finally the cells were taken up in 400 µl of PBS 2% BSA and run
through the flow cytometer, Beckman Coulter, Cyan.
2.2.3 Flow cytometry intracellular cytokine staining of stimulated
CD4+ and CD8+ T cell populations
PBMCs where isolated from whole blood as described above, the cells were plated in
a 96 well flexiplate at 1x10⁶ cells/well in 50 µl culture media. The cells were then
stimulated with PMA (500 ng/ml) and Ionomycin (500ng/ml) and Brefeldin A (2
µg/ml) was added to the wells after which the cells were cultured for 3 hours at 37°C.
Chapter Two Material and Methods 43
The cells were subsequently stained for the relevant antibodies for the surface markers
CD3, CD4, CD8, CCR7 and CD45RO and incubated on ice for 20 minutes, after
which the cells were fixed and permeabilised using the FIX & PERM® cell fixation
kit from Invitrogen. The cells were subsequently stained for the relevant antibodies
for the intracellular markers IFN-γ, IL-17 and IL-22 and incubated on ice for 20
minutes in the dark. The cells were subsequently washed and taken up in 400 µl of
PBS 2% BSA and run through the flow cytometer, Beckman Coulter, Cyan.
2.2.4 FACS sorting of CD8+ CCR7/CD45RA populations
120 ml of blood was collected from a healthy control and PBMC were isolated as
previously described. Compensation between two colours used in the staining was
achieved by staining 2 x 10⁵ cells with single antibodies. The cells for the population
sort were stained with an antibody cocktail of CD8β PECy5, CD45RA ECD and
CCR7 FITC in a volume of 1 ml. The cells were stained for 20 minutes on ice, after
which they were washed and filtered through a 50 µm filter (CellTrics®) and put into
5 ml polypropylene tubes (Falcon 352063). The cells were sorted on the Mo-Flo
MultiLaser flow cytometer (DakoCytomation), after being gated on forward and side
scatter profiles to include only live lymphocytes, and on cell surface marker
combinations to select the cell populations of interest. These populations included
only CD8β+ cells and were based on expression of CCR7 and/or CD45RA,
CCR7+CD45RA+ (Naive), CCR7-CD45RA+ (Effector Memory RA), CCR7-CD45-
(Effector Memory) and CCR7+CD45RA- (Central Memory).

Chapter Two Material and Methods 44
2.2.5 FACS sorting of CD4+ CCR7/CD45RA populations
120 ml of blood was collected from a healthy control and PBMC were isolated as
previously described. Compensation between two colours used in the staining was
achieved by staining 2 x 10⁵ cells with single antibodies. The cells for the population
sort were stained with an antibody cocktail of CD4 PECy7, CD14PE, CD45RA ECD
and CCR7 FITC in a volume of 1 ml. The cells were stained for 20 minutes on ice,
after which they were washed and filtered through a 50 µm filter (CellTrics®) and put
into 5 ml polypropylene tubes (Falcon 352063). The cells were sorted on the Mo-Flo
MultiLaser flow cytometer (DakoCytomation), after being gated on forward and side
scatter profiles to include only live lymphocytes, and on cell surface marker
combinations to select the cell populations of interest. These populations included
CD4+CD14- cells and were based on expression of CCR7 and/or CD45RA,
CCR7+CD45RA+ (Naïve), CCR7-CD45RA+ (Effector Memory RA), CCR7-CD45-
(Effector memory) and CCR7+CD45RA- (Central memory).
2.2.6 Sorting CD9 subsets from CD4+ T cells
120 ml of blood was collected from a healthy control and PBMC were isolated as
previously described. Compensation between two colours used in the staining was
achieved by staining 2 x 10⁵ cells with single antibodies. The cells for the population
sort were stained with an antibody cocktail of CD4 PECy7, CD9PE, CD45RA ECD
and CCR7 FITC in a volume of 1 ml. The cells were stained for 20 minutes on ice,
after which they were washed and filtered through a 50 µm filter (CellTrics®) and put
Chapter Two Material and Methods 45
into 5 ml polypropylene tubes (Falcon 352063). The cells were sorted on the Mo-Flo
MultiLaser flow cytometer (DakoCytomation), after being gated on forward and side
scatter profiles to include only live lymphocytes, and on cell surface marker
combinations to select the cell populations of interest. The sorted populations were
CD9-CCR7+CD45RA- central memory T cells and CD9-CCR7-CD45- effector
memory T cells.
2.3 RNA extraction
Samples were lysed using 350 µl of lysis buffer (Qiagen, RNeasy® RLT buffer) and
were frozen down at -80 ºC, for at least a day. The samples were then defrosted at
room temperature and 350 µl of 70% Ethanol was added and mixed in. This mix was
then applied to a filter cartridge and spun for 1 minute at 11000 g. The filter was then
washed with 700 µl of buffer RW1 (Qiagen, RNeasy®) and spun for 1 minute at
11000 g. The filter was washed again with 500 µl of buffer RPE (Qiagen, RNeasy®)
and spun for 1 minute at 11000 g after which a final wash was done using 500 µl of
buffer RPE (Qiagen, RNeasy®). The sample was then spun for 2 minutes at 11000 g,
after which the filter cartridge was transferred to a clean eppendorf. 35 µl of H20 was
added to the filter and which was subsequently spun for 1 minute at 11000 g. The
RNA was then used in a DNase I kit (Ambion) treatment to remove any
contaminating DNA.
Chapter Two Material and Methods 46
2.3.1 DNase I treatment
3.5 l of 10x DNase I buffer and 1 l of DNase I were added to the RNA samples and
the samples were incubated at 37 C for 30 minutes. Following this, 5 l of DNase
inactivation reagent was added and samples were incubated at room temperature for 2
minutes, before being centrifuged for 1 minute at 11000 g. The supernatant containing
the RNA was transferred into a fresh tube. The yield of RNA was quantitated using a
spectrophotometer (Eppendorf Biophotometer, Helena Biosciences) at a wavelength
of 260 nm. Isolated RNA was stored in DEPC treated water at -20C until needed.
2.3.2 Reverse transcription
cDNA was reverse transcribed from the isolated RNA samples using the cDNA
synthesis kit Superscript VILO® (Invitrogen). The equivalent amount of RNA to
1x10⁵ cells was used in the reaction, together with 4 l 5x VILO® Reaction Mix, 10x
Superscript® Enzyme Mix and DEPC treated water to make up the reaction volume to
20 l. Samples were kept at 25C for 10 minutes, 2 hrs at 42C and 5 minutes at
85C. The resulting cDNA was then PCR purified and used for microarray analysis or
Real Time PCR.
Chapter Two Material and Methods 47
2.3.3 PCR product purification
After reverse transcription the cDNA was purified using NuceleoSpin® Extract II
(Macherey-Nagel). First the cDNA was bound to the column by mixing 1 volume of
sample with 2 volumes of Buffer NT and spinning the sample for 1 minute at 11000
g. The silica membrane was then washed by adding 700 µl of Buffer NT3 and
spinning for 1 minute at 11000 g. The membrane was dried by a subsequent spin of 2
minutes at 11000 g, after which the cDNA was eluted in 50 µl DEPC H2O by
spinning for 1 minute at 11000 g. The eluted cDNA was then quantitated with a
spectrophotometer (Eppendorf Biophotometer) at 260 nm and tested for purity via
electrophoresis gel and stored at -200C.
2.4 Real Time PCR
Gene expression profiles of purified total RNA from sorted cell populations were
analysed using TaqMan Low Density Arrays (www.appliedbiosystems.com). A
working solution was prepared per sample; this consisted of 50 μl cDNA (equivalent
to 1x10⁵ cells) and 50 μl Taqman Gene Expression Master Mix. Approximately 95 μl
of each sample’s working solution was then pipetted into two ports of the card. The
cards were then centrifuged twice at 300g for 1 minute to allow adequate distribution
of the sample over the probes. The plate was then sealed and the ports cut off. The
Applied Biosystems 7900HT Fast Real-Time PCR System was used to perform the
real time-PCR with the following cycle conditions: 50°C for 2 minutes, 94.5°C for 10
minutes and then 45 cycles of 97°C for 30 seconds and 59.7°C for 1 minute.
Chapter Two Material and Methods 48
Data was analysed using SDS 2.2 (Applied Biosystems). Relative quantification of
signal per gene was achieved by setting thresholds within the logarithmic phase of the
PCR for the control gene and the target gene. The cycle number (Ct) at which the
threshold was reached was then determined. The Ct for the target gene was subtracted
from the Ct for the control gene and the relative quantity was calculated as 2-ΔCT.
2.5 Microarray spotting
The probes used for the arrays were Operon Human Genome Array-Ready Oligo
Set™ V4.0 (AROS) and were spotted by the Liverpool microarray facility, University
of Liverpool. The oligos were spotted using a TAS microgrid II robot (BioRobotics).
AROS contains 35,035 oligonucleotide probes, representing approximately 25,100
unique genes and 39,600 transcripts excluding control oligos.
2.5.1 CyDye labelling
cDNA samples were labelled with Cy3-dCTP and Cy5-dCTP prior to hybridization.
500 ng of sample cDNA was added to 20 l of random primer mix from the Bioprime
Labelling Kit (Invitrogen) and the volume was made up to 43 l with de-ionised
water. The mix was heated to 94 C for 5 minutes and then cooled on ice before
adding 1.2 l (10 mM) dATP, 1.2 l (10 mM) dTTP, 1.2 l (10 mM) dGTP, 0.72 l
(10 mM) dCTP, 0.68 l de-ionised water, 1 l of either Cy3 dCTP or Cy5 dCTP
(Amersham Biosciences), and 1 l (40 U/l) Klenow enzyme (from the Bioprime

Chapter Two Material and Methods 49
Labelling Kit, Invitrogen). The reaction was kept at 37C for 2 hours before labelled
cDNA was purified using the NuceleoSpin® Extract II. Labelled cDNA was eluted in
70 l de-ionised water instead of using the elution buffer supplied. The quantity of
labelled product was determined using a spectrophotometer (Pharmacia Biotech
Ultrospec 2100 pro) at a wavelength of either 550nm (Cy3-dCTP) or 650nm (Cy5-
dCTP). The picomole (pmol) yield was calculated as follows:
Cy3 = Abs550 x dilution factor /0.15
Cy5 = Abs 650 x dilution factor /0.25
Labelled cDNA was stored in the absence of light at 4C until hybridisation, which
was performed later on the same day.
2.5.2 Hybridisation
The microarrays were pre-hybridised to GAPS II coated slides (Corning) for 2 hours
at 42 C. Pre-hybridisation solution consisted of 12.5 ml of formamide (Sigma), 12.5
ml of 20 x SSC, 0.25 ml of 20% SDS and 50 l of 100 mg/l Fraction V BSA
(Sigma), made up to a volume of 50 ml with de-ionised water. Equal quantities (100
pmol) of labelled cDNA from the test and reference samples were added together and
concentrated using a Microcon YM-30 concentration column (Millipore). The column
was centrifuged for 10 minutes, inverted into a fresh tube and the concentrate was
eluted in a final volume of 30 l of de-ionised water. The hybridisation mix was made
up using the instructions provided with the GAPS II coated slides and contained 20 l
Chapter Two Material and Methods 50
of formamide, 20 l of 20 x SSC, 0.4 l of 20% SDS, 2.5 l (2 mg/ml) of PolyA
DNA (Invitrogen) and 4 l (2 mg/ml) of Cot1 DNA (Invitrogen). This was added to
30 l of labelled cDNA and the volume was made up to 80 l with de-ionised water.
The solution was then denatured at 95 C for 5 minutes and kept on ice.
Pre-hybridised slides were dipped in de-ionised water and then ethanol, centrifuged
until dry and placed into a hybridisation chamber (Corning), which had been prepared
by using 10 l of de-ionised water to moisten the seal. The hybridization mix was
added to the surface of the slides and a Lifter Slip (VWR International) was applied.
The hybridisation chamber was then sealed, wrapped in a dampened paper towel and
foil and kept in a hybridisation oven for 16-20 hours at 42 C. After hybridisation, the
Lifter Slip was removed by immersing the slide in a solution of 2 x SSC (0.3M
sodium citrate + 3M NaCl, pH 7.0) + 0.1% SDS at 42 C. The slides were then
washed for 2 minutes at 42 C in 2 x SSC + 0.1% SDS and for 2 minutes at room
temperature in 0.2 x SSC. This was followed by 4 washes of 2 minutes at room
temperature in 0.05 x SSC, before the slides were dipped into de-ionised water,
followed by ethanol, and then centrifuged until dry. After hybridization, the arrays
were scanned using a Perkin Elmer Scanarray Gx Plus scanner and Scanarray express.
2.5.3 Microarray data analysis
Slide scans were processed first using Scanarray express. A prepared (and thoroughly
checked) GAL file was used to interpret the slide image and the intensity data was
extracted. This was then exported as a gpr file. The resulting files were then uploaded

Chapter Two Material and Methods 51
into the Gene Expression Pattern Analysis Suite v2.0 (GEPAS) analysis software
(http://gepas.bioinfo.cipf.es/) for normalisation. Normalisation was performed using
print-tip normalisation with background subtraction. This was performed first within
slide, and then between slide. Data for the normalised data was then exported to TIGR
Multiexperiment Viewer (TMEV), which allowed the data to be analysed by SAM
analysis, hierarchical clustering and PCA.
2.5.4 Statistical tests
For analysis of the sorted T cell populations supervised statistical tests were used,
SAM (Significance Analysis of Microarrays). SAM is a supervised statistical test.
The test results in a list of genes significantly different between the samples and the
samples were then clustered together based on gene expression profiles, using
hierarchical clustering (HCL). Hierarchical clustering analysis clusters genes or
samples together based on similar expression profiles. An HCL could then be
visualised using Principal Component Analysis.
Statistical analysis of flow cytometry data was carried out using GraphPad Prism
computer software (GraphPad Software, Inc., San Diego, CA) and performing a t-test.

Chapter Three Results 52
Chapter Three
Examining Gene Expression Profiles of CD4+ and
CD8+ T Cell Populations During Differentiation

Chapter Three Results 53
3 EXAMINING GENE EXPRESSION PROFILES OF CD4+ AND CD8+ T CELL POPULATIONS DURING DIFFERENTIATION
3.1 Introduction
After recognizing antigen presented on mature dendritic cells naive T cells undergo clonal
expansion and differentiate into effector cells. CD8+ T cells differentiate into cells capable of
producing IFN-γ, TNF-α and several chemokines as well as directly killing their target cells.
CD4+ T cells can differentiate into several subsets of T helper cells (Th) Th1, Th2, Th17 and
regulatory T cells (T regs) 57;113. CD4+ and CD8+ T cell populations have been described
based on their cytokine production profiles (T helper subsets) and on the expression of cell
surface markers. Based on the expression of CCR7 and CD45RA the CD4+ and CD8+ T cell
compartments can be divided into a double positive naive population (CCR7+CD45RA+), a
single positive central memory population (CCR7+CD45RA-), a double negative effector
memory population (CCR7-CD45RA-) and a single positive effector memory RA population
terminally differentiated cells (CCR7-CD45RA+) 43.
Other frequently used markers are the costimulatory molecules CD27 and CD28, CD62L and
CD45RA. Using these markers several populations also designated naive, central memory
and effector memory populations can be described 62-64.
Several groups have used microarrays to delineate different cell populations in humans. Most
groups have sorted cells based on the expression of surface markers and subsequently reverse
transcribed the mRNA of these sorted cells to cDNA for use in an array. Holmes et al (2005)
used microarray analysis to investigate the relationship between naive, effector and memory
Chapter Three Results 54
CD8+ T cells in humans 105. They sorted these three populations based on CD27 and
CD45RA expression and determined genes which were differentially expressed between the
populations. It was found that genes expressed in memory cells show intermediate levels of
expression between naive and effector T cells. Wang et al (2008) examined gene expression
for human CD3+, CD4+ and CD8+ T cell populations 110. The cells were stimulated and the
gene expression on the different time points was analysed and Wang et al described a list of
upregulated and downregulated genes during activation. Chtanova et al (2001) analysed the
gene expression of murine CD4+ Th1 and Th2 and CD8+ type 1 and type 2 cell populations
111. Their analysis resulted in lists of genes differentially expressed between the four cell
types studied. These previous studies have shown that microarray analysis is a useful strategy
to utilise when trying to identify differences between cell populations sorted based on
expression of surface markers.
The aim of the experiments in this chapter was to identify shared and unique genes during the
differentiation of both CD4+ and CD8+ T cell populations. We set out to sort the T cell
populations based on CCR7 and CD45RA and describe the gene expression profiles for each
subset. Genes that are shared in both CD4+ and CD8+ T cell differentiation will come up in
gene lists generated when comparing the differentiation states within their compartment and
genes which are unique to differentiation states in either CD4+ or CD8+ will not.
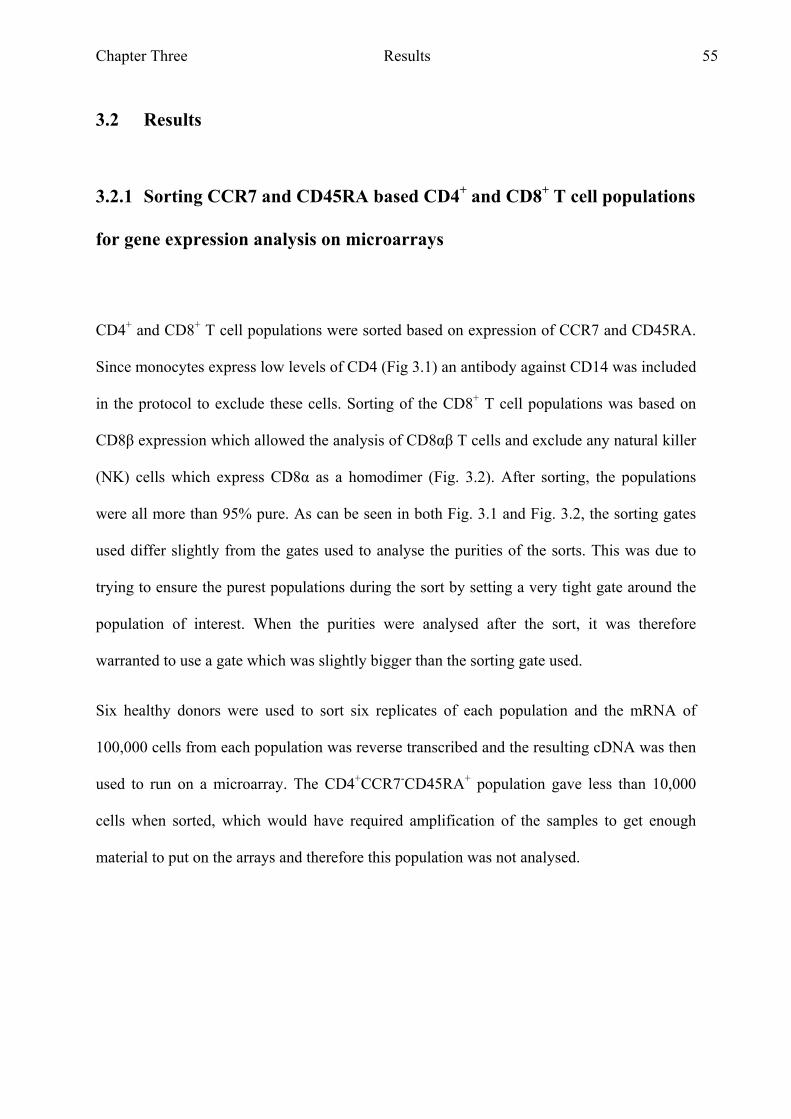
Chapter Three Results 55
3.2 Results
3.2.1 Sorting CCR7 and CD45RA based CD4+ and CD8+ T cell populations
for gene expression analysis on microarrays
CD4+ and CD8+ T cell populations were sorted based on expression of CCR7 and CD45RA.
Since monocytes express low levels of CD4 (Fig 3.1) an antibody against CD14 was included
in the protocol to exclude these cells. Sorting of the CD8+ T cell populations was based on
CD8β expression which allowed the analysis of CD8αβ T cells and exclude any natural killer
(NK) cells which express CD8α as a homodimer (Fig. 3.2). After sorting, the populations
were all more than 95% pure. As can be seen in both Fig. 3.1 and Fig. 3.2, the sorting gates
used differ slightly from the gates used to analyse the purities of the sorts. This was due to
trying to ensure the purest populations during the sort by setting a very tight gate around the
population of interest. When the purities were analysed after the sort, it was therefore
warranted to use a gate which was slightly bigger than the sorting gate used.
Six healthy donors were used to sort six replicates of each population and the mRNA of
100,000 cells from each population was reverse transcribed and the resulting cDNA was then
used to run on a microarray. The CD4+CCR7-CD45RA+ population gave less than 10,000
cells when sorted, which would have required amplification of the samples to get enough
material to put on the arrays and therefore this population was not analysed.
Chapter Three Results 56
Figure 3.1. Sorting populations based on the expression of CD4, CCR7 and CD45RA. A) Representative donor (n=6) showing the gating used during the sort and representative percentages of each population. B) Representative purities for sorted CD4+ naive T cells. C) Representative purities for sorted CD4+ central memory T cells. D) Representative purities for sorted CD4+ effector memory T cells.

Chapter Three Results 57
Figure 3.2. Sorting populations based on the expression of CD8, CCR7 and CD45RA. A) Representative donor (n=6) showing the gating used during the sort and representative percentages of each population. B) Representative purities for sorted CD8+ naive T cells. C) Representative purities for sorted CD8+ central memory T cells. D) Representative purities for sorted CD8+ effector memory T cells. E) Representative purities for sorted CD8+ effector memory RA T cells.

Chapter Three Results 58
3.2.2 Microarray analysis of sorted CD4+ and CD8+ T cell populations
To address the question of which genes allow the best distinction between the four described
CD4+ or CD8+ T cell populations, the cDNA from each population was run on a full human
genome microarray which contained 35,035 oligonucleotide probes, representing
approximately 25,100 unique genes and 39,600 transcripts excluding control oligos. Each
microarray analysed a single sample and a human reference sample, labelled with different
Cy-dyes hybridised. The human reference sample consisted of a low number of RNA
transcripts for 99% of genes expressed on the arrays. The addition of a reference sample
allowed for the comparison of different slides to each other, since the reference sample
should give a similar signal every time. The expression levels of the genes on the array are
therefore expression values relative to the human reference sample. The expression value of a
particular gene was calculated by taking the human reference value for that gene and dividing
by the sample value for that gene. This means that if the gene in question has a very low level
of expression in the sample the expression value relative to the human reference will be a
positive number, whereas if the gene is expressed very high in the sample, the expression
value becomes a smaller minus number.
Chapter Three Results 59
3.2.3 Comparing the four differentiation states without distinguishing
between CD4+ and CD8+ T cell populations
SAM analysis was performed, dividing the samples into the four differentiation states: naive,
central memory (CM), effector memory (EM) and effector memory RA (EMRA). The
samples were not divided between CD4+ and CD8+, therefore each SAM group contained 12
samples (six CD4+ populations and six CD8+ populations), except for the EMRA group
which only contained six CD8+ populations. This analysis resulted in a SAM gene list of 115
genes which differed significantly in their expression between the differentiated T cell
populations and a false discovery rate (FDR) of 1% (Supplemental Table 1). This gene list
was used to analyse the samples by hierarchical clustering (HCL). Fig. 3.3 shows how the
samples cluster together based on these 115 genes. Based on these genes five CD8+ samples
were misclassified. A CD8+ naive sample clustered more closely together with CD4+ naive
samples, however it is also clear from the clustering that all but two naive samples clustered
separately from the other differentiated populations. The two CD8+ naive samples which
clustered together with the more differentiated populations clustered very close to the
differentiated CD8+ populations. One CD8+ EMRA sample clustered together with the CD8+
EM population from the same donor (donor F). Another CD8+ CM sample clustered together
with the CD8+ EM population from the same donor (donor E). Lastly the CD8+ EM and
EMRA from donor A clustered together.
Principal component analysis (PCA) was used to visualise the clustering from the HCL (Fig.
3.4). The PCA shows the naive samples clustering very close together, regardless of whether
they are from the CD4+ or CD8+ compartment. The more differentiated populations however
showed a split between CD4+ and CD8+, even though this was not one of the criteria which
Chapter Three Results 60
generated the SAM gene list. Within the CD4+ compartment the EM population (red spheres)
differed the most in its gene expression profile, compared to the naive samples (light blue
spheres). The gene expression of the CD4+ CM population shows that the expression levels
of those genes are intermediate to the naive and EM population. The CD8+ compartment
shows a similar trend, albeit not as clear as can be seen within the CD4+ compartment. This
could be due to the EM and EMRA populations sharing a lot of functions and therefore
having very similar gene expression profiles.
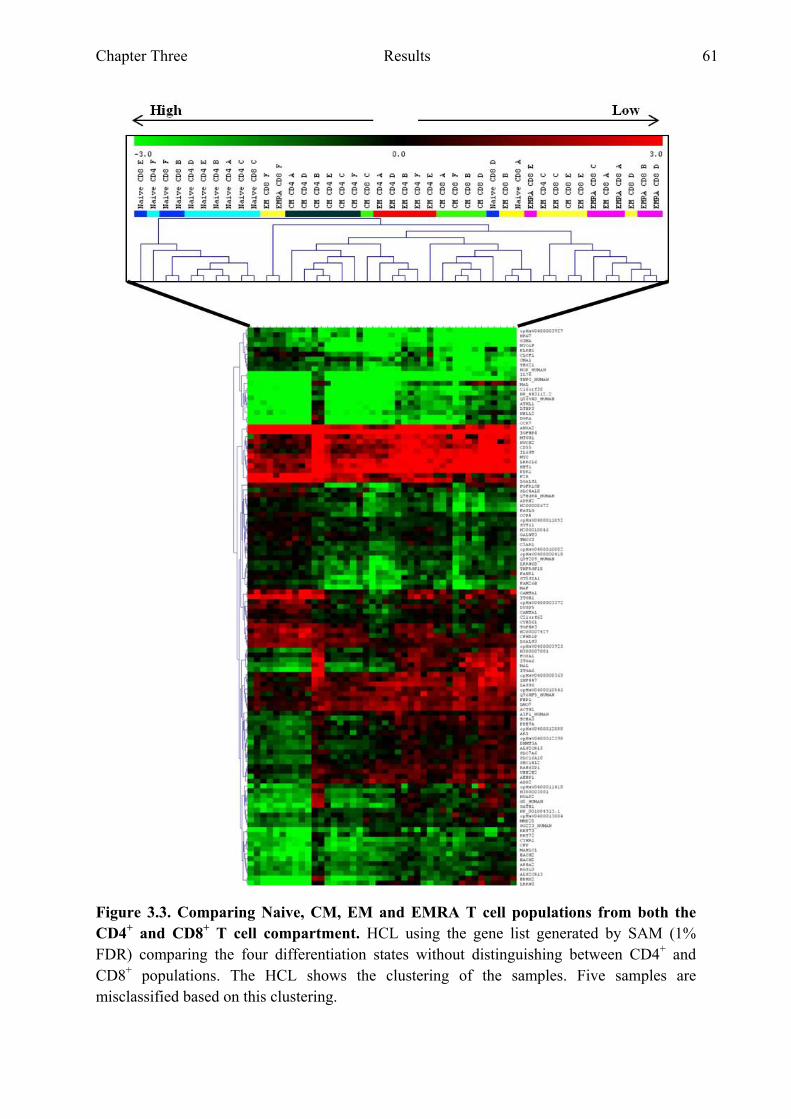
Chapter Three Results 61
Figure 3.3. Comparing Naive, CM, EM and EMRA T cell populations from both the CD4+ and CD8+ T cell compartment. HCL using the gene list generated by SAM (1% FDR) comparing the four differentiation states without distinguishing between CD4+ and CD8+ populations. The HCL shows the clustering of the samples. Five samples are misclassified based on this clustering.
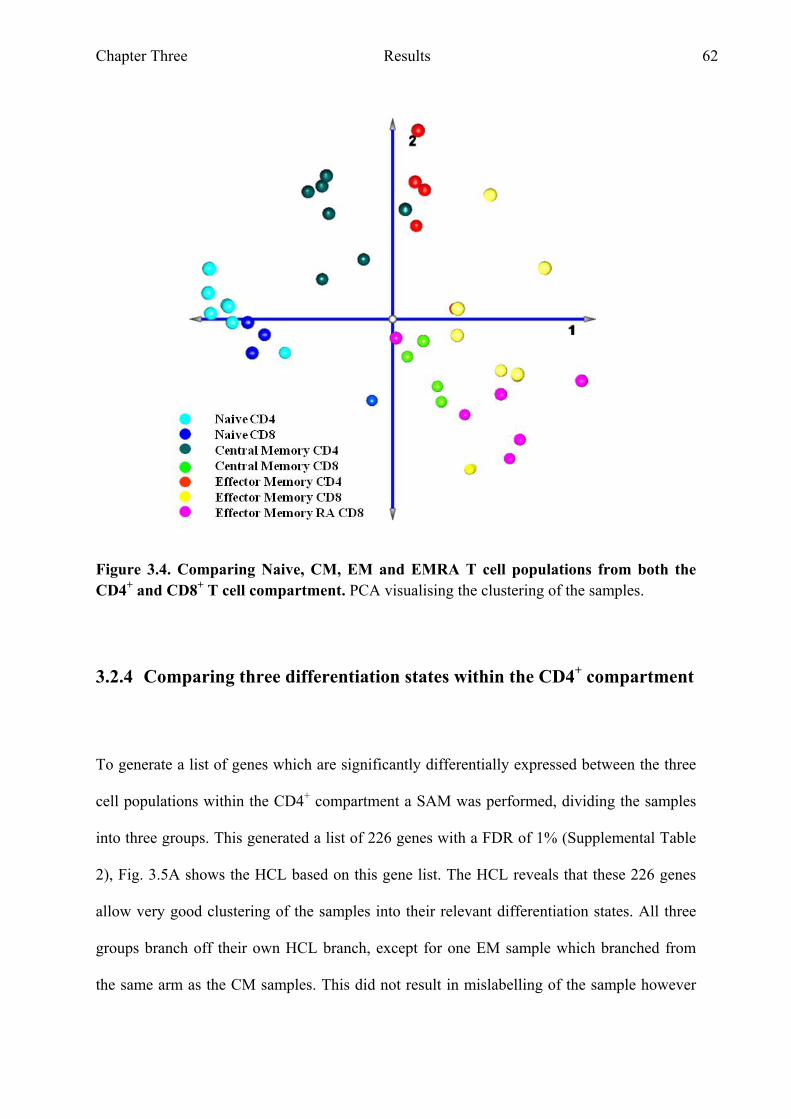
Chapter Three Results 62
Figure 3.4. Comparing Naive, CM, EM and EMRA T cell populations from both the CD4+ and CD8+ T cell compartment. PCA visualising the clustering of the samples.
3.2.4 Comparing three differentiation states within the CD4+ compartment
To generate a list of genes which are significantly differentially expressed between the three
cell populations within the CD4+ compartment a SAM was performed, dividing the samples
into three groups. This generated a list of 226 genes with a FDR of 1% (Supplemental Table
2), Fig. 3.5A shows the HCL based on this gene list. The HCL reveals that these 226 genes
allow very good clustering of the samples into their relevant differentiation states. All three
groups branch off their own HCL branch, except for one EM sample which branched from
the same arm as the CM samples. This did not result in mislabelling of the sample however
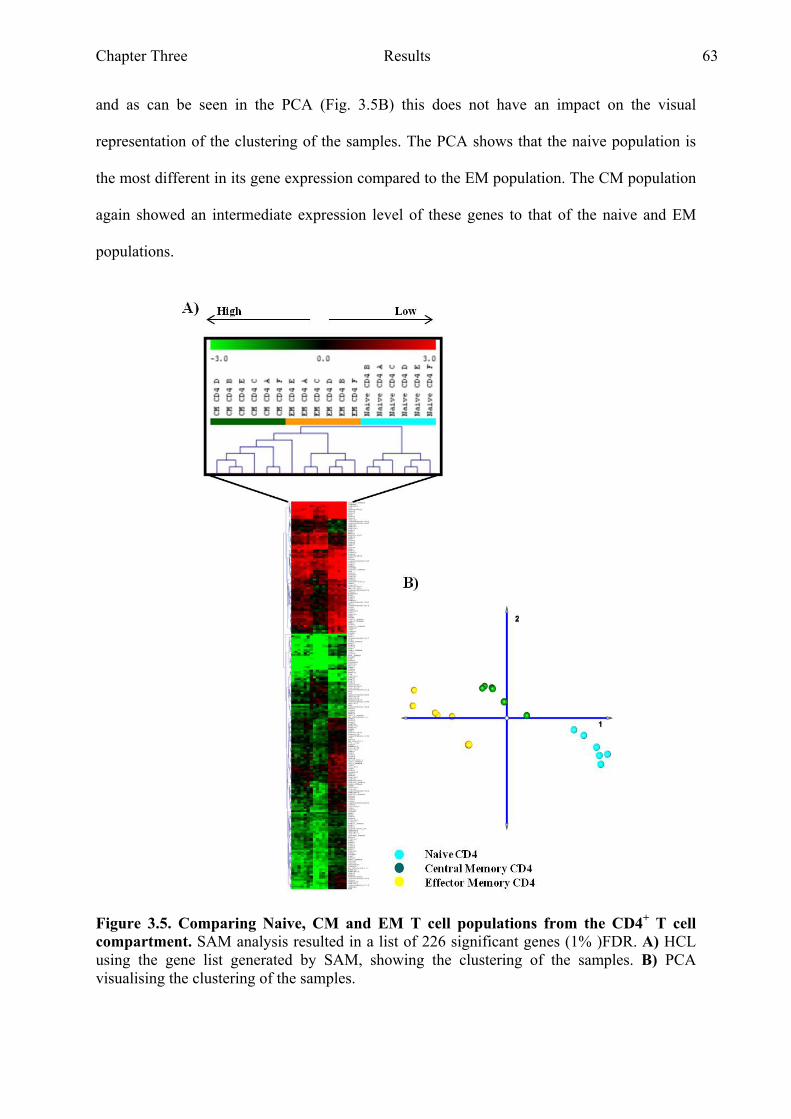
Chapter Three Results 63
and as can be seen in the PCA (Fig. 3.5B) this does not have an impact on the visual
representation of the clustering of the samples. The PCA shows that the naive population is
the most different in its gene expression compared to the EM population. The CM population
again showed an intermediate expression level of these genes to that of the naive and EM
populations.
Figure 3.5. Comparing Naive, CM and EM T cell populations from the CD4+ T cell compartment. SAM analysis resulted in a list of 226 significant genes (1% )FDR. A) HCL using the gene list generated by SAM, showing the clustering of the samples. B) PCA visualising the clustering of the samples.
Chapter Three Results 64
To identify the genes significantly differently expressed between CD4+ naive and CM
populations, a paired SAM was executed. This meant that the naive and CM population from
one donor were paired together in the analysis, to address any donor variability that may have
been present. The paired SAM resulted in a list of 135 genes, with a FDR of 1%
(Supplemental Table 3). The HCL in Fig. 3.6A clearly shows the ability of this gene list to
separate the two populations from each other. Both populations clustered very tightly
together on two separate arms of the HCL. The PCA (Fig. 3.6B) again shows two distinct
clusters correlating to the two populations. Fig. 7A shows the 4 genes with the highest fold
difference (> 2 fold) in the naive population compared to the CM population. The gene
LRRN3 (Leucine-rich repeat neuronal protein 3) came up on this list as one of the genes with
the highest fold difference between CD4+ naive cells and CD4+ CM cells. Fig. 3.7B shows
the 10 genes with the highest fold difference (> 2 fold) in the CM population compared to the
naive population. The two genes with the highest differential expression between CM CD4+
T cells and naive CD4+ T cells are KLRB1 (killer cell lectin-like receptor subfamily B
member 1 or CD161) and FGFR1OP (CCR6 or CD196).
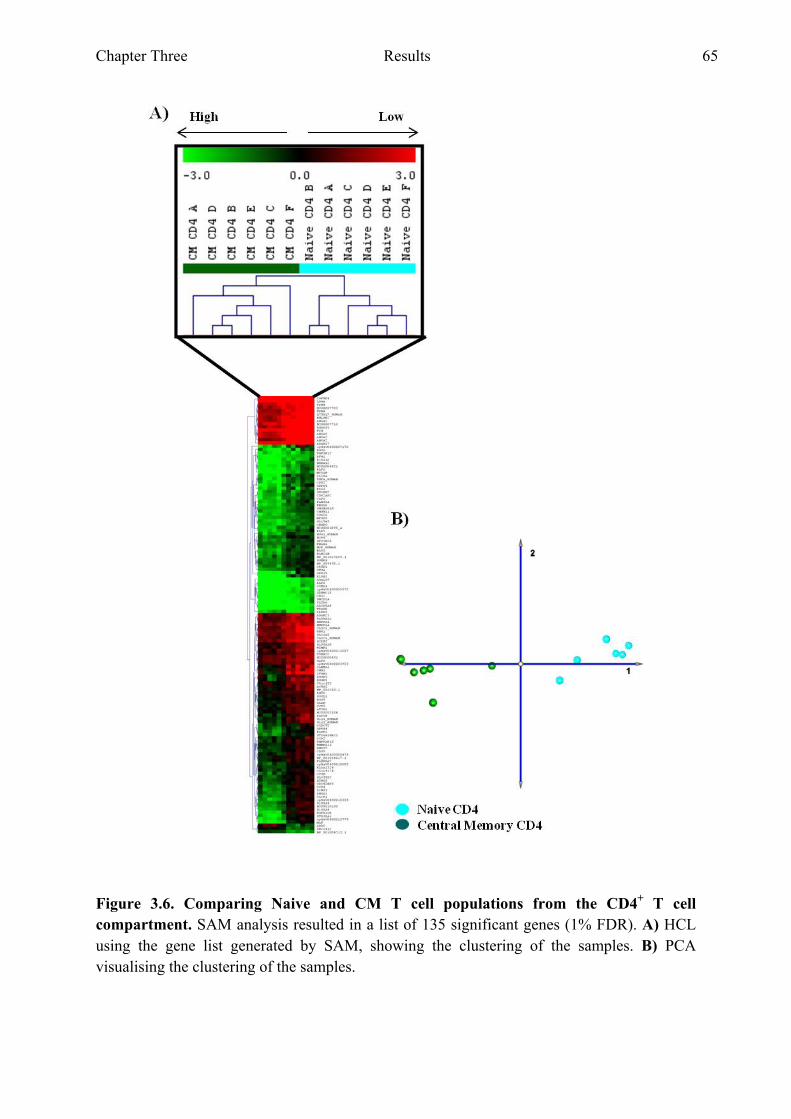
Chapter Three Results 65
Figure 3.6. Comparing Naive and CM T cell populations from the CD4+ T cell compartment. SAM analysis resulted in a list of 135 significant genes (1% FDR). A) HCL using the gene list generated by SAM, showing the clustering of the samples. B) PCA visualising the clustering of the samples.
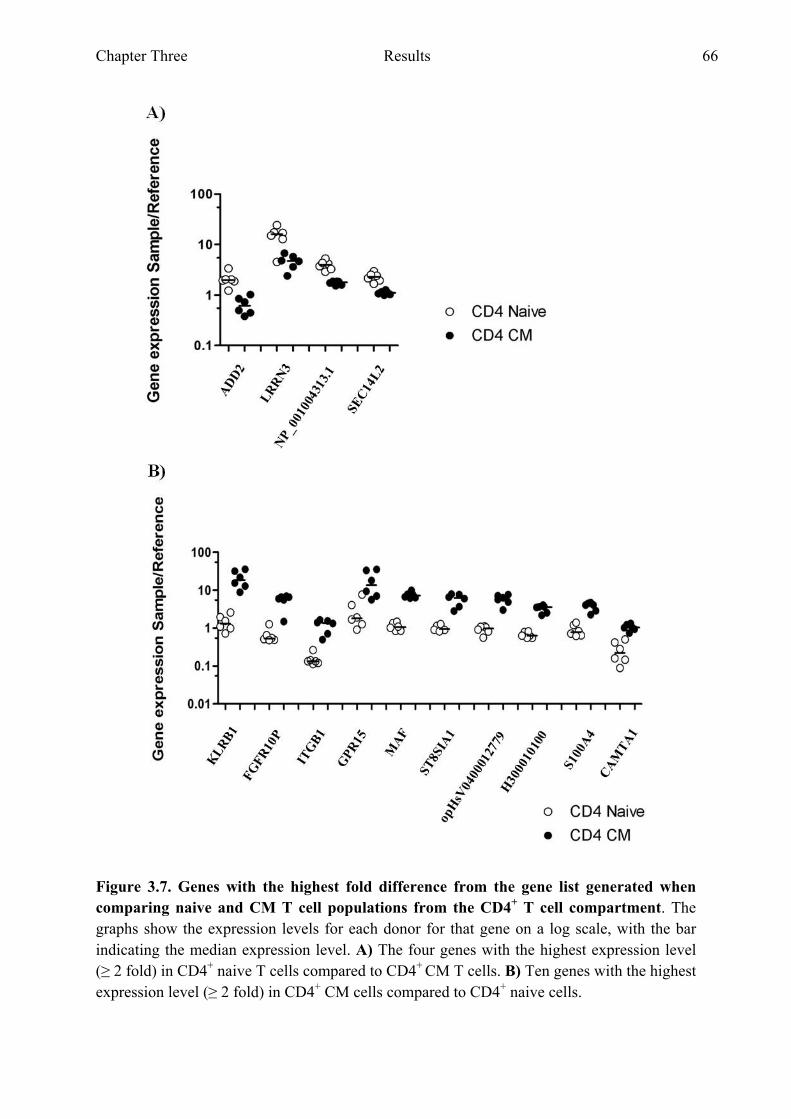
Chapter Three Results 66
Figure 3.7. Genes with the highest fold difference from the gene list generated when comparing naive and CM T cell populations from the CD4+ T cell compartment. The graphs show the expression levels for each donor for that gene on a log scale, with the bar indicating the median expression level. A) The four genes with the highest expression level (≥ 2 fold) in CD4+ naive T cells compared to CD4+ CM T cells. B) Ten genes with the highest expression level (≥ 2 fold) in CD4+ CM cells compared to CD4+ naive cells.
Chapter Three Results 67
The same approach was used to identify genes which are differentially expressed between
CD4+ naive and EM populations. In this case the paired SAM resulted in a list of 279 genes
(Supplemental Table 4) with significantly different gene expression between CD4+ naive and
CD4+ EM T cell populations (1% FDR). The resulting HCL (Fig. 3.8A) shows the ability of
this gene list to distinguish these two differentiation states based on their gene expression.
The PCA (Fig. 3.8B) shows the two populations clustering apart from each other in
concordance with the HCL. The 10 genes with the highest fold difference in CD4+ naive T
cells compared to CD4+ EM T cells are shown in Fig. 3.9A. LRRN3 again is more highly
expressed in CD4+ naive T cells compared to the CD4+ EM T cells (17.1 times higher
expression). Fig. 3.9B shows the 10 genes with the highest fold difference in CD4+ EM T
cells compared to CD4+ naive T cells. The two genes with the highest fold difference were
KLRB1 (Killer cell lectin-like receptor) and GZMA (granzyme A) which are both genes
involved in T cell effector function.
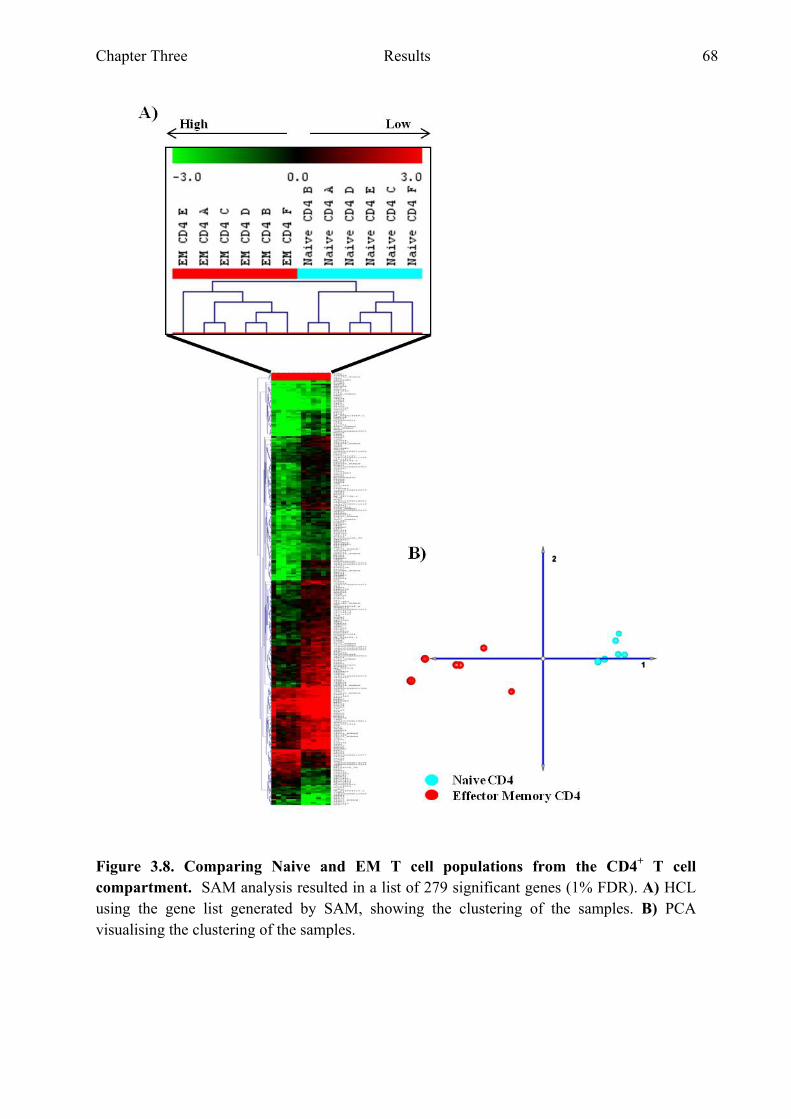
Chapter Three Results 68
Figure 3.8. Comparing Naive and EM T cell populations from the CD4+ T cell compartment. SAM analysis resulted in a list of 279 significant genes (1% FDR). A) HCL using the gene list generated by SAM, showing the clustering of the samples. B) PCA visualising the clustering of the samples.
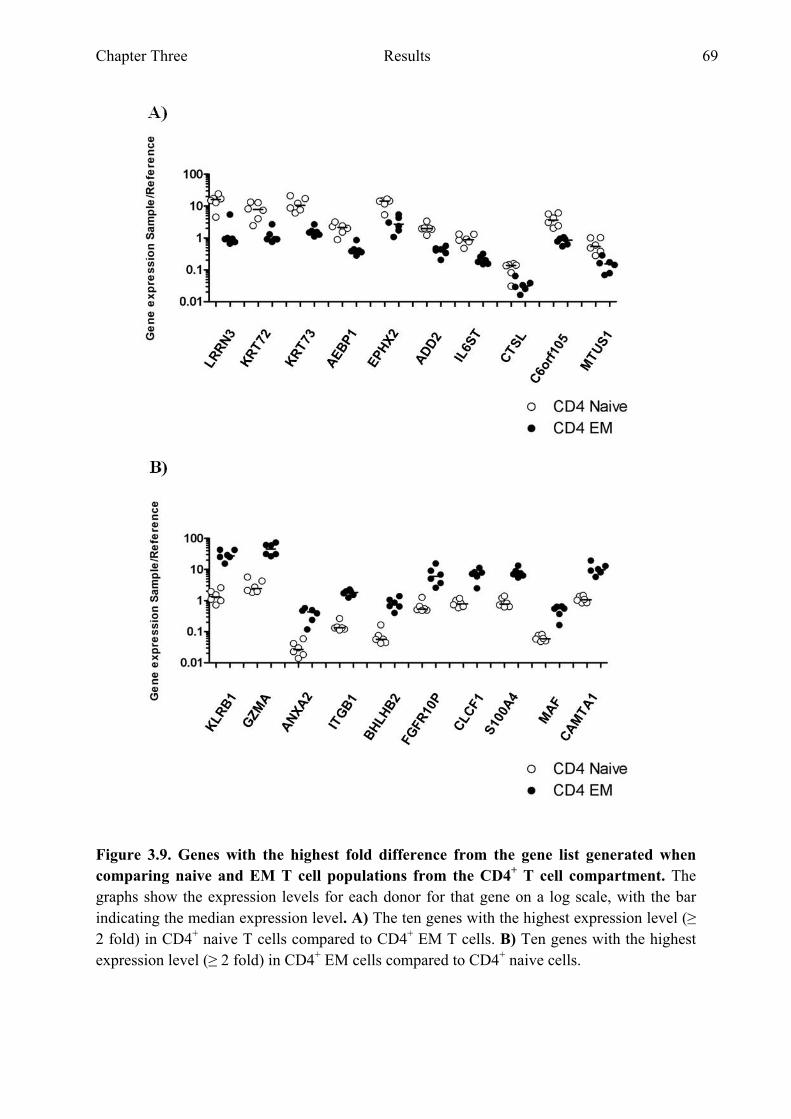
Chapter Three Results 69
Figure 3.9. Genes with the highest fold difference from the gene list generated when comparing naive and EM T cell populations from the CD4+ T cell compartment. The graphs show the expression levels for each donor for that gene on a log scale, with the bar indicating the median expression level. A) The ten genes with the highest expression level (≥ 2 fold) in CD4+ naive T cells compared to CD4+ EM T cells. B) Ten genes with the highest expression level (≥ 2 fold) in CD4+ EM cells compared to CD4+ naive cells.
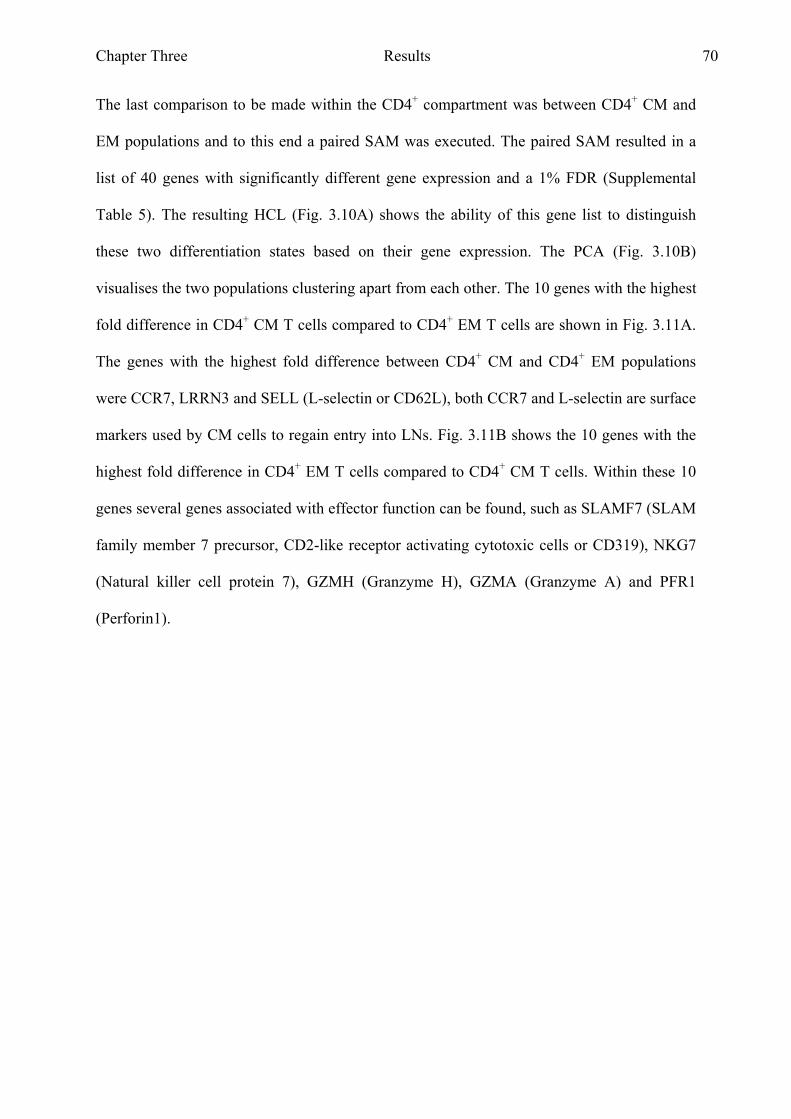
Chapter Three Results 70
The last comparison to be made within the CD4+ compartment was between CD4+ CM and
EM populations and to this end a paired SAM was executed. The paired SAM resulted in a
list of 40 genes with significantly different gene expression and a 1% FDR (Supplemental
Table 5). The resulting HCL (Fig. 3.10A) shows the ability of this gene list to distinguish
these two differentiation states based on their gene expression. The PCA (Fig. 3.10B)
visualises the two populations clustering apart from each other. The 10 genes with the highest
fold difference in CD4+ CM T cells compared to CD4+ EM T cells are shown in Fig. 3.11A.
The genes with the highest fold difference between CD4+ CM and CD4+ EM populations
were CCR7, LRRN3 and SELL (L-selectin or CD62L), both CCR7 and L-selectin are surface
markers used by CM cells to regain entry into LNs. Fig. 3.11B shows the 10 genes with the
highest fold difference in CD4+ EM T cells compared to CD4+ CM T cells. Within these 10
genes several genes associated with effector function can be found, such as SLAMF7 (SLAM
family member 7 precursor, CD2-like receptor activating cytotoxic cells or CD319), NKG7
(Natural killer cell protein 7), GZMH (Granzyme H), GZMA (Granzyme A) and PFR1
(Perforin1).
Chapter Three Results 71
Figure 3.10. Comparing CM and EM T cell populations from the CD4+ T cell compartment. SAM analysis resulted in a list of 40 significant genes (1% FDR). A) HCL using the gene list generated by SAM, showing the clustering of the samples. B) PCA visualising the clustering of the samples.

Chapter Three Results 72
Figure 3.11. Genes with the highest fold difference from the gene list generated when comparing CM and EM T cell populations from the CD4+ T cell compartment. The graphs show the expression levels for each donor for that gene on a log scale, with the bar indicating the median expression level. A) The ten genes with the highest expression level (≥ 2 fold) in CD4+ CM T cells compared to CD4+ EM T cells. B) Ten genes with the highest expression level (≥ 2 fold) in CD4+ EM cells compared to CD4+ CM cells.
Chapter Three Results 73
3.2.5 Comparing four differentiation states within the CD8+ compartment
To generate a list of significantly differentially expressed genes between the four cell
populations within the CD8+ compartment a SAM was performed, dividing the samples into
four groups. This analysis resulted in a list of nine genes which were found to be expressed at
significantly different levels between the four differentiation states (1% FDR, Supplemental
Table 6). This list of genes was then used to cluster the samples together based on their gene
expression profiles for these genes, shown in Fig. 3.12A as a HCL. Using these nine genes to
cluster the samples resulted in five samples being misclassified. One CM sample clustered
together with two naive samples, whereas another CM sample clustered together with the EM
sample from the same donor (donor E). As was seen before in 3.2.3 distinguishing between
the EM and EMRA populations proved difficult, which may be a result of the many shared
functions between these two subsets. In this case three EM samples were misclassified as
EMRA samples. Fig. 3.12B shows the resulting PCA which shows that the gene expression
of the naive CD8+ T cell population differed the most from the CD8+ EM and EMRA T cell
populations, with the gene expression levels of the CM population intermediate between the
naive and effector populations.
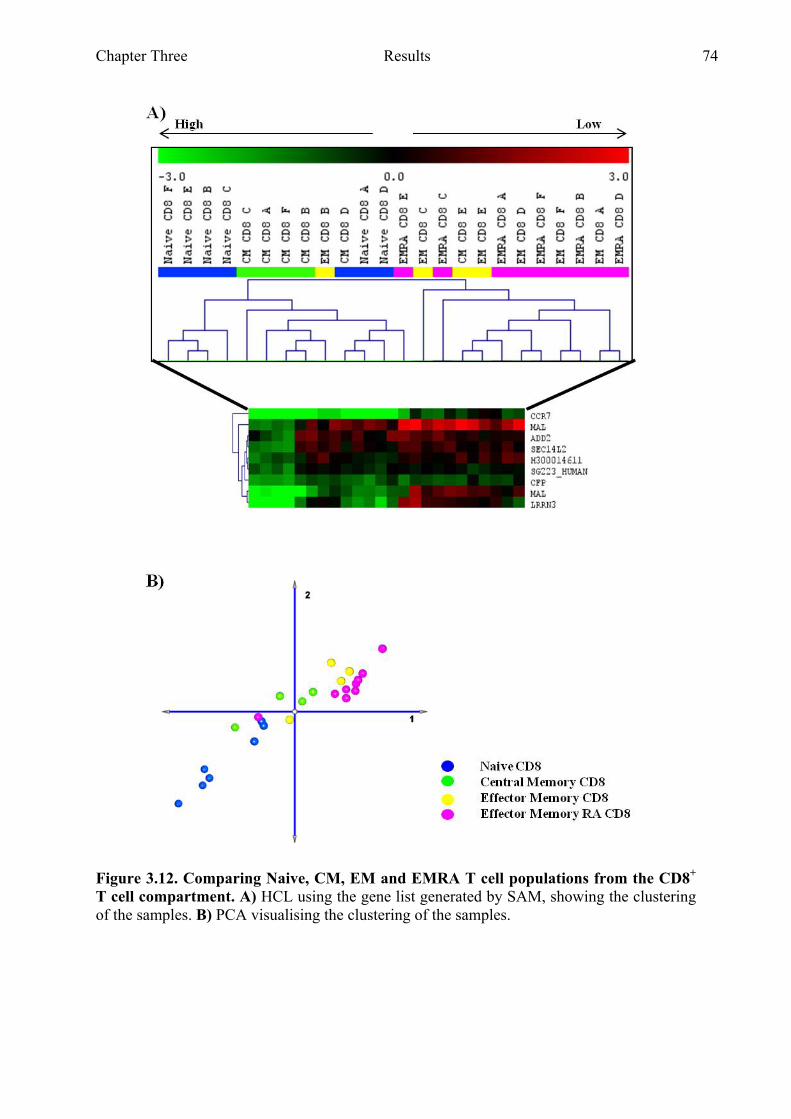
Chapter Three Results 74
Figure 3.12. Comparing Naive, CM, EM and EMRA T cell populations from the CD8+ T cell compartment. A) HCL using the gene list generated by SAM, showing the clustering of the samples. B) PCA visualising the clustering of the samples.
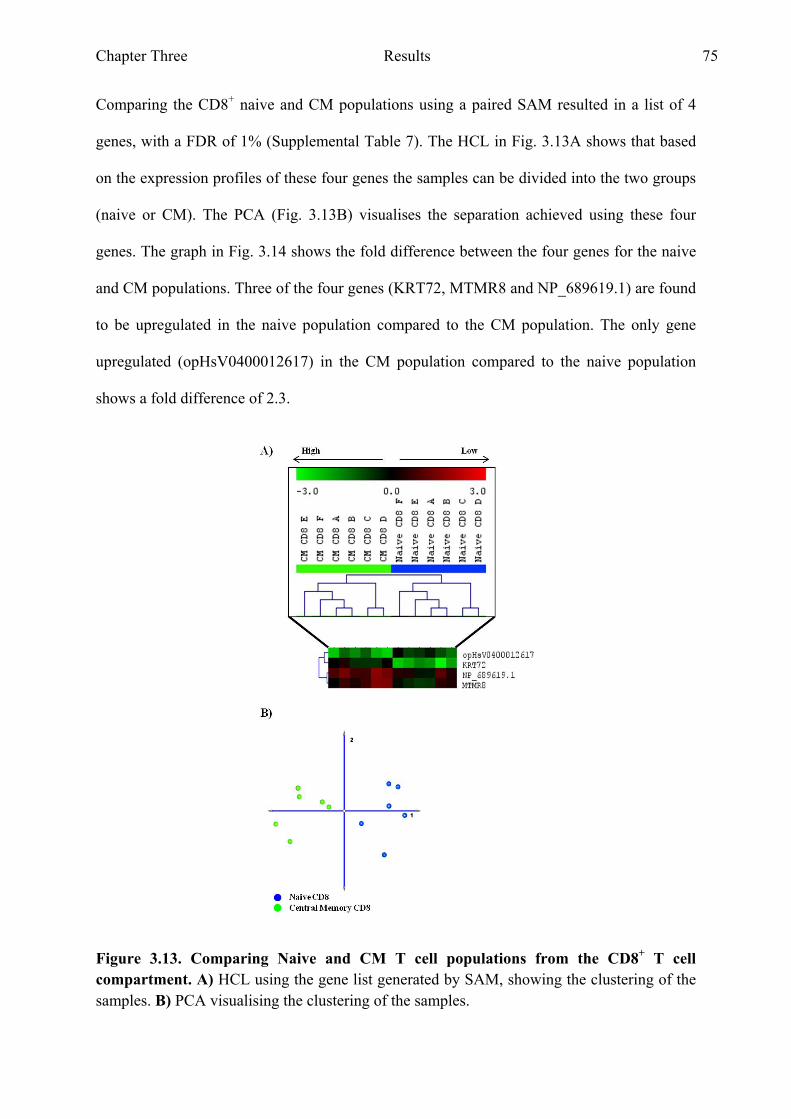
Chapter Three Results 75
Comparing the CD8+ naive and CM populations using a paired SAM resulted in a list of 4
genes, with a FDR of 1% (Supplemental Table 7). The HCL in Fig. 3.13A shows that based
on the expression profiles of these four genes the samples can be divided into the two groups
(naive or CM). The PCA (Fig. 3.13B) visualises the separation achieved using these four
genes. The graph in Fig. 3.14 shows the fold difference between the four genes for the naive
and CM populations. Three of the four genes (KRT72, MTMR8 and NP_689619.1) are found
to be upregulated in the naive population compared to the CM population. The only gene
upregulated (opHsV0400012617) in the CM population compared to the naive population
shows a fold difference of 2.3.
Figure 3.13. Comparing Naive and CM T cell populations from the CD8+ T cell compartment. A) HCL using the gene list generated by SAM, showing the clustering of the samples. B) PCA visualising the clustering of the samples.
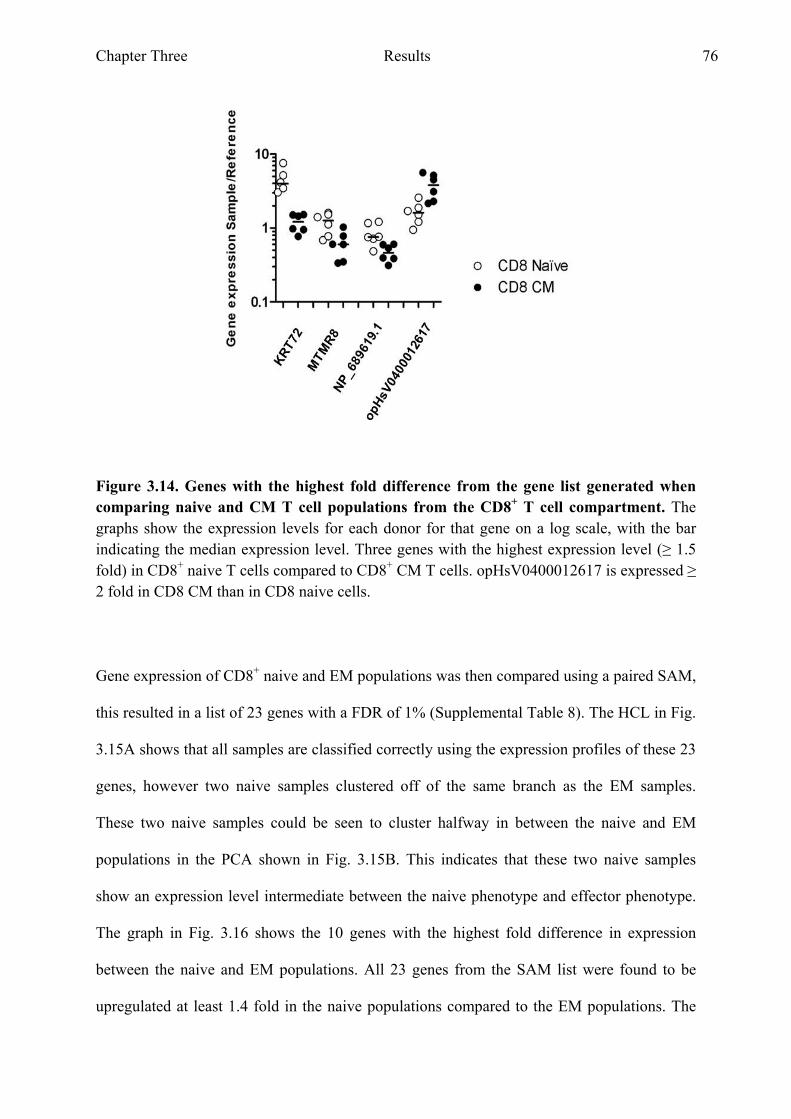
Chapter Three Results 76
Figure 3.14. Genes with the highest fold difference from the gene list generated when comparing naive and CM T cell populations from the CD8+ T cell compartment. The graphs show the expression levels for each donor for that gene on a log scale, with the bar indicating the median expression level. Three genes with the highest expression level (≥ 1.5 fold) in CD8+ naive T cells compared to CD8+ CM T cells. opHsV0400012617 is expressed ≥ 2 fold in CD8 CM than in CD8 naive cells.
Gene expression of CD8+ naive and EM populations was then compared using a paired SAM,
this resulted in a list of 23 genes with a FDR of 1% (Supplemental Table 8). The HCL in Fig.
3.15A shows that all samples are classified correctly using the expression profiles of these 23
genes, however two naive samples clustered off of the same branch as the EM samples.
These two naive samples could be seen to cluster halfway in between the naive and EM
populations in the PCA shown in Fig. 3.15B. This indicates that these two naive samples
show an expression level intermediate between the naive phenotype and effector phenotype.
The graph in Fig. 3.16 shows the 10 genes with the highest fold difference in expression
between the naive and EM populations. All 23 genes from the SAM list were found to be
upregulated at least 1.4 fold in the naive populations compared to the EM populations. The
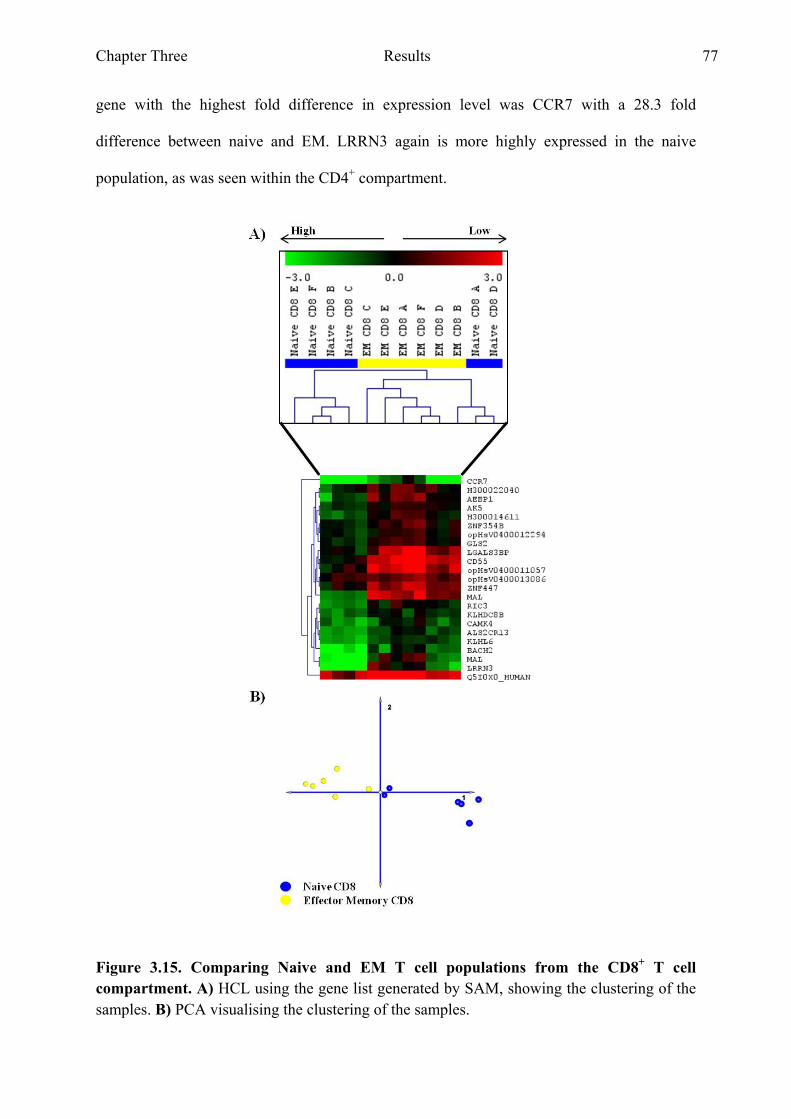
Chapter Three Results 77
gene with the highest fold difference in expression level was CCR7 with a 28.3 fold
difference between naive and EM. LRRN3 again is more highly expressed in the naive
population, as was seen within the CD4+ compartment.
Figure 3.15. Comparing Naive and EM T cell populations from the CD8+ T cell compartment. A) HCL using the gene list generated by SAM, showing the clustering of the samples. B) PCA visualising the clustering of the samples.

Chapter Three Results 78
Figure 3.16. Genes with the highest fold difference from the gene list generated when comparing naive and EM T cell populations from the CD8+ T cell compartment. The graphs show the expression levels for each donor for that gene on a log scale, with the bar indicating the median expression level. The graph shows the ten genes with the highest expression level (≥ 2 fold) in CD8+ naive T cells compared to CD8+ EM T cells.
Comparing CD8+ naive and EMRA populations a SAM list of 24 genes, with a FDR of 1%
(Supplemental Table 9) was generated. The HCL in Fig. 3.17A shows that all but one sample
were correctly classified based on this gene list. Two naive samples are shown to branch off
of the same HCL branch as the EMRA populations and one EMRA sample is classified as
naive. The PCA in Fig. 3.17B shows the clustering of the samples and the two naive samples
can be seen clustering closely to the EMRA samples. As was the case in the CD8+ naive
versus EM populations; all significant genes found in this comparison are upregulated in the
naive samples compared to the EMRA samples. The ten genes with the highest fold
difference are shown in Fig. 3.18.

Chapter Three Results 79
Figure 3.17. Comparing Naive and EMRA T cell populations from the CD8+ T cell compartment. A) HCL using the gene list generated by SAM, showing the clustering of the samples. B) PCA visualising the clustering of the samples.
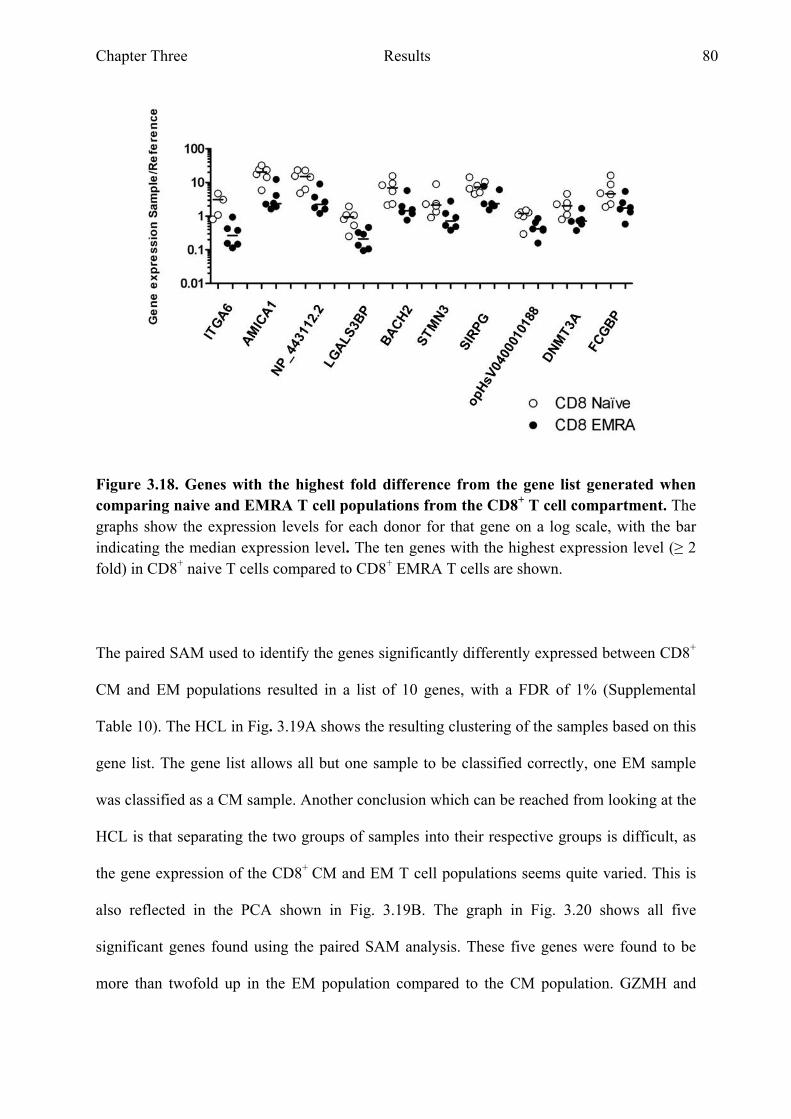
Chapter Three Results 80
Figure 3.18. Genes with the highest fold difference from the gene list generated when comparing naive and EMRA T cell populations from the CD8+ T cell compartment. The graphs show the expression levels for each donor for that gene on a log scale, with the bar indicating the median expression level. The ten genes with the highest expression level (≥ 2 fold) in CD8+ naive T cells compared to CD8+ EMRA T cells are shown.
The paired SAM used to identify the genes significantly differently expressed between CD8+
CM and EM populations resulted in a list of 10 genes, with a FDR of 1% (Supplemental
Table 10). The HCL in Fig. 3.19A shows the resulting clustering of the samples based on this
gene list. The gene list allows all but one sample to be classified correctly, one EM sample
was classified as a CM sample. Another conclusion which can be reached from looking at the
HCL is that separating the two groups of samples into their respective groups is difficult, as
the gene expression of the CD8+ CM and EM T cell populations seems quite varied. This is
also reflected in the PCA shown in Fig. 3.19B. The graph in Fig. 3.20 shows all five
significant genes found using the paired SAM analysis. These five genes were found to be
more than twofold up in the EM population compared to the CM population. GZMH and
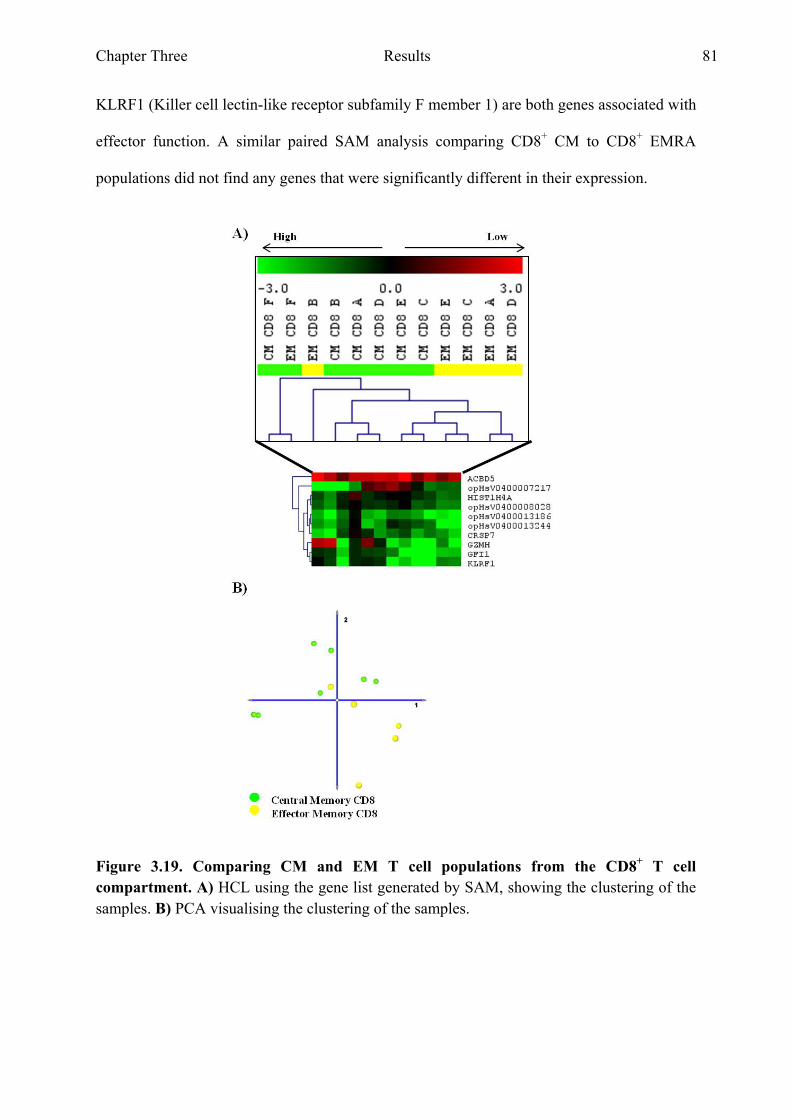
Chapter Three Results 81
KLRF1 (Killer cell lectin-like receptor subfamily F member 1) are both genes associated with
effector function. A similar paired SAM analysis comparing CD8+ CM to CD8+ EMRA
populations did not find any genes that were significantly different in their expression.
Figure 3.19. Comparing CM and EM T cell populations from the CD8+ T cell compartment. A) HCL using the gene list generated by SAM, showing the clustering of the samples. B) PCA visualising the clustering of the samples.
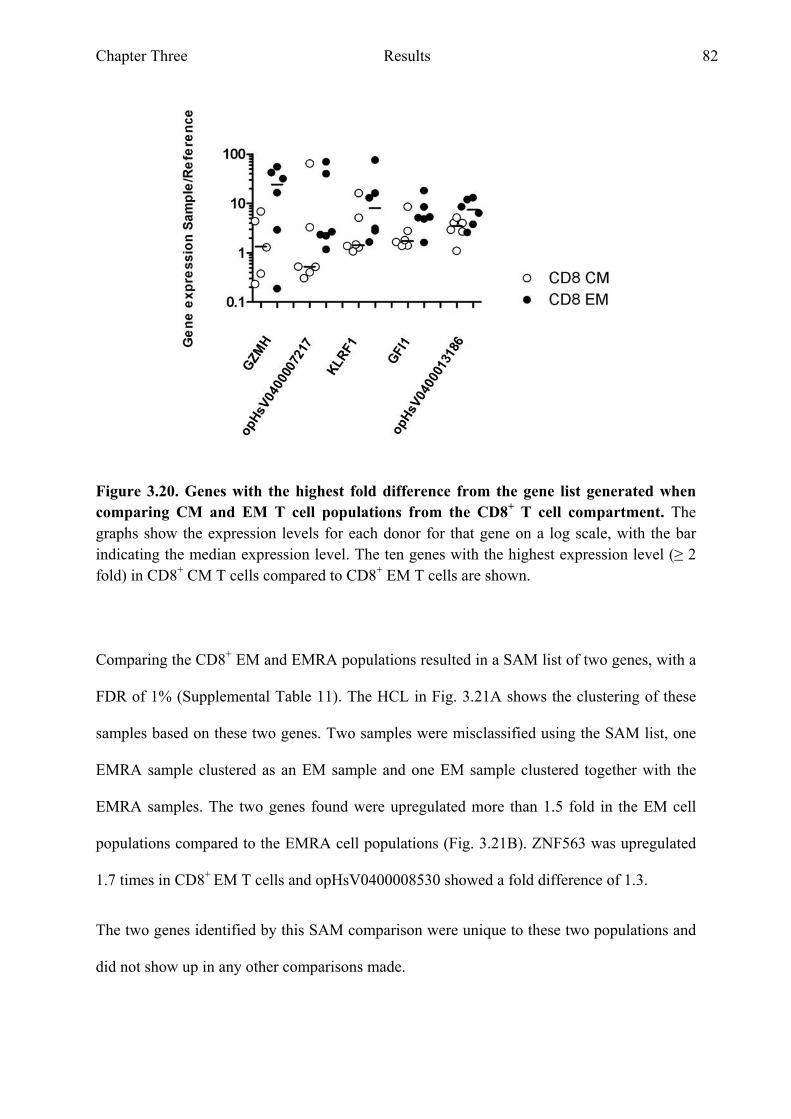
Chapter Three Results 82
Figure 3.20. Genes with the highest fold difference from the gene list generated when comparing CM and EM T cell populations from the CD8+ T cell compartment. The graphs show the expression levels for each donor for that gene on a log scale, with the bar indicating the median expression level. The ten genes with the highest expression level (≥ 2 fold) in CD8+ CM T cells compared to CD8+ EM T cells are shown.
Comparing the CD8+ EM and EMRA populations resulted in a SAM list of two genes, with a
FDR of 1% (Supplemental Table 11). The HCL in Fig. 3.21A shows the clustering of these
samples based on these two genes. Two samples were misclassified using the SAM list, one
EMRA sample clustered as an EM sample and one EM sample clustered together with the
EMRA samples. The two genes found were upregulated more than 1.5 fold in the EM cell
populations compared to the EMRA cell populations (Fig. 3.21B). ZNF563 was upregulated
1.7 times in CD8+ EM T cells and opHsV0400008530 showed a fold difference of 1.3.
The two genes identified by this SAM comparison were unique to these two populations and
did not show up in any other comparisons made.
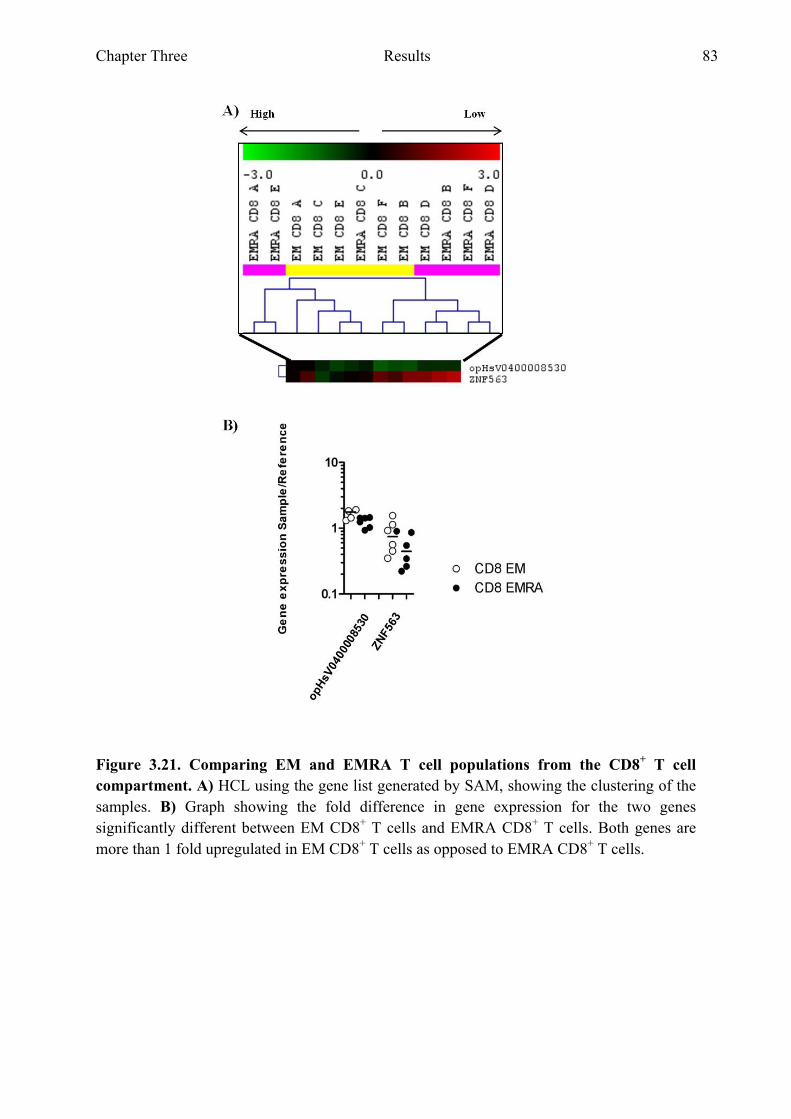
Chapter Three Results 83
Figure 3.21. Comparing EM and EMRA T cell populations from the CD8+ T cell compartment. A) HCL using the gene list generated by SAM, showing the clustering of the samples. B) Graph showing the fold difference in gene expression for the two genes significantly different between EM CD8+ T cells and EMRA CD8+ T cells. Both genes are more than 1 fold upregulated in EM CD8+ T cells as opposed to EMRA CD8+ T cells.

Chapter Three Results 84
3.2.6 Comparing between CD4+ and CD8+ differentiation states
To identify the genes significantly differently expressed between CD4+ naive and CD8+ naive
T cell populations, a paired SAM was executed. The CD4+ naive and CD8+ naive population
from one donor were paired together in the analysis, to address any donor variability that may
have been present. The paired SAM resulted in a list of 52 genes, with a FDR of 1%
(Supplemental Table 12). The HCL in Fig. 3.22A shows that using these 52 genes results in
perfect clustering of these two T cell populations, which is also shown in the PCA in Fig.
3.22B. The graph in Fig. 3.23A shows the 10 genes with the highest fold difference in the
naive CD4+ T cell populations compared to the CD8+ naive T cell populations. CD4 was the
gene with the highest fold difference (11.4) in CD4+ naive cells compared to CD8+ naive
cells and the gene TSPAN18 (Tetraspanin-18) was upregulated 4.6 times. The graph in Fig.
3.23B shows the five genes with the highest fold difference in the naive CD8+ T cell
populations compared to the CD4+ naive T cell populations. CD8β and CD8α were among
these five genes with the highest fold difference in CD8+ naive cells compared to CD4+ naive
cells as was KLRC4 (NKG2-D type II integral membrane protein or CD314), which is
normally expressed on NK cells.
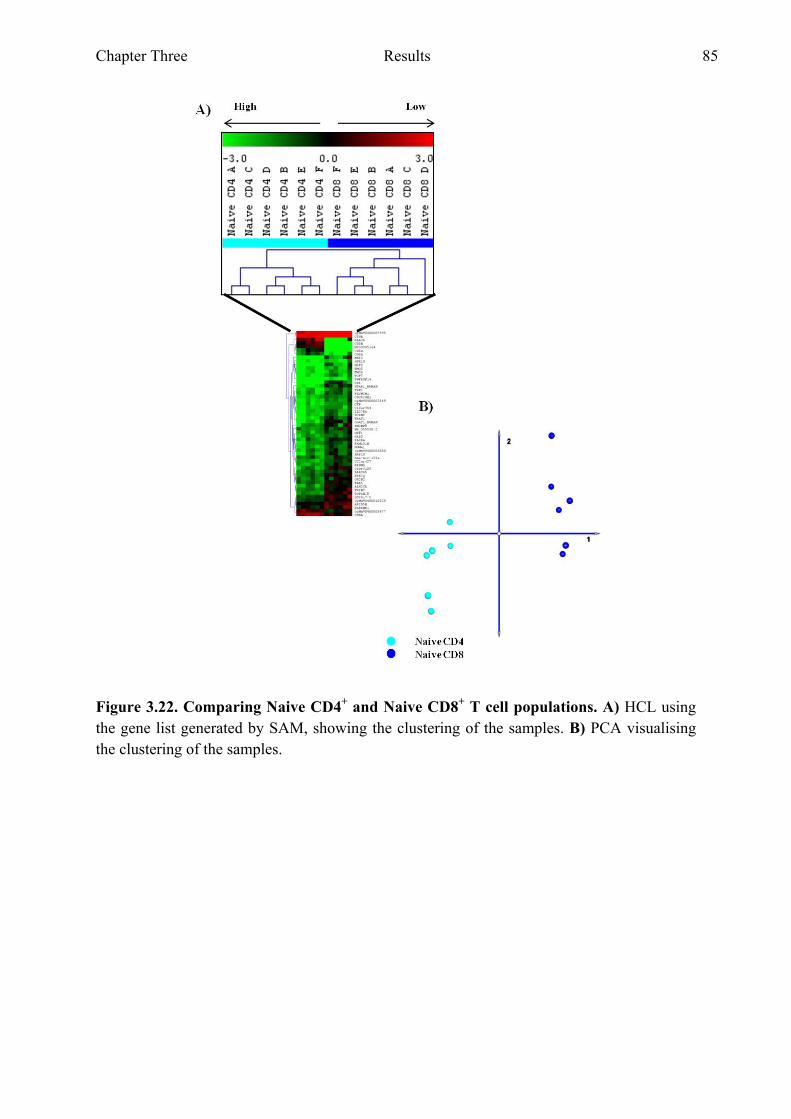
Chapter Three Results 85
Figure 3.22. Comparing Naive CD4+ and Naive CD8+ T cell populations. A) HCL using the gene list generated by SAM, showing the clustering of the samples. B) PCA visualising the clustering of the samples.
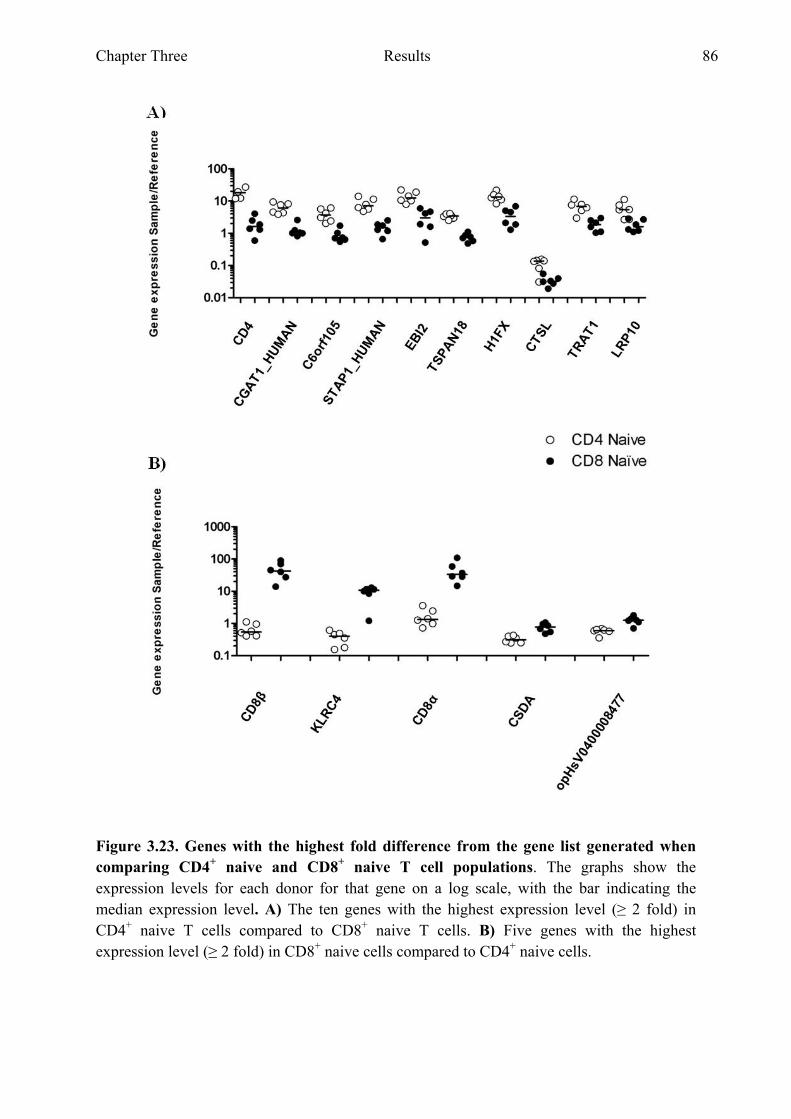
Chapter Three Results 86
Figure 3.23. Genes with the highest fold difference from the gene list generated when comparing CD4+ naive and CD8+ naive T cell populations. The graphs show the expression levels for each donor for that gene on a log scale, with the bar indicating the median expression level. A) The ten genes with the highest expression level (≥ 2 fold) in CD4+ naive T cells compared to CD8+ naive T cells. B) Five genes with the highest expression level (≥ 2 fold) in CD8+ naive cells compared to CD4+ naive cells.
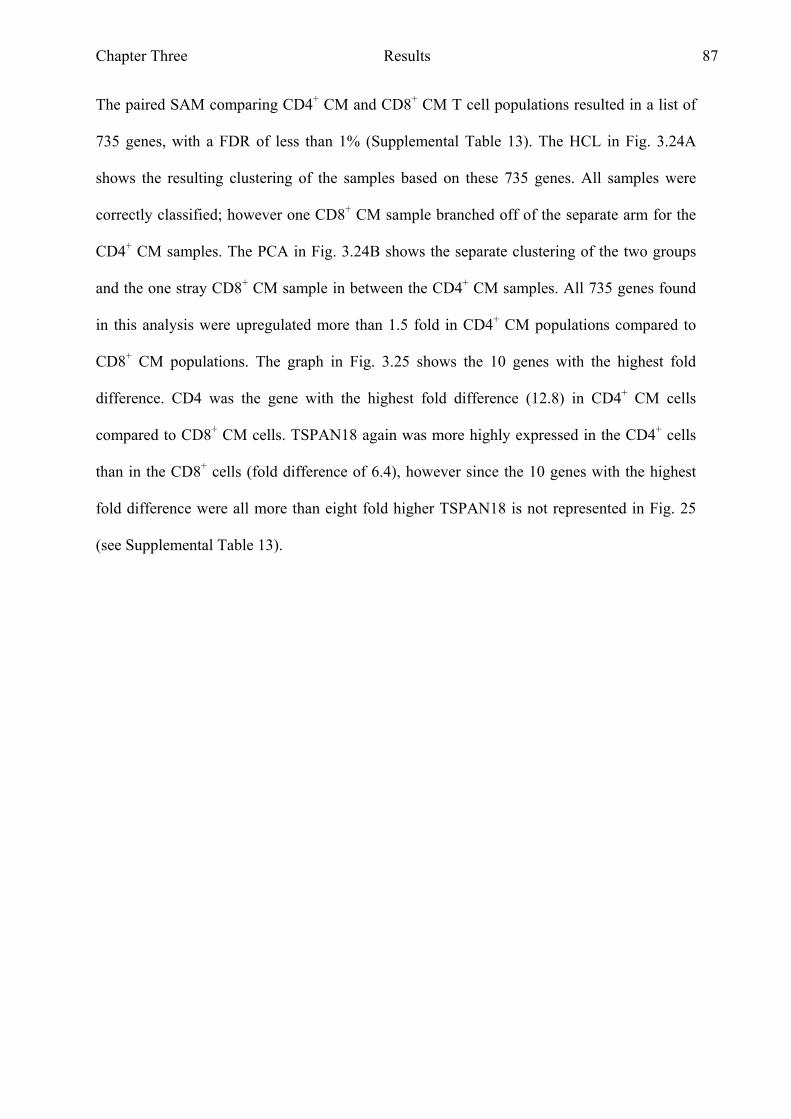
Chapter Three Results 87
The paired SAM comparing CD4+ CM and CD8+ CM T cell populations resulted in a list of
735 genes, with a FDR of less than 1% (Supplemental Table 13). The HCL in Fig. 3.24A
shows the resulting clustering of the samples based on these 735 genes. All samples were
correctly classified; however one CD8+ CM sample branched off of the separate arm for the
CD4+ CM samples. The PCA in Fig. 3.24B shows the separate clustering of the two groups
and the one stray CD8+ CM sample in between the CD4+ CM samples. All 735 genes found
in this analysis were upregulated more than 1.5 fold in CD4+ CM populations compared to
CD8+ CM populations. The graph in Fig. 3.25 shows the 10 genes with the highest fold
difference. CD4 was the gene with the highest fold difference (12.8) in CD4+ CM cells
compared to CD8+ CM cells. TSPAN18 again was more highly expressed in the CD4+ cells
than in the CD8+ cells (fold difference of 6.4), however since the 10 genes with the highest
fold difference were all more than eight fold higher TSPAN18 is not represented in Fig. 25
(see Supplemental Table 13).
Chapter Three Results 88
Figure 3.24. Comparing CM CD4+ and CM CD8+ T cell populations. A) HCL using the gene list generated by SAM, showing the clustering of the samples. B) PCA visualising the clustering of the samples.
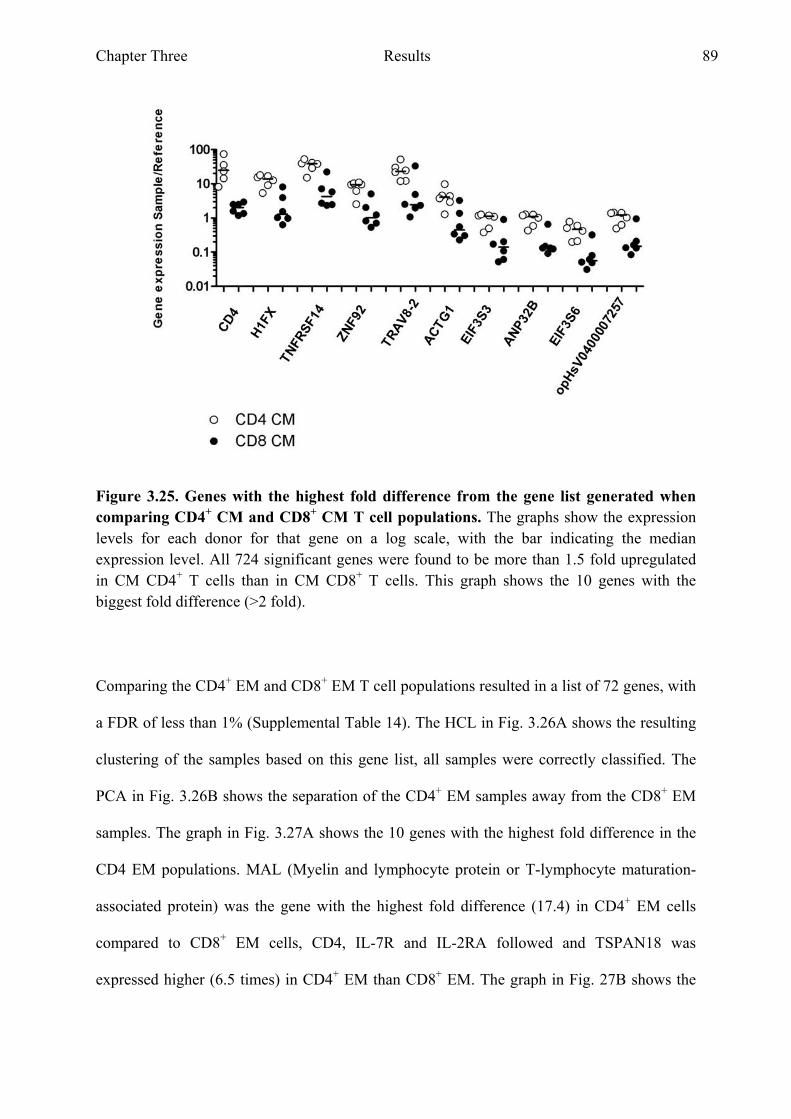
Chapter Three Results 89
Figure 3.25. Genes with the highest fold difference from the gene list generated when comparing CD4+ CM and CD8+ CM T cell populations. The graphs show the expression levels for each donor for that gene on a log scale, with the bar indicating the median expression level. All 724 significant genes were found to be more than 1.5 fold upregulated in CM CD4+ T cells than in CM CD8+ T cells. This graph shows the 10 genes with the biggest fold difference (>2 fold).
Comparing the CD4+ EM and CD8+ EM T cell populations resulted in a list of 72 genes, with
a FDR of less than 1% (Supplemental Table 14). The HCL in Fig. 3.26A shows the resulting
clustering of the samples based on this gene list, all samples were correctly classified. The
PCA in Fig. 3.26B shows the separation of the CD4+ EM samples away from the CD8+ EM
samples. The graph in Fig. 3.27A shows the 10 genes with the highest fold difference in the
CD4 EM populations. MAL (Myelin and lymphocyte protein or T-lymphocyte maturation-
associated protein) was the gene with the highest fold difference (17.4) in CD4+ EM cells
compared to CD8+ EM cells, CD4, IL-7R and IL-2RA followed and TSPAN18 was
expressed higher (6.5 times) in CD4+ EM than CD8+ EM. The graph in Fig. 27B shows the
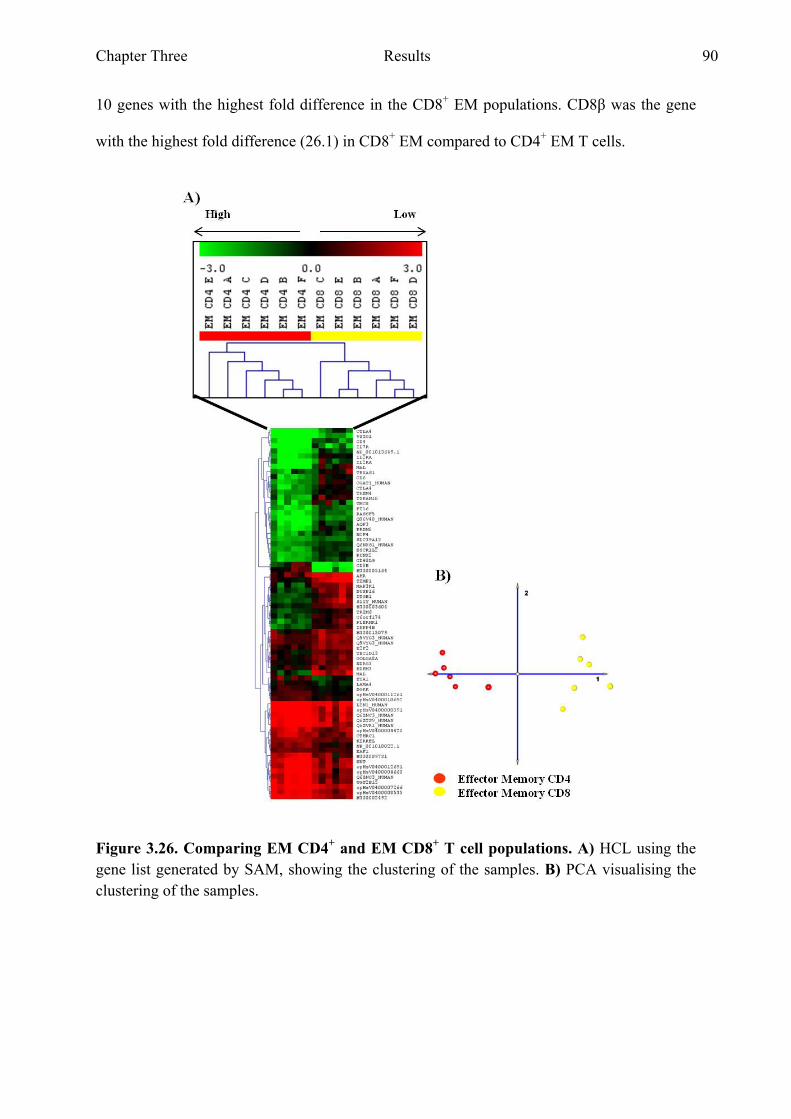
Chapter Three Results 90
10 genes with the highest fold difference in the CD8+ EM populations. CD8β was the gene
with the highest fold difference (26.1) in CD8+ EM compared to CD4+ EM T cells.
Figure 3.26. Comparing EM CD4+ and EM CD8+ T cell populations. A) HCL using the gene list generated by SAM, showing the clustering of the samples. B) PCA visualising the clustering of the samples.

Chapter Three Results 91
Figure 3.27. Genes with the highest fold difference from the gene list generated when comparing CD4+ EM and CD8+ EM T cell populations. The graphs show the expression levels for each donor for that gene on a log scale, with the bar indicating the median expression level. A) The ten genes with the highest expression level (≥ 2 fold) in CD4+ EM T cells compared to CD8+ EM T cells. B) Ten genes with the highest expression level (≥ 2 fold) in CD8+ EM cells compared to CD4+ EM cells.
Chapter Three Results 92
3.2.7 Shared and unique genes in CD4+ and CD8+ differentiation pathways
To identify genes which were consistently different between CD4+ and CD8+ T cell
populations the SAM lists generated when comparing CD4+ T cell populations to CD8+ T cell
populations were compared, resulting in the identification of two genes consistently able to
distinguish whether a cell was a CD4+ or a CD8+ T cell. These two genes were CD4 and
TSPAN18 and their expression was higher in CD4+ cells than in CD8+ T cells. Tables 1, 2 and
3 show the genes which are shared between the three gene lists generated by the three
possible comparisons when comparing the differentiation states between compartments
(CD4+ naive - CD8+ naive, CD4+ CM - CD8+ CM and CD4+ EM - CD8+EM, represented in
Fig. 3.28). Table 1 shows the genes shared between the comparisons CD4+ naive/CD8+ naive
and CD4+ CM/CD8+ CM and that these shared genes are all upregulated in the CD4+
populations. This indicates that either these genes are not expressed in CD8+ T cell
populations or just not as high as they are expressed in CD4+ T cells. The fold difference
CD4/CD8 is bigger in the CM comparison for 18 (out of 21) genes, indicating that there is a
bigger difference in expression levels for these genes between the CD4+ CM and CD8+ CM
populations.
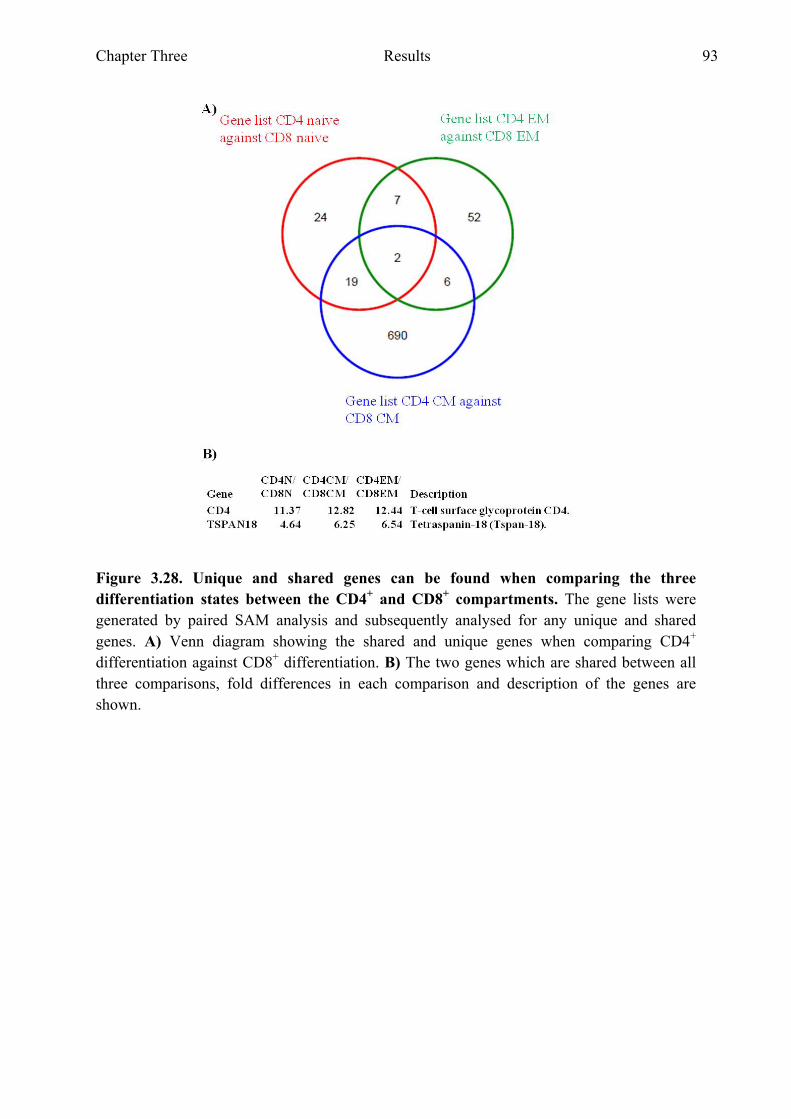
Chapter Three Results 93
Figure 3.28. Unique and shared genes can be found when comparing the three differentiation states between the CD4+ and CD8+ compartments. The gene lists were generated by paired SAM analysis and subsequently analysed for any unique and shared genes. A) Venn diagram showing the shared and unique genes when comparing CD4+ differentiation against CD8+ differentiation. B) The two genes which are shared between all three comparisons, fold differences in each comparison and description of the genes are shown.
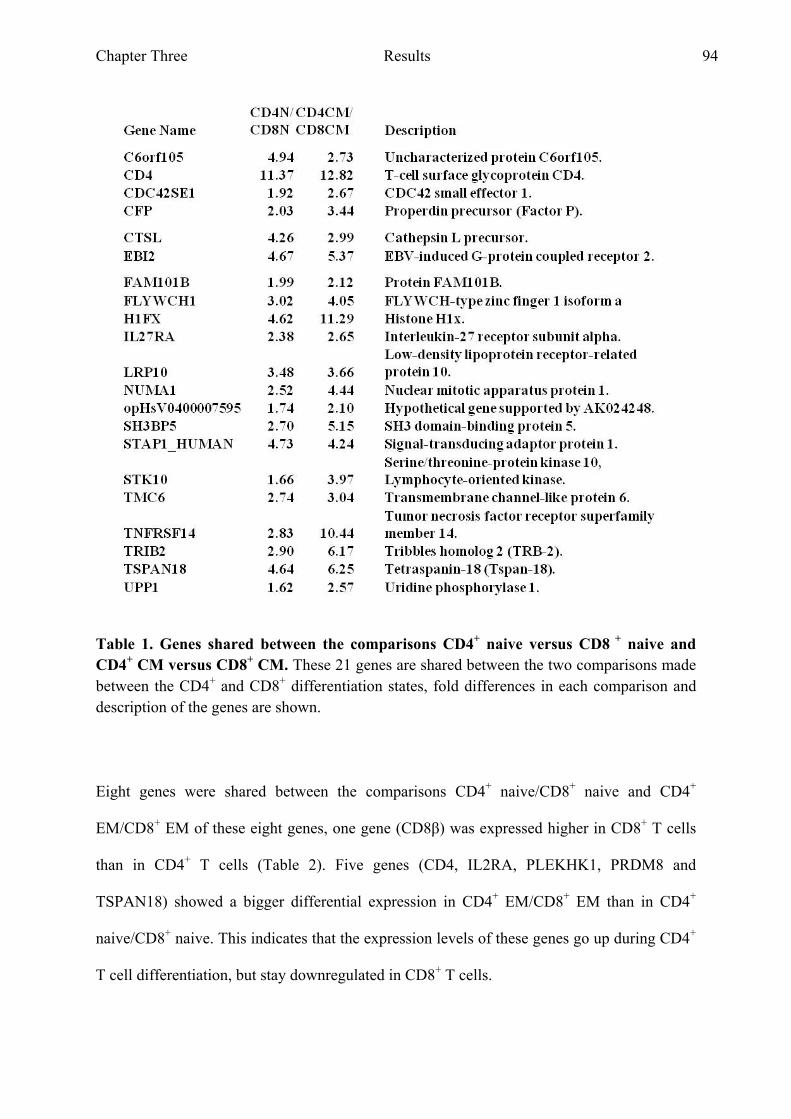
Chapter Three Results 94
Table 1. Genes shared between the comparisons CD4+ naive versus CD8 + naive and CD4+ CM versus CD8+ CM. These 21 genes are shared between the two comparisons made between the CD4+ and CD8+ differentiation states, fold differences in each comparison and description of the genes are shown.
Eight genes were shared between the comparisons CD4+ naive/CD8+ naive and CD4+
EM/CD8+ EM of these eight genes, one gene (CD8β) was expressed higher in CD8+ T cells
than in CD4+ T cells (Table 2). Five genes (CD4, IL2RA, PLEKHK1, PRDM8 and
TSPAN18) showed a bigger differential expression in CD4+ EM/CD8+ EM than in CD4+
naive/CD8+ naive. This indicates that the expression levels of these genes go up during CD4+
T cell differentiation, but stay downregulated in CD8+ T cells.
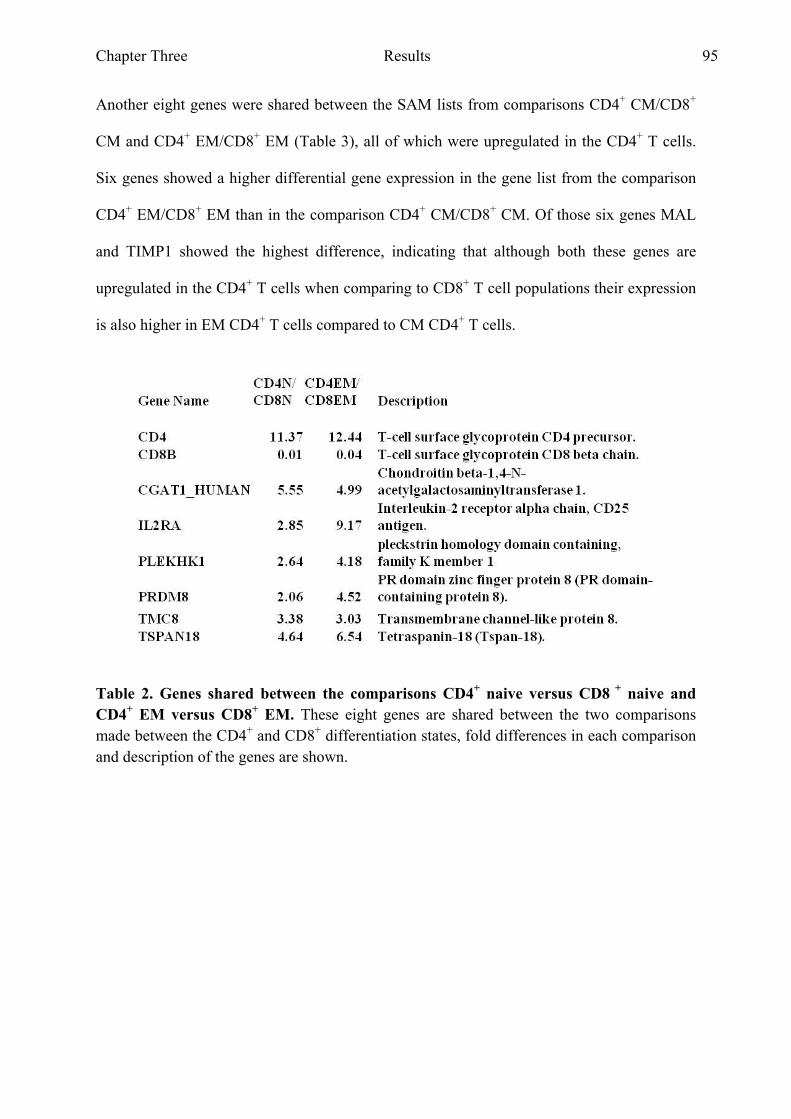
Chapter Three Results 95
Another eight genes were shared between the SAM lists from comparisons CD4+ CM/CD8+
CM and CD4+ EM/CD8+ EM (Table 3), all of which were upregulated in the CD4+ T cells.
Six genes showed a higher differential gene expression in the gene list from the comparison
CD4+ EM/CD8+ EM than in the comparison CD4+ CM/CD8+ CM. Of those six genes MAL
and TIMP1 showed the highest difference, indicating that although both these genes are
upregulated in the CD4+ T cells when comparing to CD8+ T cell populations their expression
is also higher in EM CD4+ T cells compared to CM CD4+ T cells.
Table 2. Genes shared between the comparisons CD4+ naive versus CD8 + naive and CD4+ EM versus CD8+ EM. These eight genes are shared between the two comparisons made between the CD4+ and CD8+ differentiation states, fold differences in each comparison and description of the genes are shown.
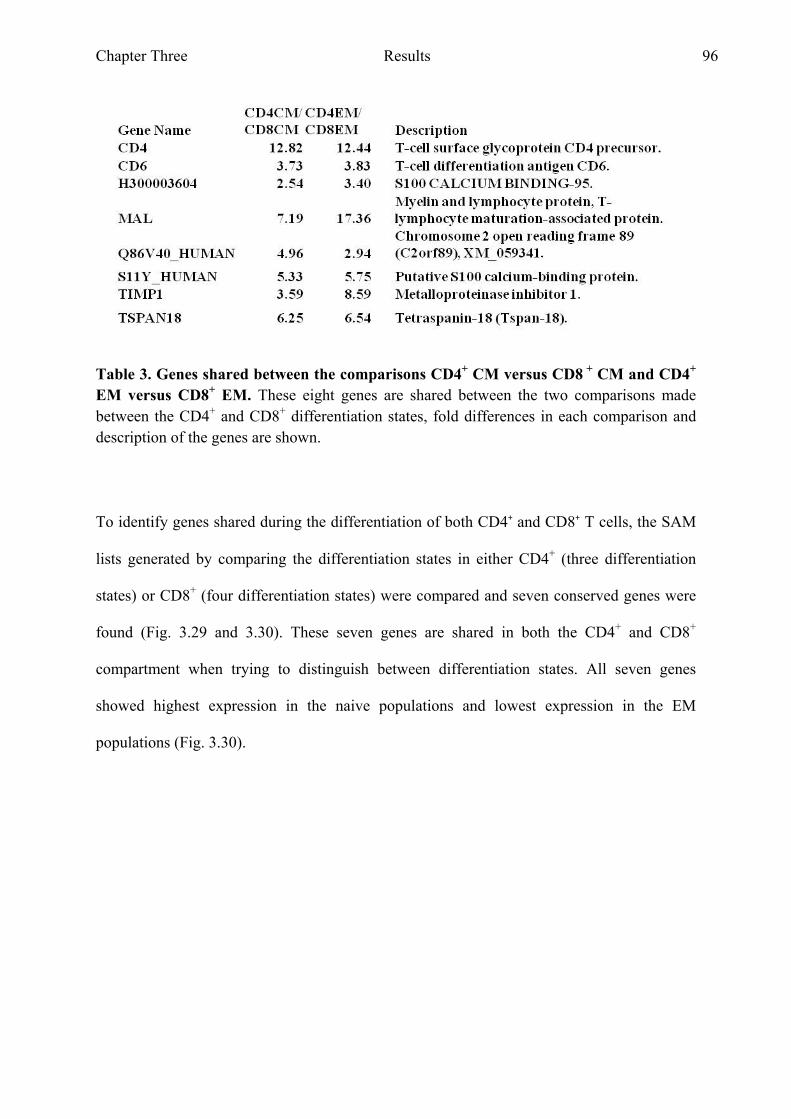
Chapter Three Results 96
Table 3. Genes shared between the comparisons CD4+ CM versus CD8 + CM and CD4+ EM versus CD8+ EM. These eight genes are shared between the two comparisons made between the CD4+ and CD8+ differentiation states, fold differences in each comparison and description of the genes are shown.
To identify genes shared during the differentiation of both CD4+ and CD8+ T cells, the SAM
lists generated by comparing the differentiation states in either CD4+ (three differentiation
states) or CD8+ (four differentiation states) were compared and seven conserved genes were
found (Fig. 3.29 and 3.30). These seven genes are shared in both the CD4+ and CD8+
compartment when trying to distinguish between differentiation states. All seven genes
showed highest expression in the naive populations and lowest expression in the EM
populations (Fig. 3.30).
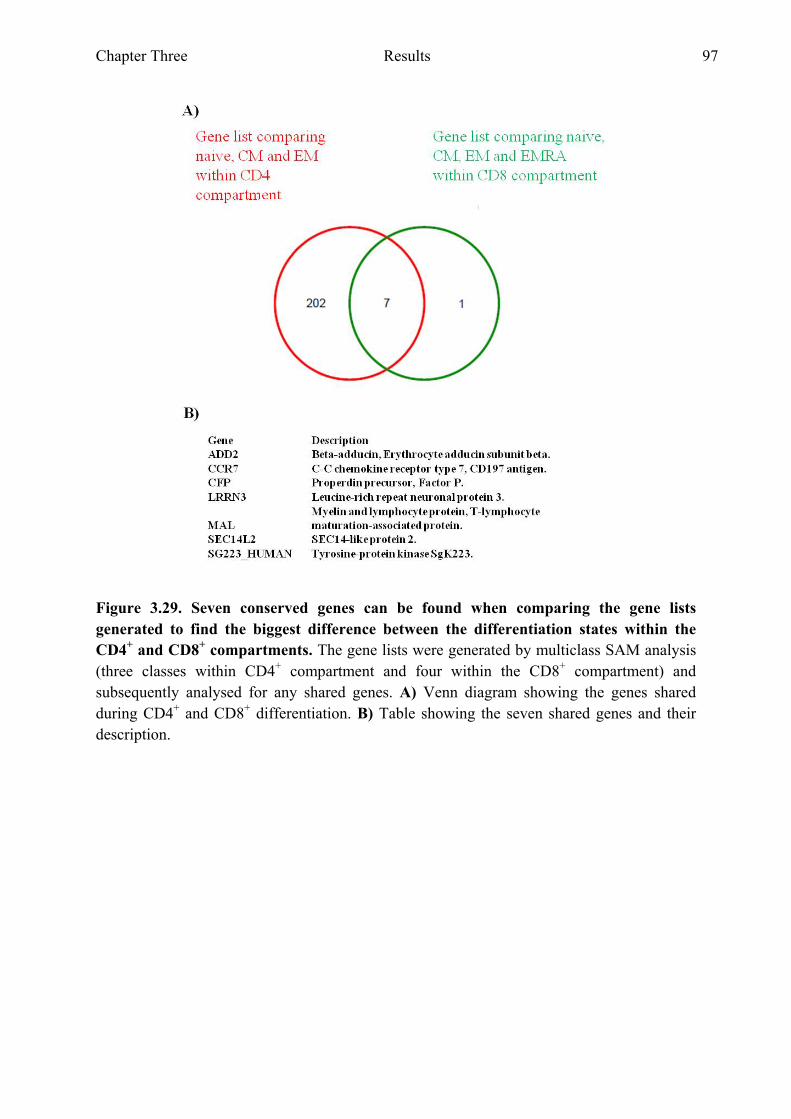
Chapter Three Results 97
Figure 3.29. Seven conserved genes can be found when comparing the gene lists generated to find the biggest difference between the differentiation states within the CD4+ and CD8+ compartments. The gene lists were generated by multiclass SAM analysis (three classes within CD4+ compartment and four within the CD8+ compartment) and subsequently analysed for any shared genes. A) Venn diagram showing the genes shared during CD4+ and CD8+ differentiation. B) Table showing the seven shared genes and their description.
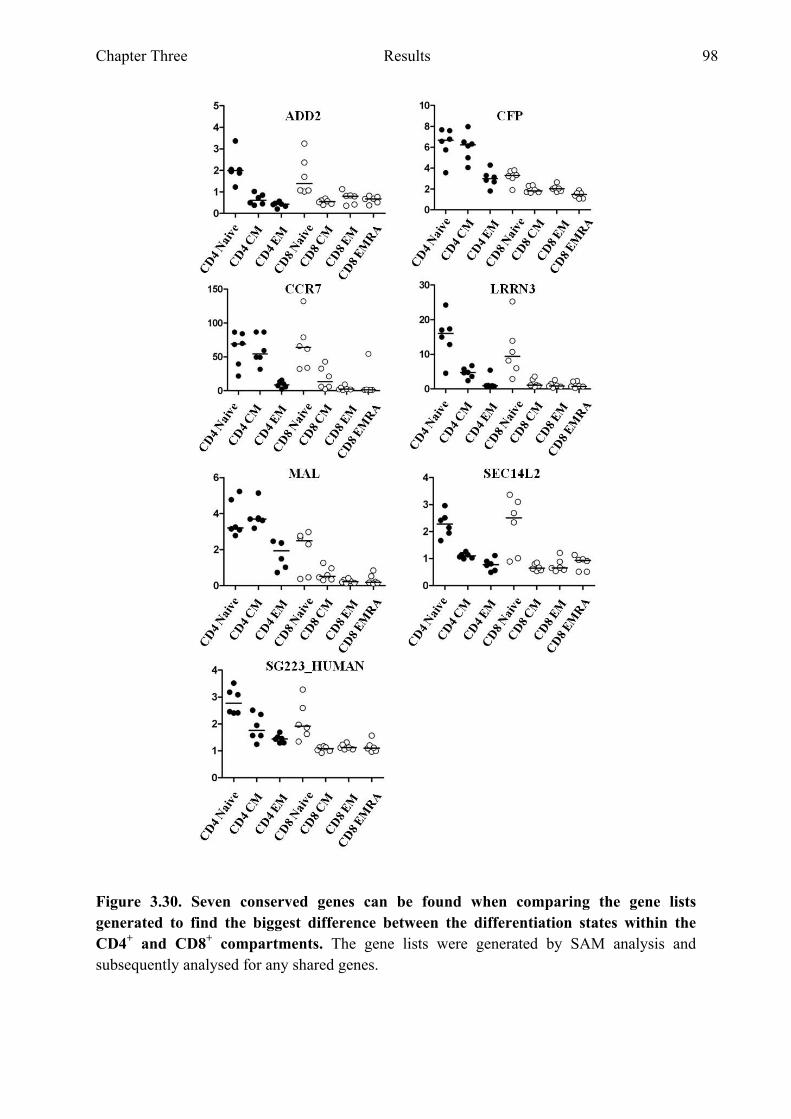
Chapter Three Results 98
Figure 3.30. Seven conserved genes can be found when comparing the gene lists generated to find the biggest difference between the differentiation states within the CD4+ and CD8+ compartments. The gene lists were generated by SAM analysis and subsequently analysed for any shared genes.
Chapter Three Results 99
3.3 Discussion.
T cell populations have been described using cell surface markers as well as intracellular
markers (transcription factors) and the ability of the cells to produce cytokines 43;57;58;114. Cell
surface markers, such as CCR7, CD62L and CD45RA/RO, have been used to describe
memory populations in both CD4+ and CD8+ T cells, however it is likely that within these
seemingly homogenous populations there is a variety of cell types which have not been
described yet 115. Microarray analysis can be used to identify genes (and genetic profiles)
which differ between T cell populations, but have not yet been described as having a role in T
cell biology. Several studies have shown that microarray analysis is a useful strategy to utilise
when trying to identify differences between cell populations sorted based on expression of
surface markers 108;111;116-118. The aim of the experiments in this chapter was to describe genes
which are significantly different in their expression between the T cell populations based on
CCR7 and CD45RA within the CD4+ and CD8+ compartments as well as genes which are
shared in the differentiation process in both the CD4+ and CD8+ T cell compartments.
It is noticeable when analysing the various SAM gene lists generated in the different
comparisons, that the number of differentially expressed genes in the CD8+ compartment is
lower than in the CD4+ compartment. This might indicate that the four differentiation states
within the CD8+ compartment are very similar in their function. The lower amount of
differentially expressed genes corresponds to the fact that in the literature CD4+ T cells can
be subdivided into many T helper subsets, whereas this has not been the case for the CD8+
compartment. The variety of T helper populations within the memory populations of the
CD4+ compartment may result in many more differentially expressed genes within the CD4+
compartment compared to the CD8+ compartment. When going through the gene lists
Chapter Three Results 100
generated it is noticeable that none of the CD4+ T helper cell associated genes, such as T-bet
and GATA-3 can be identified on the gene lists. This is also true for the typically Th1 or Th2
associated cytokines, such as IFNγ and IL-4, show up on the lists. This indicates that these
cells are either present at too low a frequency or that these gene products are only expressed
at relatively low levels. The genes which the array analysis has identified are therefore more
likely to be genes shared by all CD4+ T cell populations.
Microarray analysis identified several genes which are unique to the differentiation process
within the CD4+ or CD8+ compartments as well as genes which are shared between the two
compartments. The Venn diagram in Fig. 3.29 shows that there are seven genes which are
shared between the gene lists generated when comparing the three differentiation states
(naive, central memory and effector memory) between CD4+ and CD8+. These seven genes
are involved in the differentiation process in both CD4+ and CD8+ T cells, CCR7 and LRRN3
are two genes from this list, which show differential expression levels as the cells
differentiate (Fig. 3.30). Two genes (CD4 and TSPAN18) are shared between the lists
generated when comparing the differentiation states from the CD4 compartment to those of
the CD8 compartment (Fig. 3.28). This indicates that at least in our arrays the expression of
these two genes is sufficient in determining whether a sample is from the CD4+ T cell
compartment or from CD8+ T cell compartment.
Chapter Three Results 101
Many of the genes identified in our gene lists have already been described in T cell biology,
such as CD4, CD8, CCR7 and granzymes which supports the validity of finding other genes
which have not yet been implicated in T cell biology.
CC-chemokine receptor 7 (CCR7) has been used to describe several T cell populations in
combination with the surface marker CD45RA 114. CCL19 and CCL21 are the only two
ligands for this chemokine receptor and lymph nodes reticular fibroblasts in the T cell area
produce CCL21 which then allows circulating naive and CM T cells entry into the LNs 119.
Whereas both naive and CM T cells express CCR7 and therefore can recirculate through
peripheral lymphnodes, CCR7 expression is lost on the EM population 114. As shown in
figure 3.30, our results correspond with the literature, in that CCR7 expression from both
CD4+ and CD8+ naive and CM T cells is higher than that found in the EM or EMRA
populations.
L-selectin (SELL or CD62L) was among the 10 most differentially expressed genes between
the CD4+ CM and EM populations, with the highest expression found in the CD4+ CM
population. This corresponds with the described function of L-selectin as being expressed on
the surface of both naive and CM populations for both the CD4+ and the CD8+ compartments.
L-selectin allows these cells entry into LNs, by binding to its ligands, such as peripheral node
addressins (PNAds) present on the surface of high endothelial venules within the LNs 120 121.
CCR6 is a chemokine receptor and its ligand is CCL20, CCR6 expression has an important
role in mucosal immunity 122. In our arrays CCR6 (or FGFR10P) is more highly expressed in
both the CD4+ CM and EM populations compared to the CD4+ naive population. CCR6 and
CCL20 are important in intestinal immunity. CCR6-mediated signals help to organize

Chapter Three Results 102
lymphoid tissues such as Peyer's patches (PPs), mesenteric lymph nodes (MLNs) and
gutassociated lymphoid tissue (GALT) by recruiting both lymphoid and myeloid cells.
Expression of CCR6 has been described on both Th17 and Treg cells and this could
correspond to the higher expression of CCR6 found in our arrays in the more differentiated
cells.
TNFRSF14 (or Herpesvirus entry mediator, HVEM) belongs to a group of molecules
involved in costimulation as well as inhibition of T cell responses. These proteins span the
plasma membrane and their ligands are type II transmembrane proteins with intracellular N
terminus domains 123. OX-40 (CD134) and CD27 are both known members of the TNFRSF
family and both are known to function as costimulatory molecules on T cells during T cell
activation 123. HVEM, however, can inhibit T cell activation by binding to coinhibitory
receptors, such as B andT-lymphocyte attenuator (BTLA) or CD160 as well as as costimulate
T cells by functioning as a receptor for LIGHT (homologous to LTs, exhibits inducible
expression, and competes with HSV gD for herpesvirus entry mediator, a receptor expressed
by T lymphocytes or TNSF14). Expression of TNFRSF14 was found to be more highly
expressed on the CD4+ CM population compared to its CD8+ counterpart. Most T cells
express TNFRSF14 on their cell surface and recently it has been shown that knocking out
TNFRSF14 in a mouse model leads to a reduction in the amount of Th2 memory cells 124.
As described above CTLA-4 and CD28 are structurally related receptors present on the cell
surface of T cells. Both receptors can bind to CD80 and CD86, but ligation of CTLA-4 leads
to an inhibitory signal limiting T cell activation, whereas CD28 signalling functions as a
costimulatory signal 51 52.Furthermore, whereas CD28 expression on T cells is constitutive,
CTLA-4 expression is induced by T cell stimulation via the TCR. CTLA-4 expression was
Chapter Three Results 103
found to be higher in the CD4+ EM population, when compared to the CD8+ EM population.
This higher expression could be due to the presence of Tregs within the CD4+ compartment,
with Tregs constitutively expressing CTLA-4.
Myelin and lymphocyte protein (MAL) was cloned from both human T cells as well as from
cells in the nervous system, such as myelinating cells and oligodendrytes 125. MAL was
identified in our arrays as a differentially expressed gene within the CD8 compartment,
comparing CD8+ naive cells with CD8+ EM cells, with expression being higher in the naive
cells. It was also found to have higher expression in CD4+ CM and EM T cells compared to
their CD8+ counterparts. MAL is a transmembrane protein and has been described to be a
component of detergent insoluble complexes in myelinating and epithelial cells as well as in
T cells 125. In 2008 Antόn et al showed that MAL was required for efficient Lck expression
on the cell surface of T cells 126. The MAL protein contains a MAL and related proteins for
vesicle trafficking and membrane link (MARVEL) domain, which is present in proteins that
are involved in membrane localisation events. Antόn et al showed that Lck is transported to
the plasma membrane of T cells in MAL expressing vesicles. When they used a Jurkat TCR-
signalling impaired mutant, which did not express any MAL mRNA, they found that these
cells also did not express any MAL protein. The mutant Jurkat cells were found to be unable
to transport the TCR, ZAP-70 as well as LAT into the immunological synapse (IS). This
same phenotype was found when MAL expression was knocked down in both wild type
Jurkat cells as well as primary T cells by using MAL specific siRNA. Lck expression at the
plasma membrane was found to be significantly lower in the mutant Jurkat cells, as well as in
wild type Jurkat cells and primary cells treated with MAL specific siRNA. Expression of Lck
was found to be concentrated at a specific intracellular location within the MAL deficient
cells. Antόn et al showed that MAL expression in T cells is needed for a specific Lck
Chapter Three Results 104
transport pathway, required for Lck expression at the plasma membrane. A more recent paper
from Antόn et al (2011) describes a role for MAL in delivering proteins to the central
supramolecular activation cluster (cSMAC), which forms on the T cell surface within the IS
127. These data indicate an important role for MAL in T cell function and as figure 3.30
shows, MAL expression was found to be highest in the less differentiated cells from both
CD4+ and CD8+ T cell compartments. The overall expression of MAL seems to be higher
within the CD4+ compartment, which could possibly correlate with the fact that the CD4
molecule is able to bind more Lck than the CD8 molecule.
The genes for perforin (PRF) and granzymes A and H (GZMA/H) were found to be more
highly expressed in CD4+ EM, when compared to CD4+ CM T cells. This finding
corresponds to the literature where it has been described that cytotoxic T cells express high
levels of these proteins within their secretory granules 128. When granzymes are synthesised
they are inactive zymogens, when cleaved they become enzymatically active. Within the
secretory granules the granzymes are in an acidic environment, but when released into the
cytosol which has a pH of around 7, they become maximally active, since their pH optimum
is at 7.5 129. Granzyme A can aid in T cell motility by cleaving several extracellular matrix
proteins 128. In total five human granzymes have been described (A, B, H, K and M), of
which GZM A and GZM B are the most abundant 129. Delivery of granzymes to the target
cells is reliant on perforin created pores 130 131. Perforin itself is a calcium dependent pore
forming protein of 67 kDa and it is present together with granzymes within the secrotory
granules. There are two possible pathways described for how perforin aids granzyme delivery
to the cytosol of the target cells. The first possibility is that the granules are secreted into the
IS, where perforin forms a pore through the plasma membrane, allowing entry of the
granzymes. The second possibility is that when the granules are secreted into the IS, they are
Chapter Three Results 105
subsequently endocytosed by the target cell, after which perforin will form pores through the
membrane of the granule into the cytosol of the target cell 131.
Tetraspanin18, which was found to be significantly more highly expressed in CD4+ T cells,
compared to CD8+ T cells is a gene identified by our arrays which currently has no known
function in T cell biology. A second gene which currently has not been implicated in T cell
biology was LRRN3, which was found to mimic the expression of CCR7 in that it is highly
expressed in naive T cells, drops in central memory T cells and is lowest in effector memory
T cells. For both these genes there is no literature as to what their function might be in T cell
biology. The family of tetraspanins has been implicated in organising the cell membrane
resulting in coordinating signalling pathways and several groups have reported a role for
tetraspanin microdomains in MHC-II clustering on APCs 73;82;132;133. Unternaehrer et al
(2007) described that CD9 on mouse DCs is involved in the multimerisation of MHC-II
molecules on the cell surface and suggested that this multimerisation could enhance the
ability of DCs to engage with the T cell receptor. They found that the absence of CD9
abrogated MHC-II clustering 134. Kropshofer et al (2001) used an antibody against CDw78
microdomains on human cell lines and found that tetraspanins CD9, CD81 and CD82
associate with MHC-II in these microdomains. The function of tetraspanins on the cell
surface of APCs seems to enhance the signal strength from loaded MHC-II molecules, the
role of tetraspanin18 on the cell surface of CD4+ T cells could have a similar function, in
creating tetraspanin enriched domains containing CD4, costimulatory molecules and TCRs.
Since Tspan18 expression is consistently higher in CD4+ T cells compared to CD8+ T cells it
is possible Tspan18 actually clusters with the CD4 molecule on the cell surface. Another
possibility is that Tspan18 associates specifically with a molecule which is only involved in
CD4+ T cell function and not CD8+ T cell function. If a specific antibody against Tspan18
Chapter Three Results 106
becomes available it could be possible to test whether this holds true by doing a co-
imunoprecipitation assay with Tspan18.
LRRN3 has been implicated as a candidate gene for autism 135, because of its proximity to a
marker which consistently showed up in screens of chromosome 7. The region 7q22-31 is
suspected of containing a gene associated with autism. However it was concluded after
genotyping that there is no genomic variation in the LRRN3 gene associated with autism and
thus LRRN3 is in fact unlikely to be related to autism 135. NLRR-3, which is the mouse
ortholog of LRRN3 is highly expressed in the brain of mice and is thought to be important in
the development of the murine nervous system. Studies in Drosophila also suggest that the
LRR family is involved in target recognition and cell differentiation during the development
of the neuronal network 136. Haines et al (2005) describe NLRR-1 as possibly being involved
in myogenesis. In their paper they also examined the expression of NLRR-2 and NLRR-3
during mouse development 137. NLRR-3 was found to be highly expressed at 10.5 dpc in the
trigeminal and facio-acoustic ganglia and in the migrating germ cells in the tail. Its
expression in the neural tube was restricted to the developing motorhorn, whereas NLRR-2
expression could not be found during development. In adult mice NLRR-3 was highly
expressed in brain and in lower levels in lung, kidney and liver. The NLRR family are
proteins which are expressed on the cell surface and could be involved in cell adhesion or
signalling 137. Since LRRN3 consistently followed the same directionality as CCR7 it is
possible that LRRN3 on T cells functions as a cell surface marker which is expressed on cells
which need to be able to gain entry into LNs. To determine whether LRRN3 itself functions
as a receptor which allows entry into LNs, a chemotaxis assay could be set up if a suitable
antibody against LRRN3 becomes available.
ADD2 (Beta-adducin) shows up on two gene lists within the CD4 compartment, in the
comparison naive against CM as well as in the comparison naive against EM. In both
Chapter Three Results 107
comparisons its expression is higher in the naive population. ADD2 is a subunit of the
adducin cytoskeleton protein 138;139. Yenerel et al (2005) found that during in vitro erythroid
differentiation of human cells expression of ADD3 was higher than ADD2 expression at day
8, but by day 10 this had reversed. This data suggests that ADD3 is needed in early erythroid
differentiation whereas ADD2 is needed in later stages of differentiation. In our arrays the
expression of ADD2 highly expressed in the naive CD4 T cells compared to the differentiated
CM and EM populations. If ADD2 has a similar role on T cells as Yeneral et al (2005)
describe for red blood cells, it could be that during T cell maturation in the thymus a similar
switch of ADD3 and ADD2 occurs, reaching highest levels of ADD2 in the naive cells which
are then released into the periphery 139
AEBP1 (adipocyte enhancer binding protein 1) and MTUS1 (mitochondrial tumor suppressor
1 isoform 3) are shared between the gene lists generated when comparing CD4+ naive T cells
to EM and CM to EM cells. In these comparisons, both genes were more highly expressed on
naive or CM cells respectively. Ro et al (2007) describe a role for AEBP1 in energy
homeostasis of mice 140. Rodrigues-Ferreira et al (2009) describe a correlation between
MTUS1 downregulation and breast cancer tumours which are highly proliferative 141.
S100A4 (S100 calcium binding protein A4) shows up in the comparisons naive versus CM
and naive versus EM and in both cases the gene is expressed more highly in the more
differentiated cells. Haining et al (2008) also identified S100A4 as a differentially expressed
gene, in studies addressing a transcriptional signature of human CD8+ memory cell
differentiation which is shared by T and B cells 108. S100A4 has been described to enhance
the motility of cancer cells by its interaction with myosin-IIA, Haining et al (2008) suggest
that its function on more differentiated cells could be to enhance their ability to migrate
108;142. MYO1F (Myosin-If), also found to be upregulated in previous studies, showed the
same trend as S100A4, in that it is more highly expressed in the more differentiated CD4+ T
Chapter Three Results 108
cells. Kim et al (2006) showed that mice deficient in Myo1f have increased adhesion and
reduced mobility 143.
BHLHB2 (class B helix-loop-helix protein 2) can be found in all three gene lists generated
when comparing the three differentiation states within the CD4+ compartment. Spontaneous
activation of T cells occurs in mice deficient in the transcription factor Stra13 (BHLHB2) and
these mice go on to develop autoimmunity 108;144. Haining et al (2008) suggest that increased
expression of BHLHB2 in the more differentiated cells could be needed for quiescence 108.
Indeed BHLHB2 expression was found to be highest in the more differentiated CD4+ EM
population. Based on the results discussed in this chapter a list of 96 genes was generated to
validate the array results by Real Time PCR.
Based on our data two possible models of T cell differentiation can be suggested, a linear
model of T cell differentiation and a non-linear model of T cell differentiation (Fig. 3.31 and
3.32). Several models for T cell differentiation have been proposed before; Kallies (2008)
suggests a pathway for CD8+ T cell differentiation which is similar to the non-linear model of
T cell differentiation shown in Fig. 3.31 145. Kalies suggests that differential expression of
transcription factors and responsiveness to cytokines results in the development of distinct T
cell populations. Kallies’ model is based on expression levels of the cytokines IL-2 and IL-12
and transcription factors T-bet, Eomes and Blimp-1, he suggests that low levels of IL-2 and
IL-12 in the environment skew naive T cells to memory precursor effector cells (MPECs),
which express low levels of T-bet, Eomes and Blimp-1. The MPECs can then give rise to
long lived memory cells (central memory) and long lived effector cells (effector memory).
High levels of IL-2 and IL-12 will skew the naive cells towards short lived effector cells.
Chang et al (2007) suggest that the occurrence of distinct differentiated T cells is a result of
Chapter Three Results 109
asymmetric cell division 146. A naive T cell is activated by an antigen presenting cell (APC)
and this results in the formation of an immunological synapse containing CD4+ and CD8+ T
cell coreceptors, adhesion molecules and cytokine receptors. The interaction between the T
cell and the APC lasts for several hours and could therefore last during cell division. They
suggest that the daughter cell near the immunological synapse gives rise to effector cells,
whereas the cell derived from the distal end differentiates into memory cells 146. Catron et al
(2006) suggest yet another possibility as to how central memory cells arise. First they
assessed what the dynamics of naive T cell circulation were when naive CD4+ T cells specific
for the I-Eα MHC-II molecule were injected into wildtype C57BL/6 recipient mice which
lack this antigen. Naive cells were shown to quickly enter lymph nodes using CD62L, where
they remained for a day before returning to the circulation. Their subsequent experiments
identified two populations. The first is a resident population, which was not affected by
blocking CD62L with an antibody, had gone through more than six cell divisions and the
majority of which did not express either CD62L or CCR7. The second population, the late-
arriving population, could be blocked by anti-CD62L treatment, had undergone one to six
cell divisions and expressed both CD62L and CCR7 at high levels. The features of the late-
arriving cell population suggest that these could be central memory cells, whereas the
resident population shares the features of an effector population 147.
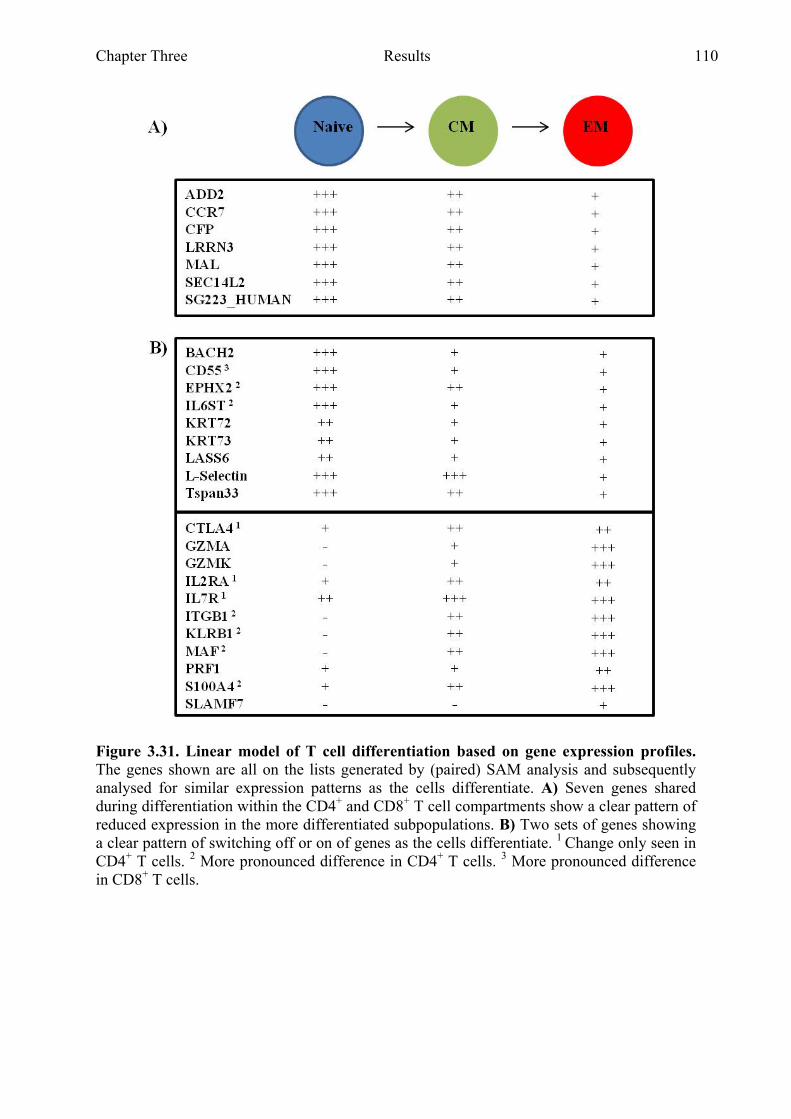
Chapter Three Results 110
Figure 3.31. Linear model of T cell differentiation based on gene expression profiles. The genes shown are all on the lists generated by (paired) SAM analysis and subsequently analysed for similar expression patterns as the cells differentiate. A) Seven genes shared during differentiation within the CD4+ and CD8+ T cell compartments show a clear pattern of reduced expression in the more differentiated subpopulations. B) Two sets of genes showing a clear pattern of switching off or on of genes as the cells differentiate. 1 Change only seen in CD4+ T cells. 2 More pronounced difference in CD4+ T cells. 3 More pronounced difference in CD8+ T cells.
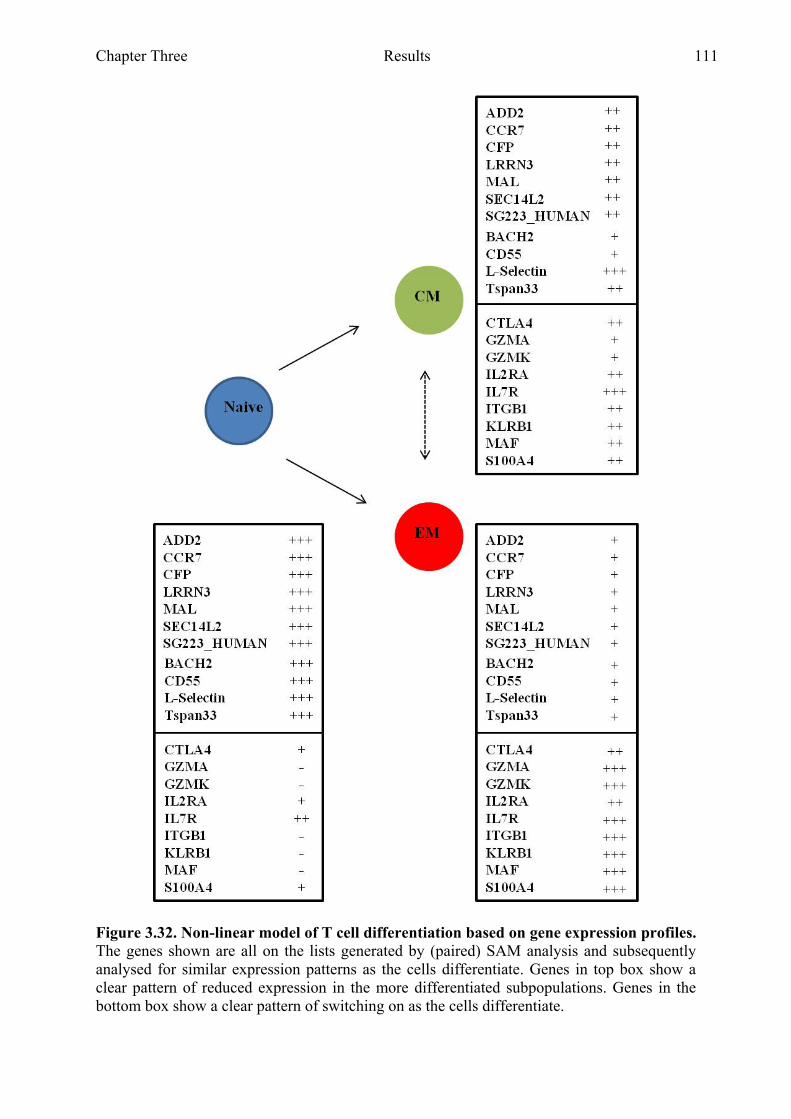
Chapter Three Results 111
Figure 3.32. Non-linear model of T cell differentiation based on gene expression profiles. The genes shown are all on the lists generated by (paired) SAM analysis and subsequently analysed for similar expression patterns as the cells differentiate. Genes in top box show a clear pattern of reduced expression in the more differentiated subpopulations. Genes in the bottom box show a clear pattern of switching on as the cells differentiate.
Chapter Three Results 112
The gene expression patterns described in this chapter cannot by themselves point to which of
these three described theories of T cell differentiation is true for the populations analysed. It
is also not necessarily the case that these three differentiation pathways are mutually
exclusive of each other. What our data does suggest is that for many of the genes shared
when comparing between the naive, CM and EM populations for both CD4+ and CD8+ T cell
populations the CM population shows gene expression levels intermediate to those of the
naive and the EM populations. This suggests to us that these genes could very well be
important in the fine-tuning which results in the different differentiation states. Fig. 3.31 and
3.32 both show the seven genes which are shared when comparing the SAM gene lists
generated through the comparisons of differentiation states in either CD4+ (three
differentiation states) or CD8+ (four differentiation states). It is clear that these genes show
the highest expression in the naive population and lowest in the EM population. This
indicates that in both CD4+ and CD8+ T cells there are several important genes which need to
be switched off or downregulated during the differentiation of a naive T cell into an EM T
cell. The genes in Fig. 3.31B are selected from the SAM lists of all comparisons specifically
looking for genes which show a trend. It shows that apart from those seven shared genes
there are another nine genes which follow the same trend of highest expression in naive T
cells and lowest in EM T cells. There are also 11 genes which follow the opposite gene
expression in that their expression is highest in EM cells and lowest in the naive cells, many
of which are known to be involved in effector function (such as the granzymes and perforin).
Both a linear model and a non-linear model of differentiation could be supported by our data.
Naive T cells could give rise to CM T cells by downregulation of some genes and
upregulation of several others, after which the CM T cells could continue the downregulation
and upregulation of the same genes and give rise to the EM population which would be in
line with a linear pathway of differentiation. However a non-linear model of differentiation is
Chapter Three Results 113
also supported by our gene expression patterns and incorporating the asymmetric model of
differentiation we could postulate that a naive T cell can give rise to both a CM and an EM T
cell. The late-arriving cell model of differentiation could also be used in conjunction with our
non-linear model of differentiation, where a naive T cell encounters antigen in the lymph
node and is activated to give rise to an EM cell and a subsequent naive T cell to arrive to the
site of antigen presentation is stimulated to give rise to a CM T cell. Our data cannot exclude
the possibility of ‘inter-differentiation’ where a CM cell could differentiate into an EM cell
and vice versa.

Chapter Four Results 114
Chapter Four
Validating Gene Expression Profiles of CD4+ and
CD8+ T Cell Populations by Real Time PCR
Analysis
Chapter Four Results 115
4 VALIDATING GENE EXPRESSION PROFILES OF CD4+ AND
CD8+ T CELL POPULATIONS BY REAL TIME PCR ANALYSIS
4.1 Introduction
The results from the previous chapter showed that a number of shared and unique genes
could be identified when comparing CD4+ and CD8+ T cell populations. To validate the
results from the microarray analysis a list of 96 genes was chosen from the different
Significance Analysis of Microarray (SAM) lists generated by all the different comparisons.
These 96 genes included two housekeeping genes, ribosomal RNA 18S and GAPDH.
Quantitative Real Time polymerase chain reaction (PCR) is a more accurate way of utilising
PCR analysis to quantify the expression level of a certain gene in a sample. The addition of
fluorescent probes to Real Time PCR allows accurate measurement of a fluorescent signal
during the PCR reaction, hence the addition Real Time 109. Real Time PCR has been used to
validate gene expression results obtained from microarray analysis because it allows the
researcher to focus on several specific genes with a more quantitative technique. Wang et al
(2008) compared the gene expression profiles of bulk CD4+ and CD8+ T cells against each
other as well as against the total CD3+ population; gene expression between these three
populations was found to be largely conserved, but not identical. They then used Real Time
PCR to validate their microarray results and found that the Real Time PCR data for several
selected genes corresponded with the microarray data. By comparing the log ratios of the
timepoint/0 hour calculated for both the PCR data and the microarray data on an x/y-plot, the
correlation between the data sets could be visualised 110. Chtanova et al (2001) used
microarray analysis to compare the gene expression profiles of murine CD4+ Th1 and Th2
Chapter Four Results 116
cells and CD8+ type 1 and type 2 T cells. Type 1 CD8+ T cells are thought to arise by
exposure to IL-12, whereas type 2 CD8+ T cells require IL-4. The populations analysed were
shown to exhibit differential expression of cytokine, growth factor and transcription factor
genes; which was validated through Real Time PCR analysis 111. To date Real Time PCR
remains the gold standard for validating microarray results 109;112.
TaqMan low density arrays (LDAs) are customisable 384-well micro fluidic cards designed
to be used with the Applied Biosystems 7900HT Fast Real-Time PCR System. Each LDA
can be used to perform 384 real-time PCR reactions on one to eight samples simultaneously.
To validate the gene expression profiles found in Chapter 3, 96 genes were selected from the
SAM lists generated in Chapter 3 and a specific LDA was created with each card containing
four repeats.
The aim of the experiments in this chapter was to validate the gene expression values
identified through the microarray results by analysing the gene expression values of 96
specific genes through micro fluidic Real Time PCR (Supplemental Table 1).
Chapter Four Results 117
4.2 Results
4.2.1 Sorting CD4+ and CD8+ T cell populations based on CCR7 and
CD45RA for gene expression analysis on microfluidic cards
CD4+ and CD8+ T cell populations were sorted based on expression of CCR7 and CD45RA.
In the sorting protocol for the CD4+ T cells monocytes were excluded by adding an antibody
against CD14 (Fig. 4.1A). CD8+ T cell populations were sorted based on CD8β expression
which allowed the analysis of CD8αβ T cells only and excluded any NK cells which express
CD8α as a homodimer on their cell surface (Fig. 4.1B). The resulting sorted populations were
all more than 95% pure. Sorting gates used differed slightly from the gates used to analyse
the purities of the sorts. During the sort a very tight gate was set around the population of
interest, to ensure the purest populations possible; when analysing the purities a gate which
was slightly bigger than the sorting gate could therefore be used.
Five healthy donors were used to sort five replicates of each population, two donors which
had been analysed in the microarray experiment and three new donors. The mRNA of
100,000 cells from each population was reverse transcribed and the resulting cDNA was then
used to run on a micro fluidic card. The relative quantity of signal per gene was calculated by
setting thresholds within the logarithmic phase of the PCR for the control gene (18S) and the
target gene. The cycle number (Ct) at which the threshold was reached was then determined.
The Ct for the target gene was subtracted from the Ct for the control gene and the relative
quantity was calculated as 2-ΔCT.
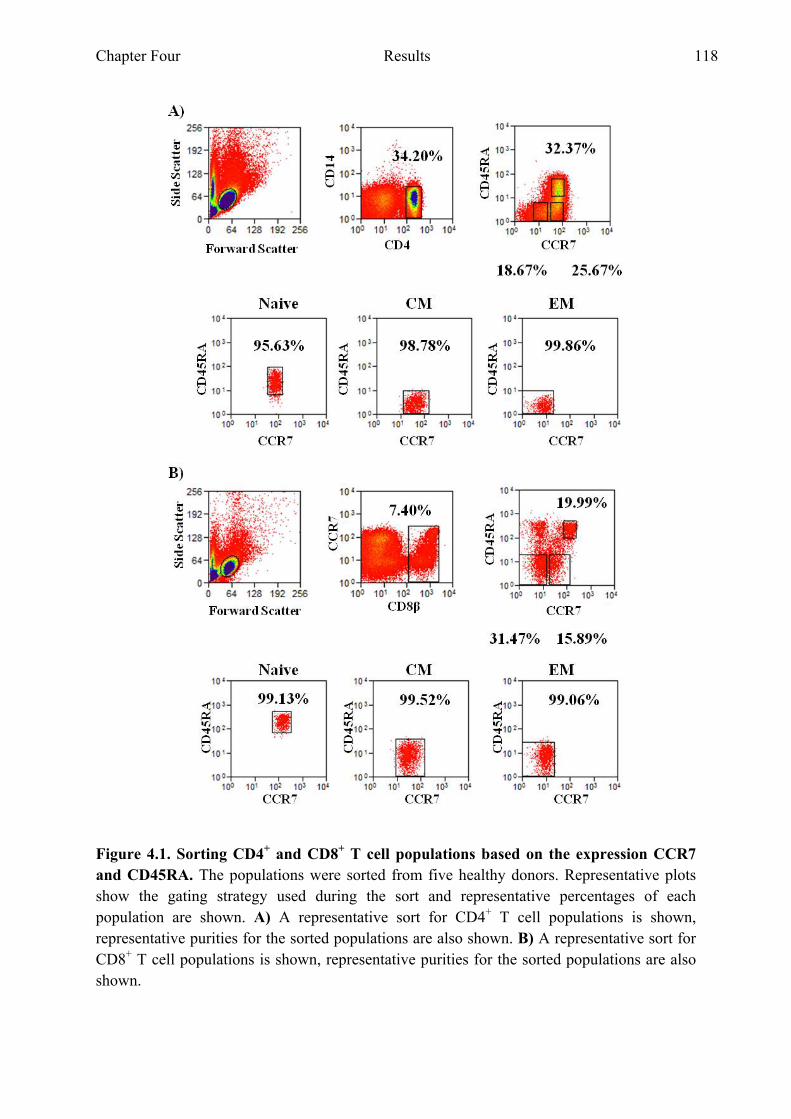
Chapter Four Results 118
Figure 4.1. Sorting CD4+ and CD8+ T cell populations based on the expression CCR7 and CD45RA. The populations were sorted from five healthy donors. Representative plots show the gating strategy used during the sort and representative percentages of each population are shown. A) A representative sort for CD4+ T cell populations is shown, representative purities for the sorted populations are also shown. B) A representative sort for CD8+ T cell populations is shown, representative purities for the sorted populations are also shown.
Chapter Four Results 119
4.2.2 Gene expression profiles identified through microarray correspond
with the expression found through Real Time PCR analysis
To analyse the correlation between the microarray results from Chapter 3 and the micro
fluidic card results, the gene expression profiles for the 96 genes selected for validation were
compared. The microarray data were available as a log 2 ratio of reference/sample, whereas
the Real Time PCR data was available as a relative quantity value. Since the PCR data did
not have a reference sample run alongside, which would enable calculating the log 2 ratio of
reference/sample for the PCR data, a different approach was used to analyse correlation
between microarray results and PCR results. For each comparison made, the fold differences
were calculated for both the array data and the PCR data; these were then converted to a log 2
scale, because the range of the fold differences was too high to be represented well on a linear
scale (Supplementary Table 1). The log 2 value of the fold difference from the PCR data (Fig.
4.2 x-axis) was then plotted against the log 2 value of the fold difference from the array data
(Fig. 4.2 y-axis). The plots in Fig. 4.2 clearly show that the data from PCR and array for the
96 genes which were selected for validation correlate to each other.
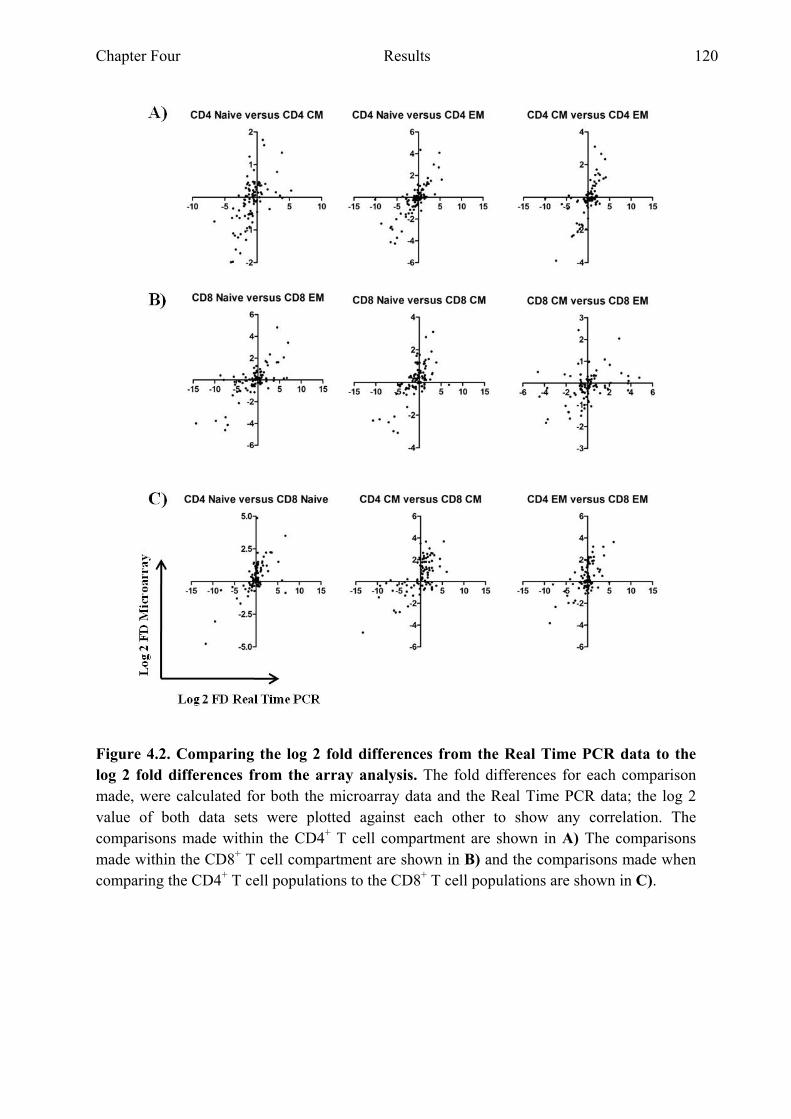
Chapter Four Results 120
Figure 4.2. Comparing the log 2 fold differences from the Real Time PCR data to the log 2 fold differences from the array analysis. The fold differences for each comparison made, were calculated for both the microarray data and the Real Time PCR data; the log 2 value of both data sets were plotted against each other to show any correlation. The comparisons made within the CD4+ T cell compartment are shown in A) The comparisons made within the CD8+ T cell compartment are shown in B) and the comparisons made when comparing the CD4+ T cell populations to the CD8+ T cell populations are shown in C).
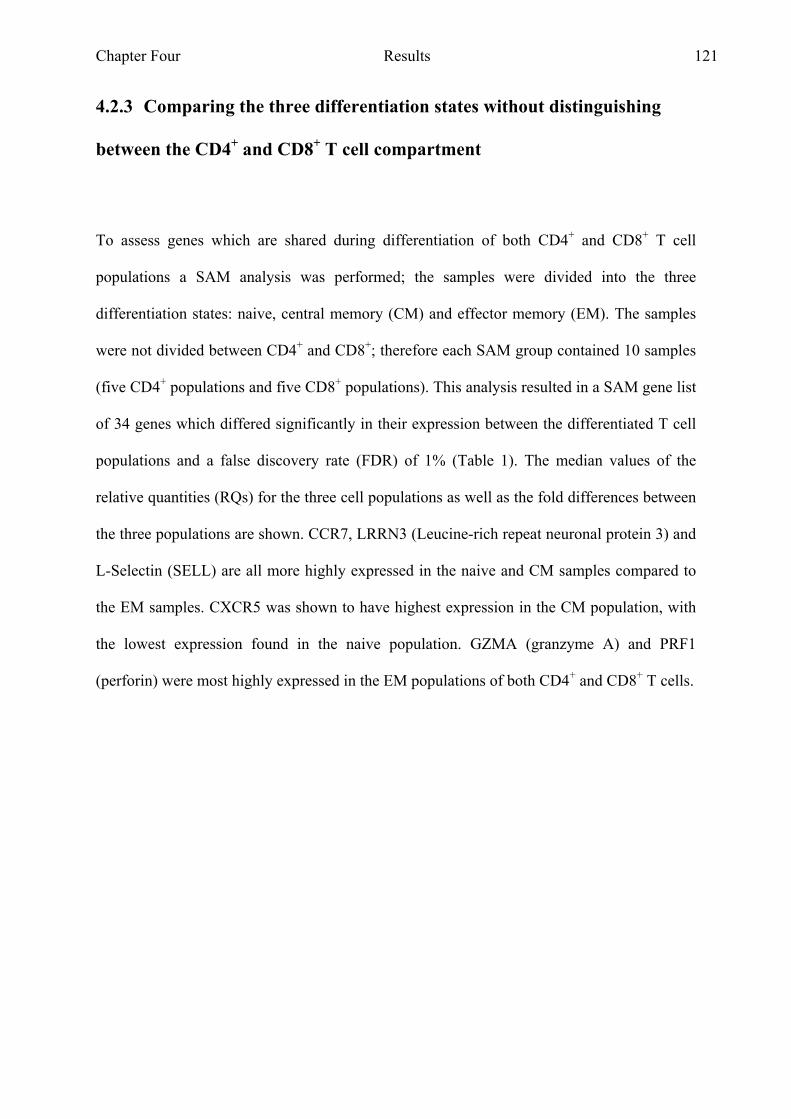
Chapter Four Results 121
4.2.3 Comparing the three differentiation states without distinguishing
between the CD4+ and CD8+ T cell compartment
To assess genes which are shared during differentiation of both CD4+ and CD8+ T cell
populations a SAM analysis was performed; the samples were divided into the three
differentiation states: naive, central memory (CM) and effector memory (EM). The samples
were not divided between CD4+ and CD8+; therefore each SAM group contained 10 samples
(five CD4+ populations and five CD8+ populations). This analysis resulted in a SAM gene list
of 34 genes which differed significantly in their expression between the differentiated T cell
populations and a false discovery rate (FDR) of 1% (Table 1). The median values of the
relative quantities (RQs) for the three cell populations as well as the fold differences between
the three populations are shown. CCR7, LRRN3 (Leucine-rich repeat neuronal protein 3) and
L-Selectin (SELL) are all more highly expressed in the naive and CM samples compared to
the EM samples. CXCR5 was shown to have highest expression in the CM population, with
the lowest expression found in the naive population. GZMA (granzyme A) and PRF1
(perforin) were most highly expressed in the EM populations of both CD4+ and CD8+ T cells.
Chapter Four Results 122
Table 1. Comparing the gene expression of sorted naive, central memory (CM) and effector memory (EM) CD4+ and CD8+ T cell populations. SAM analysis resulted in a list of 34 significant genes (1% FDR).
Chapter Four Results 123
4.2.4 Comparing the three differentiation states within the CD4+ T cell
compartment
To generate a list of genes which are significantly differentially expressed between the three
cell populations within the CD4+ compartment a SAM was performed, dividing the samples
into three groups. This generated a list of 26 genes with a FDR of 1% (Table 2), Fig. 4.3A
shows the HCL based on this gene list. The HCL reveals that these 26 genes allow good
clustering of the samples into their relevant differentiation states. The PCA (Fig. 4.3B)
visualises the clustering of the samples. The PCA shows that the naive and CM populations
are the most similar in their gene expression compared to the EM population.
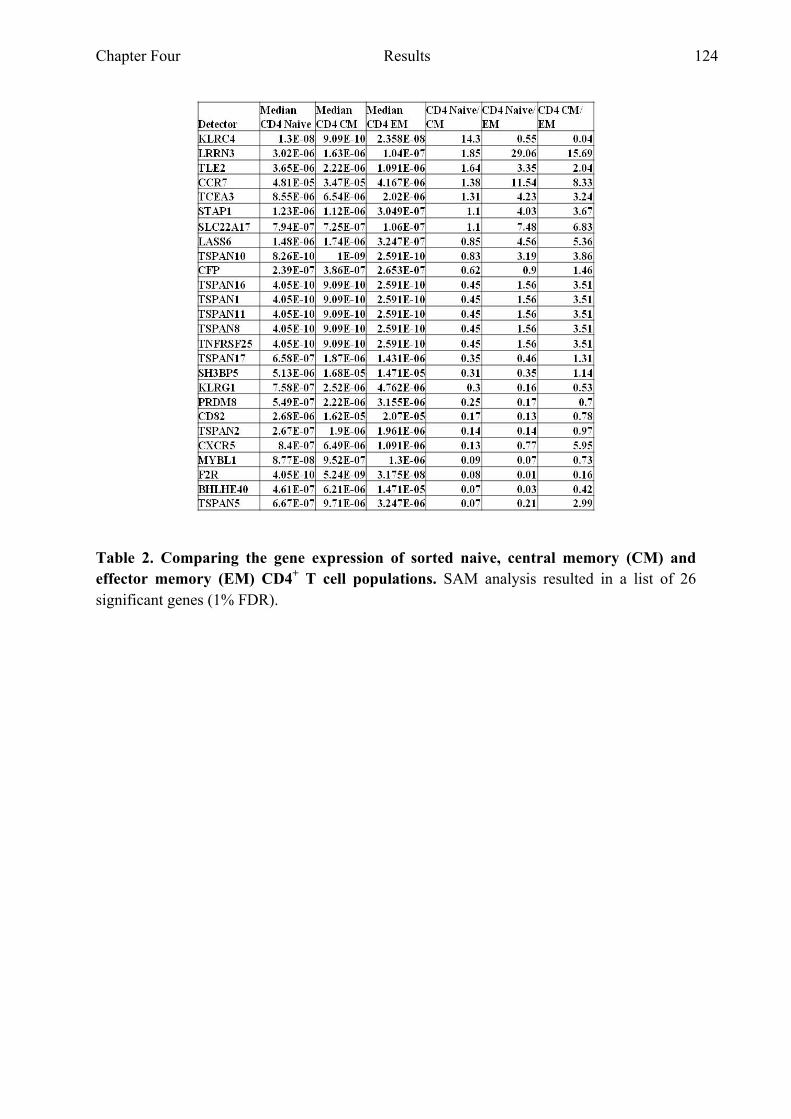
Chapter Four Results 124
Table 2. Comparing the gene expression of sorted naive, central memory (CM) and effector memory (EM) CD4+ T cell populations. SAM analysis resulted in a list of 26 significant genes (1% FDR).
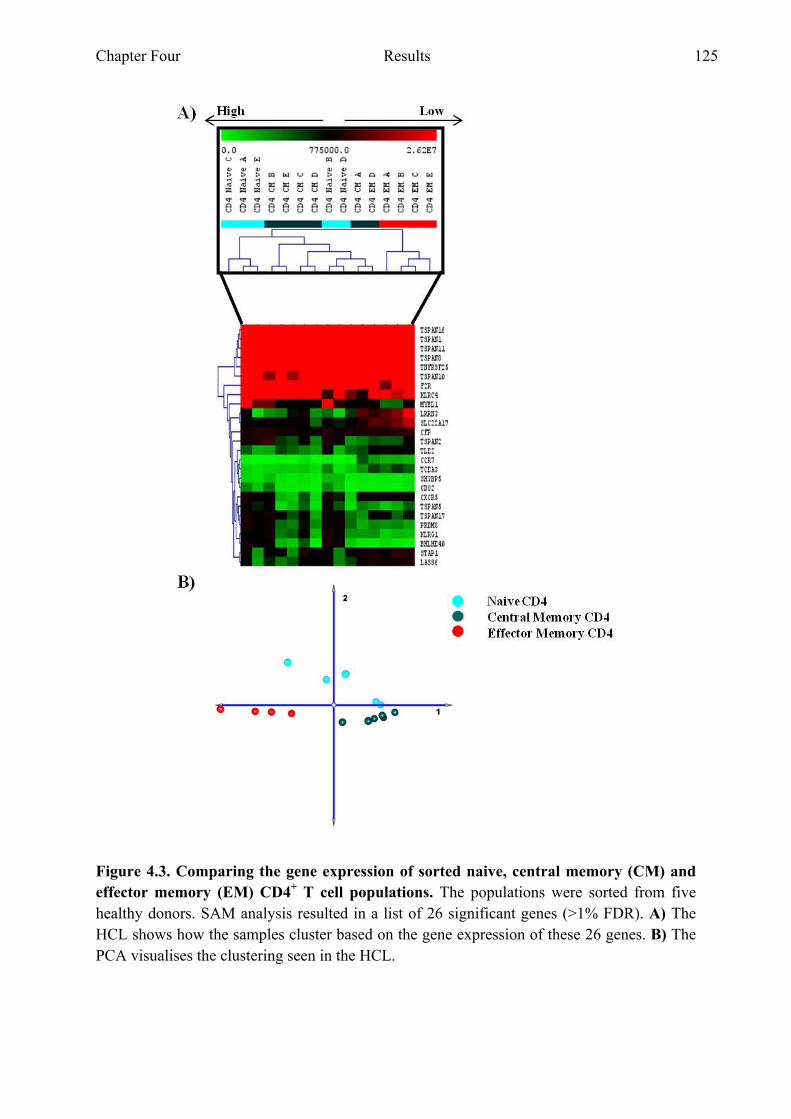
Chapter Four Results 125
Figure 4.3. Comparing the gene expression of sorted naive, central memory (CM) and effector memory (EM) CD4+ T cell populations. The populations were sorted from five healthy donors. SAM analysis resulted in a list of 26 significant genes (>1% FDR). A) The HCL shows how the samples cluster based on the gene expression of these 26 genes. B) The PCA visualises the clustering seen in the HCL.
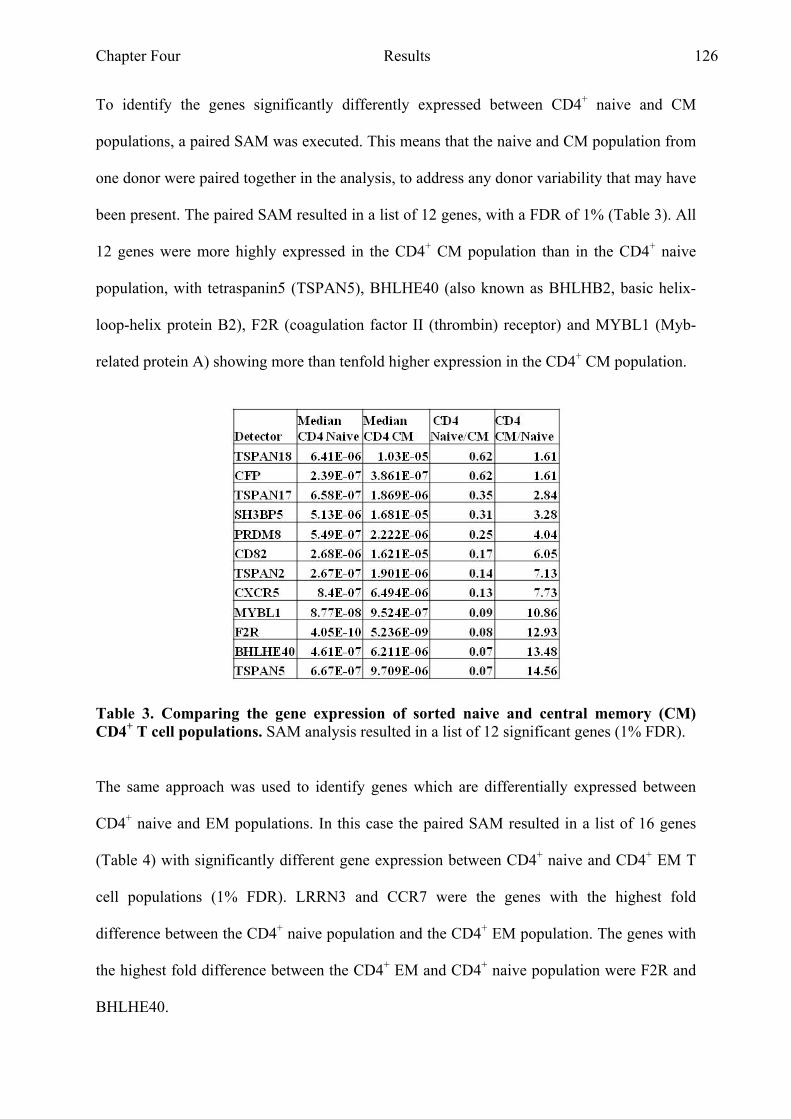
Chapter Four Results 126
To identify the genes significantly differently expressed between CD4+ naive and CM
populations, a paired SAM was executed. This means that the naive and CM population from
one donor were paired together in the analysis, to address any donor variability that may have
been present. The paired SAM resulted in a list of 12 genes, with a FDR of 1% (Table 3). All
12 genes were more highly expressed in the CD4+ CM population than in the CD4+ naive
population, with tetraspanin5 (TSPAN5), BHLHE40 (also known as BHLHB2, basic helix-
loop-helix protein B2), F2R (coagulation factor II (thrombin) receptor) and MYBL1 (Myb-
related protein A) showing more than tenfold higher expression in the CD4+ CM population.
Table 3. Comparing the gene expression of sorted naive and central memory (CM) CD4+ T cell populations. SAM analysis resulted in a list of 12 significant genes (1% FDR).
The same approach was used to identify genes which are differentially expressed between
CD4+ naive and EM populations. In this case the paired SAM resulted in a list of 16 genes
(Table 4) with significantly different gene expression between CD4+ naive and CD4+ EM T
cell populations (1% FDR). LRRN3 and CCR7 were the genes with the highest fold
difference between the CD4+ naive population and the CD4+ EM population. The genes with
the highest fold difference between the CD4+ EM and CD4+ naive population were F2R and
BHLHE40.
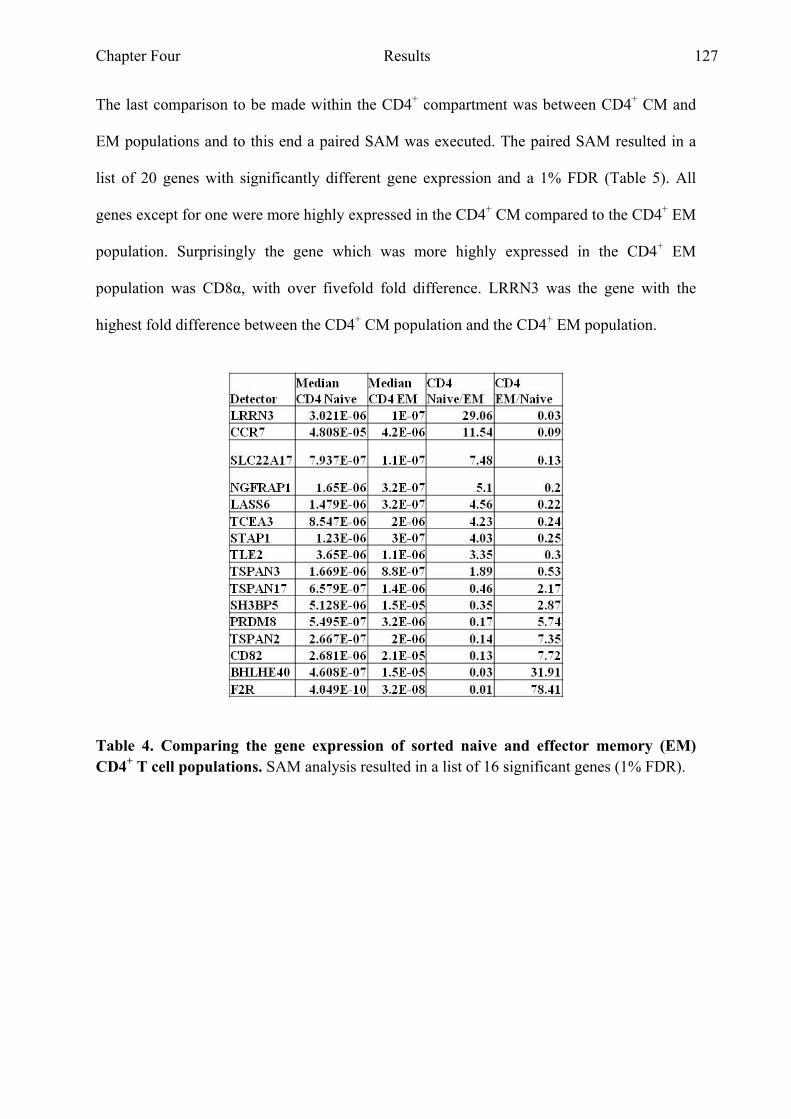
Chapter Four Results 127
The last comparison to be made within the CD4+ compartment was between CD4+ CM and
EM populations and to this end a paired SAM was executed. The paired SAM resulted in a
list of 20 genes with significantly different gene expression and a 1% FDR (Table 5). All
genes except for one were more highly expressed in the CD4+ CM compared to the CD4+ EM
population. Surprisingly the gene which was more highly expressed in the CD4+ EM
population was CD8α, with over fivefold fold difference. LRRN3 was the gene with the
highest fold difference between the CD4+ CM population and the CD4+ EM population.
Table 4. Comparing the gene expression of sorted naive and effector memory (EM) CD4+ T cell populations. SAM analysis resulted in a list of 16 significant genes (1% FDR).

Chapter Four Results 128
Table 5. Comparing the gene expression of sorted central memory (CM) and effector memory (EM) CD4+ T cell populations. SAM analysis resulted in a list of 20 significant genes (1% FDR).
4.2.5 Comparing the three differentiation states within the CD8+ T cell
compartment
To generate a list of genes which are significantly differentially expressed between the three
cell populations within the CD8+ compartment a SAM was performed, dividing the samples
into three groups. This analysis resulted in a list of 22 genes which were found to be
expressed at significantly different levels between the three differentiation states (1% FDR,
Table 6). NGFRAP1 (nerve growth factor receptor (TNFRSF16) associated protein 1) was
found to have the highest expression in CD8+ naive T cells and its expression dropped down
as the cells differentiate. LRRN3, CCR7 and L-selectin were also all expressed highest on
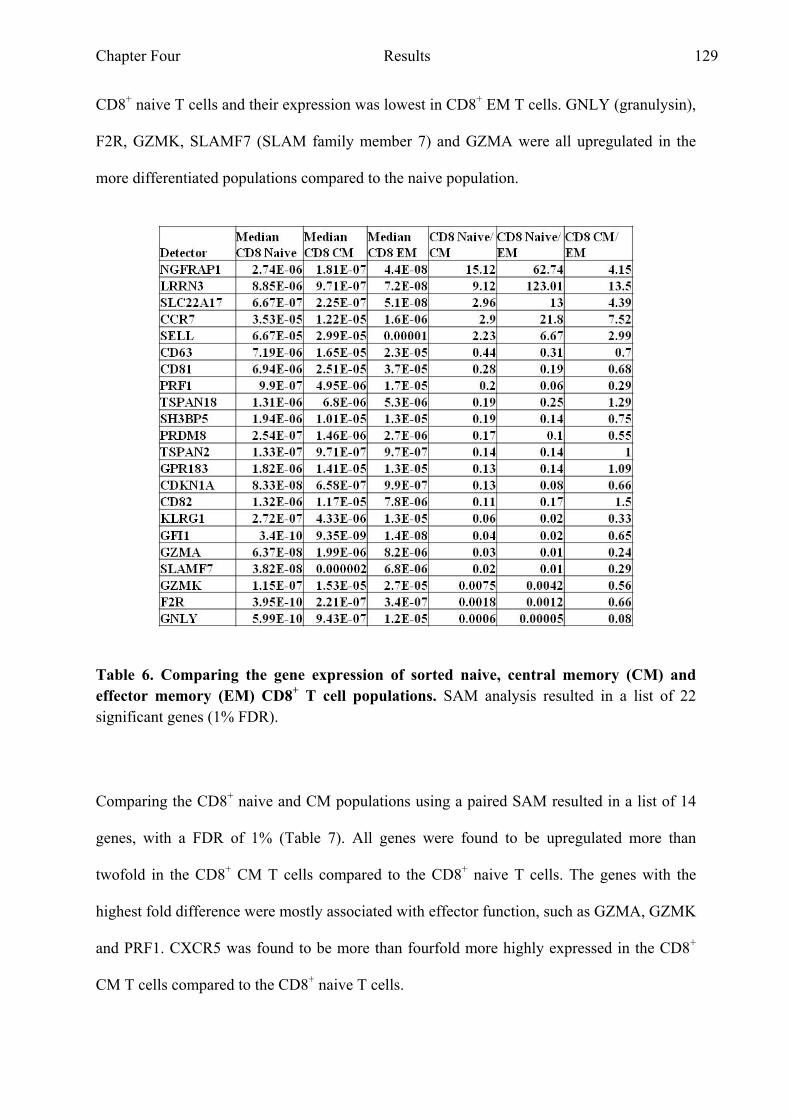
Chapter Four Results 129
CD8+ naive T cells and their expression was lowest in CD8+ EM T cells. GNLY (granulysin),
F2R, GZMK, SLAMF7 (SLAM family member 7) and GZMA were all upregulated in the
more differentiated populations compared to the naive population.
Table 6. Comparing the gene expression of sorted naive, central memory (CM) and effector memory (EM) CD8+ T cell populations. SAM analysis resulted in a list of 22 significant genes (1% FDR).
Comparing the CD8+ naive and CM populations using a paired SAM resulted in a list of 14
genes, with a FDR of 1% (Table 7). All genes were found to be upregulated more than
twofold in the CD8+ CM T cells compared to the CD8+ naive T cells. The genes with the
highest fold difference were mostly associated with effector function, such as GZMA, GZMK
and PRF1. CXCR5 was found to be more than fourfold more highly expressed in the CD8+
CM T cells compared to the CD8+ naive T cells.
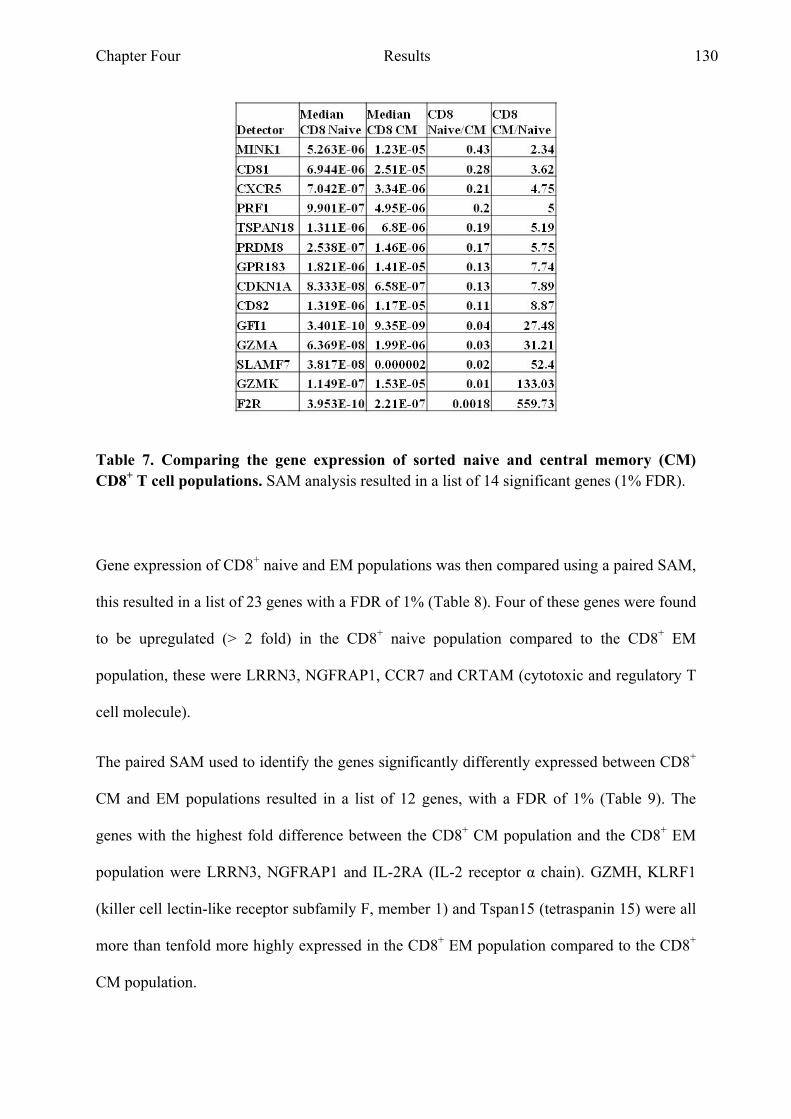
Chapter Four Results 130
Table 7. Comparing the gene expression of sorted naive and central memory (CM) CD8+ T cell populations. SAM analysis resulted in a list of 14 significant genes (1% FDR).
Gene expression of CD8+ naive and EM populations was then compared using a paired SAM,
this resulted in a list of 23 genes with a FDR of 1% (Table 8). Four of these genes were found
to be upregulated (> 2 fold) in the CD8+ naive population compared to the CD8+ EM
population, these were LRRN3, NGFRAP1, CCR7 and CRTAM (cytotoxic and regulatory T
cell molecule).
The paired SAM used to identify the genes significantly differently expressed between CD8+
CM and EM populations resulted in a list of 12 genes, with a FDR of 1% (Table 9). The
genes with the highest fold difference between the CD8+ CM population and the CD8+ EM
population were LRRN3, NGFRAP1 and IL-2RA (IL-2 receptor α chain). GZMH, KLRF1
(killer cell lectin-like receptor subfamily F, member 1) and Tspan15 (tetraspanin 15) were all
more than tenfold more highly expressed in the CD8+ EM population compared to the CD8+
CM population.
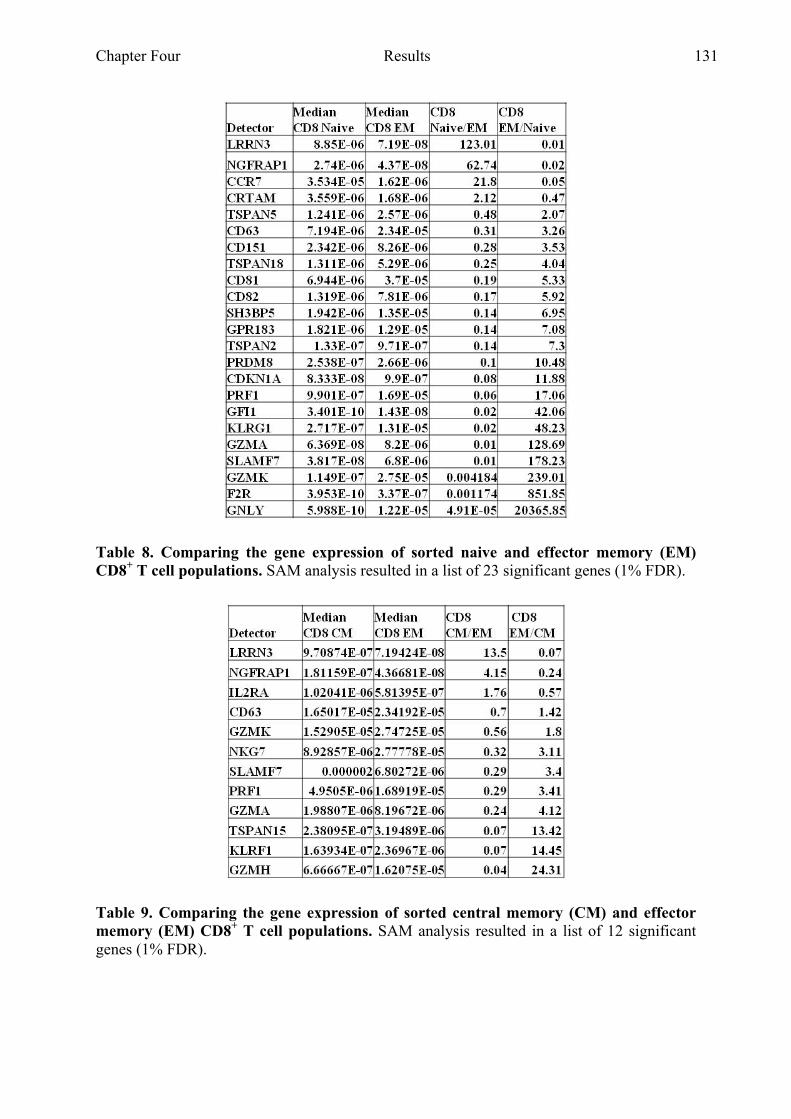
Chapter Four Results 131
Table 8. Comparing the gene expression of sorted naive and effector memory (EM) CD8+ T cell populations. SAM analysis resulted in a list of 23 significant genes (1% FDR).
Table 9. Comparing the gene expression of sorted central memory (CM) and effector memory (EM) CD8+ T cell populations. SAM analysis resulted in a list of 12 significant genes (1% FDR).
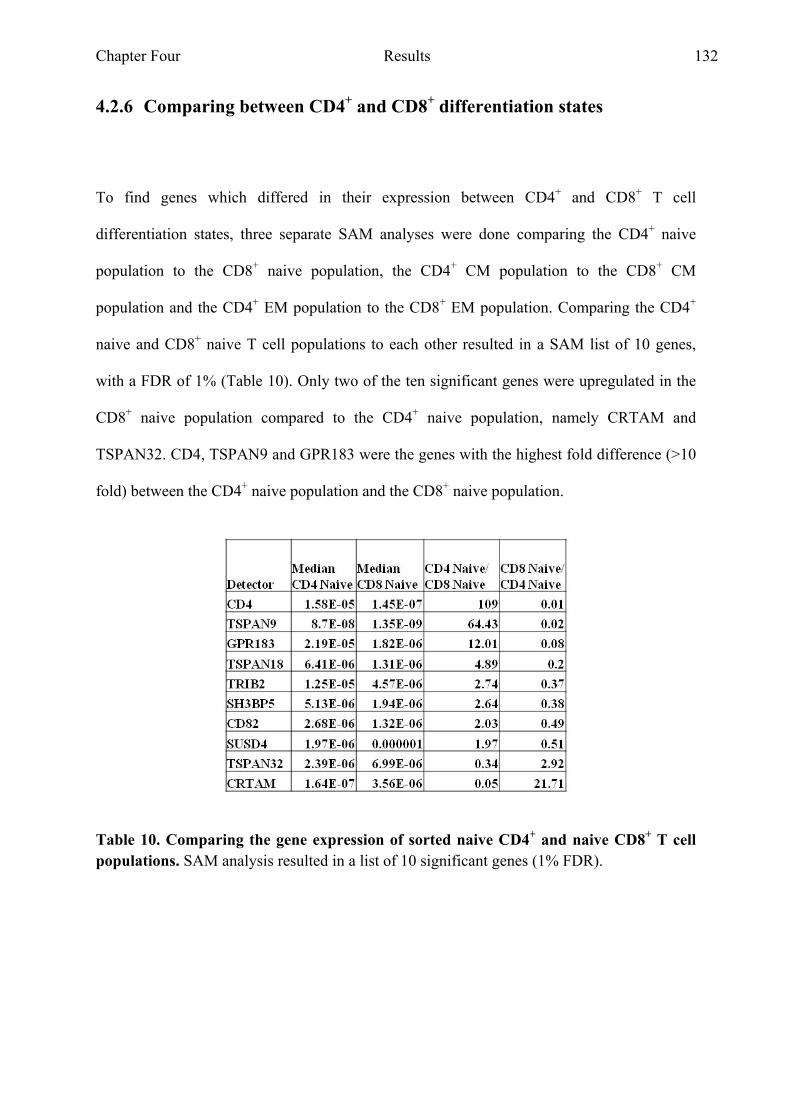
Chapter Four Results 132
4.2.6 Comparing between CD4+ and CD8+ differentiation states
To find genes which differed in their expression between CD4+ and CD8+ T cell
differentiation states, three separate SAM analyses were done comparing the CD4+ naive
population to the CD8+ naive population, the CD4+ CM population to the CD8+ CM
population and the CD4+ EM population to the CD8+ EM population. Comparing the CD4+
naive and CD8+ naive T cell populations to each other resulted in a SAM list of 10 genes,
with a FDR of 1% (Table 10). Only two of the ten significant genes were upregulated in the
CD8+ naive population compared to the CD4+ naive population, namely CRTAM and
TSPAN32. CD4, TSPAN9 and GPR183 were the genes with the highest fold difference (>10
fold) between the CD4+ naive population and the CD8+ naive population.
Table 10. Comparing the gene expression of sorted naive CD4+ and naive CD8+ T cell populations. SAM analysis resulted in a list of 10 significant genes (1% FDR).
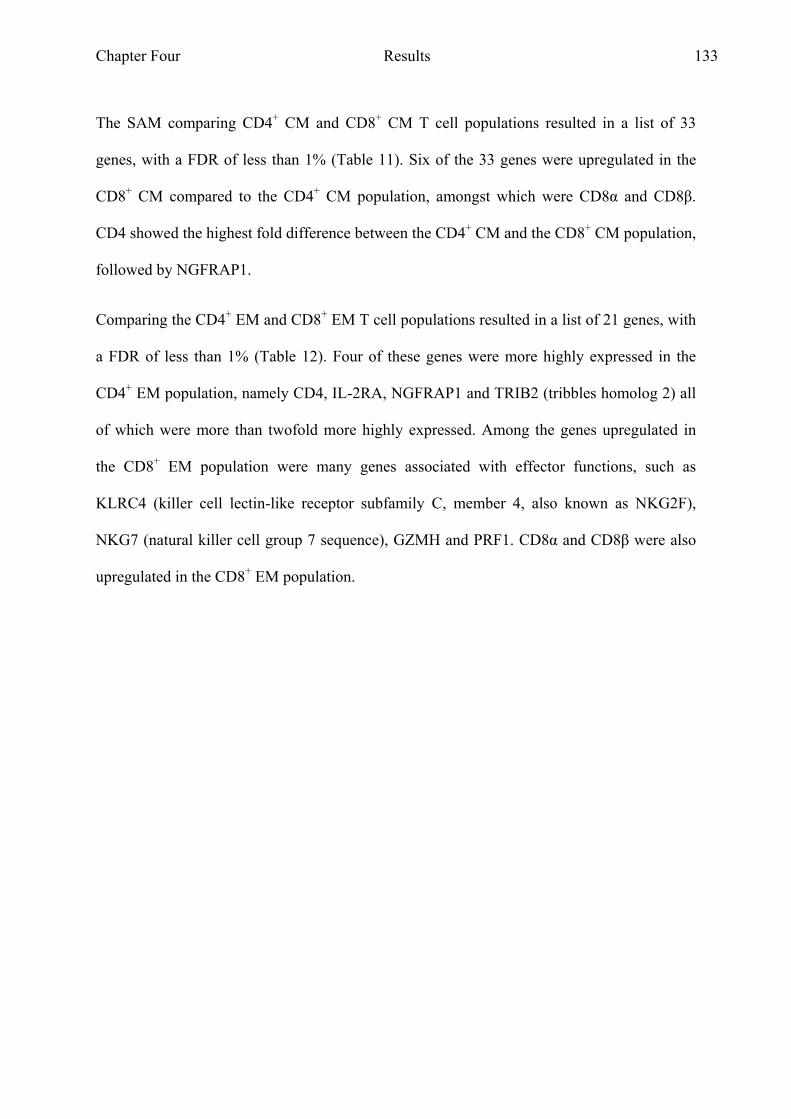
Chapter Four Results 133
The SAM comparing CD4+ CM and CD8+ CM T cell populations resulted in a list of 33
genes, with a FDR of less than 1% (Table 11). Six of the 33 genes were upregulated in the
CD8+ CM compared to the CD4+ CM population, amongst which were CD8α and CD8β.
CD4 showed the highest fold difference between the CD4+ CM and the CD8+ CM population,
followed by NGFRAP1.
Comparing the CD4+ EM and CD8+ EM T cell populations resulted in a list of 21 genes, with
a FDR of less than 1% (Table 12). Four of these genes were more highly expressed in the
CD4+ EM population, namely CD4, IL-2RA, NGFRAP1 and TRIB2 (tribbles homolog 2) all
of which were more than twofold more highly expressed. Among the genes upregulated in
the CD8+ EM population were many genes associated with effector functions, such as
KLRC4 (killer cell lectin-like receptor subfamily C, member 4, also known as NKG2F),
NKG7 (natural killer cell group 7 sequence), GZMH and PRF1. CD8α and CD8β were also
upregulated in the CD8+ EM population.
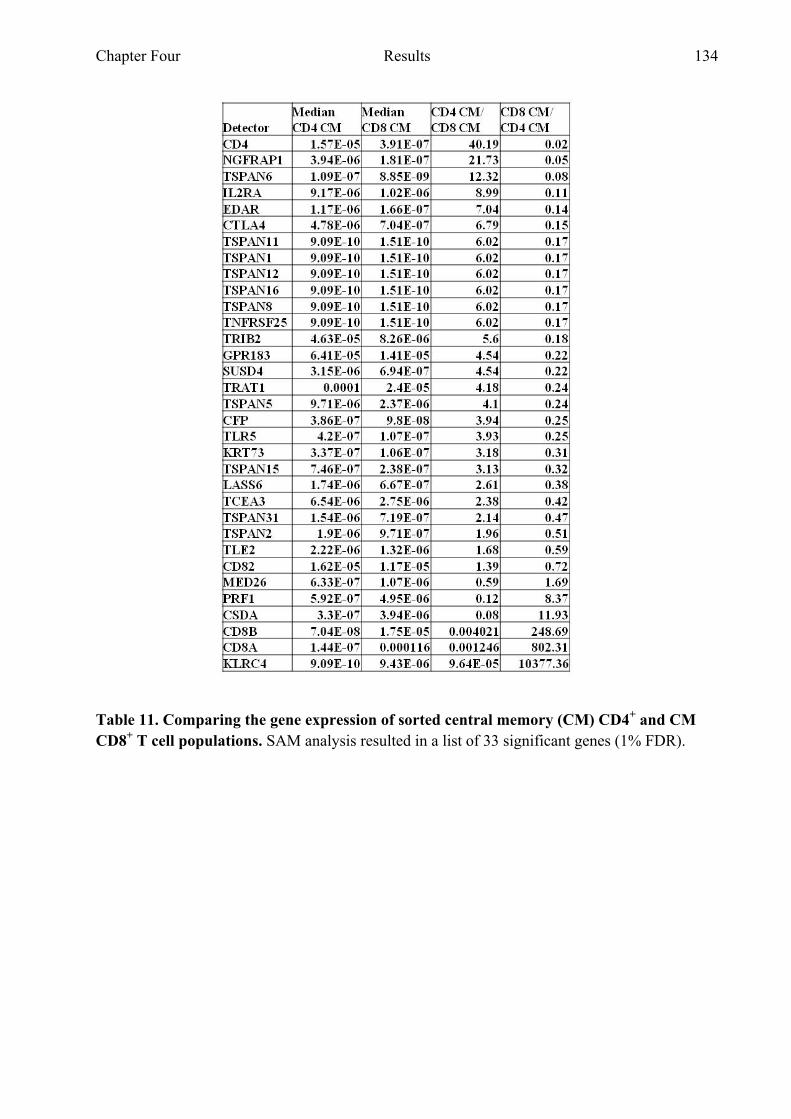
Chapter Four Results 134
Table 11. Comparing the gene expression of sorted central memory (CM) CD4+ and CM CD8+ T cell populations. SAM analysis resulted in a list of 33 significant genes (1% FDR).
Chapter Four Results 135
Table 12. Comparing the gene expression of sorted effector memory (EM) CD4+ and effector memory (EM) CD8+ T cell populations. SAM analysis resulted in a list of 21 significant genes (1% FDR).
4.2.7 Shared and unique genes in CD4+ and CD8+ differentiation pathways
To identify genes shared during differentiation of both CD4+ and CD8+ T cell populations the
SAM lists generated when comparing the naive, CM and EM populations within the CD4+
and CD8+ compartments were compared. This resulted in nine genes which were found to be
shared between these comparisons (Fig. 4.4). As can be seen in the figure all nine genes
showed a pattern in which the CM population exhibits an intermediate gene expression to the
naive and EM populations. This pattern suggests that these genes are important in the
differentiation from a naive T cell to a CM or EM T cell in both the CD4+ and CD8+ T cell
compartment.

Chapter Four Results 136
Figure 4.4. Nine shared genes can be found when comparing the differentiation of CD4+ and CD8+ T cell populations. When analysing the SAM lists generated when comparing the naive, central memory (CM) and effector memory (EM) populations within the CD4+ and CD8+ compartments, nine genes were found to be shared.
When trying to identify genes which were consistently different between CD4+ and CD8+ T
cell populations the SAM lists generated when comparing the CD4+ naive to CD8+ naive,
CD4+ CM to CD8+ CM and CD4+ EM to CD8+ EM were compared to each other. One gene,
TRIB2, was found to be shared (Fig. 4.5). This suggests that this gene is consistently
differentially expressed between all CD4+ and CD8+ T cell populations.
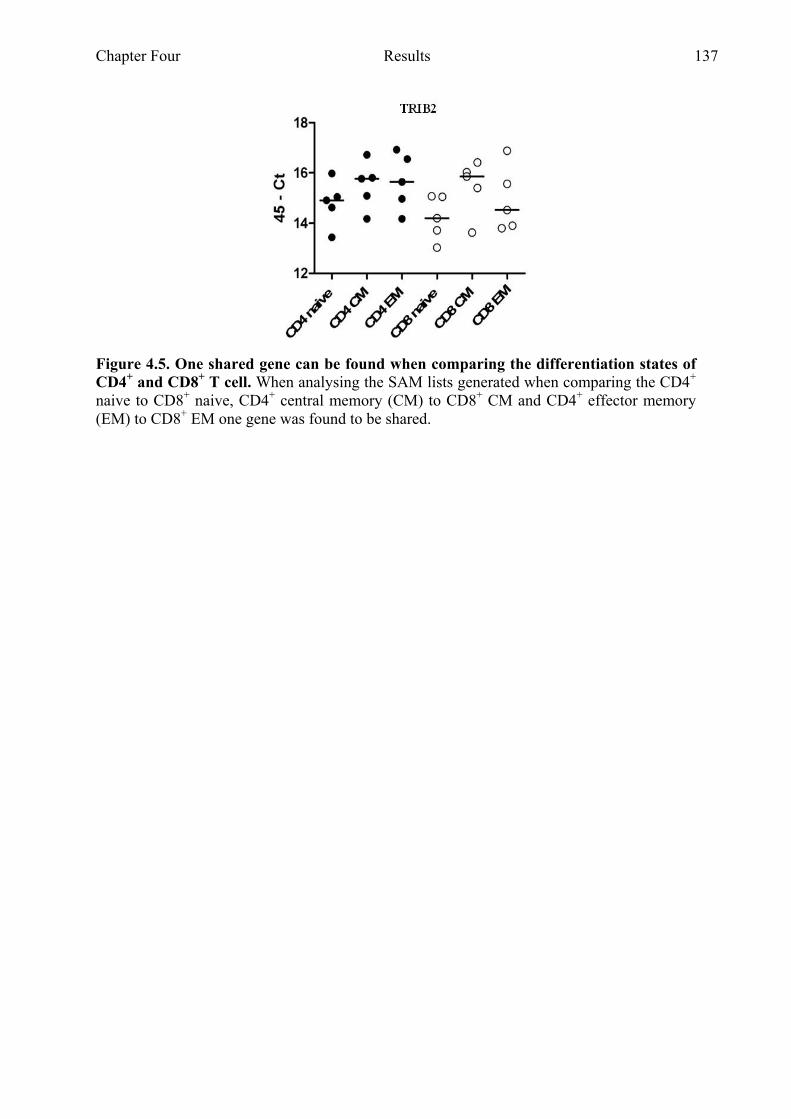
Chapter Four Results 137
Figure 4.5. One shared gene can be found when comparing the differentiation states of CD4+ and CD8+ T cell. When analysing the SAM lists generated when comparing the CD4+ naive to CD8+ naive, CD4+ central memory (CM) to CD8+ CM and CD4+ effector memory (EM) to CD8+ EM one gene was found to be shared.
Chapter Four Results 138
4.3 Discussion
The results from the previous Chapter suggested a pathway shared between CD4+ and CD8+
T cells during differentiation. Real Time PCR has been used as the gold standard for
validating gene expression levels and to validate the microarray analysis of the CD4+ and
CD8+ T cell populations 96 genes were selected from the gene lists generated in Chapter 3
and tested by Real Time PCR. Real Time PCR has the advantage over microarrays in that it is
a highly reproducible and more quantitative way and it allows the testing of more samples
than would be possible by microarray analysis (Fig. 4.6). Large scale microarray analysis is a
useful tool to analyse large quantities of genes at the same time and identifying genes of
interest, to validate and follow up on such genes a more specific microarray can be designed
which might contain genes from the same gene family as a gene of interest. Real Time PCR
analysis can then be used to validate the gene expression identified through array analysis, as
it is a more quantitative technique as well as allowing the researcher to analyse a larger
sample pool.
Microarray analysis of the T cell populations within the CD4+ and CD8+ compartment
identified tetraspanin18 as a differentially expressed gene between CD4+ and CD8+ T cells.
The Real Time PCR data of these same T cell populations did not show this difference to the
same extent. Instead, whereas Tspan18 expression by microarray analysis was consistently
found to be higher in CD4+ naive, CM and EM T cell populations when compared to their
CD8+ counterparts, the Real Time PCR analysis showed that this was not the case when
comparing CD4+ CM to CD8+ CM. In the Real Time PCR samples expression of Tspan18
was found to be higher in the CD8+ CM population compared to the CD4+ CM population. In
Chapter Four Results 139
both the naive and EM populations Tspan18 expression was again found to be higher in the
CD4+ compartment. Protty et al (2009) analysed the expression of tetraspanins in platelets
and found that CD9, CD63, CD151 and Tspan9 were expressed on platelets. They also
analysed expression of the 33 different tetraspanins in various human cell types and found
that when comparing CD4+ helper T cells to cytotoxic CD8+ T cells, Tspan18 was also more
highly expressed in the CD4+ T cells compared to the CD8+ T cells 148. This data strengthens
our initial finding of higher Tspan18 expression in the CD4+ T cell compartment. Based on
our identification of Tspan18 in our microarray analysis, tetraspanin family members were
included in our Real Time PCR validation experiments. This allowed us to identify that
several tetraspanins were differentially expressed during T cell differentiation, such as CD81
and CD82; both of which show increased expression in the more differentiated cells of both
the CD4+ and the CD8+ compartment. CD9 expression seemed to be lowest on the CD4+ CM
population, with CD4+ naive and EM cells expressing similar levels of CD9. Within the
CD8+ compartment CD9 expression did not significantly differ between the three
populations.
Chapter Four Results 140
Figure 4.6. Comparing microarray analysis to Real Time PCR analysis. Large scale microarray analysis allows analysis of large quantities of genes at the same time and identifying genes of interest. Validation and follow up on such genes can be done with a more specific microarray designed to contain genes from the same gene family as a gene of interest. Real Time PCR analysis is then used as the gold standard to validate the gene expression identified through array analysis, as it is a more quantitative technique as well as it allows the researcher to analyse a larger sample pool.
Real Time PCR analysis of genes selected from the microarray data resulted, as expected, in
several differentially expressed genes. One of which was KLRC4, also known as NKG2F and
found to be raised in CD8+ EM T cells. KLRC4 is a member of the NKG2 family of C-type
lectins. MHC-Ib molecule HLA-E functions as a ligand for the receptor encoded by these
genes and its binding results in an inhibitory signal to the cells expressing the receptor,
mainly NK cells and some T cells 149. Some family members can also send an activation
signal when recognising MHC molecules and whether a receptor is inhibitory or activating
corresponds to the characteristics of their cytoplasmic or transmembrane domains 150;151.
NKG2A contains an immunorecptor tyrosine-based inhibition motif (ITIM) in its cytoplasmic
tail which upon activation results in a inhibitory signal. Family members with activating
capabilities have a truncated cytoplasmic domain, therefore lacking the ITIMs, these
Chapter Four Results 141
receptors associate with adaptor molecules (e.g. DAP12) which contain immunoreceptor
tyrosine-based activation motifs (ITAMs) 150;151.
The transcript for KLRC4 has been identified in studies however Kim et al (2004) are the
first to describe protein expression of KLRC4 in NK cells by performing
immunoprecipitation and immunoblotting 149;152. KLRC4 has a high homology with NKG2C,
which binds to DAP12, prompting them to assess whether KLRC4 could also bind to DAP12.
The mouse pro-B cell line Ba/F3 was transfected with either NKG2C as a control or with
KLRC4 as well as with an ecotropic retrovirus encoding human DAP12 with a Flag epitope
attached to allow identification on the cell surface. Subsequent immunoprecipitation with an
anti-Flag antibody and immunoblotting showed that KLRC4 was able to bind to DAP12.
Further analysis revealed that the KLRC4-DAP12 complex was not expressed on the cell
surface. The association of KLRC4 with DAP12 suggests that it could have a role in cell
activation. Somewhat contradictory is the fact that KLRC4 contains an ITIM motif in its
cytoplasmic tail, which could suggest that KLRC4 could have a role in cell activation as well
as a cell activation inhibitory role. The data in this chapter shows KLRC4 is differentially
expressed on T cell populations, being the most highly expressed gene in four SAM gene
lists. When comparing the differentiation states without distinguishing between CD4+ and
CD8+ T cell populations, its expression is highest in the naive populations and drops down as
the cells differentiate. KLRC4 also comes up as differentially expressed between the naive,
CM and EM populations within the CD4+ compartment; however within the CD4+
compartment its expression is highest on the EM population and lowest on the CM
population (Fig. 4.7). When comparing the differentiation states between compartments,
KLRC4 is shown to be more highly expressed in CD8+ CM and EM T cell populations
compared to the CD4+ CM and EM T cell populations respectively. It is clear that CD8+ T
cells express higher levels of KLRC4 which corresponds with some reports of expression of
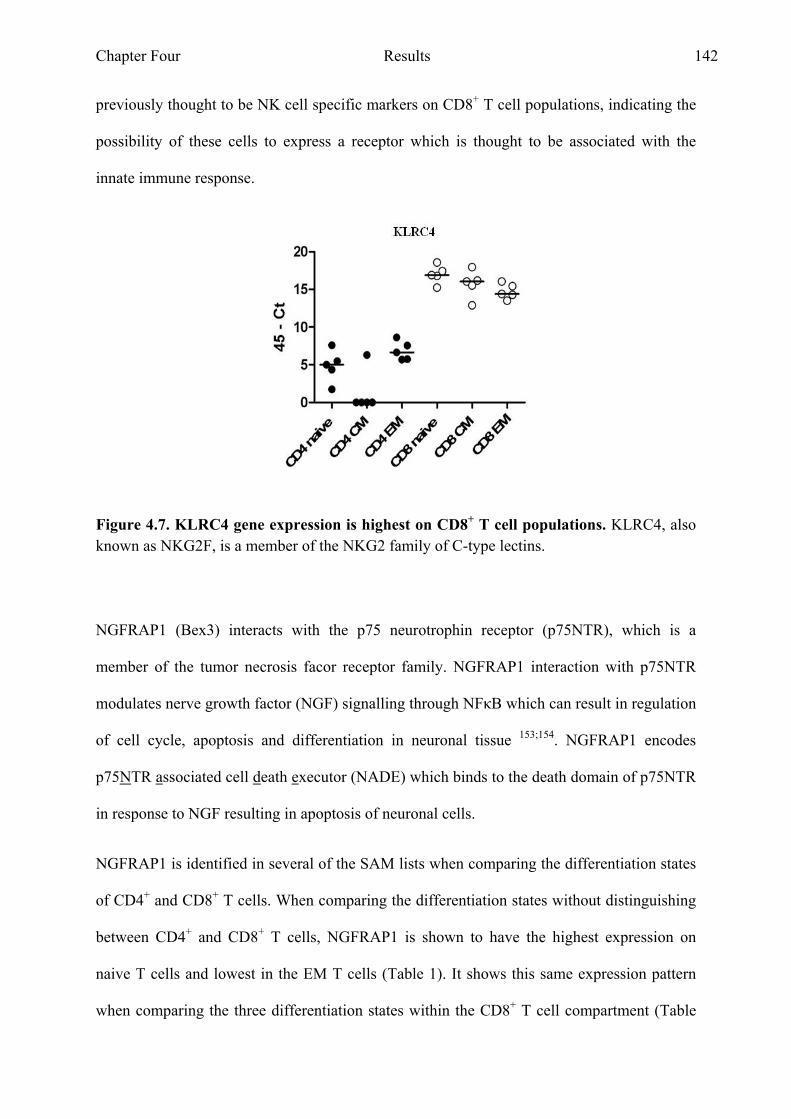
Chapter Four Results 142
previously thought to be NK cell specific markers on CD8+ T cell populations, indicating the
possibility of these cells to express a receptor which is thought to be associated with the
innate immune response.
Figure 4.7. KLRC4 gene expression is highest on CD8+ T cell populations. KLRC4, also known as NKG2F, is a member of the NKG2 family of C-type lectins.
NGFRAP1 (Bex3) interacts with the p75 neurotrophin receptor (p75NTR), which is a
member of the tumor necrosis facor receptor family. NGFRAP1 interaction with p75NTR
modulates nerve growth factor (NGF) signalling through NFκB which can result in regulation
of cell cycle, apoptosis and differentiation in neuronal tissue 153;154. NGFRAP1 encodes
p75NTR associated cell death executor (NADE) which binds to the death domain of p75NTR
in response to NGF resulting in apoptosis of neuronal cells.
NGFRAP1 is identified in several of the SAM lists when comparing the differentiation states
of CD4+ and CD8+ T cells. When comparing the differentiation states without distinguishing
between CD4+ and CD8+ T cells, NGFRAP1 is shown to have the highest expression on
naive T cells and lowest in the EM T cells (Table 1). It shows this same expression pattern
when comparing the three differentiation states within the CD8+ T cell compartment (Table

Chapter Four Results 143
6). Comparing its expression between CD4+ and CD8+ T cell populations shows that in both
compartments the expression is lowest in the EM population (Table 4, 5, 8 and 9) in the
CD8+ compartment expression is highest in the naive population, while its expression level in
CD4+ naive cells is similar to that of CD4+ CM cells (Fig. 4.8). If naive and CM T cells
express high levels of NGFRAP1 this may make them more susceptible to p75NTR mediated
apoptosis, which would indicate a pathway for controlling naive and CM T cell responses.
Figure 4.8. NGFRAP1 gene expression is lowest on EM CD4+ and CD8+ T cell populations. NGFRAP1 binds p75 neurotrophin receptor (p75NTR), a member of the tumor necrosis facor receptor family, this binding can result in apoptosis.
SLC22A17 (Solute carrier family 22 member 17) is also known as brain type organic cation
transporter (BOCT) in mice and Miharada et al (2007) suggest that the human homolog
might be a receptor for lipocalin 2 (LCN2 or 24p3) 155. As a protection mechanism mamalian
cells remove iron from the environment to prevent it from being used for bacterial cell
growth. LCN2 is a secreted member of the lipocalin family of proteins and has been
implicated in iron trafficking in and out of the cell. LCN2 on its own cannot bind iron, but it
can bind iron through binding with a small molecular weight bacterial siderophore, which is
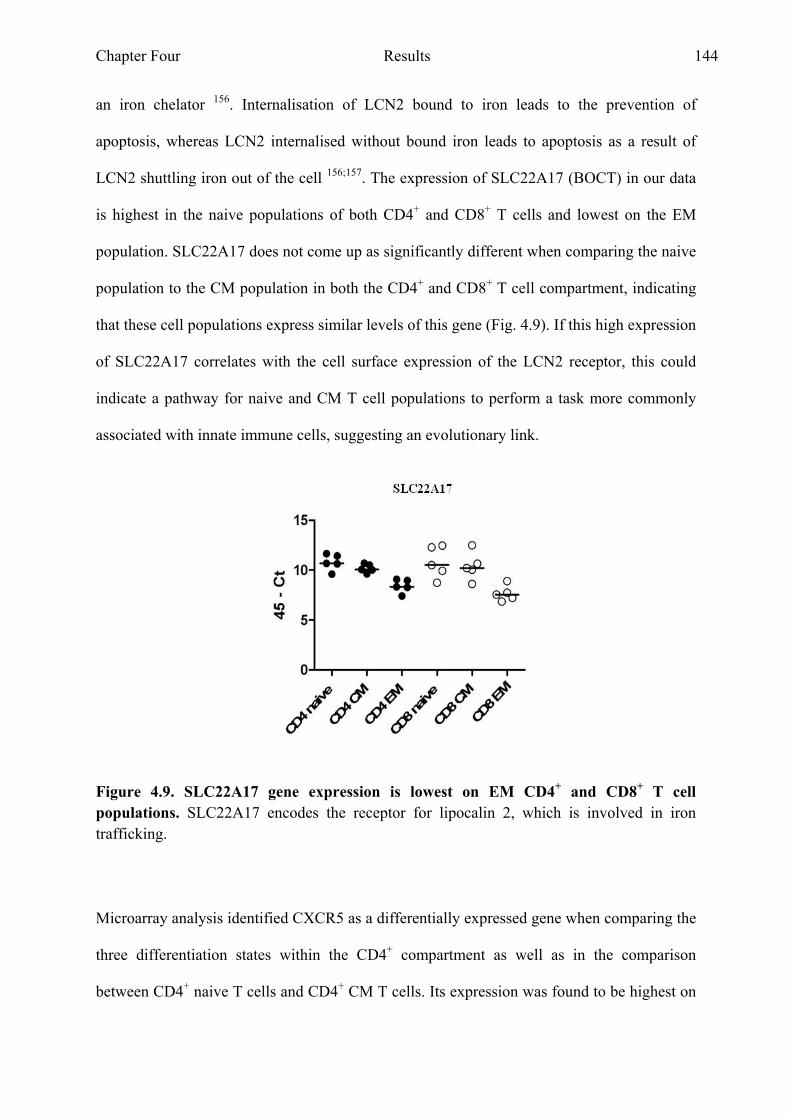
Chapter Four Results 144
an iron chelator 156. Internalisation of LCN2 bound to iron leads to the prevention of
apoptosis, whereas LCN2 internalised without bound iron leads to apoptosis as a result of
LCN2 shuttling iron out of the cell 156;157. The expression of SLC22A17 (BOCT) in our data
is highest in the naive populations of both CD4+ and CD8+ T cells and lowest on the EM
population. SLC22A17 does not come up as significantly different when comparing the naive
population to the CM population in both the CD4+ and CD8+ T cell compartment, indicating
that these cell populations express similar levels of this gene (Fig. 4.9). If this high expression
of SLC22A17 correlates with the cell surface expression of the LCN2 receptor, this could
indicate a pathway for naive and CM T cell populations to perform a task more commonly
associated with innate immune cells, suggesting an evolutionary link.
Figure 4.9. SLC22A17 gene expression is lowest on EM CD4+ and CD8+ T cell populations. SLC22A17 encodes the receptor for lipocalin 2, which is involved in iron trafficking.
Microarray analysis identified CXCR5 as a differentially expressed gene when comparing the
three differentiation states within the CD4+ compartment as well as in the comparison
between CD4+ naive T cells and CD4+ CM T cells. Its expression was found to be highest on
Chapter Four Results 145
CD4+ CM T cells. CXCR5 is the chemokine receptor for CXCL13 which is expressed on all
B cells as well as on CD4+ follicular helper cells (TFH). TFH cells can be found within the B
cell area of secondary lymphoid organs where they help generate an effective B cell response
by supporting antibody production and isotype class switching 58;158. The Real Time PCR
data for CXCR5 showed that the difference between CD4+ naive and CD4+ CM T cells
identified in the array analysis is maintained, but it also shows that CD8+ CM T cells also
express high levels of CXCR5 (Fig. 4.10). The higher expression on CD4+ CM T cells could
correspond to the TFH cell population, but the higher expression on CD8+ CM T cells has not
been described before. Quigley et al (2007) describe a CD8+CXCR5+ T cell population in
human tonsil B cell follicles as well as peripheral blood which does not express any CCR7.
They describe these cells as early effector cells because of the lack of CCR7 expression
combined with their ability to produce IFNγ and GZMA. Stimulation of these cells in vitro
led to the upregulation of receptors needed for interaction with B cells, such as CD70 and
OX40. They found that CD8+CXCR5+ T cells could support tonsil B cell survival and IgG
production 158. The cell surface expression of CXCR5 on the CCR7+CD45RA-CD8+ CM T
cells will have to be analysed to examine whether the high expression found in the mRNA
levels of these cells corresponds to the protein levels. If CD8+ CM T cells indeed express
high levels of CXCR5 on their cell surface, these CD8+CXCR5+ CM T cells could provide B
cell help, as do TFH cells; with the exception that CD8+CXCR5+ CM T cells will be able to
respond to different antigens presented on MHC class I molecules as opposed to TFH cells
which respond to antigen presented on MHC class II molecules.
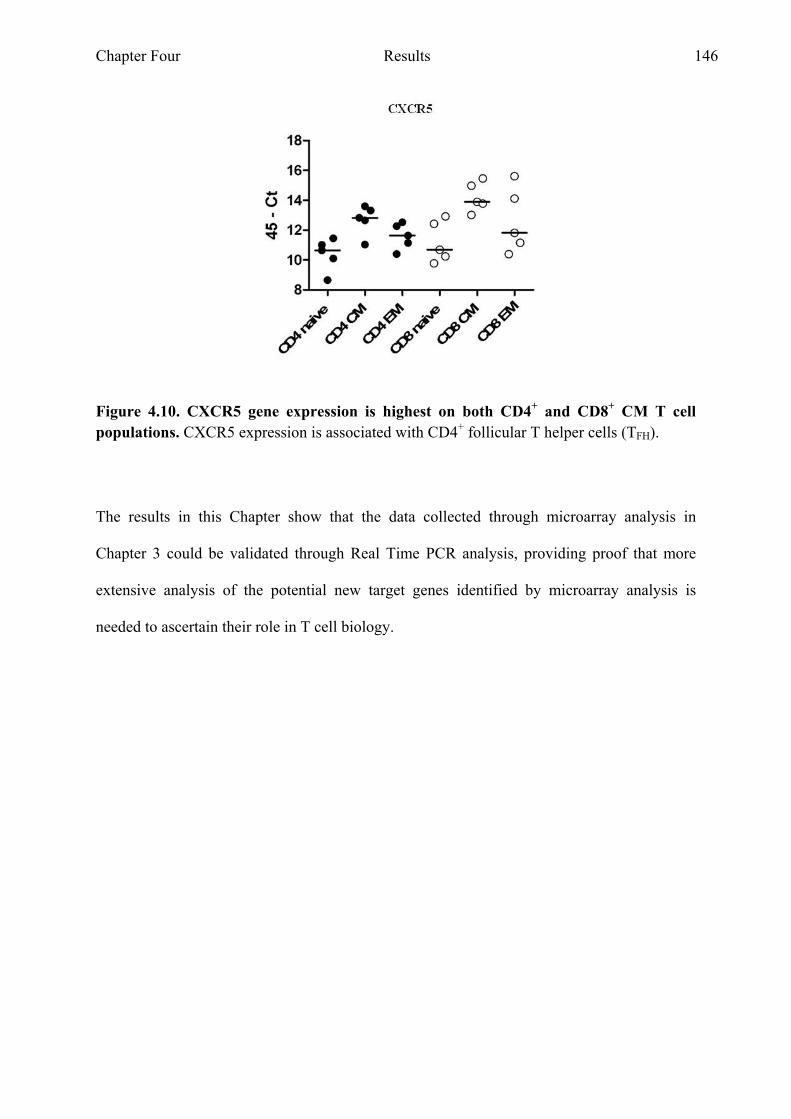
Chapter Four Results 146
Figure 4.10. CXCR5 gene expression is highest on both CD4+ and CD8+ CM T cell populations. CXCR5 expression is associated with CD4+ follicular T helper cells (TFH).
The results in this Chapter show that the data collected through microarray analysis in
Chapter 3 could be validated through Real Time PCR analysis, providing proof that more
extensive analysis of the potential new target genes identified by microarray analysis is
needed to ascertain their role in T cell biology.
Chapter Five Results 147
Chapter Five
Expression of Tetraspanin Family Members on
CD4+ and CD8+ T Cell Populations
Chapter Five Results 148
5 EXPRESSION OF TETRASPANIN FAMILY MEMBERS ON
CD4+ AND CD8+ T CELL POPULATIONS
5.1 Introduction
The purpose of analysing gene expression profiles of different subsets of T cell was to
identify genes or gene families associated with specific subsets and which may be involved in
differentiation of T cells and T cell function. Several family members of the tetraspanin
family were identified by microarray and Real Time PCR as showing differential expression
on CD4+ and CD8+ T cell subsets. Tetraspanins are a family of membrane spanning proteins,
consisting of 33 family members in humans and mouse 73;74. They consist of four
transmembrane domains, a small and a large extracellular loop and two short intracellular
amino and carboxyl tails. Many tetraspanins are posttranslationally modified by the addition
of palmitate to the cysteine residues closest to the membrane. This addition of palmitate
allows the formation of tetraspanin-enriched microdomains (TEMs) at the cell surface.
Tetraspanins have been implicated in having a role in many biological functions, such as cell
activation, membrane fusion, adhesion, differentiation and metastasis 78;79;80;81;82. CD9 has
been described to be involved in membrane fusion, metastasis suppression and sperm-egg
fusion 80;81;83 and CD81 in cell migration, hepatitis C infection and also membrane fusion 84 80
85 89. CD63 is highly expressed on late endosomes and exosomes 78. Several binding partners
which tetraspanins associate with on the cell surface have been identified; Yanez-Mo et al
(2008) showed direct association of CD9 with ICAM-1 as well as recruitment of VCAM-1
into TEMs by its association with CD151 87;88. CD151 is also described to associate with
Chapter Five Results 149
α3β1 and α6β4 and by doing so is involved in regulating integrin-dependent cell morphology,
migration and adhesion 86.
In the previous chapters various members of the tetraspanin family showed differential
expression based on their mRNA in T cell populations. Using microarray analysis
tetraspanin18 was shown to consistently be able to distinguish between CD4+ and CD8+ T
cell populations. We wished to determine whether the surface expression of tetraspanins
corresponded to the mRNA data from the microarray and Real Time PCR; to date however
there is no working monoclonal or polyclonal antibody against tetraspanin18. I therefore
analysed the cell surface expression of the tetraspanin family members where antibodies were
available. The analysis of tetraspanin family member gene expression via Real Time PCR
indicated that CD81 and CD82 showed differential gene expression along the T cell
differentiation pathway, therefore antibodies against these tetraspanins were included in the
flow cytometry analysis. Antibodies against CD9, CD37, CD53, CD63 and CD151 were also
included. CD53, like CD63 has been described in the endocytic pathway 8. CD9 was found to
show a biphasic expression on both CD4+ and CD8+ T cell populations and therefore the
possible function of CD9 on T cells was also examined.
Chapter Five Results 150
5.2 Results
5.2.1 Expression of tetraspanin CD9 on human CD4+ and CD8+ T cell
populations is biphasic
Peripheral Blood Mononuclear Cells (PBMC) were isolated from fresh heparinised blood.
The cells were subsequently stained for the markers CD4, CD8, CCR7, CD45RA and CD9
and analysed by flow cytometry. Fig. 5.1 shows the expression levels of CD9 on CD4+ T cell
populations based on CCR7 and CD45RA. As described above, the markers CCR7 and
CD45RA allow the distinction of several T cell populations within the CD4+ T cell
compartment, namely naive (CCR7+CD45RA+), central memory (CCR7+CD45RA-) and
effector memory (CCR7-CD45RA-). The top part of Fig. 5.1 shows representative plots
showing the gating strategy used to analyse the data. The percentage CD9 positive cells in
each differentiation state (based on an isotype control) varied between donors, however a
trend can be detected showing that the CM population has the lowest level of expression
compared to the naive and EM populations (Fig. 5.3).

Chapter Five Results 151
Figure 5.1. CD9 expression on CD4+ T cell populations is varied between donors as well as differentiation states. CD9 expression on CD4+ T cell populations was analysed by FACS for six different donors, the letters A-F denote the 6 different donors, percentage positive cells based on isotype control, indicated by dotted line.
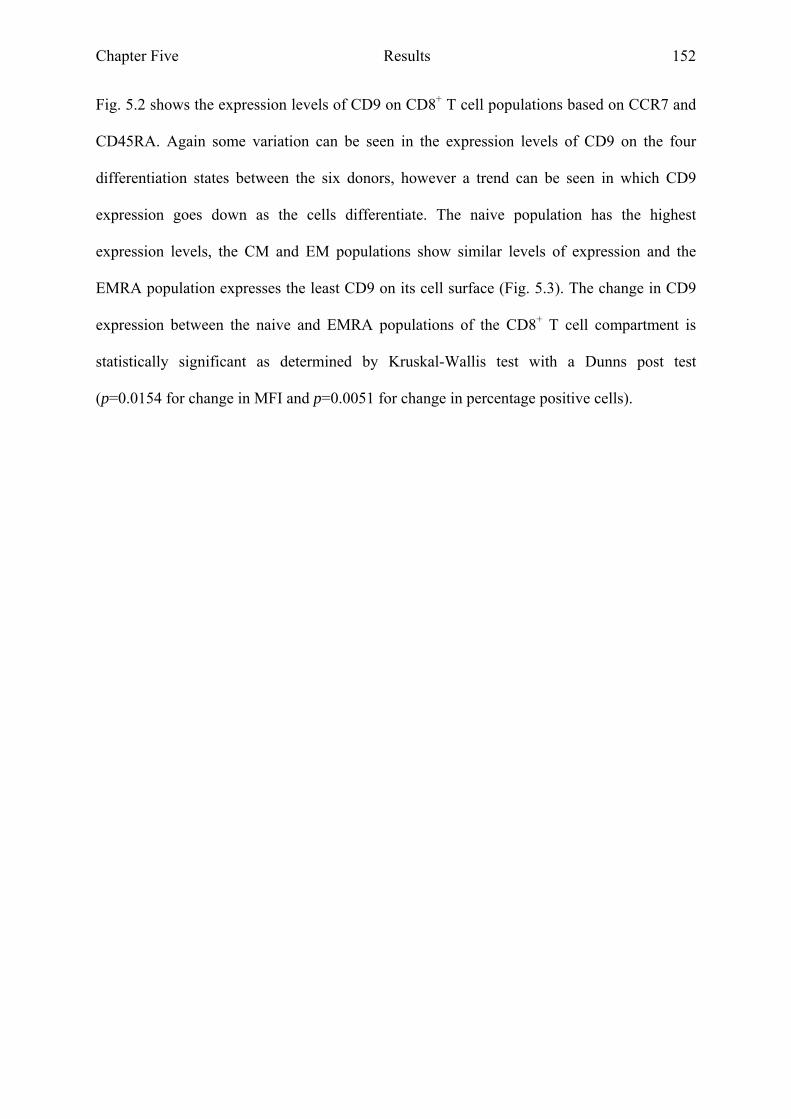
Chapter Five Results 152
Fig. 5.2 shows the expression levels of CD9 on CD8+ T cell populations based on CCR7 and
CD45RA. Again some variation can be seen in the expression levels of CD9 on the four
differentiation states between the six donors, however a trend can be seen in which CD9
expression goes down as the cells differentiate. The naive population has the highest
expression levels, the CM and EM populations show similar levels of expression and the
EMRA population expresses the least CD9 on its cell surface (Fig. 5.3). The change in CD9
expression between the naive and EMRA populations of the CD8+ T cell compartment is
statistically significant as determined by Kruskal-Wallis test with a Dunns post test
(p=0.0154 for change in MFI and p=0.0051 for change in percentage positive cells).
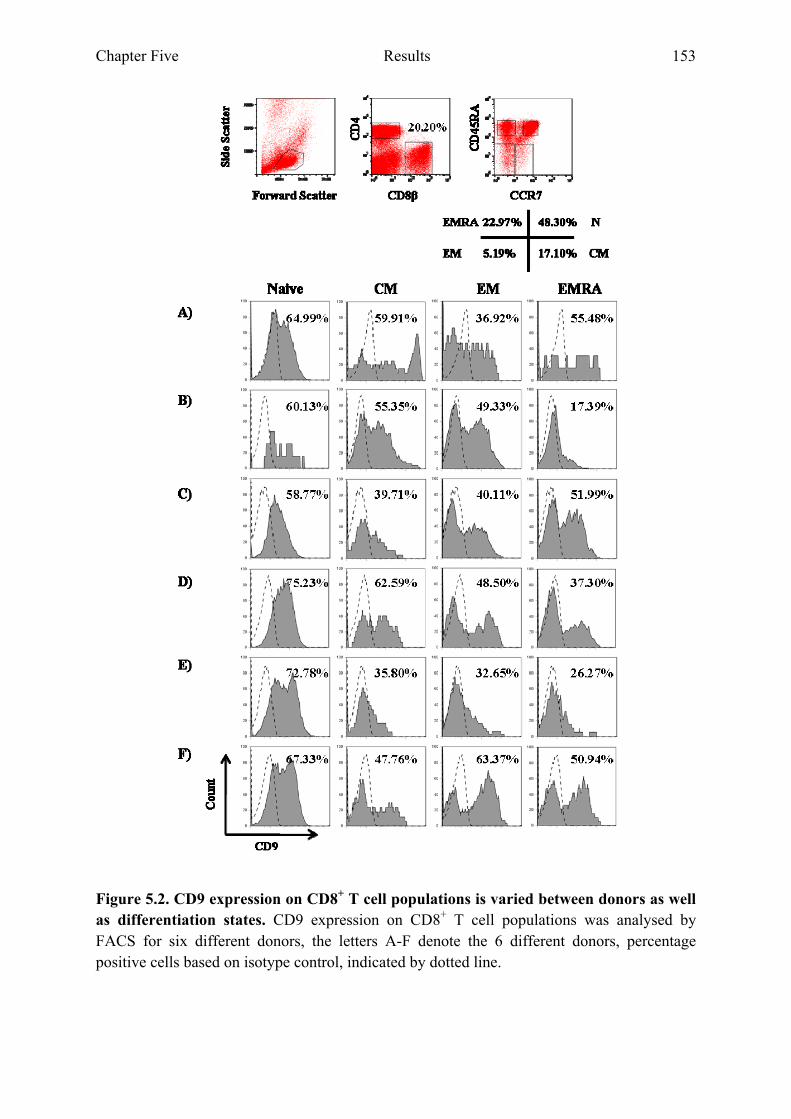
Chapter Five Results 153
Figure 5.2. CD9 expression on CD8+ T cell populations is varied between donors as well as differentiation states. CD9 expression on CD8+ T cell populations was analysed by FACS for six different donors, the letters A-F denote the 6 different donors, percentage positive cells based on isotype control, indicated by dotted line.
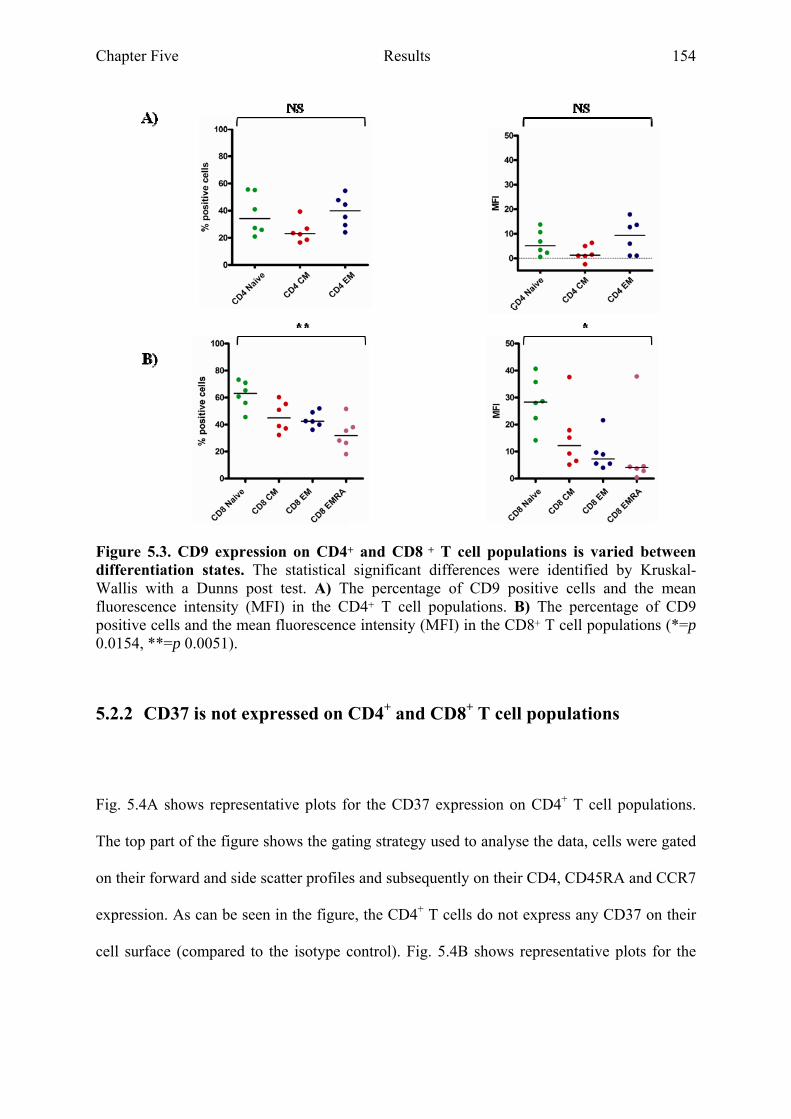
Chapter Five Results 154
Figure 5.3. CD9 expression on CD4+ and CD8 + T cell populations is varied between differentiation states. The statistical significant differences were identified by Kruskal-Wallis with a Dunns post test. A) The percentage of CD9 positive cells and the mean fluorescence intensity (MFI) in the CD4+ T cell populations. B) The percentage of CD9 positive cells and the mean fluorescence intensity (MFI) in the CD8+ T cell populations (*=p 0.0154, **=p 0.0051).
5.2.2 CD37 is not expressed on CD4+ and CD8+ T cell populations
Fig. 5.4A shows representative plots for the CD37 expression on CD4+ T cell populations.
The top part of the figure shows the gating strategy used to analyse the data, cells were gated
on their forward and side scatter profiles and subsequently on their CD4, CD45RA and CCR7
expression. As can be seen in the figure, the CD4+ T cells do not express any CD37 on their
cell surface (compared to the isotype control). Fig. 5.4B shows representative plots for the
Chapter Five Results 155
expression of CD37 on CD8 T cell populations and as was the case with the CD4+
populations, the CD8+ T cells do not express any CD37 on their cell surface.
Figure 5.4. CD37 is not expressed on CD4+ and CD8+ T cell populations. CD37 expression on CD4+ and CD8+ T cell populations was analysed by FACS for six different donors, percentage positive cells based on isotype control, indicated by dotted line. A) Representative plot showing the CD37 expression on CD4+ T cell populations. B) Representative plot showing the CD37 expression on CD8+ T cell populations.

Chapter Five Results 156
5.2.3 CD53 and CD63 expression on CD8+ T cell populations increases
during differentiation
Fig. 5.5A shows representative plots for the CD53 expression on CD4+ T cell populations.
The top part of the figure shows the gating strategy used to analyse the data, cells were gated
on their forward and side scatter profiles and subsequently on their CD4, CD45RA and CCR7
expression. The CD53 expression on CD4+ T cells seemed stable during differentiation (Fig.
5.6A). Fig. 5.5B shows the CD53 expression on CD8+ T cell populations and the expression
of CD53 on the cell surface seemed to increase as the cells become more differentiated (Fig.
5.6). The increase in CD53 expression on the CD8+ T cells as they differentiate from naive to
the EM and EMRA populations is statistically different, as determined by Kruskall-Wallis
with a Dunns post test (p=0.0119 for change in MFI and p=0.0107 for change in percentage
positive cells).
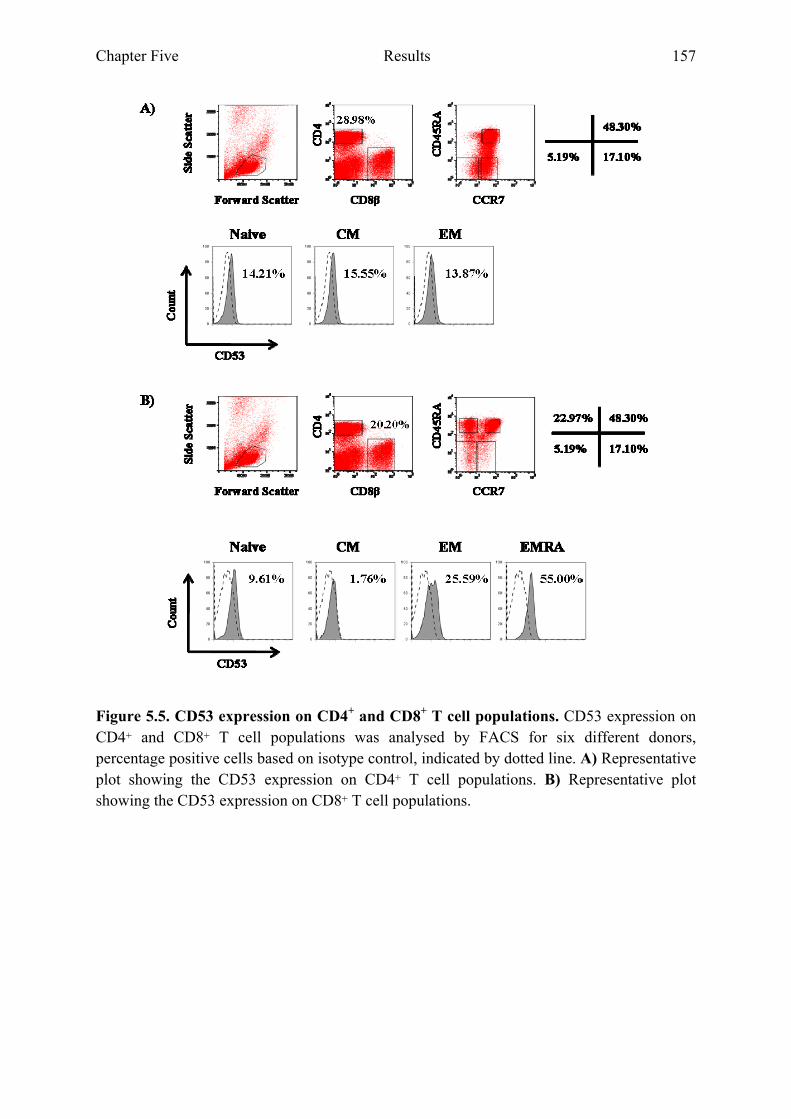
Chapter Five Results 157
Figure 5.5. CD53 expression on CD4+ and CD8+ T cell populations. CD53 expression on CD4+ and CD8+ T cell populations was analysed by FACS for six different donors, percentage positive cells based on isotype control, indicated by dotted line. A) Representative plot showing the CD53 expression on CD4+ T cell populations. B) Representative plot showing the CD53 expression on CD8+ T cell populations.
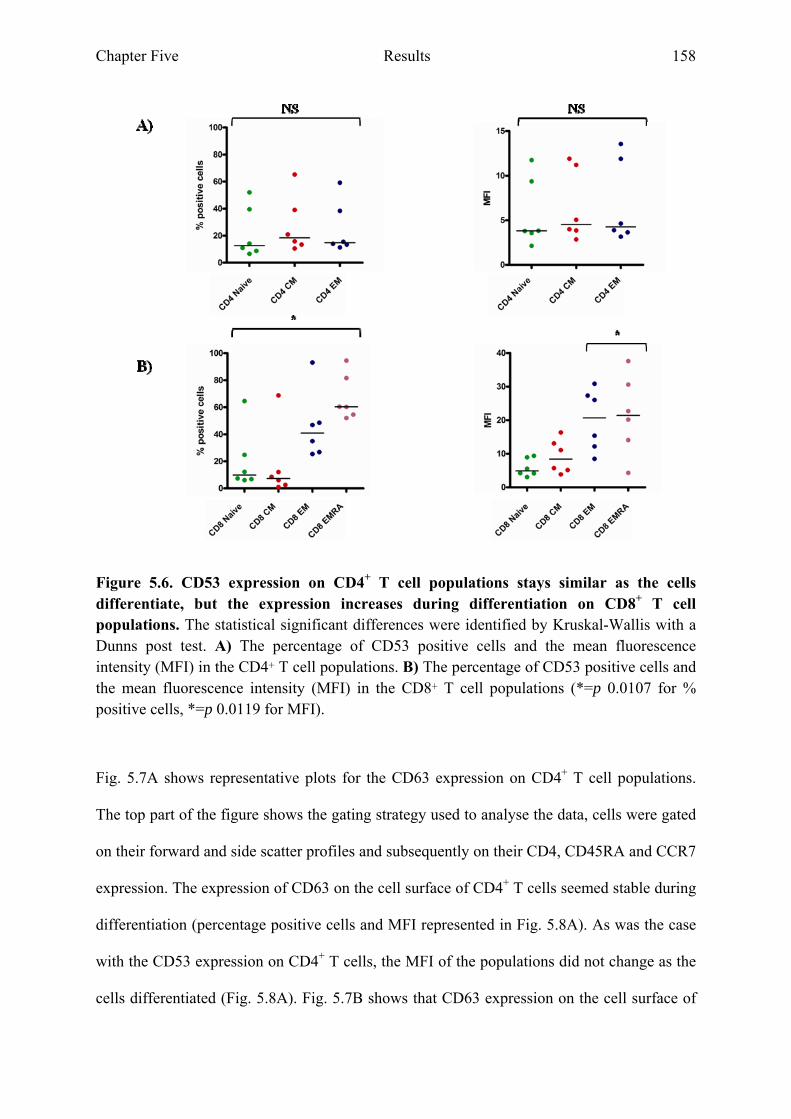
Chapter Five Results 158
Figure 5.6. CD53 expression on CD4+ T cell populations stays similar as the cells differentiate, but the expression increases during differentiation on CD8+ T cell populations. The statistical significant differences were identified by Kruskal-Wallis with a Dunns post test. A) The percentage of CD53 positive cells and the mean fluorescence intensity (MFI) in the CD4+ T cell populations. B) The percentage of CD53 positive cells and the mean fluorescence intensity (MFI) in the CD8+ T cell populations (*=p 0.0107 for % positive cells, *=p 0.0119 for MFI).
Fig. 5.7A shows representative plots for the CD63 expression on CD4+ T cell populations.
The top part of the figure shows the gating strategy used to analyse the data, cells were gated
on their forward and side scatter profiles and subsequently on their CD4, CD45RA and CCR7
expression. The expression of CD63 on the cell surface of CD4+ T cells seemed stable during
differentiation (percentage positive cells and MFI represented in Fig. 5.8A). As was the case
with the CD53 expression on CD4+ T cells, the MFI of the populations did not change as the
cells differentiated (Fig. 5.8A). Fig. 5.7B shows that CD63 expression on the cell surface of
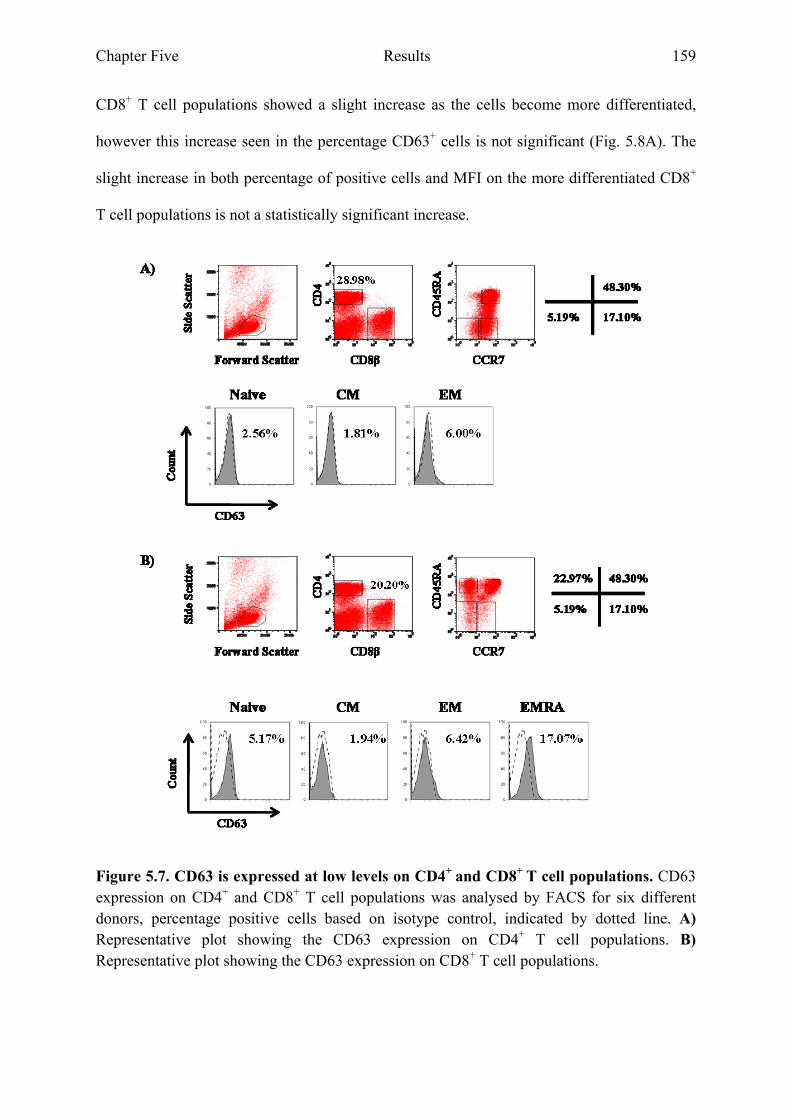
Chapter Five Results 159
CD8+ T cell populations showed a slight increase as the cells become more differentiated,
however this increase seen in the percentage CD63+ cells is not significant (Fig. 5.8A). The
slight increase in both percentage of positive cells and MFI on the more differentiated CD8+
T cell populations is not a statistically significant increase.
Figure 5.7. CD63 is expressed at low levels on CD4+ and CD8+ T cell populations. CD63 expression on CD4+ and CD8+ T cell populations was analysed by FACS for six different donors, percentage positive cells based on isotype control, indicated by dotted line. A) Representative plot showing the CD63 expression on CD4+ T cell populations. B) Representative plot showing the CD63 expression on CD8+ T cell populations.

Chapter Five Results 160
Figure 5.8. CD63 expression on CD4+ T cell populations stays similar as the cells differentiate, but the expression increases during differentiation on CD8+ T cell populations. The statistical significant differences were identified by Kruskal-Wallis with a Dunns post test.. A) The percentage of CD63 positive cells and the mean fluorescence intensity (MFI) in the CD4+ T cell populations. B) The percentage of CD63 positive cells and the mean fluorescence intensity (MFI) in the CD8+ T cell populations.
Chapter Five Results 161
5.2.4 CD81 is expressed at high levels in both CD4+ and CD8+ T cell
populations
Fig. 5.9A shows representative plots for the CD81 expression on CD4+ T cell populations.
The top part of the figure shows the gating strategy used to analyse the data, cells were gated
on their forward and side scatter profiles and subsequently on their CD4, CD45RA and CCR7
expression. The CD81 expression on CD4+ T cells seemed to stay stable as the cells
differentiated (Fig. 5.10A). Fig. 5.9B shows the expression of CD81 on CD8+ T cell
populations. The CD8+ T cells show a slight increase in CD81 expression as they
differentiated (percentage positive cells and MFI shown in Fig. 5.10B). No statistical
difference could be found in the percentage positive cells comparing all populations. The
change in MFI between naive and EM populations is statistically different (Kruskal-Wallis
with a Dunns post test, p=0.0383), however the median values between the more
differentiated CM, EM and EMRA populations did not differ much.
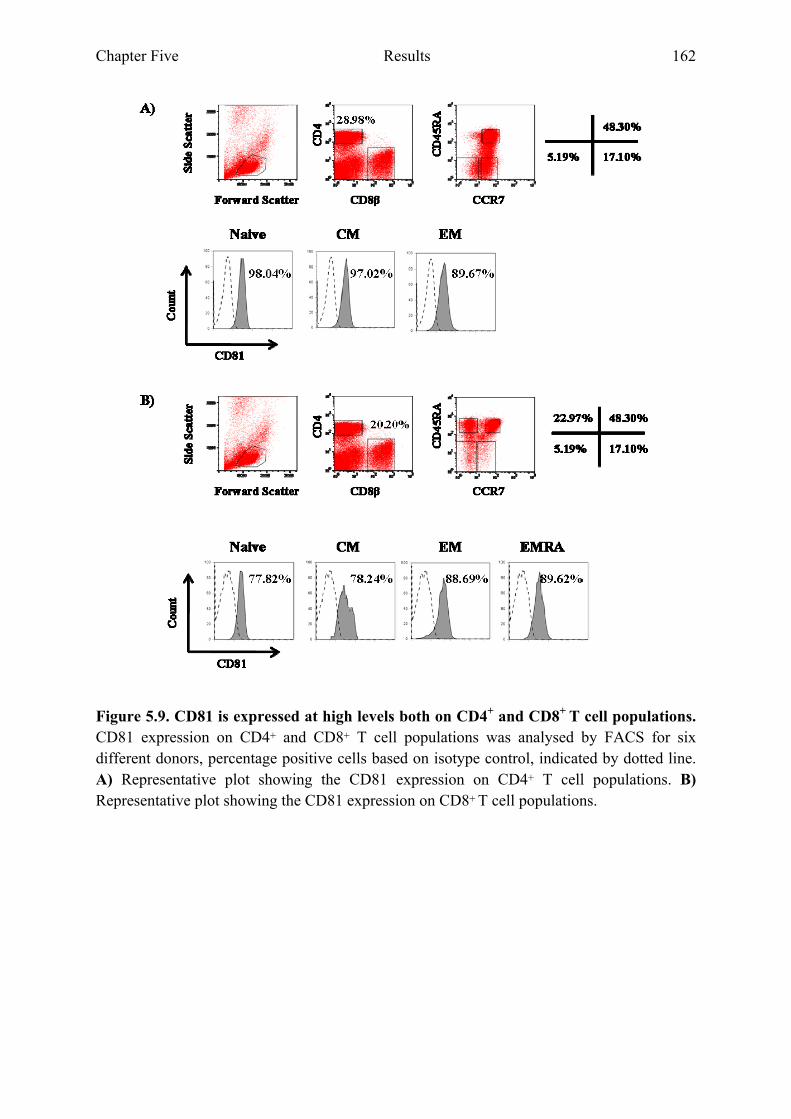
Chapter Five Results 162
Figure 5.9. CD81 is expressed at high levels both on CD4+ and CD8+ T cell populations. CD81 expression on CD4+ and CD8+ T cell populations was analysed by FACS for six different donors, percentage positive cells based on isotype control, indicated by dotted line. A) Representative plot showing the CD81 expression on CD4+ T cell populations. B) Representative plot showing the CD81 expression on CD8+ T cell populations.
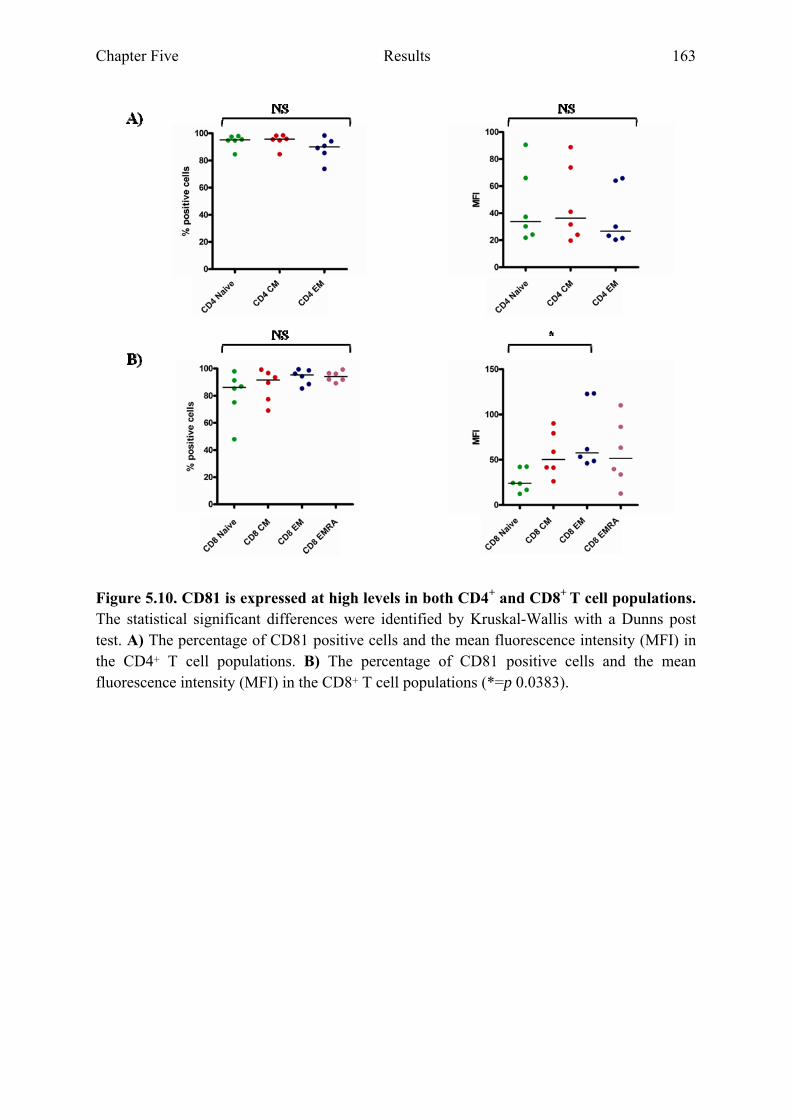
Chapter Five Results 163
Figure 5.10. CD81 is expressed at high levels in both CD4+ and CD8+ T cell populations. The statistical significant differences were identified by Kruskal-Wallis with a Dunns post test. A) The percentage of CD81 positive cells and the mean fluorescence intensity (MFI) in the CD4+ T cell populations. B) The percentage of CD81 positive cells and the mean fluorescence intensity (MFI) in the CD8+ T cell populations (*=p 0.0383).
Chapter Five Results 164
5.2.5 CD82 is expressed at very high levels on CD4+ T cell populations and
its expression decreases on CD8+ T cells as they differentiate
Fig. 5.11A shows representative plots for the CD82 expression on CD4+ T cell populations.
The top part of the figure shows the gating strategy used to analyse the data, cells were gated
on their forward and side scatter profiles and subsequently on their CD4, CD45RA and CCR7
expression. The percentage CD82 positive cells was ≥ 95% on all three differentiation states,
however the amount of CD82 expressed on the cell surface of CD82 positive cells
(represented by the MFI) showed lowest expression of CD82 on the naive population,
whereas the CM and EM populations showed the highest MFI (Fig. 5.12A). The change in
CD82 expression on the CD4+ T cells as they differentiate from naive to the CM and EM
populations is statistically different, as determined by Kruskall-Wallis with a Dunns post test
(p=0.00097 for change in MFI and p=0.0008 for change in percentage positive cells). Fig.
5.11B shows the CD82 expression on CD8+ T cell populations and the expression of CD82
seemed to decrease as the cells differentiate. Both the percentage positive cells and the MFI
readings showed the highest expression levels of CD82 on the CM population and the lowest
expression on the EMRA population (Fig. 5.12B). The change in CD82 expression between
the CM and EMRA CD8+ T cells is statistically different, as determined by Kruskall-Wallis
with a Dunns post test (p=0.0035 for change in MFI and p=0.0004 for change in percentage
positive cells).
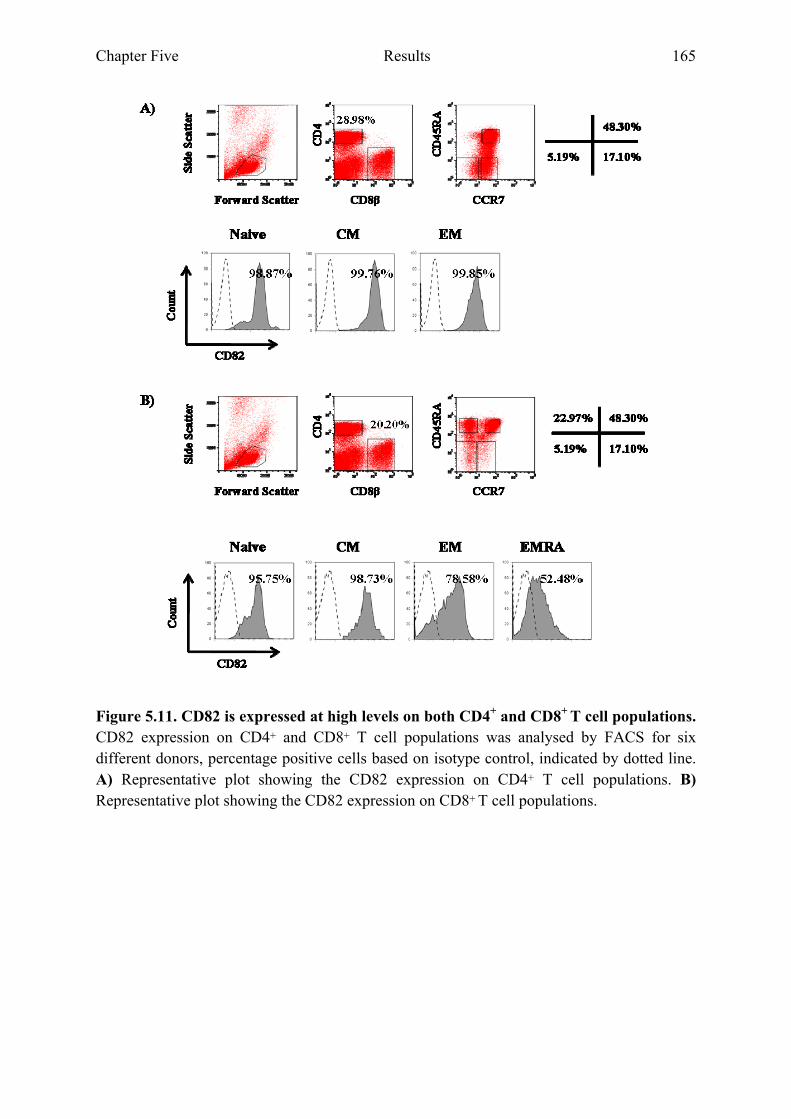
Chapter Five Results 165
Figure 5.11. CD82 is expressed at high levels on both CD4+ and CD8+ T cell populations. CD82 expression on CD4+ and CD8+ T cell populations was analysed by FACS for six different donors, percentage positive cells based on isotype control, indicated by dotted line. A) Representative plot showing the CD82 expression on CD4+ T cell populations. B) Representative plot showing the CD82 expression on CD8+ T cell populations.

Chapter Five Results 166
Figure 5.12. CD82 is expressed at very high levels on CD4+ T cell populations and its expression decreases on CD8+ T cells as they differentiate. The statistical significant differences were identified by Kruskal-Wallis with a Dunns post test. A) The percentage of CD82 positive cells and the mean fluorescence intensity (MFI) in the CD4+ T cell populations (**=p 0.0097, ***=p 0.0008). B) The percentage of CD82 positive cells and the mean fluorescence intensity (MFI) in the CD8+ T cell populations (**=p 0.0035, ***=p 0.0004).

Chapter Five Results 167
5.2.6 CD151 expression is highest on CD4+ and CD8+ EM T cell
populations
Fig. 5.13A shows representative plots for the CD151 expression on CD4+ T cell populations.
The top part of the figure shows the gating strategy used to analyse the data, cells were gated
on their forward and side scatter profiles and subsequently on their CD4, CD45RA and CCR7
expression. The expression of CD151 on CD4+ T cell populations is shown to go from almost
no expression on CD4+ naive T cells to > 40% positive cells in the EM population. The
highest expression of CD151 could be found on the CD4+ EM cells (Fig. 5.14). The change
in CD151 expression on the CD4+ T cells as they differentiate from naive to the EM and
population is statistically different, as determined by Kruskall-Wallis with a Dunns post test
(p=0.0043 for the change in percentage positive cells). The expression of CD151 on CD8+ T
cell populations showed a similar trend (Fig. 5.13B and 5.14B), although there seemed to be
a bigger spread between donors in the CD8+ compartment. The increase in CD151 expression
on the CD8+ T cells as they differentiate from naive to the EM population is statistically
different, as determined by Kruskall-Wallis with a Dunns post test (p=0.0372 for change in
MFI).

Chapter Five Results 168
Figure 5.13. CD151 is expressed at low levels on both CD4+ and CD8+ T cell populations. CD151 expression on CD4+ and CD8+ T cell populations was analysed by FACS for six different donors, percentage positive cells based on isotype control, indicated by dotted line. A) Representative plot showing the CD151 expression on CD4+ T cell populations. B) Representative plot showing the CD151 expression on CD8+ T cell populations.
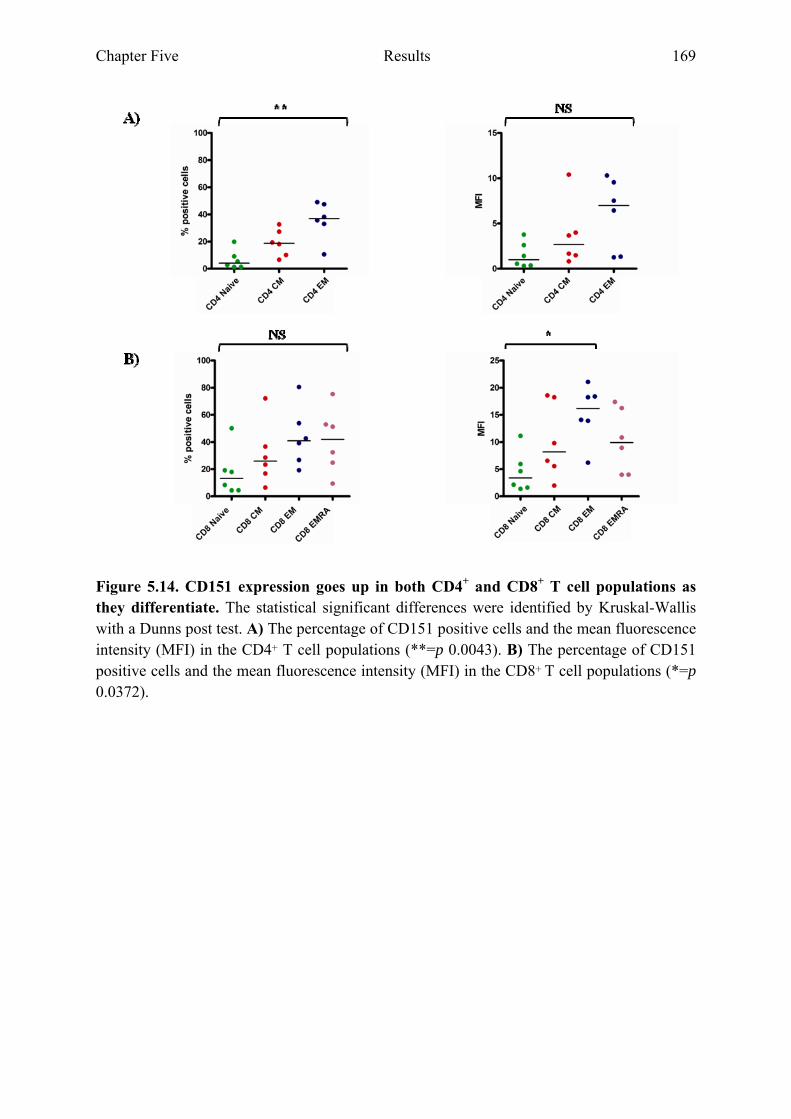
Chapter Five Results 169
Figure 5.14. CD151 expression goes up in both CD4+ and CD8+ T cell populations as they differentiate. The statistical significant differences were identified by Kruskal-Wallis with a Dunns post test. A) The percentage of CD151 positive cells and the mean fluorescence intensity (MFI) in the CD4+ T cell populations (**=p 0.0043). B) The percentage of CD151 positive cells and the mean fluorescence intensity (MFI) in the CD8+ T cell populations (*=p 0.0372).
Chapter Five Results 170
5.2.7 Expression of tetraspanins on the cell surface of CD4+ or CD8+ T cell
populations is not altered when comparing populations based on CD27 and
CD45RA or CCR7 and CD45RA
As described before different surface markers can be used to divide CD4+ and CD8+ T cell
populations into several distinct differentiation states. CD27 is another marker which when
used in conjunction with CD45RA describes naive, CM, EM and EMRA populations. To
check if any difference in the expression of the tetraspanin panel could be found when using
CD27 instead of CCR7 to divide the cells into the four populations, the cells were stained
with both CCR7 and CD27 as well as CD4, CD8β and CD45RA. As can be seen in Fig. 5.15
and 5.16 the expression of the tetraspanins on the four populations for both CD4+ and CD8+ T
cells follows the same expression pattern regardless of which antibody was used to identify
the populations. This indicates that CD4+ and CD8+ populations based on CCR7 and CD27
are homogeneous in their tetraspanin expression and one can conclude from this that these
two cell surface markers therefore are identifying the same populations.
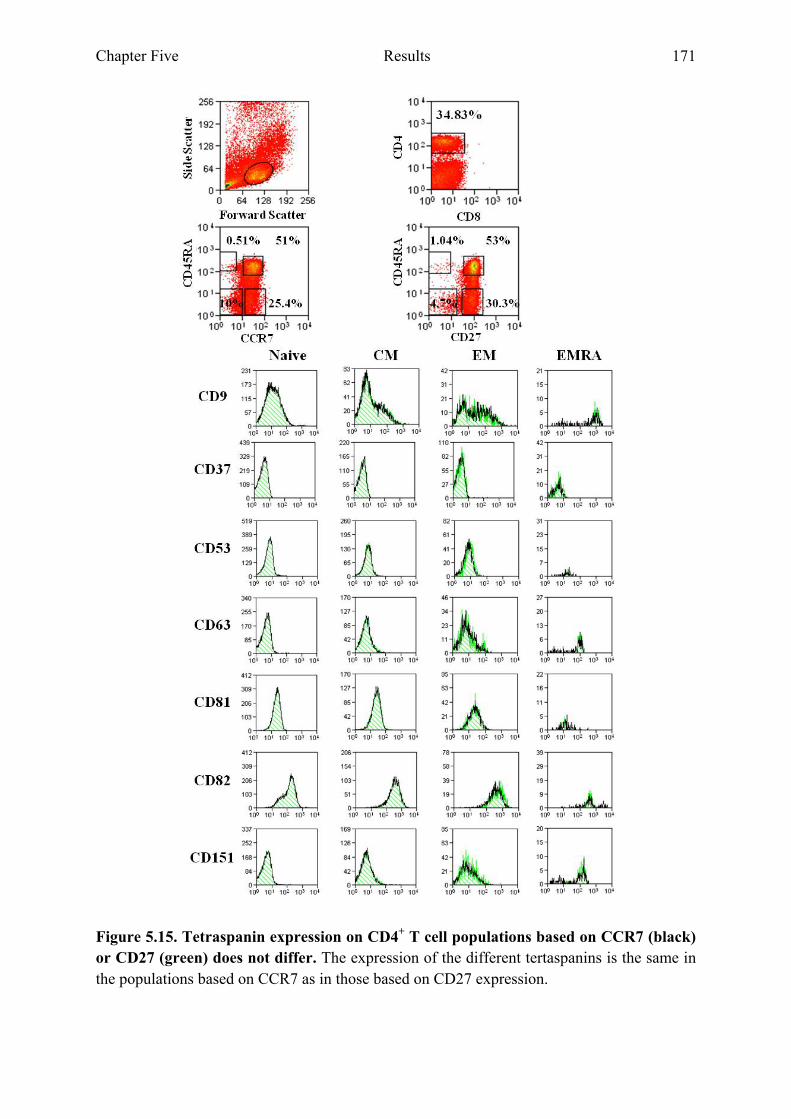
Chapter Five Results 171
Figure 5.15. Tetraspanin expression on CD4+ T cell populations based on CCR7 (black) or CD27 (green) does not differ. The expression of the different tertaspanins is the same in the populations based on CCR7 as in those based on CD27 expression.
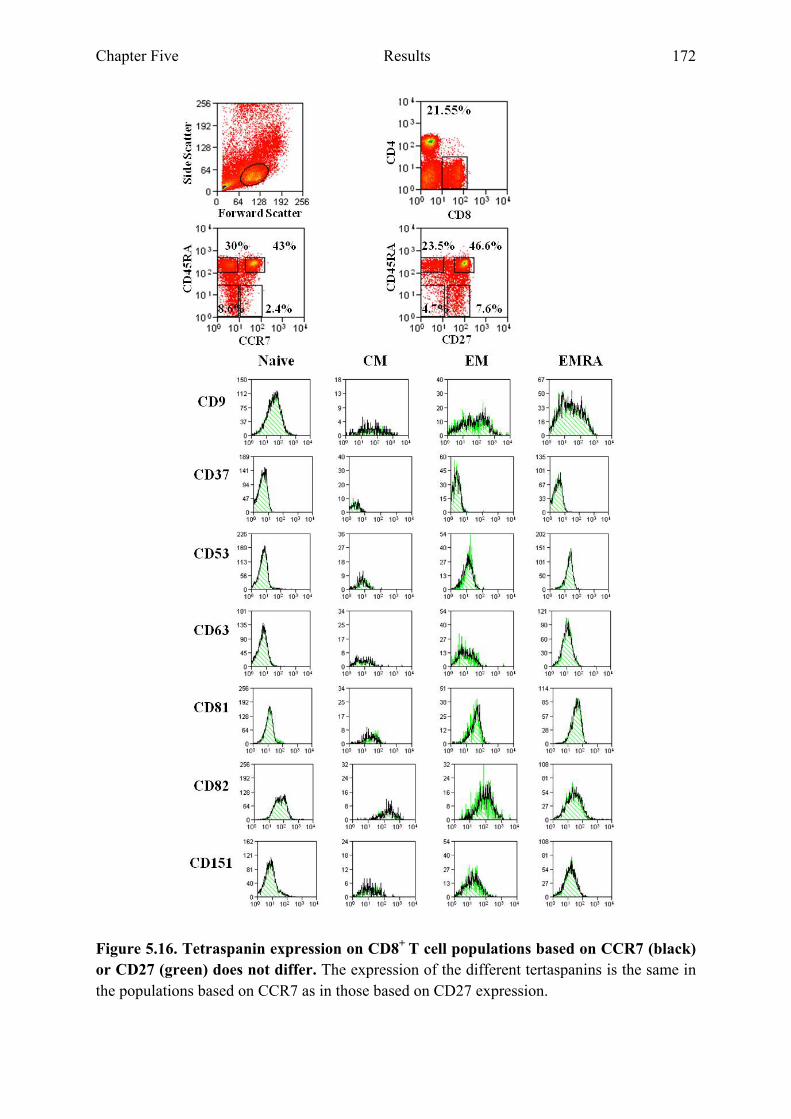
Chapter Five Results 172
Figure 5.16. Tetraspanin expression on CD8+ T cell populations based on CCR7 (black) or CD27 (green) does not differ. The expression of the different tertaspanins is the same in the populations based on CCR7 as in those based on CD27 expression.
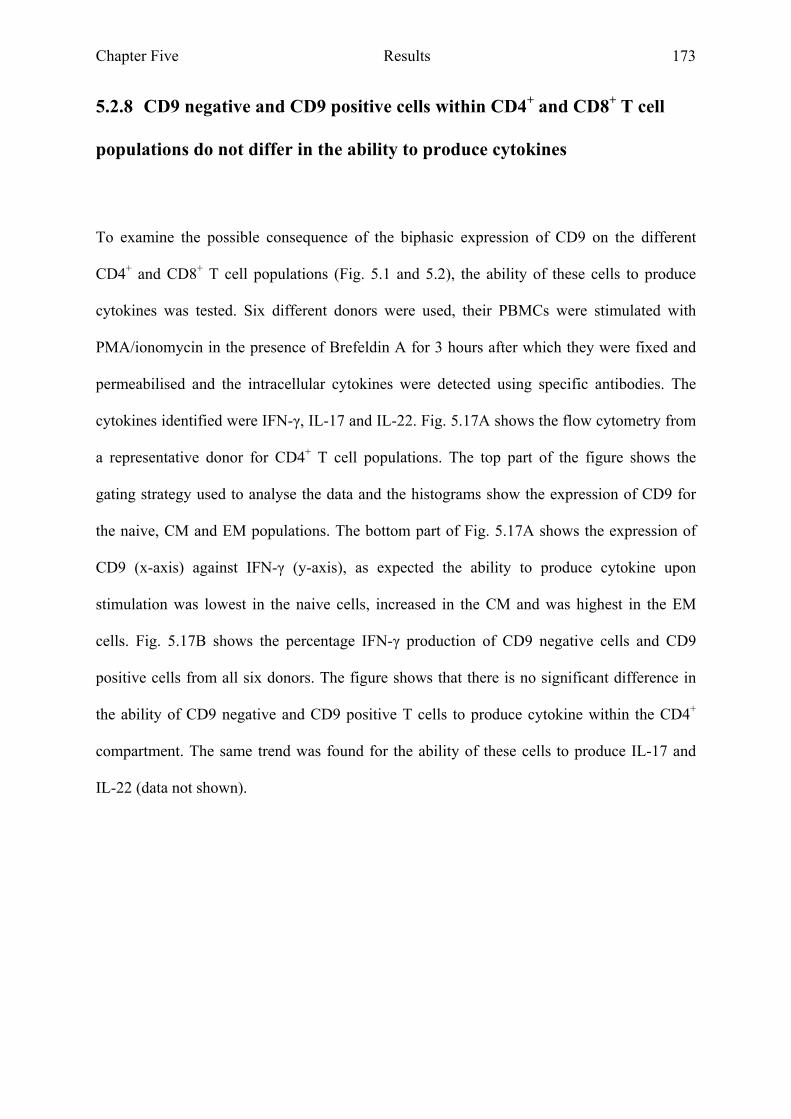
Chapter Five Results 173
5.2.8 CD9 negative and CD9 positive cells within CD4+ and CD8+ T cell
populations do not differ in the ability to produce cytokines
To examine the possible consequence of the biphasic expression of CD9 on the different
CD4+ and CD8+ T cell populations (Fig. 5.1 and 5.2), the ability of these cells to produce
cytokines was tested. Six different donors were used, their PBMCs were stimulated with
PMA/ionomycin in the presence of Brefeldin A for 3 hours after which they were fixed and
permeabilised and the intracellular cytokines were detected using specific antibodies. The
cytokines identified were IFN-γ, IL-17 and IL-22. Fig. 5.17A shows the flow cytometry from
a representative donor for CD4+ T cell populations. The top part of the figure shows the
gating strategy used to analyse the data and the histograms show the expression of CD9 for
the naive, CM and EM populations. The bottom part of Fig. 5.17A shows the expression of
CD9 (x-axis) against IFN-γ (y-axis), as expected the ability to produce cytokine upon
stimulation was lowest in the naive cells, increased in the CM and was highest in the EM
cells. Fig. 5.17B shows the percentage IFN-γ production of CD9 negative cells and CD9
positive cells from all six donors. The figure shows that there is no significant difference in
the ability of CD9 negative and CD9 positive T cells to produce cytokine within the CD4+
compartment. The same trend was found for the ability of these cells to produce IL-17 and
IL-22 (data not shown).
Chapter Five Results 174
Figure 5.17. No difference between CD9 negative and CD9 positive cells IFN γ production in CD4+ T cell populations. A) Representative plot (n=6) of the IFN γ production of CD9 negative and CD9 positive cells in CD4+ T cell populations. Dotted line indicates isotype control. B) The percentage of IFN γ production in the CD9 negative (left) and CD9 positive cells (right) CD4+ T cell populations.
Chapter Five Results 175
Fig. 5.18A shows the flow cytometry stain from a representative donor for CD8+ T cell
populations. The top part of the figure shows the gating strategy used to analyse the data and
the histograms show the expression of CD9 for the naive, CM, EM and EMRA populations.
The bottom part of Fig. 5.18A shows the expression of CD9 (x-axis) against IFN-γ (y-axis),
as can be seen the ability to produce cytokine upon stimulation was lowest in the naive cells,
increased in the CM, was highest in the EM cells and dropped down slightly in the EMRA
population. The figure shows that the percentage of IFN-γ producing cells in the CD9
negative population is slightly higher than in the CD9 positive T cells. Even though CD8+
cells are known to have a more limited repertoire of cytokine production and preferentially
produce IFN-γ, the production of IL-17 and IL-22 was still analysed. The production of IL-17
and IL-22 was found to not significantly differ between the CD9 negative and CD9 positive
populations for both the CD4+ and the CD8+ compartment (data not shown).

Chapter Five Results 176
Figure 5.18. No difference between CD9 negative and CD9 positive cells IFN γ production in CD8+ T cell populations. A) Representative plot (n=6) of the IFN γ production of CD9 negative and CD9 positive cells in CD8+ T cell populations. Dotted line indicates isotype control. B) The percentage of IFN γ production in the CD9 negative (left) and CD9 positive cells (right) CD8+ T cell populations.
Chapter Five Results 177
5.2.9 CD9 expression on sorted CD4+ CM and EM T cell populations
To analyse the effect of cellular activation on CD9 negative T cells, CD9 negative
populations were sorted from CD4+ CM and EM populations for two donors. The cells were
then seeded at 10,000-70,000 cells/well and were either stimulated with α-CD3/α-CD28
beads and cultured, or not stimulated and cultured, after which their CD9 expression was
assessed. Fig. 5.19A shows the sorting strategy used to sort CD4+ CM CD9- cells,
representative flow cytometry plots are shown. The cells were gated on size and granularity,
the expression of CD4 and CCR7+CD45RA-. An isotype control (IgGκ) for the CD9 antibody
(Fig. 5.19A first histogram) was used to establish specific staining for CD9 (Fig. 5.19A
second histogram). Fig. 5.19B shows representative purities for CD4, the CM population and
subsequently the sorted CD9- population. Compared to the purity on day 0 a subtle increase in
CD9+ cells could be seen for both the unstimulated and the stimulated cultured cells at day 2.
The number of CD9+ cells on day 8 returned to a similar percentage positive cells as on day
0. Fig. 5.20A shows the percentage CD9 positive cells from one sort for the CM CD9- sorted
population in culture (a technical replicate is shown for day 2). Fig. 5.20A shows that
especially the stimulated cells increased their CD9 expression after two days in culture, but
that this increased expression has disappeared at day 8 in culture. Fig. 5.20B shows the
percentage CD9 positive cells from a second sort for the CM CD9- sorted population in
culture. An increase in CD9 positive cells can be seen in the stimulated cells after two days in
culture. For this second sort, there was no day 8 time point to corroborate the drop back to
day 0 CD9 expression levels seen in the first experiment.
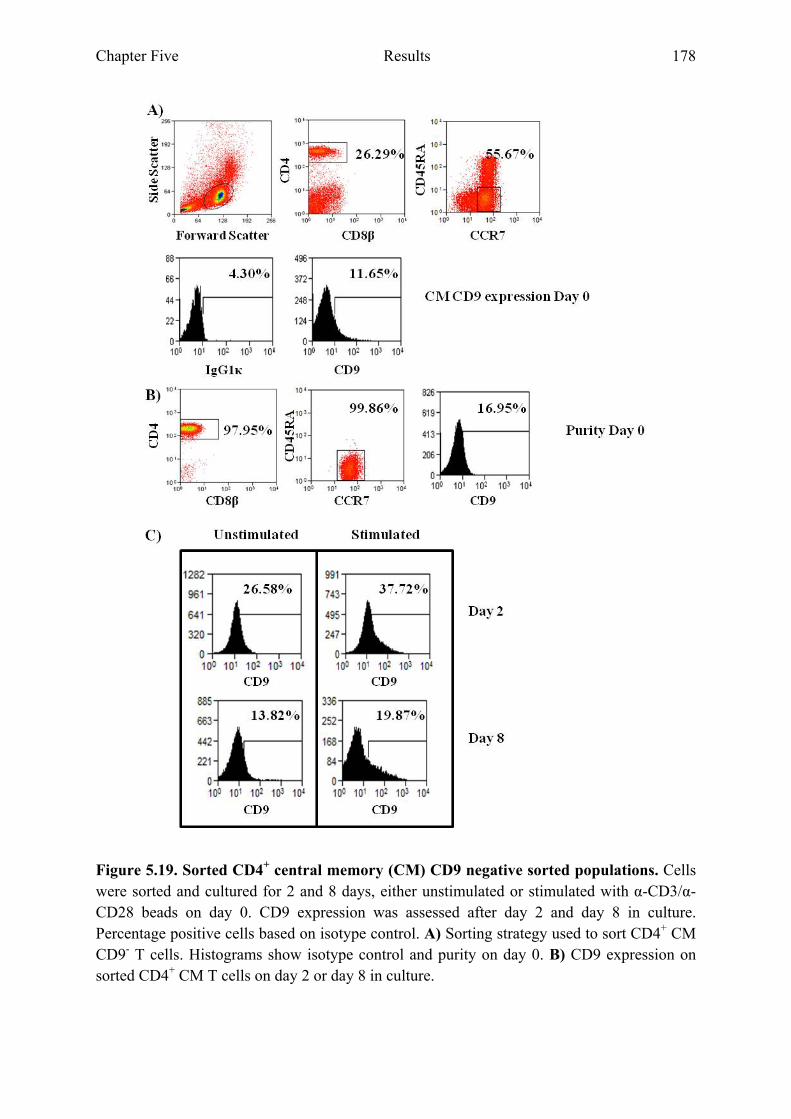
Chapter Five Results 178
Figure 5.19. Sorted CD4+ central memory (CM) CD9 negative sorted populations. Cells were sorted and cultured for 2 and 8 days, either unstimulated or stimulated with α-CD3/α-CD28 beads on day 0. CD9 expression was assessed after day 2 and day 8 in culture. Percentage positive cells based on isotype control. A) Sorting strategy used to sort CD4+ CM CD9- T cells. Histograms show isotype control and purity on day 0. B) CD9 expression on sorted CD4+ CM T cells on day 2 or day 8 in culture.
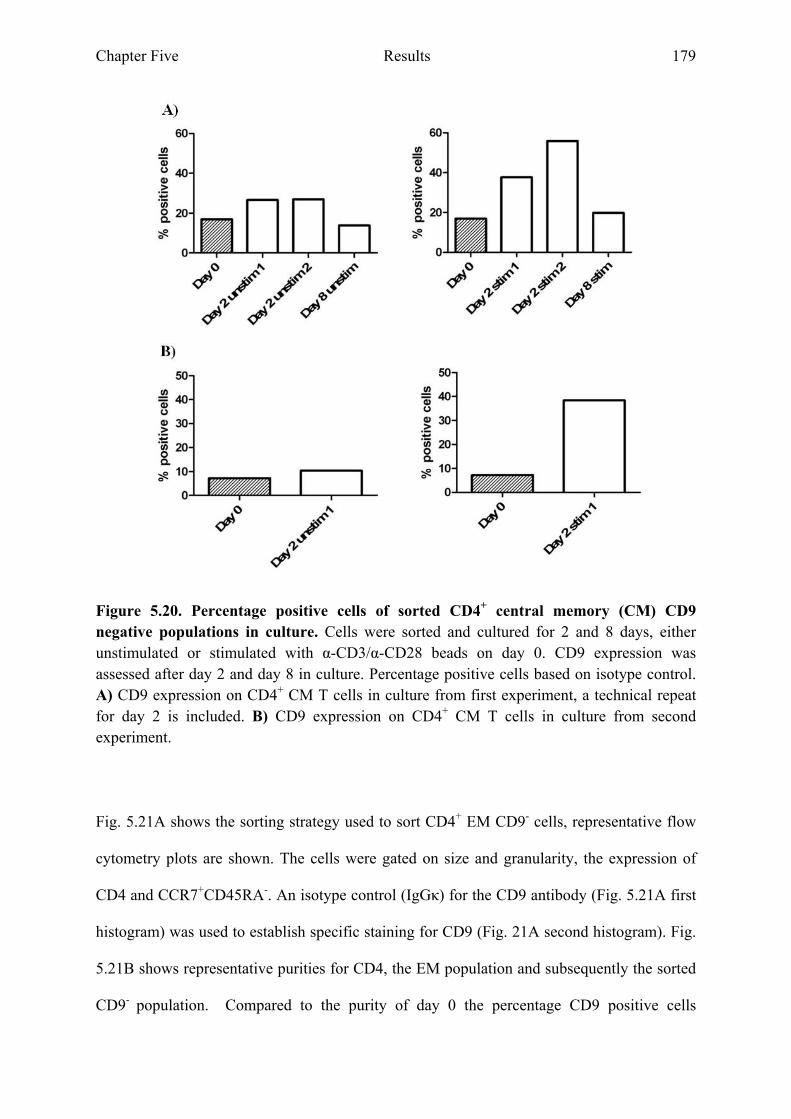
Chapter Five Results 179
Figure 5.20. Percentage positive cells of sorted CD4+ central memory (CM) CD9 negative populations in culture. Cells were sorted and cultured for 2 and 8 days, either unstimulated or stimulated with α-CD3/α-CD28 beads on day 0. CD9 expression was assessed after day 2 and day 8 in culture. Percentage positive cells based on isotype control. A) CD9 expression on CD4+ CM T cells in culture from first experiment, a technical repeat for day 2 is included. B) CD9 expression on CD4+ CM T cells in culture from second experiment.
Fig. 5.21A shows the sorting strategy used to sort CD4+ EM CD9- cells, representative flow
cytometry plots are shown. The cells were gated on size and granularity, the expression of
CD4 and CCR7+CD45RA-. An isotype control (IgGκ) for the CD9 antibody (Fig. 5.21A first
histogram) was used to establish specific staining for CD9 (Fig. 21A second histogram). Fig.
5.21B shows representative purities for CD4, the EM population and subsequently the sorted
CD9- population. Compared to the purity of day 0 the percentage CD9 positive cells
Chapter Five Results 180
increased substantially after two days in culture (Fig. 5.21C), this held true for both the
unstimulated and (to a lesser extent) stimulated cells. After eight days in culture, the CD9
expression was back to a similar level as on day 0. Fig. 5.22A summarises the flow cytometry
data for the first experiment and it is clear that CD9 expression was increased on day 2 and
dropped back down on day 8. The increase in CD9 expression was higher in the unstimulated
cells than in the stimulated cells. This increase in CD9 expression was also clear in the
second experiment (Fig. 5.22B).
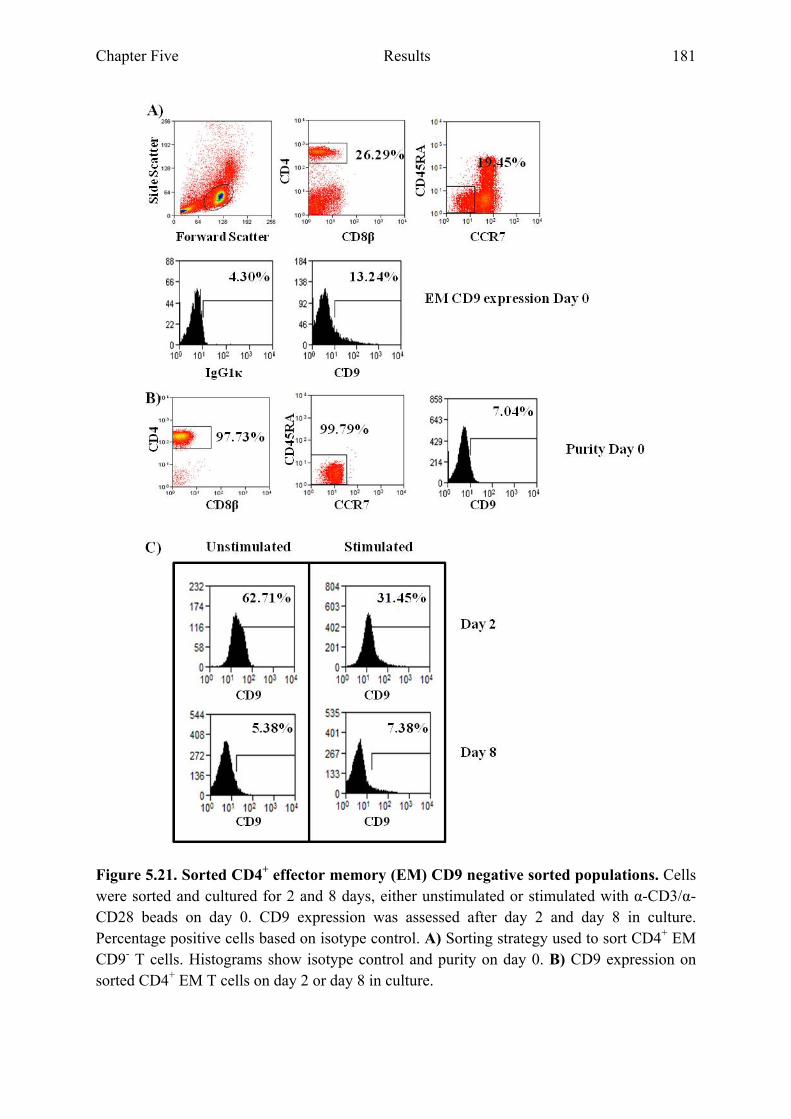
Chapter Five Results 181
Figure 5.21. Sorted CD4+ effector memory (EM) CD9 negative sorted populations. Cells were sorted and cultured for 2 and 8 days, either unstimulated or stimulated with α-CD3/α-CD28 beads on day 0. CD9 expression was assessed after day 2 and day 8 in culture. Percentage positive cells based on isotype control. A) Sorting strategy used to sort CD4+ EM CD9- T cells. Histograms show isotype control and purity on day 0. B) CD9 expression on sorted CD4+ EM T cells on day 2 or day 8 in culture.
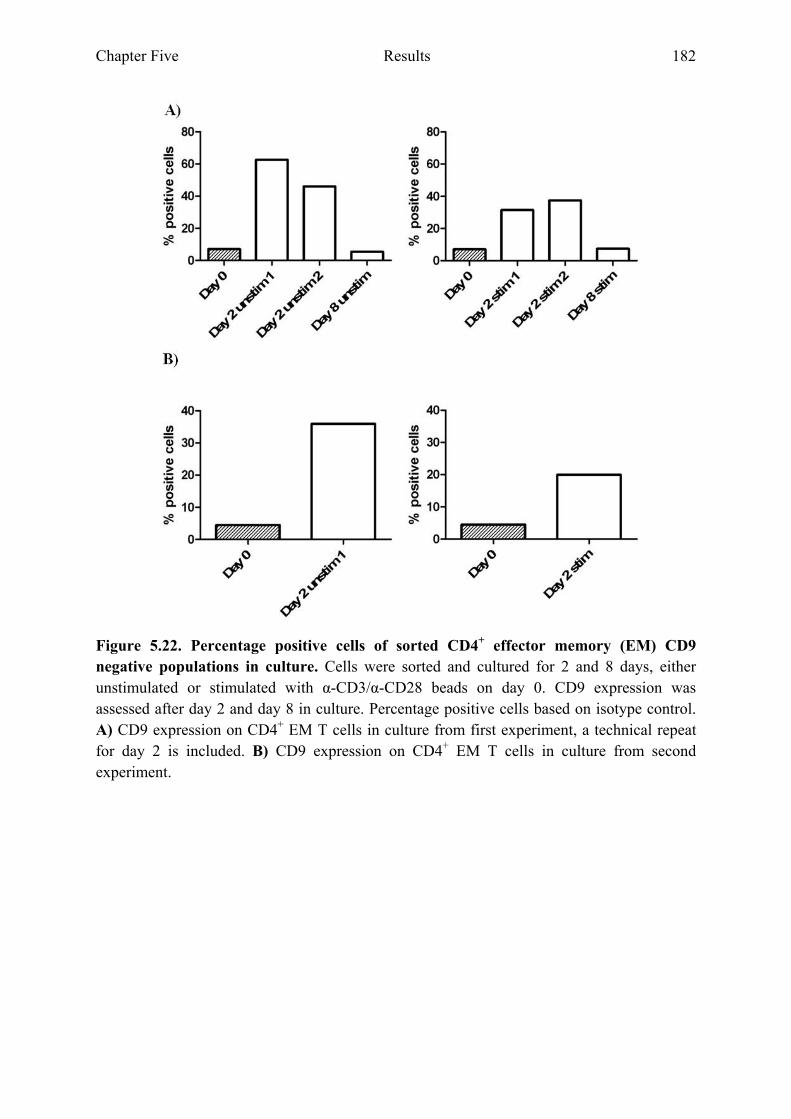
Chapter Five Results 182
Figure 5.22. Percentage positive cells of sorted CD4+ effector memory (EM) CD9 negative populations in culture. Cells were sorted and cultured for 2 and 8 days, either unstimulated or stimulated with α-CD3/α-CD28 beads on day 0. CD9 expression was assessed after day 2 and day 8 in culture. Percentage positive cells based on isotype control. A) CD9 expression on CD4+ EM T cells in culture from first experiment, a technical repeat for day 2 is included. B) CD9 expression on CD4+ EM T cells in culture from second experiment.
Chapter Five Results 183
5.3 Discussion
The aim of the experiments in this chapter was to correlate the cell surface expression of
tetraspanins on CD4+ and CD8+ T cell populations with their mRNA levels identified in these
cells by microarray and Real Time PCR. Tetraspanins have been implicated in organising the
cell membrane resulting in coordinating signalling pathways and several groups have
reported a role for tetraspanin microdomains in MHC II clustering on APCs 73;82;132;133. The
experiments in this chapter show that the family of tetraspanins shows differential expression
patterns on both CD4+ and CD8+ T cell populations.
In most cases the expression levels measured by microarray, Real Time PCR and flow
cytometry corresponded very well (Fig. 5.23 A and B) indicating that for most tetraspanins
mRNA levels and cell surface expression do not differ too much. For CD37 cell surface
expression was undetectable above an isotype control (Fig. 5.4 and 5.23A), but was
detectable at mRNA level on both microarray and Real Time PCR. The cell surface
expression of CD9 detected by flow cytometry corresponded with the mRNA levels
identified through microarray and Real Time PCR.
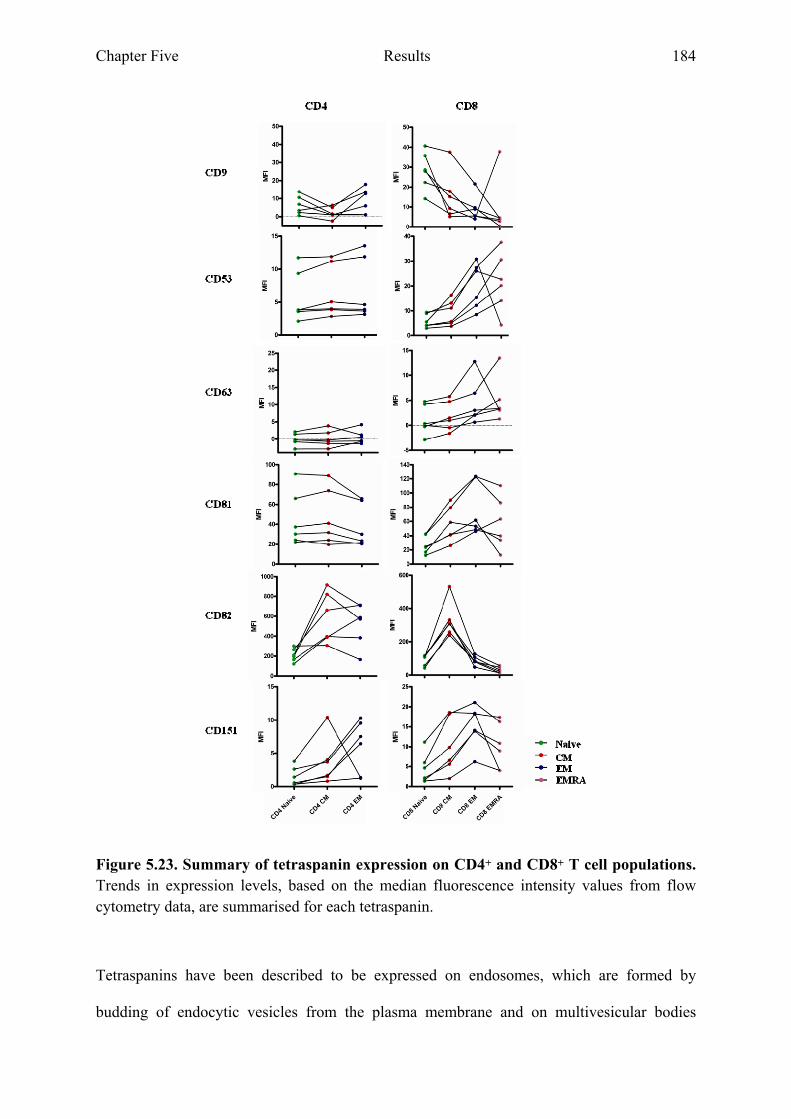
Chapter Five Results 184
Figure 5.23. Summary of tetraspanin expression on CD4+ and CD8+ T cell populations. Trends in expression levels, based on the median fluorescence intensity values from flow cytometry data, are summarised for each tetraspanin.
Tetraspanins have been described to be expressed on endosomes, which are formed by
budding of endocytic vesicles from the plasma membrane and on multivesicular bodies
Chapter Five Results 185
(MVBs) 78. MVBs can mature into lysosomes, which can fuse with the plasma membrane
when triggered, turning them into exosomes. Tetraspanins CD53 and CD63 have been
described to be highly expressed on exosomes 78;159. Exosomes can transfer lipids and
proteins, deliver mRNA or in the case of cytotoxic T cells deliver perforins and granzymes.
CD63 has been described to be mainly localised on the lysosomes of resting platelets, but
after platelet activation CD63 expression is increased on the cell surface 159. The data in this
chapter shows that for CD8+ T cells the expression of CD53 and CD63 goes up in the more
differentiated cells (Fig. 5.23). This increased expression of these tetraspanins on the more
mature cells of the EM and EMRA populations could be due to the fact that these two
populations are capable of exerting effector functions by releasing cytotoxic lysosomes. The
CD53 and CD63 expression on the cell surface could reflect a stage in the recirculation to the
plasma membrane from endosomes/exosomes.
CD151 regulates cell migration through its interaction with the integrin α3β1 and α6β4 and
its involvement in matrix metalloproteinases (MMP) expression 81. After CD151 knockdown
in a carcinoma cell line the expression levels of several MMPs were reduced. The CD151
knockdown cells also had impairment in their mobility and in α3β1 internalisation. The
importance of CD151 in integrin trafficking was shown by mutating the sorting motif of
CD151 resulting in reduced α3β1, α5β1 and α6β1 endocytosis and accumulation of these
integrins in intracellular compartments. The expression of CD151 on both CD4+ and CD8+ T
cells was shown to be highest on the EM and EMRA populations (Fig. 5.23) and these cells
need to be able to migrate into tissues. CD151’s involvement in integrin trafficking and the
fact that memory T cells are known to show a higher and more varied expression of integrins
than the naive population, could correlate with the increased CD151 expression found on the
more differentiated cells 81. In cultured human umbilical vein endothelial cells (HUVEC)

Chapter Five Results 186
CD151 expression was found mostly on endosomes/exosomes, which could indicate that
similar to CD53 and CD63, the increased expression of CD151 on the EM and EMRA T cell
populations could be due to recirculation between endosomes and plasma membrane 160 161.
Unternaehrer et al (2007) described that CD9 on mouse DCs is involved in the
multimerisation of MHC-II molecules on the cell surface and suggested that this
multimerisation could enhance the ability of DCs to engage with the T cell receptor 134. They
found that MHC-II formed clusters on the cell surface of DCs, but not B blasts. They then
focussed on the expression of several tetraspanins known to be predominantly expressed on
the surface of cells. CD81 was expressed at high levels on B blasts, but not on DCs. Whereas
CD9 was expressed at high levels on the DCs and not on B blasts. When they transfected BM
derived DCs from CD9-/- mice with a I-E-GFP construct and tested I-A/I-E clustering by
using I-A or I-E beads, they found that in the absence of CD9 MHC-II clustering was
abrogated. To test whether CD9 was indeed capable of directing MHC-II clustering on the
cell surface, a B cell line which does not express CD9 was transfected with a CD9 construct
and this resulted in I-E coimmunoprecipitating with I-A. Kropshofer et al (2001) used an
antibody against CDw78 microdomains on human cell lines and found that tetraspanins CD9,
CD81 and CD82 associate with MHC-II in these microdomains 133.
When sorted CD9 negative cells from CD4+ CM or EM T cells were cultured in vitro, an
increase in CD9 positive cells was found after two days in culture (Fig. 5.19-22). This
increase in CD9 positive cells disappeared after prolonged culture of these cells without
restimulation (8 days in culture). The increase in CD9 positive cells after stimulation could
indicate CD9 involvement on recently activated T cells. As Unternaehrer et al (2007) show,
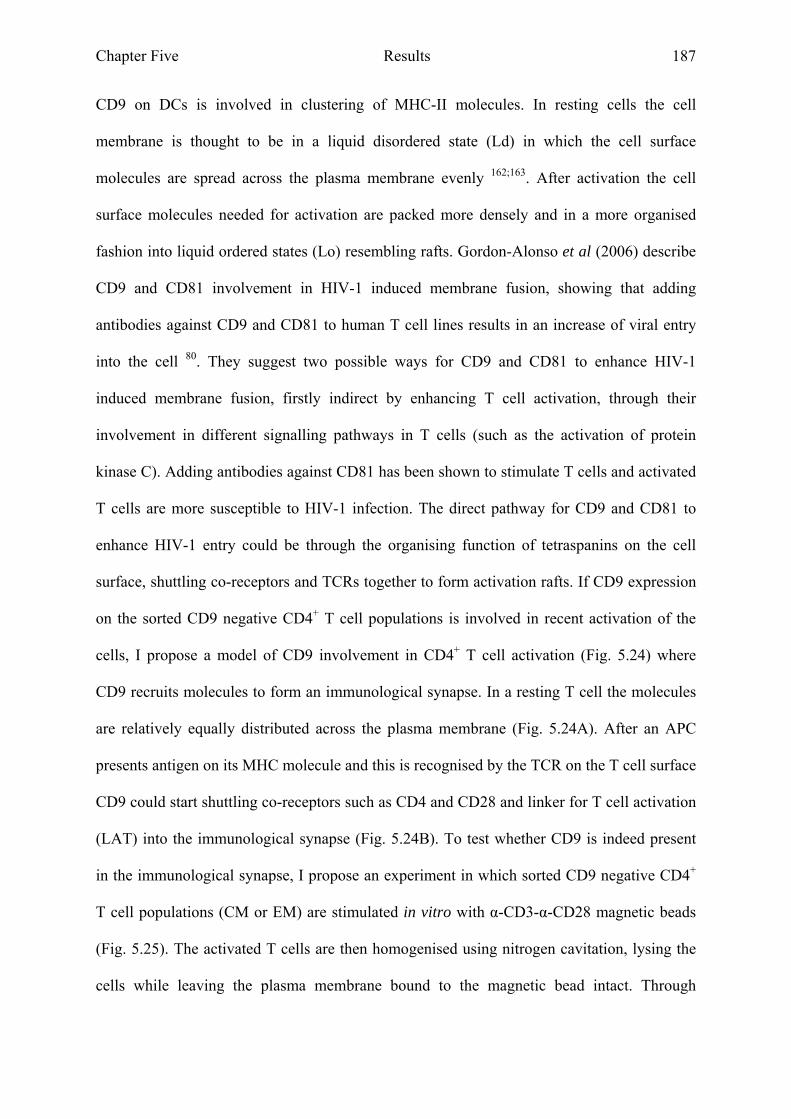
Chapter Five Results 187
CD9 on DCs is involved in clustering of MHC-II molecules. In resting cells the cell
membrane is thought to be in a liquid disordered state (Ld) in which the cell surface
molecules are spread across the plasma membrane evenly 162;163. After activation the cell
surface molecules needed for activation are packed more densely and in a more organised
fashion into liquid ordered states (Lo) resembling rafts. Gordon-Alonso et al (2006) describe
CD9 and CD81 involvement in HIV-1 induced membrane fusion, showing that adding
antibodies against CD9 and CD81 to human T cell lines results in an increase of viral entry
into the cell 80. They suggest two possible ways for CD9 and CD81 to enhance HIV-1
induced membrane fusion, firstly indirect by enhancing T cell activation, through their
involvement in different signalling pathways in T cells (such as the activation of protein
kinase C). Adding antibodies against CD81 has been shown to stimulate T cells and activated
T cells are more susceptible to HIV-1 infection. The direct pathway for CD9 and CD81 to
enhance HIV-1 entry could be through the organising function of tetraspanins on the cell
surface, shuttling co-receptors and TCRs together to form activation rafts. If CD9 expression
on the sorted CD9 negative CD4+ T cell populations is involved in recent activation of the
cells, I propose a model of CD9 involvement in CD4+ T cell activation (Fig. 5.24) where
CD9 recruits molecules to form an immunological synapse. In a resting T cell the molecules
are relatively equally distributed across the plasma membrane (Fig. 5.24A). After an APC
presents antigen on its MHC molecule and this is recognised by the TCR on the T cell surface
CD9 could start shuttling co-receptors such as CD4 and CD28 and linker for T cell activation
(LAT) into the immunological synapse (Fig. 5.24B). To test whether CD9 is indeed present
in the immunological synapse, I propose an experiment in which sorted CD9 negative CD4+
T cell populations (CM or EM) are stimulated in vitro with α-CD3-α-CD28 magnetic beads
(Fig. 5.25). The activated T cells are then homogenised using nitrogen cavitation, lysing the
cells while leaving the plasma membrane bound to the magnetic bead intact. Through
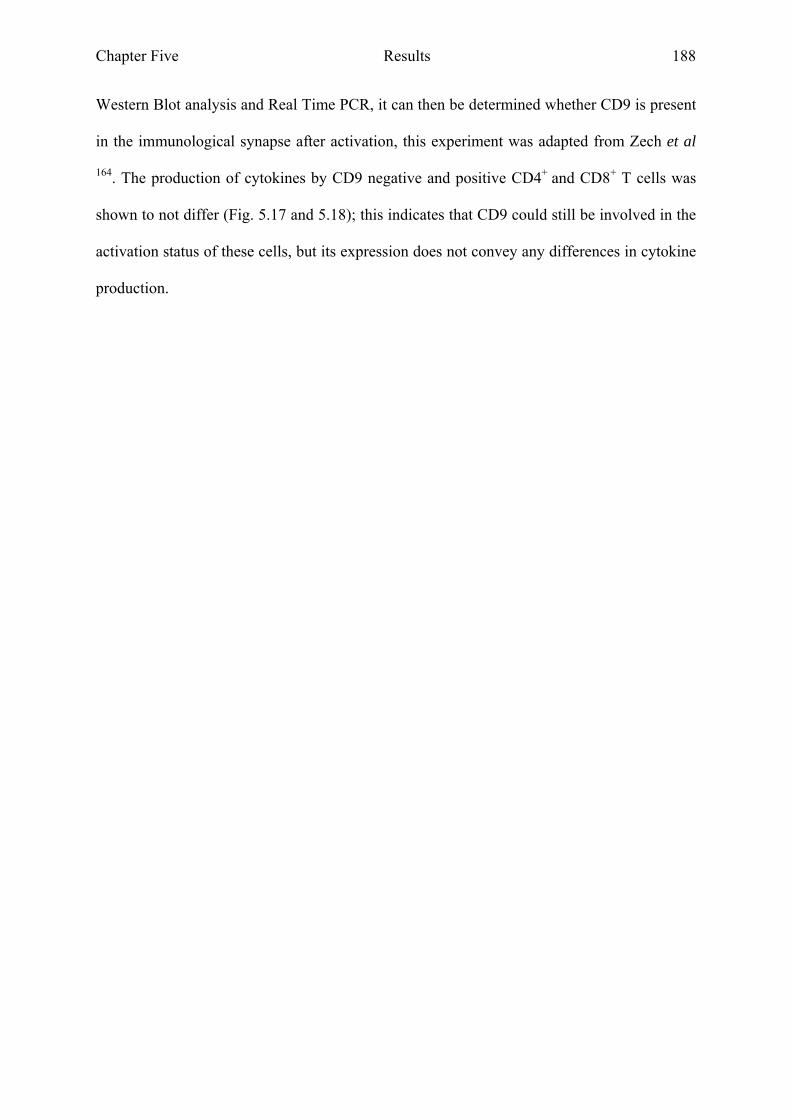
Chapter Five Results 188
Western Blot analysis and Real Time PCR, it can then be determined whether CD9 is present
in the immunological synapse after activation, this experiment was adapted from Zech et al
164. The production of cytokines by CD9 negative and positive CD4+ and CD8+ T cells was
shown to not differ (Fig. 5.17 and 5.18); this indicates that CD9 could still be involved in the
activation status of these cells, but its expression does not convey any differences in cytokine
production.
Chapter Five Results 189
Figure 5.24. Model of CD9 involvement on recently activated CD4+ T cell populations. A) The cell membrane of resting T cells may contain small rafts of proteins. B) When activated by an antigen presenting cell (APC) clusters of T cell receptors (TCRs) and CD3 with signalling proteins such as LAT and Lck can form. Tetraspanin CD9 could be involved in forming these rafts.
Chapter Five Results 190
Figure 5.25. Model of analysing CD9 involvement on recently activated CD4+ T cell populations. Sorted CD4+ T cells are incubated with α-CD3/α-CD28 magnetic beads, the T cell gets activated after which the cell is lysed by nitrogen cavitation, leaving the plasma membrane bound to the magnetic bead intact. The bound plasma membrane can than be analysed through Western Blot and Real Time PCR to identify whether CD9 is involved in these activation rafts.
CD81 has been described to have an antiproliferative effect on B cells where it is part of a
complex with CD21, CD19 and Leu13 79. On human thymocytes CD81 has been shown to
associate with both the CD4 and the CD8 co-receptors and the addition of an anti-CD81
antibody resulted in adhesion of the cells. The anti-CD81 triggered adhesion could be
blocked by anti-LFA-1 and anti-ICAM-1 antibodies, suggesting that this adhesion is caused
by these molecules. Crosslinking of CD81 on thymocytes resulted in a costimulatory signal to
CD3 and subsequent proliferation, but each of the antibodies to CD3 or CD81 on their own
had no proliferative effect on the cells 79;98. The data in this chapter shows the percentage
CD81 positive CD4+ T cells slightly decreases as the cells mature, whereas a slight increase
can be seen on the percentage CD81 positive CD8+ T cells as they differentiate (Fig. 5.23).
When looking at the MFI of the positive cells though, it is noticeable that the amount of
CD81 on the positive cells does not change significantly (Fig 5.10), except between CD8+
populations (p = 0.0383). This suggests that in both CD4+ and CD8+ T cells throughout
differentiation the naive cells and the antigen experienced CM, EM and EMRA populations
Chapter Five Results 191
express similar levels of CD81 on their cell surface. Todd et al (1996) cultured thymocytes in
the presence of an antibody against CD81, which resulted in the upregulation of the
activation markers CD69 and CD25 98. They found that the majority of the CD69+ cells
cultured in the presence of anti-CD81 had a CD4-CD8+ phenotype. This could suggest that
CD81 has an important role in CD8+ T cell generation in the thymus and possibly in the more
differentiated CD8+ T cells. CD8+ T cells might need CD81 expression to become more
easily activated and increase their proliferation; it is possible that CD9 performs a similar
function on CD4+ T cells.
The results from Chapter 5 show that several tetraspanin family members display differential
expression on the T cell surface. CD9 expression was found to show a biphasic expression
pattern on both CD4+ and CD8+ T cells. An increase in CD9 positive cells was found after
two days in culture (Fig. 5.19-22) when sorted CD9 negative cells from CD4+ CM or EM T
cells were cultured in vitro; this increase in CD9 positive cells disappeared after prolonged
culture of these cells without restimulation (8 days in culture). The increase in CD9 positive
cells after stimulation could possibly indicate CD9 involvement on recently activated T cells,
however there was no difference in the production of cytokines by CD9 negative and positive
CD4+ and CD8+ T cells (Fig. 5.17 and 5.18). This result does not exclude CD9 involvement
in the activation status of these cells, but its expression does not seem to convey a difference
in cytokine production.

Chapter Six General Discussion 192
Chapter Six
General Discussion
Chapter Six General Discussion 193
6 GENERAL DISCUSSION
6.1 Introduction
CD4+ and CD8+ T cells are important mediators of the adaptive immune response and they
can be subdivided into several populations based on the expression of cell surface markers
and transcription factors as well as the ability to produce cytokines. The principle of using
gene expression profiles to analyse previously described cell populations has been
successfully used in several studies, resulting in the identification of several target genes and
cell type specific gene expression profiles 108;110;117. The aim of this study was to analyse the
gene expression of sorted CD4+ and CD8+ T cell populations based on the expression of
CCR7 and CD45RA to identify gene profiles for these cell populations as well as genes of
interest to be analysed further.
During the course of this thesis I have shown that by using microarray analysis on sorted
CD4+ and CD8+ T cell populations shared and distinct genes can be found. The gene
expression profiles analysed suggested a linear pathway of differentiation for these
populations; they could not exclude a divergent differentiation pathway necessarily. I have
also provided evidence that the data generated through microarray analysis could be validated
by Real Time PCR. Furthermore the role of the tetraspanin gene family of interest, which
arose from the microarray data was analysed for CD4+ and CD8+ T cells, indicating the
differential involvement of tetraspanins at various stages of T cell differentiation.
The finding of gene expression profiles relating to naive, central memory (CM) and effector
memory (EM) T cell populations for both CD4+ and CD8+ T cells can be of importance when
examining T cell mediated diseases in humans. The profiles identified in this study are
Chapter Six General Discussion 194
specific to a steady-state condition, with no inflammation present; however the fact that these
genes have proved to be important in distinguishing between T cell populations at a steady-
state implies that they could also be important in a disease setting. The genes identified in this
thesis could reflect a baseline expression level which changes when the immune system is
activated against a pathogen and returns to baseline after antigen clearance. It would therefore
be interesting to analyse the gene expression of these cell populations in a disease setting.
The tetraspanin gene family has been described to be involved in many important cellular
processes, such as cell activation, adhesion and differentiation 77;165;166. Several tetraspanins
show wide distribution on many different cell types (e.g. CD81 on most human tissues),
whereas others show a more restricted level of expression (e.g. CD37 on B cells).
Tetraspanins are known to associate with other molecules such as integrins, signalling
enzymes as well as other tetraspanins 77;165. The many interactions that tetraspanins can form
suggest their involvement in the plasma membrane as molecular facilitators which organise
the membrane into tetraspanin enriched domains (TEMs) upon activation. Differential
expression levels of tetraspanins found in this study indeed suggest a role for tetraspanins in
T cell activation, migration and lysosomal function. The fact that tetraspanins are capable of
forming homodimers and heterodimers suggests that there might be some redundancy in the
function of different tetraspanins.
Chapter Six General Discussion 195
6.2 A shared differentiation pathway for CD4+ and CD8+ T cell
populations based on CCR7 and CD45RA
The results from Chapters 3 and 4 suggest several genes which can be used to distinguish
between naive, central memory and effector memory T cell populations. These genes suggest
a linear pathway of differentiation, but they do not exclude a non-linear pathway of
differentiation (Fig. 3.32 and 3.33). One of the limitations of microarray analysis is the
generation of a large data set, which on its own is not biologically significant. Further
experiments leading on from microarray data are always needed to examine the function of
target genes identified. The genes identified in this study will need to be analysed more
extensively to ascertain their function in T cell biology. Another factor to consider is that the
cell populations analysed in this thesis were all collected under non-inflammatory conditions,
from healthy donors. The populations analysed were therefore in a resting state and how their
behaviour in rest relates to that which occurs under inflammatory conditions cannot be
ascertained from this study. Based on the results from the gene expression analysis I would
suggest an adaptation to our models of differentiation described in Chapter 3 (Fig. 6.1, 3.32
and 3.33). During acute inflammation naive T cells are activated and give rise to short lived
effector T cells, capable of producing inflammatory cytokines as well as releasing vesicles
containing granzymes and perforin. Memory T cells can either be formed during this same
acute inflammation stage and persist over longer periods of time, or they arise at the end of
the expansion state by late-arriving naive T cells. The late arriving naive T cells can
differentiate along a linear pathway of differentiation or a non-linear pathway to give rise to
long lived CM and EM T cell populations.
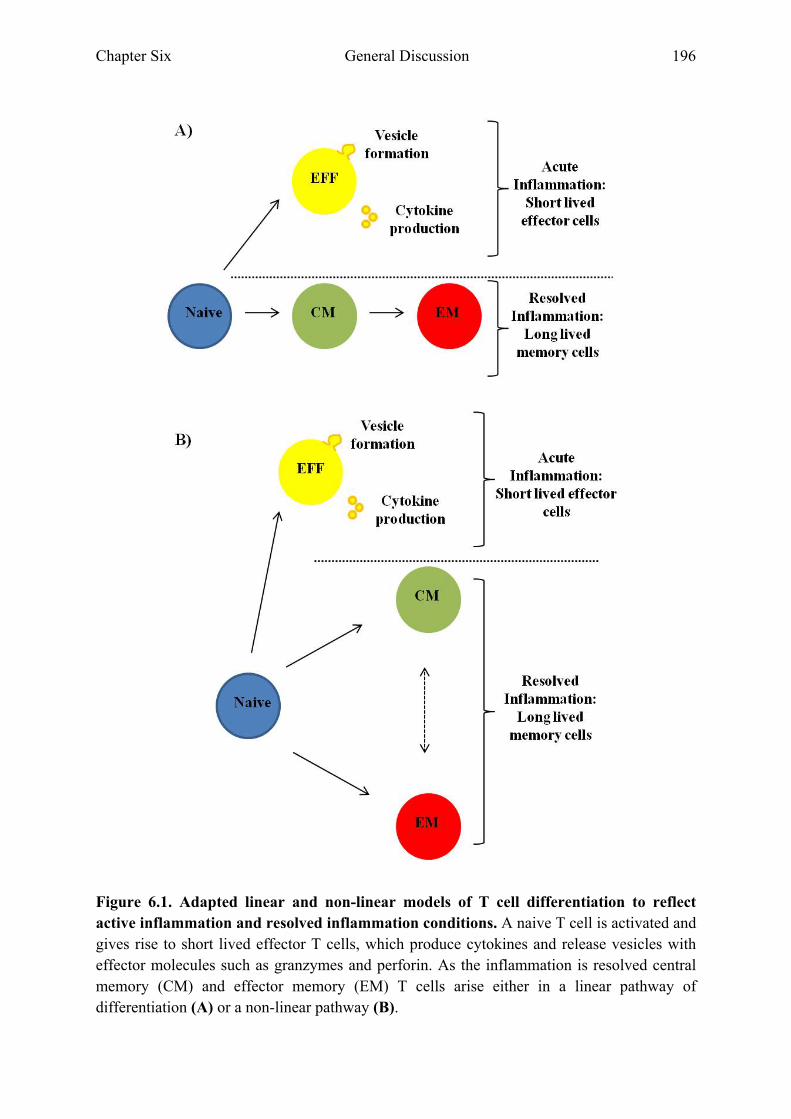
Chapter Six General Discussion 196
Figure 6.1. Adapted linear and non-linear models of T cell differentiation to reflect active inflammation and resolved inflammation conditions. A naive T cell is activated and gives rise to short lived effector T cells, which produce cytokines and release vesicles with effector molecules such as granzymes and perforin. As the inflammation is resolved central memory (CM) and effector memory (EM) T cells arise either in a linear pathway of differentiation (A) or a non-linear pathway (B).
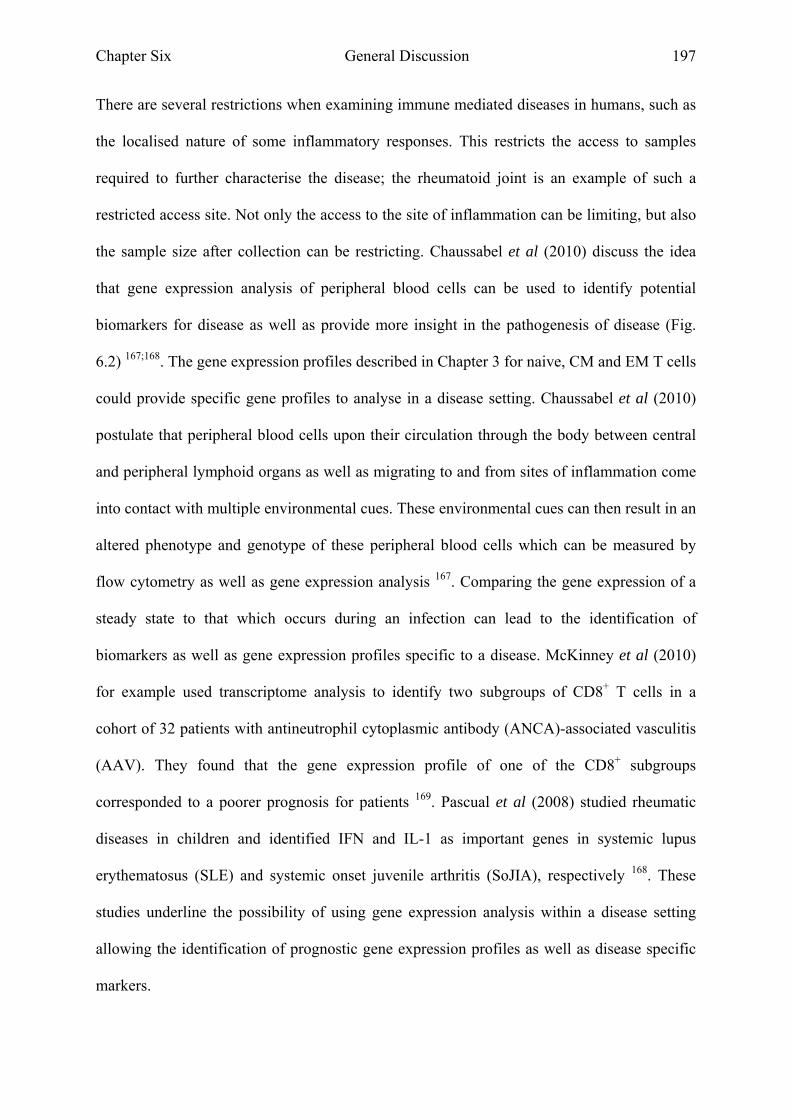
Chapter Six General Discussion 197
There are several restrictions when examining immune mediated diseases in humans, such as
the localised nature of some inflammatory responses. This restricts the access to samples
required to further characterise the disease; the rheumatoid joint is an example of such a
restricted access site. Not only the access to the site of inflammation can be limiting, but also
the sample size after collection can be restricting. Chaussabel et al (2010) discuss the idea
that gene expression analysis of peripheral blood cells can be used to identify potential
biomarkers for disease as well as provide more insight in the pathogenesis of disease (Fig.
6.2) 167;168. The gene expression profiles described in Chapter 3 for naive, CM and EM T cells
could provide specific gene profiles to analyse in a disease setting. Chaussabel et al (2010)
postulate that peripheral blood cells upon their circulation through the body between central
and peripheral lymphoid organs as well as migrating to and from sites of inflammation come
into contact with multiple environmental cues. These environmental cues can then result in an
altered phenotype and genotype of these peripheral blood cells which can be measured by
flow cytometry as well as gene expression analysis 167. Comparing the gene expression of a
steady state to that which occurs during an infection can lead to the identification of
biomarkers as well as gene expression profiles specific to a disease. McKinney et al (2010)
for example used transcriptome analysis to identify two subgroups of CD8+ T cells in a
cohort of 32 patients with antineutrophil cytoplasmic antibody (ANCA)-associated vasculitis
(AAV). They found that the gene expression profile of one of the CD8+ subgroups
corresponded to a poorer prognosis for patients 169. Pascual et al (2008) studied rheumatic
diseases in children and identified IFN and IL-1 as important genes in systemic lupus
erythematosus (SLE) and systemic onset juvenile arthritis (SoJIA), respectively 168. These
studies underline the possibility of using gene expression analysis within a disease setting
allowing the identification of prognostic gene expression profiles as well as disease specific
markers.
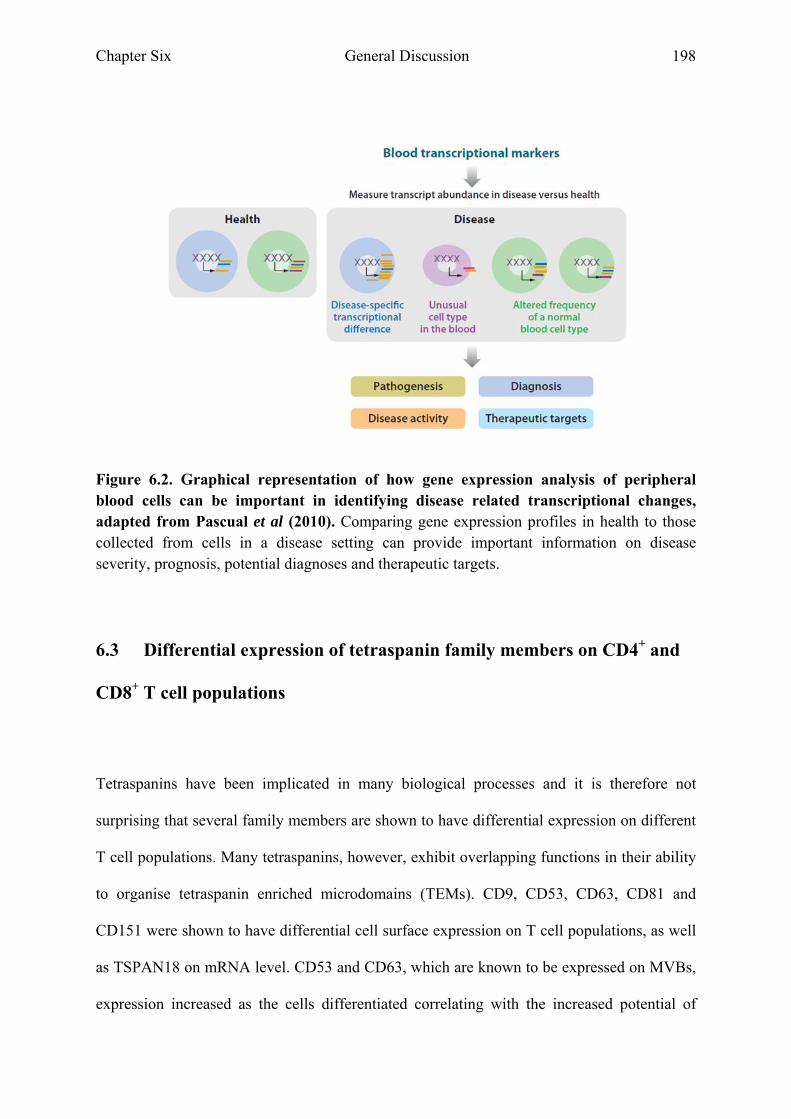
Chapter Six General Discussion 198
Figure 6.2. Graphical representation of how gene expression analysis of peripheral blood cells can be important in identifying disease related transcriptional changes, adapted from Pascual et al (2010). Comparing gene expression profiles in health to those collected from cells in a disease setting can provide important information on disease severity, prognosis, potential diagnoses and therapeutic targets.
6.3 Differential expression of tetraspanin family members on CD4+ and
CD8+ T cell populations
Tetraspanins have been implicated in many biological processes and it is therefore not
surprising that several family members are shown to have differential expression on different
T cell populations. Many tetraspanins, however, exhibit overlapping functions in their ability
to organise tetraspanin enriched microdomains (TEMs). CD9, CD53, CD63, CD81 and
CD151 were shown to have differential cell surface expression on T cell populations, as well
as TSPAN18 on mRNA level. CD53 and CD63, which are known to be expressed on MVBs,
expression increased as the cells differentiated correlating with the increased potential of
Chapter Six General Discussion 199
those cells to produce vesicles. CD9 and CD81 expression seem to follow opposite
expression patterns on CD4+ and CD8+ T cells as they differentiate, with CD9 expression
going up in CD4+ T cells, but down in CD8+ and CD81 expression going down on CD4+ T
cells but up in CD8+. This could suggest a role for CD9 in CD4+ T cell activation and CD81
in CD8+ T cell activation. CD9 and CD81 might bind to CD4 and CD8 respectively, or bind
to an unknown CD4 specific or CD8 specific cell surface molecule, resulting in the
enhancement of T cell activation. This includes the possibility CD9 and CD81 organise the
plasma membrane around the TCR-co-stimulatory molecule complex which could enhance T
cell activation.
It would be interesting, however, to analyse the differential tetraspanin expression found on
human T cells more in depth. The experiment I suggest in Chapter 5 to analyse the
involvement of CD9 in CD4+ T cell activation, can easily be used for analysing CD81’s
possible role in CD8+ T cell activation. The differential tetraspanin expression found on T
cells in this study, as was the case with the gene expression profiles, were assessed during
steady state conditions. It would be interesting to see if these particular tetraspanins, which
show differential expression under non-inflammatory conditions exhibit the same expression
patterns during disease. Tetraspanins have been implicated in several disease settings, such as
CD9 and CD81 in HIV-1 induced membrane fusion, CD82 as a tumour suppressor and
CD151 as a promoter of tumour progression 80;81 and it would therefore be interesting to
analyse the expression of these tetraspanins on the CCR7/CD45RA based T cell populations
in peripheral blood of patients with these different diseases.
Chapter Six General Discussion 200
6.4 Future work leading from this study
The aim of this study was to examine lineage relationships between human CD4+ and CD8+ T
cell populations based on CCR7 and CD45RA. Through microarray analysis gene expression
profiles could be assembled to distinguish between sorted human CD4+ and CD8+ T cell
populations. These gene expression profiles show that the central memory population
consistently shows expression values intermediate to the naive and the effector memory
populations. As described before this suggests a linear pathway of differentiation, but does
not exclude a non-linear pathway. To analyse which of these pathways is involved in the
generation of differentiated T cell populations, I suggest an adaptation of Schepers et al
(2008) method for cellular barcoding 170. Schepers et al (2008) generated a retroviral plasmid
library, with each plasmid containing the GFP gene as well as a unique barcode formed by a
random stretch of 98 bp of noncoding DNA. Cells of interest can be retrovirally transduced
and their progeny analysed by a barcode microarray. To use this strategy for further analysis
of the data generated in this thesis, there are two models which can be followed; an in vitro
human model and an in vivo mouse model. For the in vitro human model sorted CD4+ or
CD8+ human naive T cells will be labelled using the Schepers et al barcoding method; the
cells are then stimulated in vitro using αCD3/αCD28 beads. Cells are collected on day 0 as
well as after 48 hrs, 7 days and 14 days after which CM and EM populations are sorted based
on the expression of CCR7 and CD45RA. The RNA and genomic DNA of these cells are
than extracted to be analysed by Real Time PCR and barcode microarray respectively. The
Real Time PCR analysis will include the genes identified in this thesis and the barcode
microarray will allow analysis of the progeny of the naive population from day 0. These data
can then be correlated to each other to allow a conclusion to be made on which pathway of
Chapter Six General Discussion 201
differentiation naive T cells follow to give rise to their differentiated progeny and whether
their progeny corresponds with the cell types in steady state conditions.
The second model I suggest is to analyse the differentiation of naive T cells in an in vivo
mouse model. This involves validating the gene expression profiles generated in this thesis
using murine T cell populations. Sorted CD4+ and CD8+ T cell populations from spleen and
lymph node based on CCR7 or CD62L and CD44 expression are analysed by Real Time PCR
for their expression of the genes identified in the human model. If these genes can be
validated, naive OT-I T cells can be labelled with a barcode, after which they are injected
back into the mice which are then challenged with ovalbumin (OVA). At day 7 after the
OVA challenge the spleen and lymph nodes of these mice are collected and the cells are
sorted based on CCR7/CD62L and CD44 expression. The samples are split in two; one for
RNA extraction and a second for genomic DNA extraction. The RNA is used in the analysis
of the gene expression profiles of these cells, whereas the genomic DNA is put on the
barcode microarrays. Subsequent analysis of the results from those tests will show whether
the cells which are formed after antigenic challenge of naive T cells correspond to the CM
and EM populations described based on the genes identified in this study; as well as how they
relate to a single naive progenitor cell.
LRRN3 consistently showed highest expression levels on naive T cells and lowest on EM T
cells, similar to the expression pattern of CCR7 and L-Selectin. Since LRRN3 has not yet
been described in T cell biology, it would be interesting to identify the role of LRRN3 on T
cells. The fact that LRRN3 follows the expression levels of chemokine receptors involved
into gaining entry into LNs (CCR7 and L-selectin) might suggest that LRRN3 has a similar
role on T cells, however leucine rich repeats (LRRs) have also been described in pattern
Chapter Six General Discussion 202
recognition receptors (PRRs) such as TLRs 115. The higher expression of LRRN3 on naive T
cells could suggest a way for naive T cells to recognise antigen, independent of MHC
presentation, and a crossover between innate and adaptive immunity. The first experiment to
identify LRRN3’s role in T cells would be to assess whether LRRN3 is actually expressed on
the cell surface. This would be easiest with an antibody, but as no antibody against LRRN3 is
available as of yet, I would suggest constructing a plasmid containing GFP labelled LRRN3
and transfecting naive T cells which are already known to express it at mRNA level. The
expression of LRRN3 can then be analysed by flow cytometry to assess whether LRRN3
expression can be found at the cell surface. If LRRN3 is found to be expressed at the cell
surface, a cell type identified by Real Time PCR not to have any LRRN3 expression can be
transfected with the construct. If LRRN3 functions as a PRR it might respond to one of the
known ligands for TLRs. The transfected cells would therefore be incubated with known
TLR ligands after which the possible interaction between LRRN3 and a ligand can be
assessed by immunoprecipitation using an antibody against GFP.
CXCR5 expression was found to be highest on both CD4+ and CD8+ CM T cell populations,
to analyse whether this high expression level of CXCR5 mRNA corresponds to high
expression of CXCR5 on the cell surface, flow cytometry analysis can be done. If the cell
surface expression of CXCR5 corresponds to the mRNA levels, it would be interesting to
investigate the function of CXCR5 on these cell populations. CD4+ TFH cells continuously
express CXCR5 at high levels on their cell surface and high expression levels found on CD4+
CM T cells could correspond to this cell population. High expression of CXCR5 on CD8+
CM T cells has not been described before and it would therefore be interesting to further
investigate the function of CXCR5 on these cells. To determine whether CXCR5+CD8+ CM
T cells can maintain B cell survival, I suggest sorting CXCR5+CD8+ CM T cells as well as B
Chapter Six General Discussion 203
cells from the same donor and co-culturing these cells together. B cells would be co-cultured
with CD4+ TFH cells or B cells cultured alone as a control. After seven days in culture the
cells will be stained for flow cytometry analysis of CXCR5, CD8 and CD19 expression as
well as a stain to exclude dead cells. The supernatant of the co-cultures will be analysed for
IgG expression to analyse whether CXCR5+CD8+ CM T cells can support B cell production
of IgG.
Taken together these data identified gene expression profiles for CD4+ and CD8+ T cell
populations, as well as identifying several genes of interest whose role in T cell biology
should be studied further. However, transcriptome analysis could not identify populations of
T cells encapsuled within our sorted populations, such as subsets based on cytokine
expression. These subsets may become more apparent in a disease setting. In conclusion,
transcriptome analysis has shown great potential in identifying genes specific to individual T
cells subsets. Future studies should concentrate on both global gene profiles and individual
gene analysis in such subsets.

Chapter Seven References 204
Chapter Seven
Reference List

Chapter Seven References 205
7 REFERENCE LIST
1. Moser M, Leo O. Key concepts in immunology. Vaccine 2010;28 Suppl 3:C2-13.
2. Biron CA. More things in heaven and earth: defining innate and adaptive immunity.
Nat.Immunol. 2010;11:1080-1082.
3. Dempsey PW, Vaidya SA, Cheng G. The art of war: Innate and adaptive immune
responses. Cell Mol.Life Sci. 2003;60:2604-2621.
4. Paust S, Senman B, von Andrian UH. Adaptive immune responses mediated by
natural killer cells. Immunol.Rev. 2010;235:286-296.
5. Joffre O, Nolte MA, Sporri R, Reis e Sousa. Inflammatory signals in dendritic cell
activation and the induction of adaptive immunity. Immunol.Rev. 2009;227:234-247.
6. Dunkelberger JR, Song WC. Complement and its role in innate and adaptive immune
responses. Cell Res. 2010;20:34-50.
7. Auffray C, Sieweke MH, Geissmann F. Blood monocytes: development,
heterogeneity, and relationship with dendritic cells. Annu.Rev.Immunol.
2009;27:669-692.
8. Giebel B, Beckmann J. Asymmetric cell divisions of human hematopoietic stem and
progenitor cells meet endosomes. Cell Cycle 2007;6:2201-2204.
9. Beckmann J, Scheitza S, Wernet P, Fischer JC, Giebel B. Asymmetric cell division
within the human hematopoietic stem and progenitor cell compartment: identification
of asymmetrically segregating proteins. Blood 2007;109:5494-5501.
Chapter Seven References 206
10. Doulatov S, Notta F, Eppert K et al. Revised map of the human progenitor hierarchy
shows the origin of macrophages and dendritic cells in early lymphoid development.
Nat.Immunol. 2010;11:585-593.
11. Kondo M, Weissman IL, Akashi K. Identification of clonogenic common lymphoid
progenitors in mouse bone marrow. Cell 1997;91:661-672.
12. Akashi K, Traver D, Miyamoto T, Weissman IL. A clonogenic common myeloid
progenitor that gives rise to all myeloid lineages. Nature 2000;404:193-197.
13. Dorshkind K. Not a split decision for human hematopoiesis. Nat.Immunol.
2010;11:569-570.
14. Yin T, Li L. The stem cell niches in bone. J.Clin.Invest 2006;116:1195-1201.
15. Suda T, Arai F, Hirao A. Hematopoietic stem cells and their niche. Trends Immunol.
2005;26:426-433.
16. Calvi LM, Adams GB, Weibrecht KW et al. Osteoblastic cells regulate the
haematopoietic stem cell niche. Nature 2003;425:841-846.
17. Zhang J, Niu C, Ye L et al. Identification of the haematopoietic stem cell niche and
control of the niche size. Nature 2003;425:836-841.
18. Kopp HG, Avecilla ST, Hooper AT, Rafii S. The bone marrow vascular niche: home
of HSC differentiation and mobilization. Physiology.(Bethesda.) 2005;20:349-356.
19. Witte MH, Jones K, Wilting J et al. Structure function relationships in the lymphatic
system and implications for cancer biology. Cancer Metastasis Rev. 2006;25:159-184.

Chapter Seven References 207
20. Boehm T, Bleul CC. The evolutionary history of lymphoid organs. Nat.Immunol.
2007;8:131-135.
21. Blum KS, Pabst R. Keystones in lymph node development. J.Anat. 2006;209:585-
595.
22. Drayton DL, Liao S, Mounzer RH, Ruddle NH. Lymphoid organ development: from
ontogeny to neogenesis. Nat.Immunol. 2006;7:344-353.
23. Randall TD, Carragher DM, Rangel-Moreno J. Development of secondary lymphoid
organs. Annu.Rev.Immunol. 2008;26:627-650.
24. Cupedo T, Mebius RE. Cellular interactions in lymph node development. J.Immunol.
2005;174:21-25.
25. Hoorweg K, Cupedo T. Development of human lymph nodes and Peyer's patches.
Semin.Immunol. 2008;20:164-170.
26. Link A, Vogt TK, Favre S et al. Fibroblastic reticular cells in lymph nodes regulate
the homeostasis of naive T cells. Nat.Immunol. 2007;8:1255-1265.
27. Balogh P, Fisi V, Szakal AK. Fibroblastic reticular cells of the peripheral lymphoid
organs: unique features of a ubiquitous cell type. Mol.Immunol. 2008;46:1-7.
28. Fu YX, Chaplin DD. Development and maturation of secondary lymphoid tissues.
Annu.Rev.Immunol. 1999;17:399-433.
29. Ohl L, Henning G, Krautwald S et al. Cooperating mechanisms of CXCR5 and CCR7
in development and organization of secondary lymphoid organs. J.Exp.Med.
2003;197:1199-1204.
Chapter Seven References 208
30. Ruddle NH, Akirav EM. Secondary lymphoid organs: responding to genetic and
environmental cues in ontogeny and the immune response. J.Immunol.
2009;183:2205-2212.
31. Vinuesa CG, Linterman MA, Goodnow CC, Randall KL. T cells and follicular
dendritic cells in germinal center B-cell formation and selection. Immunol.Rev.
2010;237:72-89.
32. Carpenter AC, Bosselut R. Decision checkpoints in the thymus. Nat.Immunol.
2010;11:666-673.
33. Rothenberg EV. Cell lineage regulators in B and T cell development. Nat.Immunol.
2007;8:441-444.
34. Dervovic D, Zuniga-Pflucker JC. Positive selection of T cells, an in vitro view.
Semin.Immunol. 2010;22:276-286.
35. Aliahmad P, Kaye J. Commitment issues: linking positive selection signals and
lineage diversification in the thymus. Immunol.Rev. 2006;209:253-273.
36. Singer A, Adoro S, Park JH. Lineage fate and intense debate: myths, models and
mechanisms of CD4- versus CD8-lineage choice. Nat.Rev.Immunol. 2008;8:788-801.
37. Hosoya T, Maillard I, Engel JD. From the cradle to the grave: activities of GATA-3
throughout T-cell development and differentiation. Immunol.Rev. 2010;238:110-125.
38. Sprent J, Surh CD. T cell memory. Annu.Rev.Immunol. 2002;20:551-579.
39. Weninger W, Manjunath N, von Andrian UH. Migration and differentiation of CD8+
T cells. Immunol.Rev. 2002;186:221-233.
Chapter Seven References 209
40. Laudanna C, Alon R. Right on the spot. Chemokine triggering of integrin-mediated
arrest of rolling leukocytes. Thromb.Haemost. 2006;95:5-11.
41. Rocha B, Tanchot C. The Tower of Babel of CD8+ T-cell memory: known facts,
deserted roads, muddy waters, and possible dead ends. Immunol.Rev. 2006;211:182-
196.
42. Dutton RW, Bradley LM, Swain SL. T cell memory. Annu.Rev.Immunol.
1998;16:201-223.
43. Sallusto F, Lenig D, Forster R, Lipp M, Lanzavecchia A. Two subsets of memory T
lymphocytes with distinct homing potentials and effector functions. Nature
1999;401:708-712.
44. Surh CD, Boyman O, Purton JF, Sprent J. Homeostasis of memory T cells.
Immunol.Rev. 2006;211:154-163.
45. Vogt AB, Spindeldreher S, Kropshofer H. Clustering of MHC-peptide complexes
prior to their engagement in the immunological synapse: lipid raft and tetraspan
microdomains. Immunol.Rev. 2002;189:136-151.
46. van der Merwe PA, Davis SJ. Molecular interactions mediating T cell antigen
recognition. Annu.Rev.Immunol. 2003;21:659-684.
47. Vyas JM, Van der Veen AG, Ploegh HL. The known unknowns of antigen processing
and presentation. Nat.Rev.Immunol. 2008;8:607-618.
48. Guy CS, Vignali DA. Organization of proximal signal initiation at the TCR:CD3
complex. Immunol.Rev. 2009;232:7-21.

Chapter Seven References 210
49. Baine I, Abe BT, Macian F. Regulation of T-cell tolerance by calcium/NFAT
signaling. Immunol.Rev. 2009;231:225-240.
50. Alarcon B, Mestre D, Martinez-Martin N. The immunological synapse: a cause or
consequence of T-cell receptor triggering? Immunology 2011;133:420-425.
51. Bour-Jordan H, Esensten JH, Martinez-Llordella M et al. Intrinsic and extrinsic
control of peripheral T-cell tolerance by costimulatory molecules of the CD28/ B7
family. Immunol.Rev. 2011;241:180-205.
52. Felix NJ, Suri A, Salter-Cid L et al. Targeting lymphocyte co-stimulation: from bench
to bedside. Autoimmunity 2010;43:514-525.
53. Swain SL, Agrewala JN, Brown DM et al. CD4+ T-cell memory: generation and
multi-faceted roles for CD4+ T cells in protective immunity to influenza.
Immunol.Rev. 2006;211:8-22.
54. Bourgeois C, Tanchot C. Mini-review CD4 T cells are required for CD8 T cell
memory generation. Eur.J.Immunol. 2003;33:3225-3231.
55. Bevan MJ. Helping the CD8(+) T-cell response. Nat.Rev.Immunol. 2004;4:595-602.
56. Rocha B, Tanchot C. Towards a cellular definition of CD8+ T-cell memory: the role
of CD4+ T-cell help in CD8+ T-cell responses. Curr.Opin.Immunol. 2004;16:259-
263.
57. Zhou L, Chong MM, Littman DR. Plasticity of CD4+ T cell lineage differentiation.
Immunity. 2009;30:646-655.
Chapter Seven References 211
58. Yu D, Batten M, Mackay CR, King C. Lineage specification and heterogeneity of T
follicular helper cells. Curr.Opin.Immunol. 2009;21:619-625.
59. Akbar AN, Vukmanovic-Stejic M, Taams LS, Macallan DC. The dynamic co-
evolution of memory and regulatory CD4+ T cells in the periphery.
Nat.Rev.Immunol. 2007;7:231-237.
60. Pillai V, Karandikar NJ. Human regulatory T cells: a unique, stable thymic subset or a
reversible peripheral state of differentiation? Immunol.Lett. 2007;114:9-15.
61. Liston A, Rudensky AY. Thymic development and peripheral homeostasis of
regulatory T cells. Curr.Opin.Immunol. 2007;19:176-185.
62. Amyes E, Hatton C, Montamat-Sicotte D et al. Characterization of the CD4+ T cell
response to Epstein-Barr virus during primary and persistent infection. J.Exp.Med.
2003;198:903-911.
63. Amyes E, McMichael AJ, Callan MF. Human CD4+ T cells are predominantly
distributed among six phenotypically and functionally distinct subsets. J.Immunol.
2005;175:5765-5773.
64. Roman E, Miller E, Harmsen A et al. CD4 effector T cell subsets in the response to
influenza: heterogeneity, migration, and function. J.Exp.Med. 2002;196:957-968.
65. Lu L, Cantor H. Generation and regulation of CD8(+) regulatory T cells. Cell
Mol.Immunol. 2008;5:401-406.
66. Kondo T, Takata H, Takiguchi M. Functional expression of chemokine receptor
CCR6 on human effector memory CD8(+) T cells. Eur.J.Immunol. 2007;37:54-65.
Chapter Seven References 212
67. Takata H, Takiguchi M. Three memory subsets of human CD8+ T cells differently
expressing three cytolytic effector molecules. J.Immunol. 2006;177:4330-4340.
68. Hamann D, Baars PA, Rep MH et al. Phenotypic and functional separation of memory
and effector human CD8+ T cells. J.Exp.Med. 1997;186:1407-1418.
69. Appay V, Dunbar PR, Callan M et al. Memory CD8+ T cells vary in differentiation
phenotype in different persistent virus infections. Nat.Med. 2002;8:379-385.
70. Monteiro M, Evaristo C, Legrand A, Nicoletti A, Rocha B. Cartography of gene
expression in CD8 single cells: novel. Blood 2007;109:2863-2870.
71. Noble A, Zhao ZS, Cantor H. Suppression of immune responses by CD8 cells. II. Qa-
1 on activated B cells stimulates CD8 cell suppression of T helper 2 responses.
J.Immunol. 1998;160:566-571.
72. Najafian N, Chitnis T, Salama AD et al. Regulatory functions of CD8+. J.Clin.Invest
2003;112:1037-1048.
73. Berditchevski F, Odintsova E. Tetraspanins as regulators of protein trafficking.
Traffic. 2007;8:89-96.
74. Boucheix C, Rubinstein E. Tetraspanins. Cell Mol.Life Sci. 2001;58:1189-1205.
75. Wright MD, Moseley GW, van Spriel AB. Tetraspanin microdomains in immune cell
signalling and malignant disease. Tissue Antigens 2004;64:533-542.
76. Charrin S, le Naour F, Silvie O et al. Lateral organization of membrane proteins:
tetraspanins spin their web. Biochem.J. 2009;420:133-154.
Chapter Seven References 213
77. Hemler ME. Tetraspanin functions and associated microdomains. Nat.Rev.Mol.Cell
Biol. 2005;6:801-811.
78. Pols MS, Klumperman J. Trafficking and function of the tetraspanin CD63. Exp.Cell
Res. 2009;315:1584-1592.
79. Levy S, Todd SC, Maecker HT. CD81 (TAPA-1): a molecule involved in signal
transduction and cell adhesion in the immune system. Annu.Rev.Immunol.
1998;16:89-109.
80. Gordon-Alonso M, Yanez-Mo M, Barreiro O et al. Tetraspanins CD9 and CD81
modulate HIV-1-induced membrane fusion. J.Immunol. 2006;177:5129-5137.
81. Zoller M. Tetraspanins: push and pull in suppressing and promoting metastasis.
Nat.Rev.Cancer 2009;9:40-55.
82. Khandelwal S, Roche PA. Distinct MHC class II molecules are associated on the
dendritic cell surface in cholesterol-dependent membrane microdomains.
J.Biol.Chem. 2010;285:35303-35310.
83. Rubinstein E, Ziyyat A, Wolf JP, le Naour F, Boucheix C. The molecular players of
sperm-egg fusion in mammals. Semin.Cell Dev.Biol. 2006;17:254-263.
84. Chambrion C, le Naour F. The tetraspanins CD9 and CD81 regulate CD9P1-induced
effects on cell migration. PLoS.One. 2010;5:e11219.
85. Andre M, Morelle W, Planchon S et al. Glycosylation status of the membrane protein
CD9P-1. Proteomics. 2007;7:3880-3895.
Chapter Seven References 214
86. van Spriel AB, Figdor CG. The role of tetraspanins in the pathogenesis of infectious
diseases. Microbes.Infect. 2010;12:106-112.
87. Yanez-Mo M, Barreiro O, Gordon-Alonso M, Sala-Valdes M, Sanchez-Madrid F.
Tetraspanin-enriched microdomains: a functional unit in cell plasma membranes.
Trends Cell Biol. 2009;19:434-446.
88. Yanez-Mo M, Barreiro O, Gonzalo P et al. MT1-MMP collagenolytic activity is
regulated through association with tetraspanin CD151 in primary endothelial cells.
Blood 2008;112:3217-3226.
89. van Spriel AB, Sofi M, Gartlan KH et al. The tetraspanin protein CD37 regulates IgA
responses and anti-fungal immunity. PLoS.Pathog. 2009;5:e1000338.
90. Powner D, Kopp PM, Monkley SJ, Critchley DR, Berditchevski F. Tetraspanin CD9
in cell migration. Biochem.Soc.Trans. 2011;39:563-567.
91. Miyado K, Yamada G, Yamada S et al. Requirement of CD9 on the egg plasma
membrane for fertilization. Science 2000;287:321-324.
92. Jegou A, Ziyyat A, Barraud-Lange V et al. CD9 tetraspanin generates fusion
competent sites on the egg membrane for mammalian fertilization.
Proc.Natl.Acad.Sci.U.S.A 2011;108:10946-10951.
93. Takeda Y, He P, Tachibana I et al. Double deficiency of tetraspanins CD9 and CD81
alters cell motility and protease production of macrophages and causes chronic
obstructive pulmonary disease-like phenotype in mice. J.Biol.Chem. 2008;283:26089-
26097.
Chapter Seven References 215
94. Koumangoye RB, Sakwe AM, Goodwin JS, Patel T, Ochieng J. Detachment of breast
tumor cells induces rapid secretion of exosomes which subsequently mediate cellular
adhesion and spreading. PLoS.One. 2011;6:e24234.
95. Petersen SH, Odintsova E, Haigh TA et al. The role of tetraspanin CD63 in antigen
presentation via MHC class II. Eur.J.Immunol. 2011;41:2556-2561.
96. Shoham T, Rajapaksa R, Boucheix C et al. The tetraspanin CD81 regulates the
expression of CD19 during B cell development in a postendoplasmic reticulum
compartment. J.Immunol. 2003;171:4062-4072.
97. Boismenu R, Rhein M, Fischer WH, Havran WL. A role for CD81 in early T cell
development. Science 1996;271:198-200.
98. Todd SC, Lipps SG, Crisa L, Salomon DR, Tsoukas CD. CD81 expressed on human
thymocytes mediates integrin activation and interleukin 2-dependent proliferation.
J.Exp.Med. 1996;184:2055-2060.
99. Takeda Y, Li Q, Kazarov AR et al. Diminished metastasis in tetraspanin CD151-
knockout mice. Blood 2011;118:464-472.
100. Sadej R, Romanska H, Kavanagh D et al. Tetraspanin CD151 regulates transforming
growth factor beta signaling: implication in tumor metastasis. Cancer Res.
2010;70:6059-6070.
101. Haeuw JF, Goetsch L, Bailly C, Corvaia N. Tetraspanin CD151 as a target for
antibody-based cancer immunotherapy. Biochem.Soc.Trans. 2011;39:553-558.
102. Wright MD, Geary SM, Fitter S et al. Characterization of mice lacking the tetraspanin
superfamily member CD151. Mol.Cell Biol. 2004;24:5978-5988.

Chapter Seven References 216
103. Yang YH, Speed T. Design issues for cDNA microarray experiments. Nat.Rev.Genet.
2002;3:579-588.
104. Olson NE. The microarray data analysis process: from raw data to biological
significance. NeuroRx. 2006;3:373-383.
105. Holmes S, He M, Xu T, Lee PP. Memory T cells have gene expression patterns
intermediate between naive and effector. Proc.Natl.Acad.Sci.U.S.A 2005;102:5519-
5523.
106. Du X, Tang Y, Xu H et al. Genomic profiles for human peripheral blood T cells, B
cells, natural killer cells, monocytes, and polymorphonuclear cells: comparisons to
ischemic stroke, migraine, and Tourette syndrome. Genomics 2006;87:693-703.
107. Palmer C, Diehn M, Alizadeh AA, Brown PO. Cell-type specific gene expression
profiles of leukocytes in human peripheral blood. BMC.Genomics 2006;7:115.
108. Haining WN, Ebert BL, Subrmanian A et al. Identification of an evolutionarily
conserved transcriptional signature of CD8 memory differentiation that is shared by T
and B cells. J.Immunol. 2008;181:1859-1868.
109. Canales RD, Luo Y, Willey JC et al. Evaluation of DNA microarray results with
quantitative gene expression platforms. Nat.Biotechnol. 2006;24:1115-1122.
110. Wang M, Windgassen D, Papoutsakis ET. Comparative analysis of transcriptional
profiling of CD3+, CD4+ and CD8+ T cells identifies novel immune response players
in T-cell activation. BMC.Genomics 2008;9:225.

Chapter Seven References 217
111. Chtanova T, Kemp RA, Sutherland AP, Ronchese F, Mackay CR. Gene microarrays
reveal extensive differential gene expression in both CD4(+) and CD8(+) type 1 and
type 2 T cells. J.Immunol. 2001;167:3057-3063.
112. Vanguilder HD, Vrana KE, Freeman WM. Twenty-five years of quantitative PCR for
gene expression analysis. Biotechniques 2008;44:619-626.
113. Reiner SL. Development in motion: helper T cells at work. Cell 2007;129:33-36.
114. Sallusto F, Geginat J, Lanzavecchia A. Central memory and effector memory T cell
subsets: function, generation, and maintenance. Annu.Rev.Immunol. 2004;22:745-
763.
115. Haining WN, Wherry EJ. Integrating genomic signatures for immunologic discovery.
Immunity. 2010;32:152-161.
116. Peixoto A, Evaristo C, Munitic I et al. CD8 single-cell gene coexpression reveals
three different effector types present at distinct phases of the immune response.
J.Exp.Med. 2007;204:1193-1205.
117. Chtanova T, Newton R, Liu SM et al. Identification of T cell-restricted genes, and
signatures for different T cell responses, using a comprehensive collection of
microarray datasets. J.Immunol. 2005;175:7837-7847.
118. Haining WN, Angelosanto J, Brosnahan K et al. High-throughput gene expression
profiling of memory differentiation in primary human T cells. BMC.Immunol.
2008;9:44.
119. Forster R, Davalos-Misslitz AC, Rot A. CCR7 and its ligands: balancing immunity
and tolerance. Nat.Rev.Immunol. 2008;8:362-371.
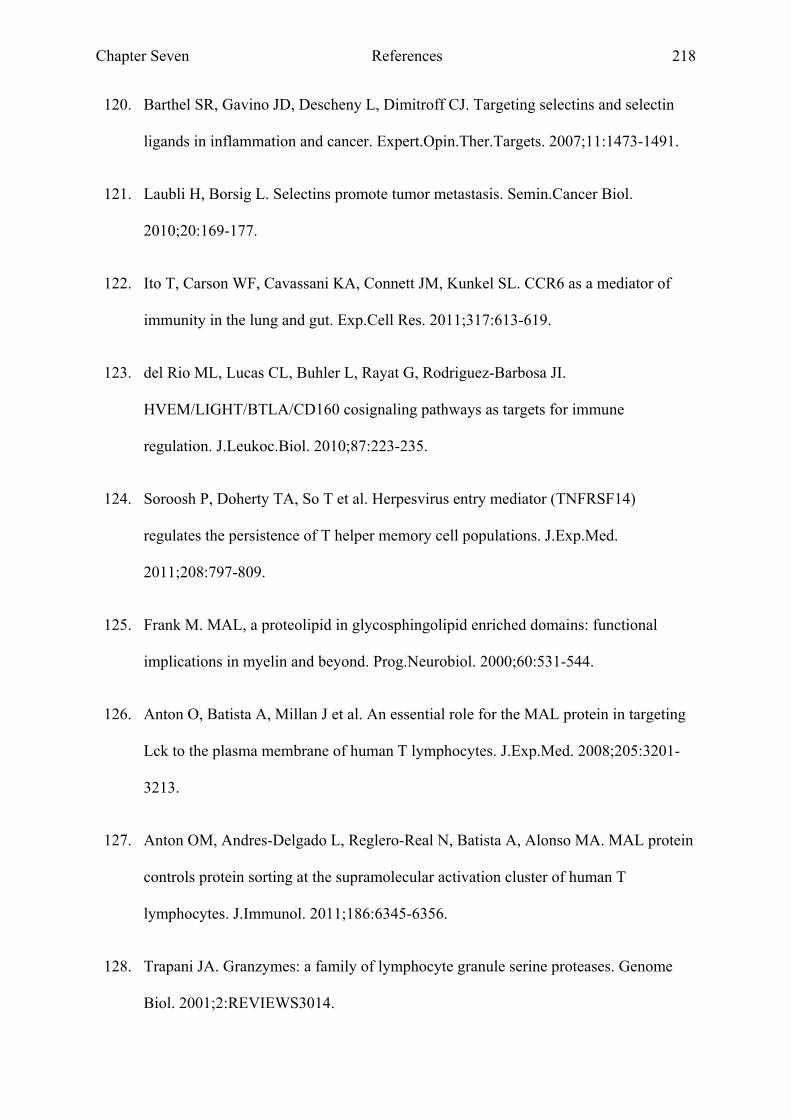
Chapter Seven References 218
120. Barthel SR, Gavino JD, Descheny L, Dimitroff CJ. Targeting selectins and selectin
ligands in inflammation and cancer. Expert.Opin.Ther.Targets. 2007;11:1473-1491.
121. Laubli H, Borsig L. Selectins promote tumor metastasis. Semin.Cancer Biol.
2010;20:169-177.
122. Ito T, Carson WF, Cavassani KA, Connett JM, Kunkel SL. CCR6 as a mediator of
immunity in the lung and gut. Exp.Cell Res. 2011;317:613-619.
123. del Rio ML, Lucas CL, Buhler L, Rayat G, Rodriguez-Barbosa JI.
HVEM/LIGHT/BTLA/CD160 cosignaling pathways as targets for immune
regulation. J.Leukoc.Biol. 2010;87:223-235.
124. Soroosh P, Doherty TA, So T et al. Herpesvirus entry mediator (TNFRSF14)
regulates the persistence of T helper memory cell populations. J.Exp.Med.
2011;208:797-809.
125. Frank M. MAL, a proteolipid in glycosphingolipid enriched domains: functional
implications in myelin and beyond. Prog.Neurobiol. 2000;60:531-544.
126. Anton O, Batista A, Millan J et al. An essential role for the MAL protein in targeting
Lck to the plasma membrane of human T lymphocytes. J.Exp.Med. 2008;205:3201-
3213.
127. Anton OM, Andres-Delgado L, Reglero-Real N, Batista A, Alonso MA. MAL protein
controls protein sorting at the supramolecular activation cluster of human T
lymphocytes. J.Immunol. 2011;186:6345-6356.
128. Trapani JA. Granzymes: a family of lymphocyte granule serine proteases. Genome
Biol. 2001;2:REVIEWS3014.
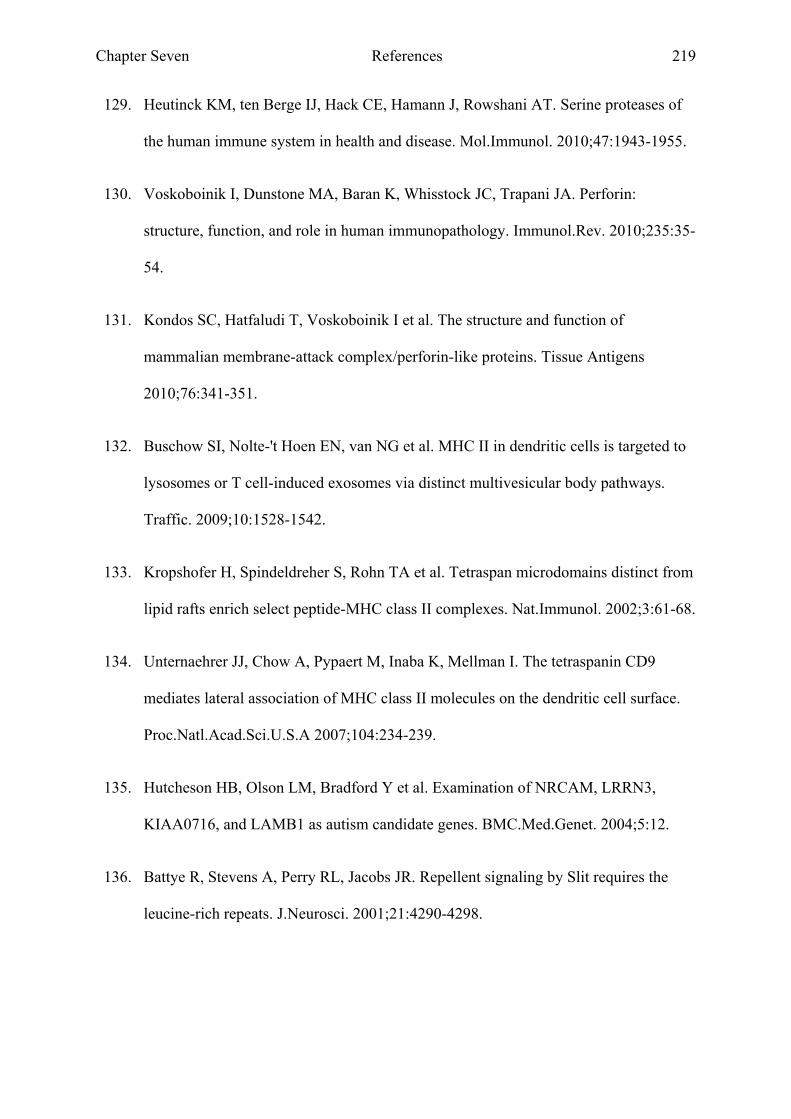
Chapter Seven References 219
129. Heutinck KM, ten Berge IJ, Hack CE, Hamann J, Rowshani AT. Serine proteases of
the human immune system in health and disease. Mol.Immunol. 2010;47:1943-1955.
130. Voskoboinik I, Dunstone MA, Baran K, Whisstock JC, Trapani JA. Perforin:
structure, function, and role in human immunopathology. Immunol.Rev. 2010;235:35-
54.
131. Kondos SC, Hatfaludi T, Voskoboinik I et al. The structure and function of
mammalian membrane-attack complex/perforin-like proteins. Tissue Antigens
2010;76:341-351.
132. Buschow SI, Nolte-'t Hoen EN, van NG et al. MHC II in dendritic cells is targeted to
lysosomes or T cell-induced exosomes via distinct multivesicular body pathways.
Traffic. 2009;10:1528-1542.
133. Kropshofer H, Spindeldreher S, Rohn TA et al. Tetraspan microdomains distinct from
lipid rafts enrich select peptide-MHC class II complexes. Nat.Immunol. 2002;3:61-68.
134. Unternaehrer JJ, Chow A, Pypaert M, Inaba K, Mellman I. The tetraspanin CD9
mediates lateral association of MHC class II molecules on the dendritic cell surface.
Proc.Natl.Acad.Sci.U.S.A 2007;104:234-239.
135. Hutcheson HB, Olson LM, Bradford Y et al. Examination of NRCAM, LRRN3,
KIAA0716, and LAMB1 as autism candidate genes. BMC.Med.Genet. 2004;5:12.
136. Battye R, Stevens A, Perry RL, Jacobs JR. Repellent signaling by Slit requires the
leucine-rich repeats. J.Neurosci. 2001;21:4290-4298.
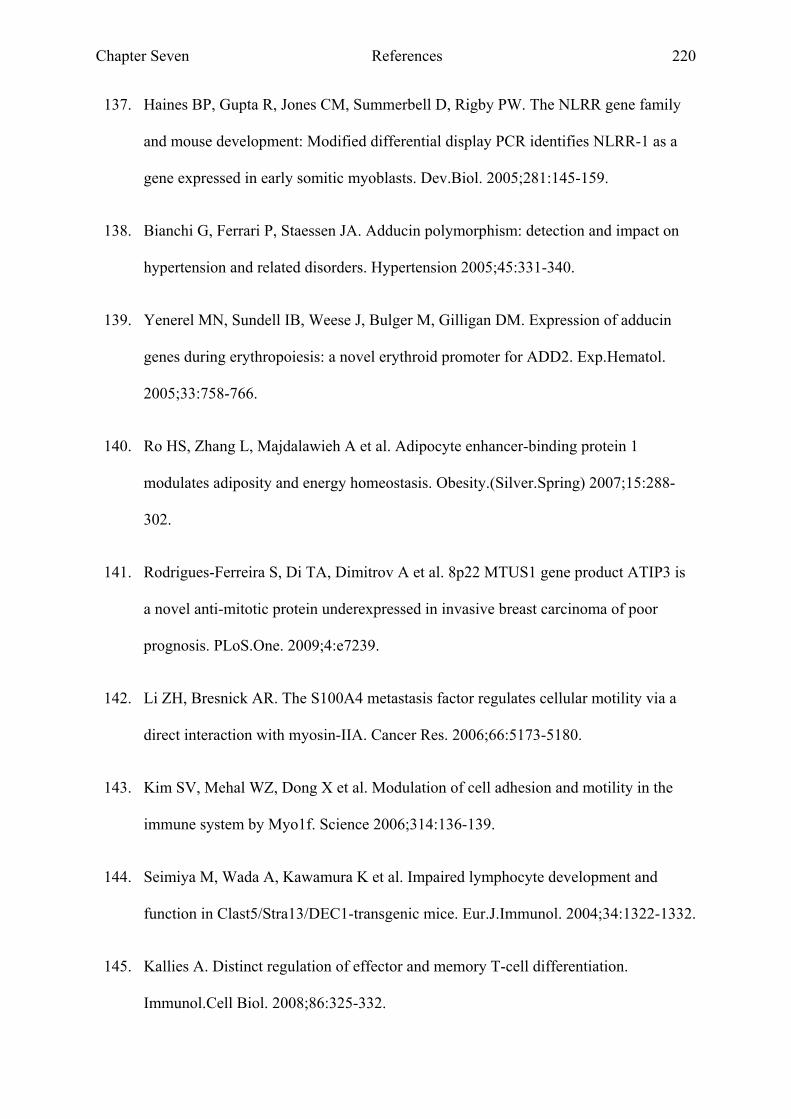
Chapter Seven References 220
137. Haines BP, Gupta R, Jones CM, Summerbell D, Rigby PW. The NLRR gene family
and mouse development: Modified differential display PCR identifies NLRR-1 as a
gene expressed in early somitic myoblasts. Dev.Biol. 2005;281:145-159.
138. Bianchi G, Ferrari P, Staessen JA. Adducin polymorphism: detection and impact on
hypertension and related disorders. Hypertension 2005;45:331-340.
139. Yenerel MN, Sundell IB, Weese J, Bulger M, Gilligan DM. Expression of adducin
genes during erythropoiesis: a novel erythroid promoter for ADD2. Exp.Hematol.
2005;33:758-766.
140. Ro HS, Zhang L, Majdalawieh A et al. Adipocyte enhancer-binding protein 1
modulates adiposity and energy homeostasis. Obesity.(Silver.Spring) 2007;15:288-
302.
141. Rodrigues-Ferreira S, Di TA, Dimitrov A et al. 8p22 MTUS1 gene product ATIP3 is
a novel anti-mitotic protein underexpressed in invasive breast carcinoma of poor
prognosis. PLoS.One. 2009;4:e7239.
142. Li ZH, Bresnick AR. The S100A4 metastasis factor regulates cellular motility via a
direct interaction with myosin-IIA. Cancer Res. 2006;66:5173-5180.
143. Kim SV, Mehal WZ, Dong X et al. Modulation of cell adhesion and motility in the
immune system by Myo1f. Science 2006;314:136-139.
144. Seimiya M, Wada A, Kawamura K et al. Impaired lymphocyte development and
function in Clast5/Stra13/DEC1-transgenic mice. Eur.J.Immunol. 2004;34:1322-1332.
145. Kallies A. Distinct regulation of effector and memory T-cell differentiation.
Immunol.Cell Biol. 2008;86:325-332.
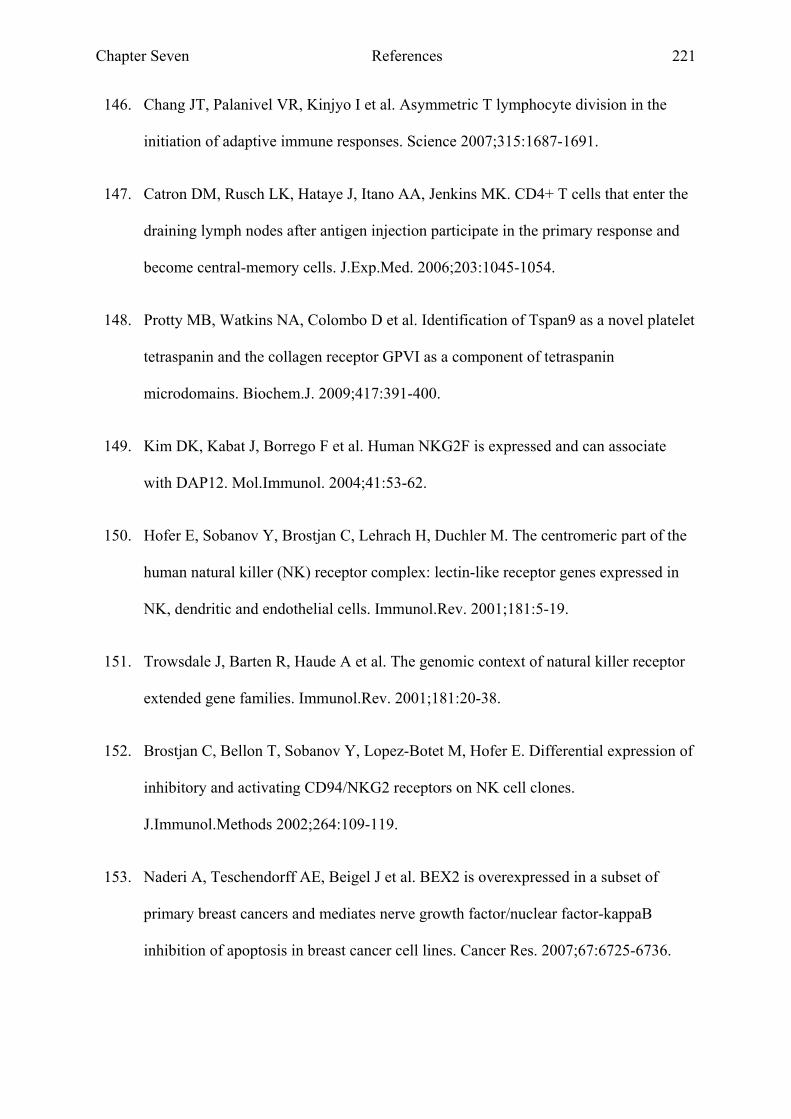
Chapter Seven References 221
146. Chang JT, Palanivel VR, Kinjyo I et al. Asymmetric T lymphocyte division in the
initiation of adaptive immune responses. Science 2007;315:1687-1691.
147. Catron DM, Rusch LK, Hataye J, Itano AA, Jenkins MK. CD4+ T cells that enter the
draining lymph nodes after antigen injection participate in the primary response and
become central-memory cells. J.Exp.Med. 2006;203:1045-1054.
148. Protty MB, Watkins NA, Colombo D et al. Identification of Tspan9 as a novel platelet
tetraspanin and the collagen receptor GPVI as a component of tetraspanin
microdomains. Biochem.J. 2009;417:391-400.
149. Kim DK, Kabat J, Borrego F et al. Human NKG2F is expressed and can associate
with DAP12. Mol.Immunol. 2004;41:53-62.
150. Hofer E, Sobanov Y, Brostjan C, Lehrach H, Duchler M. The centromeric part of the
human natural killer (NK) receptor complex: lectin-like receptor genes expressed in
NK, dendritic and endothelial cells. Immunol.Rev. 2001;181:5-19.
151. Trowsdale J, Barten R, Haude A et al. The genomic context of natural killer receptor
extended gene families. Immunol.Rev. 2001;181:20-38.
152. Brostjan C, Bellon T, Sobanov Y, Lopez-Botet M, Hofer E. Differential expression of
inhibitory and activating CD94/NKG2 receptors on NK cell clones.
J.Immunol.Methods 2002;264:109-119.
153. Naderi A, Teschendorff AE, Beigel J et al. BEX2 is overexpressed in a subset of
primary breast cancers and mediates nerve growth factor/nuclear factor-kappaB
inhibition of apoptosis in breast cancer cell lines. Cancer Res. 2007;67:6725-6736.
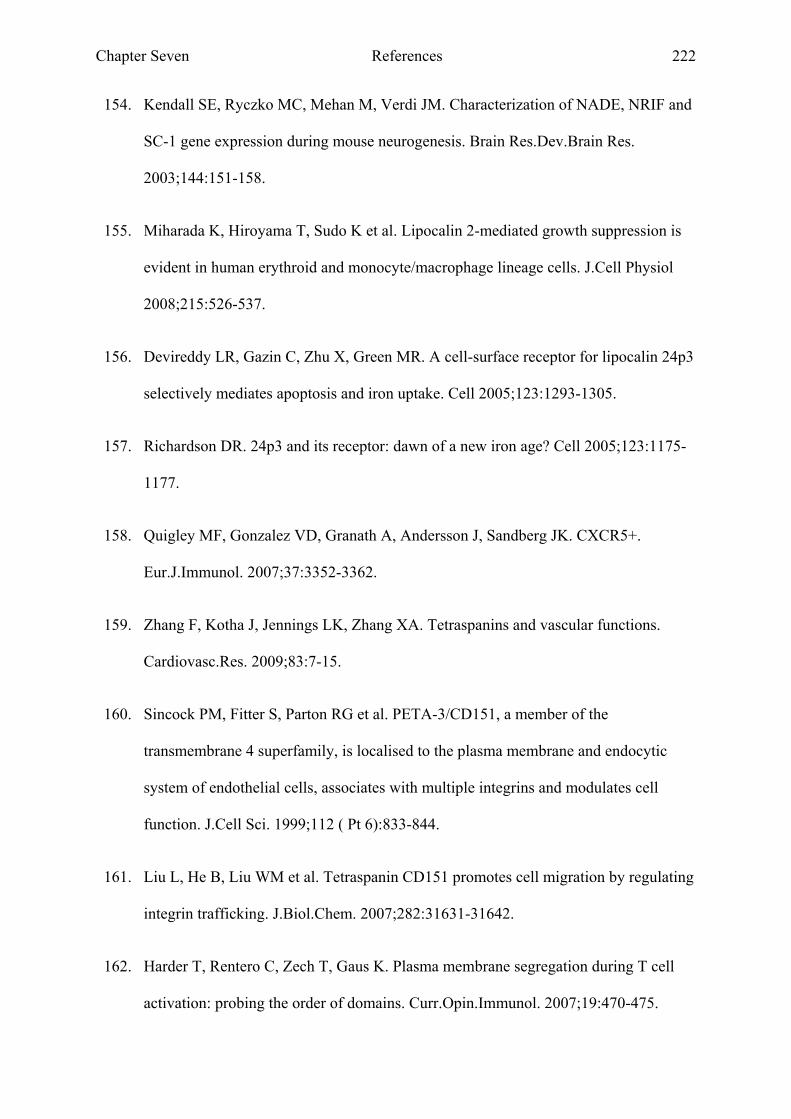
Chapter Seven References 222
154. Kendall SE, Ryczko MC, Mehan M, Verdi JM. Characterization of NADE, NRIF and
SC-1 gene expression during mouse neurogenesis. Brain Res.Dev.Brain Res.
2003;144:151-158.
155. Miharada K, Hiroyama T, Sudo K et al. Lipocalin 2-mediated growth suppression is
evident in human erythroid and monocyte/macrophage lineage cells. J.Cell Physiol
2008;215:526-537.
156. Devireddy LR, Gazin C, Zhu X, Green MR. A cell-surface receptor for lipocalin 24p3
selectively mediates apoptosis and iron uptake. Cell 2005;123:1293-1305.
157. Richardson DR. 24p3 and its receptor: dawn of a new iron age? Cell 2005;123:1175-
1177.
158. Quigley MF, Gonzalez VD, Granath A, Andersson J, Sandberg JK. CXCR5+.
Eur.J.Immunol. 2007;37:3352-3362.
159. Zhang F, Kotha J, Jennings LK, Zhang XA. Tetraspanins and vascular functions.
Cardiovasc.Res. 2009;83:7-15.
160. Sincock PM, Fitter S, Parton RG et al. PETA-3/CD151, a member of the
transmembrane 4 superfamily, is localised to the plasma membrane and endocytic
system of endothelial cells, associates with multiple integrins and modulates cell
function. J.Cell Sci. 1999;112 ( Pt 6):833-844.
161. Liu L, He B, Liu WM et al. Tetraspanin CD151 promotes cell migration by regulating
integrin trafficking. J.Biol.Chem. 2007;282:31631-31642.
162. Harder T, Rentero C, Zech T, Gaus K. Plasma membrane segregation during T cell
activation: probing the order of domains. Curr.Opin.Immunol. 2007;19:470-475.
Chapter Seven References 223
163. Gaus K, Chklovskaia E, Fazekas de St GB, Jessup W, Harder T. Condensation of the
plasma membrane at the site of T lymphocyte activation. J.Cell Biol. 2005;171:121-
131.
164. Zech T, Ejsing CS, Gaus K et al. Accumulation of raft lipids in T-cell plasma
membrane domains engaged in TCR signalling. EMBO J. 2009;28:466-476.
165. Schroder J, Lullmann-Rauch R, Himmerkus N et al. Deficiency of the tetraspanin
CD63 associated with kidney pathology but normal lysosomal function. Mol.Cell
Biol. 2009;29:1083-1094.
166. Imhof I, Gasper WJ, Derynck R. Association of tetraspanin CD9 with transmembrane
TGF{alpha} confers alterations in cell-surface presentation of TGF{alpha} and
cytoskeletal organization. J.Cell Sci. 2008;121:2265-2274.
167. Chaussabel D, Pascual V, Banchereau J. Assessing the human immune system
through blood transcriptomics. BMC.Biol. 2010;8:84.
168. Pascual V, Allantaz F, Patel P et al. How the study of children with rheumatic
diseases identified interferon-alpha and interleukin-1 as novel therapeutic targets.
Immunol.Rev. 2008;223:39-59.
169. McKinney EF, Lyons PA, Carr EJ et al. A CD8+ T cell transcription signature
predicts prognosis in autoimmune disease. Nat.Med. 2010;16:586-91, 1p.
170. Schepers K, Swart E, van Heijst JW et al. Dissecting T cell lineage relationships by
cellular barcoding. J.Exp.Med. 2008;205:2309-2318.

Chapter Eight Appendix 224
Chapter Eight
Appendix

Chapter Eight Appendix 225
8 APPENDIX
Please see enclosed CD for appendix data
8.1 Chapter Three Supplemental Table 1
8.2 Chapter Three Supplemental Table 2
8.3 Chapter Three Supplemental Table 3
8.4 Chapter Three Supplemental Table 4
8.5 Chapter Three Supplemental Table 5
8.6 Chapter Three Supplemental Table 6
8.7 Chapter Three Supplemental Table 7
8.8 Chapter Three Supplemental Table 8
8.9 Chapter Three Supplemental Table 9
8.10 Chapter Three Supplemental Table 10
8.11 Chapter Three Supplemental Table 11
8.12 Chapter Three Supplemental Table 12
8.13 Chapter Three Supplemental Table 13
8.14 Chapter Three Supplemental Table 14
8.15 Chapter Three Supplemental Table 15
Normalised microarray results for all samples
8.16 Chapter Four Supplemental Table 1