identifying critical attack assets in dependency …xou/publications/drdc08.pdf · identifying...
TRANSCRIPT
Identifying critical attack assets independency attack graphs
Reginald SawillaDefence R&D Canada – Ottawa
Xinming OuKansas State University
This Technical Memorandum is an extended version of work published in the proceedings of the 13thEuropean Symposium on Research in Computer Security (ESORICS).
Defence R&D Canada – OttawaTechnical Memorandum
DRDC Ottawa TM 2008-180
September 2008

Principal Author
Original signed by Reginald Sawilla and Xinming Ou
Reginald Sawilla and Xinming Ou
Approved by
Original signed by Julie Lefebvre
Julie LefebvreHead/NIO Section
Approved for release by
Original signed by Pierre Lavoie
Pierre LavoieHead/Document Review Panel
c© Her Majesty the Queen in Right of Canada as represented by theMinister of NationalDefence, 2008
c© Sa Majeste la Reine (en droit du Canada), telle que representee par le ministre de laDefense nationale, 2008

Abstract
Attack graphs have been proposed as useful tools for analyzing security vulnerabilities innetwork systems. Even when they are produced efficiently, the size and complexity of at-tack graphs often prevent a human from fully comprehending the information conveyed. Adistillation of this overwhelming amount of information iscrucial to aid network adminis-trators in efficiently allocating scarce human and financialresources. This paper introducesAssetRank, a generalization of Google’s PageRank algorithm which ranks web pages inweb graphs. AssetRank addresses the unique semantics of dependency attack graphs andincorporates vulnerability data from public databases to compute metrics for the graph ver-tices (representing attacker privileges and vulnerabilities) which reveal their importance inattacks against the system. We give a stochastic interpretation of the computed values in thecontext of dependency attack graphs, and conduct experiments on various network scenar-ios. The results of the experiments show that the numeric ranks given by our algorithm areconsistent with the intuitive importance that the privileges and vulnerabilities have to an at-tacker. The vertex ranks can be used to prioritize countermeasures, help a human reader tobetter comprehend security problems, and provide input to further security analysis tools.
Resum e
On a propose des graphes d’attaque comme outils utiles pourl’analyse des vulnerabilitesde securite des reseaux informatiques. Meme lorsqu’ils sont produits de facon efficiente, lataille et la complexite de ces graphes empechent souvent un etre humain de bien saisir toutel’information ainsi presentee. Il est essentiel de distiller cette masse ecrasante d’informa-tion pour aider les administrateurs de reseau a allouer defacon efficiente leurs ressourceshumaines et financieres limitees. Dans ce document, on pr´esente l’algorithme AssetRank,une generalisation de l’algorithme PageRank de Google qui sert a classer les pages Webdans des graphes Web. AssetRank traite la semantique unique des graphes d’attaque adependances et il attribue une mesure aux sommets (qui representent les privileges et lesvulnerabilites), ce qui indique leur importance dans desattaques contre un systeme. Nousdonnons une interpretation stochastique des valeurs calculees dans le contexte des graphesd’attaque a dependances et nous menons des experiences avec differents scenarios s’ap-pliquant aux reseaux. Les resultats des experiences montrent que le classement numeriqueproduit par notre algorithme correspond a l’importance intuitive qu’un attaquant accordeaux privileges et aux vulnerabilites. Le classement ordonne des sommets peut etre utilisepour etablir l’ordre de priorite des contre-mesures, aider un lecteur humain a mieux cer-ner les problemes de securite et fournir des entrants pour d’autres outils d’analyse de lasecurite.
DRDC Ottawa TM 2008-180 i

This page intentionally left blank.
ii DRDC Ottawa TM 2008-180

Executive summary
Identifying critical attack assets in dependency attackgraphs
Reginald Sawilla, Xinming Ou; DRDC Ottawa TM 2008-180; Defence R&DCanada – Ottawa; September 2008.
Background: An attack graph is a mathematical abstraction of the detailsof possible at-tacks against a specific network. However, even for small networks, attack graphs are toolarge and complex for a human to fully comprehend. While a user will quickly under-stand that attackers can penetrate the network, it is essentially impossible to know whichprivileges and vulnerabilities are the most important to the attackers’ success. Computernetwork administrators require a tool which can distill theoverwhelming amount of infor-mation into a list of priorities that will help them to efficiently utilize scarce human andfinancial resources.
This paper is an extended version of [1] and a continuation of the work in [2].
Principal results: This paper introduces AssetRank, a generalization of Google’s Page-Rank algorithm which ranks web pages in web graphs. AssetRank consumes a listing ofassets and their dependencies and generates an understanding of their value by assigninga ranking to the assets based upon the system dependencies. Our first contribution al-lows AssetRank to treat vertices typed as AND and OR correctly based on their logicalmeanings. The second contribution is a generalization of PageRank’s single system-widedamping factor to a per-vertex damping factor. This generalization allows AssetRank to ac-curately model the various likelihoods of an attacker’s ability to obtain privileges throughmeans not captured in the graph (out-of-band attacks). The third contribution is leveragingpublicly available vulnerability information (e.g. Common Vulnerability Scoring System(CVSS)) through parameters in AssetRank so that the importance of security problemsis computed with respect to vulnerability attributes such as attack complexity and exploitavailability. The fourth contribution is that our generalized ranking algorithm allows net-work defenders to obtain personalized AssetRanks to reflectthe importance of attack assetswith respect to the protection of specific critical network assets. The fifth contribution isan interpretation of the semantics of AssetRank values in the context of attack graphs.
Significance of results:The numeric value computed by AssetRank is a direct indicatorof how important the attack asset represented by a vertex is to a potential attacker. Thealgorithm was empirically verified through numerous experiments conducted on severalexample networks. The rank metric will be valuable to users of attack graphs in betterunderstanding the security risks, in fusing publicly available attack asset attribute data, in
DRDC Ottawa TM 2008-180 iii

determining appropriate mitigation measures, and as inputto further attack graph analysistools.
Future work: We would like to explore the fusing of business priorities and implementa-tion costs with AssetRank values so that the resulting metric can be used immediately bya system administrator to generate a course of action or automatically implement securityhardening measures. We would also like to conduct experiments on operational networksto better understand the advantages and limitations of our proposed algorithm, along withways of improving it. Finally, we would like to determine AssetRank’s rate of convergenceand its stability under perturbations.
iv DRDC Ottawa TM 2008-180

Sommaire
Identifying critical attack assets in dependency attackgraphs
Reginald Sawilla, Xinming Ou ; DRDC Ottawa TM 2008-180 ; R & D pour ladefense Canada – Ottawa ; septembre 2008.
Contexte : Un graphe d’attaque est une abstraction mathematique des details d’attaquespossibles contre un reseau particulier. Toutefois, memepour de petits reseaux, la taille etla complexite des graphes ainsi obtenus sont trop grandes pour qu’un etre humain puissecomprendre pleinement l’information qu’ils contiennent.Un utilisateur peut comprendrerapidement que des attaquants peuvent penetrer dans le r´eseau, mais il est essentiellementimpossible de savoir quels sont les privileges et les vuln´erabilites qui ont le plus d’im-portance pour les attaquants. Les administrateurs de reseau ont besoin d’un outil qui peutdistiller la masse ecrasante d’information de facon a creer une liste de priorites qui lesaidera a utiliser de facon efficiente leurs ressources humaines et financieres limitees.
Ce document est une version allongee du document [1] et la suite du travail decrit dans ledocument [2].
Principaux r esultats : Ce document presente l’algorithme AssetRank, une generalisationde l’algorithme PageRank de Google, qui sert a classer les pages Web sous forme degraphes Web. AssetRank traite une liste d’actifs ainsi que de leurs dependances et il etablitleur valeur en attribuant un rang aux actifs en fonction de leurs dependances envers lesysteme. Notre premiere contribution permet a AssetRank de traiter correctement les som-mets qui sont categorises AND et OR en fonction de leur signification logique. Notreseconde contribution est une generalisation du facteur d’amortissement unique de Page-Rank s’appliquant a l’ensemble du systeme afin de produireun facteur d’amortissementpropre a chaque sommet. Cette generalisation permet a AssetRank de modeliser avec exac-titude les probabilites qu’un attaquant puisse obtenir des droits grace a des moyens qui nesont pas saisis dans le graphe (attaques hors bande). Notre troisieme contribution consistea tirer parti des renseignements disponibles publiquement au sujet des vulnerabilites (p.ex. le Common Vulnerability Scoring System (CVSS)) au moyen de parametres d’As-setRank, ce qui a pour effet que l’importance des problemesde securite est calculee enfonction des attributs de vulnerabilite, comme la complexite de l’attaque et la disponibilitede son code d’exploitation. La quatrieme contribution de notre algorithme de classementgeneralise permet aux defendeurs des reseaux d’obtenir des classements d’actifs correspon-dant a l’importance des actifs d’attaque pour la protection d’actifs essentiels du reseau. Lacinquieme contribution est une interpretation de la semantique des valeurs de classementdans le contexte de graphes d’attaque.
DRDC Ottawa TM 2008-180 v

Importance des resultats : La valeur numerique calculee par AssetRank est un indica-teur direct de l’importance qu’a un actif objet d’attaque,represente par un sommet, pourun attaquant potentiel. L’algorithme a ete verifie empiriquement au cours de nombreusesexperiences qui ont porte sur divers reseaux representatifs. Les valeurs des rangs obtenuesseront utiles pour que les utilisateurs des graphes d’attaque puissent mieux comprendre lesrisques sur le plan de la securite, pour integrer les donnees publiques sur les attributs desactifs attaques et pour determiner les mesures de reduction du risque appropriees. Elles se-ront aussi utiles comme entrants appliques a d’autres outils d’analyse de graphes d’attaque.
Travaux futurs : Nous aimerions explorer les facons d’incorporer les priorites operationnelleset les couts de mise en oeuvre avec les valeurs produites parAssetRank afin que les va-leurs ainsi obtenues puissent etre utilisees immediatement par un administrateur de reseaupour generer une marche a suivre ou mettre en oeuvre automatiquement des mesures dedurcissement de la securite. Nous aimerions aussi mener des experiences sur des reseauxoperationnels pour mieux comprendre les avantages et les limites de l’algorithme que nousproposons et trouver des facons de l’ameliorer. Enfin, nous souhaitons determiner le tauxde convergence d’AssetRank ainsi que sa stabilite en presence de perturbations.
vi DRDC Ottawa TM 2008-180

Table of contents
Abstract . . . . . . . . . . . . . . . . . . . . . . . . . . . . . . . . . . . . . . . . . i
Resume . . . . . . . . . . . . . . . . . . . . . . . . . . . . . . . . . . . . . . . . . i
Executive summary. . . . . . . . . . . . . . . . . . . . . . . . . . . . . . . . . . . iii
Sommaire . . . . . . . . . . . . . . . . . . . . . . . . . . . . . . . . . . . . . . . . v
Table of contents . . . . . . . . . . . . . . . . . . . . . . . . . . . . . . . . . . . . vii
List of figures . . . . . . . . . . . . . . . . . . . . . . . . . . . . . . . . . . . . . . ix
List of tables. . . . . . . . . . . . . . . . . . . . . . . . . . . . . . . . . . . . . . . x
Acknowledgements. . . . . . . . . . . . . . . . . . . . . . . . . . . . . . . . . . . xi
1 Introduction . . . . . . . . . . . . . . . . . . . . . . . . . . . . . . . . . . . . . 1
2 Attack Graphs. . . . . . . . . . . . . . . . . . . . . . . . . . . . . . . . . . . . 3
3 AssetRank for Attack Graphs. . . . . . . . . . . . . . . . . . . . . . . . . . . . 5
3.1 AND Vertices . . . . . . . . . . . . . . . . . . . . . . . . . . . . . . . . 6
3.2 Vertex-Specific Damping. . . . . . . . . . . . . . . . . . . . . . . . . . 8
3.3 Personalization Vector. . . . . . . . . . . . . . . . . . . . . . . . . . . . 8
4 Parameter Assignment. . . . . . . . . . . . . . . . . . . . . . . . . . . . . . . 9
4.1 Dependency Matrix (D) . . . . . . . . . . . . . . . . . . . . . . . . . . . 9
4.2 Damping Matrix (∆) . . . . . . . . . . . . . . . . . . . . . . . . . . . . . 11
4.3 Personalization Vector (P ) . . . . . . . . . . . . . . . . . . . . . . . . . . 12
5 Experiments. . . . . . . . . . . . . . . . . . . . . . . . . . . . . . . . . . . . . 12
5.1 Experiment 1. . . . . . . . . . . . . . . . . . . . . . . . . . . . . . . . . 12
5.2 Experiment 2. . . . . . . . . . . . . . . . . . . . . . . . . . . . . . . . . 14
5.3 Experiment 3. . . . . . . . . . . . . . . . . . . . . . . . . . . . . . . . . 16
6 Interpretation of AssetRank. . . . . . . . . . . . . . . . . . . . . . . . . . . . . 17
DRDC Ottawa TM 2008-180 vii

7 Discussion. . . . . . . . . . . . . . . . . . . . . . . . . . . . . . . . . . . . . . 19
8 Related Work . . . . . . . . . . . . . . . . . . . . . . . . . . . . . . . . . . . . 20
9 Conclusion . . . . . . . . . . . . . . . . . . . . . . . . . . . . . . . . . . . . . 21
Annex A: Full Attack Graph . . . . . . . . . . . . . . . . . . . . . . . . . . . . . . 23
Annex B: Experiment 1b Attack Graph. . . . . . . . . . . . . . . . . . . . . . . . 25
Annex C: Experiment 2a Attack Graph. . . . . . . . . . . . . . . . . . . . . . . . 27
Annex D: Experiment 2b Attack Graph. . . . . . . . . . . . . . . . . . . . . . . . 29
Annex E: Experiment 3 Attack Graph. . . . . . . . . . . . . . . . . . . . . . . . . 31
References. . . . . . . . . . . . . . . . . . . . . . . . . . . . . . . . . . . . . . . . 32
viii DRDC Ottawa TM 2008-180

List of figures
Figure 1: An example network. . . . . . . . . . . . . . . . . . . . . . . . . . . . 1
Figure 2: Vertices and arcs in a dependency attack graph. . . . . . . . . . . . . . 5
Figure 3: AssetRank computation for an AND/OR graph. . . . . . . . . . . . . . 7
Figure 4: Scenario for experiments 1a and 1b. . . . . . . . . . . . . . . . . . . . 13
Figure 5: Attack graph for the Experiment 1a scenario. . . . . . . . . . . . . . . 14
Figure 6: A realistic network scenario for Experiment 3. . . . . . . . . . . . . . . 16
Figure A.1: Attack graph for the network in Figure 1. . . . . . . . . . . . . . . . . 23
Figure B.1: Attack graph for the Experiment 1b scenario. . . . . . . . . . . . . . . 25
Figure C.1: Attack graph for the Experiment 2a scenario. . . . . . . . . . . . . . . 27
Figure D.1: Attack graph for the Experiment 2b scenario. . . . . . . . . . . . . . . 29
Figure E.1: Attack graph for the Experiment 3 scenario. . . . . . . . . . . . . . . . 31
DRDC Ottawa TM 2008-180 ix

List of tables
Table 1: CVSS Exploitability Metrics and Success Likelihoods . . . . . . . . . . 10
Table 2: AssetRanks for Experiment 1a. . . . . . . . . . . . . . . . . . . . . . . 13
Table 3: AssetRanks for Experiment 1b. . . . . . . . . . . . . . . . . . . . . . . 14
Table 4: AssetRanks for Experiment 2a. . . . . . . . . . . . . . . . . . . . . . . 15
Table 5: AssetRanks for Experiment 2b. . . . . . . . . . . . . . . . . . . . . . . 15
x DRDC Ottawa TM 2008-180

Acknowledgements
The authors thank Craig Burrell for many valuable discussions. We also thank the numer-ous people who provided helpful comments on the paper.
DRDC Ottawa TM 2008-180 xi

This page intentionally left blank.
xii DRDC Ottawa TM 2008-180

1 Introduction
An attack graph is a mathematical abstraction of the detailsof possible attacks against aspecific network. Various forms of attack graphs have been proposed for analyzing thesecurity of enterprise networks [3, 4, 5, 6, 7, 8]. Recent advances have enabled computingattack graphs for networks with thousands of machines [4, 6]. Even when attack graphs canbe efficiently computed, the resulting size and complexity of the graphs is still too largefor a human to fully comprehend [9, 10, 11]. While a user will quickly understand thatattackers can penetrate the network, it is essentially impossible to know which privilegesand vulnerabilities are the most important to the attackers’ success. Network administratorsrequire a tool which can distill the overwhelming amount of information into a list ofpriorities that will help them to secure the network, makingefficient use of scarce humanand financial resources.
The problem of information overload can occur even for small-sized networks. The ex-ample network shown in Figure1 is from recent work by Ingolset al. [4]. Machine A isan attacker’s launch pad (for example, the Internet). Machines B, C, and D are located inthe left subnet and machines E and F are in the right subnet. The firewall FW controls thenetwork traffic such that the only allowed network access between the subnets is from Cand D to E. All of the machines have a remotely exploitable vulnerability.
We applied the MulVAL attack graph tool suite [6] to the example network. The resultingattack graph can be found in AppendixA. Even for a small network, the attack graph isbarely readable on a full page. Assuming the attack graph canbe read, it is still difficult fora human to capture the core security problems in the simple network. Essentially, the soft-ware vulnerabilities on hosts C and D will enable an attackerfrom A to gain local privilegeson the victim machines, and use them as stepping stones to penetrate the firewall, whichonly allows through traffic from C and D. In this example, all the machines can potentiallybe compromised by the attacker, and all the vulnerabilitieson the hosts can play a role inthose potential attack paths. However, the vulnerabilities on C and D, and the potential
Figure 1: An example network
DRDC Ottawa TM 2008-180 1

compromise of those two machines, are crucial for the attacker to successfully penetrateinto the right subnet, presumably a more sensitive zone. Theattack graph produced byMulVAL does reflect this dependency, but a careful reading ofthe graph is necessary tounderstand which graph vertices are the most important to consider. When the networksize grows and attack paths become more complicated, it is insurmountably difficult for ahuman to digest all the dependency relations in the attack graph and identify key problems.
Besides the dependency relations represented in an attack graph, another important factor indetermining the criticality of an identified security problem is the likelihood the attack pathcan lead to a successful exploit. For example, both hosts C and D can be exploited remotelyby the attacker on host A. Assume that the vulnerability on host C is only theoretical andno one has successfully produced a proof-of-concept exploit, whereas the vulnerabilityon host D has a publicly available exploit that works most of the time. Obviously thevulnerability on D is more likely to be exploited than the vulnerability on C and so itselimination deserves prioritization.
In the past five years, significant resources have gone into standardizing the definition ofthe attributes of reported security vulnerabilities. Mostnotably, the Common VulnerabilityScoring System (CVSS)1 is a standard for sharing the attributes of discovered securityvulnerabilities among IT security professionals. It represents not just a single numericscore, but a metric vector that describes various aspects ofa vulnerability such as its accessvector, access complexity and exploitability. The CVSS metric vector is included in theNational Vulnerability Database (NVD)2 for every vulnerability reported in NVD. Themetrics provide crucial baseline information for automated security analysis. However,the metrics themselves can only give limited information without an understanding of theglobal security interactions in an enterprise environment. For example, further assume thatthe vulnerability on B is the same as the one on D. Since B does not have access into theright subnet, its vulnerability is less critical than the one on D. In the scenario just described,our algorithm gives first priority to the vulnerability on D,followed by the vulnerability onB, and then C. This prioritization is intuitive since D is easy to exploit and gives accessto the right subnet; B is easy to exploit and gives access to D;and since only proof-of-concept code exists to exploit C, it warrants the lowest priority. All of the parametersin our algorithm can be tuned to model attackers of various levels of sophistication andtechnique.
In order to determine the relative importance of security problems in a network, both thedependency relationships in the attack graphand the attributes of the security problemsneed to be considered. We present an approach which automatically digests the depen-dency relations in an attack graph as well as the baseline information of the vulnerabilityattributes to compute the relative importance of attacker assets (the graph vertices) as anumeric metric. The metric gauges the importance of a privilege or vulnerability to an
1. http://www.first.org/cvss/2. http://nvd.nist.gov/cvss.cfm
2 DRDC Ottawa TM 2008-180

attacker (and hence the defender). Our approach fuses attack graphs and baseline securitymetrics such as CVSS, to make both of them more useful in security analysis. The productis primarily a defensive tool which gives the advantage to network defenders since theyhave full information about their network and can build a complete attack graph whereasattackers will usually have incomplete information.
Our algorithm is based on the Google PageRank algorithm [12] which ranks the importanceof web pages. It is important to note that our work is significantly different from previouswork in applying Google PageRank algorithm to attack graphs[13].
First, we have approached the problem using dependency attack graphs which have verydifferent semantics from the state-enumeration attack graphs used in the previous work(see Section2). PageRank is a generic graph data-mining algorithm that has been applied tovarious types of directed graphs but it has not yet been applied to dependency attack graphs.The interpretation of the computed rank values are completely different for different graphsemantics and it is important to understand what the values mean in any new context.
Second, our work extends the original PageRank algorithm bygeneralizing its dampingfactor and providing the ability to operate on heterogeneous graphs with both AND and ORvertices. Our work shows how our PageRank generalizations,the dependency matrix, andpersonalization vector can be set to obtain rich security insight from the fusion of attackgraphs with attack asset attributes, such as the maturity ofexploit code. Our extendedPageRank algorithm is named AssetRank.
Dependency attack graphs contain both AND and OR vertices. The metric the AssetRankalgorithm computes indicates the value of an attack asset (agraph vertex) to a potentialattacker. Attack assets consist of privileges, such as the ability to execute code on a par-ticular machine, and facts, such as the existence of vulnerable software on a host. We givea stochastic interpretation of the asset ranks in the context of network attacks and conductexperiments on various network settings. The results of ourexperiments show that the ver-tex ranks computed by our algorithm are consistent, from a security point of view, with therelative importance of the attack assets to an attacker. Theasset ranks add value to bothattack graphs and CVSS vulnerability data. The asset ranks can be used to prioritize coun-termeasures, help a human reader to better comprehend security problems, and provideinput to further security analysis tools.
2 Attack Graphs
There are basically two types of attack graphs. In the first type, each vertex representsthe entire network state and the arcs represent state transitions caused by an attacker’sactions. Examples are Sheyner’s scenario graph based on model checking [14], and theattack graph in Swiler and Phillips’ work [15]. This type of attack graph is sometimes
DRDC Ottawa TM 2008-180 3

called astate enumeration attack graph [9]. In the second type of attack graph, a vertexdoes not represent the entire state of a system but rather a system condition in some formof logical sentence. The arcs in these graphs represent the causality relations between thesystem conditions. We call this type of attack graph adependency attack graph. Examplesare the graph structure used by Ammannet al. [3], theexploit dependency graphs definedby Noelet al. [5, 9], the MulVAL logical attack graph by Ouet al. [6], and themultiple-prerequisite graphs by Ingolset al. [4].
The key difference between the two types of attack graphs lies in the semantics of theirvertices. While each vertex in a state enumeration attack graph encodes all the conditionsin the network, a vertex in a dependency attack graph encodesa single attack asset of thenetwork. A paths1 → s2 → s3 in a state enumeration attack graph means that the system’sstate can be transitioned froms1 to s2 and then tos3 by an attacker. But the conditionthat enables the transitions2 → s3 may have already become true in a previous state, says1. The reason the attacker can get to states3 is encoded in some state variables ins2, butthe arcs in the graph do not directly show where these conditions were first enabled. Ina dependency attack graph, however, the dependency relations among various assets aredirectly represented by the arcs.
For example, Figure2 is a simple dependency attack graph. The verticesp1, ..., p5 areassets to an attacker ande1, e2 are exploits an attacker can launch to gain privileges. Thearcs from a vertex in a dependency attack graph can form one oftwo logical relations:“OR” or “AND”. An “OR” vertex represents conditions which may be enabled by any oneof its out-neighbours. An “AND” vertex represents an exploit in the attack graph requiringall of the preconditions represented by its out-neighboursto be met. In our figures we usediamonds to symbolize OR vertices, ellipses to symbolize AND vertices, and boxes forSINK vertices (vertices with no out-neighbours). The dependency attack graph in Figure2shows that attackers can gain privilegep5 through one of two ways. They can launchexploit e1 if all of the conditionsp1, p2 andp3 are true. Or they can launch exploite2 ifconditionsp3 andp4 are true. Each of the conditionsp1, ..., p4 could be some other privilegethe attackers need to gain first, or some configuration information such as the existence ofa software vulnerability on a host.
In this paper we have chosen to use dependency attack graphs.Our goal is to compute anumeric value representing the importance of each attack asset to an attacker and as suchthe semantics of dependency attack graphs are better suitedfor this purpose. Intuitively, themore a vertex is depended upon, the more important it is to an attacker. This is analogousto PageRank’s use in the World Wide Web where the more the web depends upon a page(evidenced by links to it) the more important the page is.
4 DRDC Ottawa TM 2008-180

p5
e1 e2
p1 p2 p3 p4
Figure 2: Vertices and arcs in a dependency attack graph
3 AssetRank for Attack Graphs
Internet web pages are represented in a directed graph sometimes called aweb graph. Thevertices of the graph are web pages and the arcs are URL links from one page to another.Google’s PageRank algorithm [12] computes a page’s rank, not based on its content, buton the link structures of the web graph. Pages that are pointed to by many pages or by afew important pages have higher ranks than pages that are pointed to by a few unimportantpages. In this paper, we introduce AssetRank, a generalization of the PageRank algorithm,which can handle the semantics of vertices and arcs of dependency attack graphs. Our firstcontribution allows AssetRank to treat the AND and OR vertices in a dependency attackgraph correctly based on their logical meanings, whereas PageRank is only applied to ORvertex graphs. The second contribution is a generalizationof PageRank’s single system-wide damping factor to a per-vertex damping factor. This generalization allows AssetRankto accurately model the various likelihoods of an attacker’s ability to obtain privilegesthrough means not captured in the graph (out-of-band attacks). The third contribution isleveraging publicly available vulnerability information(e.g. CVSS) through parameters inAssetRank so that the importance of security problems is computed with respect to vulner-ability attributes such as attack complexity and exploit availability. The fourth contributionis that our generalized ranking algorithm allows network defenders to obtain personalizedAssetRanks to reflect the importance of attack assets with respect to the protection of spe-cific critical network assets. The fifth contribution is an interpretation of the semantics ofAssetRank values in the context of attack graphs.
The AssetRank algorithm presented here could be applied to any graph whose arcs repre-sent some type of dependency relation between vertices. In fact, web graphs are a specialcase of dependency graphs since a web page’s functionality in part depends on the pages itlinks to.
DRDC Ottawa TM 2008-180 5

A dependency attack graphG is represented asG = (V, A, f, g, h) whereV is a set of ver-tices;A is a set of arcs represented as(u, v), meaning that vertexu depends on vertexv; f
is a mapping of positive weights to vertices;g is a mapping of non-negative weights to arcs;andh is a mapping of vertices to their type (AND, OR, or SINK). Theout-neighbourhoodof a vertexv is defined asN+(v) = {w ∈ V : (v, w) ∈ A}, andin-neighbourhood of v
is defined asN−(v) = {u ∈ V : (u, v) ∈ A}. The cardinality of a setX is denoted|X|and its L1-norm is denoted||X||1. Without loss of generality, we require the vector of allvertex weightsf(V ) to sum to 1.
AssetRank is computed by solving for the principal eigenvector X in the following equa-tion.
λX = (D∆ + γPeT )X (1)
Whereλ is the principal eigenvalue,X is the vector of AssetRanks (scaled to sum to 1),D is the transpose of the square adjacency matrix of a dependency attack graphG (anAND/OR directed graph),∆ is a diagonal matrix of vertex-specific arc-weight dampingfactors where each value is in the range[0, 1], γ ∈ (0, 1] is the vertex-weight dampingfactor, P = f(V ) is a personalization vector composed of the vertices’ personalizationvalues (that is, the vertex weights), ande is the all-ones vector.
Equation (1) reduces to the original PageRank ifλ = 1, ∆ = δI (whereI is the identitymatrix andδ is PageRank’s damping factor),γ = 1 − δ, and all vertices are required to beOR vertices.
3.1 AND Vertices
Dependency attack graphs contain both AND and OR vertices. An OR vertex can be sat-isfied by any of its out-neighbours, whereas an AND vertex depends onall of its out-neighbours. For example, the simple dependency attack graph in Figure3(a) shows thatattackers attaining the goalp1 depend upon their ability to obtain both privilegesp2 andp3.p2 is an AND vertex3 and it requires the two vulnerabilitiesvul1 andvul2. p3 is an ORvertex and it requires only one of eithervul3 or vul4. In this example we assume all thearcs have the same weight.
Since any of an OR vertex’s out-neighbours can enable it, theimportance of each out-neighbour decreases as the number of out-neighbours increases since the vertex can besatisfied by any one of them. This reduced dependency is not true of AND vertices. Sinceall the out-neighbours of an AND vertex are necessary to enable it, it is intuitively incorrectto lessen the amount of value flowed to each out-neighbour as their numbers grow.
3. In our figures, AND vertices are represented by ovals, OR vertices are represented by diamonds, andSINK vertices are represented by rectangles.
6 DRDC Ottawa TM 2008-180

p1
p2 p3
vul1 vul2 vul3 vul4
(a)
Vertex AssetRankp1 0.1722p2 0.1680p3 0.1680vul1 0.1639vul2 0.1639vul3 0.0820vul4 0.0820
(b)
Figure 3: AssetRank computation for an AND/OR graph
Rather than splitting the value of an AND vertex wereplicate it to its out-neighbours. Eachout-neighbour of an AND vertex receives the full value from the vertex multiplied by thevertex’s damping factor. That is, for every outgoing edge(u, v) from an AND vertexu,the corresponding matrix entryDvu
4 is 1. We now have the following restrictions on thegraph’s arc weights:
∑
w∈N+(v)
g(v, w) =
|N+(v)|, if h(v) = AND
1, if h(v) = OR
0, if h(v) = SINK
(2)
A unique principal eigenvectorX in Equation (1) exists (up to scalar multiplication) andfollows from Perron’s theorem (see, for example, [16]), and the fact thatD∆ + γPeT
is positive. Thus, convergence using the power method is guaranteed. The computationusing the power method with the terms optimized to take advantage of the sparsity ofD∆follows.
Step 1:X ′t= D∆Xt−1 + γP ; Step 2:Xt =
1
||X ′t||1
X ′t
(3)
Figure3(b)displays the result of applying the above algorithm to the graph in Figure3(a).For this example, we use a single constant damping factor of∆ = 0.85I andP is such thatonly the goal vertexp1 has a non-zero personalization value.
AssetRank gives5 the expected relative importance for the four vulnerabilities: vul1 and
4. As a shorthand notation we useu andv in Dvu to represent the column and row indices correspondingto the respective vertices.
5. All of the experiments in this paper required a computation time of less than one second on a typicaldesktop PC and converged in 78 iterations or less. The complexity of the power method depends uponthe complexity of matrix multiplication and the number of iterations required. The complexity of naivematrix multiplication isO(n3). Speed improvements for PageRank computation can also speed up AssetRankcomputation as long as they do not require the principal eigenvalue to be 1.
DRDC Ottawa TM 2008-180 7

vul2 are twice as important asvul3 andvul4 since patching one ofvul1 or vul2 has anequivalent effect in denying the goalp1 as patching bothvul3 andvul4.
3.2 Vertex-Specific Damping
In the case of PageRank applied to web pages, the system-widedamping factorδ gives theprobability that surfers will stop surfing [17]. They could stop surfing for any number ofreasons including having found the desired information or encountering a poor quality webpage. The reality is that not all web pages have an equal likelihood to be the end point ofa user’s surfing. On some web pages almost all of the surfers will continue surfing (forexample, search results) while on other pages, almost all ofthe surfers will stop surfing(for example, a local weather page).
An analogous situation exists for attack graphs. An “attackplanner” will more likely stoptraversing the attack graph if the vertex represents a privilege that can be easily obtained“out-of-band”. For example, attackers requiring the ability to execute code on a user desk-top could use out-of-band methods such as social engineering rather than purely technicalexploits.6
In general, the damping factor measures the likelihood thatan attack planner will continuetraversing the graph. We improve the accuracy of the ranks bynot assuming that the plan-ners are equally likely to stop traversing the graph regardless of the vertex they are visiting.Rather than using a single damping factor, we introduce vertex-specific damping factorsδv
and assemble them into the diagonal damping matrix∆ = diag(δ1, δ2, . . . , δ|V |).
3.3 Personalization Vector
It is insufficient to consider only the dependency relationsand damping factors in deter-mining a vertex’s value. Network defenders place a higher priority on defending criticalservers than non-critical PCs. Similarly, some assets are more valuable than others to at-tackers. We use vertex weights as apersonalization value to represent a vertex’s inherentvalue to network attackers or defenders. Network defendersmay identify the assets theydesire to deny the attacker by assigning them a personalization value that reflects their im-portance to the defender’s operations. The remaining attack assets are assigned a value of 0which then causes the computed AssetRank values to reflect their importance only in so faras they are likely to be used by an attacker to obtain the attack assets identified as critical.
6. The attack graphs we use in this paper include only technical exploits.
8 DRDC Ottawa TM 2008-180
4 Parameter Assignment
Attack graph dependencies and attack asset attribute information (such as CVSS metricsobtained from the NVD database) supply the three key componentsD, ∆, andP of theAssetRank matrixA = D∆+γPeT . In this section we explain how to obtain and set thesevalues. In Section5 we will demonstrate their effect on the asset ranks. The parameterγ sets the influence of the personalization vector which has the effect of opting to favourattack assets closer to the goal versus favouring attack assets closer to the attacker.
4.1 Dependency Matrix ( D)
To model attacker preferences, we assign asuccess likelihood s(v) to every vertex. Thesuccess likelihood has a slightly different meaning for thethree types of vertices: AND,OR, and SINK.
The SINK vertices represent the ground facts that MulVAL uses when deriving attack paths.The ground facts include the existence of vulnerable software, network routes and theservices running on each machine. Every ground fact is assigned a success likelihood.To simplify the demonstration in this paper we assign the success likelihood 1 to all non-vulnerability SINK vertices. That is, we assume that if a service exists, it is always up, andthat network paths are stable.7
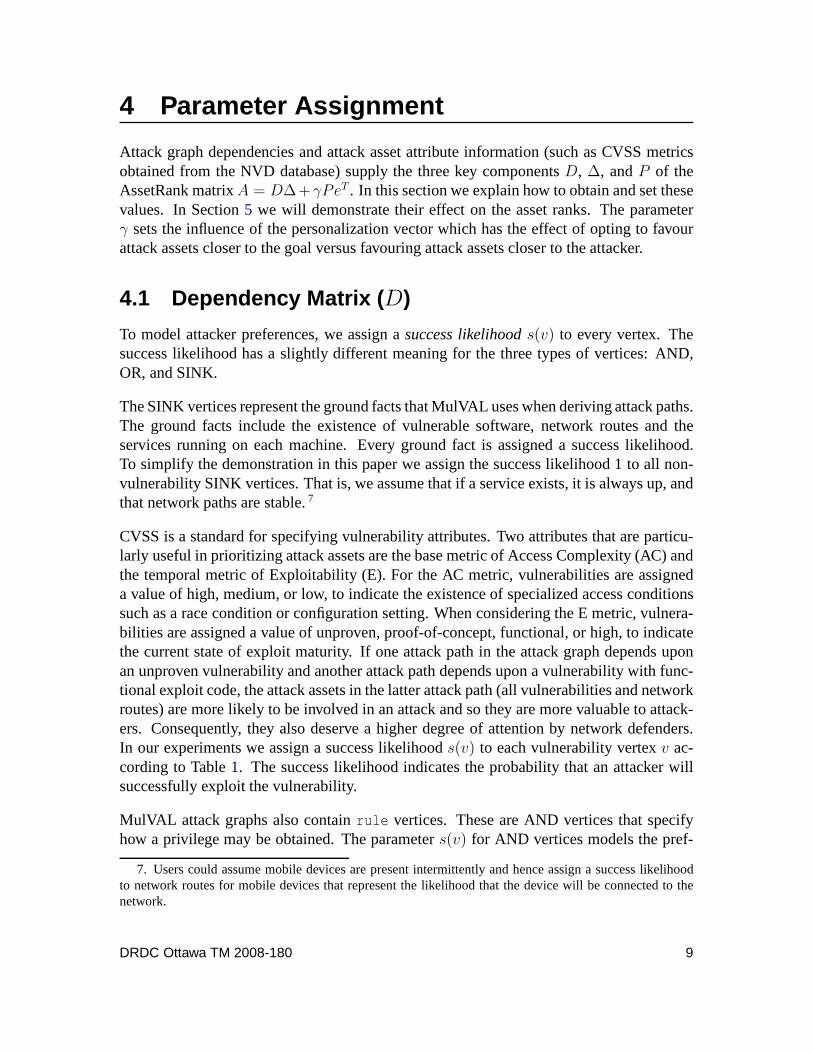
CVSS is a standard for specifying vulnerability attributes. Two attributes that are particu-larly useful in prioritizing attack assets are the base metric of Access Complexity (AC) andthe temporal metric of Exploitability (E). For the AC metric, vulnerabilities are assigneda value of high, medium, or low, to indicate the existence of specialized access conditionssuch as a race condition or configuration setting. When considering the E metric, vulnera-bilities are assigned a value of unproven, proof-of-concept, functional, or high, to indicatethe current state of exploit maturity. If one attack path in the attack graph depends uponan unproven vulnerability and another attack path depends upon a vulnerability with func-tional exploit code, the attack assets in the latter attack path (all vulnerabilities and networkroutes) are more likely to be involved in an attack and so theyare more valuable to attack-ers. Consequently, they also deserve a higher degree of attention by network defenders.In our experiments we assign a success likelihoods(v) to each vulnerability vertexv ac-cording to Table1. The success likelihood indicates the probability that an attacker willsuccessfully exploit the vulnerability.
MulVAL attack graphs also containrule vertices. These are AND vertices that specifyhow a privilege may be obtained. The parameters(v) for AND vertices models the pref-
7. Users could assume mobile devices are present intermittently and hence assign a success likelihoodto network routes for mobile devices that represent the likelihood that the device will be connected to thenetwork.
DRDC Ottawa TM 2008-180 9
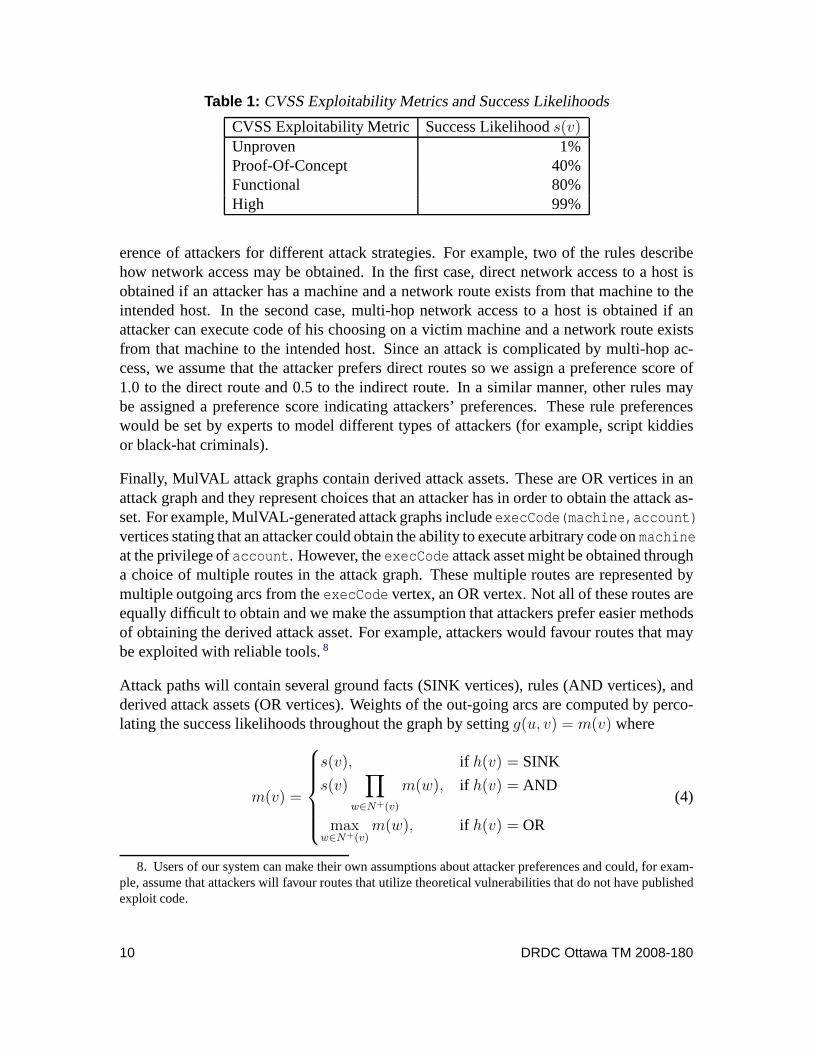
Table 1: CVSS Exploitability Metrics and Success Likelihoods
CVSS Exploitability Metric Success Likelihoods(v)Unproven 1%Proof-Of-Concept 40%Functional 80%High 99%
erence of attackers for different attack strategies. For example, two of the rules describehow network access may be obtained. In the first case, direct network access to a host isobtained if an attacker has a machine and a network route exists from that machine to theintended host. In the second case, multi-hop network accessto a host is obtained if anattacker can execute code of his choosing on a victim machineand a network route existsfrom that machine to the intended host. Since an attack is complicated by multi-hop ac-cess, we assume that the attacker prefers direct routes so weassign a preference score of1.0 to the direct route and 0.5 to the indirect route. In a similar manner, other rules maybe assigned a preference score indicating attackers’ preferences. These rule preferenceswould be set by experts to model different types of attackers(for example, script kiddiesor black-hat criminals).
Finally, MulVAL attack graphs contain derived attack assets. These are OR vertices in anattack graph and they represent choices that an attacker hasin order to obtain the attack as-set. For example, MulVAL-generated attack graphs includeexecCode(machine,account)vertices stating that an attacker could obtain the ability to execute arbitrary code onmachineat the privilege ofaccount. However, theexecCode attack asset might be obtained througha choice of multiple routes in the attack graph. These multiple routes are represented bymultiple outgoing arcs from theexecCode vertex, an OR vertex. Not all of these routes areequally difficult to obtain and we make the assumption that attackers prefer easier methodsof obtaining the derived attack asset. For example, attackers would favour routes that maybe exploited with reliable tools.8
Attack paths will contain several ground facts (SINK vertices), rules (AND vertices), andderived attack assets (OR vertices). Weights of the out-going arcs are computed by perco-lating the success likelihoods throughout the graph by setting g(u, v) = m(v) where
m(v) =
s(v), if h(v) = SINK
s(v)∏
w∈N+(v)
m(w), if h(v) = AND
maxw∈N+(v)
m(w), if h(v) = OR
(4)
8. Users of our system can make their own assumptions about attacker preferences and could, for exam-ple, assume that attackers will favour routes that utilize theoretical vulnerabilities that do not have publishedexploit code.
10 DRDC Ottawa TM 2008-180

In words, the arc weight from vertexu to v is the success likelihood ofv if v is a SINKvertex, the attacker’s preference for the attack type multiplied by the product of all of thepaths required forv if v is an AND vertex, and the easiest path fromv if v is an OR vertex.Finally, the arc weights are normalized according to Equation (2).
4.2 Damping Matrix ( ∆)
In Section3.2 we introduced vertex-specific damping factors. This extension allows themodeling of out-of-band attacks for derived attack assets (OR vertices). For example, theability to execute code on a victim’s machine can be gained byobtaining the victim’s logincredentials through social engineering — a non-technical attack that is not captured in theattack graph. If attackers gain the attack assetv by means outside the graph, they will notrequire the dependencies ofv captured in the attack graph so those dependencies are lessvaluable to the attacker and so deserve less attention from network defenders.
For MulVAL attack graphs, specifying a damping factor is only sensible for OR vertices(derived attack assets). The damping factor has no effect onSINK vertices because theyhave no out-going arcs. Also, AND vertices are fundamentally required in the attack graphand cannot be obtained out-of-band so the damping factor forAND vertices is set to 1 (nodamping).
The success likelihood of obtaining a derived asset out-of-band for an OR vertexv is de-noteds(v). An example of an out-of-band attack is an attacker obtaining a user’s logincredentials through social engineering. The success likelihood depends upon the level ofawareness and training of the user. A network defender can specify the success likelihoodbased upon the type of user account. For example, root users could be assigned a low like-lihood score such as 20% while standard users could be assigned a score of 80%. Securityexperts will be relied upon to provide metrics for out-of-band attacks.
The degree to which attackers will use out-of-band attacks depends upon both the projectedsuccess of the out-of-band attack and the difficulty of obtaining the attack asset by usingthe means specified in the attack graph. If the attack asset may be obtained with certaintyusing the attack graph then the attacker will use those means. Also, if out-of-band attacksare impossible or are certain to fail, the attacker will not exit the graph to attempt theout-of-band means but will use the means in the attack graph to obtain the privilege. Thefollowing equation captures these requirements. For an OR vertexv with an out-of-bandsuccess likelihoods(v), the damping factorδv is given by
δv = (1 − s(v)) + s(v)m(v) . (5)
The damping matrix is a diagonal matrix constructed from thevertex-specific dampingfactors by setting∆ = diag(δ1, δ2, . . . , δ|V |).
DRDC Ottawa TM 2008-180 11

4.3 Personalization Vector ( P )
The personalization vectorP represents the network defender’s desire to deny an attackasset to attackers. If a defender is only interested in denying a single goal vertexg then itspersonalization valuef(g) is set to 1 and all other vertices are set to 0.9 If the defenderdesires to deny several vertices (for example, theexecCode privilege on all servers) thenthe values will be set for the vertices in a manner that represents the defenders (conversely,the attackers) interest in those vertices. It is expected that the defender will set the person-alization values based upon the organization’s operational priorities.
5 Experiments
In this section we present several experiments we conductedto study 1) AssetRank’s ef-ficacy in giving results consistent with the importance of anattack asset to a potential at-tacker; and 2) how the AssetRank metric may be used to better understand security threatsconveyed in a dependency attack graph, as well as in choosingappropriate mitigation mea-sures.
In our experiments, we use the MulVAL attack-graph tool suite to compute a dependencyattack graph based upon a network description and a user query. For example, a user mayask if attackers can execute code of their choosing on any server. The attack graph isexported to a custom Python module. The Python module normalizes the input data, com-putes the AssetRank values, and visualizes the attack graphusing the graph visualizationsoftware Graphviz [18].
5.1 Experiment 1
The first experiment demonstrates the effect of arc weights and vertex-specific dampingfactors on a small network. Figure4 shows the network for experiments 1a and 1b. Theattacker has access to both PC1 and PC2. User1 is on PC1 which has vulnerability Vul1and User2 is on PC2 which has vulnerability Vul2. PC1 and PC2 have access to the goalmachine but not to each other.
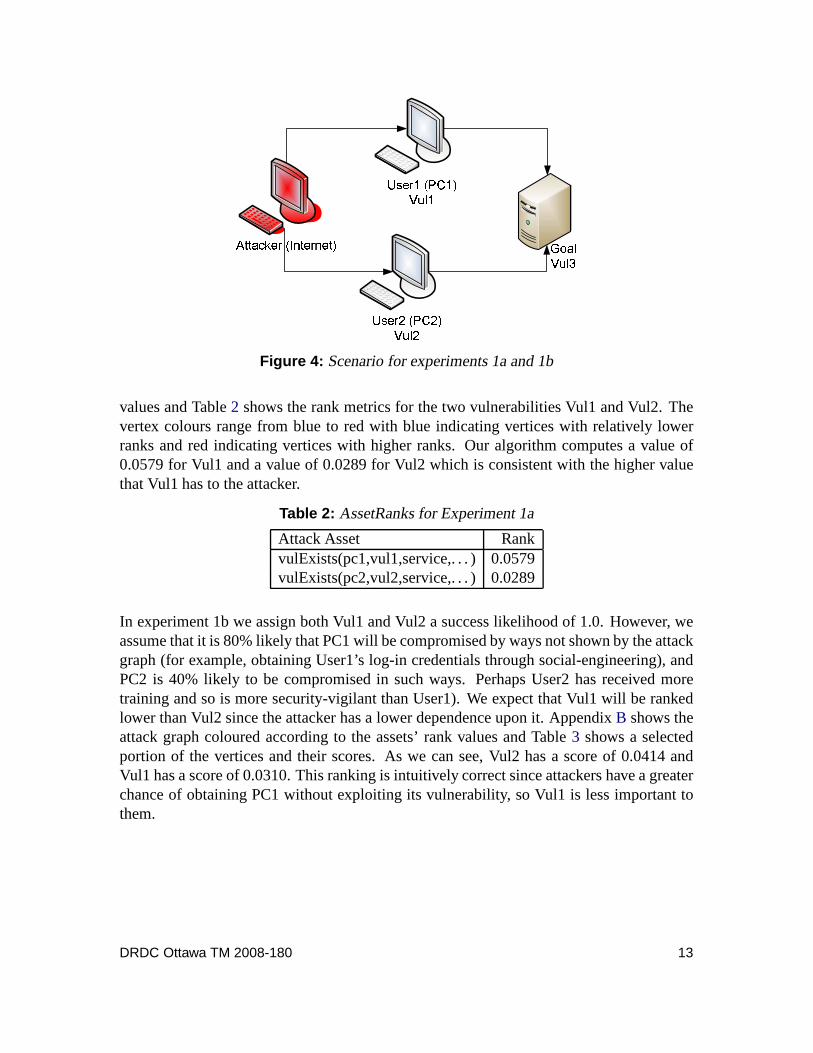
In experiment 1a we assume that Vul1 has functional exploit tools available and Vul2 hasonly proof-of-concept code available. Hence, we assign success likelihood metrics of 0.8and 0.4, respectively. A uniform damping factor of 0.99 is applied to all vertices. Weexpect that Vul1 will have a higher rank metric than Vul2 since the attacker is more likelyto prefer it. Figure5 shows the attack graph coloured according to the assets’ AssetRank
9. Technically, the non-goal vertices are set to an arbitrarily small ε > 0 and the goal is set to1−(|V |−1)ε.This ensures that the AssetRank matrixA = D∆+γPeT is positive, a condition that guarantees the existenceof a unique positive eigenvector according to Perron’s theorem.
12 DRDC Ottawa TM 2008-180
����� ������������ �������
������������� ����������Figure 4: Scenario for experiments 1a and 1b
values and Table2 shows the rank metrics for the two vulnerabilities Vul1 and Vul2. Thevertex colours range from blue to red with blue indicating vertices with relatively lowerranks and red indicating vertices with higher ranks. Our algorithm computes a value of0.0579 for Vul1 and a value of 0.0289 for Vul2 which is consistent with the higher valuethat Vul1 has to the attacker.
Table 2: AssetRanks for Experiment 1a
Attack Asset RankvulExists(pc1,vul1,service,. . . )0.0579vulExists(pc2,vul2,service,. . . )0.0289
In experiment 1b we assign both Vul1 and Vul2 a success likelihood of 1.0. However, weassume that it is 80% likely that PC1 will be compromised by ways not shown by the attackgraph (for example, obtaining User1’s log-in credentials through social-engineering), andPC2 is 40% likely to be compromised in such ways. Perhaps User2 has received moretraining and so is more security-vigilant than User1). We expect that Vul1 will be rankedlower than Vul2 since the attacker has a lower dependence upon it. AppendixB shows theattack graph coloured according to the assets’ rank values and Table3 shows a selectedportion of the vertices and their scores. As we can see, Vul2 has a score of 0.0414 andVul1 has a score of 0.0310. This ranking is intuitively correct since attackers have a greaterchance of obtaining PC1 without exploiting its vulnerability, so Vul1 is less important tothem.
DRDC Ottawa TM 2008-180 13

1: execCode(goal,serviceaccount)Rank: 0.01373
Damp: 0.99 Likelihood: 1.0
2: RULE 2 (remote exploit of a server program)Rank: 0.01867
Damp: 0.99 Likelihood: 1.0
0.8
3: netAccess(goal,tcp,80)Rank: 0.02539
Damp: 0.99 Likelihood: 1.0
1.0
24: networkServiceInfo(goal,service,tcp,80,serviceaccount)Rank: 0.02539
Damp: 0.99 Likelihood: 1.0
1.0
25: vulExists(goal,vul3,service,remoteExploit,privEscalation)Rank: 0.02539
Damp: 0.99 Likelihood: 1.0
1.0
4: RULE 5 (multi-hop access)Rank: 0.02302
Damp: 0.99 Likelihood: 0.5
0.8
14: RULE 5 (multi-hop access)Rank: 0.01151
Damp: 0.99 Likelihood: 0.5
0.4
5: hacl(pc1,goal,tcp,80)Rank: 0.03129
Damp: 0.99 Likelihood: 1.0
1.0
6: execCode(pc1,serviceaccount)Rank: 0.03129
Damp: 0.99 Likelihood: 1.0
1.0
7: RULE 2 (remote exploit of a server program)Rank: 0.04255
Damp: 0.99 Likelihood: 1.0
0.8
8: netAccess(pc1,tcp,80)Rank: 0.05785
Damp: 0.99 Likelihood: 1.0
1.0
12: networkServiceInfo(pc1,service,tcp,80,serviceaccount)Rank: 0.05785
Damp: 0.99 Likelihood: 1.0
1.0
13: vulExists(pc1,vul1,service,remoteExploit,privEscalation)Rank: 0.05785
Damp: 0.99 Likelihood: 0.8
1.0
9: RULE 6 (direct network access)Rank: 0.07866
Damp: 0.99 Likelihood: 1.0
1.0
10: hacl(a,pc1,tcp,80)Rank: 0.10695
Damp: 0.99 Likelihood: 1.0
1.0
21: attackerLocated(a)Rank: 0.16043
Damp: 0.99 Likelihood: 1.0
1.0
15: hacl(pc2,goal,tcp,80)Rank: 0.01565
Damp: 0.99 Likelihood: 1.0
1.0
16: execCode(pc2,serviceaccount)Rank: 0.01565
Damp: 0.99 Likelihood: 1.0
1.0
17: RULE 2 (remote exploit of a server program)Rank: 0.02127
Damp: 0.99 Likelihood: 1.0
0.4
18: netAccess(pc2,tcp,80)Rank: 0.02893
Damp: 0.99 Likelihood: 1.0
1.0
22: networkServiceInfo(pc2,service,tcp,80,serviceaccount)Rank: 0.02893
Damp: 0.99 Likelihood: 1.0
1.0
23: vulExists(pc2,vul2,service,remoteExploit,privEscalation)Rank: 0.02893
Damp: 0.99 Likelihood: 0.4
1.0
19: RULE 6 (direct network access)Rank: 0.03933
Damp: 0.99 Likelihood: 1.0
1.0
1.0
20: hacl(a,pc2,tcp,80)Rank: 0.05348
Damp: 0.99 Likelihood: 1.0
1.0
Figure 5: Attack graph for the Experiment 1a scenario
Table 3: AssetRanks for Experiment 1b
Attack Asset RankvulExists(pc1,vul1,service,. . . )0.0310vulExists(pc2,vul2,service,. . . )0.0414
5.2 Experiment 2
We now demonstrate the results of applying AssetRank to the attack graph for the examplenetwork in Figure1. In the first scenario, we assume all the vulnerabilities have the sameexploitability difficulty level, represented by identicalsuccess likelihood metrics.
A portion of the resulting ranking is shown in Table4, and the complete attack graph withcoloured vertex ranking can be found in AppendixC. 10 The ranking is consistent with theintuitive importance of the various attacker assets. Namely, vulnerabilities on C and D aremore important than the one on B, since these two machines arestepping stones into theright subnet. Likewise, the attacker’s reachability to C and D is ranked higher than that toB.
10. In MulVAL, a tuplevulExists(Host, VulID, Account, AccessVector, Consequence) means“machine Host has the vulnerability VulID in software running as Account that is exploitable via AccessVec-tor with the result Consequence.” A tuplehacl(H1, H2, Protocol, Port) means “machine H1 can reachmachine H2 through Protocol and Port.”
14 DRDC Ottawa TM 2008-180
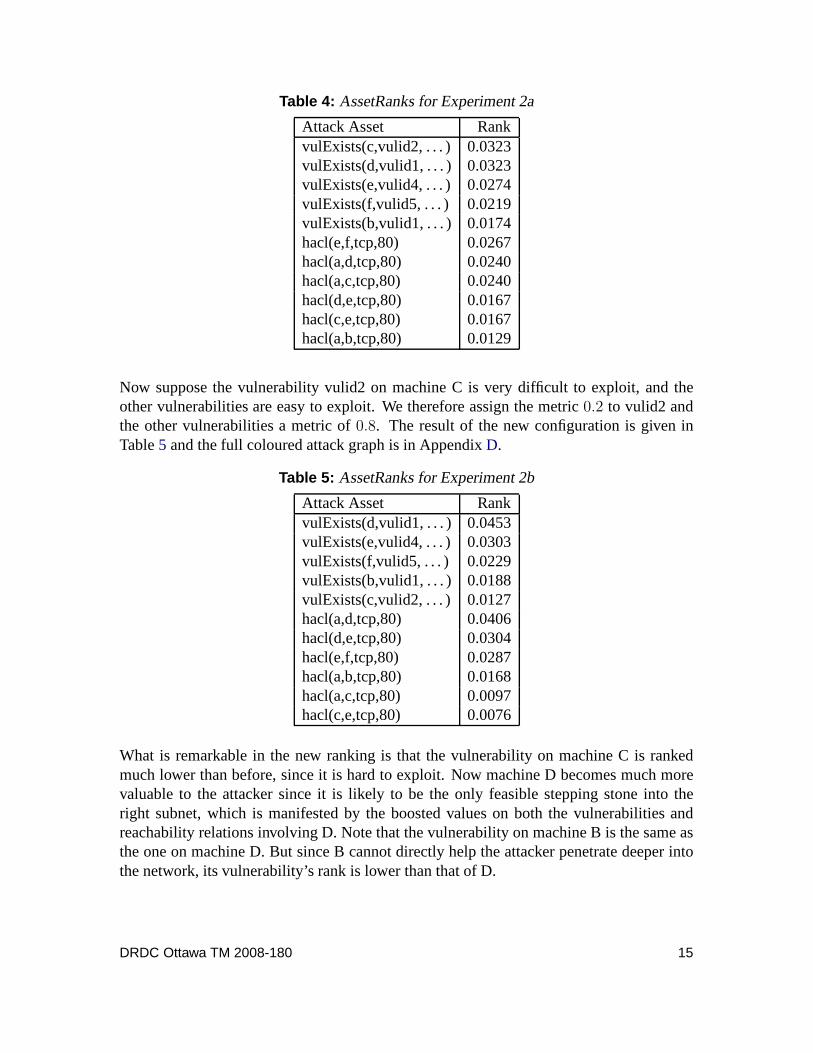
Table 4: AssetRanks for Experiment 2a
Attack Asset RankvulExists(c,vulid2, . . . ) 0.0323vulExists(d,vulid1, . . . ) 0.0323vulExists(e,vulid4, . . . ) 0.0274vulExists(f,vulid5, . . . ) 0.0219vulExists(b,vulid1, . . . ) 0.0174hacl(e,f,tcp,80) 0.0267hacl(a,d,tcp,80) 0.0240hacl(a,c,tcp,80) 0.0240hacl(d,e,tcp,80) 0.0167hacl(c,e,tcp,80) 0.0167hacl(a,b,tcp,80) 0.0129
Now suppose the vulnerability vulid2 on machine C is very difficult to exploit, and theother vulnerabilities are easy to exploit. We therefore assign the metric0.2 to vulid2 andthe other vulnerabilities a metric of0.8. The result of the new configuration is given inTable5 and the full coloured attack graph is in AppendixD.
Table 5: AssetRanks for Experiment 2b
Attack Asset RankvulExists(d,vulid1, . . . ) 0.0453vulExists(e,vulid4, . . . ) 0.0303vulExists(f,vulid5, . . . ) 0.0229vulExists(b,vulid1, . . . ) 0.0188vulExists(c,vulid2, . . . ) 0.0127hacl(a,d,tcp,80) 0.0406hacl(d,e,tcp,80) 0.0304hacl(e,f,tcp,80) 0.0287hacl(a,b,tcp,80) 0.0168hacl(a,c,tcp,80) 0.0097hacl(c,e,tcp,80) 0.0076
What is remarkable in the new ranking is that the vulnerability on machine C is rankedmuch lower than before, since it is hard to exploit. Now machine D becomes much morevaluable to the attacker since it is likely to be the only feasible stepping stone into theright subnet, which is manifested by the boosted values on both the vulnerabilities andreachability relations involving D. Note that the vulnerability on machine B is the same asthe one on machine D. But since B cannot directly help the attacker penetrate deeper intothe network, its vulnerability’s rank is lower than that of D.
DRDC Ottawa TM 2008-180 15

Enterprise Network
Control Network (EMS)
������������� !"#!"$%&!"����' ������ (���)�$��"���
*!+ !"#!",-. !"#!" ���"�/ !"#!"
0$!"*�"1$������$2�3! !"#!"Internet
DMZCORP Internal
Figure 6: A realistic network scenario for Experiment 3
5.3 Experiment 3
To study how AssetRank works in a more complicated realisticsetting, we tested it on anetwork scenario adapted from a real control-system network, shown in Figure6. In thisnetwork, an enterprise network is protected by a firewall from the Internet. Only machinesin the DMZ subnet can be directly accessed from the Internet zone. The machines in theCORP internal subnet can freely access the Internet. Only one machine in the network,the Citrix server, can access the control-system subnet (the Energy Management System,or EMS) which is protected by another firewall, and it may onlyaccess the Data Historian.Assuming the attacker is on the Internet and wants to obtain privileges on the Communica-tions Servers in the EMS subnet, there are two obvious entry ways for him: the web serverand the VPN server, both of which can be directly accessed from the Internet.
We introduced hypothetical vulnerabilities into this scenario and assigned metrics for thembased on our understanding of typical security problems in this type of network.11 Weapplied AssetRank on this example and the resulting coloured attack graphs can be foundin AppendixE. The ranking identifies the two most critical vulnerabilities in the network.One is a remote buffer overflow vulnerability on the web server, which would allow a re-
11. In real applications, this information will automatically be furnished by data collection agents installedon the machines and the CVSS metrics provided by the NVD.
16 DRDC Ottawa TM 2008-180

mote attacker to gain code execution privilege in the DMZ subnet. The other is a browservulnerability on the user workstation. Since outbound traffic from the CORP Internal zoneis not restricted, an unsuspecting user may browse to a malicious website and compromisehis machine. This compromise will yield privileges on the internal network to the attacker.There are many other vulnerabilities in the network and there are other ways to penetrateinto the system (for example, through the VPN server). But the two critical problems iden-tified by the AssetRank algorithm are consistent with a human’s conclusion after spendingan extensive amount of time studying the information revealed by the complicated 129vertex attack graph with 185 dependencies.
6 Interpretation of AssetRank
In this section we describe a stochastic interpretation forthe numeric value computed byAssetRank on dependency attack graphs. Stochastic interpretation has been used to give theoriginal PageRank a semantic meaning in a random walk model [12, 17]. A random walkersurfs the web graph in the following manner. At each time interval, with probabilityδ itwill follow one of the links in the current page with equal probability; with probability1−δ
it will “get bored” and jump to one of the pages in the web graphwith equal probability.Under this interpretation, the equilibrium point of sequence (3) will be the probability arandom surfer is on a page. This random-walk model cannot be applied to dependencyattack graphs, primarily because it does not handle AND and OR vertices differently. Inthis section we give an interpretation of AssetRank that provides meaningful semantics inthe context of dependency attack graphs.
Our interpretation is inspired by the model used by Bianchini et al. [17]. Imagine a poten-tial attacker has the attack graph12 and is planning how to attack the system. He does soby dispatching an army of “attack planning agents” whose task is to learn how to obtainthe privileges represented by the vertices. Every agent behaves in the following manner:at each moment an agent considers only one vertex in the attack graph. We usevi(t) todenote the vertex agenti is contemplating at timet. Let v = vi(t). If v is a sink vertex,agenti has finished his job and stops working. Otherwise he will, with probabilityδv, planhow to satisfy the requirements forv based on the attack graph; with probability1 − δv,he stops traversing the graph and decides to obtain the privilegev through other meansnot encoded in the attack graph (for example, through backdoors already installed in thesystem or social engineering). In the latter case, the agenthas also finished his planningand stops working.
With probability δv, the agent uses the attack graph and follows the out-going arcs fromv to satisfy its preconditions. Two cases need to be considered. If v is an OR vertex, the
12. In reality an attack graph should never be leaked to an attacker; however, in evaluating security weassume that the attacker has the attack graph since securitythrough obscurity is not true security.
DRDC Ottawa TM 2008-180 17

agent will choose one of its out-neighboursw with the following probability.
Pr[ vi(t + 1) = w | vi(t) = v ] = g(v, w) (6)
If v is an AND vertex, the agent must plan how to satisfyall the out-neighbours ofv. Thushe must move along all the out-going arcs simultaneously. Wemodel this by allowing theagent to replicate itself13 with each replica moving to one of the out-neighbours indepen-dently. More precisely, at stept + 1 agenti will becomer = |N+(v)| agentsi1, ..., ir,each of which is assigned one of the vertices inN+(v) so that every element inN+(v) iscovered.
The potential attacker has an unlimited number of such agents at his disposal. Every time hedispatches an agent to a vertex in the attack graph, the agentwill try to find a way to attackthe system such that the goal represented by the starting vertex can be achieved. When theagent (and all his clones) finishes the job, an attack plan hasbeen made. Each time he mayfind a different attack path due to the probabilistic choiceshe makes along the way. At eachtime interval, the potential attacker will dispatch new agents with probabilityγ and the newagents will start from one of the graph vertices with the probability distribution specifiedby the personalization vectorP . The number of new agents isγ times the number of activeagents currently in the system.
Let the vectorXt = [X1t, ..., X
|V |t ]T whereXv
tis a random variable representing the number
of active agents planning an attack for vertexv at timet. E(Xv
t) is the expected value of the
random variableXv
t. We useE(Xt) to represent[E(X1
t), ..., E(X
|V |t )]T . Let E(X0) = P
which corresponds to the attacker dispatching the first agent according to the probabilitydistribution given byP . The following equation then holds fort > 0.
E(Xt) = D∆E(Xt−1) + γ||E(Xt−1)||1P (7)
After normalization, this is precisely the sequence specified by (3). The normalized valueof E(Xt) converges to a unique solution ast → ∞ and the AssetRank value computed willrepresent the portion of active attack planning agents on each vertex in the attack graph.
Under this attack-planning-agents interpretation, a higher AssetRank value for a vertexindicates there will be a larger portion of planning agents discovering how to obtain theasset represented by the vertex. Thus, our AssetRank metricdirectly implies the importanceof the privilege or vulnerability to a potential attacker. The arc weightg(v, w) indicates thedesirability of the attack step(v, w) with respect to achieving the capabilityv, since ahigherg(v, w) means a planning agent will be more likely to choosew asv’s enabler. Avertex’s personalization value represents the desirability of the privilege to an attacker. Ahigher personalization value indicates the vertex is more important to the attacker and so
13. Analogous to the UNIXfork() command.
18 DRDC Ottawa TM 2008-180
he is more likely to dispatch a planning agent to determine how to achieve the goal. Alower δv indicates the attacker is more likely to gain privileges by out-of-band means andthus will not follow the attack graph.γ indicates the rate at which the attacker dispatchesnew agents.
7 Discussion
A very useful aspect of AssetRank in the context of attack graphs is to assist in prioritizingfurther analysis and understanding of the threats. We have used the AssetRank values tocolour the attack graph vertices so that a user’s attention is immediately focussed on themost critical portion. The lowest ranked vertices are coloured blue and the highest rankedvertices are coloured red. This colouring is intended to be analogous to water faucets wherethe hot (and dangerous) tap is coloured red and the cold tap iscoloured blue. The valuescould also be use to incrementally show the vertices in an attack graph, with the highestranked vertices shown first followed by the lower-ranked ones. Network defenders canwork through the ranked attack graph addressing the threatsin order of their criticality.Since the full attack graph is often too cumbersome for a userto understand, this type ofincremental analysis should be useful in practice.
As discussed in Section6, the asset ranks correspond to the expected percentage of attackplanning agents working on each vertex. The vertices in the attack graph represent specificvulnerabilities on specific machines. For example, the verticesvulExists(pc1,vul1),vulExists(pc1,vul2), vulExists(pc1,vul3), andvulExists(pc2,vul1) could ap-pear in an AssetRanked attack graph. Further analysis can beconducted on the rank metricsto further understand how mitigation measures should be prioritized. In this case, the val-ues for all of the vertices connected topc1 can be summed to produce a total that indicatesthe number of attack planning agents that are seeking to compromise that machine. Ifa machine is especially vulnerable then the network defenders could decide to remove itfrom the network or separate its functionality amongst several new machines in order toreduce the quantity of software on the single machine. Similarly, the rank metrics for eachspecific vulnerability may be summed (for example, sum all ofthe rank values related tovul1) to learn which vulnerability overall is the most importantto attackers. Since rollingout patches is not generally performed on a single machine but rather across the entire net-work, network defenders could prioritize patch roll-out bythe sum of the asset ranks foreach vulnerability.
We have shown that arc weights are a flexible instrument that allow the user to take attackerpreferences into account. In our paper we used the weights tofavour attacks with matureexploitation techniques over unproven attacks. Alternatively, the metric can be used todenote other attack characteristics or a combination of them.
• Stealthiness of an attack — allows the inclusion of IDSs in the model by giving a
DRDC Ottawa TM 2008-180 19

penalty for attacks leaving evidence (log entries or systemcrashes for example) ordetectable attacks over links monitored by an IDS.
• Resources required — gives the ability to penalize resourceconsuming attacks (forexample, attacks that require password cracking or large bandwidth).
8 Related Work
Mehtaet al. apply the Google PageRank algorithm to state enumeration attack graphs [13].Aside from the generalizations of PageRank presented in this paper, the key difference fromtheir work is that AssetRank is applied to dependency attackgraphs which have very dif-ferent semantics from the state enumeration attack graphs generated by a model checker.First, a vertex in a dependency attack graph describes a privilege attackers use or a vul-nerability they exploit to accomplish an attack. Hence, ranking a vertex in a dependencyattack graph directly gives a metric for the privilege or vulnerability. Ranking a vertex ina state enumeration attack graph does not provide this semantics since a vertex representsthe state of the entire system including all configuration settings and attacker privileges.Second, the source vertices of our attack graphs are the attackers’ goals as opposed to thesource vertex being the network initial state, as is the casein the work of Mehtaet al.Since our source vertices are the attackers’ goals, value flows from them and the computedrank of each vertex is in terms of how much attackersneed the attack asset to achieve theirgoals. Thus our rank is a direct indicator of the main attack enablers and where securityhardening should be performed. The rank computed in Mehtaet al.’s work represents theprobability a random attacker (similar to the random walkerin the PageRank model) is ina specific state, in particular, a state where he has achievedhis goal. But the probability arandom attacker is in the goal state may decrease as the number of attack paths increases— simply because there are more states to split the distribution. As a result, contrary towhat was proposed in their paper, this rank cannot serve as a metric for the system’s overallvulnerability.
Recent years have seen a number of efforts that apply numericsecurity metrics to attackgraphs. For example, Wanget al. studied how to combine individual security metricsto compute an overall security metric using attack graphs [19]. Dewri et al. proposedconfiguration optimization methods that are based on attackgraphs, numeric cost functions,and genetic algorithms [20]. The goal of our work is different. We aim to use standardizedsecurity metrics and a unified algorithmic framework to rankand prioritize the securityproblems revealed by an attack graph.
There have been various forms of attack graph analysis proposed in the past. The rankingscheme described in this paper is complementary to those works and could be used incombination with existing approaches. One of the factors that has been deemed useful forattack graphs is finding a minimal set of critical configuration settings that enable potential
20 DRDC Ottawa TM 2008-180

attacks since these could serve as a hint on how to eliminate the attacks. Approaches tofind the minimal set have been proposed for both dependency attack graphs [5] and state-enumeration attack graphs [8, 21]. Business needs usually do not permit the elimination ofall security risks so the AssetRank values could be used alongside minimal-cut algorithmsto selectively eliminate risk. In the experiment in Section5.2, the highest ranked vertices(compromise/vulnerability on host C and D) happen to be a minimal set that will cut theattack graph in two parts. AssetRank can incorporate standardized security metrics such asCVSS, and compute the relative importance of each attack asset based on both the metricsand the attack graph. A binary result from the minimal-cut algorithm does not provide thiscapability, which we believe is important in realistic security management.
It has been recognized that the complexity of attack graphs often prevents them from beinguseful in practice and methodologies have been proposed to better visualize them [9, 10,11, 22]. The ranks computed by our algorithm could be used in combination with thetechniques in those works to help further the visualizationprocess, for example by coloringthe visualization based on the computed ranks.
9 Conclusion
In this paper we proposed the AssetRank algorithm, a generalization of the PageRank algo-rithm, that can be applied to rank the importance of a vertex in a dependency attack graph.The model adds the ability to reason on heterogeneous graphscontaining both AND andOR vertices. It also adds the ability to model various types of attackers. We have shownhow to incorporate vulnerability attribute information into the arc weights. Similarly, userscould compute attack asset ranks derived from metrics regarding attack noisiness, attackpath length, or resource utilization. We have also shown howto model the existence ofout-of-band attacks into vertex-specific damping weights.We incorporated personalizationvalues to allow network defenders to specify the assets theymost desire to deny attackersand thus obtain a personalized attack asset ranking based upon their operational priorities.
The numeric value computed by AssetRank is a direct indicator of how important the attackasset represented by a vertex is to a potential attacker. Thealgorithm was empiricallyverified through numerous experiments conducted on severalexample networks. The rankmetric will be valuable to users of attack graphs in better understanding the security risks, infusing publicly available attack asset attribute data, in determining appropriate mitigationmeasures, and as input to further attack graph analysis tools.
DRDC Ottawa TM 2008-180 21

This page intentionally left blank.
22 DRDC Ottawa TM 2008-180

Annex A: Full Attack Graph
execCode(f,serviceaccount)
RULE 2 (22) : remote exploit of a server program
12
networkServiceInfo(f,service,tcp,80,serviceaccount)
1
vulExists(f,vulid,service,remoteExploit,privEscalation)
1
netAccess(f,tcp,80)
11
RULE 5 (52) : multi-hop access
10
hacl(e,f,tcp,80)
1
execCode(e,serviceaccount)
9
RULE 2 (17) : remote exploit of a server program
8
networkServiceInfo(e,service,tcp,80,serviceaccount)
1
vulExists(e,vulid,service,remoteExploit,privEscalation)
1
netAccess(e,tcp,80)
7
RULE 5 (44) : multi-hop access
6
RULE 5 (46) : multi-hop access
6
hacl(c,e,tcp,80)
1
execCode(c,serviceaccount)
5
RULE 2 (7) : remote exploit of a server program
4
networkServiceInfo(c,service,tcp,80,serviceaccount)
1
vulExists(c,vulid,service,remoteExploit,privEscalation)
1
netAccess(c,tcp,80)
3
RULE 5 (32) : multi-hop access
6
RULE 5 (36) : multi-hop access
6
RULE 6 (59) : direct network access
2
hacl(b,c,tcp,80)
1
execCode(b,serviceaccount)
5
RULE 2 (2) : remote exploit of a server program
4
netAccess(b,tcp,80)
3
networkServiceInfo(b,service,tcp,80,serviceaccount)
1
vulExists(b,vulid,service,remoteExploit,privEscalation)
1
RULE 5 (28) : multi-hop access
6
RULE 5 (30) : multi-hop access
6
RULE 6 (56) : direct network access
2
5
hacl(c,b,tcp,80)
1
hacl(d,b,tcp,80)
1
execCode(d,serviceaccount)
5
RULE 2 (12) : remote exploit of a server program
4
netAccess(d,tcp,80)
3
networkServiceInfo(d,service,tcp,80,serviceaccount)
1
vulExists(d,vulid,service,remoteExploit,privEscalation)
1
RULE 5 (38) : multi-hop access
6
RULE 5 (40) : multi-hop access
6
RULE 6 (61) : direct network access
2
5
hacl(b,d,tcp,80)
1
5
hacl(c,d,tcp,80)
1
hacl(a,d,tcp,80)
1
attackerLocated(a)
1
1
hacl(a,b,tcp,80)
1
5
hacl(d,c,tcp,80)
1
1
hacl(a,c,tcp,80)
1
hacl(d,e,tcp,80)
5
1
Figure A.1: Attack graph for the network in Figure1
DRDC Ottawa TM 2008-180 23

This page intentionally left blank.
24 DRDC Ottawa TM 2008-180

Annex
B:E
xperiment1b
Attack
Graph
1: execCode(goal,serviceaccount)Rank: 0.01702
Damp: 0.5 Likelihood: 1.0
2: RULE 2 (remote exploit of a server program)Rank: 0.01448
Damp: 1.0 Likelihood: 1.0
0.5
3: netAccess(goal,tcp,80)Rank: 0.02465
Damp: 0.5 Likelihood: 1.0
1.0
24: networkServiceInfo(goal,service,tcp,80,serviceaccount)Rank: 0.02465
Damp: 1.0 Likelihood: 1.0
1.0
25: vulExists(goal,vul3,service,remoteExploit,privEscalation)Rank: 0.02465
Damp: 1.0 Likelihood: 1.0
1.0
4: RULE 5 (multi-hop access)Rank: 0.01049
Damp: 1.0 Likelihood: 0.5
0.5
14: RULE 5 (multi-hop access)Rank: 0.01049
Damp: 1.0 Likelihood: 0.5
0.5
5: hacl(pc1,goal,tcp,80)Rank: 0.01785
Damp: 1.0 Likelihood: 1.0
1.0
6: execCode(pc1,serviceaccount)Rank: 0.01785
Damp: 0.6 Likelihood: 0.8
1.0
7: RULE 2 (remote exploit of a server program)Rank: 0.01823
Damp: 1.0 Likelihood: 1.0
0.5
8: netAccess(pc1,tcp,80)Rank: 0.03102
Damp: 1.0 Likelihood: 1.0
1.0
12: networkServiceInfo(pc1,service,tcp,80,serviceaccount)Rank: 0.03102
Damp: 1.0 Likelihood: 1.0
1.0
13: vulExists(pc1,vul1,service,remoteExploit,privEscalation)Rank: 0.03102
Damp: 1.0 Likelihood: 0.5
1.0
9: RULE 6 (direct network access)Rank: 0.0528
Damp: 1.0 Likelihood: 1.0
1.0
10: hacl(a,pc1,tcp,80)Rank: 0.08985
Damp: 1.0 Likelihood: 1.0
1.0
21: attackerLocated(a)Rank: 0.20966
Damp: 1.0 Likelihood: 1.0
1.0
15: hacl(pc2,goal,tcp,80)Rank: 0.01785
Damp: 1.0 Likelihood: 1.0
1.0
16: execCode(pc2,serviceaccount)Rank: 0.01785
Damp: 0.8 Likelihood: 0.4
1.0
17: RULE 2 (remote exploit of a server program)Rank: 0.0243
Damp: 1.0 Likelihood: 1.0
0.5
18: netAccess(pc2,tcp,80)Rank: 0.04136
Damp: 1.0 Likelihood: 1.0
1.0
22: networkServiceInfo(pc2,service,tcp,80,serviceaccount)Rank: 0.04136
Damp: 1.0 Likelihood: 1.0
1.0
23: vulExists(pc2,vul2,service,remoteExploit,privEscalation)Rank: 0.04136
Damp: 1.0 Likelihood: 0.5
1.0
19: RULE 6 (direct network access)Rank: 0.07039
Damp: 1.0 Likelihood: 1.0
1.0
1.0
20: hacl(a,pc2,tcp,80)Rank: 0.1198
Damp: 1.0 Likelihood: 1.0
1.0
Fig
ure
B.1:A
ttackgraph
forthe
Experim
ent1bscenario
DR
DC
Ottaw
aT
M2008-180
25

This page intentionally left blank.
26 DRDC Ottawa TM 2008-180

Annex C: Experiment 2a Attack Graph1: execCode(f,serviceaccount)
Rank: 0.02209Damp: 0.8131072 Likelihood: 0.2
2: RULE 2 (remote exploit of a server program)Rank: 0.01983
Damp: 1.0 Likelihood: 1.0
0.065536
3: netAccess(f,tcp,80)Rank: 0.0219
Damp: 1.0 Likelihood: 0.0
1.0
51: networkServiceInfo(f,service,tcp,80,serviceaccount)Rank: 0.0219
Damp: 1.0 Likelihood: 1.0
1.0
52: vulExists(f,vulid5,service,remoteExploit,privEscalation)Rank: 0.0219
Damp: 1.0 Likelihood: 0.8
1.0
4: RULE 5 (multi-hop access)Rank: 0.02419
Damp: 1.0 Likelihood: 0.5
0.08192
5: hacl(e,f,tcp,80)Rank: 0.02671
Damp: 1.0 Likelihood: 0.8
1.0
6: execCode(e,serviceaccount)Rank: 0.02671
Damp: 0.84096 Likelihood: 0.2
1.0
7: RULE 2 (remote exploit of a server program)Rank: 0.02481
Damp: 1.0 Likelihood: 1.0
0.2048
8: netAccess(e,tcp,80)Rank: 0.0274
Damp: 1.0 Likelihood: 0.0
1.0
49: networkServiceInfo(e,service,tcp,80,serviceaccount)Rank: 0.0274
Damp: 1.0 Likelihood: 1.0
1.0
50: vulExists(e,vulid4,service,remoteExploit,privEscalation)Rank: 0.0274
Damp: 1.0 Likelihood: 0.8
1.0
9: RULE 5 (multi-hop access)Rank: 0.01513
Damp: 1.0 Likelihood: 0.5
0.256
47: RULE 5 (multi-hop access)Rank: 0.01513
Damp: 1.0 Likelihood: 0.5
0.256
10: hacl(c,e,tcp,80)Rank: 0.01671
Damp: 1.0 Likelihood: 0.8
1.0
11: execCode(c,serviceaccount)Rank: 0.02853
Damp: 0.928 Likelihood: 0.2
1.0
12: RULE 2 (remote exploit of a server program)Rank: 0.02924
Damp: 1.0 Likelihood: 1.0
0.64
13: netAccess(c,tcp,80)Rank: 0.03229
Damp: 1.0 Likelihood: 0.0
1.0
45: networkServiceInfo(c,service,tcp,80,serviceaccount)Rank: 0.03229
Damp: 1.0 Likelihood: 1.0
1.0
46: vulExists(c,vulid2,service,remoteExploit,privEscalation)Rank: 0.03229
Damp: 1.0 Likelihood: 0.8
1.0
14: RULE 5 (multi-hop access)Rank: 0.00696
Damp: 1.0 Likelihood: 0.5
0.256
40: RULE 5 (multi-hop access)Rank: 0.00696
Damp: 1.0 Likelihood: 0.5
0.256
42: RULE 6 (direct network access)Rank: 0.02175
Damp: 1.0 Likelihood: 1.0
0.8
15: hacl(b,c,tcp,80)Rank: 0.00768
Damp: 1.0 Likelihood: 0.8
1.0
16: execCode(b,serviceaccount)Rank: 0.01537
Damp: 0.928 Likelihood: 0.2
1.0
17: RULE 2 (remote exploit of a server program)Rank: 0.01575
Damp: 1.0 Likelihood: 1.0
0.64
18: netAccess(b,tcp,80)Rank: 0.01739
Damp: 1.0 Likelihood: 0.0
1.0
38: networkServiceInfo(b,service,tcp,80,serviceaccount)Rank: 0.01739
Damp: 1.0 Likelihood: 1.0
1.0
39: vulExists(b,vulid1,service,remoteExploit,privEscalation)Rank: 0.01739
Damp: 1.0 Likelihood: 0.8
1.0
19: RULE 5 (multi-hop access)Rank: 0.00375
Damp: 1.0 Likelihood: 0.5
0.256
21: RULE 5 (multi-hop access)Rank: 0.00375
Damp: 1.0 Likelihood: 0.5
0.256
35: RULE 6 (direct network access)Rank: 0.01171
Damp: 1.0 Likelihood: 1.0
0.8
1.0
20: hacl(c,b,tcp,80)Rank: 0.00414
Damp: 1.0 Likelihood: 0.8
1.0
22: hacl(d,b,tcp,80)Rank: 0.00414
Damp: 1.0 Likelihood: 0.8
1.0
23: execCode(d,root)Rank: 0.02853
Damp: 0.928 Likelihood: 0.2
1.0
24: RULE 2 (remote exploit of a server program)Rank: 0.02924
Damp: 1.0 Likelihood: 1.0
0.64
25: netAccess(d,tcp,80)Rank: 0.03229
Damp: 1.0 Likelihood: 0.0
1.0
33: networkServiceInfo(d,service,tcp,80,root)Rank: 0.03229
Damp: 1.0 Likelihood: 1.0
1.0
34: vulExists(d,vulid1,service,remoteExploit,privEscalation)Rank: 0.03229
Damp: 1.0 Likelihood: 0.8
1.0
26: RULE 5 (multi-hop access)Rank: 0.00696
Damp: 1.0 Likelihood: 0.5
0.256
28: RULE 5 (multi-hop access)Rank: 0.00696
Damp: 1.0 Likelihood: 0.5
0.256
30: RULE 6 (direct network access)Rank: 0.02175
Damp: 1.0 Likelihood: 1.0
0.8
1.0
27: hacl(b,d,tcp,80)Rank: 0.00768
Damp: 1.0 Likelihood: 0.8
1.0
1.0
29: hacl(c,d,tcp,80)Rank: 0.00768
Damp: 1.0 Likelihood: 0.8
1.0
31: hacl(a,d,tcp,80)Rank: 0.02401
Damp: 1.0 Likelihood: 0.8
1.0
44: attackerLocated(a)Rank: 0.06096
Damp: 1.0 Likelihood: 1.0
1.0
1.0
36: hacl(a,b,tcp,80)Rank: 0.01294
Damp: 1.0 Likelihood: 0.8
1.0
1.0
41: hacl(d,c,tcp,80)Rank: 0.00768
Damp: 1.0 Likelihood: 0.8
1.0
1.0
43: hacl(a,c,tcp,80)Rank: 0.02401
Damp: 1.0 Likelihood: 0.8
1.0 1.0
48: hacl(d,e,tcp,80)Rank: 0.01671
Damp: 1.0 Likelihood: 0.8
1.0
Figure C.1: Attack graph for the Experiment 2a scenario
DRDC Ottawa TM 2008-180 27

This page intentionally left blank.
28 DRDC Ottawa TM 2008-180

Annex D: Experiment 2b Attack Graph1: execCode(f,serviceaccount)
Rank: 0.02241Damp: 0.8131072 Likelihood: 0.2
2: RULE 2 (remote exploit of a server program)Rank: 0.02041
Damp: 1.0 Likelihood: 1.0
0.065536
3: netAccess(f,tcp,80)Rank: 0.02286
Damp: 1.0 Likelihood: 0.0
1.0
51: networkServiceInfo(f,service,tcp,80,serviceaccount)Rank: 0.02286
Damp: 1.0 Likelihood: 1.0
1.0
52: vulExists(f,vulid5,service,remoteExploit,privEscalation)Rank: 0.02286
Damp: 1.0 Likelihood: 0.8
1.0
4: RULE 5 (multi-hop access)Rank: 0.02561
Damp: 1.0 Likelihood: 0.5
0.08192
5: hacl(e,f,tcp,80)Rank: 0.02869
Damp: 1.0 Likelihood: 0.8
1.0
6: execCode(e,serviceaccount)Rank: 0.02869
Damp: 0.84096 Likelihood: 0.2
1.0
7: RULE 2 (remote exploit of a server program)Rank: 0.02703
Damp: 1.0 Likelihood: 1.0
0.2048
8: netAccess(e,tcp,80)Rank: 0.03028
Damp: 1.0 Likelihood: 0.0
1.0
49: networkServiceInfo(e,service,tcp,80,serviceaccount)Rank: 0.03028
Damp: 1.0 Likelihood: 1.0
1.0
50: vulExists(e,vulid4,service,remoteExploit,privEscalation)Rank: 0.03028
Damp: 1.0 Likelihood: 0.8
1.0
9: RULE 5 (multi-hop access)Rank: 0.00678
Damp: 1.0 Likelihood: 0.5
0.064
47: RULE 5 (multi-hop access)Rank: 0.02714
Damp: 1.0 Likelihood: 0.5
0.256
10: hacl(c,e,tcp,80)Rank: 0.0076
Damp: 1.0 Likelihood: 0.8
1.0
11: execCode(c,serviceaccount)Rank: 0.0122
Damp: 0.832 Likelihood: 0.2
1.0
12: RULE 2 (remote exploit of a server program)Rank: 0.01137
Damp: 1.0 Likelihood: 1.0
0.16
13: netAccess(c,tcp,80)Rank: 0.01273
Damp: 1.0 Likelihood: 0.0
1.0
45: networkServiceInfo(c,service,tcp,80,serviceaccount)Rank: 0.01273
Damp: 1.0 Likelihood: 1.0
1.0
46: vulExists(c,vulid2,service,remoteExploit,privEscalation)Rank: 0.01273
Damp: 1.0 Likelihood: 0.2
1.0
14: RULE 5 (multi-hop access)Rank: 0.00278
Damp: 1.0 Likelihood: 0.5
0.256
40: RULE 5 (multi-hop access)Rank: 0.00278
Damp: 1.0 Likelihood: 0.5
0.256
42: RULE 6 (direct network access)Rank: 0.0087
Damp: 1.0 Likelihood: 1.0
0.8
15: hacl(b,c,tcp,80)Rank: 0.00312
Damp: 1.0 Likelihood: 0.8
1.0
16: execCode(b,serviceaccount)Rank: 0.01611
Damp: 0.928 Likelihood: 0.2
1.0
17: RULE 2 (remote exploit of a server program)Rank: 0.01675
Damp: 1.0 Likelihood: 1.0
0.64
18: netAccess(b,tcp,80)Rank: 0.01877
Damp: 1.0 Likelihood: 0.0
1.0
38: networkServiceInfo(b,service,tcp,80,serviceaccount)Rank: 0.01877
Damp: 1.0 Likelihood: 1.0
1.0
39: vulExists(b,vulid1,service,remoteExploit,privEscalation)Rank: 0.01877
Damp: 1.0 Likelihood: 0.8
1.0
19: RULE 5 (multi-hop access)Rank: 0.0012
Damp: 1.0 Likelihood: 0.5
0.064
21: RULE 5 (multi-hop access)Rank: 0.00481
Damp: 1.0 Likelihood: 0.5
0.256
35: RULE 6 (direct network access)Rank: 0.01502
Damp: 1.0 Likelihood: 1.0
0.8
1.0
20: hacl(c,b,tcp,80)Rank: 0.00135
Damp: 1.0 Likelihood: 0.8
1.0
22: hacl(d,b,tcp,80)Rank: 0.00538
Damp: 1.0 Likelihood: 0.8
1.0
23: execCode(d,root)Rank: 0.0389
Damp: 0.928 Likelihood: 0.2
1.0
24: RULE 2 (remote exploit of a server program)Rank: 0.04044
Damp: 1.0 Likelihood: 1.0
0.64
25: netAccess(d,tcp,80)Rank: 0.04531
Damp: 1.0 Likelihood: 0.0
1.0
33: networkServiceInfo(d,service,tcp,80,root)Rank: 0.04531
Damp: 1.0 Likelihood: 1.0
1.0
34: vulExists(d,vulid1,service,remoteExploit,privEscalation)Rank: 0.04531
Damp: 1.0 Likelihood: 0.8
1.0
26: RULE 5 (multi-hop access)Rank: 0.0116
Damp: 1.0 Likelihood: 0.5
0.256
28: RULE 5 (multi-hop access)Rank: 0.0029
Damp: 1.0 Likelihood: 0.5
0.064
30: RULE 6 (direct network access)Rank: 0.03625
Damp: 1.0 Likelihood: 1.0
0.8
1.0
27: hacl(b,d,tcp,80)Rank: 0.013
Damp: 1.0 Likelihood: 0.8
1.0
1.0
29: hacl(c,d,tcp,80)Rank: 0.00325
Damp: 1.0 Likelihood: 0.8
1.0
31: hacl(a,d,tcp,80)Rank: 0.04061
Damp: 1.0 Likelihood: 0.8
1.0
44: attackerLocated(a)Rank: 0.06718
Damp: 1.0 Likelihood: 1.0
1.0
1.0
36: hacl(a,b,tcp,80)Rank: 0.01682
Damp: 1.0 Likelihood: 0.8
1.0
1.0
41: hacl(d,c,tcp,80)Rank: 0.00312
Damp: 1.0 Likelihood: 0.8
1.0
1.0
43: hacl(a,c,tcp,80)Rank: 0.00974
Damp: 1.0 Likelihood: 0.8
1.0 1.0
48: hacl(d,e,tcp,80)Rank: 0.0304
Damp: 1.0 Likelihood: 0.8
1.0
Figure D.1: Attack graph for the Experiment 2b scenario
DRDC Ottawa TM 2008-180 29

This page intentionally left blank.
30 DRDC Ottawa TM 2008-180

Annex E: Experiment 3 Attack Graph1: execCode(commServer,root)
Rank: 0.01053Damp: 1.0 Likelihood: 0.0
2: RULE 2 (remote exploit of a server program)Rank: 0.01109
Damp: 1.0 Likelihood: 1.0
0.0096
3: netAccess(commServer,iccpProtocol,iccpPort)Rank: 0.01169
Damp: 1.0 Likelihood: 0.0
1.0
144: networkServiceInfo(commServer,iccpService,iccpProtocol,iccpPort,root)Rank: 0.01169
Damp: 1.0 Likelihood: 1.0
1.0
145: vulExists(commServer,iccpVulnerability,iccpService,remoteExploit,privEscalation)Rank: 0.01169
Damp: 1.0 Likelihood: 0.8
1.0
4: RULE 5 (multi-hop access)Rank: 0.01231
Damp: 1.0 Likelihood: 0.5
0.012
5: hacl(dataHistorian,commServer,iccpProtocol,iccpPort)Rank: 0.01297
Damp: 1.0 Likelihood: 1.0
1.0
6: execCode(dataHistorian,root)Rank: 0.01297
Damp: 1.0 Likelihood: 0.0
1.0
7: RULE 2 (remote exploit of a server program)Rank: 0.01366
Damp: 1.0 Likelihood: 1.0
0.024
8: netAccess(dataHistorian,sqlProtocol,sqlPort)Rank: 0.01438
Damp: 1.0 Likelihood: 0.0
1.0
142: networkServiceInfo(dataHistorian,oracleSqlServer,sqlProtocol,sqlPort,root)Rank: 0.01438
Damp: 1.0 Likelihood: 1.0
1.0
143: vulExists(dataHistorian,oracleSqlVulnerability,oracleSqlServer,remoteExploit,privEscalation)Rank: 0.01438
Damp: 1.0 Likelihood: 0.4
1.0
9: RULE 5 (multi-hop access)Rank: 0.00446
Damp: 1.0 Likelihood: 0.5
0.025
140: RULE 5 (multi-hop access)Rank: 0.01069
Damp: 1.0 Likelihood: 0.5
0.06
141: hacl(citrixServer,dataHistorian,sqlProtocol,sqlPort)Rank: 0.01596
Damp: 1.0 Likelihood: 1.0
1.0
11: execCode(citrixServer,normalAccount)Rank: 0.00559
Damp: 1.0 Likelihood: 0.0
1.0
12: RULE 0 (When a principal is compromised any machine he has an account on will also be compromised)Rank: 0.00589
Damp: 1.0 Likelihood: 0.5
0.05
13: canAccessHost(citrixServer)Rank: 0.0062
Damp: 1.0 Likelihood: 0.0
1.0
65: principalCompromised(ordinaryEmployee)Rank: 0.00976
Damp: 1.0 Likelihood: 0.0
1.0
139: hasAccount(ordinaryEmployee,citrixServer,normalAccount)Rank: 0.00796
Damp: 1.0 Likelihood: 1.0
1.0
14: RULE 7 (Access a host through executing code on the machine)Rank: 0.00212
Damp: 1.0 Likelihood: 1.0
0.12
124: RULE 8 (Access a host through a log-in service)Rank: 0.00442
Damp: 1.0 Likelihood: 1.0
0.25
15: execCode(citrixServer,root)Rank: 0.01661
Damp: 1.0 Likelihood: 0.0
1.0
16: RULE 4 (Trojan horse installation)Rank: 0.0175
Damp: 1.0 Likelihood: 0.2
0.12
17: accessFile(citrixServer,write,’/usr/local/share’)Rank: 0.01843
Damp: 1.0 Likelihood: 0.0
1.0
18: RULE 15 (NFS semantics)Rank: 0.01941
Damp: 1.0 Likelihood: 1.0
0.6
19: accessFile(fileServer,write,’/export’)Rank: 0.02511
Damp: 1.0 Likelihood: 0.0
1.0
123: nfsMounted(citrixServer,’/usr/local/share’,fileServer,’/export’,read)Rank: 0.02045
Damp: 1.0 Likelihood: 1.0
1.0
20: RULE 16 (NFS shell)Rank: 0.00085
Damp: 1.0 Likelihood: 0.6
0.03
23: RULE 16 (NFS shell)Rank: 0.01706
Damp: 1.0 Likelihood: 0.6
0.6
120: RULE 16 (NFS shell)Rank: 0.00853
Damp: 1.0 Likelihood: 0.6
0.3
1.0
21: hacl(citrixServer,fileServer,nfsProtocol,nfsPort)Rank: 0.0009
Damp: 1.0 Likelihood: 1.0
1.0
22: nfsExportInfo(fileServer,’/export’,write,citrixServer)Rank: 0.0009
Damp: 1.0 Likelihood: 1.0
1.0
24: hacl(webServer,fileServer,nfsProtocol,nfsPort)Rank: 0.01797
Damp: 1.0 Likelihood: 1.0
1.0
25: nfsExportInfo(fileServer,’/export’,write,webServer)Rank: 0.01797
Damp: 1.0 Likelihood: 1.0
1.0
26: execCode(webServer,apache)Rank: 0.0253
Damp: 1.0 Likelihood: 0.1
1.0
27: RULE 2 (remote exploit of a server program)Rank: 0.02665
Damp: 1.0 Likelihood: 1.0
1.0
28: netAccess(webServer,httpProtocol,httpPort)Rank: 0.02807
Damp: 1.0 Likelihood: 0.0
1.0
118: networkServiceInfo(webServer,httpd,httpProtocol,httpPort,apache)Rank: 0.02807
Damp: 1.0 Likelihood: 1.0
1.0
119: vulExists(webServer,’CAN-2002-0392’,httpd,remoteExploit,privEscalation)Rank: 0.02807
Damp: 1.0 Likelihood: 1.0
1.0
29: RULE 5 (multi-hop access)Rank: 0.00214
Damp: 1.0 Likelihood: 0.5
0.1
111: RULE 5 (multi-hop access)Rank: 0.00536
Damp: 1.0 Likelihood: 0.5
0.25
113: RULE 5 (multi-hop access)Rank: 0.00064
Damp: 1.0 Likelihood: 0.5
0.03
115: RULE 6 (direct network access)Rank: 0.02143
Damp: 1.0 Likelihood: 1.0
1.0
30: hacl(vpnServer,webServer,httpProtocol,httpPort)Rank: 0.00226
Damp: 1.0 Likelihood: 1.0
1.0
31: execCode(vpnServer,normalAccount)Rank: 0.00354
Damp: 0.84 Likelihood: 0.2
1.0
32: RULE 0 (When a principal is compromised any machine he has an account on will also be compromised)Rank: 0.00313
Damp: 1.0 Likelihood: 0.5
0.2
33: canAccessHost(vpnServer)Rank: 0.0033
Damp: 1.0 Likelihood: 0.0
1.0
1.0
110: hasAccount(ordinaryEmployee,vpnServer,normalAccount)Rank: 0.0033
Damp: 1.0 Likelihood: 1.0
1.0
34: RULE 8 (Access a host through a log-in service)Rank: 0.00348
Damp: 1.0 Likelihood: 1.0
1.0
35: netAccess(vpnServer,vpnProtocol,vpnPort)Rank: 0.00366
Damp: 1.0 Likelihood: 0.0
1.0
107: logInService(vpnServer,vpnProtocol,vpnPort)Rank: 0.00366
Damp: 1.0 Likelihood: 0.0
1.0
36: RULE 5 (multi-hop access)Rank: 0.00107
Damp: 1.0 Likelihood: 0.5
0.5
38: RULE 5 (multi-hop access)Rank: 0.00053
Damp: 1.0 Likelihood: 0.5
0.25
102: RULE 5 (multi-hop access)Rank: 0.00013
Damp: 1.0 Likelihood: 0.5
0.06
104: RULE 6 (direct network access)Rank: 0.00213
Damp: 1.0 Likelihood: 1.0
1.0
1.0
37: hacl(webServer,vpnServer,vpnProtocol,vpnPort)Rank: 0.00112
Damp: 1.0 Likelihood: 1.0
1.0
103: hacl(workStation,vpnServer,vpnProtocol,vpnPort)Rank: 0.0007
Damp: 1.0 Likelihood: 1.0
1.0
40: execCode(workStation,normalAccount)Rank: 0.02494
Damp: 0.8 Likelihood: 0.4
1.0
41: RULE 0 (When a principal is compromised any machine he has an account on will also be compromised)Rank: 0.00024
Damp: 1.0 Likelihood: 0.5
0.00576
72: RULE 3 (remote exploit for a client program)Rank: 0.02077
Damp: 1.0 Likelihood: 0.5
0.5
42: canAccessHost(workStation)Rank: 0.00025
Damp: 1.0 Likelihood: 0.0
1.0
73: hasAccount(ordinaryEmployee,workStation,normalAccount)Rank: 0.0312
Damp: 1.0 Likelihood: 1.0
1.0
1.0
43: RULE 7 (Access a host through executing code on the machine)Rank: 0.00018
Damp: 1.0 Likelihood: 1.0
0.12
49: RULE 8 (Access a host through a log-in service)Rank: 9e-05
Damp: 1.0 Likelihood: 1.0
0.06
44: execCode(workStation,root)Rank: 0.00411
Damp: 0.648 Likelihood: 0.4
1.0
45: RULE 4 (Trojan horse installation)Rank: 0.00281
Damp: 1.0 Likelihood: 0.2
0.12
46: accessFile(workStation,write,’/usr/local/share’)Rank: 0.00296
Damp: 1.0 Likelihood: 0.0
1.0
47: RULE 15 (NFS semantics)Rank: 0.00311
Damp: 1.0 Likelihood: 1.0
0.6
1.0
48: nfsMounted(workStation,’/usr/local/share’,fileServer,’/export’,read)Rank: 0.00328
Damp: 1.0 Likelihood: 1.0
1.0
50: netAccess(workStation,tcp,sshProtocol)Rank: 9e-05
Damp: 1.0 Likelihood: 0.0
1.0
61: logInService(workStation,tcp,sshProtocol)Rank: 9e-05
Damp: 1.0 Likelihood: 0.0
1.0
51: RULE 5 (multi-hop access)Rank: 3e-05
Damp: 1.0 Likelihood: 0.5
0.06
53: RULE 5 (multi-hop access)Rank: 3e-05
Damp: 1.0 Likelihood: 0.5
0.06
57: RULE 5 (multi-hop access)Rank: 1e-05
Damp: 1.0 Likelihood: 0.5
0.024
59: RULE 5 (multi-hop access)Rank: 3e-05
Damp: 1.0 Likelihood: 0.5
0.06
1.0
52: hacl(citrixServer,workStation,tcp,sshProtocol)Rank: 3e-05
Damp: 1.0 Likelihood: 1.0
1.0
54: hacl(fileServer,workStation,tcp,sshProtocol)Rank: 3e-05
Damp: 1.0 Likelihood: 1.0
1.0
55: execCode(fileServer,root)Rank: 0.00136
Damp: 0.912 Likelihood: 0.1
1.0
56: RULE 4 (Trojan horse installation)Rank: 0.00131
Damp: 1.0 Likelihood: 0.2
0.12
1.0
1.0
58: hacl(vpnServer,workStation,tcp,sshProtocol)Rank: 1e-05
Damp: 1.0 Likelihood: 1.0
1.0 1.0
60: hacl(workStation,workStation,tcp,sshProtocol)Rank: 3e-05
Damp: 1.0 Likelihood: 1.0
1.0
62: RULE 12 ()Rank: 0.0001
Damp: 1.0 Likelihood: 1.0
1.0
63: networkServiceInfo(workStation,sshd,tcp,sshProtocol,sshPort)Rank: 0.0001
Damp: 1.0 Likelihood: 1.0
1.0
66: RULE 10 (password sniffing)Rank: 0.00167
Damp: 1.0 Likelihood: 0.8
0.096
68: RULE 10 (password sniffing)Rank: 0.00167
Damp: 1.0 Likelihood: 0.8
0.096
70: RULE 11 (password sniffing)Rank: 0.00694
Damp: 1.0 Likelihood: 0.8
0.4
1.0
1.0
1.0
1.0
1.0
1.0
1.0
74: inCompetent(ordinaryEmployee)Rank: 0.02188
Damp: 1.0 Likelihood: 1.0
1.0
75: canAccessMaliciousInput(workStation)Rank: 0.02188
Damp: 1.0 Likelihood: 0.0
1.0
101: vulExists(workStation,browser_vulid,firefox,remoteExploit,privEscalation)Rank: 0.02188
Damp: 1.0 Likelihood: 1.0
1.0
76: RULE 21 (Browsing a malicious website)Rank: 0.01474
Damp: 1.0 Likelihood: 1.0
1.0
81: RULE 22 (Browsing a compromised website)Rank: 0.00071
Damp: 1.0 Likelihood: 0.4
0.048
85: RULE 22 (Browsing a compromised website)Rank: 0.00071
Damp: 1.0 Likelihood: 0.4
0.048
89: RULE 22 (Browsing a compromised website)Rank: 0.00028
Damp: 1.0 Likelihood: 0.4
0.0192
93: RULE 22 (Browsing a compromised website)Rank: 0.0059
Damp: 1.0 Likelihood: 0.4
0.4
97: RULE 22 (Browsing a compromised website)Rank: 0.00071
Damp: 1.0 Likelihood: 0.4
0.048
117: attackerLocated(internet)Rank: 0.04034
Damp: 1.0 Likelihood: 1.0
1.0
78: hacl(workStation,internet,httpProtocol,httpPort)Rank: 0.01553
Damp: 1.0 Likelihood: 1.0
1.0
99: isWebBrowser(firefox)Rank: 0.02428
Damp: 1.0 Likelihood: 1.0
1.0
100: installed(workStation,firefox)Rank: 0.02428
Damp: 1.0 Likelihood: 1.0
1.0
1.0
1.01.0
82: hacl(workStation,citrixServer,httpProtocol,httpPort)Rank: 0.00075
Damp: 1.0 Likelihood: 1.0
1.0
1.0
1.01.0
86: hacl(workStation,fileServer,httpProtocol,httpPort)Rank: 0.00075
Damp: 1.0 Likelihood: 1.0
1.0
1.0
1.01.0
90: hacl(workStation,vpnServer,httpProtocol,httpPort)Rank: 0.0003
Damp: 1.0 Likelihood: 1.0
1.0
1.0
1.01.0
114: hacl(workStation,webServer,httpProtocol,httpPort)Rank: 0.01253
Damp: 1.0 Likelihood: 1.0
1.0
1.0
1.01.0
98: hacl(workStation,workStation,httpProtocol,httpPort)Rank: 0.00075
Damp: 1.0 Likelihood: 1.0
1.0
1.0
1.0
1.0
105: hacl(internet,vpnServer,vpnProtocol,vpnPort)Rank: 0.00224
Damp: 1.0 Likelihood: 1.0
1.0
108: RULE 13 ()Rank: 0.00386
Damp: 1.0 Likelihood: 1.0
1.0
109: networkServiceInfo(vpnServer,vpnService,vpnProtocol,vpnPort,root)Rank: 0.00406
Damp: 1.0 Likelihood: 1.0
1.01.0
1.0
1.0
1.0
1.0
116: hacl(internet,webServer,httpProtocol,httpPort)Rank: 0.02257
Damp: 1.0 Likelihood: 1.0
1.0
1.0
121: hacl(workStation,fileServer,nfsProtocol,nfsPort)Rank: 0.00899
Damp: 1.0 Likelihood: 1.0
1.0
122: nfsExportInfo(fileServer,’/export’,write,workStation)Rank: 0.00899
Damp: 1.0 Likelihood: 1.0
1.0
125: netAccess(citrixServer,sshProtocol,sshPort)Rank: 0.00465
Damp: 1.0 Likelihood: 0.0
1.0
136: logInService(citrixServer,sshProtocol,sshPort)Rank: 0.00465
Damp: 1.0 Likelihood: 0.0
1.0
126: RULE 5 (multi-hop access)Rank: 0.00055
Damp: 1.0 Likelihood: 0.5
0.06
128: RULE 5 (multi-hop access)Rank: 0.00055
Damp: 1.0 Likelihood: 0.5
0.06
130: RULE 5 (multi-hop access)Rank: 0.00092
Damp: 1.0 Likelihood: 0.5
0.1
132: RULE 5 (multi-hop access)Rank: 0.00231
Damp: 1.0 Likelihood: 0.5
0.25
134: RULE 5 (multi-hop access)Rank: 0.00055
Damp: 1.0 Likelihood: 0.5
0.06
1.0
127: hacl(citrixServer,citrixServer,sshProtocol,sshPort)Rank: 0.00058
Damp: 1.0 Likelihood: 1.0
1.0
1.0
129: hacl(fileServer,citrixServer,sshProtocol,sshPort)Rank: 0.00058
Damp: 1.0 Likelihood: 1.0
1.0
1.0
131: hacl(vpnServer,citrixServer,sshProtocol,sshPort)Rank: 0.00097
Damp: 1.0 Likelihood: 1.0
1.0
1.0
135: hacl(workStation,citrixServer,sshProtocol,sshPort)Rank: 0.00302
Damp: 1.0 Likelihood: 1.0
1.0
1.0
1.0
137: RULE 12 ()Rank: 0.0049
Damp: 1.0 Likelihood: 1.0
1.0
138: networkServiceInfo(citrixServer,sshd,sshProtocol,sshPort,root)Rank: 0.00516
Damp: 1.0 Likelihood: 1.0
1.0
1.0
1.0
Figure E.1: Attack graph for the Experiment 3 scenario
DRDC Ottawa TM 2008-180 31
References
[1] Sawilla, R. E. and Ou, X. (2008), Identifying Critical Attack Assets in DependencyAttack Graphs,Proceedings of the 13th European Symposium on Research inComputer Security, 13, 18–34.
[2] Sawilla, R. E. and Ou, X. (2007), Googling Attack Graphs,(DRDC Ottawa TM2007-205) Defence R&D Canada – Ottawa.
[3] Ammann, P., Wijesekera, D., and Kaushik, S. (2002), Scalable, Graph-BasedNetwork Vulnerability Analysis, InProceedings of 9th ACM Conference onComputer and Communications Security, Washington, DC.
[4] Ingols, K., Lippmann, R., and Piwowarski, K. (2006), Practical Attack GraphGeneration for Network Defense, In22nd Annual Computer Security ApplicationsConference (ACSAC), Miami Beach, Florida.
[5] Noel, S., Jajodia, S., O’Berry, B., and Jacobs, M. (2003), Efficient Minimum-CostNetwork Hardening via Exploit Dependency Graphs, In19th Annual ComputerSecurity Applications Conference (ACSAC).
[6] Ou, X., Boyer, W. F., and McQueen, M. A. (2006), A scalableapproach to attackgraph generation, In13th ACM Conference on Computer and CommunicationsSecurity (CCS), pp. 336–345.
[7] Phillips, C. and Swiler, L. P. (1998), A graph-based system for network-vulnerabilityanalysis, InNSPW ’98: Proceedings of the 1998 workshop on New securityparadigms, pp. 71–79, ACM Press.
[8] Sheyner, O., Haines, J., Jha, S., Lippmann, R., and Wing,J. M. (2002), Automatedgeneration and analysis of attack graphs, InProceedings of the 2002 IEEESymposium on Security and Privacy, pp. 254–265.
[9] Noel, S. and Jajodia, S. (2004), Managing attack graph complexity through visualhierarchical aggregation, InVizSEC/DMSEC ’04: Proceedings of the 2004 ACMworkshop on Visualization and data mining for computer security, pp. 109–118,New York, NY, USA: ACM Press.
[10] Noel, S., Jacobs, M., Kalapa, P., and Jajodia, S. (2005), Multiple Coordinated Viewsfor Network Attack Graphs, InIEEE Workshop on Visualization for ComputerSecurity (VizSEC 2005).
[11] Lippmann, R., Williams, L., and Ingols, K. (2007), An Interactive Attack GraphCascade and Reachability Display, InIEEE Workshop on Visualization for ComputerSecurity (VizSEC 2007).
32 DRDC Ottawa TM 2008-180

[12] Page, L., Brin, S., Motwani, R., and Winograd, T. (1998), The PageRank CitationRanking: Bringing Order to the Web, Technical Report Stanford Digital LibraryTechnologies Project.
[13] Mehta, V., Bartzis, C., Zhu, H., Clarke, E., and Wing, J.(2006), Ranking AttackGraphs, InProceedings of Recent Advances in Intrusion Detection (RAID).
[14] Sheyner, O. (2004), Scenario Graphs and Attack Graphs,Ph.D. thesis, CarnegieMellon.
[15] Swiler, L. P., Phillips, C., Ellis, D., and Chakerian, S. (2001), Computer-AttackGraph Generation Tool, InDARPA Information Survivability Conference andExposition (DISCEX II’01), Vol. 2.
[16] Meyer, C. D. (2000), Matrix analysis and applied linearalgebra, Philadelphia, PA,USA: Society for Industrial and Applied Mathematics.
[17] Bianchini, M., Gori, M., and Scarselli, F. (2005), Inside PageRank,ACM Trans.Inter. Tech., 5(1), 92–128.
[18] Ellson, J., Gansner, E. R., Koutsofios, E., North, S. C.,and Woodhull, G. (2001),Graphviz - Open Source Graph Drawing Tools,Graph Drawing, pp. 483–484.
[19] Wang, L., Singhal, A., and Jajodia, S. (2007), Measuring Network Security UsingAttack Graphs, InThird Workshop on Quality of Protection (QoP).
[20] Dewri, R., Poolsappasit, N., Ray, I., and Whitley, D. (2007), Optimal SecurityHardening Using Multi-objective Optimization on Attack Tree Models of Networks,In 14th ACM Conference on Computer and Communications Security (CCS).
[21] Jha, S., Sheyner, O., and Wing, J. M. (2002), Two Formal Analyses of AttackGraphs, InProceedings of the 15th IEEE Computer Security Foundations Workshop,pp. 49–63, Nova Scotia, Canada.
[22] Homer, J., Varikuti, A., Ou, X., and McQueen, M. A. (2008), Improving AttackGraph Visualization through Data Reduction and Attack Grouping, InThe 5thInternational Workshop on Visualization for Cyber Security (VizSEC).
DRDC Ottawa TM 2008-180 33