identifying cost-effective technical report - nrel · identifying cost-effective residential energy...
TRANSCRIPT
Technical Report NREL/TP-7A2-48267 June 2010
Identifying Cost-Effective Residential Energy Efficiency Opportunities for the Kauai Island Utility Cooperative S. Busche and S. Hockett
National Renewable Energy Laboratory 1617 Cole Boulevard, Golden, Colorado 80401-3393 303-275-3000 • www.nrel.gov
NREL is a national laboratory of the U.S. Department of Energy Office of Energy Efficiency and Renewable Energy Operated by the Alliance for Sustainable Energy, LLC
Contract No. DE-AC36-08-GO28308
Technical Report NREL/TP-7A2-48267 June 2010
Identifying Cost-Effective Residential Energy Efficiency Opportunities for the Kauai Island Utility Cooperative S. Busche and S. Hockett
Prepared under Task No. IDHW9170
NOTICE
This report was prepared as an account of work sponsored by an agency of the United States government. Neither the United States government nor any agency thereof, nor any of their employees, makes any warranty, express or implied, or assumes any legal liability or responsibility for the accuracy, completeness, or usefulness of any information, apparatus, product, or process disclosed, or represents that its use would not infringe privately owned rights. Reference herein to any specific commercial product, process, or service by trade name, trademark, manufacturer, or otherwise does not necessarily constitute or imply its endorsement, recommendation, or favoring by the United States government or any agency thereof. The views and opinions of authors expressed herein do not necessarily state or reflect those of the United States government or any agency thereof.
Available electronically at http://www.osti.gov/bridge
Available for a processing fee to U.S. Department of Energy and its contractors, in paper, from:
U.S. Department of Energy Office of Scientific and Technical Information P.O. Box 62 Oak Ridge, TN 37831-0062 phone: 865.576.8401 fax: 865.576.5728 email: mailto:[email protected]
Available for sale to the public, in paper, from: U.S. Department of Commerce National Technical Information Service 5285 Port Royal Road Springfield, VA 22161 phone: 800.553.6847 fax: 703.605.6900 email: [email protected] online ordering: http://www.ntis.gov/ordering.htm
Printed on paper containing at least 50% wastepaper, including 20% postconsumer waste
iii
Acknowledgments
This report was produced with funding from, and in coordination with, the U.S. Department of Energy (DOE). The authors would like to acknowledge the guidance provided by Elizabeth Doris, without which this project could not have been completed. The authors would also like to thank Ray Mierta, Kauai Island Utility Cooperative (KIUC), for sharing a significant amount of information on KIUC’s existing programs and energy use patterns on Kaua‘i and providing contextual background to ensure that this analysis was appropriate to the situation on Kaua‘i. During the review process, the authors benefitted from the input provided by Elizabeth Doris and Kari Burman. In addition to these reviewers, we appreciate the assistance of Karen Petersen in NREL’s Communications Office for her editing support. Of course, any remaining errors are the responsibility of the authors.
iv
List of Acronyms
AC air-conditioning CEC California Energy Commission CFL compact fluorescent lamp DBEDT Department of Business, Economic Development &
Tourism DHW domestic hot water DOE Department of Energy DSM demand-side management EB electronic ballast EEPS energy efficiency portfolio standard HB House Bill HE high-efficiency HCEI Hawai‘i Clean Energy Initiative HECO Hawaiian Electric Company HVAC heating, ventilation, and air-conditioning KIUC Kauai Island Utility Cooperative kWh kilowatt-hour LCOE levelized cost of energy M&V measurement and verification NPV net present value NTG net-to-gross ratio NREL National Renewable Energy Laboratory PUC Public Utilities Commission RAC room air-conditioning RPS renewable portfolio standard SB Senate Bill T&D transmission and distribution TRC Total Resource Cost test
v
Executive Summary
This analysis is an update to the Energy Efficiency Potential report completed by KEMA for the Kauai Island Utility Cooperative (KIUC) and identifies potential energy efficiency opportunities in the residential sector on Kaua‘i (KEMA 2005). The Total Resource Cost (TRC) test is used to determine which of the energy efficiency measures analyzed in the KEMA report are cost effective for KIUC to include in a residential energy efficiency program. As much as possible and appropriate, the data used in the KEMA study was updated to reflect the current context on Kaua‘i, including measure cost, energy prices, and market saturation.
Cost-effective energy efficiency opportunities remain in the residential sector for utility-funded energy efficiency programs. The following energy efficiency measures, separated by end use, receive a passing TRC score:
• Water heating
o Low-flow showerhead
o Pipe wrap
o Domestic hot water (DHW) temperature reduction
o ENERGY STAR clothes washer1
• Lighting
o Compact fluorescent lamps (CFLs)
o Halogen lamps
o T8 with electric ballast (2 lamp, 4-foot T8, replaced on burnout)
• Appliances
o High-efficiency refrigerator
o High-efficiency dishwasher
• High-efficiency pool pump and motor
There is a high awareness among Kaua‘i residents of the residential energy efficiency programs that KIUC currently offers, which currently focus on end uses similar to those listed above. However, the participation rate in these programs is lower than would be expected based on the opportunity for savings identified herein. Additional research into optimizing the marketing, incentives, and delivery mechanism may aid KIUC in garnering greater participation in either existing or new residential energy efficiency programs. Increasing the participation rate relative to program costs will increase the cost-effectiveness of utility-funded residential energy efficiency programs and may result in additional measures receiving passing TRC scores.
1 Energy savings from this measure result from a reduced need to heat water. However, when grouping measures into potential programs, this measure is included in an appliance program and not a water-heating-specific program because the marketing and delivery mechanism are more likely to align with a program incentivizing other high-efficiency appliances.
vi
Table of Contents List of Acronyms ........................................................................................................................................ ivExecutive Summary .................................................................................................................................... vTable of Contents ....................................................................................................................................... viList of Figures ........................................................................................................................................... viiList of Tables ............................................................................................................................................. viiIntroduction ................................................................................................................................................. 1Background ................................................................................................................................................. 1Methodology ................................................................................................................................................ 3TRC Scores .................................................................................................................................................. 6Program Options & Maximum Potential Savings .................................................................................. 10
Water Heating ..........................................................................................................................11Lighting ....................................................................................................................................12Appliances ................................................................................................................................13Pool Pump and Motors .............................................................................................................14
Program Development & Delivery ........................................................................................................... 15Best Practices ...........................................................................................................................16
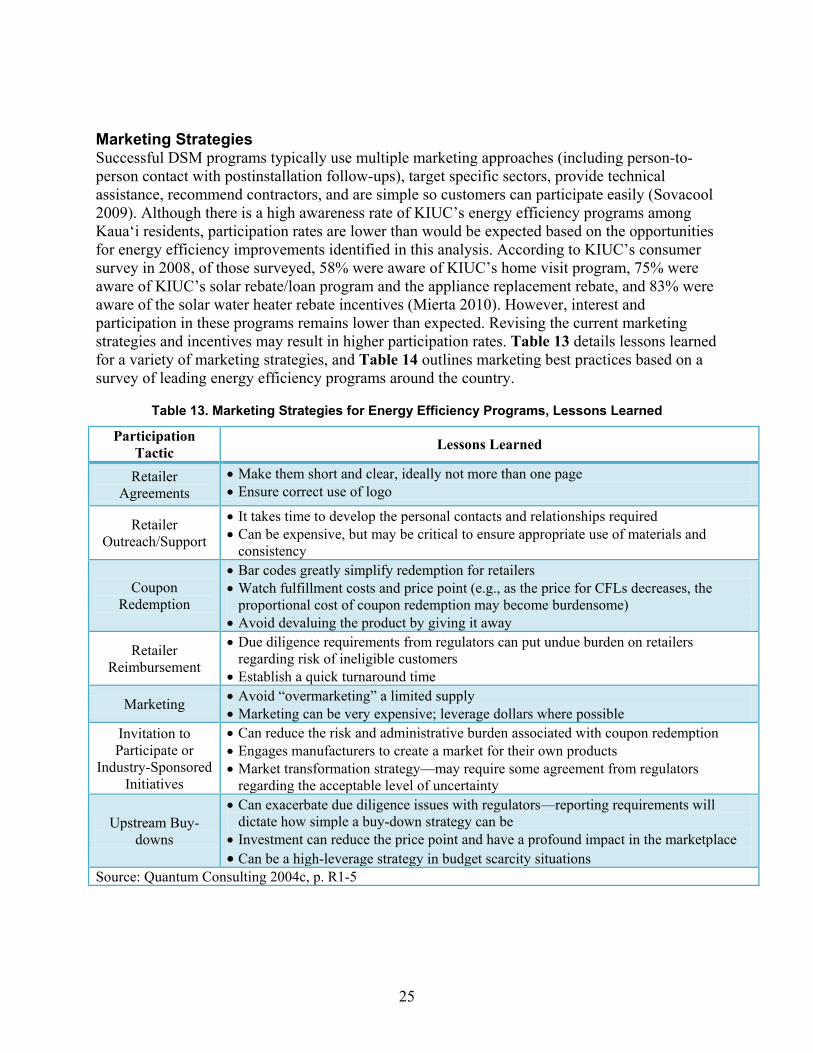
Low-Income Programs .......................................................................................................22Program Administration ...........................................................................................................23Partnerships ..............................................................................................................................24Marketing Strategies ................................................................................................................25Challenges ................................................................................................................................26
Conclusion ................................................................................................................................................. 27References ................................................................................................................................................. 29Appendix A: Energy Efficiency Measures .............................................................................................. 32Appendix B: Avoided Cost Adjustments ................................................................................................ 35
vii
List of Figures Figure 1. Annual Average Residential Energy Use by Island, 2008 ....................................................... 2Figure 2. Average Annual Residential Energy Use, Kauai and Statewide, 2000-2008 ......................... 2 List of Tables Table 1. Evaluation Perspective for Cost-Benefit Analysis Tests.......................................................... 4 Table 2. TRC Scores for Potential Residential Energy Efficiency Measures ........................................ 6 Table 3. Comparison of Measures that Passed the KEMA Methodology and the TRC in this
Update .................................................................................................................................................... 7 Table 4. Energy Efficiency Measures Ordered by LCOE ........................................................................ 9 Table 5. Potential Energy Efficiency Measures & Estimated Savings - Water Heating Program ..... 12 Table 6. Potential Energy Efficiency Measures & Estimated Savings – Lighting Program .............. 13 Table 7. Potential Energy Efficiency Measures & Estimated Savings – Appliance Program ........... 13 Table 8. Program Theory: Identifying Key Stakeholders, Program Barriers and Identifying
Program Strategies ............................................................................................................................ 16 Table 9. Key Impacts of Energy Efficiency Program Types ................................................................. 18 Table 10. Typical Incentive Types by Residential Market Sector ......................................................... 19 Table 11. Residential Program Best Practices ....................................................................................... 20 Table 12. Exemplary Residential Energy Efficiency Program Best Practices .................................... 21 Table 13. Marketing Strategies for Energy Efficiency Programs, Lessons Learned ......................... 25 Table 14. Advertising Best Practices ...................................................................................................... 26 Table 15. Direct Install Program 2009 Measure Installation Rates ...................................................... 27 Table 16. Avoided Costs from the 2005 KEMA Report .......................................................................... 35 Table 17. Avoided Costs, Adjustment #1 - Medium Costs .................................................................... 36 Table 18. Avoided Costs, Adjustment #2 - High Costs ......................................................................... 36
1
Introduction
In partnership with the U.S. Department of Energy (DOE), in 2008 the State of Hawai‘i established the Hawai‘i Clean Energy Initiative (HCEI) to facilitate the state’s transition to 70% clean energy by 2030. To successfully achieve these long-term goals, stakeholders throughout the islands are working together to reduce energy use, promote the development of renewable energy, and support the transition to a more self-reliant Hawai‘i. Interested in better understanding the energy efficiency potential on Kaua‘i, the Kauai Island Utility Cooperative (KIUC) requested that the National Renewable Energy Laboratory (NREL) analyze potential residential energy efficiency measures.
This report builds on existing efficiency reports, providing an economic analysis of potential residential energy efficiency measures suitable for Kaua‘i and information on developing residential energy efficiency programs. NREL identified opportunities for KIUC to cost-effectively reduce peak demand and aid residential customers in reducing their energy use through utility-supported energy efficiency programs. The measures were analyzed based on KIUC’s current program costs and delivery mechanisms. As such, those measures found to be cost effective in this analysis are cost effective at the program level if the program costs are similar to the existing program costs on a per-measure basis. Although beyond the scope of this analysis, further investigation into optimizing KIUC’s marketing and advertising strategies for residential energy efficiency programs may identify strategies to increase program participation per dollar invested, improving the cost-effectiveness of all measures.2
The first section provides background on energy use and efficiency programs on Kaua‘i. The second section details the methodology of the economic analysis, the results of which are presented in the third section. The fourth section describes the residential energy efficiency program options based on the results of the analysis, as well as the maximum potential savings from each end use. The fifth section discusses best practices in program development and implementation based on leading energy efficiency programs throughout the country and the challenges in determining potential program impacts. The final section summarizes the conclusions of this analysis.
This is not to say that the existing delivery and marketing methods are inefficient, but simply that further research by marketing and advertising specialists would aid KIUC in determining the most cost-effective strategies for driving program participation.
Background
Average residential energy use in Hawai‘i is much lower than in most states. In 2008, Hawai‘i ranked 8th lowest in the nation in annual residential electricity use (EIA 2010). Considering that residential customers in several states utilize other sources of energy (such as heating oil or natural gas for heating and/or cooking) in addition to electricity, if total residential energy use were combined, Hawai‘i would likely rank even better. In 2008 Hawai‘i’s average residential
2 If it’s possible for KIUC to increase program participation per dollar spent on marketing and administration, the cost-effectiveness of each measure would increase. As discussed later in this report, although there is high awareness among Kaua‘i residents of the efficiency programs KIUC offers, the participation rates are lower than would be expected based on the efficiency opportunities that exist.
2
electricity rates, at $0.32/kilowatt-hour (kWh), were higher than those in any other state—2.8 times higher than the average and more than 4.5 times higher than those in Idaho, which had the lowest electricity rates in the country (EIA 2010).
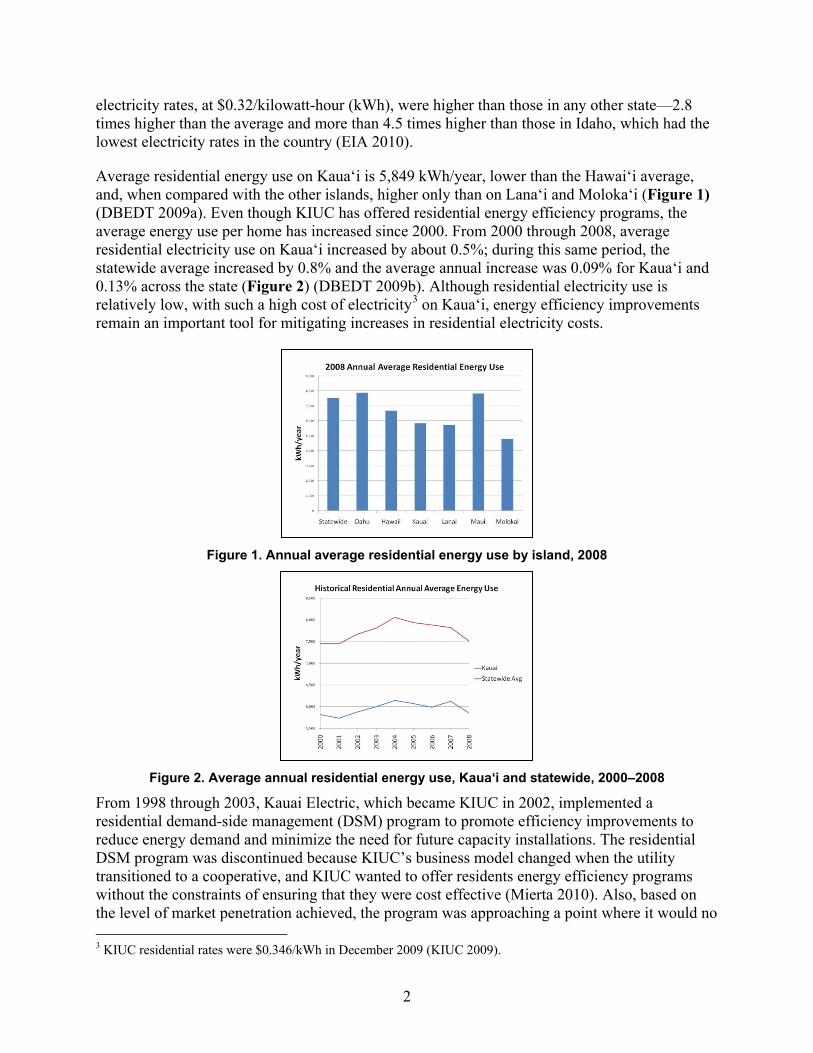
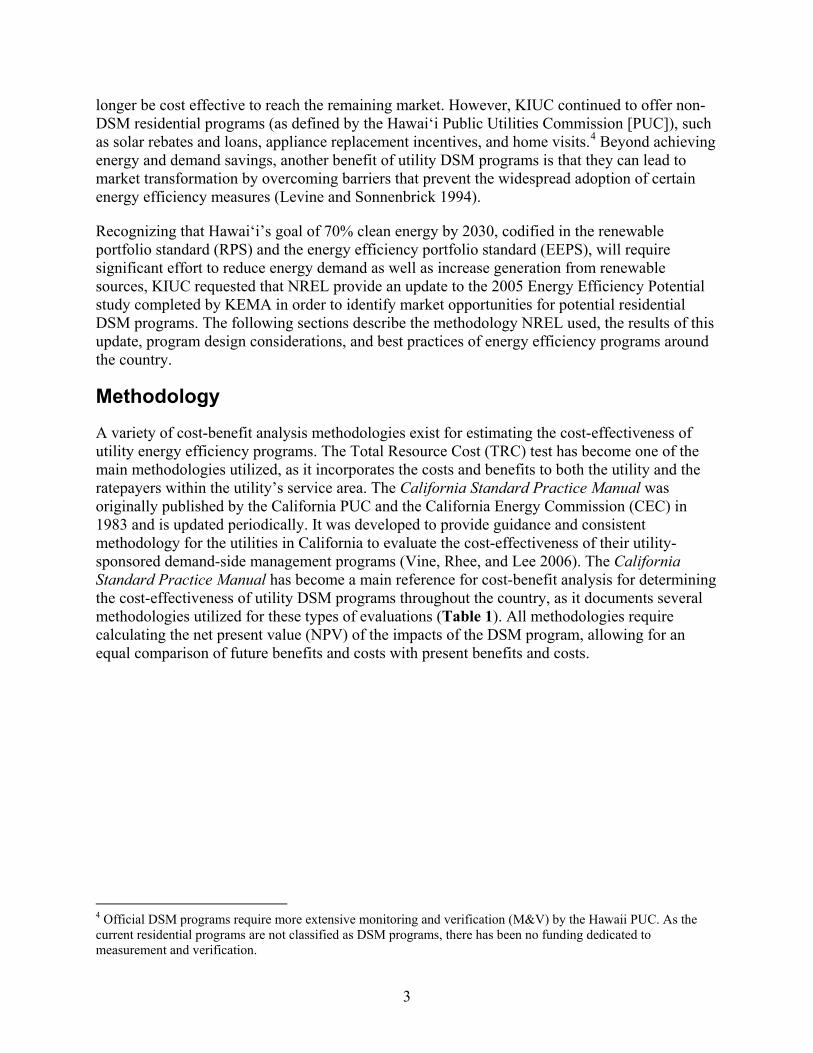
Average residential energy use on Kaua‘i is 5,849 kWh/year, lower than the Hawai‘i average, and, when compared with the other islands, higher only than on Lana‘i and Moloka‘i (Figure 1) (DBEDT 2009a). Even though KIUC has offered residential energy efficiency programs, the average energy use per home has increased since 2000. From 2000 through 2008, average residential electricity use on Kaua‘i increased by about 0.5%; during this same period, the statewide average increased by 0.8% and the average annual increase was 0.09% for Kaua‘i and 0.13% across the state (Figure 2) (DBEDT 2009b). Although residential electricity use is relatively low, with such a high cost of electricity3
on Kaua‘i, energy efficiency improvements remain an important tool for mitigating increases in residential electricity costs.
Figure 1. Annual average residential energy use by island, 2008
Figure 2. Average annual residential energy use, Kaua‘i and statewide, 2000–2008
From 1998 through 2003, Kauai Electric, which became KIUC in 2002, implemented a residential demand-side management (DSM) program to promote efficiency improvements to reduce energy demand and minimize the need for future capacity installations. The residential DSM program was discontinued because KIUC’s business model changed when the utility transitioned to a cooperative, and KIUC wanted to offer residents energy efficiency programs without the constraints of ensuring that they were cost effective (Mierta 2010). Also, based on the level of market penetration achieved, the program was approaching a point where it would no 3 KIUC residential rates were $0.346/kWh in December 2009 (KIUC 2009).
3
longer be cost effective to reach the remaining market. However, KIUC continued to offer non-DSM residential programs (as defined by the Hawai‘i Public Utilities Commission [PUC]), such as solar rebates and loans, appliance replacement incentives, and home visits.4
Recognizing that Hawai‘i’s goal of 70% clean energy by 2030, codified in the renewable portfolio standard (RPS) and the energy efficiency portfolio standard (EEPS), will require significant effort to reduce energy demand as well as increase generation from renewable sources, KIUC requested that NREL provide an update to the 2005 Energy Efficiency Potential study completed by KEMA in order to identify market opportunities for potential residential DSM programs. The following sections describe the methodology NREL used, the results of this update, program design considerations, and best practices of energy efficiency programs around the country.
Beyond achieving energy and demand savings, another benefit of utility DSM programs is that they can lead to market transformation by overcoming barriers that prevent the widespread adoption of certain energy efficiency measures (Levine and Sonnenbrick 1994).
Methodology
A variety of cost-benefit analysis methodologies exist for estimating the cost-effectiveness of utility energy efficiency programs. The Total Resource Cost (TRC) test has become one of the main methodologies utilized, as it incorporates the costs and benefits to both the utility and the ratepayers within the utility’s service area. The California Standard Practice Manual was originally published by the California PUC and the California Energy Commission (CEC) in 1983 and is updated periodically. It was developed to provide guidance and consistent methodology for the utilities in California to evaluate the cost-effectiveness of their utility-sponsored demand-side management programs (Vine, Rhee, and Lee 2006). The California Standard Practice Manual has become a main reference for cost-benefit analysis for determining the cost-effectiveness of utility DSM programs throughout the country, as it documents several methodologies utilized for these types of evaluations (Table 1). All methodologies require calculating the net present value (NPV) of the impacts of the DSM program, allowing for an equal comparison of future benefits and costs with present benefits and costs.
4 Official DSM programs require more extensive monitoring and verification (M&V) by the Hawaii PUC. As the current residential programs are not classified as DSM programs, there has been no funding dedicated to measurement and verification.
4
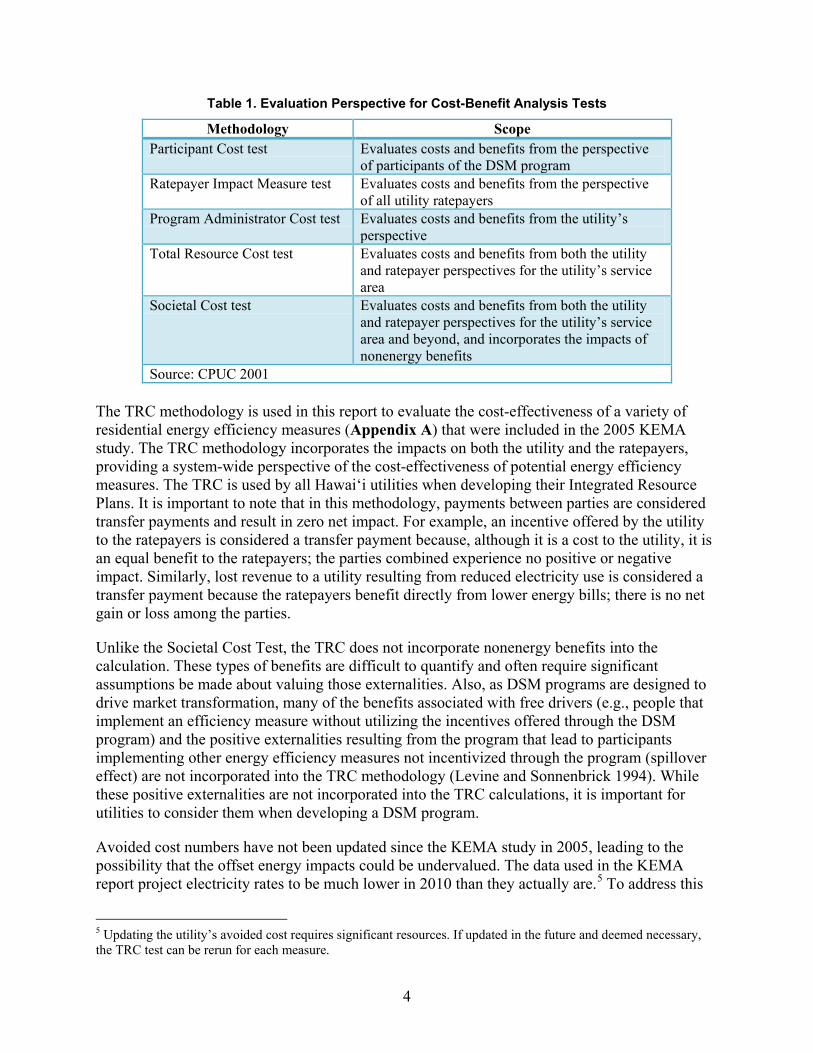
Table 1. Evaluation Perspective for Cost-Benefit Analysis Tests
Methodology Scope Participant Cost test Evaluates costs and benefits from the perspective
of participants of the DSM program Ratepayer Impact Measure test Evaluates costs and benefits from the perspective
of all utility ratepayers Program Administrator Cost test Evaluates costs and benefits from the utility’s
perspective Total Resource Cost test Evaluates costs and benefits from both the utility
and ratepayer perspectives for the utility’s service area
Societal Cost test Evaluates costs and benefits from both the utility and ratepayer perspectives for the utility’s service area and beyond, and incorporates the impacts of nonenergy benefits
Source: CPUC 2001 The TRC methodology is used in this report to evaluate the cost-effectiveness of a variety of residential energy efficiency measures (Appendix A) that were included in the 2005 KEMA study. The TRC methodology incorporates the impacts on both the utility and the ratepayers, providing a system-wide perspective of the cost-effectiveness of potential energy efficiency measures. The TRC is used by all Hawai‘i utilities when developing their Integrated Resource Plans. It is important to note that in this methodology, payments between parties are considered transfer payments and result in zero net impact. For example, an incentive offered by the utility to the ratepayers is considered a transfer payment because, although it is a cost to the utility, it is an equal benefit to the ratepayers; the parties combined experience no positive or negative impact. Similarly, lost revenue to a utility resulting from reduced electricity use is considered a transfer payment because the ratepayers benefit directly from lower energy bills; there is no net gain or loss among the parties.
Unlike the Societal Cost Test, the TRC does not incorporate nonenergy benefits into the calculation. These types of benefits are difficult to quantify and often require significant assumptions be made about valuing those externalities. Also, as DSM programs are designed to drive market transformation, many of the benefits associated with free drivers (e.g., people that implement an efficiency measure without utilizing the incentives offered through the DSM program) and the positive externalities resulting from the program that lead to participants implementing other energy efficiency measures not incentivized through the program (spillover effect) are not incorporated into the TRC methodology (Levine and Sonnenbrick 1994). While these positive externalities are not incorporated into the TRC calculations, it is important for utilities to consider them when developing a DSM program.
Avoided cost numbers have not been updated since the KEMA study in 2005, leading to the possibility that the offset energy impacts could be undervalued. The data used in the KEMA report project electricity rates to be much lower in 2010 than they actually are.5
5 Updating the utility’s avoided cost requires significant resources. If updated in the future and deemed necessary, the TRC test can be rerun for each measure.
To address this
5
discrepancy, TRC scores were run for each measure using the 2005 avoided costs (the “low” scenario), a medium scenario, and a high scenario (see Appendix B for further explanation). This sensitivity analysis demonstrated that the TRC scores changed very little between the three avoided costs scenarios. In fact, between the high and medium scenarios, only one measure changed from a passing TRC score to a failing score.
To adjust for changes in the market over the last five years, the cost and energy savings data points for each measure were updated or verified by researching the cost to purchase the various products on Kaua‘i and the energy savings for each measure. For the majority of the measures, this was completed by contacting either the Home Depot or Sears on Kaua‘i, the two main suppliers of appliances and other home improvement goods. For specialty items, such as the pool pump and motor, local distributors were contacted. The load profiles for each end use, end use peak percentage, base case equipment, equipment life, and technology saturation remain the same as in the KEMA report.6 The total number of houses was updated based on the number of residential meters (Mierta 2010). The ratio of single family houses and multifamily units was determined by utilizing the ratio established in previous HCEI work (BAH 2010). The percentage of homes to which the measure is applicable, the percentage of homes that have not yet implemented the measure,7
Average program costs were estimated based on the historical costs of KIUC’s residential energy efficiency programs between 2007 and 2009 ($68/participant on average) (Mierta 2010). Although the program costs will vary for each measure, when various measures are rolled together into a program, the historical average program cost provides a realistic estimate of the potential costs to KIUC to implement the measures. Program costs are highly dependent on the number of participants and the program design, as discussed in the Program Development & Delivery section.
and the percentage of homes in which it would be feasible to implement the efficiency measure remain the same as in the KEMA report.
A 9% discount rate was used in the model, based on the discount rate used by KIUC in the 2008 Integrated Resource Plan (B&V 2008). A net-to-gross (NTG) ratio of 85% was used, as it is the NTG used by KIUC in its Annual Program Accomplishments and Surcharge Reports (Mierta 2010). The NTG ratio represents the number of participants that are driven by the program to implement the measure that would not have otherwise done so, while excluding free riders.
Unlike incentives provided by the utility, state, and federal incentives are considered a positive payment to ratepayers in a typical TRC methodology. However, state and federal incentives are not included in this analysis due to uncertainty surrounding funding longevity and when the program would be implemented by KIUC. As such, the TRC score for any measure for which a ratepayer could utilize a state or federal incentive would increase accordingly.
6 While the base case equipment may be more efficient than it was five years ago, until a residential appliance survey can be completed, no assumption is made as to how the market has changed on Kaua‘i. 7 Ibid.
6
TRC Scores
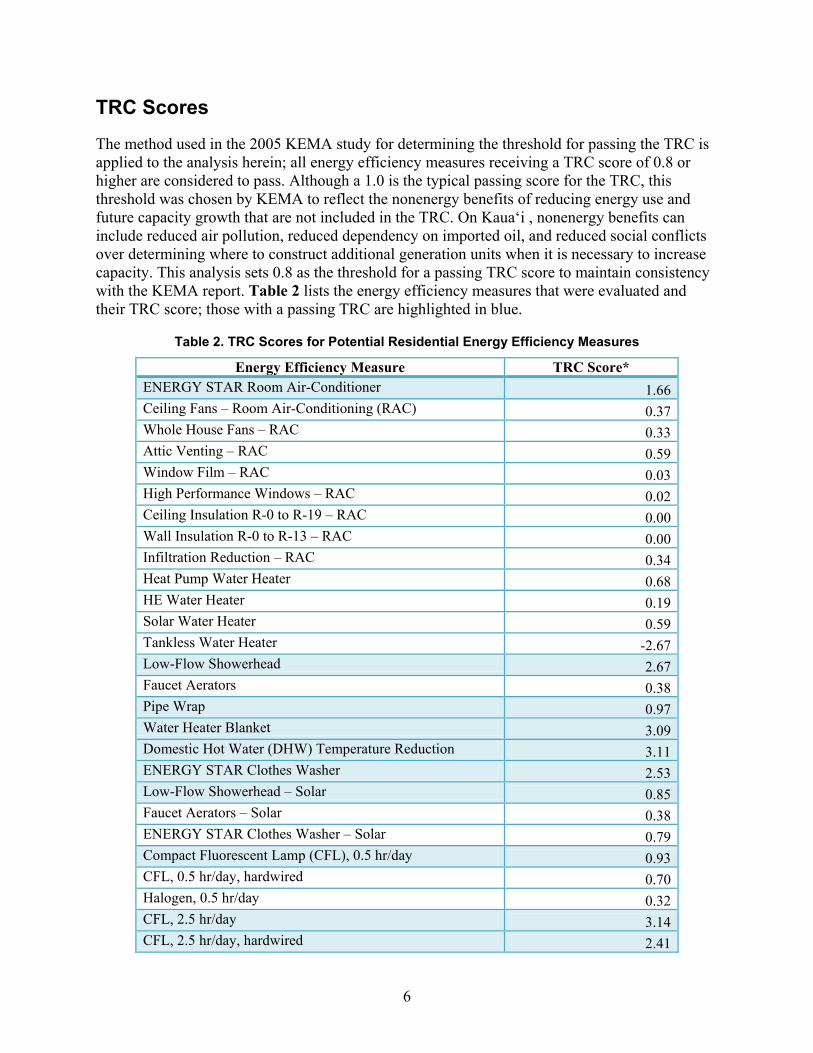
The method used in the 2005 KEMA study for determining the threshold for passing the TRC is applied to the analysis herein; all energy efficiency measures receiving a TRC score of 0.8 or higher are considered to pass. Although a 1.0 is the typical passing score for the TRC, this threshold was chosen by KEMA to reflect the nonenergy benefits of reducing energy use and future capacity growth that are not included in the TRC. On Kaua‘i , nonenergy benefits can include reduced air pollution, reduced dependency on imported oil, and reduced social conflicts over determining where to construct additional generation units when it is necessary to increase capacity. This analysis sets 0.8 as the threshold for a passing TRC score to maintain consistency with the KEMA report. Table 2 lists the energy efficiency measures that were evaluated and their TRC score; those with a passing TRC are highlighted in blue.
Table 2. TRC Scores for Potential Residential Energy Efficiency Measures
Energy Efficiency Measure TRC Score* ENERGY STAR Room Air-Conditioner 1.66 Ceiling Fans – Room Air-Conditioning (RAC) 0.37 Whole House Fans – RAC 0.33 Attic Venting – RAC 0.59 Window Film – RAC 0.03 High Performance Windows – RAC 0.02 Ceiling Insulation R-0 to R-19 – RAC 0.00 Wall Insulation R-0 to R-13 – RAC 0.00 Infiltration Reduction – RAC 0.34 Heat Pump Water Heater 0.68 HE Water Heater 0.19 Solar Water Heater 0.59 Tankless Water Heater -2.67 Low-Flow Showerhead 2.67 Faucet Aerators 0.38 Pipe Wrap 0.97 Water Heater Blanket 3.09 Domestic Hot Water (DHW) Temperature Reduction 3.11 ENERGY STAR Clothes Washer 2.53 Low-Flow Showerhead – Solar 0.85 Faucet Aerators – Solar 0.38 ENERGY STAR Clothes Washer – Solar 0.79 Compact Fluorescent Lamp (CFL), 0.5 hr/day 0.93 CFL, 0.5 hr/day, hardwired 0.70 Halogen, 0.5 hr/day 0.32 CFL, 2.5 hr/day 3.14 CFL, 2.5 hr/day, hardwired 2.41
7
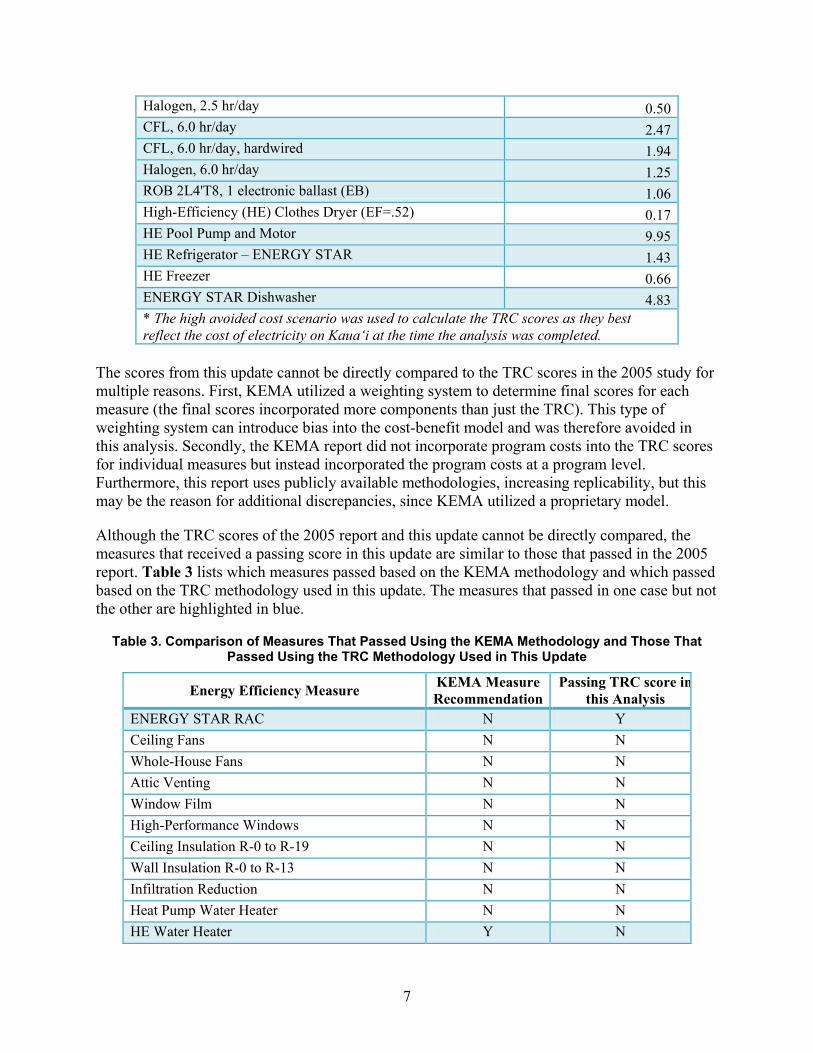
Halogen, 2.5 hr/day 0.50 CFL, 6.0 hr/day 2.47 CFL, 6.0 hr/day, hardwired 1.94 Halogen, 6.0 hr/day 1.25 ROB 2L4'T8, 1 electronic ballast (EB) 1.06 High-Efficiency (HE) Clothes Dryer (EF=.52) 0.17 HE Pool Pump and Motor 9.95 HE Refrigerator – ENERGY STAR 1.43 HE Freezer 0.66 ENERGY STAR Dishwasher 4.83 * The high avoided cost scenario was used to calculate the TRC scores as they best reflect the cost of electricity on Kaua‘i at the time the analysis was completed.
The scores from this update cannot be directly compared to the TRC scores in the 2005 study for multiple reasons. First, KEMA utilized a weighting system to determine final scores for each measure (the final scores incorporated more components than just the TRC). This type of weighting system can introduce bias into the cost-benefit model and was therefore avoided in this analysis. Secondly, the KEMA report did not incorporate program costs into the TRC scores for individual measures but instead incorporated the program costs at a program level. Furthermore, this report uses publicly available methodologies, increasing replicability, but this may be the reason for additional discrepancies, since KEMA utilized a proprietary model.
Although the TRC scores of the 2005 report and this update cannot be directly compared, the measures that received a passing score in this update are similar to those that passed in the 2005 report. Table 3 lists which measures passed based on the KEMA methodology and which passed based on the TRC methodology used in this update. The measures that passed in one case but not the other are highlighted in blue.
Table 3. Comparison of Measures That Passed Using the KEMA Methodology and Those That Passed Using the TRC Methodology Used in This Update
Energy Efficiency Measure KEMA Measure Recommendation
Passing TRC score in this Analysis
ENERGY STAR RAC N Y Ceiling Fans N N Whole-House Fans N N Attic Venting N N Window Film N N High-Performance Windows N N Ceiling Insulation R-0 to R-19 N N Wall Insulation R-0 to R-13 N N Infiltration Reduction N N Heat Pump Water Heater N N HE Water Heater Y N
8
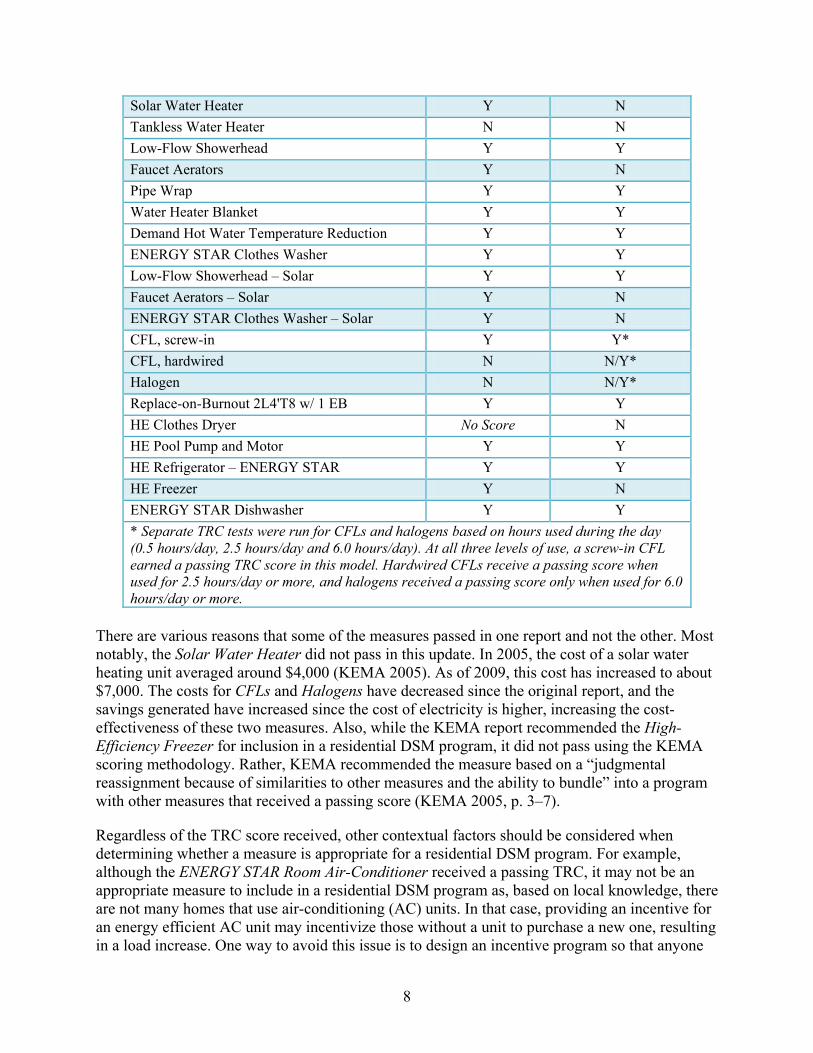
Solar Water Heater Y N Tankless Water Heater N N Low-Flow Showerhead Y Y Faucet Aerators Y N Pipe Wrap Y Y Water Heater Blanket Y Y Demand Hot Water Temperature Reduction Y Y ENERGY STAR Clothes Washer Y Y Low-Flow Showerhead – Solar Y Y Faucet Aerators – Solar Y N ENERGY STAR Clothes Washer – Solar Y N CFL, screw-in Y Y* CFL, hardwired N N/Y* Halogen N N/Y* Replace-on-Burnout 2L4'T8 w/ 1 EB Y Y HE Clothes Dryer No Score N HE Pool Pump and Motor Y Y HE Refrigerator – ENERGY STAR Y Y HE Freezer Y N ENERGY STAR Dishwasher Y Y * Separate TRC tests were run for CFLs and halogens based on hours used during the day (0.5 hours/day, 2.5 hours/day and 6.0 hours/day). At all three levels of use, a screw-in CFL earned a passing TRC score in this model. Hardwired CFLs receive a passing score when used for 2.5 hours/day or more, and halogens received a passing score only when used for 6.0 hours/day or more.
There are various reasons that some of the measures passed in one report and not the other. Most notably, the Solar Water Heater did not pass in this update. In 2005, the cost of a solar water heating unit averaged around $4,000 (KEMA 2005). As of 2009, this cost has increased to about $7,000. The costs for CFLs and Halogens have decreased since the original report, and the savings generated have increased since the cost of electricity is higher, increasing the cost-effectiveness of these two measures. Also, while the KEMA report recommended the High-Efficiency Freezer for inclusion in a residential DSM program, it did not pass using the KEMA scoring methodology. Rather, KEMA recommended the measure based on a “judgmental reassignment because of similarities to other measures and the ability to bundle” into a program with other measures that received a passing score (KEMA 2005, p. 3–7).
Regardless of the TRC score received, other contextual factors should be considered when determining whether a measure is appropriate for a residential DSM program. For example, although the ENERGY STAR Room Air-Conditioner received a passing TRC, it may not be an appropriate measure to include in a residential DSM program as, based on local knowledge, there are not many homes that use air-conditioning (AC) units. In that case, providing an incentive for an energy efficient AC unit may incentivize those without a unit to purchase a new one, resulting in a load increase. One way to avoid this issue is to design an incentive program so that anyone
9
who chooses to participate must trade in an old AC unit in order to receive any incentive for a new ENERGY STAR AC unit. This holds true for all appliance replacement programs; if the program does not require that the old appliance be turned in, then there is no way to ensure that the program is not simply subsidizing the purchase of a new appliance in a home that does not currently have that appliance. Furthermore, the household may continue to use the old appliance and may then have two of the appliances operating.8
Although some of these efficiency measures do not pass the TRC test and are not cost-effective measures for the utility to support through a residential DSM program, they may still be cost effective for individuals to implement on their own. For example, while a utility program to incentivize installation of solar water heating systems is not cost effective according to the TRC test (i.e., the costs to the utility and residents combined are considered to outweigh the energy savings benefits), it may be cost effective for individual homeowners to install solar water heating systems on their own. Based on a simple payback model, at current energy rates, it will take about eight to nine years for an individual to recoup the up-front investment on a solar water heating system. According to life cycle analysis, solar water heaters are cost effective at any location in Hawai‘i for a homeowner (Walker 2008).
In both cases, the utility will have increased instead of decreased the load for that household. Requiring participants to exchange or recycle their old appliances before receiving the rebate does add a burden of action on the participants, which, if the incentive is not sufficiently high, may reduce the number of participants.
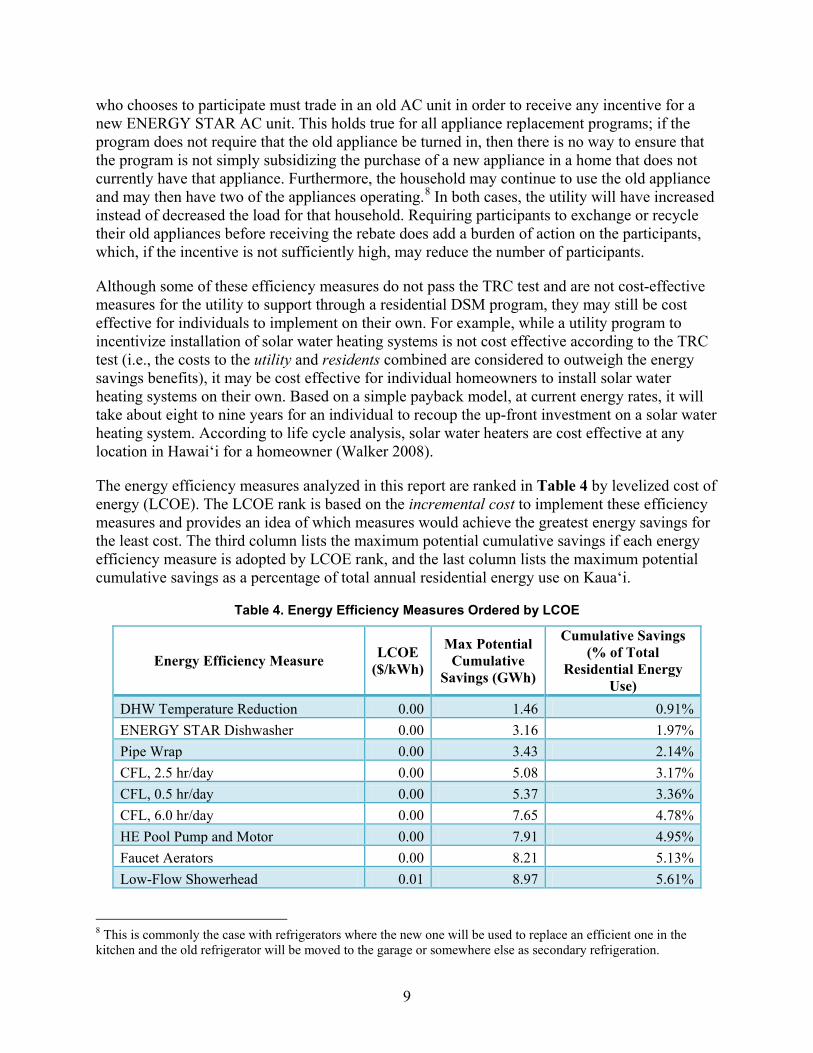
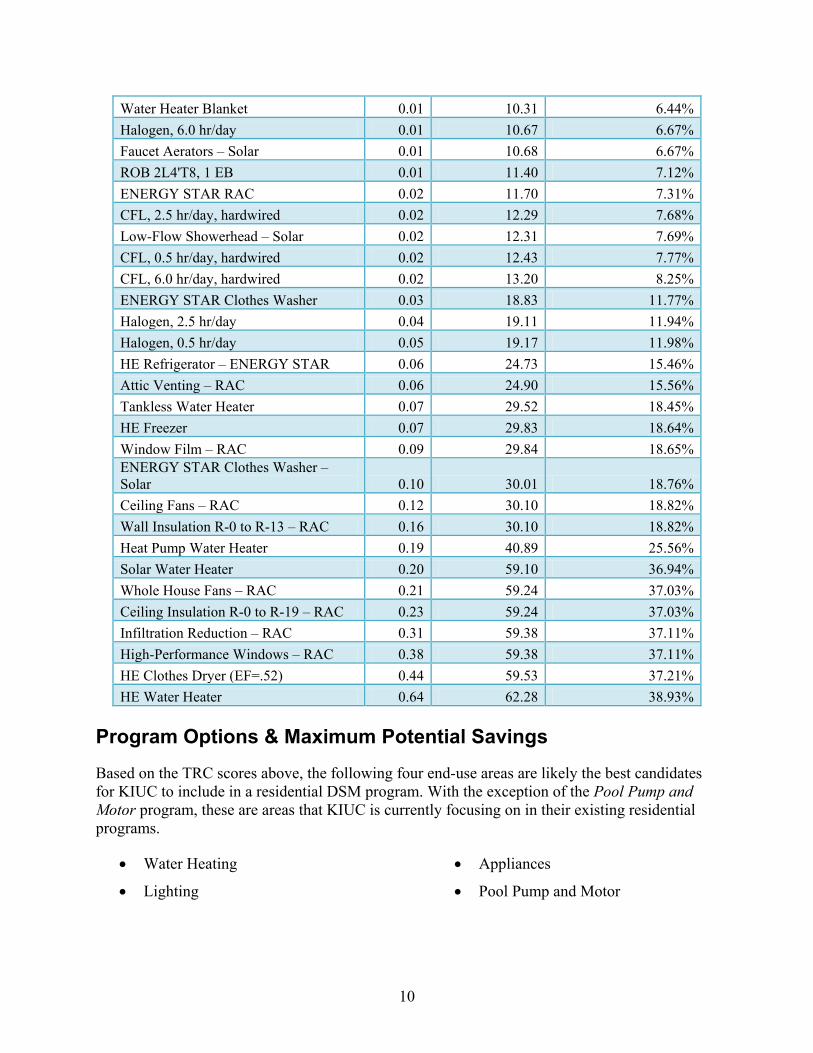
The energy efficiency measures analyzed in this report are ranked in Table 4 by levelized cost of energy (LCOE). The LCOE rank is based on the incremental cost to implement these efficiency measures and provides an idea of which measures would achieve the greatest energy savings for the least cost. The third column lists the maximum potential cumulative savings if each energy efficiency measure is adopted by LCOE rank, and the last column lists the maximum potential cumulative savings as a percentage of total annual residential energy use on Kaua‘i.
Table 4. Energy Efficiency Measures Ordered by LCOE
Energy Efficiency Measure LCOE ($/kWh)
Max Potential Cumulative
Savings (GWh)
Cumulative Savings (% of Total
Residential Energy Use)
DHW Temperature Reduction 0.00 1.46 0.91% ENERGY STAR Dishwasher 0.00 3.16 1.97% Pipe Wrap 0.00 3.43 2.14% CFL, 2.5 hr/day 0.00 5.08 3.17% CFL, 0.5 hr/day 0.00 5.37 3.36% CFL, 6.0 hr/day 0.00 7.65 4.78% HE Pool Pump and Motor 0.00 7.91 4.95% Faucet Aerators 0.00 8.21 5.13% Low-Flow Showerhead 0.01 8.97 5.61%
8 This is commonly the case with refrigerators where the new one will be used to replace an efficient one in the kitchen and the old refrigerator will be moved to the garage or somewhere else as secondary refrigeration.
10
Water Heater Blanket 0.01 10.31 6.44% Halogen, 6.0 hr/day 0.01 10.67 6.67% Faucet Aerators – Solar 0.01 10.68 6.67% ROB 2L4'T8, 1 EB 0.01 11.40 7.12% ENERGY STAR RAC 0.02 11.70 7.31% CFL, 2.5 hr/day, hardwired 0.02 12.29 7.68% Low-Flow Showerhead – Solar 0.02 12.31 7.69% CFL, 0.5 hr/day, hardwired 0.02 12.43 7.77% CFL, 6.0 hr/day, hardwired 0.02 13.20 8.25% ENERGY STAR Clothes Washer 0.03 18.83 11.77% Halogen, 2.5 hr/day 0.04 19.11 11.94% Halogen, 0.5 hr/day 0.05 19.17 11.98% HE Refrigerator – ENERGY STAR 0.06 24.73 15.46% Attic Venting – RAC 0.06 24.90 15.56% Tankless Water Heater 0.07 29.52 18.45% HE Freezer 0.07 29.83 18.64% Window Film – RAC 0.09 29.84 18.65% ENERGY STAR Clothes Washer – Solar 0.10 30.01 18.76% Ceiling Fans – RAC 0.12 30.10 18.82% Wall Insulation R-0 to R-13 – RAC 0.16 30.10 18.82% Heat Pump Water Heater 0.19 40.89 25.56% Solar Water Heater 0.20 59.10 36.94% Whole House Fans – RAC 0.21 59.24 37.03% Ceiling Insulation R-0 to R-19 – RAC 0.23 59.24 37.03% Infiltration Reduction – RAC 0.31 59.38 37.11% High-Performance Windows – RAC 0.38 59.38 37.11% HE Clothes Dryer (EF=.52) 0.44 59.53 37.21% HE Water Heater 0.64 62.28 38.93%
Program Options & Maximum Potential Savings
Based on the TRC scores above, the following four end-use areas are likely the best candidates for KIUC to include in a residential DSM program. With the exception of the Pool Pump and Motor program, these are areas that KIUC is currently focusing on in their existing residential programs.
• Water Heating
• Lighting
• Appliances
• Pool Pump and Motor
11
Program design is integral in determining the success of any DSM program and often very specific to the locale in which the DSM program is being offered. Not only do incentives need to be set at a level sufficient to drive additional adoption of energy efficiency measures but when designing the program the utility must also consider the most effective way to market to the target sectors among its ratepayers. For example, direct mailing may be effective at reaching multiple people, but if the energy efficiency measure doesn’t apply to most customers or the mailing is not read by most recipients, a more targeted approach may be more appropriate and cost effective, even if more costly.
Program costs are highly dependent on the program design, including the implementation method, marketing strategy, and measurement and verification (M&V) requirements. For example, any type of direct install or home visit program that requires a home visit will result in significantly higher costs to the utility than financial incentive programs such as rebates. The program cost estimates used in this report reflect the average program costs for KIUC’s residential programs between 2007 and 2009, which include a mix of implementation types such as rebates, loans, appliance replacement, and home visits (Mierta 2010).9
Water Heating
As such, if the utility chooses to implement all residential programs through a direct install/home visit method, the actual program costs will exceed those used in this model, and some measures may no longer receive a passing TRC score.
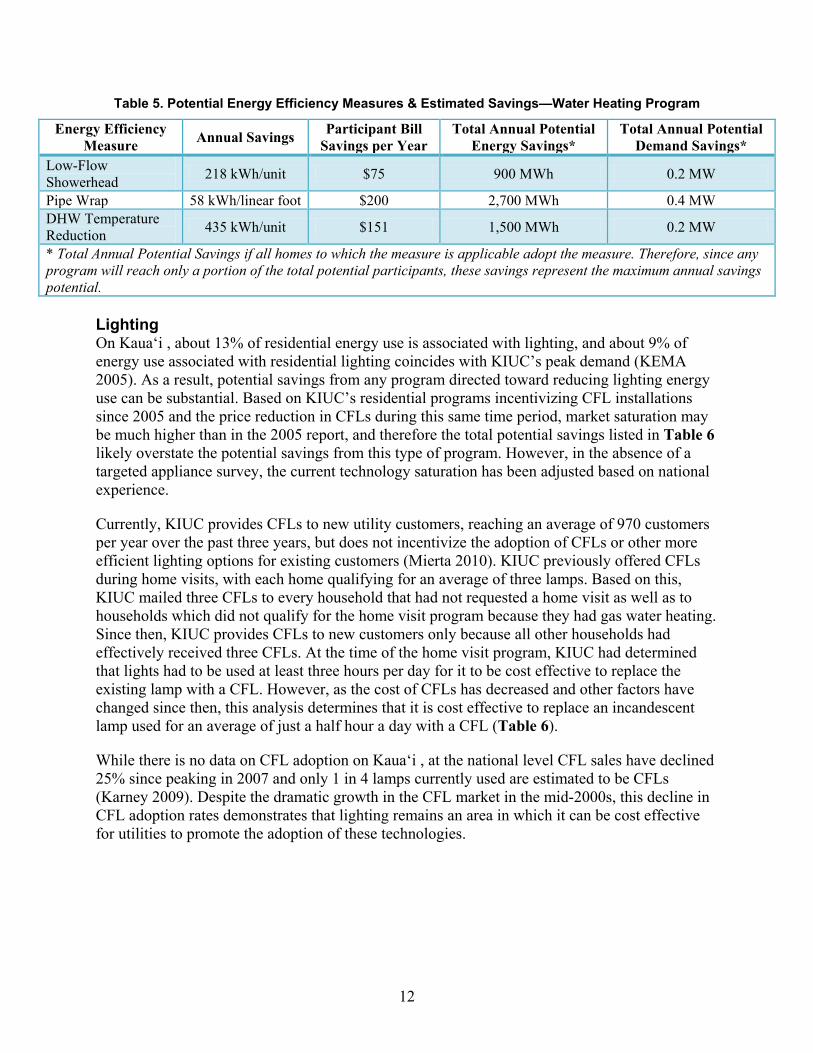
Reducing energy use for heating water is a priority throughout Hawai‘i for two main reasons. First, as approximately 40%–50% of the residential electricity load on Kaua‘i is a result of water heating demand, reducing the energy used for this end use can substantially reduce residential customers’ energy bills (Mierta 2010).10
Table 5
Second, a proportionately high amount of the energy demand for heating water occurs simultaneously with KIUC’s peak demand. As presented in
, substantial energy savings can be derived from reducing the energy needed to heat water. While the Water Heater Blanket measure passes the TRC with a 3.09, it is not included in the proposed measures because, based on local experience, this is not an appropriate measure for most homes. Under KIUC’s residential direct install program, between 2007 and 2009, adding a water heater blanket to a home’s water heater applied to less than 2% of the homes visited (Mierta 2010).
9 This average cost is used because it represents the actual costs of KIUC’s historical efforts based on a variety of different program implementation types. It is assumed that any future residential DSM programs will also have a similar mix of program implementation types. 10 In terms of the percentage of energy use from water heating, there is a discrepancy between the KEMA report and the data that KIUC finds when it completes bill analyses. KEMA reported that 30% of residential energy use was a result of water heating, but when KIUC analyzes bills it continues to find that the actual usage for heating water is closer to 40%–50% (KEMA 2005; Mierta 2010).
12
Table 5. Potential Energy Efficiency Measures & Estimated Savings—Water Heating Program
Energy Efficiency Measure Annual Savings Participant Bill
Savings per Year Total Annual Potential
Energy Savings* Total Annual Potential
Demand Savings* Low-Flow Showerhead 218 kWh/unit $75 900 MWh 0.2 MW
Pipe Wrap 58 kWh/linear foot $200 2,700 MWh 0.4 MW DHW Temperature Reduction 435 kWh/unit $151 1,500 MWh 0.2 MW
* Total Annual Potential Savings if all homes to which the measure is applicable adopt the measure. Therefore, since any program will reach only a portion of the total potential participants, these savings represent the maximum annual savings potential.
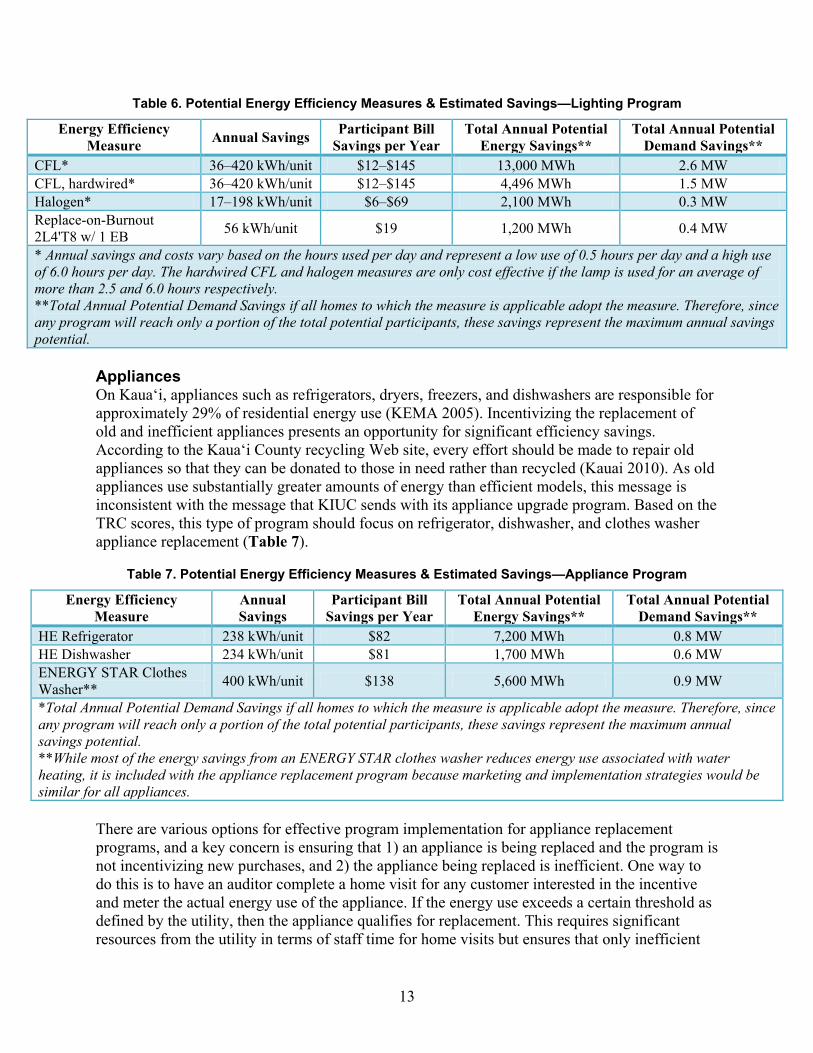
Lighting On Kaua‘i , about 13% of residential energy use is associated with lighting, and about 9% of energy use associated with residential lighting coincides with KIUC’s peak demand (KEMA 2005). As a result, potential savings from any program directed toward reducing lighting energy use can be substantial. Based on KIUC’s residential programs incentivizing CFL installations since 2005 and the price reduction in CFLs during this same time period, market saturation may be much higher than in the 2005 report, and therefore the total potential savings listed in Table 6 likely overstate the potential savings from this type of program. However, in the absence of a targeted appliance survey, the current technology saturation has been adjusted based on national experience.
Currently, KIUC provides CFLs to new utility customers, reaching an average of 970 customers per year over the past three years, but does not incentivize the adoption of CFLs or other more efficient lighting options for existing customers (Mierta 2010). KIUC previously offered CFLs during home visits, with each home qualifying for an average of three lamps. Based on this, KIUC mailed three CFLs to every household that had not requested a home visit as well as to households which did not qualify for the home visit program because they had gas water heating. Since then, KIUC provides CFLs to new customers only because all other households had effectively received three CFLs. At the time of the home visit program, KIUC had determined that lights had to be used at least three hours per day for it to be cost effective to replace the existing lamp with a CFL. However, as the cost of CFLs has decreased and other factors have changed since then, this analysis determines that it is cost effective to replace an incandescent lamp used for an average of just a half hour a day with a CFL (Table 6).
While there is no data on CFL adoption on Kaua‘i , at the national level CFL sales have declined 25% since peaking in 2007 and only 1 in 4 lamps currently used are estimated to be CFLs (Karney 2009). Despite the dramatic growth in the CFL market in the mid-2000s, this decline in CFL adoption rates demonstrates that lighting remains an area in which it can be cost effective for utilities to promote the adoption of these technologies.
13
Table 6. Potential Energy Efficiency Measures & Estimated Savings—Lighting Program
Energy Efficiency Measure Annual Savings Participant Bill
Savings per Year Total Annual Potential
Energy Savings** Total Annual Potential
Demand Savings** CFL* 36–420 kWh/unit $12–$145 13,000 MWh 2.6 MW CFL, hardwired* 36–420 kWh/unit $12–$145 4,496 MWh 1.5 MW Halogen* 17–198 kWh/unit $6–$69 2,100 MWh 0.3 MW Replace-on-Burnout 2L4'T8 w/ 1 EB 56 kWh/unit $19 1,200 MWh 0.4 MW
* Annual savings and costs vary based on the hours used per day and represent a low use of 0.5 hours per day and a high use of 6.0 hours per day. The hardwired CFL and halogen measures are only cost effective if the lamp is used for an average of more than 2.5 and 6.0 hours respectively. **Total Annual Potential Demand Savings if all homes to which the measure is applicable adopt the measure. Therefore, since any program will reach only a portion of the total potential participants, these savings represent the maximum annual savings potential.
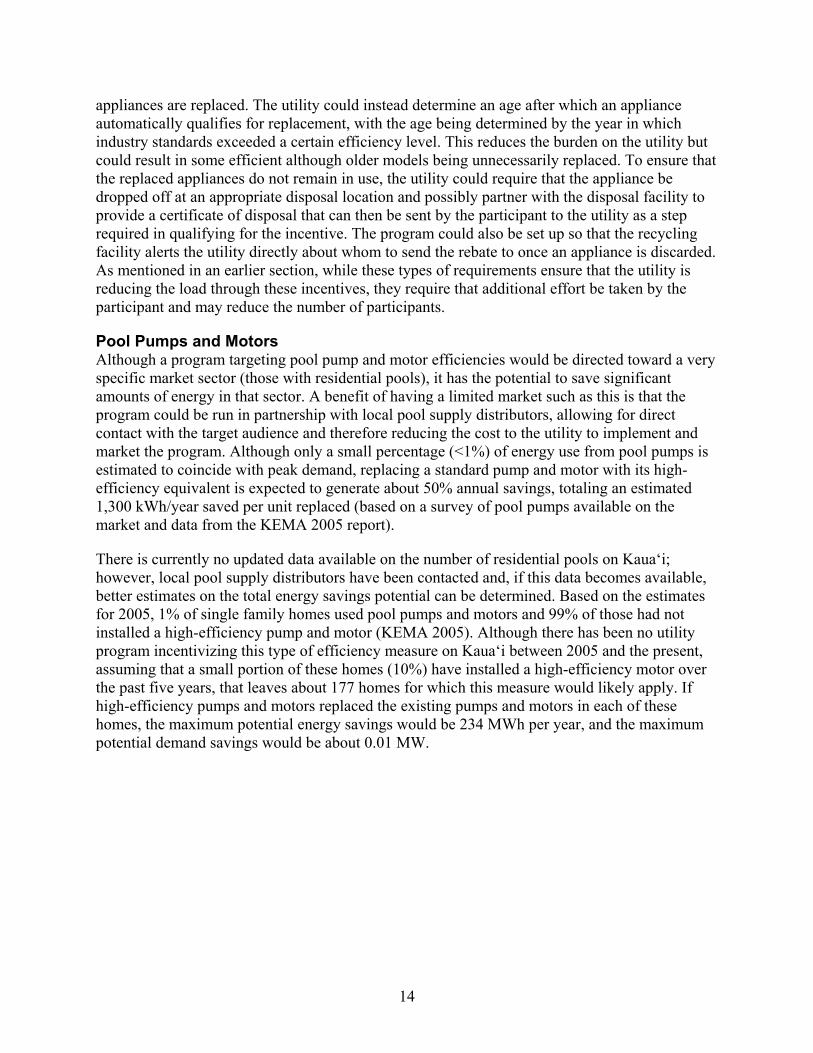
Appliances On Kaua‘i, appliances such as refrigerators, dryers, freezers, and dishwashers are responsible for approximately 29% of residential energy use (KEMA 2005). Incentivizing the replacement of old and inefficient appliances presents an opportunity for significant efficiency savings. According to the Kaua‘i County recycling Web site, every effort should be made to repair old appliances so that they can be donated to those in need rather than recycled (Kauai 2010). As old appliances use substantially greater amounts of energy than efficient models, this message is inconsistent with the message that KIUC sends with its appliance upgrade program. Based on the TRC scores, this type of program should focus on refrigerator, dishwasher, and clothes washer appliance replacement (Table 7).
Table 7. Potential Energy Efficiency Measures & Estimated Savings—Appliance Program
Energy Efficiency Measure
Annual Savings
Participant Bill Savings per Year
Total Annual Potential Energy Savings**
Total Annual Potential Demand Savings**
HE Refrigerator 238 kWh/unit $82 7,200 MWh 0.8 MW HE Dishwasher 234 kWh/unit $81 1,700 MWh 0.6 MW ENERGY STAR Clothes Washer** 400 kWh/unit $138 5,600 MWh 0.9 MW
*Total Annual Potential Demand Savings if all homes to which the measure is applicable adopt the measure. Therefore, since any program will reach only a portion of the total potential participants, these savings represent the maximum annual savings potential. **While most of the energy savings from an ENERGY STAR clothes washer reduces energy use associated with water heating, it is included with the appliance replacement program because marketing and implementation strategies would be similar for all appliances.
There are various options for effective program implementation for appliance replacement programs, and a key concern is ensuring that 1) an appliance is being replaced and the program is not incentivizing new purchases, and 2) the appliance being replaced is inefficient. One way to do this is to have an auditor complete a home visit for any customer interested in the incentive and meter the actual energy use of the appliance. If the energy use exceeds a certain threshold as defined by the utility, then the appliance qualifies for replacement. This requires significant resources from the utility in terms of staff time for home visits but ensures that only inefficient
14
appliances are replaced. The utility could instead determine an age after which an appliance automatically qualifies for replacement, with the age being determined by the year in which industry standards exceeded a certain efficiency level. This reduces the burden on the utility but could result in some efficient although older models being unnecessarily replaced. To ensure that the replaced appliances do not remain in use, the utility could require that the appliance be dropped off at an appropriate disposal location and possibly partner with the disposal facility to provide a certificate of disposal that can then be sent by the participant to the utility as a step required in qualifying for the incentive. The program could also be set up so that the recycling facility alerts the utility directly about whom to send the rebate to once an appliance is discarded. As mentioned in an earlier section, while these types of requirements ensure that the utility is reducing the load through these incentives, they require that additional effort be taken by the participant and may reduce the number of participants.
Pool Pumps and Motors Although a program targeting pool pump and motor efficiencies would be directed toward a very specific market sector (those with residential pools), it has the potential to save significant amounts of energy in that sector. A benefit of having a limited market such as this is that the program could be run in partnership with local pool supply distributors, allowing for direct contact with the target audience and therefore reducing the cost to the utility to implement and market the program. Although only a small percentage (<1%) of energy use from pool pumps is estimated to coincide with peak demand, replacing a standard pump and motor with its high-efficiency equivalent is expected to generate about 50% annual savings, totaling an estimated 1,300 kWh/year saved per unit replaced (based on a survey of pool pumps available on the market and data from the KEMA 2005 report).
There is currently no updated data available on the number of residential pools on Kaua‘i; however, local pool supply distributors have been contacted and, if this data becomes available, better estimates on the total energy savings potential can be determined. Based on the estimates for 2005, 1% of single family homes used pool pumps and motors and 99% of those had not installed a high-efficiency pump and motor (KEMA 2005). Although there has been no utility program incentivizing this type of efficiency measure on Kaua‘i between 2005 and the present, assuming that a small portion of these homes (10%) have installed a high-efficiency motor over the past five years, that leaves about 177 homes for which this measure would likely apply. If high-efficiency pumps and motors replaced the existing pumps and motors in each of these homes, the maximum potential energy savings would be 234 MWh per year, and the maximum potential demand savings would be about 0.01 MW.
15
Program Development and Delivery
The “incentive design process should not be an abstract analytical effort,” it should involve the program implementer working with customers and trade allies to determine the appropriate level of incentive to achieve the desired level of program participation (NAPEE 2010, p. 16).
Energy efficiency program development and delivery are unique to each location in which they are implemented because each locale has unique market characteristics. As such, it is impossible to simply duplicate a program that is effective in one locale elsewhere. However, new programs can benefit from the valuable lessons learned in other programs. This section presents best practices for energy efficiency programs as identified in reviews of leading energy efficiency programs throughout the country.
Energy efficiency program best practices indicate that the process for developing an effective program is to:
1. Identify sectors where efficiency improvements can be achieved
2. Identify the barriers to efficiency measure adoption in each sector
3. Identify mechanisms for addressing these barriers
4. Develop the program (includes the incentive type and level; marketing strategy; and M&V methods) to best meet the local circumstances identified in the first three steps (NAPEE 2010).
A market analysis is necessary to determine where opportunities for efficiency improvements exist. Without a market analysis, it is difficult to identify the available market and how to best advertise efficiency improvements to target sectors. It is more cost effective to develop targeted marketing strategies. The analysis presented in the first sections of this report used market data from the 2005 KEMA report. While this data reflects the market conditions that existed more than five years ago, this is the most current data available on market penetration of energy efficient measures on Kaua‘i.
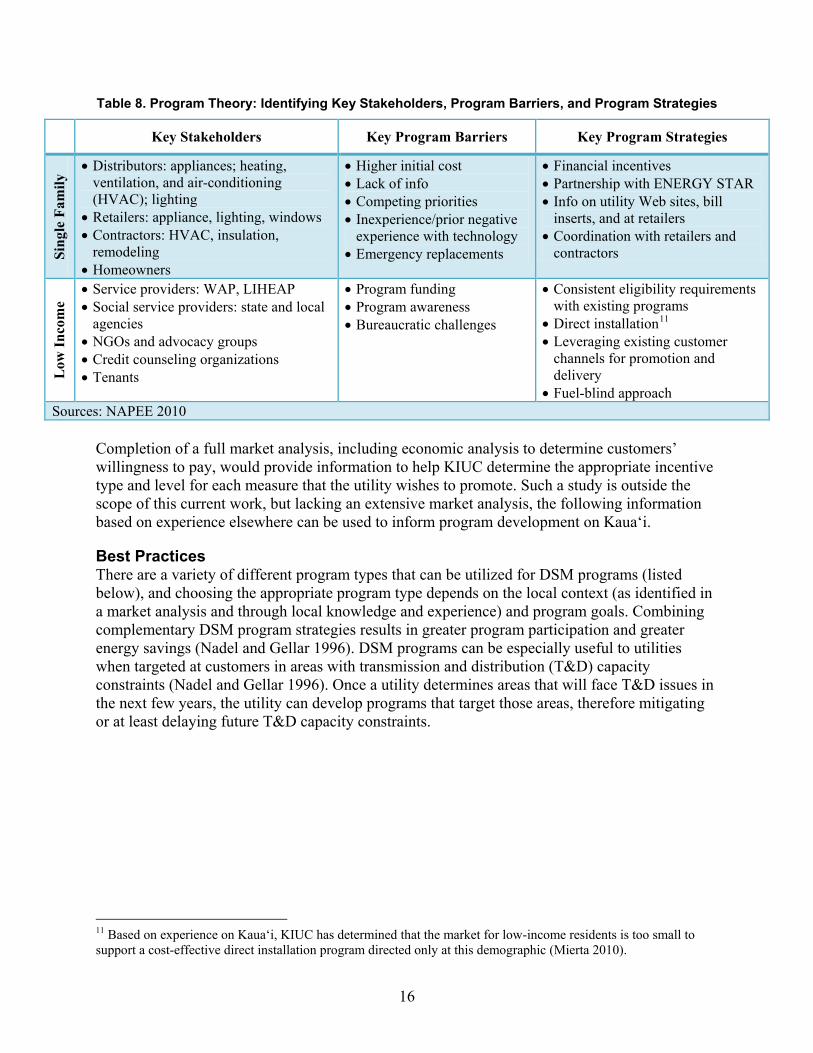
Once the sectors where energy efficiency improvement potential exists have been identified, the next step is to identify the key stakeholders, program barriers, and program strategies. Table 8 provides a general summary of these three components based on energy efficiency program experience throughout the country. It is also important to determine the mix of renters and owners in the target sectors because different barriers exist for these different demographics (NAPEE 2010). If the target sector consists of buildings where the tenants rent, the programs should target building owners and address the split incentive that occurs when tenants reap the benefits of energy savings from efficiency measures but the owner paid to implement the measure. In 2006, the most recent year with data, approximately 34% of residents rented (DBEDT 2009a).
16
Table 8. Program Theory: Identifying Key Stakeholders, Program Barriers, and Program Strategies
Key Stakeholders Key Program Barriers Key Program Strategies
Sing
le F
amily
• Distributors: appliances; heating, ventilation, and air-conditioning (HVAC); lighting
• Retailers: appliance, lighting, windows • Contractors: HVAC, insulation,
remodeling • Homeowners
• Higher initial cost • Lack of info • Competing priorities • Inexperience/prior negative
experience with technology • Emergency replacements
• Financial incentives • Partnership with ENERGY STAR • Info on utility Web sites, bill
inserts, and at retailers • Coordination with retailers and
contractors
Low
Inco
me
• Service providers: WAP, LIHEAP • Social service providers: state and local
agencies • NGOs and advocacy groups • Credit counseling organizations • Tenants
• Program funding • Program awareness • Bureaucratic challenges
• Consistent eligibility requirements with existing programs
• Direct installation11
• Leveraging existing customer channels for promotion and delivery
• Fuel-blind approach Sources: NAPEE 2010
Completion of a full market analysis, including economic analysis to determine customers’ willingness to pay, would provide information to help KIUC determine the appropriate incentive type and level for each measure that the utility wishes to promote. Such a study is outside the scope of this current work, but lacking an extensive market analysis, the following information based on experience elsewhere can be used to inform program development on Kaua‘i.
Best Practices There are a variety of different program types that can be utilized for DSM programs (listed below), and choosing the appropriate program type depends on the local context (as identified in a market analysis and through local knowledge and experience) and program goals. Combining complementary DSM program strategies results in greater program participation and greater energy savings (Nadel and Gellar 1996). DSM programs can be especially useful to utilities when targeted at customers in areas with transmission and distribution (T&D) capacity constraints (Nadel and Gellar 1996). Once a utility determines areas that will face T&D issues in the next few years, the utility can develop programs that target those areas, therefore mitigating or at least delaying future T&D capacity constraints.
11 Based on experience on Kaua‘i, KIUC has determined that the market for low-income residents is too small to support a cost-effective direct installation program directed only at this demographic (Mierta 2010).
17
There are a variety of program types, and each has its strengths and weaknesses in driving energy efficiency measure adoption. The most common program types are (Nadel and Gellar 1996):
• Information programs
• Loans and leasing programs
• Rebate programs
• Performance contracting12
• Comprehensive/direct install programs
• Market transformation programs.
Informational programs typically include educational brochures, training programs, home visits, and labeling. Although the savings from information programs are difficult to measure, most estimate that savings are low (Nadel and Gellar 1996). However, a program in Ireland achieved 7% energy savings, and although short-term savings were minimal, the long-term impact of the program was considered to be substantial (Dulleck and Kaufmann 2004). In this case, the utility had a direct mandate to reduce demand. Information programs that provide training for energy auditors and people in the trades and buildings operations sectors can create lasting change and allow for the utility to offer more diverse and successful programs (Wilson et al. 2008). Informational programs are a good complement to other programs (Nadel and Gellar 1996). Data shows that 38% of people read bill inserts, potentially limiting their usefulness (Sovacool 2009). In general, generic distribution and marketing strategies should be avoided in favor of targeted and strategic marketing mechanisms.
Loan programs are typically more difficult to administer and market than rebate programs (Nadel and Geller 1996). Energy reductions are typically realized more quickly with rebate programs than with loan or market transformation programs. However, although customers generally prefer rebate programs to loan programs, rebate programs may not provide sufficient incentives to entice the majority of eligible customers to participate. Dealer cooperation and coordination are critical to successful rebate programs. Rebate programs are also less effective for low-income customers because they often cannot afford to replace existing technology with newer, more efficient technology until it burns out, even with a rebate (Wilson et al. 2008). Loan programs, on the other hand, provide all customers with access to up-front capital.
12 Typically only used for commercial customers.
18
Comprehensive/direct install programs have low participation rates due to the high cost and time commitment required per participant. However, direct install programs do achieve higher energy savings per participant than other programs (Nadel and Geller 1996). These programs usually include an initial home visit, completed either by a utility employee or an approved contractor, followed by arrangements for measure installation and often financial assistance. This type of program is particularly effective at reaching low-income and other hard-to-reach customer groups.
Many utilities have moved toward market transformation programs to reach more people with their programs and change energy use behavior for a larger percentage of customers (Nadel and Geller 1996). Market transformation programs require significant up-front investment, but the long-term cost-to-savings ratio is low because they achieve nearly 100% participation over time since the energy behavior norms change across the entire population, not just among those who participate directly in a rebate, loan, or other limited program. Measurement and verification of savings can be challenging, however, and these types of programs require significant coordination among multiple stakeholders, sometimes even those operating outside of the utility’s service area. Although savings can be high, it can take a long time for savings to be realized.
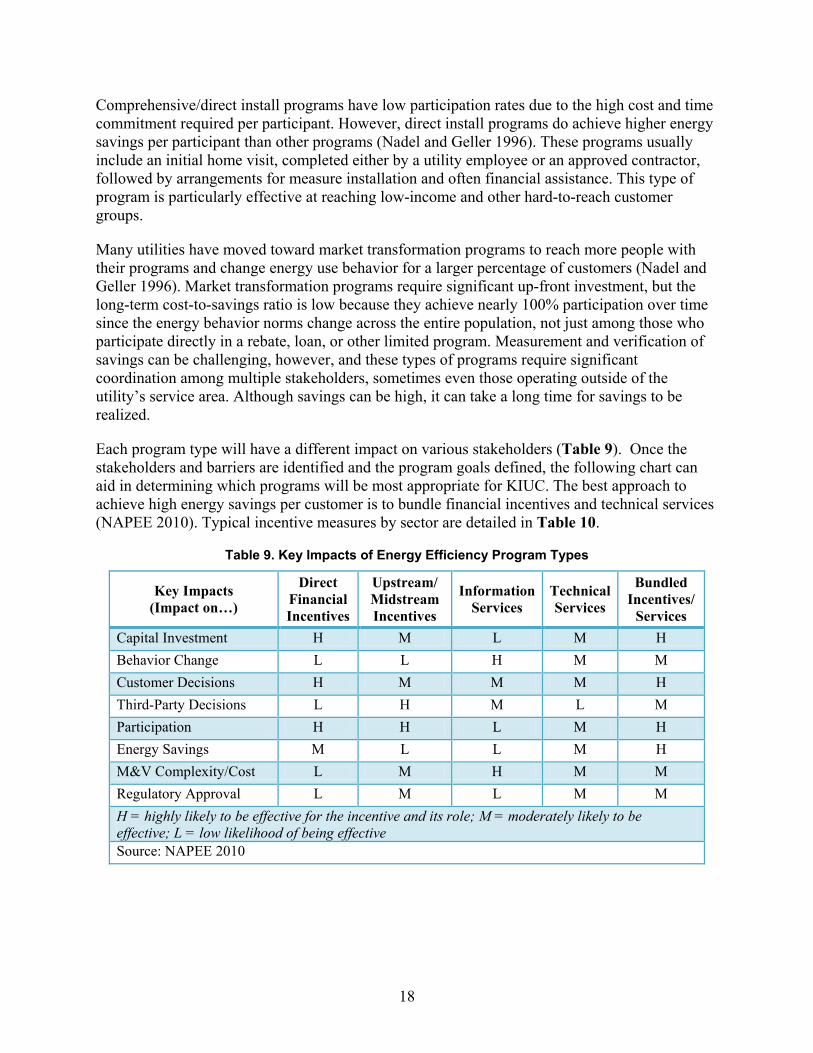
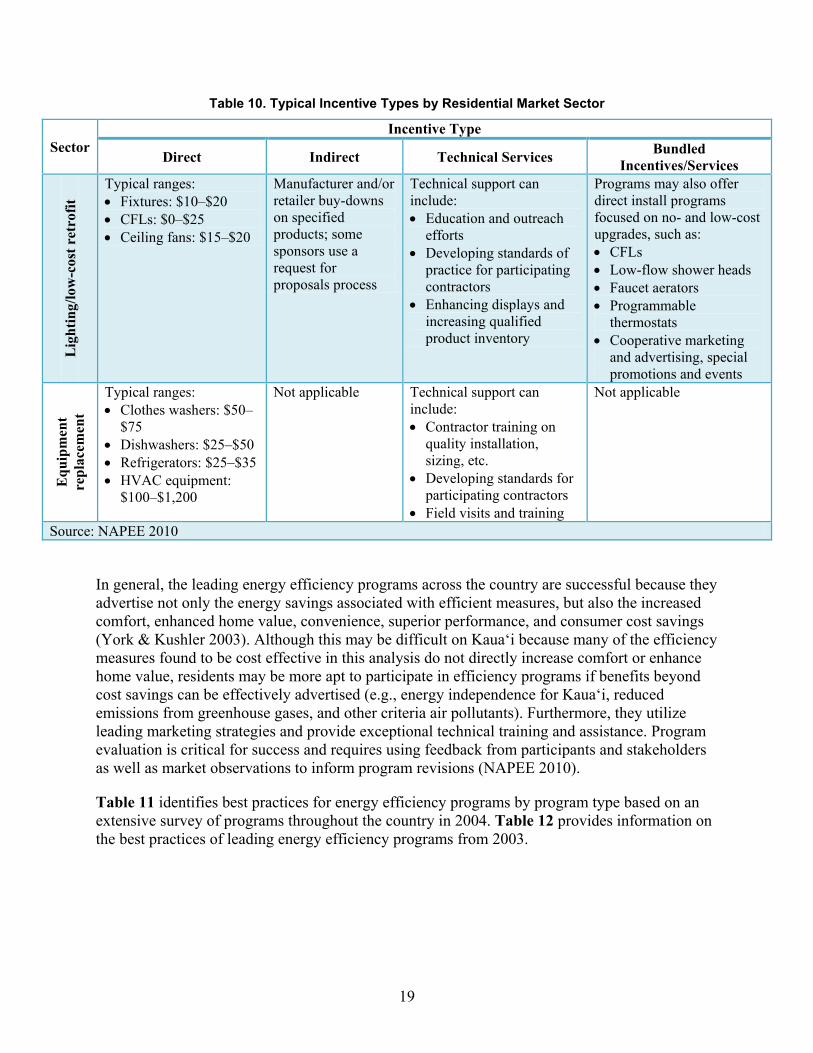
Each program type will have a different impact on various stakeholders (Table 9). Once the stakeholders and barriers are identified and the program goals defined, the following chart can aid in determining which programs will be most appropriate for KIUC. The best approach to achieve high energy savings per customer is to bundle financial incentives and technical services (NAPEE 2010). Typical incentive measures by sector are detailed in Table 10.
Table 9. Key Impacts of Energy Efficiency Program Types
Key Impacts (Impact on…)
Direct Financial Incentives
Upstream/ Midstream Incentives
Information Services
Technical Services
Bundled Incentives/
Services Capital Investment H M L M H Behavior Change L L H M M Customer Decisions H M M M H Third-Party Decisions L H M L M Participation H H L M H Energy Savings M L L M H M&V Complexity/Cost L M H M M Regulatory Approval L M L M M H = highly likely to be effective for the incentive and its role; M = moderately likely to be effective; L = low likelihood of being effective Source: NAPEE 2010
19
Table 10. Typical Incentive Types by Residential Market Sector
Sector Incentive Type
Direct Indirect Technical Services Bundled Incentives/Services
Lig
htin
g/lo
w-c
ost r
etro
fit
Typical ranges: • Fixtures: $10–$20 • CFLs: $0–$25 • Ceiling fans: $15–$20
Manufacturer and/or retailer buy-downs on specified products; some sponsors use a request for proposals process
Technical support can include: • Education and outreach
efforts • Developing standards of
practice for participating contractors
• Enhancing displays and increasing qualified product inventory
Programs may also offer direct install programs focused on no- and low-cost upgrades, such as: • CFLs • Low-flow shower heads • Faucet aerators • Programmable
thermostats • Cooperative marketing
and advertising, special promotions and events
Equ
ipm
ent
repl
acem
ent
Typical ranges: • Clothes washers: $50–
$75 • Dishwashers: $25–$50 • Refrigerators: $25–$35 • HVAC equipment:
$100–$1,200
Not applicable Technical support can include: • Contractor training on
quality installation, sizing, etc.
• Developing standards for participating contractors
• Field visits and training
Not applicable
Source: NAPEE 2010
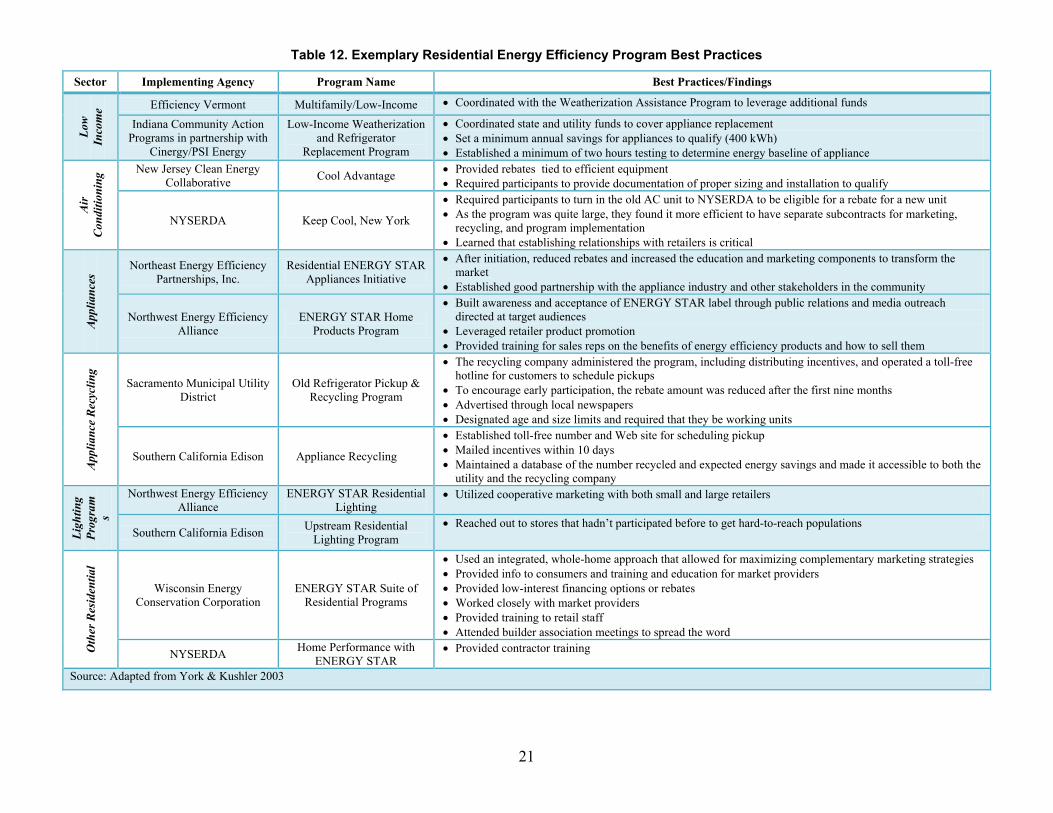
In general, the leading energy efficiency programs across the country are successful because they advertise not only the energy savings associated with efficient measures, but also the increased comfort, enhanced home value, convenience, superior performance, and consumer cost savings (York & Kushler 2003). Although this may be difficult on Kaua‘i because many of the efficiency measures found to be cost effective in this analysis do not directly increase comfort or enhance home value, residents may be more apt to participate in efficiency programs if benefits beyond cost savings can be effectively advertised (e.g., energy independence for Kaua‘i, reduced emissions from greenhouse gases, and other criteria air pollutants). Furthermore, they utilize leading marketing strategies and provide exceptional technical training and assistance. Program evaluation is critical for success and requires using feedback from participants and stakeholders as well as market observations to inform program revisions (NAPEE 2010).
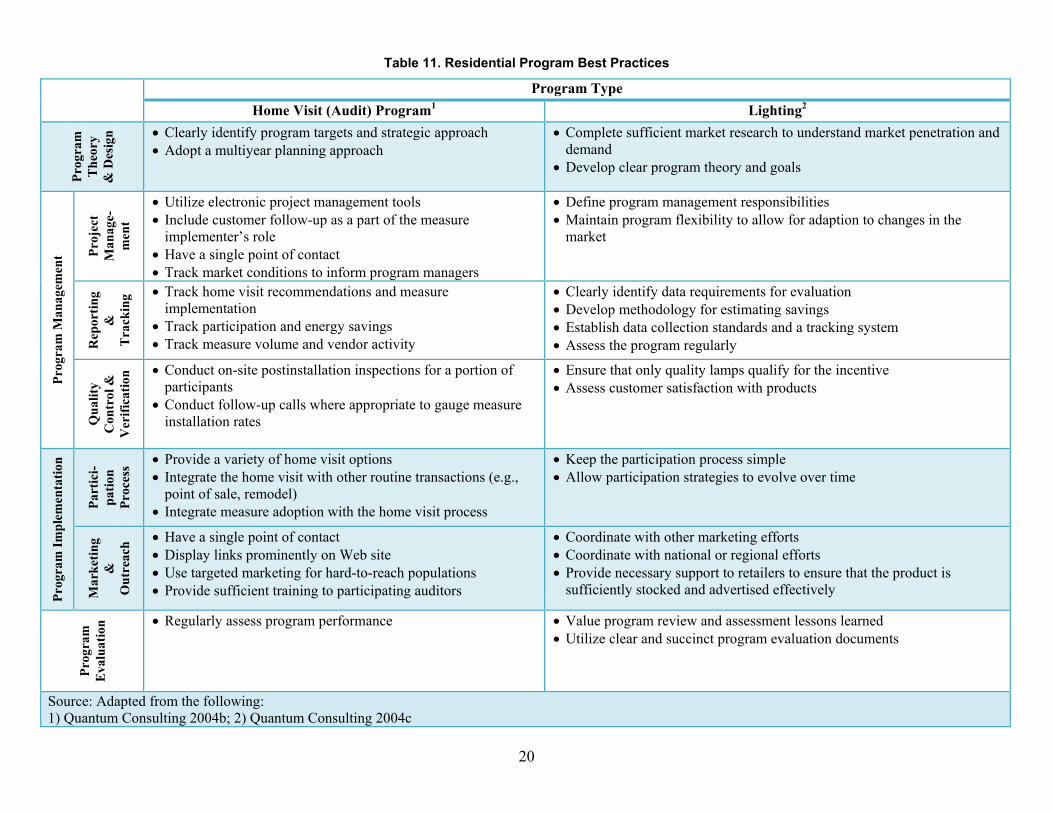
Table 11 identifies best practices for energy efficiency programs by program type based on an extensive survey of programs throughout the country in 2004. Table 12 provides information on the best practices of leading energy efficiency programs from 2003.
20
Table 11. Residential Program Best Practices
Program Type Home Visit (Audit) Program Lighting1
Prog
ram
T
heor
y &
Des
ign
2 • Clearly identify program targets and strategic approach • Adopt a multiyear planning approach
• Complete sufficient market research to understand market penetration and demand
• Develop clear program theory and goals
Prog
ram
Man
agem
ent Pr
ojec
t M
anag
e-m
ent
• Utilize electronic project management tools • Include customer follow-up as a part of the measure
implementer’s role • Have a single point of contact • Track market conditions to inform program managers
• Define program management responsibilities • Maintain program flexibility to allow for adaption to changes in the
market
Rep
ortin
g &
T
rack
ing • Track home visit recommendations and measure
implementation • Track participation and energy savings • Track measure volume and vendor activity
• Clearly identify data requirements for evaluation • Develop methodology for estimating savings • Establish data collection standards and a tracking system • Assess the program regularly
Qua
lity
Con
trol
&
Ver
ifica
tion • Conduct on-site postinstallation inspections for a portion of
participants • Conduct follow-up calls where appropriate to gauge measure
installation rates
• Ensure that only quality lamps qualify for the incentive • Assess customer satisfaction with products
Prog
ram
Impl
emen
tatio
n
Part
ici-
patio
n Pr
oces
s • Provide a variety of home visit options • Integrate the home visit with other routine transactions (e.g.,
point of sale, remodel) • Integrate measure adoption with the home visit process
• Keep the participation process simple • Allow participation strategies to evolve over time
Mar
ketin
g &
O
utre
ach • Have a single point of contact
• Display links prominently on Web site • Use targeted marketing for hard-to-reach populations • Provide sufficient training to participating auditors
• Coordinate with other marketing efforts • Coordinate with national or regional efforts • Provide necessary support to retailers to ensure that the product is
sufficiently stocked and advertised effectively
Prog
ram
E
valu
atio
n • Regularly assess program performance • Value program review and assessment lessons learned • Utilize clear and succinct program evaluation documents
Source: Adapted from the following: 1) Quantum Consulting 2004b; 2) Quantum Consulting 2004c
21
Table 12. Exemplary Residential Energy Efficiency Program Best Practices
Sector Implementing Agency Program Name Best Practices/Findings Lo
w
Inco
me Efficiency Vermont Multifamily/Low-Income • Coordinated with the Weatherization Assistance Program to leverage additional funds
Indiana Community Action Programs in partnership with
Cinergy/PSI Energy
Low-Income Weatherization and Refrigerator
Replacement Program
• Coordinated state and utility funds to cover appliance replacement • Set a minimum annual savings for appliances to qualify (400 kWh) • Established a minimum of two hours testing to determine energy baseline of appliance
Air
C
ondi
tioni
ng New Jersey Clean Energy
Collaborative Cool Advantage • Provided rebates tied to efficient equipment • Required participants to provide documentation of proper sizing and installation to qualify
NYSERDA Keep Cool, New York
• Required participants to turn in the old AC unit to NYSERDA to be eligible for a rebate for a new unit • As the program was quite large, they found it more efficient to have separate subcontracts for marketing,
recycling, and program implementation • Learned that establishing relationships with retailers is critical
App
lianc
es Northeast Energy Efficiency
Partnerships, Inc. Residential ENERGY STAR
Appliances Initiative
• After initiation, reduced rebates and increased the education and marketing components to transform the market
• Established good partnership with the appliance industry and other stakeholders in the community
Northwest Energy Efficiency Alliance
ENERGY STAR Home Products Program
• Built awareness and acceptance of ENERGY STAR label through public relations and media outreach directed at target audiences
• Leveraged retailer product promotion • Provided training for sales reps on the benefits of energy efficiency products and how to sell them
App
lianc
e R
ecyc
ling
Sacramento Municipal Utility District
Old Refrigerator Pickup & Recycling Program
• The recycling company administered the program, including distributing incentives, and operated a toll-free hotline for customers to schedule pickups
• To encourage early participation, the rebate amount was reduced after the first nine months • Advertised through local newspapers • Designated age and size limits and required that they be working units
Southern California Edison Appliance Recycling
• Established toll-free number and Web site for scheduling pickup • Mailed incentives within 10 days • Maintained a database of the number recycled and expected energy savings and made it accessible to both the
utility and the recycling company
Ligh
ting
Prog
ram
s
Northwest Energy Efficiency Alliance
ENERGY STAR Residential Lighting
• Utilized cooperative marketing with both small and large retailers
Southern California Edison Upstream Residential Lighting Program
• Reached out to stores that hadn’t participated before to get hard-to-reach populations
Oth
er R
esid
entia
l
Wisconsin Energy Conservation Corporation
ENERGY STAR Suite of Residential Programs
• Used an integrated, whole-home approach that allowed for maximizing complementary marketing strategies • Provided info to consumers and training and education for market providers • Provided low-interest financing options or rebates • Worked closely with market providers • Provided training to retail staff • Attended builder association meetings to spread the word
NYSERDA Home Performance with ENERGY STAR
• Provided contractor training
Source: Adapted from York & Kushler 2003
22
When designing a customer incentive program, the program implementer may want to consider the following questions (NAPEE 2010):
• Are the program strategies designed to address the identified barriers in the target market?
• Was a detailed market assessment completed to examine market actors and decision-making processes?
• Is the program designed to leverage other available incentives?
• Was input from customers and trade allies incorporated into the program design process?
• Have potential unintended consequences of the program and strategies to mitigate them been identified?
• Is the proposed program cost effective?
Low-Income Programs Low-income residents spend a disproportionate amount of their income on energy. Across the country, low-income families typically spend 14% of their income on energy, whereas others spend an average of only 3.5% (EERE/DOE 2001). Utilities benefit from low-income targeted programs in multiple ways, including reduced costs associated with a reduced need for credit and collection, service shut-offs, and uncollectible account write-offs (Kushler et al. 2005). Utilities offering these programs also typically benefit from improved customer relations.
Many utilities provide greater incentives to low-income residents through their residential DSM programs, such as free components like showerheads and free appliance replacement. To identify which customers to target for incentives designated for low-income residents, utilities typically partner with the local community action agency that already has an established relationship with the sector. In some cases, utilities train community action agency staff members to conduct home visits to provide education on energy use as well as identify whether the resident qualifies for any of the utility’s residential DSM programs. Providing additional incentives to low-income residents allows the utility to target a sector that can least afford energy efficiency improvements and can least afford to adjust their energy budget should the cost of energy rise rapidly.
23
In a survey of utility sector low-income energy efficiency programs, Kushler et al. (2005) found that exemplary programs had the following traits:
• Partnerships are established with a wide variety of stakeholders (including community action agencies, social service agencies, private market providers, and others) to leverage available funding from multiple sources.
• Direct customer services for many programs are provided through community action agencies because they have strong relationships with the low-income community.
• Programs commonly use whole-house approaches when assessing the energy efficiency of a house.
• Most programs incorporate customer education along with other services offered.
• Program evaluation is valued and is routinely undertaken.
• The cost-effectiveness of the program is less important than with non-low-income programs but still an objective of the program.
Program Administration There is no administrative structure that has emerged as the best structure for energy efficiency program administration (Blumstein et al. 2005). Various administrative entities can successfully run energy efficiency programs. For example, a utility can successfully administer a program if it has a trusted position in a community, especially if it has historical experience with administering energy efficiency programs. Administering all programs through a utility can also be beneficial, as there are opportunities for economies of scale to be achieved rather than having multiple entities administer various programs. However, there is also the possibility that a utility’s incentive to increase sales can result in a conflict of interest and insufficient support from the utility’s stakeholders for energy efficiency programs.
Creating a nonprofit entity that focuses solely on energy efficiency can present many challenges. Doing so requires establishing a board of directors, creating a governance mechanism, and building trust within the community from scratch. The benefit of a third-party administrator is that the organization can focus all of its efforts on implementing energy efficiency programs. Campaigns that last for only a short time and require significant staff resources may be best administered by a third party under a short-term contract, as it is difficult for a utility to ramp up staffing for a short-term program (Summit Blue 2007).
24
When choosing a program administrator, it is important to consider the following (Blumstein et al. 2005):
• Does it have sufficient support to be recognized by the community, utility, and other stakeholders as a legitimate entity with the right to act?
• Are appropriate mechanisms established to ensure accountability?
• Does the entity employ and have the ability to maintain and attract qualified employees? Does the entity have the capability and desire to work with others beyond the utility’s service area to coordinate on market transformation efforts?
• Should the program administrator “be an institutional home for human capital” (i.e., skilled employees), or should it be a “funding mechanism” and shop out the technical support to local private sector and/or nonprofit firms?
Partnerships A consistent component of successful energy efficiency programs is well-developed partnerships between the administrator and various community stakeholders. To leverage local resources and existing relationships with the target sectors, it is critical for the administrator to form partnerships with local businesses and retailers, community action agencies, and trade organizations (Wilson et al. 2008). Working with retailers to promote the program’s energy efficiency products ensures greater participation and greater energy savings. Further, in rural areas, it is particularly critical for the program administrator to partner with local retailers as well as chain stores to make sure that sufficient product is stocked and that the salespeople have the necessary information about the product and programs to inform customers. Working in cooperation with trade allies, including installers and contractors, ensures proper equipment installation and familiarity with energy efficient equipment, which allows them to better promote the installation of energy efficient equipment to customers. Identifying potential partners that already have established relationships with the target sectors allows for coordinated and strategic marketing (Wilson et al. 2008). For example, programs targeted to the low-income sector have traditionally benefitted from being offered through local community action programs because these groups have a well-established relationship and trust with the low-income community.
KIUC already partners with various stakeholders on the island, including ACE Hardware, the Kauai Economic Development Board, and the local food bank. Other potential partners may include local faith-based groups contractors, schools and those involved in related trades (e.g., electricians and plumbers).
25
Marketing Strategies Successful DSM programs typically use multiple marketing approaches (including person-to-person contact with postinstallation follow-ups), target specific sectors, provide technical assistance, recommend contractors, and are simple so customers can participate easily (Sovacool 2009). Although there is a high awareness rate of KIUC’s energy efficiency programs among Kaua‘i residents, participation rates are lower than would be expected based on the opportunities for energy efficiency improvements identified in this analysis. According to KIUC’s consumer survey in 2008, of those surveyed, 58% were aware of KIUC’s home visit program, 75% were aware of KIUC’s solar rebate/loan program and the appliance replacement rebate, and 83% were aware of the solar water heater rebate incentives (Mierta 2010). However, interest and participation in these programs remains lower than expected. Revising the current marketing strategies and incentives may result in higher participation rates. Table 13 details lessons learned for a variety of marketing strategies, and Table 14 outlines marketing best practices based on a survey of leading energy efficiency programs around the country.
Table 13. Marketing Strategies for Energy Efficiency Programs, Lessons Learned
Participation Tactic Lessons Learned
Retailer Agreements
• Make them short and clear, ideally not more than one page • Ensure correct use of logo
Retailer Outreach/Support
• It takes time to develop the personal contacts and relationships required • Can be expensive, but may be critical to ensure appropriate use of materials and
consistency
Coupon Redemption
• Bar codes greatly simplify redemption for retailers • Watch fulfillment costs and price point (e.g., as the price for CFLs decreases, the
proportional cost of coupon redemption may become burdensome) • Avoid devaluing the product by giving it away
Retailer Reimbursement
• Due diligence requirements from regulators can put undue burden on retailers regarding risk of ineligible customers
• Establish a quick turnaround time
Marketing • Avoid “overmarketing” a limited supply • Marketing can be very expensive; leverage dollars where possible
Invitation to Participate or
Industry-Sponsored Initiatives
• Can reduce the risk and administrative burden associated with coupon redemption • Engages manufacturers to create a market for their own products • Market transformation strategy—may require some agreement from regulators
regarding the acceptable level of uncertainty
Upstream Buy-downs
• Can exacerbate due diligence issues with regulators—reporting requirements will dictate how simple a buy-down strategy can be
• Investment can reduce the price point and have a profound impact in the marketplace • Can be a high-leverage strategy in budget scarcity situations
Source: Quantum Consulting 2004c, p. R1-5
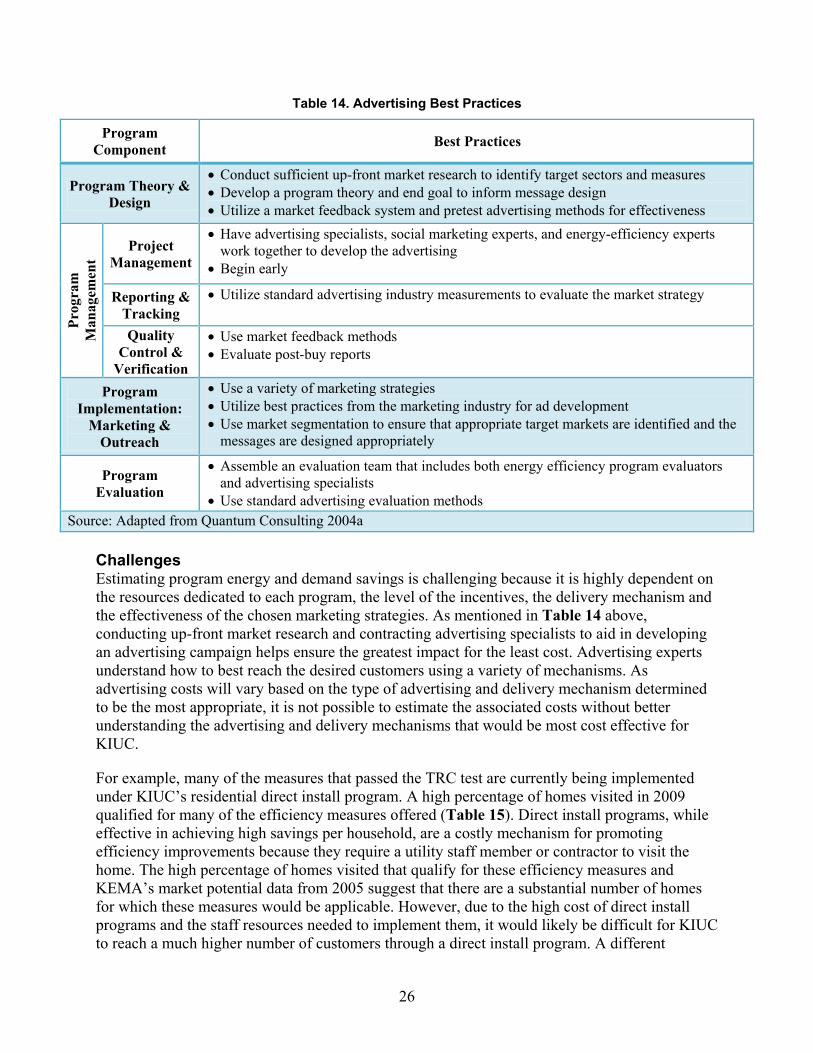
26
Table 14. Advertising Best Practices
Program Component Best Practices
Program Theory & Design
• Conduct sufficient up-front market research to identify target sectors and measures • Develop a program theory and end goal to inform message design • Utilize a market feedback system and pretest advertising methods for effectiveness
Prog
ram
M
anag
emen
t
Project Management
• Have advertising specialists, social marketing experts, and energy-efficiency experts work together to develop the advertising
• Begin early
Reporting & Tracking
• Utilize standard advertising industry measurements to evaluate the market strategy
Quality Control &
Verification
• Use market feedback methods • Evaluate post-buy reports
Program Implementation:
Marketing & Outreach
• Use a variety of marketing strategies • Utilize best practices from the marketing industry for ad development • Use market segmentation to ensure that appropriate target markets are identified and the
messages are designed appropriately
Program Evaluation
• Assemble an evaluation team that includes both energy efficiency program evaluators and advertising specialists
• Use standard advertising evaluation methods Source: Adapted from Quantum Consulting 2004a
Challenges Estimating program energy and demand savings is challenging because it is highly dependent on the resources dedicated to each program, the level of the incentives, the delivery mechanism and the effectiveness of the chosen marketing strategies. As mentioned in Table 14 above, conducting up-front market research and contracting advertising specialists to aid in developing an advertising campaign helps ensure the greatest impact for the least cost. Advertising experts understand how to best reach the desired customers using a variety of mechanisms. As advertising costs will vary based on the type of advertising and delivery mechanism determined to be the most appropriate, it is not possible to estimate the associated costs without better understanding the advertising and delivery mechanisms that would be most cost effective for KIUC.
For example, many of the measures that passed the TRC test are currently being implemented under KIUC’s residential direct install program. A high percentage of homes visited in 2009 qualified for many of the efficiency measures offered (Table 15). Direct install programs, while effective in achieving high savings per household, are a costly mechanism for promoting efficiency improvements because they require a utility staff member or contractor to visit the home. The high percentage of homes visited that qualify for these efficiency measures and KEMA’s market potential data from 2005 suggest that there are a substantial number of homes for which these measures would be applicable. However, due to the high cost of direct install programs and the staff resources needed to implement them, it would likely be difficult for KIUC to reach a much higher number of customers through a direct install program. A different
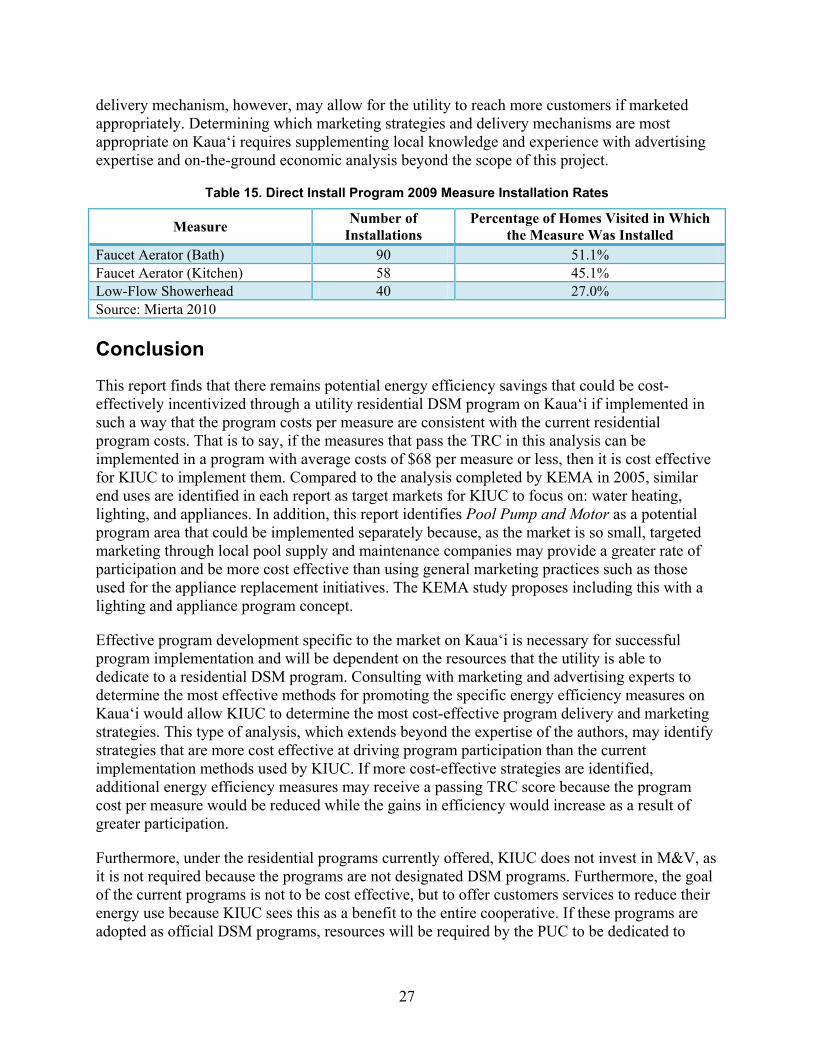
27
delivery mechanism, however, may allow for the utility to reach more customers if marketed appropriately. Determining which marketing strategies and delivery mechanisms are most appropriate on Kaua‘i requires supplementing local knowledge and experience with advertising expertise and on-the-ground economic analysis beyond the scope of this project.
Table 15. Direct Install Program 2009 Measure Installation Rates
Measure Number of Installations
Percentage of Homes Visited in Which the Measure Was Installed
Faucet Aerator (Bath) 90 51.1% Faucet Aerator (Kitchen) 58 45.1% Low-Flow Showerhead 40 27.0% Source: Mierta 2010 Conclusion
This report finds that there remains potential energy efficiency savings that could be cost-effectively incentivized through a utility residential DSM program on Kaua‘i if implemented in such a way that the program costs per measure are consistent with the current residential program costs. That is to say, if the measures that pass the TRC in this analysis can be implemented in a program with average costs of $68 per measure or less, then it is cost effective for KIUC to implement them. Compared to the analysis completed by KEMA in 2005, similar end uses are identified in each report as target markets for KIUC to focus on: water heating, lighting, and appliances. In addition, this report identifies Pool Pump and Motor as a potential program area that could be implemented separately because, as the market is so small, targeted marketing through local pool supply and maintenance companies may provide a greater rate of participation and be more cost effective than using general marketing practices such as those used for the appliance replacement initiatives. The KEMA study proposes including this with a lighting and appliance program concept.
Effective program development specific to the market on Kaua‘i is necessary for successful program implementation and will be dependent on the resources that the utility is able to dedicate to a residential DSM program. Consulting with marketing and advertising experts to determine the most effective methods for promoting the specific energy efficiency measures on Kaua‘i would allow KIUC to determine the most cost-effective program delivery and marketing strategies. This type of analysis, which extends beyond the expertise of the authors, may identify strategies that are more cost effective at driving program participation than the current implementation methods used by KIUC. If more cost-effective strategies are identified, additional energy efficiency measures may receive a passing TRC score because the program cost per measure would be reduced while the gains in efficiency would increase as a result of greater participation.
Furthermore, under the residential programs currently offered, KIUC does not invest in M&V, as it is not required because the programs are not designated DSM programs. Furthermore, the goal of the current programs is not to be cost effective, but to offer customers services to reduce their energy use because KIUC sees this as a benefit to the entire cooperative. If these programs are adopted as official DSM programs, resources will be required by the PUC to be dedicated to
28
M&V to ensure that the programs implemented are achieving the appropriate levels of energy efficiency improvements. According to efficiency program best practices, regardless of whether or not a utility-supported efficiency program is required to measure and verify savings, doing so is considered to be extremely valuable. For example, M&V is a critical tool for informing program revision as well as for demonstrating to stockholders or, in the case of KIUC, members that the utility’s resources are being used cost effectively.
As mentioned throughout this report, the cost, benefit, and market penetration data has been updated where possible. However, due to the limited scope of this update, some data, particularly market penetration data, cannot be updated without further on-the-ground surveys of technology saturation in homes on Kaua‘i. Future work in this area would provide an enhanced understanding of the existing market for specific technologies and allow KIUC to refine marketing strategies and program design to better target specific customers and programs.
29
References
[BAH] Booz Allen Hamilton. (2010). Patrick Finch, Personal communication with Sarah Busche. January 2010.
[B&V] Black & Veatch. (2008). “Integrated Resource Plan.” Accessed November 2009. http://www.kiuc.coop/IRP/Tariff/IRP2008_2008%20KIUC%20IRP.PDF.
Blumstein, C.; Goldman, C.; Barbose, G. (2005). “Who Should Administer Energy-Efficiency Programs?” Energy Policy 33, pp. 1053–1067.
[CPUC] California Public Utilities Commission. (2001). “California Standard Practice Manual – Economic Analysis of Demand-Side Programs and Projects.” Accessed December 2009. http://www.energy.ca.gov/greenbuilding/documents/background/07-J_CPUC_STANDARD_PRACTICE_MANUAL.PDF.
[DBEDT] Department of Business, Economic Development & Tourism. (2009a). “State of Hawaii Data Book – 2008.” Accessed January 2010. http://hawaii.gov/dbedt/info/economic/databook/.
DBEDT. (2009b). “State of Hawaii Data Book – 2000-2008, table 17.10.” Accessed January 2010. http://hawaii.gov/dbedt/info/economic/databook/.
[DSIRE] Database of State Incentives for Renewables & Efficiency. (2009). “Hawaii Renewable Portfolio Standard.” North Carolina State University. Accessed January 2010. http://dsireusa.org/incentives/incentive.cfm?Incentive_Code=HI06R&re=1&ee=1.
Dulleck, U.; Kaufmann, S. (2004). “Do Customer Information Programs Reduce Household Electricity Demand? – The Irish Program.” Energy Policy 32, pp. 1025–1032.
[EERE/DOE] Energy Efficiency and Renewable Energy/U.S. Department of Energy. (2001). “Making Paradise More Affordable with Weatherization.” Accessed July 2009. http://apps1.eere.energy.gov/weatherization/pdfs/states/30650.pdf.
[EIA] Energy Information Administration. (2010). “Average Monthly Bill by Census Division, and State 2008.” U.S. Department of Energy’s Energy Information Administration. Accessed February 2010. http://www.eia.doe.gov/cneaf/electricity/esr/table5.html.
[EPA] U.S. Environmental Protection Agency. (2009). “Hawaii State Best Practices.” Accessed January 2010. http://www.epa.gov/rdee/energy-programs/state-and-local/states/hi.html.
Geller, H.; Nadel, S. (1994). “Market Transformation Strategies to Promote End-Use Efficiency.” ACEEE: Washington, D.C.
Karney, R. H. (2009). “Letter to ENERGY STAR CFL Stakeholders.” Department of Energy. Accessed February 2010.
http://drintl.com/HtmlEmail/CFL/DOE%20CFL%20Letter_SummitFollowUp_Sept09.pdf.
30
KEMA. (2005). “Energy Efficiency Potential Study.” Kauai Island Utility Cooperative. Accessed October 2009. http://www.kiuc.coop/IRP/Tariff/Appendix%20E%20KEMA.pdf
[KIUC] Kauai Island Utility Cooperative. (2005). “Annual Program Accomplishments and Surcharge Report – 2005.”
KIUC. (2009). “Effective Rates for December 1, 2009.” Accessed December 2009. http://www.kiuc.coop/pdf/ratedata_2009.pdf.
[Kauai] County of Kauai. (2010). “Appliance Recycling.” Accessed February 2010. http://www.kauai.gov/Government/Departments/PublicWorks/RecyclingPrograms/ApplianceRecycling/tabid/110/Default.aspx.
Kushler, M.; York, D.; Witte, P. (2005). “Meeting Essential Needs: The Results of a National Search for Exemplary Utility-Funded Low-Income Energy Efficiency Programs.” American Council for an Energy-Efficiency Economy. Accessed February 2010. http://aceee.org/pubs/u053.pdf?CFID=3895764&CFTOKEN=90104255.
Levine, M. D.; Sonnenblick, R. (1994). “On the Assessment of Utility Demand-Side Management Programs.” Energy Policy 22 (10), pp. 848–856.
Mierta, R. (2010). Kauai Island Utility Cooperative. Personal communication to Sarah Busche, Stephen Hockett, and Elizabeth Doris.
Nadel, S.; Geller, H. (1996). “Utility DSM. What Have We Learned? Where Are We Going?” Energy Policy 24 (4), pp. 289–302.
NAPEE. (2010). “Customer Incentives for Energy Efficiency Through Program Offerings.” National Action Plan for Energy Efficiency. U.S. Environmental Protection Agency. Accessed February 2010. http://www.epa.gov/cleanenergy/documents/program_incentives.pdf.
Quantum Consulting. (2004a). “National Energy Efficiency Best Practices Study: Crosscutting – Advertising Best Practices Report.” Best Practices Benchmarking for Energy Efficiency Programs. California Public Utilities Commission. Accessed February 2010. http://www.eebestpractices.com/pdf/BP_O1.PDF.
Quantum Consulting. (2004b). “National Energy Efficiency Best Practices Study: Residential Audit Programs Best Practices Report.” Best Practices Benchmarking for Energy Efficiency Programs. California Public Utilities Commission. Accessed February 2010. http://www.eebestpractices.com/pdf/BP_R7.PDF.
Quantum Consulting. (2004c). “National Energy Efficiency Best Practices Study: Residential Lighting Best Practices Report.” Best Practices Benchmarking for Energy Efficiency Programs. California Public Utilities Commission. Accessed February 2010. http://www.eebestpractices.com/pdf/BP_R1.PDF
Quantum Consulting. (2004d). “National Energy Efficiency Best Practices Study: Residential Single-Family Comprehensive Weatherization Best Practices Report.” Best Practices
31
Benchmarking for Energy Efficiency Programs. California Public Utilities Commission. Accessed February 2010. http://www.eebestpractices.com/pdf/BP_R4.PDF
Quantum Consulting. (2004e). “National Energy Efficiency Best Practices Study: Residential Multi-Family Comprehensive Best Practices Report.” Best Practices Benchmarking for Energy Efficiency Programs. California Public Utilities Commission. Accessed Feb 2010. http://www.eebestpractices.com/pdf/BP_R5.PDF
Quantum Consulting. (2008). “National Energy Efficiency Best Practices Study: Portfolio Best Practices Report.” Best Practices Benchmarking for Energy Efficiency Programs. California Public Utilities Commission. Accessed Feb 2010. http://www.eebestpractices.com/pdf/Portfolio_BP_Report.pdf
Sovacool, B. K. (2009). “The Importance of Comprehensiveness in Renewable Electricity and Energy-Efficiency Policy.” Energy Policy 37, pp. 1529–1541.
Summit Blue. (2007). “Strategic Marketing Plan.” Prepared by Summit Blue Consulting for Bonneville Power Administration. Summit Blue Consulting. Accessed February 2010. http://www.bpa.gov/Energy/N/reports/Strategic_Marketing/pdf/SMReport.pdf
Vine, E.; Rhee, C. H.; Lee, K. D. (2006). “Measurement and Evaluation of Energy Efficiency Programs: California and South Korea.” Energy 31 (6–7), pp. 1100–1113.
Walker, A. (2008). “Cost-Effectiveness of Solar Water Heating in Hawaii.” National Renewable Energy Laboratory. Accessed February 2010. http://www.hawaiicleanenergyinitiative.org/pdfs/shw_2008.pdf.
Wilson, E. J.; Plummer, J.; Fischlein, M.; Smith, T. M. (2008). “Implementing Energy Efficiency: Challenges and Opportunities for Rural Electric Co-Operatives and Small Municipal Utilities.” Energy Policy 36, pp. 3383–3397.
York, D.; Kushler, M. (2003). “America’s Best: Profiles of America’s Leading Energy Efficiency Programs.” American Council for an Energy-Efficiency Economy. Accessed February 2010. http://www.aceee.org/pubs/u032.htm
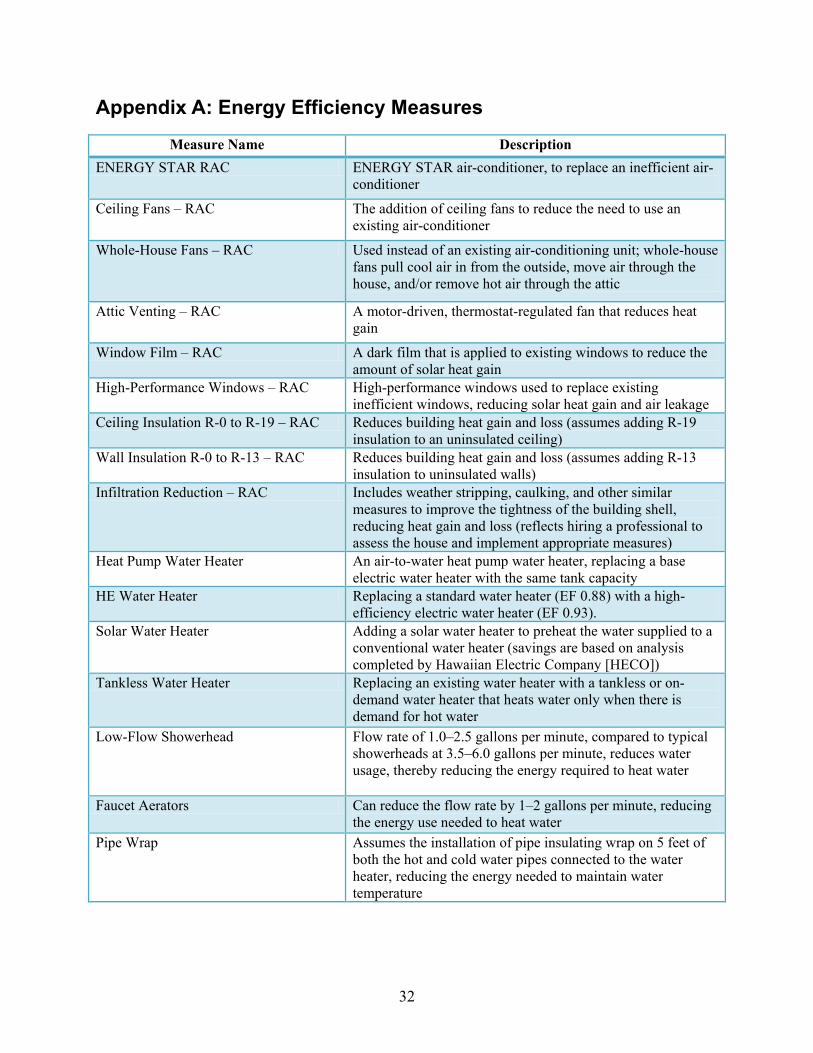
32
Appendix A: Energy Efficiency Measures
Measure Name Description ENERGY STAR RAC ENERGY STAR air-conditioner, to replace an inefficient air-
conditioner
Ceiling Fans – RAC The addition of ceiling fans to reduce the need to use an existing air-conditioner
Whole-House Fans – RAC Used instead of an existing air-conditioning unit; whole-house fans pull cool air in from the outside, move air through the house, and/or remove hot air through the attic
Attic Venting – RAC A motor-driven, thermostat-regulated fan that reduces heat gain
Window Film – RAC A dark film that is applied to existing windows to reduce the amount of solar heat gain
High-Performance Windows – RAC High-performance windows used to replace existing inefficient windows, reducing solar heat gain and air leakage
Ceiling Insulation R-0 to R-19 – RAC Reduces building heat gain and loss (assumes adding R-19 insulation to an uninsulated ceiling)
Wall Insulation R-0 to R-13 – RAC Reduces building heat gain and loss (assumes adding R-13 insulation to uninsulated walls)
Infiltration Reduction – RAC Includes weather stripping, caulking, and other similar measures to improve the tightness of the building shell, reducing heat gain and loss (reflects hiring a professional to assess the house and implement appropriate measures)
Heat Pump Water Heater An air-to-water heat pump water heater, replacing a base electric water heater with the same tank capacity
HE Water Heater Replacing a standard water heater (EF 0.88) with a high-efficiency electric water heater (EF 0.93).
Solar Water Heater Adding a solar water heater to preheat the water supplied to a conventional water heater (savings are based on analysis completed by Hawaiian Electric Company [HECO])
Tankless Water Heater Replacing an existing water heater with a tankless or on-demand water heater that heats water only when there is demand for hot water
Low-Flow Showerhead Flow rate of 1.0–2.5 gallons per minute, compared to typical showerheads at 3.5–6.0 gallons per minute, reduces water usage, thereby reducing the energy required to heat water
Faucet Aerators Can reduce the flow rate by 1–2 gallons per minute, reducing the energy use needed to heat water
Pipe Wrap Assumes the installation of pipe insulating wrap on 5 feet of both the hot and cold water pipes connected to the water heater, reducing the energy needed to maintain water temperature
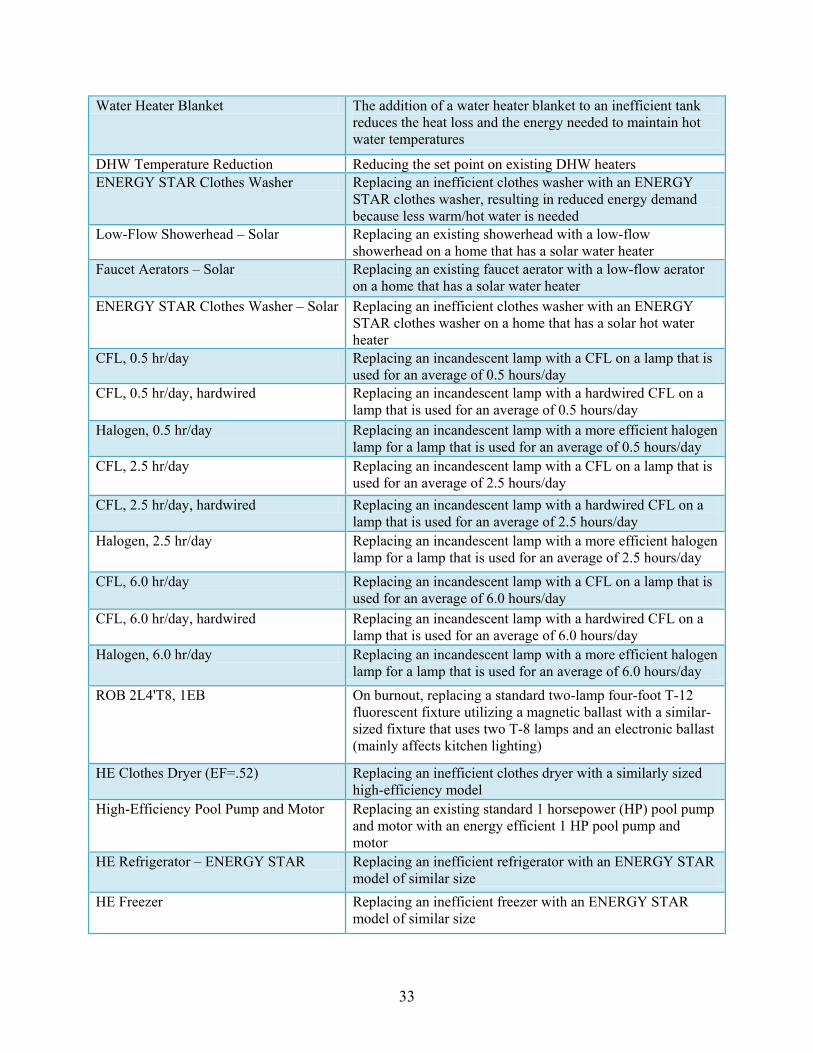
33
Water Heater Blanket The addition of a water heater blanket to an inefficient tank reduces the heat loss and the energy needed to maintain hot water temperatures
DHW Temperature Reduction Reducing the set point on existing DHW heaters ENERGY STAR Clothes Washer Replacing an inefficient clothes washer with an ENERGY
STAR clothes washer, resulting in reduced energy demand because less warm/hot water is needed
Low-Flow Showerhead – Solar Replacing an existing showerhead with a low-flow showerhead on a home that has a solar water heater
Faucet Aerators – Solar Replacing an existing faucet aerator with a low-flow aerator on a home that has a solar water heater
ENERGY STAR Clothes Washer – Solar Replacing an inefficient clothes washer with an ENERGY STAR clothes washer on a home that has a solar hot water heater
CFL, 0.5 hr/day Replacing an incandescent lamp with a CFL on a lamp that is used for an average of 0.5 hours/day
CFL, 0.5 hr/day, hardwired Replacing an incandescent lamp with a hardwired CFL on a lamp that is used for an average of 0.5 hours/day
Halogen, 0.5 hr/day Replacing an incandescent lamp with a more efficient halogen lamp for a lamp that is used for an average of 0.5 hours/day
CFL, 2.5 hr/day Replacing an incandescent lamp with a CFL on a lamp that is used for an average of 2.5 hours/day
CFL, 2.5 hr/day, hardwired Replacing an incandescent lamp with a hardwired CFL on a lamp that is used for an average of 2.5 hours/day
Halogen, 2.5 hr/day Replacing an incandescent lamp with a more efficient halogen lamp for a lamp that is used for an average of 2.5 hours/day
CFL, 6.0 hr/day Replacing an incandescent lamp with a CFL on a lamp that is used for an average of 6.0 hours/day
CFL, 6.0 hr/day, hardwired Replacing an incandescent lamp with a hardwired CFL on a lamp that is used for an average of 6.0 hours/day
Halogen, 6.0 hr/day Replacing an incandescent lamp with a more efficient halogen lamp for a lamp that is used for an average of 6.0 hours/day
ROB 2L4'T8, 1EB On burnout, replacing a standard two-lamp four-foot T-12 fluorescent fixture utilizing a magnetic ballast with a similar-sized fixture that uses two T-8 lamps and an electronic ballast (mainly affects kitchen lighting)
HE Clothes Dryer (EF=.52) Replacing an inefficient clothes dryer with a similarly sized high-efficiency model
High-Efficiency Pool Pump and Motor Replacing an existing standard 1 horsepower (HP) pool pump and motor with an energy efficient 1 HP pool pump and motor
HE Refrigerator – ENERGY STAR Replacing an inefficient refrigerator with an ENERGY STAR model of similar size
HE Freezer Replacing an inefficient freezer with an ENERGY STAR model of similar size
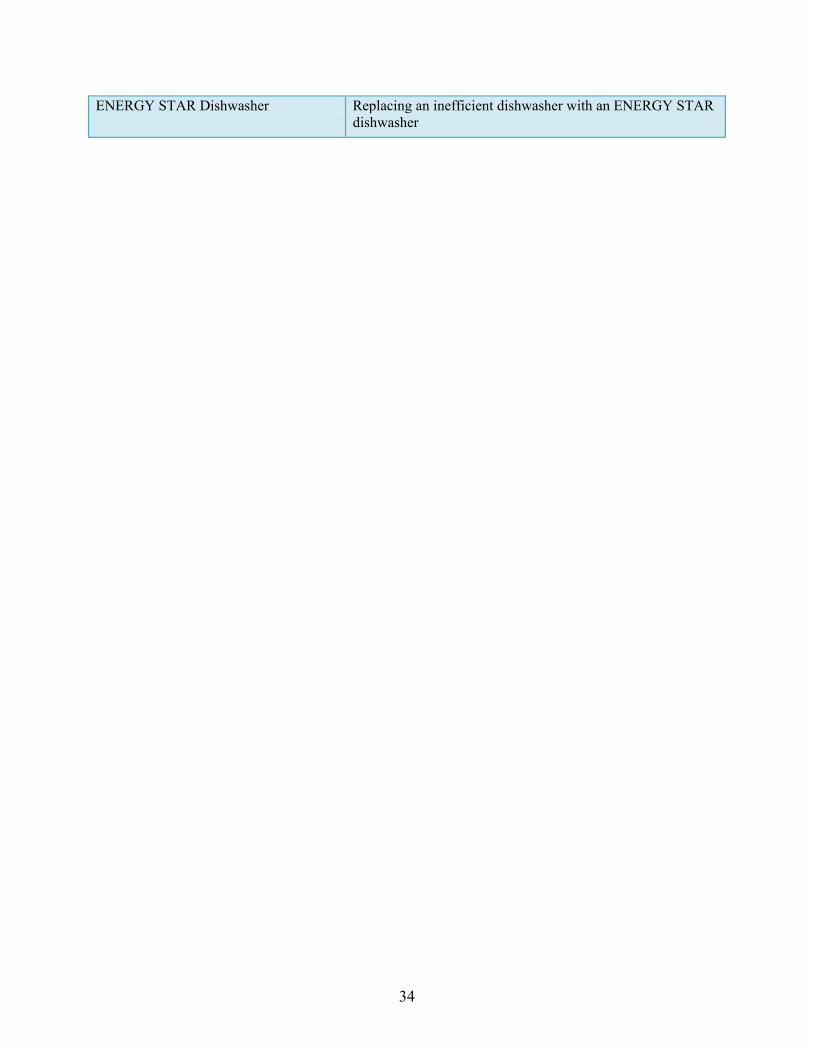
34
ENERGY STAR Dishwasher Replacing an inefficient dishwasher with an ENERGY STAR dishwasher
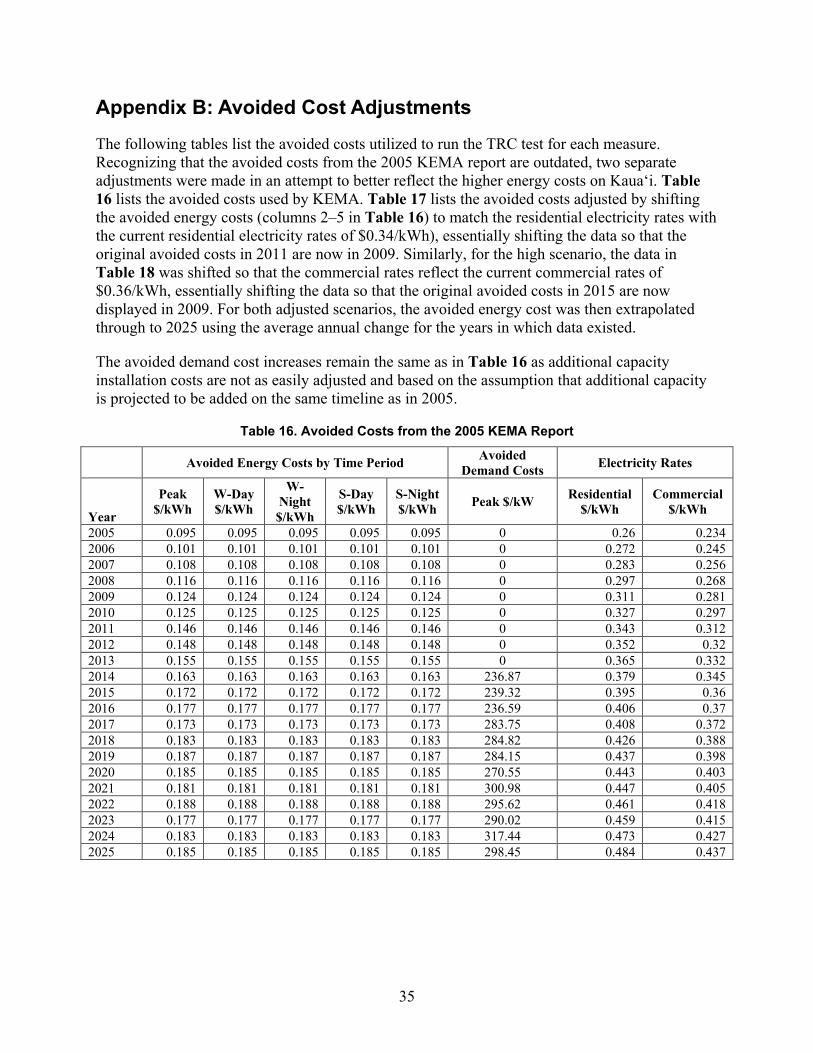
35
Appendix B: Avoided Cost Adjustments
The following tables list the avoided costs utilized to run the TRC test for each measure. Recognizing that the avoided costs from the 2005 KEMA report are outdated, two separate adjustments were made in an attempt to better reflect the higher energy costs on Kaua‘i. Table 16 lists the avoided costs used by KEMA. Table 17 lists the avoided costs adjusted by shifting the avoided energy costs (columns 2–5 in Table 16) to match the residential electricity rates with the current residential electricity rates of $0.34/kWh), essentially shifting the data so that the original avoided costs in 2011 are now in 2009. Similarly, for the high scenario, the data in Table 18 was shifted so that the commercial rates reflect the current commercial rates of $0.36/kWh, essentially shifting the data so that the original avoided costs in 2015 are now displayed in 2009. For both adjusted scenarios, the avoided energy cost was then extrapolated through to 2025 using the average annual change for the years in which data existed.
The avoided demand cost increases remain the same as in Table 16 as additional capacity installation costs are not as easily adjusted and based on the assumption that additional capacity is projected to be added on the same timeline as in 2005.
Table 16. Avoided Costs from the 2005 KEMA Report
Avoided Energy Costs by Time Period Avoided Demand Costs Electricity Rates
Year
Peak $/kWh
W-Day $/kWh
W-Night
$/kWh
S-Day $/kWh
S-Night $/kWh Peak $/kW Residential
$/kWh Commercial
$/kWh
2005 0.095 0.095 0.095 0.095 0.095 0 0.26 0.234 2006 0.101 0.101 0.101 0.101 0.101 0 0.272 0.245 2007 0.108 0.108 0.108 0.108 0.108 0 0.283 0.256 2008 0.116 0.116 0.116 0.116 0.116 0 0.297 0.268 2009 0.124 0.124 0.124 0.124 0.124 0 0.311 0.281 2010 0.125 0.125 0.125 0.125 0.125 0 0.327 0.297 2011 0.146 0.146 0.146 0.146 0.146 0 0.343 0.312 2012 0.148 0.148 0.148 0.148 0.148 0 0.352 0.32 2013 0.155 0.155 0.155 0.155 0.155 0 0.365 0.332 2014 0.163 0.163 0.163 0.163 0.163 236.87 0.379 0.345 2015 0.172 0.172 0.172 0.172 0.172 239.32 0.395 0.36 2016 0.177 0.177 0.177 0.177 0.177 236.59 0.406 0.37 2017 0.173 0.173 0.173 0.173 0.173 283.75 0.408 0.372 2018 0.183 0.183 0.183 0.183 0.183 284.82 0.426 0.388 2019 0.187 0.187 0.187 0.187 0.187 284.15 0.437 0.398 2020 0.185 0.185 0.185 0.185 0.185 270.55 0.443 0.403 2021 0.181 0.181 0.181 0.181 0.181 300.98 0.447 0.405 2022 0.188 0.188 0.188 0.188 0.188 295.62 0.461 0.418 2023 0.177 0.177 0.177 0.177 0.177 290.02 0.459 0.415 2024 0.183 0.183 0.183 0.183 0.183 317.44 0.473 0.427 2025 0.185 0.185 0.185 0.185 0.185 298.45 0.484 0.437
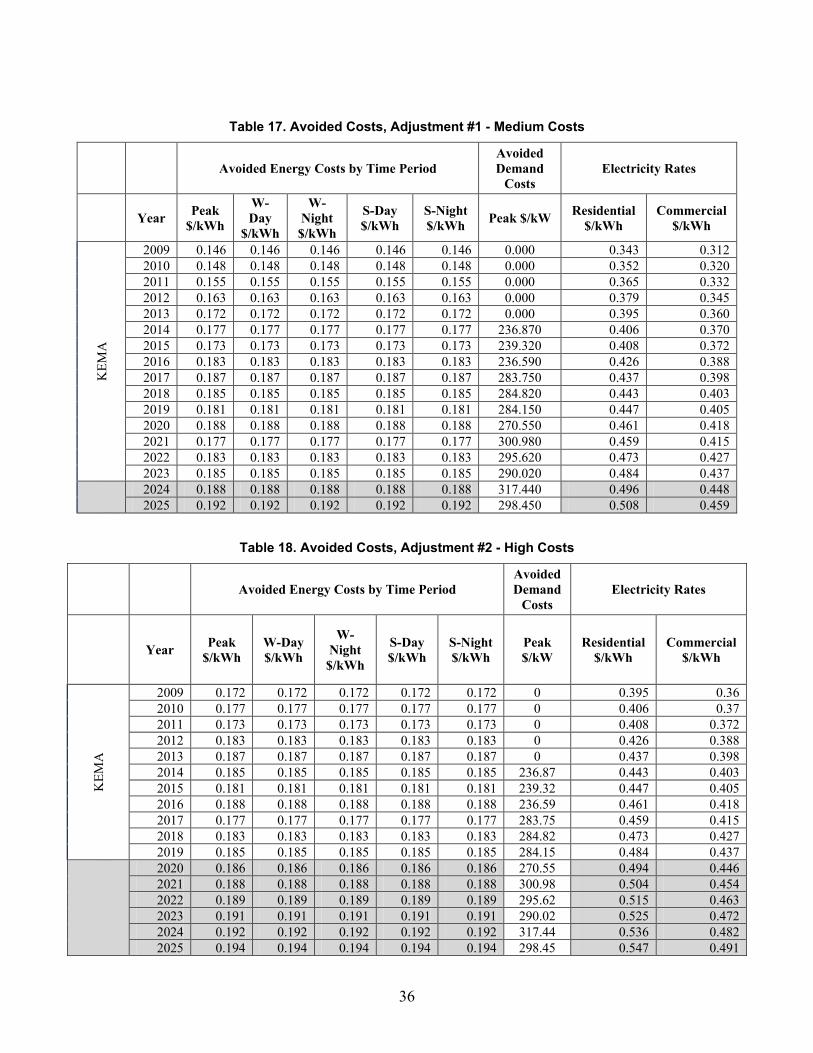
36
Table 17. Avoided Costs, Adjustment #1 - Medium Costs
Avoided Energy Costs by Time Period Avoided Demand
Costs Electricity Rates
Year Peak
$/kWh
W-Day
$/kWh
W-Night $/kWh
S-Day $/kWh
S-Night $/kWh Peak $/kW Residential
$/kWh Commercial
$/kWh
KEM
A
2009 0.146 0.146 0.146 0.146 0.146 0.000 0.343 0.312 2010 0.148 0.148 0.148 0.148 0.148 0.000 0.352 0.320 2011 0.155 0.155 0.155 0.155 0.155 0.000 0.365 0.332 2012 0.163 0.163 0.163 0.163 0.163 0.000 0.379 0.345 2013 0.172 0.172 0.172 0.172 0.172 0.000 0.395 0.360 2014 0.177 0.177 0.177 0.177 0.177 236.870 0.406 0.370 2015 0.173 0.173 0.173 0.173 0.173 239.320 0.408 0.372 2016 0.183 0.183 0.183 0.183 0.183 236.590 0.426 0.388 2017 0.187 0.187 0.187 0.187 0.187 283.750 0.437 0.398 2018 0.185 0.185 0.185 0.185 0.185 284.820 0.443 0.403 2019 0.181 0.181 0.181 0.181 0.181 284.150 0.447 0.405 2020 0.188 0.188 0.188 0.188 0.188 270.550 0.461 0.418 2021 0.177 0.177 0.177 0.177 0.177 300.980 0.459 0.415 2022 0.183 0.183 0.183 0.183 0.183 295.620 0.473 0.427 2023 0.185 0.185 0.185 0.185 0.185 290.020 0.484 0.437
2024 0.188 0.188 0.188 0.188 0.188 317.440 0.496 0.448 2025 0.192 0.192 0.192 0.192 0.192 298.450 0.508 0.459
Table 18. Avoided Costs, Adjustment #2 - High Costs
Avoided Energy Costs by Time Period Avoided Demand
Costs Electricity Rates
Year Peak $/kWh
W-Day $/kWh
W-Night $/kWh
S-Day $/kWh
S-Night $/kWh
Peak $/kW
Residential $/kWh
Commercial $/kWh
KEM
A
2009 0.172 0.172 0.172 0.172 0.172 0 0.395 0.36 2010 0.177 0.177 0.177 0.177 0.177 0 0.406 0.37 2011 0.173 0.173 0.173 0.173 0.173 0 0.408 0.372 2012 0.183 0.183 0.183 0.183 0.183 0 0.426 0.388 2013 0.187 0.187 0.187 0.187 0.187 0 0.437 0.398 2014 0.185 0.185 0.185 0.185 0.185 236.87 0.443 0.403 2015 0.181 0.181 0.181 0.181 0.181 239.32 0.447 0.405 2016 0.188 0.188 0.188 0.188 0.188 236.59 0.461 0.418 2017 0.177 0.177 0.177 0.177 0.177 283.75 0.459 0.415 2018 0.183 0.183 0.183 0.183 0.183 284.82 0.473 0.427 2019 0.185 0.185 0.185 0.185 0.185 284.15 0.484 0.437
2020 0.186 0.186 0.186 0.186 0.186 270.55 0.494 0.446 2021 0.188 0.188 0.188 0.188 0.188 300.98 0.504 0.454 2022 0.189 0.189 0.189 0.189 0.189 295.62 0.515 0.463 2023 0.191 0.191 0.191 0.191 0.191 290.02 0.525 0.472 2024 0.192 0.192 0.192 0.192 0.192 317.44 0.536 0.482 2025 0.194 0.194 0.194 0.194 0.194 298.45 0.547 0.491
F1146-E(10/2008)
REPORT DOCUMENTATION PAGE Form Approved OMB No. 0704-0188
The public reporting burden for this collection of information is estimated to average 1 hour per response, including the time for reviewing instructions, searching existing data sources, gathering and maintaining the data needed, and completing and reviewing the collection of information. Send comments regarding this burden estimate or any other aspect of this collection of information, including suggestions for reducing the burden, to Department of Defense, Executive Services and Communications Directorate (0704-0188). Respondents should be aware that notwithstanding any other provision of law, no person shall be subject to any penalty for failing to comply with a collection of information if it does not display a currently valid OMB control number. PLEASE DO NOT RETURN YOUR FORM TO THE ABOVE ORGANIZATION. 1. REPORT DATE (DD-MM-YYYY)
June 2010 2. REPORT TYPE
Technical Report 3. DATES COVERED (From - To)
4. TITLE AND SUBTITLE
Identifying Cost-Effective Residential Energy Efficiency Opportunities for the Kauai Island Utility Cooperative
5a. CONTRACT NUMBER DE-AC36-08-GO28308
5b. GRANT NUMBER
5c. PROGRAM ELEMENT NUMBER
6. AUTHOR(S) S. Busche and S. Hockett
5d. PROJECT NUMBER NREL/TP-7A2-48267
5e. TASK NUMBER IDHW.9170
5f. WORK UNIT NUMBER
7. PERFORMING ORGANIZATION NAME(S) AND ADDRESS(ES) National Renewable Energy Laboratory 1617 Cole Blvd. Golden, CO 80401-3393
8. PERFORMING ORGANIZATION REPORT NUMBER NREL/TP-7A2-48267
9. SPONSORING/MONITORING AGENCY NAME(S) AND ADDRESS(ES)
10. SPONSOR/MONITOR'S ACRONYM(S) NREL
11. SPONSORING/MONITORING AGENCY REPORT NUMBER
12. DISTRIBUTION AVAILABILITY STATEMENT National Technical Information Service U.S. Department of Commerce 5285 Port Royal Road Springfield, VA 22161
13. SUPPLEMENTARY NOTES
14. ABSTRACT (Maximum 200 Words) This analysis is an update to the 2005 Energy Efficiency Potential Study completed by KEMA for the Kauai Island Utility Cooperative (KIUC) and identifies potential energy efficiency opportunities in the residential sector on Kauai (KEMA 2005). The Total Resource Cost (TRC) test is used to determine which of the energy efficiency measures analyzed in the KEMA report are cost effective for KIUC to include in a residential energy efficiency program. This report finds that there remains potential energy efficiency savings that could be cost-effectively incentivized through a utility residential demand-side management program on Kauai if implemented in such a way that the program costs per measure are consistent with the current residential program costs.
15. SUBJECT TERMS Kauai; energy efficiency; residential energy efficiency; Kauai Island Utility Cooperative; Hawaii; Hawaii Clean Energy Initiative; HCEI
16. SECURITY CLASSIFICATION OF: 17. LIMITATION OF ABSTRACT
UL
18. NUMBER OF PAGES
19a. NAME OF RESPONSIBLE PERSON a. REPORT
Unclassified b. ABSTRACT Unclassified
c. THIS PAGE Unclassified 19b. TELEPHONE NUMBER (Include area code)
Standard Form 298 (Rev. 8/98) Prescribed by ANSI Std. Z39.18