identification of genes and molecular pathways …...identification of genes and molecular pathways...
TRANSCRIPT
Identification of genes and molecular pathways involvedin the progression of premalignant oral epithelia
Abhijit G. Banerjee,1 Indraneel Bhattacharyya,2
and Jamboor K. Vishwanatha3
1Department of Oral Biology, Faculty of Dentistry, HealthSciences Center, University of Manitoba, Winnipeg, Manitoba,Canada; 2Department of Oral and Maxillofacial Surgery and OralDiagnostic Sciences, College of Dentistry, University of Florida,Gainesville, Florida; and 3Department of Molecular Biology andImmunology, University of North Texas Health Science Center,Fort Worth, Texas
AbstractAn early interventional effort in oral premalignancy requiresnovel molecular targets and diagnostic biomarkers to delayor reverse incidences of malignant progression. Micro-array-based transcriptional profiling in disease statesprovides global insight into the causal biomolecularprocesses and novel pathways involved. In this study,we investigated transcript profiles in precancerous orallesions to identify nearly 1,700 genes as significantlyoverexpressed or underexpressed and a primarily affectedmetabolic pathway that may be responsible for irreversibletransition to progressive stages of oral cancer. For the firsttime, we show a convergence of several genes andpathways known for their oncogenic capabilities, inprogression of premalignant oral epithelial tissues. Thisstudy consequently provides a molecular basis for persis-tent proinflammatory conditions in oral premalignanttissues. We found that lipocalin-type prostaglandin D2
synthase (PTGDS), a key enzyme in the arachidonic acidmetabolism pathway, as repressed in premalignant stages.We show the protective role of these enzyme-derivedmetabolites in inhibiting cell proliferation using an in vitrooral cancer progression model. We have also confirmed theoverexpression of two invasion-related biomarkers, psor-iasin (PSOR1) and versican (CSPG2), in oral premalignant
and malignant archival tissues. Our results clearly indicatethat pharmacologic intervention with anti-inflammatoryprostaglandin D2–like analogues may help prevent or delayoral epithelial carcinogenesis because of metabolic resto-ration of a negative feedback regulatory loop through itsseveral cognate receptors or target molecules. Furtherstudies directed toward a multitude of possible protectivemechanisms of this lipocalin-type enzyme or its products inoral cancer progression are warranted. [Mol Cancer Ther2005;4(6):865–75]
IntroductionOral precancer is an ideal stage for preventive measuresbecause morbidity associated with malignant transforma-tion is high. The survival rate for patients with oral cancer at5 years postdiagnosis is very low (f55%) despite improvedmethods of diagnosis, accessibility, and treatment (1).Intraepithelial neoplasia of the oral cavity, such as oralleukoplakia or erythroleukoplakia, occurs in 1% to 10% ofthe adult population in the Western world. Almost 17.5% ofthese progress to malignancy by 8 years, but the rateof malignant conversion for dysplasia, an advanced prema-lignant stage, at initial biopsy jumps up to 36.4% (2, 3). Thecurrent optimal treatment, including surgical removal of thelesion, is inadequate due to wide exposure of carcinogensover a large mucosal surface, resulting in ‘‘field cancer-ization’’ (4). Hence, there is a basic unmet medical need todevelop better diagnostic measures and therapeutic targets.
Transcriptional profiling in premalignant stages is crucialfor revealing molecular and biological changes that resultbecause of oral epithelial transformation. We investigatedgene expression profiles of the human oral precanceroustissue specimens and compared it to a known less aggres-sive variant of premalignant (verrucous hyperplasia) andmalignant oral tissue (verrucous carcinoma) that seldommetastasizes. We hypothesized that this strategy wouldpotentially identify differentially modulated genes thatmight be responsible for more aggressive behavior andimminent malignant potential. Such study may also pro-vide novel diagnostic or therapeutic targets at premalig-nant stages that can potentially reverse, reduce, or at leastdelay the rates of malignant conversion in future. The de-velopment of a molecular diagnostic test based on theidentified signature expression profile will help screen andidentify a population or individuals at risk throughminimal invasive procedures, such as periodic brushbiopsies followed by multiplex reverse transcription-PCRanalysis. Early intervention strategies can use such expres-sion signatures as surrogate end point biomarkers of effi-cacy. In our study, we have also used cellular assays on anin vitro oral cancer progression model to validate a novelmolecular target in a prominently perturbed pathway
Received 2/1/05; revised 3/9/05; accepted 4/13/05.
Grant support: Philip Morris USA and Nebraska Cancer and SmokingDisease Research Program (J.K. Vishwanatha), National Cancer InstituteCancer Center grant T30CA36727, and Nebraska Biomedical ResearchInfrastructure grants.
The costs of publication of this article were defrayed in part by thepayment of page charges. This article must therefore be hereby markedadvertisement in accordance with 18 U.S.C. Section 1734 solely toindicate this fact.
Note: All authors were previously associated with University of NebraskaMedical Center. The studies were done at the senior author(J.K. Vishwanatha)’s laboratories at University of NebraskaMedical Center.
Requests for reprints: Abhijit G. Banerjee, Department of Oral Biology,Faculty of Dentistry, Health Sciences Center, University of Manitoba,D-303, 780 Bannatyne Avenue, Winnipeg, Manitoba,Canada R3E 0W2. Phone: 204-789-3708; Fax: 204-789-3913.E-mail: [email protected]
Copyright C 2005 American Association for Cancer Research.
865
Mol Cancer Ther 2005;4(6). June 2005
on May 2, 2017. © 2005 American Association for Cancer Research. mct.aacrjournals.org Downloaded from

involved in protection from early carcinogenic events.Therefore, this study may provide a molecular basis andinnovative approaches for clinical intervention to preventoral cancer progression in the near future.
Materials andMethodsTissue Specimens and Cell LinesThe oral biopsy specimens (n = 12) from the human
subjects were collected as per the approved guidelines ofthe institutional review board (University of NebraskaMedical Center, Omaha, NE) with written informedconsent of the patients attending regular oral health clinicsand described in Results. Similarly, paraffin-embedded oraltissues (n = 20), previously fixed in 10% neutral bufferedformalin, were obtained for immunohistochemical analysis.Cell lines of an oral cancer progression model (n = 4) weremaintained as previously described (5).
Experimental DesignTo investigate gene expression profiles, paired premalig-
nant and normal adjacent tissues (n = 6) of oral cavity werecompared within or outside similar diagnostic and patho-logic description provided by an oral pathologist(I. Bhattacharyya) involved in this study. As per knownclinical behavior of oral carcinomas, the less invasive sampleof a paired premalignant oral tissue—verrucous hyperpla-sia and a seldom metastatic, yet malignant, variant calledverrucous carcinoma (n = 2)—was included as a biologicalvariant control. This control pair of tissues is hypothesizedto help identify sets of differentially expressed genes in oraldysplasia that relates to a rather more invasive phenotypeand imminent progression to malignancy. The identified setof genes were further confirmed with similar gene expres-sion profiles of additional unpaired oral premalignantbiopsy specimens (n = 2) to arrive at a list of significantlyoverexpressed or underexpressed genes.
Transcriptional Profiling by GenechipMicroarrayTotal RNA was isolated from the frozen biopsy speci-
mens by embedding in OCT compound (VWR Scientific,San Diego, CA), cryosectioning into thin slices of 5 Am,followed by extraction of the tissues in TRIzol reagent(Invitrogen, Carlsbad, CA) and secondary cleanup usingthe RNeasy mini kit (Qiagen, Valencia, CA). The qualityand quantity of total RNA were characterized using theRNA Nanochip 6000 kit on a Bioanalyzer 2100 (AgilentTechnologies, Foster City, CA). Total RNA (100 ng),meeting desired criteria of purity and integrity from eachspecimen, was used as a starting material for biotin-labeledcRNA probe synthesis using the Enzo BioArray high-yieldRNA transcript labeling kit (Enzo, New York, NY) andmodified small-sample amplification protocol (6). Frag-mented cRNA (15 Ag) was hybridized to human 133AGenechip Oligonucleotide microarray (Affymetrix, Inc.,Santa Clara, CA). Posthybridization, the arrays werewashed, stained with streptavidin-phycoerythrin fluores-cent conjugates using Affymetrix Micro-Fluidics Station400, and scanned for digital output intensity files (*.cel)using a Hewlett-Packard Gene Array Scanner.
Data Analysis and StatisticalValidationEach intensity output file (*.cel) for a hybridized tissue
specimen was initially analyzed for probe hybridizationquality control parameters, such as average background,target intensity, and raw noise (Q) values, to ascertain theappropriate gene expression profile analysis using theMicroarray Suite (MAS 5.0) software (Affymetrix). Toidentify a differential gene expression pattern, we usedthe normal tissue expression profile as baseline for eachpaired premalignant tissue specimens in a comparisonanalysis using the Data Mining Tool (DMT-3.0) software(Affymetrix). The MAS 5.0 software uses the one-sidedWilcoxon’s signed rank test as the statistical methodto generate a detection P value based on a discrimina-tion score (R) derived using the equation R = (PM � MM)/ (PM + MM) for each probe pair, where PM denotesperfect match and MM denotes mismatch. Sixteen suchprobe pairs in the array represent the total length of eachgene transcript. The discrimination score is a basic propertyof a probe pair that describes its ability to detect itsintended target. It measures the target-specific intensitydifference of the probe pair (PM � MM) relative to itsoverall hybridization intensity (PM + MM). Only if thedetection P value is equal or below the default thresholdvalue of 0.04 is it called present (P). The data analysismanual (PDF file) downloadable from the Affymetrixwebsite provides further details of the statistical algorithmsand is only mentioned here in brief. In a comparisonanalysis, two samples, hybridized to two Genechip probearrays of the same type, are compared against each other todetect and quantify changes in gene expression. A changealgorithm generates a Change P value again based on theWilcoxon’s signed rank test and an associated Change.A second algorithm produces a quantitative estimate of thechange in gene expression in the form of signal log ratio.The increase (I), decrease (D), or No (N) Change callsbetween two array sets (such as normal versus diseasedsample) is based on such comparison analysis dependingon the change P value. The P value ranges in scale from0.0 to 1.0 and provides a measure of the likelihood ofchange and direction. Values close to 0.0 indicate likelihoodfor an increase in transcript expression level in theexperiment array compared with the baseline, whereasvalues close to 1.0 indicate likelihood for a decrease intranscript expression level. The signal log ratio algorithmestimates the magnitude and direction of change of atranscript when two arrays are compared (experimentversus baseline). It is calculated by comparing each probepair on the experiment array to the corresponding probepair on the baseline array. This strategy cancels outdifferences due to different probe binding coefficients andis, therefore, more accurate than a single-array analysis.The log scale used is base 2, making it intuitive to inter-pret the signal log ratios in terms of multiples of 2. Thus,a signal log ratio of 1 indicates an increase of the transcriptlevel by 2-fold, and �1.0 indicates a decrease by 2-fold.As with signal, computation of this number uses a one-stepTukey’s biweight method by taking a mean of the log ratios
Transcriptome Profiles in Oral Premalignancy866
Mol Cancer Ther 2005;4(6). June 2005
on May 2, 2017. © 2005 American Association for Cancer Research. mct.aacrjournals.org Downloaded from

of probe pair intensities across the two arrays. The Tukey’sbiweight method gives an estimate of the amount ofvariation in the data exactly as SD measures the amountof variation for an average. The fold changes in geneexpression can be calculated using signal log ratios usingthe following equation: fold change = 2signal log ratio forsignal log ratio >0 and (�1) � 2�(signal log ratio) for signal logratio <0. A signal log ratio of zero means no change.
Gene Clustering and Significant Gene ProfilesHierarchical clustering analysis was done on the expres-
sion data set obtained upon MAS 5.0 analysis, with theGene Cluster program, and visualized using TreeViewprogram4 to group genes according to their similarities inthe expression levels thought to be linked in the diseaseprocess using an unsupervised clustering algorithm-basedsoftware (7). The set of probe IDs in a particular clusternode depicts values for coefficient of correlation (r2) andprovides significant gene expression profiles. Such tightcluster of altered genes were queried on the NetAffxanalysis center available at the Affymetrix website5 (8) anda downloadable program from the NIH, called EASE6,which provides Bonferroni’s correction and Fisher’s exactprobability values for the microarray expression data setsbesides annotations for the significant gene lists.
Quantitative Real-time PCRThe total RNA from all of the paired and unpaired frozen
biopsy specimens (n = 12) and cell lines of an oralprogression model (n = 4) were used in the real-time PCRanalysis. We analyzed a subset of four genes by quantita-tive real-time PCR using SYBR Green I technology–basedQuantiTect HotStarTaq PCR kit (Qiagen) on an ICycler PCRmachine (Bio-Rad, Hercules, CA). We did a melt curveanalysis to determine the specificity of each amplificationreaction based on GC content of an amplified DNAfragment and specific for a single amplified target.Appropriate gene-specific primers designed for the analy-sis and amplification conditions were as mentioned inTable 1. Relative fold changes in real-time PCR experiments
were calculated using a comparative CT (threshold cycle)equation (9) in reference to a housekeeping gene. We usedstatistical analysis tools of Microsoft Excel software todetermine the significance values.
Protein AnalysisImmunohistochemistry was done on 5-Am-thick sections
of paraffin-embedded oral premalignant biopsy specimens(n = 20) using psoriasin (10) and versican (11) specificprimary antibodies and Vectastain ABC peroxidase kits(Vector Labs, Burlingame, CA) as per protocols standard-ized earlier by us (12). We ran appropriate negativecontrols, including nonimmune serum (devoid of specificprimary antibodies), in parallel to ascertain positivestaining (>10% cells) in the specimens by light microscopy.We confirmed non–cross-reactivity of the immune serumon uninvolved and unrelated tissues before using it fordysplastic specimens as a standard control. We alsoconfirmed negative staining with nonimmune serum asstandard immunohistochemistry procedure on the samedysplastic specimens to rule out any nonspecific reactivity.We recorded the serial progressive specimens of dysplasiaat various photographic magnifications that ascertainpositive staining and localization.
Pathway Prediction AnalysisWe obtained the annotations regarding involved bio-
processes, molecular function, and cellular localizationusing the Gene Ontology database as links from NetAffx-derived annotation tables. The significant gene clustersqueried with the known components of biological path-ways on the KEGG database7 and a web-based software‘‘Ingenuity pathway analysis’’8 helped identify geneswithin known networks. These gene networks were mappedwith GenMAPP program9 to identify significant pathwaysinvolved in disease progression from premalignant stages tomalignancy.
Biological AssaysWe tested a protective anti-inflammatory gene as a
plausible biological target in the process [i.e., lipocalin-type
Table 1. Primer sequences and conditions used for quantitative real-time PCR
Primer pairs Sequences Amplification conditions
DCN forward CGAGTGGTCCAGTGTTCTGA Annealing temperature (60jC), 401 bp product melting temperature (82.5jC)DCN reverse AAAGCCCCATTTTCAATTCCPTGDS forward CTCAGGAAAAACCAGTGTGAGAC Annealing temperature (55jC), 288 bp product melting temperature (89.5jC)PTGDS reverse GAAGACAATGGTATCCTCTGTGAAGKLRC2 forward CTCAGAAGTGAGTCTGGCCC Annealing temperature (58jC), 138 bp product melting temperature (80jC)KLRC2 reverse CCCTTGATGATTCAGGGAAGPSOR1 forward CCAAACACACACATCTCACTCA Annealing temperature (58jC), 417 bp product melting temperature (83.5jC)PSOR1 reverse TTATTGTTCCTGGGTCTCTGGb-Actin forward GAAGAGCTACGAGCTGCC Annealing temperature (55jC), 368 bp product melting temperature (87.5jC)b-Actin reverse TGATCCACATCTGCTGGA
7 http://www.genome.ad.jp/kegg/kegg2.html8 http://analysis.ingenuity.com9 http://www.GenMAPP.org
4 Softwares available at http://rana.stanford.edu/software5 http://www.affymetrix.com/analysis/index.affx6 http://david.niaid.nih.gov/david/ease.htm
Molecular Cancer Therapeutics 867
Mol Cancer Ther 2005;4(6). June 2005
on May 2, 2017. © 2005 American Association for Cancer Research. mct.aacrjournals.org Downloaded from

prostaglandin D2 (PGD2) synthase] using cell-based assayson the cell lines of oral cancer progression model. Weobserved this enzyme as repressed in dysplasia at themRNA level. Consequently, the effect of substitution ofthe natural metabolite PGD2, a product of the targetenzyme, was examined using 3-(4,5-dimethylthiazol-2-yl)-2,5-diphenyltetrazolium bromide dye reduction–based cellproliferation assays (13). The substitution of the enzymeitself by recombinant method calls for rather long-termexperimental methods and may have additional implica-tions to study the disease process. Briefly, 1 � 105 cells/well were treated with an optimal final concentration(6.82 Amol/L) of PGD2 (Cayman Chemicals, Ann Arbor,MI) in the culture media and the cell growth was assessedevery 24 to 96 hours in parallel with a vehicle-only (0.1%DMSO) negative control. The growth curve standardized tocell numbers (based on absorbance at 590 nm values) wasplotted at each time point to assess the effect of PGD2 on theoral cell lines. We did colorimetric substrate-based assay forcaspase-3 activation on similarly treated or untreated cells(Apoalert assay, BD Biosciences, Palo Alto, CA). AnnexinV-FITC binding assay and cell cycle analysis of PGD2-treated cells were done using the Telford assay method (14)followed by flow cytometry analysis on FACSCaliburinstrument (BD Biosciences). We analyzed the flowcytometry data using the CellQuest software package (BDBiosciences).
ResultsDifferential Gene Expression Profiles in Oral Pre-
cancerIn this study, we used paired premalignant and normal
adjacent oral tissue biopsies (n = 6) along with unpairedpremalignant tissues (n = 2) from patients attending oralhealth clinics for various premalignant oral conditions. Thepremalignant tissues represented various grades of oralepithelial dysplasia with hyperkeratosis. Additionally,a paired (n = 2) but variant oral premalignant condition,namely verrucous hyperplasia, and its malignant but sel-dom metastatic counterpart, namely verrucous carcinoma,were included in the Genechip microarray comparisonanalysis as a control set for biological behavior. We collectedthe biopsy tissues under approval of the institutional reviewboard as per their guidelines and patient informed writtenconsent. We did human U133A, Genechip (Affymetrix)hybridization analysis experiments with amplified andlabeled RNA (aRNA) from the above-mentioned biopsysamples, each starting with 100 ng of total RNA. Fluorescentscanning analysis of each Genechip array posthybridizationresulted in output of raw intensity files (*.cel). The signalintensity for each probe pair data was further normalizedbased on signals from internal controls and backgroundanalysis values (raw noise, Q < 3.00) to a signal intensity of atleast 150. The microarray data analysis shows a totaldifferential gene expression of 5,264 up-regulated genesand 4,321 down-regulated genes based on the statisticalanalysis algorithms of MAS 5.0 software (Affymetrix). These
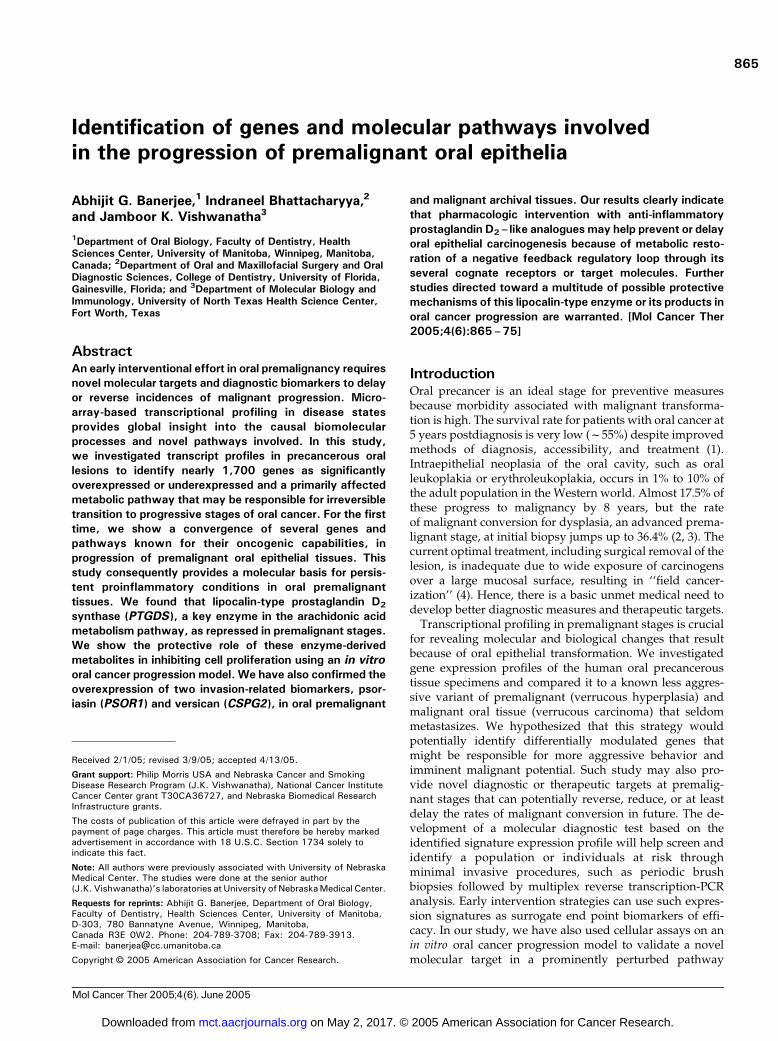
represent f41.6% of genes present on the array. The geneexpression data from our microarray experiments wasclustered for similarities in expression patterns using ahierarchical clustering method (15) across various arraysamples. Gene cluster heat maps (Fig. 1) includes therepresentative clusters of similarly expressed genes amongthe paired samples (n = 8). We did not use the expressiondata sets of unpaired samples (n = 2) to avoid any bias innode correlation coefficient values. Rather, we confirmed theexpression trends of significant genes in these specimens toarrive at significant gene expression profiles for premalig-nant tissues. We have used Affymetrix probe set IDs toenable retrieval of specific gene identities and annotationsdirectly using the NetAffx analysis tool available on theAffymetrix website and EASE software tool available fromthe NIH website. The expression profiles definitivelyclassify sets of genes expressed differentially betweennormal and premalignant samples as red and green clusters.The intensity of expression levels is shown to vary from themean of green (�) or red (+) spectrum for derived foldchange values between�9.053 and +12.042 (see Table 2). Thecorrelation coefficient value (r2) for each representative nodeprovides a measure of similarity in gene expression betweenthe respective samples.
The scatter correlation graphs of signal intensities foreach paired normal versus premalignant and verrucoushyperplasia versus verrucous carcinoma represents normaldistribution around the line of unity for majority of thegenes represented on the array (Fig. 2). The altered geneexpression is represented in color (red or green) for eachsuch comparison. A partial list of significant (>F1.5-foldin at least three of four such comparisons, i.e., 75%)differentially expressed genes based on comparison anal-ysis and corresponding to positive and negative averagefold change values calculated from average signal logratios are presented (Table 2). We have identified almost1,300 genes as significantly activated (increased) and 400genes as significantly repressed (decreased), thus givingus a total of 1,700 genes as differentially expressed (seeSupplementary Data)10 of initial 9,000 genes observed tobe up- or down-regulated. This includes 52 expressedsequence tags or full-length clones of genes with unknownfunction and hypothetical proteins that could not bemapped to known gene networks. We expect thesepotentially novel and nonannotated genes or hypotheticalproteins to be associated with malignant progression oforal dysplastic epithelia based on their similarity in expres-sion within the cluster of genes known to be involved inessential cellular processes in normal or disease states.Functional validation for such novel genes identifiedthrough our study is necessary before appropriate biolo-gical annotation can be assigned to them.
We also analyzed the expression array data from eachtissue sample for normal distribution independently using
10 Supplementary material for this article is available at Molecular CancerTherapeutics Online (http://mct.aacrjournals.org/).
Transcriptome Profiles in Oral Premalignancy868
Mol Cancer Ther 2005;4(6). June 2005
on May 2, 2017. © 2005 American Association for Cancer Research. mct.aacrjournals.org Downloaded from
probability (P-P) plots and the resultant quantile derivatives(i.e., Q-Q plots) using statistical analysis tools of MATLABsoftware (see Supplementary Data)10 to ascertain validitybefore comparison analysis and found it to be similar toscatter correlation graphs (Fig. 2) from MAS 5.0 software.This step also helped us identify outlier populations.
Validation of Microarray DataWe compared the microarray-based expression data
independently using quantitative real-time PCR techniquebased on SYBR green-1 technology, followed by ampliconidentification using melting point dissociation curves. Wedid real-time PCR for four of the significant genes identifiedin our study with specifically designed primer pairs underindicated conditions (Table 1). The first-strand cDNAderived from total RNA for real-time PCR analysis werefrom the frozen normal and dysplastic biopsy specimens(n = 12), including paired normal, premalignant, verrucoushyperplasia, and verrucous carcinoma, as well as unpairedspecimens previously used for microarray. In addition, weincluded cDNA from four cell lines of oral progression
model (n = 4) and a prostate cancer cell line (PC3) as apositive control, whereas distilled water devoid of anycDNA served as negative control for PCR reactions. We areunaware of any cell lines that are null for expression of thefour genes validated in these experiments and that could beused as additional negative controls. We calculated thecomparative threshold cycle (CT) values between thespecific gene transcript message and a housekeeping genemessage for the same unamplified RNA sample, termed asDDCT. The CT value is similar to signal log ratios ofmicroarray data after internal normalization (16). In ourexperiments, we have used the b-actin gene as a housekeep-ing gene control. The average fold expression change basedon 2�DDCT values obtained in this experiment were plotted incomparison with 2signal log ratios of microarray data thatindicates similar expression trends and, therefore, ascertainsthe validity of our microarray results (Fig. 3). However, dueto limitations of a PCR reaction (unequal efficiency and finalyield based on starting cDNA concentration), the databetween microarray and real-time PCR can never exactly
Figure 1. Gene clustering analysis reveals unique subset of genes differentially expressed in oral tissue specimens. A, total gene expression profile ofpaired oral tissue specimens represented in rows (for different genes) and in columns (for respective tissues). B, dendrograms classifying the geneexpression pattern between the oral samples for a subset of increased or decreased genes. N, paired normal tissue; D, diseased premalignant oral tissue;VH, verrucous form of hyperplasia; VCA, verrucous form of carcinoma. The cluster nodes represent an increased or decreased subset of highly correlatedgenes identified by Affymetrix probe set IDs having a similar expression pattern with correlation coefficient (r2) values close to 1.0. We used only pairedspecimens in clustering analysis and they appear in the dendrogram as per expression pattern–based similarity between specimens as well as genes.
Molecular Cancer Therapeutics 869
Mol Cancer Ther 2005;4(6). June 2005
on May 2, 2017. © 2005 American Association for Cancer Research. mct.aacrjournals.org Downloaded from
be the same and, therefore, not directly comparablenumerically as discussed previously (17, 18). For similarreasons, the negatively regulated genes, such as lipocalin-type PGD2 synthase (PTGDS), in a real-time PCR show a
negative correlation in our microarray data. We have showna comparative analysis of real-time PCR and microarray(average fold change) data for four such significantly (atleast in 75% of samples) altered genes, such as PTGDS ,
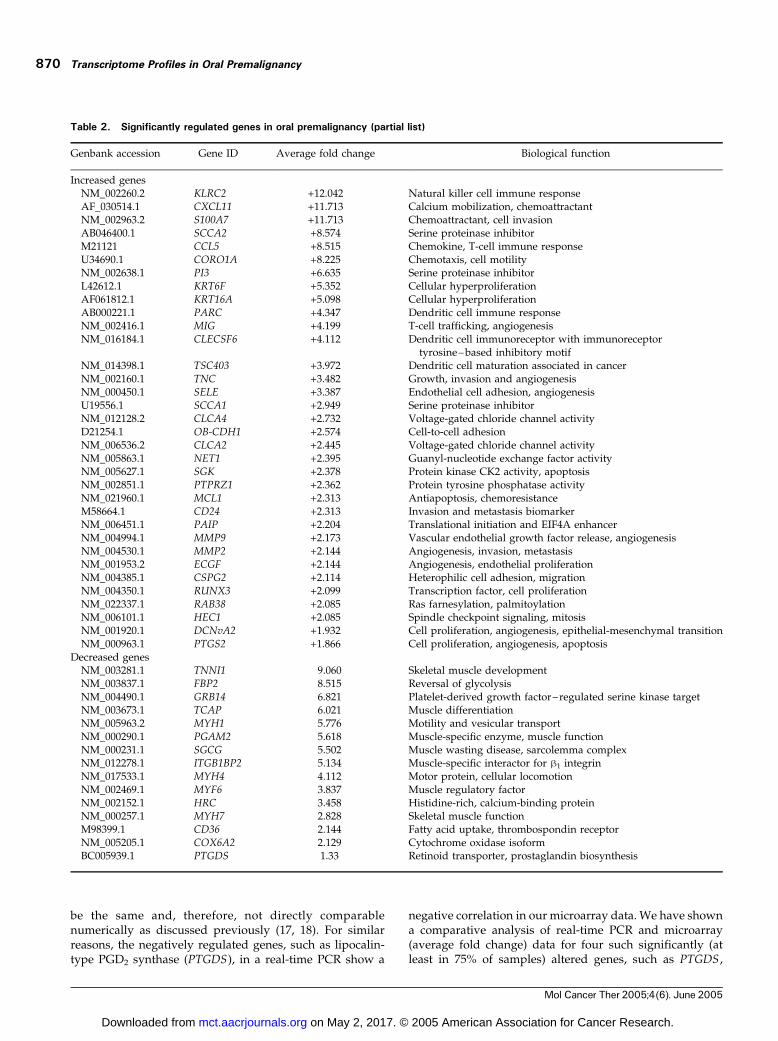
Table 2. Significantly regulated genes in oral premalignancy (partial list)
Genbank accession Gene ID Average fold change Biological function
Increased genesNM_002260.2 KLRC2 +12.042 Natural killer cell immune responseAF_030514.1 CXCL11 +11.713 Calcium mobilization, chemoattractantNM_002963.2 S100A7 +11.713 Chemoattractant, cell invasionAB046400.1 SCCA2 +8.574 Serine proteinase inhibitorM21121 CCL5 +8.515 Chemokine, T-cell immune responseU34690.1 CORO1A +8.225 Chemotaxis, cell motilityNM_002638.1 PI3 +6.635 Serine proteinase inhibitorL42612.1 KRT6F +5.352 Cellular hyperproliferationAF061812.1 KRT16A +5.098 Cellular hyperproliferationAB000221.1 PARC +4.347 Dendritic cell immune responseNM_002416.1 MIG +4.199 T-cell trafficking, angiogenesisNM_016184.1 CLECSF6 +4.112 Dendritic cell immunoreceptor with immunoreceptor
tyrosine– based inhibitory motifNM_014398.1 TSC403 +3.972 Dendritic cell maturation associated in cancerNM_002160.1 TNC +3.482 Growth, invasion and angiogenesisNM_000450.1 SELE +3.387 Endothelial cell adhesion, angiogenesisU19556.1 SCCA1 +2.949 Serine proteinase inhibitorNM_012128.2 CLCA4 +2.732 Voltage-gated chloride channel activityD21254.1 OB-CDH1 +2.574 Cell-to-cell adhesionNM_006536.2 CLCA2 +2.445 Voltage-gated chloride channel activityNM_005863.1 NET1 +2.395 Guanyl-nucleotide exchange factor activityNM_005627.1 SGK +2.378 Protein kinase CK2 activity, apoptosisNM_002851.1 PTPRZ1 +2.362 Protein tyrosine phosphatase activityNM_021960.1 MCL1 +2.313 Antiapoptosis, chemoresistanceM58664.1 CD24 +2.313 Invasion and metastasis biomarkerNM_006451.1 PAIP +2.204 Translational initiation and EIF4A enhancerNM_004994.1 MMP9 +2.173 Vascular endothelial growth factor release, angiogenesisNM_004530.1 MMP2 +2.144 Angiogenesis, invasion, metastasisNM_001953.2 ECGF +2.144 Angiogenesis, endothelial proliferationNM_004385.1 CSPG2 +2.114 Heterophilic cell adhesion, migrationNM_004350.1 RUNX3 +2.099 Transcription factor, cell proliferationNM_022337.1 RAB38 +2.085 Ras farnesylation, palmitoylationNM_006101.1 HEC1 +2.085 Spindle checkpoint signaling, mitosisNM_001920.1 DCNvA2 +1.932 Cell proliferation, angiogenesis, epithelial-mesenchymal transitionNM_000963.1 PTGS2 +1.866 Cell proliferation, angiogenesis, apoptosis
Decreased genesNM_003281.1 TNNI1 �9.060 Skeletal muscle developmentNM_003837.1 FBP2 �8.515 Reversal of glycolysisNM_004490.1 GRB14 �6.821 Platelet-derived growth factor–regulated serine kinase targetNM_003673.1 TCAP �6.021 Muscle differentiationNM_005963.2 MYH1 �5.776 Motility and vesicular transportNM_000290.1 PGAM2 �5.618 Muscle-specific enzyme, muscle functionNM_000231.1 SGCG �5.502 Muscle wasting disease, sarcolemma complexNM_012278.1 ITGB1BP2 �5.134 Muscle-specific interactor for h1 integrinNM_017533.1 MYH4 �4.112 Motor protein, cellular locomotionNM_002469.1 MYF6 �3.837 Muscle regulatory factorNM_002152.1 HRC �3.458 Histidine-rich, calcium-binding proteinNM_000257.1 MYH7 �2.828 Skeletal muscle functionM98399.1 CD36 �2.144 Fatty acid uptake, thrombospondin receptorNM_005205.1 COX6A2 �2.129 Cytochrome oxidase isoformBC005939.1 PTGDS �1.33 Retinoid transporter, prostaglandin biosynthesis
Transcriptome Profiles in Oral Premalignancy870
Mol Cancer Ther 2005;4(6). June 2005
on May 2, 2017. © 2005 American Association for Cancer Research. mct.aacrjournals.org Downloaded from

psoriasin (PSOR1 or S100A7), decorin (DCN), and killer cellC-type lectin receptor isoform 2 (KLRC2), to further validateour microarray results. Each of these genes is known to affectdifferent mechanisms in malignant progression.
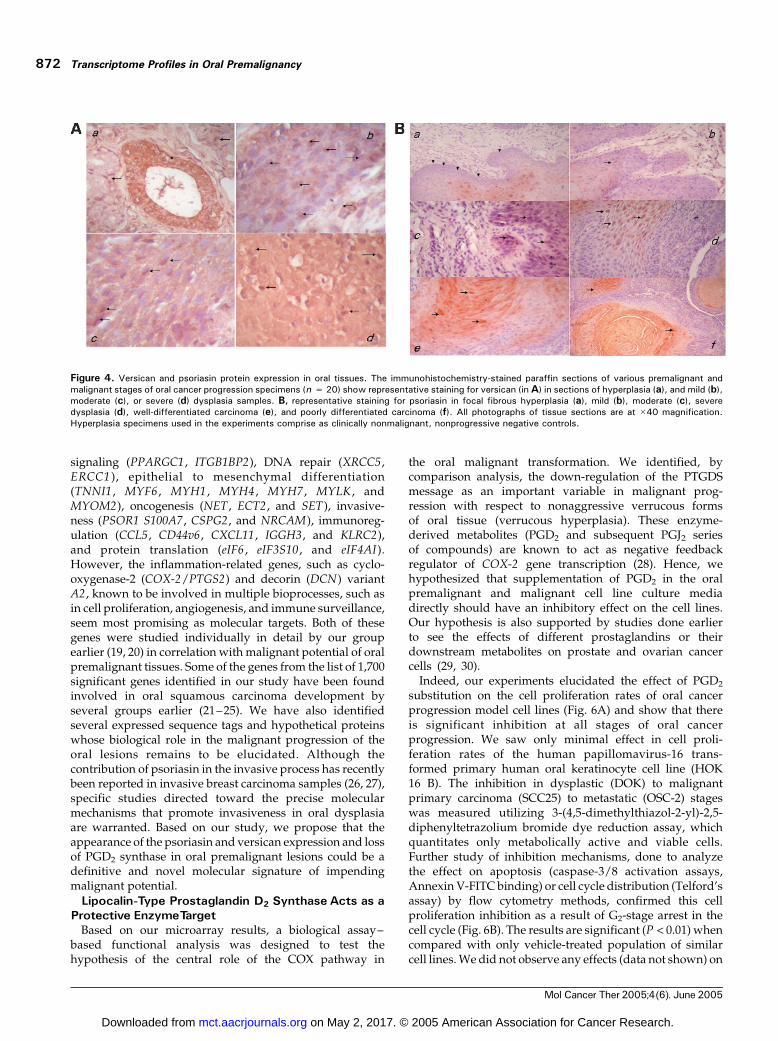
Additionally, the translated protein product of two ofthe up-regulated target genes, psoriasin and versican,were validated by immunohistochemistry in the paraffinsections (n = 20) of oral premalignant and malignanttissues using the appropriate primary antibodies followedby avidin-biotin complex–peroxidase–substrate staining.The representative data for versican and psoriasinexpression (Fig. 4A and B) show that both proteinsexpress at higher levels in dysplastic and carcinoma cellsthan in normal epithelial cells. Versican was found to beexpressed along the leading edge of the motile cellsconsistent with its role in de-adhesion of transformedcells, whereas psoriasin expression was found to be higherin invasive epithelial cells. Future studies for detailedanalysis may reveal localization differences if any. It isconcluded here that expression of both of these markers isassociated with the invasive potential of dysplasticepithelium and impending malignant transformation.Nonmalignant tissue specimens were included in thestudy as negative controls to rule out any false-positivereaction (data not shown).
Identification of a Malignant Progression-RelatedPathway in Oral Precancer
We queried the tightly regulated genes of a cluster nodeobtained from the clustering analysis represented by theirprobe IDs on the NetAffx analysis center for Genbankannotations. Such annotations are linked to molecular andbiological function databases, such as Gene Ontology, andpathway databases, such as KEGG. We predicted pathwaysinvolved in the disease process using analysis programssuch as GenMAPP and Ingenuity pathway analysis. On
summation of all pathways, we found that the genesdifferentially regulated between normal and dysplastictissues are involved in cell signaling, cell proliferation,angiogenesis, apoptosis, matrix remodeling, motility, inva-sion, and innate immune surveillance mechanisms. Afterconsidering the most significantly altered gene expressionprofiles and its pathway representation analysis, the mostperturbed pathway in dysplastic tissue was mapped relatingto arachidonic acid metabolism and related inflammatorycascades. This pathway also represents appropriate cross-talk with the transforming growth factor-h signaling, Rasoncogenic signaling, prostanoid receptor signaling, andfatty acid degradation pathways as summarized in theprogression pathway diagram (Fig. 5). Based on globalanalysis (see Supplementary Data)10 of the significant genesinvolved (30 cancer-related genes), we propose that itcould be central in the malignant progression of oraldysplasia. This is because the resultant vector of thepathway points toward combined cell proliferation, anti-apoptotic, and angiogenesis mechanisms, with concomitantdown-regulation of innate immune response–related genesthat helps eliminate genetically aberrant cells from thesystem. Thus, our data supports a general notion thatcarcinogenesis is a result of multifactorial crosstalk betweendifferent molecular pathways.
Candidate Disease-Related Genes in the PathwayAmong the genes differentially expressed in premalignant
versus paired normal tissues, the most significantly regu-lated genes are found associated with various malignantprocesses. These are the genes functionally known to beinvolved in angiogenic stimulation (MMP2 , MMP9 ,ECGF , and SELE), apoptosis, cell proliferation, and cellcycle regulation (MCL1 , CDC6 , CDK4 , MDM7, CCND2 ,CCNC , CCNB1 , E2F , GADD45 , RAB 38, and BNIP3), cell
Figure 2. Alteration of expression profile in oral tissues follows binomialdistribution. The scatter correlation graph from comparison analysis showsnormal distribution around the line of unity (f1.0) with the populations ofdifferentially expressed genes in green or red, respectively. This signifiesstatistically comparable data sets between two paired arrays beforeanalysis and biological data mining of the microarray data. Vh , verrucoushyperplasia; VCa , verrucous carcinoma.
Figure 3. Quantitative reverse transcription-PCR–based validation ofmicroarray data in real time. The figure shows similar trends of expressionanalyzed for four significant genes (PTGDS , DCN , PSOR1 , and KLRC2)from the data set. The data represented as average fold expression levelsare based on signal log average values of microarray experiments (stippledcolumns) and DDCT values (solid columns) from real-time PCR asexplained in Results. The limiting dynamics of a reverse transcription-PCRreaction skews the data for highly up-regulated genes and negativelyregulated genes. The SE (bars) of mean values (columns ) were between0.1 and 0.2, and the P value for statistical comparisons by pairedStudent’s t test was found to be <0.01. The Pearson’s correlationcoefficient (r2) varies between 0.6 and 1.0 for the above-mentioned fourgenes.
Molecular Cancer Therapeutics 871
Mol Cancer Ther 2005;4(6). June 2005
on May 2, 2017. © 2005 American Association for Cancer Research. mct.aacrjournals.org Downloaded from
signaling (PPARGC1 , ITGB1BP2), DNA repair (XRCC5 ,ERCC1 ), epithelial to mesenchymal differentiation(TNNI1 , MYF6 , MYH1 , MYH4 , MYH7 , MYLK , andMYOM2), oncogenesis (NET , ECT2 , and SET), invasive-ness (PSOR1 S100A7 , CSPG2 , and NRCAM), immunoreg-ulation (CCL5 , CD44v6, CXCL11 , IGGH3 , and KLRC2),and protein translation (eIF6 , eIF3S10 , and eIF4AI).However, the inflammation-related genes, such as cyclo-oxygenase-2 (COX-2/PTGS2) and decorin (DCN) variantA2 , known to be involved in multiple bioprocesses, such asin cell proliferation, angiogenesis, and immune surveillance,seem most promising as molecular targets. Both of thesegenes were studied individually in detail by our groupearlier (19, 20) in correlation with malignant potential of oralpremalignant tissues. Some of the genes from the list of 1,700significant genes identified in our study have been foundinvolved in oral squamous carcinoma development byseveral groups earlier (21–25). We have also identifiedseveral expressed sequence tags and hypothetical proteinswhose biological role in the malignant progression of theoral lesions remains to be elucidated. Although thecontribution of psoriasin in the invasive process has recentlybeen reported in invasive breast carcinoma samples (26, 27),specific studies directed toward the precise molecularmechanisms that promote invasiveness in oral dysplasiaare warranted. Based on our study, we propose that theappearance of the psoriasin and versican expression and lossof PGD2 synthase in oral premalignant lesions could be adefinitive and novel molecular signature of impendingmalignant potential.
Lipocalin-Type Prostaglandin D2 Synthase Acts as aProtective EnzymeTarget
Based on our microarray results, a biological assay–based functional analysis was designed to test thehypothesis of the central role of the COX pathway in
the oral malignant transformation. We identified, bycomparison analysis, the down-regulation of the PTGDSmessage as an important variable in malignant prog-ression with respect to nonaggressive verrucous formsof oral tissue (verrucous hyperplasia). These enzyme-derived metabolites (PGD2 and subsequent PGJ2 seriesof compounds) are known to act as negative feedbackregulator of COX-2 gene transcription (28). Hence, wehypothesized that supplementation of PGD2 in the oralpremalignant and malignant cell line culture mediadirectly should have an inhibitory effect on the cell lines.Our hypothesis is also supported by studies done earlierto see the effects of different prostaglandins or theirdownstream metabolites on prostate and ovarian cancercells (29, 30).
Indeed, our experiments elucidated the effect of PGD2
substitution on the cell proliferation rates of oral cancerprogression model cell lines (Fig. 6A) and show that thereis significant inhibition at all stages of oral cancerprogression. We saw only minimal effect in cell proli-feration rates of the human papillomavirus-16 trans-formed primary human oral keratinocyte cell line (HOK16 B). The inhibition in dysplastic (DOK) to malignantprimary carcinoma (SCC25) to metastatic (OSC-2) stageswas measured utilizing 3-(4,5-dimethylthiazol-2-yl)-2,5-diphenyltetrazolium bromide dye reduction assay, whichquantitates only metabolically active and viable cells.Further study of inhibition mechanisms, done to analyzethe effect on apoptosis (caspase-3/8 activation assays,Annexin V-FITC binding) or cell cycle distribution (Telford’sassay) by flow cytometry methods, confirmed this cellproliferation inhibition as a result of G2-stage arrest in thecell cycle (Fig. 6B). The results are significant (P < 0.01) whencompared with only vehicle-treated population of similarcell lines. We did not observe any effects (data not shown) on
Figure 4. Versican and psoriasin protein expression in oral tissues. The immunohistochemistry-stained paraffin sections of various premalignant andmalignant stages of oral cancer progression specimens (n = 20) show representative staining for versican (inA) in sections of hyperplasia (a), and mild (b),moderate (c), or severe (d) dysplasia samples. B, representative staining for psoriasin in focal fibrous hyperplasia (a), mild (b), moderate (c), severedysplasia (d), well-differentiated carcinoma (e), and poorly differentiated carcinoma (f). All photographs of tissue sections are at �40 magnification.Hyperplasia specimens used in the experiments comprise as clinically nonmalignant, nonprogressive negative controls.
Transcriptome Profiles in Oral Premalignancy872
Mol Cancer Ther 2005;4(6). June 2005
on May 2, 2017. © 2005 American Association for Cancer Research. mct.aacrjournals.org Downloaded from
apoptotic mechanisms, and such data is explained by thedown-regulation of gene expression profile related to theapoptotic effector molecules (cytochrome c oxidase release)observed in our microarray experiments. These effectormolecules are known to initiate the classic caspase activationpathways. Thus, in our study, we have identified a route tonatural cancer prevention process that effectively inhibitsCOX-2 at the transcriptional level and lowers the level ofdownstream metabolite (PGE2)–mediated cell proliferation.It seems from our study that in the absence or repression ofthe PTGDS enzyme levels in oral epithelial cells, dysplasticepithelial cells may progresses toward malignant stages and,therefore, could be termed as a protective target.
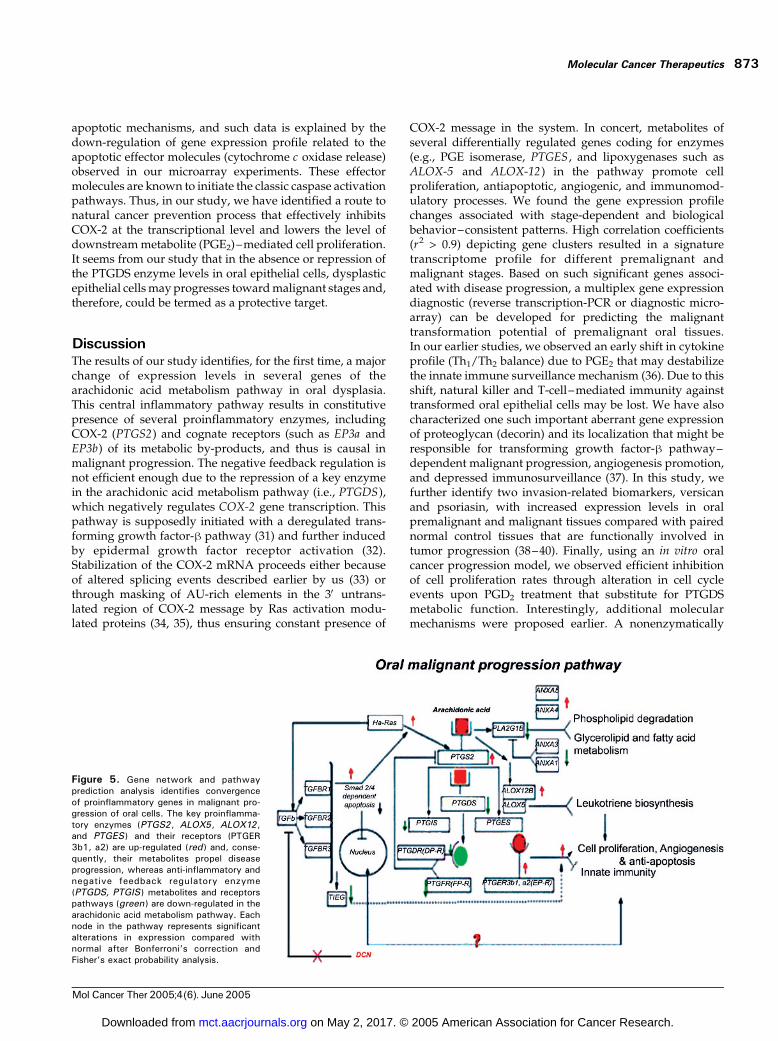
DiscussionThe results of our study identifies, for the first time, a majorchange of expression levels in several genes of thearachidonic acid metabolism pathway in oral dysplasia.This central inflammatory pathway results in constitutivepresence of several proinflammatory enzymes, includingCOX-2 (PTGS2) and cognate receptors (such as EP3a andEP3b) of its metabolic by-products, and thus is causal inmalignant progression. The negative feedback regulation isnot efficient enough due to the repression of a key enzymein the arachidonic acid metabolism pathway (i.e., PTGDS),which negatively regulates COX-2 gene transcription. Thispathway is supposedly initiated with a deregulated trans-forming growth factor-h pathway (31) and further inducedby epidermal growth factor receptor activation (32).Stabilization of the COX-2 mRNA proceeds either becauseof altered splicing events described earlier by us (33) orthrough masking of AU-rich elements in the 3V untrans-lated region of COX-2 message by Ras activation modu-lated proteins (34, 35), thus ensuring constant presence of
COX-2 message in the system. In concert, metabolites ofseveral differentially regulated genes coding for enzymes(e.g., PGE isomerase, PTGES , and lipoxygenases such asALOX-5 and ALOX-12) in the pathway promote cellproliferation, antiapoptotic, angiogenic, and immunomod-ulatory processes. We found the gene expression profilechanges associated with stage-dependent and biologicalbehavior–consistent patterns. High correlation coefficients(r2 > 0.9) depicting gene clusters resulted in a signaturetranscriptome profile for different premalignant andmalignant stages. Based on such significant genes associ-ated with disease progression, a multiplex gene expressiondiagnostic (reverse transcription-PCR or diagnostic micro-array) can be developed for predicting the malignanttransformation potential of premalignant oral tissues.In our earlier studies, we observed an early shift in cytokineprofile (Th1/Th2 balance) due to PGE2 that may destabilizethe innate immune surveillance mechanism (36). Due to thisshift, natural killer and T-cell–mediated immunity againsttransformed oral epithelial cells may be lost. We have alsocharacterized one such important aberrant gene expressionof proteoglycan (decorin) and its localization that might beresponsible for transforming growth factor-h pathway–dependent malignant progression, angiogenesis promotion,and depressed immunosurveillance (37). In this study, wefurther identify two invasion-related biomarkers, versicanand psoriasin, with increased expression levels in oralpremalignant and malignant tissues compared with pairednormal control tissues that are functionally involved intumor progression (38–40). Finally, using an in vitro oralcancer progression model, we observed efficient inhibitionof cell proliferation rates through alteration in cell cycleevents upon PGD2 treatment that substitute for PTGDSmetabolic function. Interestingly, additional molecularmechanisms were proposed earlier. A nonenzymatically
Figure 5. Gene network and pathwayprediction analysis identifies convergenceof proinflammatory genes in malignant pro-gression of oral cells. The key proinflamma-tory enzymes (PTGS2 , ALOX5, ALOX12,and PTGES ) and their receptors (PTGER3b1, a2) are up-regulated (red ) and, conse-quently, their metabolites propel diseaseprogression, whereas anti-inflammatory andnegative feedback regulatory enzyme(PTGDS, PTGIS) metabolites and receptorspathways (green ) are down-regulated in thearachidonic acid metabolism pathway. Eachnode in the pathway represents significantalterations in expression compared withnormal after Bonferroni’s correction andFisher’s exact probability analysis.
Molecular Cancer Therapeutics 873
Mol Cancer Ther 2005;4(6). June 2005
on May 2, 2017. © 2005 American Association for Cancer Research. mct.aacrjournals.org Downloaded from

catalyzed dehydration metabolite of PGD2, 15-deoxy-y-12,14-PGJ2 (15d-PGJ2), has been reported to mediate theactivation of the transcription factor, NF-E–related factor,called Nrf2 (41, 42). 15d-PGJ2 activation of Nrf2 seems to bethe main mechanism that involves adducts formation withNrf2 inhibitor Keap1, which attenuates inflammation byaltering the recruitment of inflammatory cells in acute andchronic inflammation (43), as well as by regulatingdependent gene expression. Nrf2 activation by naturalanticancer compounds, such as sulforaphane found inbroccoli, transcriptionaly induces as many as 30 differentgenes that are involved in chemoprevention effect andinclude several antioxidant and phase II carcinogen-metabolizing enzymes (e.g., members of the glutathioneS-transferase family, heme oxygenase, peroxiredoxin I, andother xenobiotic metabolizing enzymes; ref. 44). Thecompound 15d-PGJ2 also inhibits the degradation of Inha,increasing its levels in the nuclei and inhibiting thetranscription of nuclear factor-nh–dependent genes (45),such as inducible nitric oxide synthase and COX-2.
Therefore, it seems that all of these mechanisms may actsynergistically to provide a natural prevention mechanismin oral malignant progression. Recently, PGD2 was alsoreported as direct ligands of DP and CRTH2 receptors.PGD2 favors Th2-type functions through CRTH2 receptorsknown to be expressed mainly on T helper cells whilerestraining Th1-like functions via DP receptors (46). DP1receptor transcripts were reported to be present only in HT-29 cells by Hawcroft et al. (47), and none of the humancolorectal epithelial cell lines tested by them expressed anyDP2 receptor mRNA. Consequently, they concluded thatPGD2 is unlikely to have direct activity on neoplasticcolorectal epithelial cells via cell surface DP receptors. Weare in the process of deciphering the mechanistic effects ofdirect PGD2 substitution on the cell lines of the oral cancerprogression model and this includes possible receptorsignaling. Based on our observations, we propose thatcombined early intervention strategies based on not onlyCOX-2 inhibition at the enzymatic activity level but also attranscriptional regulation level using PGD2 analogues mayprovide further therapeutic efficacy or might at least delaythe malignant progression of oral epithelia.
Acknowledgments
We thank the microarray core facility of Johns Hopkins University Schoolof Medicine and Public Health (Baltimore, MD) for extensive support;Munroe Meyer Institute microarray core facility at University of NebraskaMedical Center (Omaha, NE) for providing us the Affymetrix (MAS 5.0suite and DMT) and Ingenuity analysis softwares; University of NebraskaMedical Center molecular biology and cell cycle analysis core facilities forassistance; Drs. Simon Sherman and Xiao Li (Nebraska Informatics Centerin Life Sciences, Eppley Institute, University of Nebraska Medical Center,Omaha, NE) for their help in statistical validation and bioinformaticsanalysis of our microarray data; and Drs. Peter H. Watson (University ofManitoba, Winnipeg, Manitoba, Canada) and Larry Fisher (NationalInstitute of Dental and Craniofacial Research, NIH, Bethesda, MD) forthe gift of primary antibodies for psoriasin and versican, respectively.
References
1. Vokes EE, Weichselbaum RR, Lippman SM, Hong WK. Head and neckcancer. N Engl J Med 1993;328:184–94.
2. Silverman S, Gorsky M, Lozada F. Oral leukoplakia and malignanttransformation. A follow-up study of 257 patients. Cancer 1984;53:563–8.
3. O’Shaughnessy JA, Kelloff GJ, Gordon GB, et al. Treatment andprevention of intraepithelial neoplasia: an important target for acceleratednew agent development. Clin Cancer Res 2002;8:314–46.
4. Slaughter DP, Southwick HW, Smejkal W. Field cancerization in oralstratified squamous epithelium. Cancer 1953;6:963–8.
5. Banerjee AG, Bhattacharyya I, Lydiatt WM, Vishwanatha JK. Aberrantexpression and localization of decorin in human oral dysplasia andsquamous cell carcinoma. Cancer Res 2003;63:7769–76.
6. Van Gelder RN, von Zastrow ME, Yool A, Dement WC, Barchas JD,Eberwine JH. Amplified RNA synthesized from limited quantities ofheterogeneous cDNA. Proc Natl Acad Sci U S A 1990;87:1663–7.
7. Eisen MB, Spellman PT, Brown PO, Botstein D. Cluster analysis anddisplay of genome-wide expression patterns. Proc Natl Acad Sci U S A1998;95:14863–8.
8. Liu G, Loraine AE, Shigeta R, et al. NetAffx: Affymetrix probesets andannotations. Nucleic Acids Res 2003;31:82–6.
9. Mendez E, Cheng C, Farwell DG, et al. Transcriptional expressionprofiles of oral squamous cell carcinomas. Cancer 2002;95:1482–94.
10. Emberley ED, Niu Y, Njue C, Kliewer EV, Murphy LC, Watson PH.Psoriasin (S100A7) expression is associated with poor outcome in
Figure 6. Biological validation of PGD2 synthase as a protective target inarachidonic acid metabolism pathway. The figure shows effect of PGD2
synthase (PTGDS) metabolite (PGD2) in mediating negative feedbackregulatory control. Substitution of the metabolite at final concentration of6.82 Amol/L in an in vitro cell line model of oral cancer progression causedsignificant inhibition of cell proliferation rates (A) and accumulation of cellsin the G2 phase (B) of cell cycle. The data (points and columns) representmean of triplicate independent experiments with the standard variation(bars ) observed to be <0.05. The P value is 0.0026 as calculated usingtwo-tailed paired Student’s t test.
Transcriptome Profiles in Oral Premalignancy874
Mol Cancer Ther 2005;4(6). June 2005
on May 2, 2017. © 2005 American Association for Cancer Research. mct.aacrjournals.org Downloaded from

estrogen receptor-negative invasive breast cancer. Clin Cancer Res 2003;9:2627–31.
11. Bernstein EF, Fisher LW, Li K, LeBaron RG, Tan EM, Uitto J.Differential expression of the versican and decorin genes in photoagedand sun-protected skin. Comparison by immunohistochemical and north-ern analyses. Lab Invest 1995;72:662–9.
12. Banerjee AG, Liu J, Yuan Y, et al. Expression of biomarkersmodulating prostate cancer angiogenesis: differential expression ofAnnexin II in prostate carcinomas from India and USA. Mol Cancer2003;2:34.
13. Mosmann T. Rapid colorimetric assay for cellular growth and survival:application to proliferation and cytotoxicity assays. J Immunol Methods1983;65:55–63.
14. Telford WG, King LE, Fraker PJ. Evaluation of glucocorticoid-inducedDNA fragmentation in mouse thymocytes by flow cytometry. Cell Prolif1991;24:447–59.
15. Eisen MB, Spellman PT, Brown PO, Botstein D. Cluster analysis anddisplay of genome-wide expression patterns. Proc Natl Acad Sci U S A1998;95:14863–8.
16. Mendez E, Cheng C, Farwell DG, et al. Transcriptional expressionprofiles of oral squamous cell carcinomas. Cancer 2002;95:1482–94.
17. Ding C, Cantor CR. Quantitative analysis of nucleic acids—the lastfew years of progress. J Biochem Mol Biol 2004;37:1–10.
18. Etienne W, Meyer MH, Peppers J, Meyer RA Jr. Comparison of mRNAgene expression by RT-PCR and DNA microarray. Biotechniques 2004;36:618–6.
19. Banerjee AG, Gopalakrishnan VK, Bhattacharya I, Vishwanatha JK.Deregulated cyclooxygenase-2 expression in oral premalignant tissues.Mol Cancer Ther 2002;1:1265–71.
20. Banerjee AG, Bhattacharyya I, Lydiatt WM, Vishwanatha JK.Aberrant expression and localization of decorin in human oral dysplasiaand squamous cell carcinoma. Cancer Res 2003;63:7769–76.
21. Alevizos I, Mahadevappa M, Zhang X, et al. Oral cancer in vivo geneexpression profiling assisted by laser capture microdissection and micro-array analysis. Oncogene 2001;20:6196–204.
22. Leethanakul C, Patel V, Gillespie J, et al. Distinct pattern ofexpression of differentiation and growth-related genes in squamouscell carcinomas of the head and neck revealed by the use of lasercapture microdissection and cDNA arrays. Oncogene 2000;19:3220–4.
23. Loercher A, Lee TL, Ricker JL, et al. Nuclear factor-nh is an importantmodulator of the altered gene expression profile and malignant phenotypein squamous cell carcinoma. Cancer Res 2004;64:6511–23.
24. Ginos MA, Page GP, Michalowicz BS, et al. Identification of agene expression signature associated with recurrent disease insquamous cell carcinoma of the head and neck. Cancer Res 2004;64:55–63.
25. Jeon GA, Lee JS, Patel V, et al. Global gene expression profiles ofhuman head and neck squamous carcinoma cell lines. Int J Cancer2004;112:249–58.
26. Emberley ED, Niu Y, Leygue E, et al. Psoriasin interacts with Jab1 andinfluences breast cancer progression. Cancer Res 2003;63:1954–61.
27. Emberley ED, Niu Y, Njue C, Kliewer EV, Murphy LC, Watson PH.Psoriasin (S100A7) expression is associated with poor outcome inestrogen receptor-negative invasive breast cancer. Clin Cancer Res 2003;9:2627–31.
28. Wang C, Fu M, D’Amico M, et al. Inhibition of cellular proliferationthrough InB kinase-independent and peroxisome proliferator-activatedreceptor g-dependent repression of cyclin D1. Mol Cell Biol 2001;21:3057–70.
29. Nithipatikom K, Isbell MA, Lindholm PF, Kajdacsy-Balla A, Kaul S,
Campell WB. Requirement of cyclooxygenase-2 expression and prosta-glandins for human prostate cancer cell invasion. Clin Exp Metastasis2002;19:593–601.
30. Kikuchi Y, Miyauchi M, Oomori K, Kita T, Kizawa I, Kato K. Inhibitionof human ovarian cancer cell growth in vitro and in nude mice byprostaglandin D2. Cancer Res 1986;46:3364–6.
31. Hsu S, Borke JL, Lewis JB, et al. Transforming growth factor h1
dysregulation in a human oral carcinoma tumour progression model. CellProlif 2002;35:183–92.
32. Dannenberg AJ, Lippman SM, Mann JR, Subbaramaiah K,DuBois RN. Cyclooxygenase-2 and epidermal growth factor receptor:pharmacologic targets for chemoprevention. J Clin Oncol 2005;23:254–66.
33. Banerjee AG, Gopalakrishnan VK, Bhattacharya I, Vishwanatha JK.Deregulated cyclooxygenase-2 expression in oral premalignant tissues.Mol Cancer Ther 2002;1:1265–71.
34. Sheng H, Shao J, DuBois RN. K-Ras-mediated increase in cyclo-oxygenase 2 mRNA stability involves activation of the protein kinase B1.Cancer Res 2001;61:2670–5.
35. Sheng GG, Shao JY, Sheng HM, et al. A selective cyclooxygenase 2inhibitor suppresses the growth of H-ras -transformed rat intestinalepithelial cells. Gastroenterology 1997;113:1883–91.
36. Banerjee AG, Gopalakrishnan VK, Bhattacharya I, Vishwanatha JK.Deregulated cyclooxygenase-2 expression in oral premalignant tissues.Mol Cancer Ther 2002;1:1265–71.
37. Banerjee AG, Bhattacharyya I, Lydiatt WM, Vishwanatha JK.Aberrant expression and localization of decorin in human oral dysplasiaand squamous cell carcinoma. Cancer Res 2003;63:7769–76.
38. Emberley ED, Niu Y, Leygue E, et al. Psoriasin interacts with Jab1 andinfluences breast cancer progression. Cancer Res 2003;63:1954–61.
39. Emberley ED, Niu Y, Njue C, Kliewer EV, Murphy LC, Watson PH.Psoriasin (S100A7) expression is associated with poor outcome inestrogen receptor-negative invasive breast cancer. Clin Cancer Res 2003;9:2627–31.
40. Banerjee AG, Bhattacharyya I, Lydiatt WM, Vishwanatha JK.Aberrant expression and localization of decorin in human oral dysplasiaand squamous cell carcinoma. Cancer Res 2003;63:7769–76.
41. Itoh K, Mochizuki M, Ishii Y, et al. Transcription factor Nrf2 regulatesinflammation by mediating the effect of 15-deoxy-D(12,14)-prostaglandinj(2). Mol Cell Biol 2004;24:36–45.
42. Shibata T, Kondo M, Osawa T, Shibata N, Kobayashi M, Uchida K.15-Deoxy-y-12,14-prostaglandin J2. A prostaglandin D2 metabolitegenerated during inflammatory processes. J Biol Chem 2002;277:10459–66.
43. Cuzzocrea S, Wayman NS, Mazzon E, et al. The cyclopentenoneprostaglandin 15-deoxy-D(12,14)-prostaglandin J(2) attenuates the de-velopment of acute and chronic inflammation. Mol Pharmacol 2002;61:997–1007.
44. Thimmulappa RK, Mai KH, Srisuma S, Kensler TW, Yamamoto M,Biswal S. Identification of Nrf2-regulated genes induced by the chemo-preventive agent sulforaphane by oligonucleotide microarray. Cancer Res2002;62:5196–203.
45. Castrillo A, Diaz-Guerra MJ, Hortelano S, Martin-Sanz P, Bosca L.Inhibition of InB kinase and InB phosphorylation by 15-deoxy-D(12,14)-prostaglandin J(2) in activated murine macrophages. Mol Cell Biol 2000;20:1692–8.
46. Tanaka K, Hirai H, Takano S, Nakamura M, Nagata K. Effects ofprostaglandin D2 on helper T cell functions. Biochem Biophys ResCommun 2004;316:1009–14.
47. Hawcroft G, Gardner SH, Hull MA. Expression of prostaglandin D2
receptors DP1 and DP2 by human colorectal cancer cells. Cancer Lett2004;210:81–4.
Molecular Cancer Therapeutics 875
Mol Cancer Ther 2005;4(6). June 2005
on May 2, 2017. © 2005 American Association for Cancer Research. mct.aacrjournals.org Downloaded from

2005;4:865-875. Mol Cancer Ther Abhijit G. Banerjee, Indraneel Bhattacharyya and Jamboor K. Vishwanatha the progression of premalignant oral epitheliaIdentification of genes and molecular pathways involved in
Updated version
http://mct.aacrjournals.org/content/4/6/865
Access the most recent version of this article at:
Material
Supplementary
http://mct.aacrjournals.org/content/suppl/2005/09/20/4.6.865.DC1
Access the most recent supplemental material at:
Cited articles
http://mct.aacrjournals.org/content/4/6/865.full.html#ref-list-1
This article cites 37 articles, 19 of which you can access for free at:
Citing articles
/content/4/6/865.full.html#related-urls
This article has been cited by 11 HighWire-hosted articles. Access the articles at:
E-mail alerts related to this article or journal.Sign up to receive free email-alerts
Subscriptions
Reprints and
To order reprints of this article or to subscribe to the journal, contact the AACR Publications
Permissions
To request permission to re-use all or part of this article, contact the AACR Publications
on May 2, 2017. © 2005 American Association for Cancer Research. mct.aacrjournals.org Downloaded from