ict metrics report 2016–17 gov ict metrics report 2016-17...2016–17 ict metrics report are:...
TRANSCRIPT

ICT Metrics Report2016–17
ICT Assurance
NSW Government ICT Metrics Report | 2016–17 2
Citizen engagement Over 1.1 million people interact online with the NSW Government through our websites every day. Countless more interact with government via social media.
Digital firstIn 2016-17, Service NSW led the way with 23 million online customer visits and one million ‘MyServiceNSW’ accounts created.
Open dataVolume and quantity of open data is increasing with 80,000 datasets across NSW agencies.
Expenditure is appropriateExpenditure is consistent with industry benchmarks.
Employee engagementEngagement with work remains strong at 72 per cent.
Customer satisfactionAlmost 8 out of 10 consumers and businesses were satisfied with online services.
Executive summary
The NSW Government continues the trend of being increasingly mobile, open, collaborative and citizen focused through its use of ICT. Key findings of the 2016–17 ICT Metrics Report are:
2 NSW Government ICT Metrics Report | 2016–17

ICT-enabled capabilities A Digital NSW delivers policies and services that are easy to use and help deliver outcomes in real life situations. Government services keep pace with the quality and convenience of modern services people use today.
Customers tell government once, are reminded when they need to do something, decide who can access their data, and understand how government has used it. Public confidence and trust is maintained through government systems that are secure and resilient.
Over 1.1 million people interact online with the NSW Government through our websites every day. Countless more interact through social media platforms.
The decline in websites is indicative of government’s commitment to consolidate its online presence making it easier for citizens to access online services while also reducing costs.
As the digital landscape has changed, so has the government’s approach to social media.
Across government we have a record 2,096 social media accounts, this is up 13.8 per cent on 2015–16.
Service NSW digital engagement with customers has increased significantly. In 2016-17, there were 23 million online customer visits and one million ‘MyServiceNSW’ accounts created.
Overall trends In 2016–17, the ICT spend totalled $3.08 billion, which represented approximately 4.3 per cent of total agency expenditure.
This is consistent with Gartner benchmarks — 4.1 per cent (State & Local Government) or 4.6 per cent (All industries) and reflects government’s determination to deliver digital transformation that improves services to citizens.
The bulk of the ICT spend comes from the Transport, Health and Justice clusters.
Delivering value for moneyReforms to the ICT procurement system have encouraged greater numbers of suppliers to compete for government business.
In 2016–17, the ICT Services Scheme grew by 733 new suppliers to 2,905, increasing in size by 34 per cent. Small to medium enterprises (SMEs), employing 200 or less FTEs within Australia, make up most suppliers.
Enterprise architecture maturity is increasing with 67 per cent (up from 59%) of respondent agencies operating a defined set of enterprise architecture processes.
Telco Authority: The Government Radio Network (GRN) geographically covers approximately 266,000 square kilometres, or about a third of NSW. During 2016/17, following significant network upgrades, GRN availability has been delivered in excess of the network Service Level Agreement (SLA) of 99.95 per cent, for the whole period.
IT Service Management (ITSM) focuses on the delivery of quality ICT services that meet the needs of customers and is delivered by an appropriate mix of people, process and information technology.
84 per cent of agencies reported using an ITSM methodology, ITIL V3 is predominantly used for Incident management (93%), Change management (86%), Service Design — Service Level Management (67%).
3 NSW Government ICT Metrics Report | 2016–17
Executive summary (cont.)
3 NSW Government ICT Metrics Report | 2016–17

NSW Government ICT Metrics Report | 2016–17 4
ContentsPage
Executive summary 2–3
1. Introduction 6
2. ICT-enabled capabilities 7
Service accessibility 8
Community engagement 11
Human interaction 13
Information sharing 19
3. ICT Trends in NSW Government 23
Investment and expenditure trends 24
Sector capability 33
4. Delivering value for money through ICT reforms 37
ICT Assurance Framework (IAF) 38
Procurement reforms increasing the number of SMEs 39
Enterprise architecture 40
Telco strategy 41
IT Service Management 43
NSW Government policy on cloud-based services 44
GovDC 45
5. Opportunities 46
Cyber security 47
Digital Government Strategy 48
‘One Government’ 49
6. Appendices 50
Appendix A: List of 2016–17 ICT Survey respondents 51
Appendix B: Service tower definitions 52
Appendix C: Cost elements definitions 53
Appendix D: Run, Grow, Transform the business 54
Appendix E: Glossary 55

NSW Government ICT Metrics Report | 2016–17 5
1.Introduction

NSW Government ICT Metrics Report | 2016–17 6
Introduction
The NSW Government ICT Metrics Program is a multi-source data collection initiative that captures information and communications technology (ICT) expenditure, volumetric data and measures, to inform the NSW Government’s ICT strategic direction.
Purpose of this reportThe ICT Metrics Report, produced annually, highlights major trends in digital service delivery and technology uptake by tracking key focus areas of ICT expenditure, personnel, investment and service capabilities year on year.
This report provides the results from the ICT Survey and related sources for 2016–17 during which the NSW Government spent $3.08 billion through its clusters and agencies on ICT to facilitate public sector service delivery and service reform.
Data was collected from more than 40 NSW Government agencies in 2016–17.
Benchmarking information is included to provide a comparison.
The ICT Metrics ProgramThe ICT metrics report has been presenting and interpreting data on ICT services and capabilities each year since 2012.
The ICT Metrics Program:
• measures the extent to which NSW Government agency ICT expenditure supports the delivery of key digital service capabilities
• provides transparent and comparable ICT expenditure reporting, to enable agency evaluation of performance against a whole-of-government perspective
• captures information on technology trends to inform the Government’s ICT strategic direction.
In NSW, we are committed to using digital to put more power in the hands of citizens and deliver better services, when and where people need them. Our vision is to transform life in NSW by designing policies and services that are smart, simple and seamless.
SourcesThe annual NSW Government ICT Survey is the core element of the ICT Metrics Program, complemented by data from:
• Digital NSW
• Service NSW Annual report
• NSW Procurement
• Telco Authority Annual report
• Data.NSW
• OpenGov NSW
• Customer Satisfaction Survey 2017 data from Office of the Customer Service Commissioner
• Administrative Requirements Portal (ARP) from NSW Treasury
• Centre of Education Statistics and Evaluation — NSW Government
• and supporting information provided by other NSW Government agencies and websites.
Survey of agencies representing approximately
90 per cent of total Government expenditure

NSW Government ICT Metrics Report | 2016–17 7
2.ICT-enabledcapabilities

NSW Government ICT Metrics Report | 2016–17 8
NSW Government delivers services that are easy to use and help customers in real-life situations.
Service accessibility
Over 1.1 million people interact online with the NSW Government through our websites every day. Countless more interact through social media platforms.
Digital interactions are transforming government, just as they are transforming the private sector.
Citizens are getting a more timely and efficient experience dealing with government. This is occurring without the limitations of place, time and device.
Our work is internal and external. We are seeking timely and cost-effective transactions that benefit citizens and government. We strive to deliver better value to taxpayers by implementing efficient operational solutions that are guided by business insights to government. We are also providing more ‘open data’ because it is a driver of greater innovation, productivity and economic activity.
Did you know?1.1 million people interact with NSW Government
online each day.

NSW Government ICT Metrics Report | 2016–17 9
0
200
400
600
800
687
2014–15
824
2015–16
768
2016–17
Doing more with less onlineIn 2016–17, the number of NSW Government websites fell. At the same time, citizen usage of the sites increased markedly.
A reduced number of websites is indicative of government’s commitment to consolidate its online presence, making it easier for citizens to access online services while also reducing costs. This approach has contributed to increases in both customer interaction and satisfaction in 2016–17.
While growth is positive, an opportunity exists to better understand website quality to optimise user experience and minimise duplication across sites.
Figure 3 – Number of separate websites
Service accessibility (cont.)
Consolidating
Source: NSW Government ICT Metrics Survey 2016–17

NSW Government ICT Metrics Report | 2016–17 10
0
100
200
300
400
414M
2014–15 2015–16 2016–17
251M
387M
Citizens are increasingly accessing information and services onlineIn the last two years there has been a 65 per cent increase in citizens accessing government services via websites. This is more than incremental growth. It points to citizens using our websites as a source for easy-to-find trusted and reliable information.
These visits do not include the many more who engage with NSW Government social media pages.
Figure 4 – Number of website visits
Service accessibility (cont.)
Online visits are particularly growing on smartphones and tablets, and this is a reflection of our Service accessibility. Websites and apps most popular with citizens include:
• Opal Travel and similar apps to find travel information
• Service NSW website
• FuelCheck NSW
Source: NSW Government ICT Metrics Survey 2016–17
NSW Government ICT Metrics Report | 2016–17 11
0
200
400
600
800
1,000
1,200
2014–15 2015–16 2016–17
Facebook LinkedIn Google+ and Instagram Twitter YouTube
1,1121,147
1,306
58 62 50
133 161
245
340 361 374
116 111 121
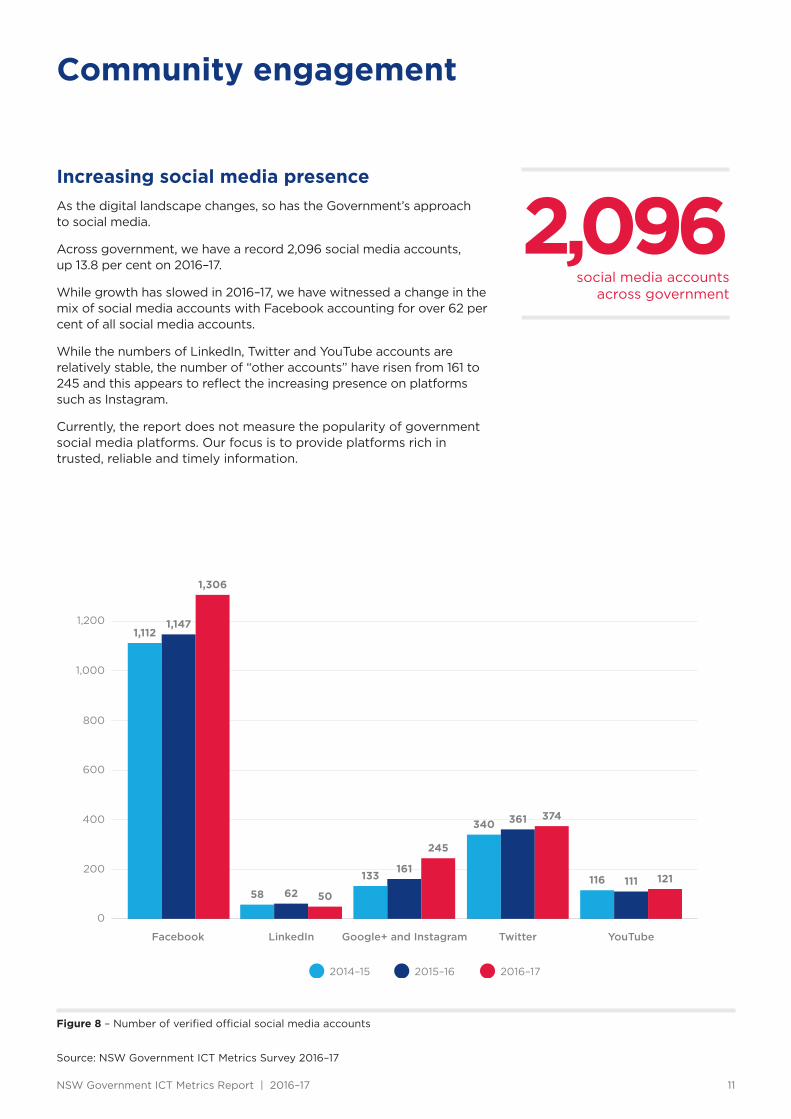
Figure 8 – Number of verified official social media accounts
Increasing social media presenceAs the digital landscape changes, so has the Government’s approach to social media.
Across government, we have a record 2,096 social media accounts, up 13.8 per cent on 2016–17.
While growth has slowed in 2016–17, we have witnessed a change in the mix of social media accounts with Facebook accounting for over 62 per cent of all social media accounts.
While the numbers of LinkedIn, Twitter and YouTube accounts are relatively stable, the number of “other accounts” have risen from 161 to 245 and this appears to reflect the increasing presence on platforms such as Instagram.
Currently, the report does not measure the popularity of government social media platforms. Our focus is to provide platforms rich in trusted, reliable and timely information.
Community engagement
social media accounts across government
2,096
Source: NSW Government ICT Metrics Survey 2016–17

NSW Government ICT Metrics Report | 2016–17 12
Community engagement (cont.)
Online citizen submissions made by the publicMeaningful engagement with citizens and the business community is vital in government decision making.
Citizen involvement informs the design and development of Government policies and initiatives.
Increasingly, we are witnessing more submissions to government inquiries, discussion papers and various policy processes.
During 2016–17, citizens and community groups made an average of 540 submissions a week to government agencies. This is an increase of 33 per cent since 2014–15.
Figure 10 – Number of online submissions made by the Public
2014–15
21,000
2015–16
26,000
2016–17
28,000
0
5,000
10,000
15,000
20,000
25,000
30,000
Source: NSW Government ICT Metrics Survey 2016–17

NSW Government ICT Metrics Report | 2016–17 13
Research on customer satisfactionA strong customer-centred approach underpins the digital transformation of government. NSW public sector agencies regularly seek customer feedback to help improve the quality of their services.
Across the NSW public sector, the Customer Service Commissioner’s customer satisfaction measurement survey is an annual whole-of-government survey to measure customer satisfaction.
The 2017 online survey was completed by both individual and business customers and captures customer feedback on multiple NSW Government services.
In 2017, face-to-face contact remained the most commonly used and preferred contact method for both consumers and businesses. Online contact was the second most common contact method for consumers.
The NSW Government’s priorities in ICT investment are intended to focus on customer-centred design, value for money, and improved service delivery through digital transformation.
The evidence from customer feedback is that this approach is working and it is working better than most other forms of traditional interaction e.g. phone calls and mail.
Human interaction
Figure 11 – Contact method for consumers and businesses in 2016–17
59%
47%
33% 33%28%
44%
13%
35%
7%12%
3% 4%
-1% 1% 1% 2% -1% 1% – 10% – 1% – 1%
In person/face-to-face
Online Phone Email Mail/fax Third parties e.g. Australia Post
Consumers (n=6,789) Business (n=1,705)
A strong customer-centred approach underpins the digital transformation of government
Source: Office of the Customer Service Commissioner, Customer Satisfaction Measurement Survey 2017

NSW Government ICT Metrics Report | 2016–17 14
Online In person/ face to face
Phone Mail/faxEmailThird parties e.g. Australia Post
Consumers (n=6,789) Business (n=1,705)
7.8 7.6 7.7 7.5 7.46.8
7.4 7.1 7.3 7.4
0.1 -0.1 0.2 -0.1
7.5 7.3
0.1 – – 0.1 0.1 – 0.1 0.3
Figure 12 – Variation in overall satisfaction with contact method, scores displayed out of 10
Customer Service Commissioner: Quarterly Pulse Check Survey
Customers who had gone online to carry out direct dealings with NSW Government services in the last 12 months were asked their overall satisfaction with using the contact method to complete their task and their satisfaction with several aspects of their online experience.
Consumer preferred method of contactThere is no one-size-fits-all model for handling citizen interactions with government. However, for actions that are routine, the interactions should be quick, cost-effective and easy to navigate.
The Pulse Check Survey indicates that customer satisfaction with the online experience has increased since 2016. As significantly, consumers are most satisfied by the currency and accuracy of content; that information is being handled securely; and that the format of content met access requirements.
This is a strong endorsement by consumers in the digital transformation work of NSW Government agencies.
Business satisfactionFor businesses, satisfaction is higher for attributes relating to secure handling of information and currency and accuracy of content, and lower for sufficient provision of content and simplicity of websites/apps.
average overall consumer satisfaction
7.7/10
average overall business satisfaction
7.6/10
Human interaction (cont.)
Source: Office of the Customer Service Commissioner, Customer Satisfaction Measurement Survey 2017

NSW Government ICT Metrics Report | 2016–17 15
Consumers (n=1,710) Business (n=414)
I was satisfied with the overall online experienceto complete the task
The content was current and accurate
I trust my information was handled securely
Format of the content met my access requirements
Was useful and allowed me to do everythingI needed to do
Content and support provided online was su�cient
Was simple and it was easy to find what I waslooking for
8 9 107654321
8
8
8
8
8
7.5
8
8
8
7.5
8
7.5
8
7.5
7.9out of 10
7.7out of 10
7.5out of 10
6.6out of 10
7.3out of 10
7.1out of 10
Choose to go onlineAverage satisfaction with online services
No other option availableAverage satisfaction with online services
Were directed/prompted to go onlineAverage satisfaction with online services
Consumers (n=2,134) Business (n=545)
Human interaction (cont.)
Figure 13 – Satisfaction with the attributes of online services
Figure 14 – 2017 Satisfaction with online services
Almost 8 out of 10 consumers choose to use online services
Almost 8 out of 10 consumers
and businesses were satisfied
with online services
Source: Office of the Customer Service Commissioner, Customer Satisfaction Measurement Survey 2017

NSW Government ICT Metrics Report | 2016–17 16
Consumers (n=1,710) Business (n=414)
Assured information remained confidential
Easily able to find what I was looking for
The service was available online
Content was more current / accurate
I had access to a computer / online device
Format of content met access requirements
Online support to answer questions
An incentive / discount was provided
8 9 107654321
7
7.5
7
7
7
7
7
7
7
7
6.5
6.5
6
6
6.5
7
Assured information remained confidential7
7.
The service was available online
I had access to a computer / online device
Online support to answer questions6
6
Across customers who had gone online to carry out their direct dealings, those who chose to go online had the highest average satisfaction with online services (8.1 out of 10 for both consumers and businesses). Customers indicating there was no other option available, recorded satisfaction levels of 7.3 out of 10 for consumers and 6.5 out of 10 for businesses.
Figure 15 – Adoption of online contact methods
in the business community feel assured information remains confidential
7.5/10
Human interaction (cont.)
Source: Office of the Customer Service Commissioner, Customer Satisfaction Measurement Survey 2017

NSW Government ICT Metrics Report | 2016–17
Service NSW digital engagement with customersAs the primary vehicle for delivery of customer facing transactional services, Service NSW plays a vital role in the work towards digital government.
As at 30 June 2017, Service NSW operated 79 service centres across NSW, two contact centres, and a mature digital channel covering the web, mobile applications and API’s.
Service NSW is a success story and it reflects positively on all agencies. The scope of its reach is compelling:
• 34 million customer interactions• Delivering services to customers and businesses
through our network of 79 service centres• Fourteen of the 16 new service centres opened
in 2016-17 were located in rural and regional communities, at Cessnock, Ballina, Raymond Terrace, Bega, Ulladulla, Mittagong, Tuncurry, Nelson Bay, Taree, Griffith, Casino, Inverell, Narooma and Eden.
• Contact Centres serving 3.5 million customers• Contact centres are located at Parramatta
and Newcastle and are key employment hubs in Western Sydney and the Newcastle region collectively they employ more than 400 team members with 270 employed on a full-time basis.
In 2016–17 our Contact Centres served more than 3.5 million customers. Since 2013 our Contact Centres have served over 9 million customers.
Source: Service NSW — Annual Report 2016–17
Human interaction (cont.)
Service NSW is a success story
Year at a glance 2016–17
7.7M customers servedwith an average wait time of 7 minutes
23.1M online customer visits
1 millionMyServiceNSW accounts created
40 partner agencies
79 service centresincluding 14 new service centres opened in regional NSW that have become key employment hubs
17

NSW Government ICT Metrics Report | 2016–17 18
Digital licences — on the way to digital governmentNSW currently issues more than 23 million licences each year, covering 769 different licence types.
A transition to digital formats changes not only the transaction channel but also brings in new concepts in citizen digital identity in place of traditional paper-based and plastic identity authentication.
The Digital Licence Program will make government licensing available to customers in a digital format.
The technology allows citizens to display, apply, update and renew their licences using their smartphone, with real-time information also available. The Digital Licence has security safeguards built in to preserve the integrity of the entitlement and enables authorities to more easily verify the validity of these.
In time, it will mean that citizens will not have to carry paper and plastic licences with them.
The launch of the digital licence platform means licence-holders can now access NSW government licences and permits digitally using your mobile phone or tablet device. The first licences to become available are:
• Recreational Fishing Fee
• Responsible Service of Alcohol (RSA) Competency Card
• Responsible Conduct of Gambling (RCG) Competency Card
Digital licences are available on an opt-in basis and licence-holders will still receive a physical licence or permit. When asked to display their licence or permit, licence-holders will have the choice to provide either their physical card or digital licence.
We will continue to introduce more licence types over time, with the digital Driver Licence on track to be ready in 2019.
Regional motorists can now test-drive their digital driver licence, with the NSW Government launching a trial in Dubbo.
Dubbo residents who participate in the trial, will be able to use their digital driver licence, accessible on a mobile phone, for proof of identity and proof of age to gain entry into pubs and clubs as well for roadside Police checks.
Human interaction (cont.)
Digital licences are now closer than ever
Source: Service NSW — Annual Report 2016–17
NSW Government ICT Metrics Report | 2016–17 19
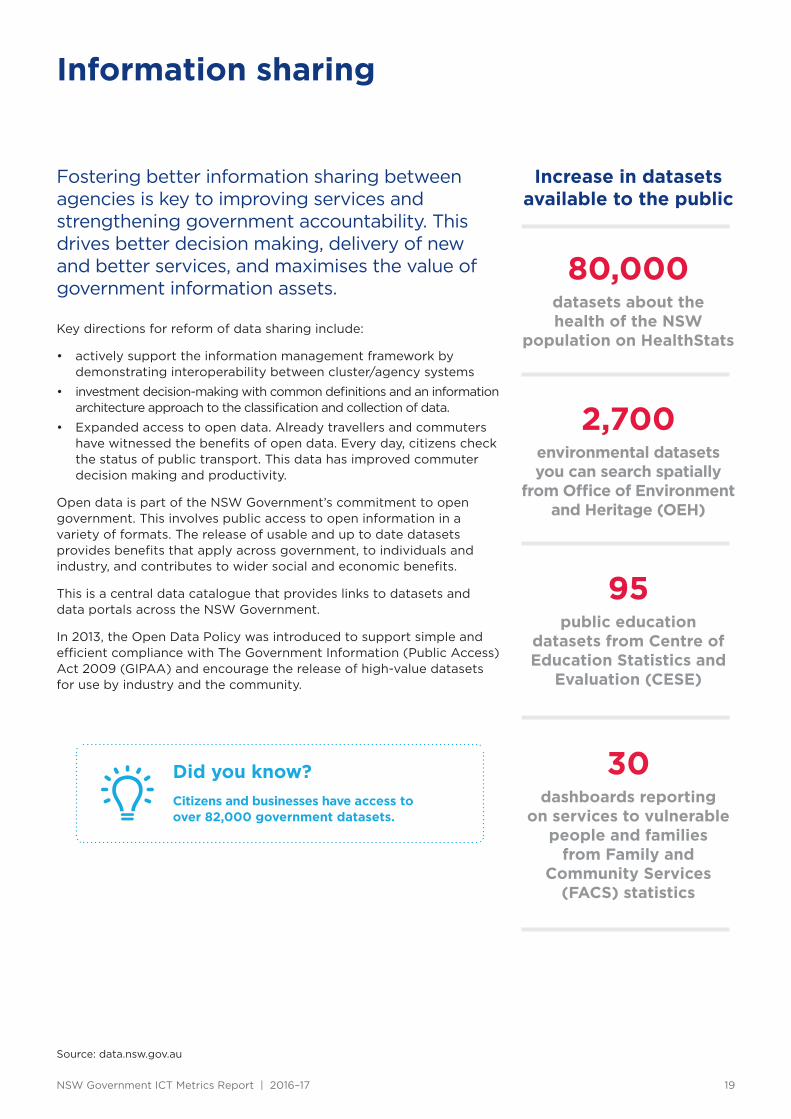
Increase in datasets available to the public
Information sharing
Fostering better information sharing between agencies is key to improving services and strengthening government accountability. This drives better decision making, delivery of new and better services, and maximises the value of government information assets.
Key directions for reform of data sharing include:
• actively support the information management framework by demonstrating interoperability between cluster/agency systems
• investment decision-making with common definitions and an information architecture approach to the classification and collection of data.
• Expanded access to open data. Already travellers and commuters have witnessed the benefits of open data. Every day, citizens check the status of public transport. This data has improved commuter decision making and productivity.
Open data is part of the NSW Government’s commitment to open government. This involves public access to open information in a variety of formats. The release of usable and up to date datasets provides benefits that apply across government, to individuals and industry, and contributes to wider social and economic benefits.
This is a central data catalogue that provides links to datasets and data portals across the NSW Government.
In 2013, the Open Data Policy was introduced to support simple and efficient compliance with The Government Information (Public Access) Act 2009 (GIPAA) and encourage the release of high-value datasets for use by industry and the community.
Source: data.nsw.gov.au
Did you know?Citizens and businesses have access to over 82,000 government datasets.
80,000datasets about the health of the NSW
population on HealthStats
2,700environmental datasets you can search spatially
from Office of Environment and Heritage (OEH)
95public education
datasets from Centre of Education Statistics and
Evaluation (CESE)
30dashboards reporting
on services to vulnerable people and families
from Family and Community Services
(FACS) statistics

NSW Government ICT Metrics Report | 2016–17 20
High-value datasets
Data quality is an important attribute for improving the usability of the data published.
Information sharing (cont.)
1 Jun 2015
1 Jun 2016
1 June 2017
Tabular 22% 27% 36.6%Spatial 2.4% 3% 3.9%
A study of Data NSW shows that the proportion of datasets that are tabular (and machine readable) or spatially enabled is increasing, as is the number of data collections which have data quality statements.
Datasets that include a data quality statement are downloaded almost twice as much as datasets without. This highlights the importance of publishing data with the appropriate metadata to enable its usability.
While the proportion of machine readable datasets and datasets with data quality statement are increasing, they are currently low. There is an opportunity to build on this foundation to significantly improve the value of open data by improving readability and interpretability.
Figure 16 – Datasets attributes
Source: data.nsw.gov.au/data/stats#res-by-org and data.nsw.gov.au/data/dataset
There is an opportunity to significantly improve the value of open data by improving readability and interpretability

NSW Government ICT Metrics Report | 2016–17 21
Case study 1: Online Birth Registration System
When a baby is born, its parents must register the birth with the NSW Registry of Births, Deaths and Marriages. Right now, mum or dad enter their newborn’s details into an online form, and then submit it to the Registry. From there, the form is printed, and information is entered manually into a database, which is time-consuming and costly and sometimes results in errors that must then be corrected. It also means parents must often wait up to 12 days for their child’s birth certificate to be issued.
This project extends the existing Births, Deaths and Marriages (BDM) online forms system to accept birth registration details directly from parents. In the new system, birth details will be submitted online and automatically uploaded into the database for official registration.
After submission, parents can check the status of their baby’s registration online and will be able to see their child’s birth registered within minutes. If the hospital or midwife has already notified the Registry of the birth, and the data matching threshold is met, a birth registration will be produced instantaneously. If a certificate has also been applied for by parents, then a certificate will be produced and sent within one working day.
Automating the births registration process will offer a more streamlined user experience. It enables parents to register and apply for a birth certificate in a single transaction. Users will also be able to automatically verify their documents and print their baby’s birth certificate themselves.
The new system is also much more efficient for government. It is estimated that a 70 per cent uptake in NSW will reduce costs to the Registry by around $334,000 p.a.
Currently a Registry staff member is required to spend up to 6 hours per day sorting and then scanning forms to send digitally to the data entry provider. Online Birth Registration will see a steady reduction in the amount of paper forms coming into the Registry and all but eliminate the need for these manual tasks. A potential saving to the Registry of at least $250,000 per year in employee-related expenses could be realised by automating the process.
The Registry has spent $46,000 in the past 12 months printing paper forms. There are additional costs associated with sending paper forms to hospitals and midwives. The new system will significantly reduce paper waste; the Registry will no longer need to shred over 90,000 paper forms per year after births are registered.
Reduced calls to the contact centre and less paper mail to open and process, will also significantly reduce costs.
Perhaps most importantly, the Registry anticipates happier parents! Right now, around 6,500 birth certificates a year need to be amended because data entry people are tasked with deciphering parents’ handwriting, and mistakes naturally happen. Now parents will enter their child’s details directly and receive a preview of their certificate before submitting. It will reduce errors and make birth registration hassle-free.
Automating the births registration process
offering a more streamlined user experience
Source: www.digital.nsw.gov.au/project-story/online-birth-registration-system
Information sharing (cont.)

NSW Government ICT Metrics Report | 2016–17 22
eHealth NSW is connecting these disjointed systems to provide clinicians with secure and immediate access to a patient’s recent medical history from across all NSW Local Health Districts and a patient’s My Health Record.
As part of this, eHealth is optimising electronic medical records (eMR). The key aspects of this work are creating a consistent eMR foundation across NSW, significantly expanding and accelerating electronic medication management, delivering new functionality and increasing adoption and use.
This means that irrespective of which NSW Health service a patient attends, their treating doctors, nurses and allied health providers will have the information they need to deliver the best care. 84 per cent of in-scope facilities are already integrated into the eMR.
The result will be better patient safety with information and best practices from one Local Health District being easily transferable to any other.
Case study 2: Electronic Medical Record 2
A patient’s health information is often spread across a vast number of different locations and incompatible computer systems.
secure and immediate access to a patient’s recent medical history and electronic medical records
Source: www.digital.nsw.gov.au/project-story/electronic-medical-record-2
Information sharing (cont.)

NSW Government ICT Metrics Report | 2016–17 23
3.ICT trends in NSW Government

NSW Government ICT Metrics Report | 2016–17 24
0.0
0.5
1.0
1.5
2.0
2.5
3.0
2014–152013–142012–13 2015–16 2016–17
3.08bn
2.4bn2.26bn2.18bn
2.65bn
Investment and expenditure trends
Total spendICT should not be seen as a cost or drain on taxpayers. Rather, it is an investment in the capability of NSW Government agencies to provide effective and responsive services to the people of NSW. It drives performance, productivity and customer satisfaction.
Over the last five years, the NSW ICT spend has increased by 41 per cent. This reflects the Government’s determination to provide customer centric services to the people of NSW.
In 2016–17, the ICT Spend totalled $3.08 billion, an increase of 16.25 per cent from 2015–16.
ICT transformation is key to improving the effectiveness of government and thereby improving customer satisfaction.
Figure 17 – Total ICT Expenditure
is spent on ICT in 2016–17
$3.08B
Source: NSW Government ICT Metrics Survey 2016–17

NSW Government ICT Metrics Report | 2016–17 25
2014–152013–142012–13 2016–172015–16
3.4%
3.8%
3.6% 3.6%
3.4%
3.6%3.7%
4%
4.3%4.3%
NSW Government Gartner Inc. State and Local Government Gartner Inc. Cross Industry
3
4
5
4.3%4.2%
4.6% 4.6%
4.1%
ICT expenditure consistent with benchmarksTo ensure we can assess the effectiveness of our spend, we benchmark ICT expenditure. ICT as a percentage of total agency expenditure increased in 2016–17 and is consistent with Industry benchmarks.9
The proportion of spend on ICT versus total agency expenditure was 4.3 per cent in 2016–17, which is consistent with the Gartner benchmarks of 4.1 per cent (State and Local Government) and 4.6 per cent (Cross Industry). This is a reflection of the Government’s determination to ‘catch-up’ on ICT and to undertake ICT transformation.
This expenditure reflects the Government’s investment in projects that could be considered ‘catch-up’ and demonstrates the determination to invest in projects that improve the capability of NSW agencies.
The 2017 Gartner Cross Industry benchmark’s average IT spend per employee is approx. $17,000. NSW Government ICT Expenditure is approximately $7,700 per employee.
Figure 19 – ICT expenditure as a percentage of total agency expenditure
Investment and expenditure trends (cont.)
⁹ State and Local: Gartner IT Key Metrics Data 2017: Key Industry Measures: Government — State and Local Analysis: Multiyear.
Cross Industry: Gartner IT Key Metrics Data (December 2017)
NSW Government Total spend : NSW Government ICT Metrics Survey 2016–17
* Gartner $ figures have been converted from USD to AUD
Expenditure is appropriate based on industry benchmarks

NSW Government ICT Metrics Report | 2016–17 26
$0
$100,000
$200,000
$300,000
$400,000
$500,000
$600,000
$700,000
$800,000
Transport $740,130 16.8%
% of change 2015–16 to 2016–17
Justice $664,150 48.4%
Health $689,336 9.9%
Education $339,088 10.1%
Finance, Services and Innovation $232,975 -2.4%
Planning and Environment $55,751
34.2%
Family and Community Services $171,498 7.9%
Industry, Skills and Regional Development $138,606
13.3%
Treasury $28,778 51.2%
Premier and Cabinet $20,243 -2.2%
ICT expenditure by clustersThe bulk of the ICT spend comes from the Transport, Health and Justice clusters.
This spend reflects the Government’s determination to invest in projects with clear benefits for the people of NSW.
Figure 18 – ICT expenditure by clusters
Investment and expenditure trends (cont.)
average increase across Transport, Health,
Justice and Education
19.4%
Source: NSW Government ICT Metrics Survey 2016–17

NSW Government ICT Metrics Report | 2016–17 27
ICT spend by service towers
Figure 20 – Spend by service tower11
ICT Expenditure ($M) 2012–13 2013–14 2014–15 2015–16 2016–17
% of 2016–17
spend
% Change from
2015–16 to 2016–17
Compound Annual
Growth Rate
Serv
ice
tow
ers
Applications 939 982 1,029 1,185 1,391 45% 17% 11%
End User Infrastructure 280 271 312 357 431 14% 21% 11%
ICT Corporate Functions 145 196 203 258 356 12% 38% 21%
Network 272 285 314 367 300 10% -18% -1%
Server 170 163 162 145 247 8% 71% 15%
Voice Services 228 215 217 173 200 6% 15% -3%
ICT Service Desk 56 63 63 59 65 2% 10% 1%
Facilities 55 44 55 55 49 2% -12% -4%
Storage* 38 49 48 43 42 1% -3% -5%
Total 2,183 2,268 2.404 2,637 3,080 100% 17% 9%
Inp
ut c
ost
s el
emen
ts
Internal personnel 544 514 514 531 659 21% 24% 9%
External personnel 267 302 323 449 615 20% 37% 24%
Software 394 404 437 459 522 17% 14% 6%
Hardware 306 313 363 424 462 15% 11% 8%
Services Outsourced 334 365 375 416 452 15% 6% 6%
Carriage 260 291 325 280 228 7% -18% -11%
Others 78 79 67 77 69 2% -10% 1%
Radio 74 2%
Total 2,183 2,268 2,404 2,637 3,080 100% 17% 9%
Investment and expenditure trends (cont.)
11 Totals may not match the sum of the elements due to rounding and consolidation.
Source: NSW Government ICT Metrics Survey 2016–17
* Negative growth in agency storage is due to whole-of-government data storage/migration initiative to GovDC. (Refer to figure 32, on page 45.)
Service towerThe service and sub-service towers represent the primary services provided by ICT departments and are aligned to skill sets and service offerings in the market. Each service tower is comprised of Cost Elements (cost definitions provided in Appendix C).
of service towers ICT spend is on Applications
45%

NSW Government ICT Metrics Report | 2016–17 28
Applications spendApplication spend is highest is Transport, Health, Justice and Education clusters.
Application spend makes up 52 per cent of the total ICT spend within Transport, which is comparable to 55 per cent within Health cluster (25 per cent in Justice and 32 per cent in Education).
Increased application expenditure is due to several key NSW government initiatives e.g; Intelligent Congestion Management and Enterprise Asset Management with a combined spend of $396 million.
Server spendServer ICT expenditure increased this year by 76 per cent ($107 million).
This incline is primarily attributed to the Transport, Justice and Family and Community Services (FACS) Clusters.
ICT Spend by service tower has been heavily focused on Applications in most of NSW clusters.
• A total of $1.3 billion has been spent on Applications alone, which makes 45 per cent of the total ICT spend in NSW.
• $431 million has been spent on End User Infrastructure ICT expenditure which accounts for 14 per cent of expenditure.
• ICT Corporate functions account for 12 per cent totalling $356 million.
• Network ICT expenditure was $300 million accounting for 10 per cent of service tower expenditure.
The various split by service towers is below:
ICT corporate function spendCorporate function spend has increased 39 per cent this year, the increase stemming primarily from NSW Planning and Environment, Education and Justice clusters.
These increases were partially offset by the transition of ServiceFirst to GovConnect. The increase in costs is related primarily to additional investment in Hardware and Software supporting Corporate Functions.
ICT service desk spend Service Desk spend increased by 19 per cent ($10 million) in 2016–17.
This increase mainly came from Justice, Education and FACS clusters.
This increase correlates to a sharp increase in internal and external personnel.
Investment and expenditure trends (cont.)

NSW Government ICT Metrics Report | 2016–17 29
0%
20%
40%
60%
80%
100%
30%
70%
33%
67%
31%
69%
Capex Opex Gartner Inc. Capex
2014–152013–142012–13 2015–16 2016–17
19%
27%
73%71%
27%29%
28%26%
23%
Figure 21 – Proportion of capital vs operating expenditure against benchmark12
Capital vs operating expenditureThe mix of capital and operating expenditure continues to change. As the major transformations are delivered, capital expenditure as a percentage of spending will fall.
ICT capital expenditure has fallen as a percentage of spending. However, it is still considerably higher than the Gartner benchmark. In 2016–17, the Gartner benchmark for capital expenditure was 19 per cent, down from 27 per cent in 2015–16.
As will be seen in the Run, Grow and Transform section, strong capital expenditure typically reflects that the Government is investing in transformation. These figures confirm that transformation across government is ongoing (see figure below).
12 Gartner IT Key Metrics Data 2017: Key Industry Measures: Government — State and Local Analysis: Multiyear
Source: NSW Government ICT Metrics Survey 2016–17
Investment and expenditure trends (cont.)
Government lagging behind in moving to Opex funded transformation

NSW Government ICT Metrics Report | 2016–17 30
Justice Police Body Worn VideoCluster: Justice
Agency: Police
Priority: Data
Project Description: Body Worn Video (BWV) camera devices and supporting infrastructure to all LACs state wide and to selected Specialist Commands on an as-needs basis. Approximately 3,500 cameras and 560 BWV kiosks. Up to 450 additional locations with archive capability.
Planning and Environment
Heritage Digitisation Cluster: Planning and Environment
Agency: State Library NSW
Priority: Customer Experience
Project Description: Digitises the Library’s most iconic, at-risk and valued collections and will completely renew its underlying infrastructure and systems. Digital material will be created and preserved at scale during this 10-year program.
Transport Intelligent Congestion Management Cluster: Transport
Agency: Transport Management Centre
Priority: Customer Experience
Project Description: A program to integrate business processes and systems that support data gathering, analysis, decision support and information exchange around congestion management.
Education
Connecting Country SchoolsCluster: Department of Education
Agency: Education
Priority: Customer Service
Project Description: Improving connectivity in 914 regional and remote government schools by installing wireless access for all learning spaces within the schools. Expanding access to the internet in NSW Regional Public Schools where access is currently via satellite connection, and supporting the wireless delivery.
Health
Electronic Medical RecordsCluster: Health
Agency: eHealth
Priority: Data
Project Description: Continued rollout of Electronic Medical Records to create a consistent experience for patients in hospitals. This phase will make EMRs, including medication management, accessible in all hospitals with access to the system.
Investment and expenditure trends (cont.)
Source: digital.nsw — Digital Government at a glance, by cluster

NSW Government ICT Metrics Report | 2016–17 31
0% 20% 40% 60% 80% 100%
NSW Govt 2016–17
NSW Govt 2015–16
NSW Govt 2014–15
Gartner 2017
Hardware Outsourcing PersonnelSoftware
18% 22% 19% 42%
18% 20% 19% 43%
23% 14% 16% 47%
14% 20% 21% 45%
Investment and expenditure trends (cont.)
Figure 22 – ICT spending distribution
ICT spending distributionICT spend in Software and Outsourcing have clearly decreased, and there is an upward trend in expenditure on Hardware and Personnel.
Spending on outsourcing has declined from 19 per cent to 16 per cent and is less than the Gartner benchmark of 21 per cent.
Overall spend for personnel is 47 per cent in 2016–17, which is 2 percentage points higher than the Gartner benchmark.
Source: NSW Government ICT Metrics Survey 2016–17

NSW Government ICT Metrics Report | 2016–17 32
0%
20%
40%
60%
80%
100%
Run the business Grow the business Transform the business
Capex Opex
23%
77%
76%
24%
70%
30%
Figure 23 – Run, Grow, Transform by capital and operating Expenditure NSW Government (Definition for Run, Grow, Transform provided in appendix D)
Investment and expenditure trends (cont.)
Run, Grow and Transform the businessThe Run, Grow and Transform model allows organisations to assess how they are spending ICT and if the ICT spend aligns with the organisation’s strategy.
The distribution of IT spending to run the business, grow the business and transform the business provides a view of the IT investment profile to support business performance.
In some industries, it is not uncommon to see a high ‘run’ focus — typically because organisations in the industry are not planning strong changes in business model growth or high organic growth — which often translates into a more ‘cost centre’ role for IT in the industry or niche sector. IT spending is classified into categories that show the impact on business outcomes or success can aid alignment and quantify underinvestment in IT.
Year 2016–17 NSW ICT Capital expenditure is in Grow and Transform the business rather than Run the business. Run the business shows a trend towards spending more on operational expenditure consistent with last year’s data.
Source: NSW Government ICT Metrics Survey 2016–17

NSW Government ICT Metrics Report | 2016–17 33
Sector capability
ICT job categories reflecting ICT trendsThe number of ICT Full-Time Equivalents (FTE) rose marginally in 2016–17 to 6,779. A 2.7 per cent increase on 2015–16.
This increase reflects the major ICT investment that is underway in the large clusters.
Program and Project management roles account for 1,020 FTEs. Two-thirds of these roles are being undertaken by external contractors.
This is recognition that many ICT transformative projects, need specific skill sets, often for just a short period of time. This targeted approach to project management is a cost-effective means of ensuring the best skills are brought in to deliver specific ICT projects.
ICT transformative projects need specific skill sets, often for just a short period of time
People Matter Employee SurveyThe NSW People Matter Employee Survey allows agencies to assess the engagement of government employees as they do their work.
The survey, with 140,063 responses was open to all employees across the NSW Government sector.
Engagement with work remains strong
at 72 per cent
Source: NSW Government ICT Metrics Survey 2016–17

NSW Government ICT Metrics Report | 2016–17 34
Program and Project Management
Development and Programming
Business Process Analysis/Design
Systems Administration
Networks and Telecommunications
Service Management
Systems Analysis and Design
Testing
Strategic Leadership
Architecture
Training and Development
0 200 400 600 800 1000
1,020
598
579
458
314
279
234
226
162
158
101
33%
% of change 2015–16 to 2016–17
Infrastructure and Facilities 782 -4%
Helpdesk/Support 884 6%
-24%
16%
-5%
-6%
-15%
-1%
11%
Databases and Data 174 4%
Systems Integration and Deployment 212 15%
17%
52%
Information/Knowledge Management 137 -12%
Web and Multimedia Content Development 74 -31%
Security 101 7%
Analytics Professionals 91 133%
Quality Assurance 46 10%
-25%
Procurement and Vendor Relations 149 -1%
Figure 25 – Number of FTE 2016–17 by job categories
Sector capability (cont.)
Source: NSW Government ICT Metrics Survey 2016–17

NSW Government ICT Metrics Report | 2016–17 35
Quality Assurance
Analytics Professionals
Security
Web and Multimedia Content Development
Training and Development
Procurement and Vendor Relations
Information/Knowledge Management
Architecture
Strategic Leadership
Systems Integration and Deployment
Databases and Data
Testing
Systems Analysis and Design
Service Management
Networks and Telecommunications
Systems Administration
Business Process Analysis/Design
Development and Programming
Helpdesk/Support
Infrastructure and Facilities
Program and Project Management
Internal FTE External (Contract Workforce)
57%
% of change 2015–16 to 2016–17
37%
54%
51%
62%
66%
60%
8%
75%
43%
41%
-25%
8%
69%
84%
3%
64%
60%
-35%
4%
84%
0 100 200 300 400 500 600 700
36
62
78
56
82
123
110
86
141
151
123
85
127
237
288
421
302
309
723
625
331
10
29
23
18
19
25
28
73
20
60
60
141
51
26
36
37
277
290
161
158
689
In certain areas, the NSW Government is progressively outsourcing project and development roles. This is recognition that, at times, it is better to hire a specialist to respond to an ICT issue for a specific length of time than to employ an FTE on an ongoing basis.
Many solution development roles are now filled by external labour, for example, in the Development and Programming (48%), Testing (63%), Business Process Analysis and Design (48%), Web and Multimedia content development (24%), Program and Project Management with (68%) job categories.
Sector capability (cont.)
Figure 26 – Number of Full time employee by Job Family
Source: NSW Government ICT Metrics Survey 2016–17
NSW Government ICT Metrics Report | 2016–17 36
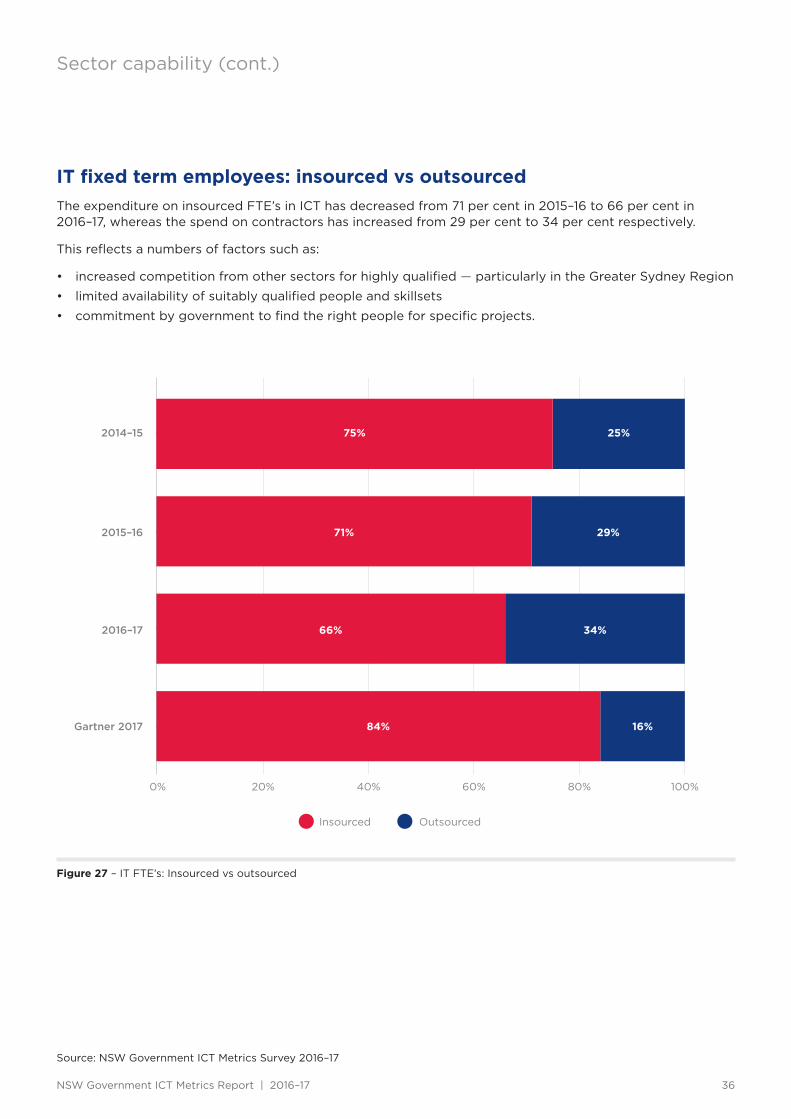
Sector capability (cont.)
IT fixed term employees: insourced vs outsourcedThe expenditure on insourced FTE’s in ICT has decreased from 71 per cent in 2015–16 to 66 per cent in 2016–17, whereas the spend on contractors has increased from 29 per cent to 34 per cent respectively.
This reflects a numbers of factors such as:
• increased competition from other sectors for highly qualified — particularly in the Greater Sydney Region
• limited availability of suitably qualified people and skillsets
• commitment by government to find the right people for specific projects.
Figure 27 – IT FTE’s: Insourced vs outsourced
Insourced Outsourced
0% 20% 40% 60% 80% 100%
2014–15
2015–16
2016–17
Gartner 2017 84% 16%
66% 34%
71% 29%
75% 25%
Source: NSW Government ICT Metrics Survey 2016–17

NSW Government ICT Metrics Report | 2016–17 37
4.Delivering value for money through ICT reforms
NSW Government ICT Metrics Report | 2016–17 38
ICT Assurance Framework (IAF)
NSW Government now invests over $3.08 billion on ICT.
This investment provides citizens with better services and ensures productive and efficient business operations.
However, given the size, scope and complexity of many projects, the ICT spend requires a systematic approach to mitigate the risk of cost overruns or service disruption.
The NSW Government has developed and implemented a strengthened ICT Investment Governance Model approved by Cabinet in December 2016. This is to ensure that taxpayer funds are applied to the right technology projects for NSW, to keep them on track, and to deliver promised benefits.
A key element of this is a new ICT Assurance Framework (IAF) covering ICT projects with an estimated total cost of at least $10 million or projects of strategic significance. The IAF is aligned with Treasury’s Gateway Policy and Infrastructure NSW’s Infrastructure Investor Assurance Framework.
The ICT Assurance Framework continues to support the health of the ICT delivery portfolio. The value of ICT Assurance services is evidenced by business units requesting support even when it is not required under the framework.
The ICT Assurance Framework Pre-Delivery Gateway Assessment to be launched in 2018, will:
• test business need
• ensure alignment with agency and whole-of-government directions, prevent duplication
• identify projects that require further thinking.
It will help clusters select the right project before significant investments are made.
The value that the Pre-Delivery Gateway Assessment can provide will increase significantly once the ICT & Digital Investment Plan (IDIP) and the whole-of-government reference architecture are introduced.
As funding and prioritisation processes evolve, so too must the ICT Assurance Framework.
The ICT Assurance Framework will be reviewed by the Government Chief Information & Digital Officer (GCIDO) to ensure that it supports the NSW Digital Government Strategy and IDIP.

NSW Government ICT Metrics Report | 2016–17 39
Procurement reforms increasing the number of SMEs
Reforms to the ICT procurement system have encouraged greater numbers of suppliers to compete for government business.
Enhanced competition and greater supplier diversity are delivering better value for money to government buyers, exposing agencies to a greater range of innovative products and services. These reforms have included transitioning to always open and online pre-qualification schemes and streamlining the ICT Services Scheme. This is less onerous and rebalances the allocation of risk within the standard form contract.
The ICT Services Catalogue lists suppliers pre-qualified to deliver a range of ICT services to the NSW Government. Category Q (co-designed by industry and government) provides services and products to assist agencies in transitioning to enterprise resource planning as-a-service.
Sub-categories include professional services, human capital management and eRecruitment, GovDC as a platform, GovDC Software as-a-service, and expense management systems.
In 2016–17, the ICT Services Scheme grew by 733 new suppliers to 2,905, increasing in size by 34 per cent. Small to medium enterprises (SMEs — employing 200 or less FTEs within Australia) make up the majority of suppliers.
Figure 28 below illustrates that the most prevalent suppliers on the procurement reform scheme employs less than 100 staff.
Figure 28 – ICT Services Supplier Scheme Growth
2014–15
795
502
92
233
1,115
658
107
292
862
1,527
156
360
2015–16 2016–17
0–19 20–100 101–200 200+
0
500
1,000
1,500 68% growth in
SME suppliers
Source: NSW Procurement

NSW Government ICT Metrics Report | 2016–17 40
0%
20%
40%
60%
80%
100%
2014–15 2015–16 2016–17
We do not operate Plan Phase Build Phase Both Plan and Build
41%
27%
5%
27%
33%
33%
5%
29%
34%
20%
10%
37%
Enterprise architecture
The NSW Government EA Strategy provides direction and practical guidance to accelerate the development of agency enterprise architecture capability and enables a common approach to the design solutions. By driving a common approach to EA there are opportunities to deliver increased value of investment by sharing and reuse of solutions.
Agencies were asked what is the nature of their EA processes, and whether they operate a defined set of Enterprise Architecture processes at the [Plan / Build / Plan + Build] phase of the Plan/Build/Run IT Value Chain.
Enterprise Architecture (EA) is a design and planning discipline that helps define the structure and operation of an organisation’s business, ICT systems and processes.
Enterprise architecture maturity is increasing with 67 per cent (up from 59%) of respondent agencies reporting they operate a defined set of enterprise architecture processes.
This reflects change in the ‘Plan and Build’ which has increased to 37 per cent (up from 29%) showing a maturity of the design and planning discipline throughout our IT value chain indicating the success of the NSW GEA Strategy to enable agency capability.
Figure 29 – Proportion of agencies that operate a defined set of Enterprise Architecture processes at each stage of the Plan/Build/Run IT value chain.
Source: NSW Government ICT Metrics Survey 2016–17

NSW Government ICT Metrics Report | 2016–17 41
Fixedvoice
Fixed data and internet
Mobile Radio Other
169M
0
50
100
150
200
54M
78M
49M
100M
Telco strategy
NSW Government Operational Communications Strategy — An innovative NSW government is digital, lean and connected.
In 2016–17 the NSW Telco Authority continued to implement the NSW Government Operational Communications Strategy, which was approved in September 2015.
NSW Government Operational Communications Strategy — An innovative NSW government is digital, lean and connected.
In 2016–17 the NSW Telco Authority continued to implement the NSW Government Operational Communications Strategy, which was approved in September 2015.
NSW Government continued to implement two strategies to in relation to telecommunications.
1. The Operational Communications Strategy has been established to improve mission critical communications used by front line staff such as police and emergency services. Approved in September 2015, the Strategy sets out the operating models, principles and actions required to reform the government communications sector in order to improve services, eliminate unnecessary duplication and promote greater industry participation and competition. The NSW Government Operational Communications Strategy can be viewed at www.telco.nsw.gov.au. The Operational Communications Strategy is primarily concerned with radio spend as set out in the figure above.
2. The Enterprise Telco Strategy has been established improve competition and value for money associated with commodity telecommunications services such as mobile phones and connectivity between government offices and data centres. Approved in October 2016, the Telco Strategy is being implemented by DFSI’s ICT Procurement branch and is concerned with Fixed Voice, Fixed Data and Internet and Mobile spend as set out in the figure above.
The 2016–17 financial year marked the NSW Telco Authority’s fifth year of operation as a statutory authority within the Department of Finance, Services and Innovation.
Figure 30 – Voice and Network spend for financial year 2017
Note that each category includes hardware, equipment and professional services.
Source: NSW Telco Authority – Telco spend by carriage
FY2017 spend
$450M
NSW Government ICT Metrics Report | 2016–17 42
NSW Government Radio Network The Telco Authority manages the NSW Government Radio Network (GRN). The GRN is used by public safety entities and other NSW government agencies for essential communications.
The GRN is used by government agencies for emergency services voice communications, special events, exercises and training
The GRN geographically covers approximately 266,000 square kilometres, or about a third of NSW.
During 2016–17, following significant network upgrades, GRN availability has been delivered in excess of the network Service Level Agreement (SLA) of 99.95 per cent, for the whole period.
The Telco Authority instigated a number of activities to improve services, user experience and the resilience of the GRN throughout 2016–17 including, building and deploying Cell on Wheels assets, upgrading site systems and upgrading the P25 core infrastructure.
Simplified, efficient service improves customer satisfaction
Mobile Data Radio Network In 2016–17 the Telco Authority continued to provide the Government Mobile Data Radio Network (MDRN) in partnership with the Trapeze Group Asia Pacific Pty Ltd.
The MDRN provides a shared capacity for low speed data communications used for computer-aided dispatching of data. The network is available in approximately 400 vehicles in the NSW Ambulance fleet to send information via data as opposed to voice, and is essential to achieving a rapid patient response. The MDRN was available 99.998 per cent of the 2016–17 financial year.
Key ProjectsCritical Communication Enhancement Program:
During 2016–17, a state-wide audit of over 2,600 radio sites, including almost 27,000 assets across the state was undertaken as part of the Critical Communication Enhancement Program (CCEP).
The Telco Authority is developing a new, integrated blueprint to consolidate around 2,400 sites to 700 sites across NSW.
As well, the coverage footprint of the Government Radio Network (GRN) was extended in a pilot area in the north-west region. This will provide approximately 20 000 square kilometres of additional in-vehicle coverage at a public safety standard.
Telco strategy (cont.)
Source: www.finance.nsw.gov.au/sites/default/files/annual_report_telco_authority_2016–17.pdf

NSW Government ICT Metrics Report | 2016–17 43
84%of agencies reported using an ITSM methodology.
ITIL V3 is predominantly used for Incident management (93%), Change management (86%), Service Design — Service Level Management (67%).
ITSMis predominantly used for Incident management (93%), Change management (86%), Service Design — Service Level Management (67%).
40% of agencies have done an assessment of their ITSM maturity.
IT Service Management
IT Service Management (ITSM) focuses on the delivery of quality ICT services that meet the needs of customers and is delivered by the right mix of people, process and information technology.
ITSM provides a framework to plan, deliver, operate and control ICT services that are both internally provided and externally sourced ‘as-a-service’.
Understanding the primary IT Service Management methodologies utilised across NSW government, and their maturities, will aid the development of a whole-of-government ITSM Framework and toolkit.
This will provide agencies with a pathway to advance their IT Service Management capability.
Key findings
Source: NSW Government IT Service Management

NSW Government ICT Metrics Report | 2016–17 44
NSW Government policy on cloud-based services
One of the Government’s ICT investment imperatives is that projects should align to a service orientation, including as-a-service sourcing models, as a primary option.
The NSW Government takes a new and more flexible approach to ICT procurement, including ‘on-tap’ or ‘as-a-service’ solutions.
It positions the NSW Government to take advantage of two major industry trends being driven by technology commodification and the adoption of web services by consumers:
• move to service orientation by both vendors and buyers
• deployment of cloud technologies into mainstream business.
Cloud-based ICT services provide opportunities for agencies to achieve better value, flexibility and reliability, and make sustainable service delivery improvements.
Figure 31 – Service Outsourcing: including as-a-service
Outsourced: as a service Outsourced: all other
2014–15 2015–16 2016–17
$0
$100K
$200K
$300K
$400K
$500K
$113K
$252K
$277K
$144K
$283K
$168K
16% 7%
16% growth
7% growth
Source: NSW Government ICT Metrics Survey 2016–17

NSW Government ICT Metrics Report | 2016–17 45
2014–15 2015–16 2016–17
Commercially Hosted Government Data Centre In-house facility
0
20,000
40,000
60,000
80,000
100,000
45,925
58,636
18,054
5,134
53,777
31,292
9,4848,712
6,325
GovDC
Agencies continue to migrate on-premises data centres to the two world-class NSW Government data centres located in NSW. These centres support agencies to buy ICT services on demand and allow smaller agencies to access additional resources without major capital expenditure. This gives smaller agencies access to services in a way that is more effective. Public bodies can buy services from the ICT Services Catalogue including services available in the GovDC Marketplace, or from GovDC.
The migration of government data through the NSW Government’s Data Centre Reform (DCR) Project is now in its fifth year.
The minimum contracted capacity has now been completed and additional capacity has also been brought online to accommodate agency needs. All Principal Departments now have services operating from GovDC.
The ICT Survey data shows that the proportion of storage and volume of storage moving to GovDC has been increasing.
Figure 32 – Storage (TBs) hosted commercially, in-house and in Government data centres
Source: NSW Government ICT Metrics Survey 2016–17

NSW Government ICT Metrics Report | 2016–17 46
5.Opportunities

NSW Government ICT Metrics Report | 2016–17 47
Strengthen risk management and response by building a
whole-of-government cyber security capability
Cyber security
As cloud, mobile and digital take-up rates increase across government and the community, the risk to their security is growing. This is driven by the increasing sophistication and number of cyber criminals and easy access to hacking tools. Prevention, detection and response are becoming more difficult and there is an opportunity to uplift cyber security capability across the NSW public sector. Cyber security is the defence of digital services, devices, networks and infrastructure from malicious attacks, unintentional damage or disruption, and the protection of information from loss, theft or malicious alteration.
As recognised by the NSW Digital Government Strategy (2017), effective cyber security, robust risk controls and strong information management are central to maintaining the confidence and trust of our customers. From individual transactions to critical information sharing across agencies, a strong framework for managing cyber risk is a pre-requisite for any modern digital government.
NSW is working with the Australian Government to further develop our cyber security capabilities through effective partnerships with the Australian Cyber Security Centre and other government agencies.
We also work with international and state-based partners, including the private sector, to promote and grow cyber security capabilities here in NSW, ensuring our customers and public sector employees are aware of the risks and can take action to minimise them.
Robust cyber security is essential for maintaining the wide array of services provided by the government, including those essential to community safety and well-being such as health, emergency services, energy, water or transport.
The Government announced a $2 million investment in the new NSW Cyber Security Network. It is a university-led network aimed at bolstering NSW’s cyber security research and development capability and harnessing the state’s growing cyber security industry.
Key findingsThe survey data shows that the number of FTEs in the ‘Security’ job category are increasing, suggesting a growing capability to support agency cyber security.

NSW Government ICT Metrics Report | 2016–17 48
Digital Government Strategy
The 2016 update of the NSW ICT Strategy, Digital+, was the last update of that strategy. The NSW Government has since pivoted to a renewed focus on Digital Government with the launch of the Digital Government Strategy in May 2017, setting a vision for a digital, responsive and agile public sector.
Three digital priorities guide the work of government agencies in digital transformation:
1. Customer experience: Improving people’s experience of government policies and services through customer-centred design.
2. Data: Better policy design and service delivery through data insights.
3. Digital on the inside: Improving the way government works by simplifying and streamlining operations and processes.
Digital NSW AcceleratorThe digital.nsw accelerator is all about delivering high-impact products to citizens as fast as possible.
Launching in early 2018, the accelerator will accelerate DFSI digital projects in phase one. Once tested and refined, the accelerator will take challenges and opportunities from across the NSW public sector.
With a focus on deeply understanding customer needs using a human centred design approach, the accelerator will see NSW government departments collaborate with citizens to co-design services and products that are smart, simple and seamless.
Customer experience
Technology Legislation Cyber security Delivery capability
Data Digital on the inside
Vis
ion
Pri
ori
ties
Ena
ble
rs
NSW Digital Government Strategy
Transform the lives of people in NSW through smart, simple, seamless policy design and services
Improve customer experience for governemnt services for
the better through customer-centred design
Improve collaboration across clusters to
drive whole of government value
Increase regulatory certainty and remove legislative barriers to digital government
Strengthen risk management and response
by buiding a whole-of-government capabiliy
Increase collaboration
and agility across government
Enable policy design and service delivery through
data insights
Improve the way government works by
simplifying and streamlining systems and processes

NSW Government ICT Metrics Report | 2016–17 49
‘One Government’
The `One Government’ approach to procurement is providing real benefits to taxpayers and is resulting in greater choice for agencies and more opportunities for NSW businesses.
By making it easier to do business with the NSW Government, we are making is easier for businesses of all sizes to work with the NSW Government.
In ICT, we are leveraging the buying power of `One Government’ to achieve better value for money in major vendor contract negotiations. As well, we are driving innovation and productivity by reviewing and refreshing current products and services.
For example, the ICT Procurement team within DFSI used the negotiation of multiple application software modules to achieve a stronger commercial and contractual position for government’s Government Selected Application Software products as well.
Changes to telecommunication procurement arrangements for fixed voice, mobile, fixed data and internet service towers will also drive better value for money by aggregating demand and streamlining the procurement process.

NSW Government ICT Metrics Report | 2016–17 50
6.Appendices

NSW Government ICT Metrics Report | 2016–17 51
Appendix A: List of 2016–17 ICT Survey respondents
Education• Board of Studies — Teaching
and Educational Standards Staff Agency
• Department of Education
Family and Community Services• Department of Family and
Community Services (cluster submission)
Finance, Services and Innovation• Land and Property Information
• SafeWork
• Service NSW
• State Insurance Regulatory Authority
• Revenue NSW
Health• Ambulance Service of NSW*
• Cancer Institute
• eHealth NSW
• Justice Health and Forensic Mental Health Network
• Local Health Districts
– Far West Local Health District & Western NSW
– Hunter New England
– Mid North Coast
– Northern NSW
– Northern Sydney & Central Coast
– South Eastern Sydney & Illawarra Shoalhaven
– Southern NSW
– Sydney & South Western Sydney
– Western Sydney & Nepean Blue Mountains
• NSW Ministry of Health
• Sydney Children’s Hospitals* Network
Industry, Skills and Regional Development• Department of Industry, Skills
and Regional Development
• TAFE NSW
– Hunter Institute
– Illawarra Institute
– New England Institute
– North Coast Institute
– Northern Sydney Institute
– Riverina Institute
– South Western Sydney Institute
– Sydney Institute
– Western Institute
– Western Sydney Institute
Justice• Department of Justice
• Fire and Rescue NSW
• Legal Aid Commission of NSW
• NSW Police Force
• Rural Fire Service of NSW
• State Emergency Service
• State Library of NSW
• Sydney Opera House Trust
Planning and Environment• Office of Environment and
Heritage
• Department of Planning and Environment
Premier and Cabinet• Audit Office of NSW
• Department of Premier and Cabinet
• New South Wales Electoral Commission
Transport and Infrastructure• NSW Trains
• Roads and Maritime Services
• State Transit Authority
• Sydney Trains
• Transport for NSW
Treasury• NSW Treasury Corporation*
• The Treasury
* Estimation of non-reporting agencies is quantified by applying a CPI indexation of data from relevant years as reported in the ICT Survey.

NSW Government ICT Metrics Report | 2016–17 52
Appendix B: Service tower definitions
ICT corporate functions (previously ICT Management) includes services, equipment, activities, personnel, functions and responsibilities providing cross-service tower governance, controlling, security, architecture, finance and human resources services to the ICT organisation.
Applications — all hardware, software, personnel (including the supporting documentation, media, on-line help facilities and tutorials) and outsourced services that perform user or business related information processing functions. Application Software does not include the tools, utilities, or system software used to deliver it.
Application sub-service towers:Application — Corporate — Enterprise Resource Planning; Human Resource Management; Workforce Capability Management; Business Continuity; Corporate Governance and Strategy; Corporate Administration; Procurement; Business Transformation and Improvement; Business Intelligence and Analytics; Enterprise Content Management; Business Process Management; Unified Communications.
Applications — Common Line of Business — Product and Service Management; Marketing; Customer Relationship Management; Partner Relationship Management; Customer Accounting; Customer Service; Emergency Management and Grants Management.
Applications — Specialist Line of Business — Common Agency Functions and Agency Specific Applications.
Applications — Other — Data and Information Management Services; Identity and Access Management Services; Security Services; ICT Services Components and Tools; Interfaces and Integration, which are not appropriately repeated under another Service Tower.
Servers include all server types. In previous years, mainframe and midrange data was de-coupled and collected separately. Services, hardware, software, functions, personnel, activities and responsibilities involved in running server applications and with typically high I/O processing capacity, which are housed centrally in data centres or server rooms.
Storage includes cost elements, activities and responsibilities involved in providing data storage services to the business. It includes Network attached storage, storage area networks, offsite storage device and backups and external fixed attached storage on mainframe and midrange servers.
End user infrastructure includes cost elements, activities and responsibilities provided directly to end-users in an agency. Hardware includes desktop and laptop computers, thin clients etc. but excludes fixed and mobile phone, and devices with combined voice and data functions which are captured in Voice services. The category includes all processes, procedures, tools and resources necessary to support the complete lifecycle of desktop technologies and the end user computing environment.
ICT service desk (previously Helpdesk) includes buildings, infrastructure, associated technologies and fully trained staff who respond to Level 1 ICT Service Desk incidents or requests (as defined below) from end users, coordinate incident management, problem management and request management activities, and act as a single point of contact for agency end-users in regard to all service towers.
Facilities include physical facilities, including raised floor space, power supply, air conditioning, and associated utilities, as well as security and facilities monitoring and maintenance services, personnel, activities, hardware and software. Facilities are data centres which include all physical sites and infrastructure used to house computer systems (e.g. servers) and associated components, such as telecommunications and storage systems.
Networks are cost elements, activities and responsibilities associated with Wide Area Network (WAN), Local Area Network (LAN), Remote Access Services (RAS), and Gateway. In previous years, WAN, LAN, RAS and Gateway networks data were collected separately, however, it has been bundled for this survey.
Voice services are all carrier and telecommunications services and cost elements involved in providing voice services and non-IP video conferencing services to the business, including VoIP services. The category also includes equipment and associated attachments, features, accessories, peripherals and cabling supported or used to provide standard voice services to the business.

NSW Government ICT Metrics Report | 2016–17 53
Appendix C: Cost Element Definitions
Cost elements are a resource based expenditure classification of seven elements. Cost elements build each of the nine service towers. Elements include:
Internal personnel — This element includes expenditure incurred for all internal full-time equivalents (FTE), i.e. employees of the agency, involved in ICT business as usual activities, includes all wages and salaries, provisions for staff entitlements and staff on-costs. See Australian and New Zealand Standard Classification of Occupations for ICT occupations.
External personnel — For all external FTEs involved in ICT activities, include all payments and allowances made to external FTE. This includes all relevant on costs that apply to contractors and consultants. See Australian and New Zealand Standard Classification of Occupations for ICT occupations.
Other expenditure — Expenditure on occupancy, facilities, utilities and other ICT expenditure not captured in hardware expenditure, software expenditure, internal personnel expenditure, external personnel expenditure, expenditure on services outsourced as-a-service, managed service or to NSW Government Shared Service Providers, and carriage expenditure (in WAN and Voice service towers only).
Hardware — Expenditure on purchasing, leases, maintenance and repair for all physical ICT equipment, such as servers, PCs, terminals, printers, peripherals, printing equipment, networking and telecommunications equipment, materials or accessories and disaster recovery hardware.
Software — Expenditure on licenses, support and maintenance for external and standard software, systems software and standard office productivity applications at a total agency level.
Carriage — A specific cost element in the Network and Voice service towers. Carriage refers to the costs of providing digital or analogue electronic signals (including data, voice or video) over a distance. Data carriage costs and volumes should be allocated to the Network Service Tower. Voice and video carriage costs and volumes should be allocated to the Voice service tower.
Services outsourced to external provider — includes services outsourced as-a-service and managed services. Includes full function outsourcing (e.g. data centre operations, WAN operations, end user infrastructure services or application maintenance) to a third-party provider or vendor in the market.

NSW Government ICT Metrics Report | 2016–17 54
Appendix D: Run, Grow, Transform the business
Source: NSW Government ICT Survey (2016-17) — Taxonomy
Run the businessThis is an indicator of how much of the IT resource is consumed and focused on the continuing operation of the business. It includes all nondiscretionary expenses as part of the run-the-business cost.
Grow the businessThis is an indicator of how much of the IT resource is consumed and focused on developing and enhancing IT systems in support of business growth (typically organic growth). Discretionary investments are more likely to be included in the grow-the-business or transform-the-business cost.
Transform the businessThis is an indicator of how much of the IT resource is consumed and focused on implementing technology systems that enable the enterprise to enact new business models. This is very much a “venture” category and would be represented by activities such as a brick-and-mortar retailer moving to online shopping, a traditional bank offering online banking (or moving into offering insurance services), or a commercial airline offering new freight services. Gaps in business alignment can be found by examining IT spending as it relates to the day-to-day operations of a business (run), the organic growth of the business or productivity improvement (grow) and its support of major business transformation, new products, services or business models (transform).

NSW Government ICT Metrics Report | 2016–17 55
Appendix E: Glossary
Short form Long form
ADS Accelerated Delivery Strategy
BYO Bring Your Own
Capex Capital Expenditure
CIO Chief Information Officer
COBIT Control Objectives for Information and Related Technologies
CPI Consumer Price Index
CSS Corporate and Shared Services
DAC Data Analytics Centre
Data.NSW http://data.nsw.gov.au
DCR Data Centre Reform
DFSI Department of Finance, Services and Innovation
EA Enterprise Architecture
EAM Enterprise Asset Management
ERC Expenditure Review Committee
ERP Enterprise resource planning
FACS Family and Community Services
FMT Financial Ma nagement Transformation
FTE Full Time Equivalent
GEA Government Enterprise Architecture
GIPAA Government Information (Public Access) Act 2009
GovDC NSW Government Data Centre
HealthStats www.healthstats.nsw.gov.au
HRM Human resource management
IAF ICT Assurance Framework
ICT Information and Communication Technology
IDG ICT and Digital Government
IDLG ICT and Digital Leadership Group
IDIP ICT and Digital Investment Plan
IT Information Technology
ITIL Information Technology Infrastructure Library
ITSM Information Technology Service Management
MP Member of Parliament
NGIS Next Generation Infrastructure Systems
OpenGov www.opengov.nsw.gov.au/
Opex Operations Expenditure
PC Personal Computer
RCG Responsible Conduct of Gaming
RFF Recreational Fishing Fee
RMS Roads and Maritime Services
RSA Responsible Service of Alcohol
VoIP Voice over Internet Protocol
WCAG Web Content Accessibility Guidelines
WoG Whole of Government
