icici prayga
DESCRIPTION
cdcTRANSCRIPT
Chapter 1
INTRODUCTION
This chapter includes Banking present scenario in India, current Banking period. This also include
Introduction to ICICI Banking.
1.1 Introduction to Banking in India.
1.2 Current Banking Period.
1.3 Growth of Banking sector.
1.4 Introduction to ICICI Bank.
1.5 ICICI Group Companies
1.6 Products
1.7 Objectives of the study
1.8 Significance of the study
1.1 Introduction to Banking in India.
Banking in India in the modern sense originated in the last decades of the 18th century.
The among the first banks were Bank of Hindustan, which established in 1770 and liquidated in 1829-32;
and General Bank of India, established 1786 but failed in 1791.
The largest bank, and the oldest still in existence, is the State Bank of India. It originated as
the Bank of Calcutta in June 1806. In 1809, it was renamed as the Bank of Bengal. This was one of the
three banks funded by a presidency government, the other two were the Bank of Bombay and the Bank of
Madras. The three banks were merged in 1921 to form the Imperial Bank of India, which upon India's
independence, became the State Bank of India in 1955. For many years the presidency banks had acted as
quasi-central banks, as did their successors, until the Reserve Bank of India was established in 1935,
under the Reserve Bank of India Act, 1934.
In 1960, the State Banks of India was given control of eight state-associated banks under the
State Bank of India (Subsidiary Banks) Act, 1959. These are now called its associate banks. In 1969 the
Indian government nationalised 14 major private banks. In 1980, 6 more private banks were nationalised.
These nationalised banks are the majority of lenders in the Indian economy. They dominate the banking
sector because of their large size and widespread networks.
1
The Indian banking sector is broadly classified into scheduled banks and non-scheduled
banks. The scheduled banks are those which are included under the 2nd Schedule of the Reserve Bank of
India Act, 1934. The scheduled banks are further classified into: nationalised banks; State Bank of India
and its associates; Regional Rural Banks (RRBs); foreign banks; and other Indian private sector banks.
The term commercial banks refers to both scheduled and non-scheduled commercial banks which are
regulated under the Banking Regulation Act, 1949.
Generally banking in India was fairly mature in terms of supply, product range and reach-
even though reach in rural India and to the poor still remains a challenge. The government has developed
initiatives to address this through the State Bank of India expanding its branch network and through the
National Bank for Agriculture and Rural Development with things like microfinance
1.2 Current period
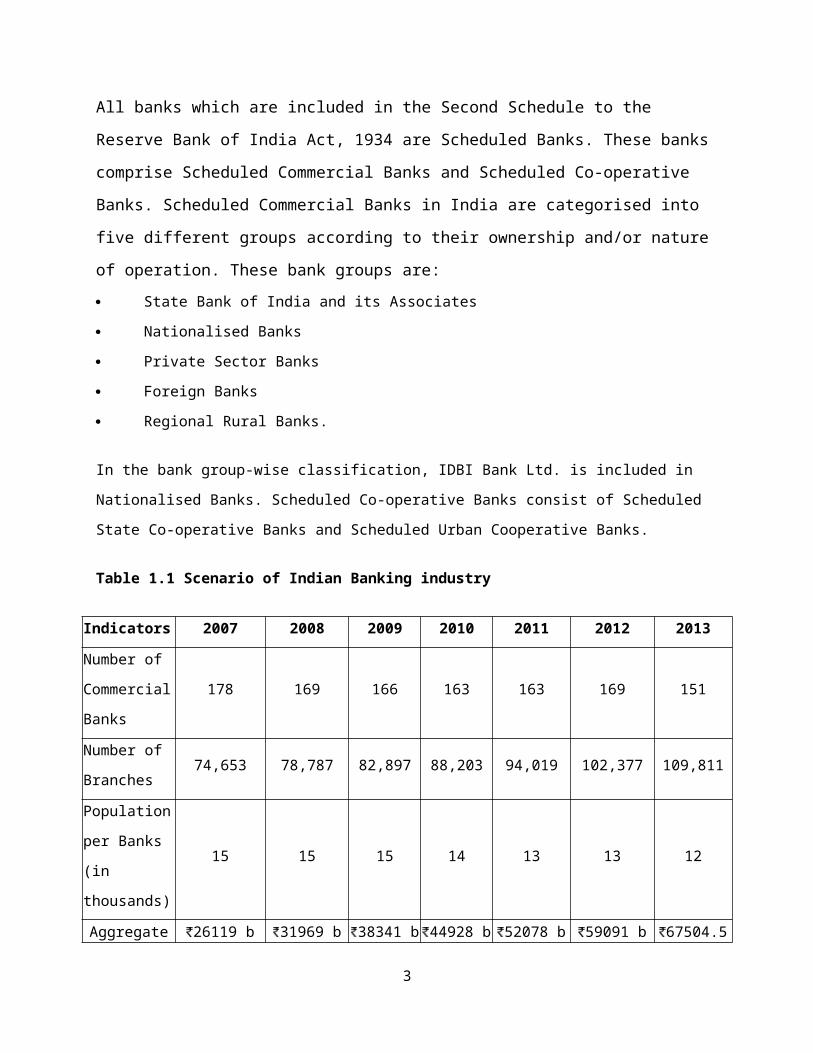
All banks which are included in the Second Schedule to the Reserve Bank of India Act, 1934 are
Scheduled Banks. These banks comprise Scheduled Commercial Banks and Scheduled Co-
operative Banks. Scheduled Commercial Banks in India are categorised into five different groups
according to their ownership and/or nature of operation. These bank groups are:
State Bank of India and its Associates
Nationalised Banks
Private Sector Banks
Foreign Banks
Regional Rural Banks.
In the bank group-wise classification, IDBI Bank Ltd. is included in Nationalised Banks. Scheduled Co-
operative Banks consist of Scheduled State Co-operative Banks and Scheduled Urban Cooperative Banks.
Table 1.1 Scenario of Indian Banking industry
Indicators 2007 2008 2009 2010 2011 2012 2013
Number of
Commercial
Banks
178 169 166 163 163 169 151
Number of
Branches74,653 78,787 82,897 88,203 94,019 102,377 109,811
Population per 15 15 15 14 13 13 12
2
Indicators 2007 2008 2009 2010 2011 2012 2013
Banks (in
thousands)
Aggregate
Deposits
26119 b
(US$410 b)
31969 b
(US$500 b)
38341 b
(US$600 b)
44928 b
(US$710 b)
52078 b
(US$820 b)
59091 b
(US$930 b)
67504.54 b
(US$1.1 trill
ion)
Bank Credit19312 b
(US$300 b)
23619 b
(US$370 b)
27755 b
(US$440 b)
32448 b
(US$510 b)
39421 b
(US$620 b)
46119 b
(US$720 b)
52605 b
(US$830 b)
Deposit as
percentage to
GNP (at factor
cost)
69% 73% 77% 78% 78% 78% 79%
Per Capita
Deposit
23382
(US$370)
28610
(US$450)
33919
(US$530)
39107
(US$610)
45505
(US$710)
50183
(US$790)
56380
(US$890)
Per Capita
Credit
17541
(US$280)
21218
(US$330)
24617
(US$390)
28431
(US$450)
34187
(US$540)
38874
(US$610)
44028
(US$690)
Credit Deposit
Ratio74% 75% 74% 74% 76% 79% 79%
1.3 Growth of Banking sector.
By 2010, banking in India was generally fairly mature in terms of supply, product range
and reach-even though reach in rural India still remains a challenge for the private sector and foreign
banks. In terms of quality of assets and capital adequacy, Indian banks are considered to have clean,
strong and transparent balance sheets relative to other banks in comparable economies in its region. The
Reserve Bank of India is an autonomous body, with minimal pressure from the government.
With the growth in the Indian economy expected to be strong for quite some time-especially
in its services sector-the demand for banking services, especially retail banking, mortgages and
investment services are expected to be strong. One may also expect M&As, takeovers, and asset sales.
In March 2006, the Reserve Bank of India allowed Warburg Pincus to increase its stake in
Kotak Mahindra Bank (a private sector bank) to 10%. This is the first time an investor has been allowed
to hold more than 5% in a private sector bank since the RBI announced norms in 2005 that any stake
exceeding 5% in the private sector banks would need to be vetted by them.
3

In recent years critics have charged that the non-government owned banks are too
aggressive in their loan recovery efforts in connection with housing, vehicle and personal loans. There are
press reports that the banks' loan recovery efforts have driven defaulting borrowers to suicide.
By 2013 the Indian Banking Industry employed 1,175,149 employees and had a total of
109,811 branches in India and 171 branches abroad and manages an aggregate deposit of 67504.54 b
(US$1.1 trillion or €840 b) and bank credit of 52604.59 b (US$830 b or €650 b). The net profit of the
banks operating in India was 1027.51 b (US$16 b or €13 b) against a turnover of 9148.59 b (US$140 b
or €110 b) for the financial year 2012-13.
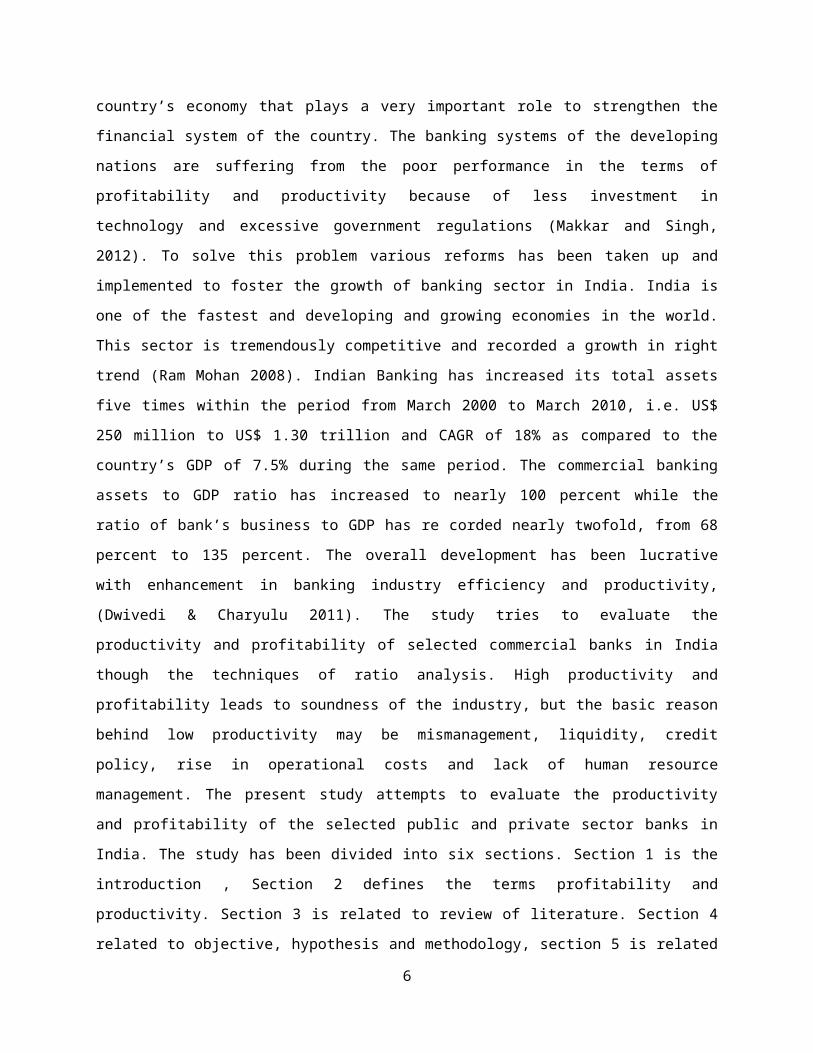
Indian banking industry is the backbone of country’s economy that plays a very important
role to strengthen the financial system of the country. The banking systems of the developing nations are
suffering from the poor performance in the terms of profitability and productivity because of less
investment in technology and excessive government regulations (Makkar and Singh, 2012). To solve this
problem various reforms has been taken up and implemented to foster the growth of banking sector in
India. India is one of the fastest and developing and growing economies in the world. This sector is
tremendously competitive and recorded a growth in right trend (Ram Mohan 2008). Indian Banking has
increased its total assets five times within the period from March 2000 to March 2010, i.e. US$ 250
million to US$ 1.30 trillion and CAGR of 18% as compared to the country’s GDP of 7.5% during the
same period. The commercial banking assets to GDP ratio has increased to nearly 100 percent while the
ratio of bank’s business to GDP has re corded nearly twofold, from 68 percent to 135 percent. The overall
development has been lucrative with enhancement in banking industry efficiency and productivity,
(Dwivedi & Charyulu 2011). The study tries to evaluate the productivity and profitability of selected
commercial banks in India though the techniques of ratio analysis. High productivity and profitability
leads to soundness of the industry, but the basic reason behind low productivity may be mismanagement,
liquidity, credit policy, rise in operational costs and lack of human resource management. The present
study attempts to evaluate the productivity and profitability of the selected public and private sector banks
in India. The study has been divided into six sections. Section 1 is the introduction , Section 2 defines the
terms profitability and productivity. Section 3 is related to review of literature. Section 4 related to
objective, hypothesis and methodology, section 5 is related to result analysis and the last section discuss
the conclusion and recommendations.
1.4 Introduction to ICICI Bank.
ICICI Bank (Industrial Credit and Investment Corporation of India) is an Indian
multinational banking and financial services company headquartered in Vadodara, Gujarat, India. As of
2014 it is the second largest bank in India in terms of assets and market capitalization. It offers a wide
4

range of banking products and financial services for corporate and retail customers through a variety of
delivery channels and specialized subsidiaries in the areas of investment banking, life, non-life insurance,
venture capital and asset management. The Bank has a network of 4,050 branches and 12,26 ATMs in
India, and has a presence in 19 countries.
ICICI Bank is one of the Big Four banks of India, along with State Bank of India, Punjab
National Bank and Bank of Baroda. The bank has subsidiaries in the United Kingdom, Russia, and
Canada; branches in United States, Singapore, Bahrain, Hong Kong, Sri Lanka, Qatar and Dubai
International Finance Centre; and representative offices in United Arab Emirates, China, South Africa,
Bangladesh, Thailand, Malaysia and Indonesia. The company's UK subsidiary has also established
branches in Belgium and Germany.
In March 2013, Operation Red Spider showed high-ranking officials and some employees
of ICICI Bank involved in money laundering. After a government inquiry, ICICI Bank suspended 18
employees and faced penalties from the Reserve Bank of India in relation to the activity.
ICICI Bank was originally promoted in 1994 by ICICI Limited, an Indian financial institution, and was its
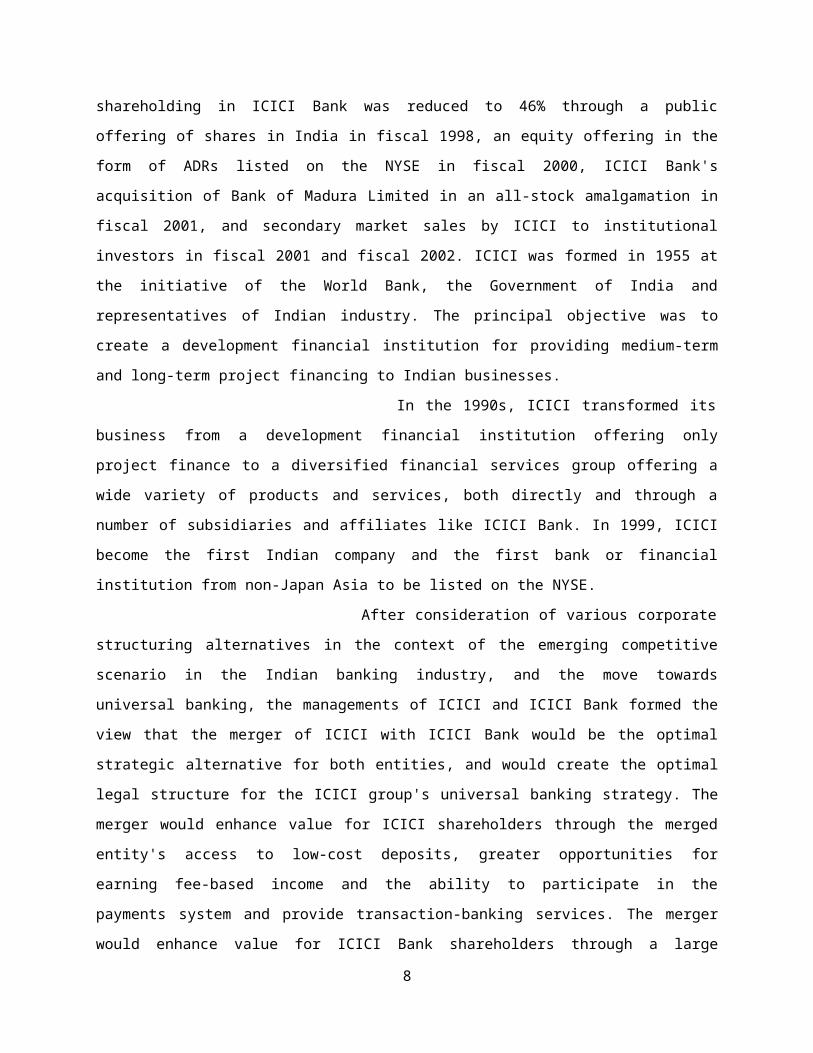
wholly-owned subsidiary. ICICI's shareholding in ICICI Bank was reduced to 46% through a public
offering of shares in India in fiscal 1998, an equity offering in the form of ADRs listed on the NYSE in
fiscal 2000, ICICI Bank's acquisition of Bank of Madura Limited in an all-stock amalgamation in fiscal
2001, and secondary market sales by ICICI to institutional investors in fiscal 2001 and fiscal 2002. ICICI
was formed in 1955 at the initiative of the World Bank, the Government of India and representatives of
Indian industry. The principal objective was to create a development financial institution for providing
medium-term and long-term project financing to Indian businesses.
In the 1990s, ICICI transformed its business from a development financial institution
offering only project finance to a diversified financial services group offering a wide variety of products
and services, both directly and through a number of subsidiaries and affiliates like ICICI Bank. In 1999,
ICICI become the first Indian company and the first bank or financial institution from non-Japan Asia to
be listed on the NYSE.
After consideration of various corporate structuring alternatives in the context of the
emerging competitive scenario in the Indian banking industry, and the move towards universal banking,
the managements of ICICI and ICICI Bank formed the view that the merger of ICICI with ICICI Bank
would be the optimal strategic alternative for both entities, and would create the optimal legal structure
for the ICICI group's universal banking strategy. The merger would enhance value for ICICI shareholders
through the merged entity's access to low-cost deposits, greater opportunities for earning fee-based
income and the ability to participate in the payments system and provide transaction-banking services.
The merger would enhance value for ICICI Bank shareholders through a large capital base and scale of
5
operations, seamless access to ICICI's strong corporate relationships built up over five decades, entry into
new business segments, higher market share in various business segments, particularly fee-based services,
and access to the vast talent pool of ICICI and its subsidiaries.
In October 2001, the Boards of Directors of ICICI and ICICI Bank approved the merger
of ICICI and two of its wholly-owned retail finance subsidiaries, ICICI Personal Financial Services
Limited and ICICI Capital Services Limited, with ICICI Bank. The merger was approved by shareholders
of ICICI and ICICI Bank in January 2002, by the High Court of Gujarat at Ahmedabad in March 2002,
and by the High Court of Judicature at Mumbai and the Reserve Bank of India in April 2002. Consequent
to the merger, the ICICI group's financing and banking operations, both wholesale and retail, have been
integrated in a single entity.
ICICI Bank has formulated a Code of Business Conduct and Ethics for its directors and
employees.
1.5 ICICI Group Companies
ICICI Group
ICICI Prudential Life Insurance Company
ICICI Securities
ICICI Lombard General Insurance Company
ICICI Prudential AMC & Trust
ICICI Venture
ICICI Direct
ICICI Foundation
Disha Financial Counselling
ICICI Bank also has banking subsidiaries in UK and Canada
1.6 Products
Pockets by ICICI Bank
In February 2015, ICICI Bank Re-Launched POCKETS. Now working as a "Digital
wallet" for everyone(Now only works with android Phones ).Wallet be can be opened by anyone and can
do transactions like recharge,shopping,transfer money using the virtual visa card, Which is issued when
signing up for the wallet.
In September 2013, ICICI Bank launched a one of its kind app on Facebook 'Pockets
by ICICI Bank' to enable customers to carry out a wide range of financial transactions on Facebook
Customers can access the ICICI Bank app by logging into their Facebook account and then going to the
6

official ICICI Bank Facebook page, and clicking on the tab for Pockets by ICICI Bank. The customer
then registers online with their debit card number and PIN, and selecting a new four digit PIN for
subsequent logins Through the app, customers can make payments to friends, recharge prepaid mobile
and book movie tickets.
One can also carry out non-financial transactions such as accessing a mini statement of
their savings bank account, getting demat holding statements, opening fixed or recurring deposit, order a
cheque book, stop a cheque payment, upgrade debit card, among others.
Some of the key features of 'Pockets by ICICI Bank' are:
Split n share: It allows customers to split and track group expenses and share them with friends
on Facebook. The app also gives the customer the option of sending messages to remind friends on
pending payments.
Pay a friend: It allows customers to transfer funds to their friends without knowing their bank
account details like account number, bank branch, branch IFSC code etc. Through this facility, customers
can create electronic coupons that can be redeemed by their friends on the bank website icicibank.com
MySavings Rewards
ICICI Bank has rolled-out the programme 'MySavings Rewards' from 1 September
2012, where reward points are offered to individual domestic customers for a variety of transactions done
through the savings bank account. Reward points are offered automatically to customers for activating
Internet banking, shopping online/ paying utility bills with Internet banking and auto-debit from savings
account towards equated monthly installments for home/ auto/ personal loan/ recurring deposit.
Customers are required to maintain a monthly average balance of 15,000 or more. th Indian bank will
recuire 5.5% interest on short term loans and long term bonds and mortgages loans up to $2 million up to
20years to pay back annuall interest of 5.5% short term loans from 3 months up to 3years at 5.5% .credit
interest is reduced to 10% annully .
iWish- the flexible recurring deposit
iWish is a flexible recurring deposit product launched by ICICI Bank for its savings
account customers. Unlike a traditional recurring deposit, iWish allows customers to save varying
7
amounts of money at any time of their choice. Customers can create several goals and track their progress
on an online interface.
1.7 OBJECTIVES OF THE STUDY:
1) To study components of productivity and profitability .
2) To identify factors affecting productivity, profitability and their interaction.
1.8 Significance of the study:
This study covers the measurement and interpretation of profitability and productivity of
ICICI Bank . Productivity and Profitability determines the future path of any concern .This study also
helps in evaluating the performance of ICICI Bank and their staff .Few published materials are available
relating to profitability and productivity in banks. But this study can be useful to academicians in
teachings and research as well as management to making efforts to improve their critical areas of
operations.
Chapter 2
REVIEW OF LITERATURE
8
Banks play a significant role in financing the economic needs of the country. To
compete effectively in present day competitive world, banks have been permitted to undertake new
activities such as investment banking, securities trading, insurance business, etc. The number of market
players has increased as their entry barriers have erased. The researchers and economists have recognized
that the measurement of productivity and profitability in banking is necessary to improve the financial
soundness of banks. A large number of studies have been conducted in the field of operational and
financial performance of banks. A brief review of some of these studies has been presented in this
chapter.
Angadi and Devraj (1983) measured productivity of Indian banks for the period 1970-
80. They took total working funds (deposits and credits) as output indicator while establishment expenses
as input indicator. They calculated return per rupee of establishment expenses. The results indicated that
the productivity of the banking system as a whole witnessed a considerable decline during the years 1970-
75. Between the years 1975 and 1978, the productivity improved but again in the year 1979 it declined.
Among the bank-groups, the productivity of public sector banks, which declined to 45.5 per cent in 1975
from 53.3 per cent in 1970 improved in 1977. However, it showed a sharp decline in 1980. The
productivity of private sector banks, which had been mostly lower than that of other bank-groups, showed
an improvement in 1979. In the case of foreign banks, the productivity was always higher than other
bank-groups. They concluded that the rapid expansion in rural and semi-urban commercial banks in the
initial period of nationalization, without corresponding growth in business of these offices, contributed to
the deceleration in productivity of these banks.
Arora and Verma (2005) studied the banking sector reforms in India and evaluated the
performance of public sector banks during the reforms period. The data of 27 public sector banks, i.e., 19
nationalized banks, and State Bank of India and its seven associates for the year 1992 has been taken.
Banking sector reforms were studied in relation to Prudential Norms,Capital Adequacy Measures,
Structural Regulation, Deregulations of interest rates, accounting and disclosure norms, HRD initiatives,
asset liability management system and risk management guidelines. Performance of public sector banks
has been evaluated on the basis of Financial Parameters, Operational Parameters, Profitability
Parameters and Productivity Parameters. The authors concluded that in order to remove subjectivity in
banking sector, major steps like Prudential Norms, Income Recognition Provisioning should have been
taken. The researchers suggested that to correct the impact of directed investments on profitability reserve
requirements should be reduced.
Bodla and Verma (2006) in their paper, evaluated and compared the performance of
two banks in India, one from the public sector, i.e., State Bank of India and the other from the private
sector, i.e., ICICI Bank. The analysis was done on the basis of CAMEL Model. The study covered the
9

time period from 2000-01 to 2004-05. The results showed that both the banks have maintained higher
level of capital adequacy ratios than the level prescribed by Reserve Bank of India. Assets quality ratios
of both the banks have been improved. State Bank of India has an edge over ICICI Bank in terms of
liquidity ratios and ICICI Bank has outperformed SBI Bank in terms of ratios of operating profit to
average working funds and net profits to average assets. On the whole, ICICI Bank has performed better
than SBI Bank.
Chawla (1988) analyzed the development and growth of banking activities after
nationalization especially in the Punjab state during the period 1969-83. The study found that
nationalization of major commercial banks in 1969 made a highly positive impact on deposit
mobilization, credit deployment and branch expansion in the state. Although inter-district disparities
continue to exist, yet a trend was noticed for reduction in these disparities. The performance of banks in
relation to schemes and programmes initiated for upliftment of weaker sections after nationalization both
in quantitative as well as qualitative terms was found to be unsatisfactory. The researcher observed that
within priority sector the relatively well-off have got the maximum benefits, whereas the poor have
remained credit starved.
Chandan and Rajput (2002) evaluated the performance of banks on the basis of
profitability analysis. The researchers analyzed the factors determining the profitability of banks in India
with the help of multiple regression technique. They found that spread, i.e., net interest income is the
major source of income for banks. The study found public sector banks at weaker position in relation to
foreign banks and private sector banks. The authors suggested that public sector banks should concentrate
on non- performing asset management and also make investment in technology upgradation for better
data management and quicker flow of information.
Joshi (2013) carried away the comparison of selected public sector banks on their 55
profitability ratios which includes SBI, PNB, Canara Bank, Bank of Baroda and Bank of India. The study
concluded that Net operating profit ratio and PBT to net worth ratio is not similar while, Net profit margin
ratio, PAT to net income and PAT to net worth is similar for the selected banks in India .
Kaushik (1995) studied the social objectives and profitability of public and private
sector banks during the period 1973 to 1991. He compared the public and private banks with the help of
various profitability and productivity indicators through ratios, average, correlation, regression and factor
analysis. He found that public sector banks were having lower profitability as compared to private sector
banks. Further, he found that the various productivity indicators showed an increasing trend during the
period of study for all the banks though the increase was much higher in the case of private sector banks.
He concluded that the profitability of public sector banks showed a declining trend due to social
objectives not because of cost inefficiency and low productivity. He suggested that productivity could be
10
increased with the help of innovative banking, improved technological and managerial knowledge, well
educated and trained manpower and infrastructural facilities.
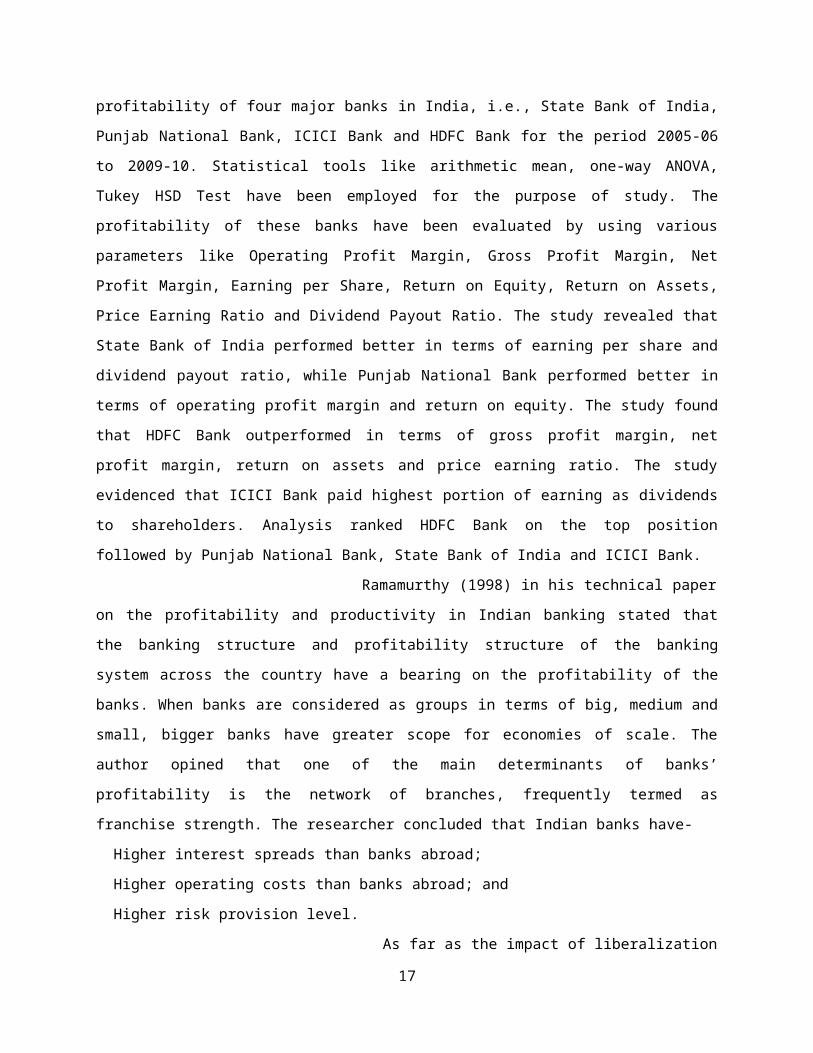
Prasad and Ravinder (2011) analyzed the profitability of four major banks in India, i.e.,
State Bank of India, Punjab National Bank, ICICI Bank and HDFC Bank for the period 2005-06 to 2009-
10. Statistical tools like arithmetic mean, one-way ANOVA, Tukey HSD Test have been employed for
the purpose of study. The profitability of these banks have been evaluated by using various parameters
like Operating Profit Margin, Gross Profit Margin, Net Profit Margin, Earning per Share, Return on
Equity, Return on Assets, Price Earning Ratio and Dividend Payout Ratio. The study revealed that State
Bank of India performed better in terms of earning per share and dividend payout ratio, while Punjab
National Bank performed better in terms of operating profit margin and return on equity. The study found
that HDFC Bank outperformed in terms of gross profit margin, net profit margin, return on assets and
price earning ratio. The study evidenced that ICICI Bank paid highest portion of earning as dividends to
shareholders. Analysis ranked HDFC Bank on the top position followed by Punjab National Bank, State
Bank of India and ICICI Bank.
Ramamurthy (1998) in his technical paper on the profitability and productivity in Indian
banking stated that the banking structure and profitability structure of the banking system across the
country have a bearing on the profitability of the banks. When banks are considered as groups in terms of
big, medium and small, bigger banks have greater scope for economies of scale. The author opined that
one of the main determinants of banks’ profitability is the network of branches, frequently termed as
franchise strength. The researcher concluded that Indian banks have-
Higher interest spreads than banks abroad;
Higher operating costs than banks abroad; and
Higher risk provision level.
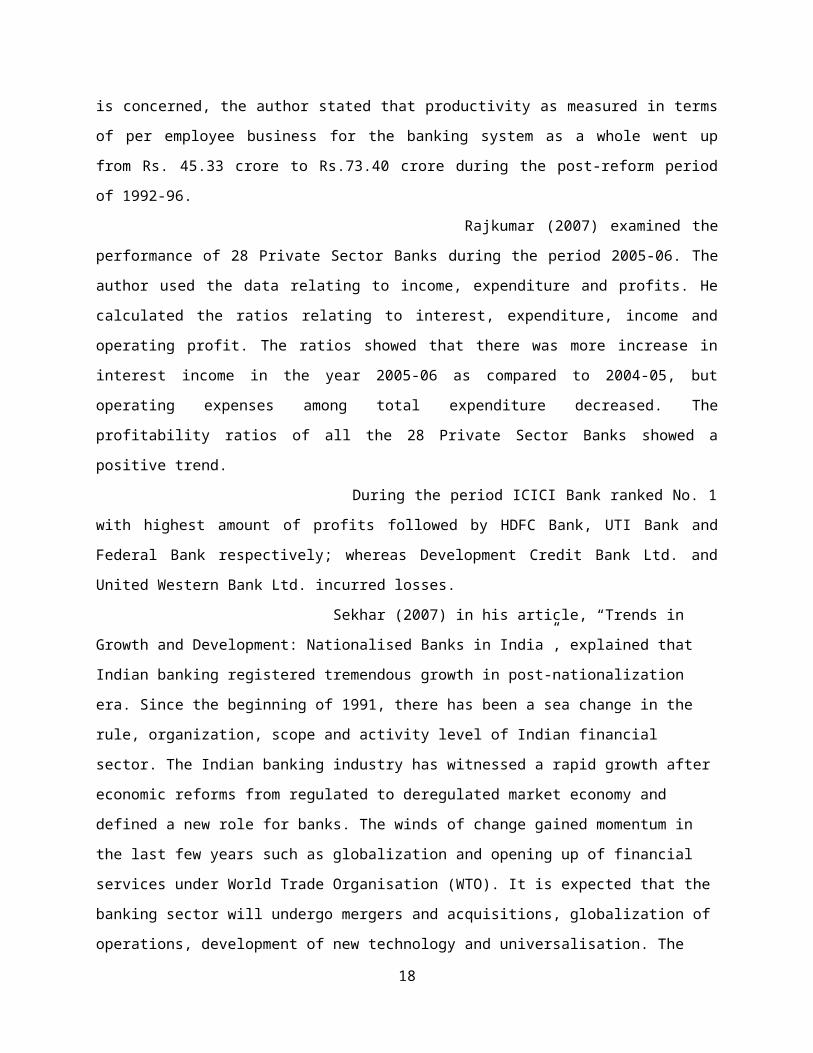
As far as the impact of liberalization is concerned, the author stated that productivity
as measured in terms of per employee business for the banking system as a whole went up from Rs. 45.33
crore to Rs.73.40 crore during the post-reform period of 1992-96.
Rajkumar (2007) examined the performance of 28 Private Sector Banks during the
period 2005-06. The author used the data relating to income, expenditure and profits. He calculated the
ratios relating to interest, expenditure, income and operating profit. The ratios showed that there was
more increase in interest income in the year 2005-06 as compared to 2004-05, but operating expenses
among total expenditure decreased. The profitability ratios of all the 28 Private Sector Banks showed a
positive trend.
During the period ICICI Bank ranked No. 1 with highest amount of profits followed by
HDFC Bank, UTI Bank and Federal Bank respectively; whereas Development Credit Bank Ltd. and
11
United Western Bank Ltd. incurred losses.
Sekhar (2007) in his article, “Trends in Growth and Development: Nationalised Banks in
India”, explained that Indian banking registered tremendous growth in post-nationalization era. Since the
beginning of 1991, there has been a sea change in the rule, organization, scope and activity level of Indian
financial sector. The Indian banking industry has witnessed a rapid growth after economic reforms from
regulated to deregulated market economy and defined a new role for banks. The winds of change gained
momentum in the last few years such as globalization and opening up of financial services under World
Trade Organisation (WTO). It is expected that the banking sector will undergo mergers and acquisitions,
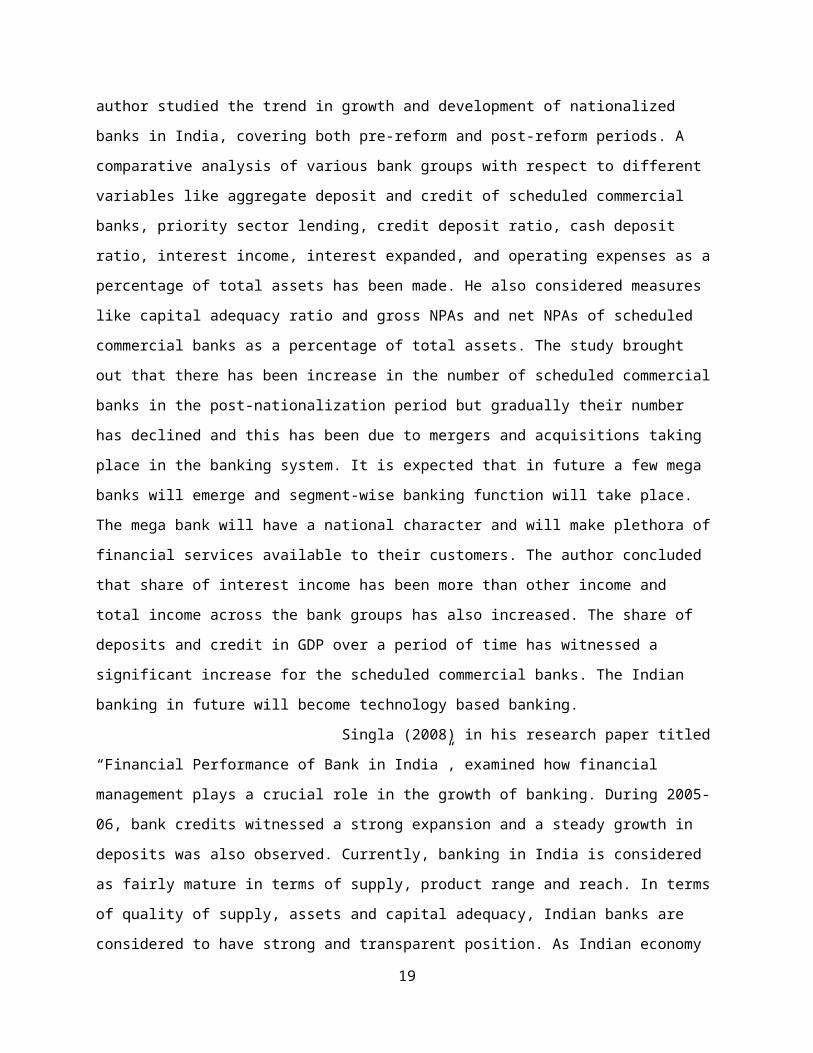
globalization of operations, development of new technology and universalisation. The author studied the
trend in growth and development of nationalized banks in India, covering both pre-reform and post-
reform periods. A comparative analysis of various bank groups with respect to different variables like
aggregate deposit and credit of scheduled commercial banks, priority sector lending, credit deposit ratio,
cash deposit ratio, interest income, interest expanded, and operating expenses as a percentage of total
assets has been made. He also considered measures like capital adequacy ratio and gross NPAs and net
NPAs of scheduled commercial banks as a percentage of total assets. The study brought out that there has
been increase in the number of scheduled commercial banks in the post-nationalization period but
gradually their number has declined and this has been due to mergers and acquisitions taking place in the
banking system. It is expected that in future a few mega banks will emerge and segment-wise banking
function will take place. The mega bank will have a national character and will make plethora of financial
services available to their customers. The author concluded that share of interest income has been more
than other income and total income across the bank groups has also increased. The share of deposits and
credit in GDP over a period of time has witnessed a significant increase for the scheduled commercial
banks. The Indian banking in future will become technology based banking.
Singla (2008) in his research paper titled “Financial Performance of Bank in India”,
examined how financial management plays a crucial role in the growth of banking. During 2005-06, bank
credits witnessed a strong expansion and a steady growth in deposits was also observed. Currently,
banking in India is considered as fairly mature in terms of supply, product range and reach. In terms of
quality of supply, assets and capital adequacy, Indian banks are considered to have strong and transparent
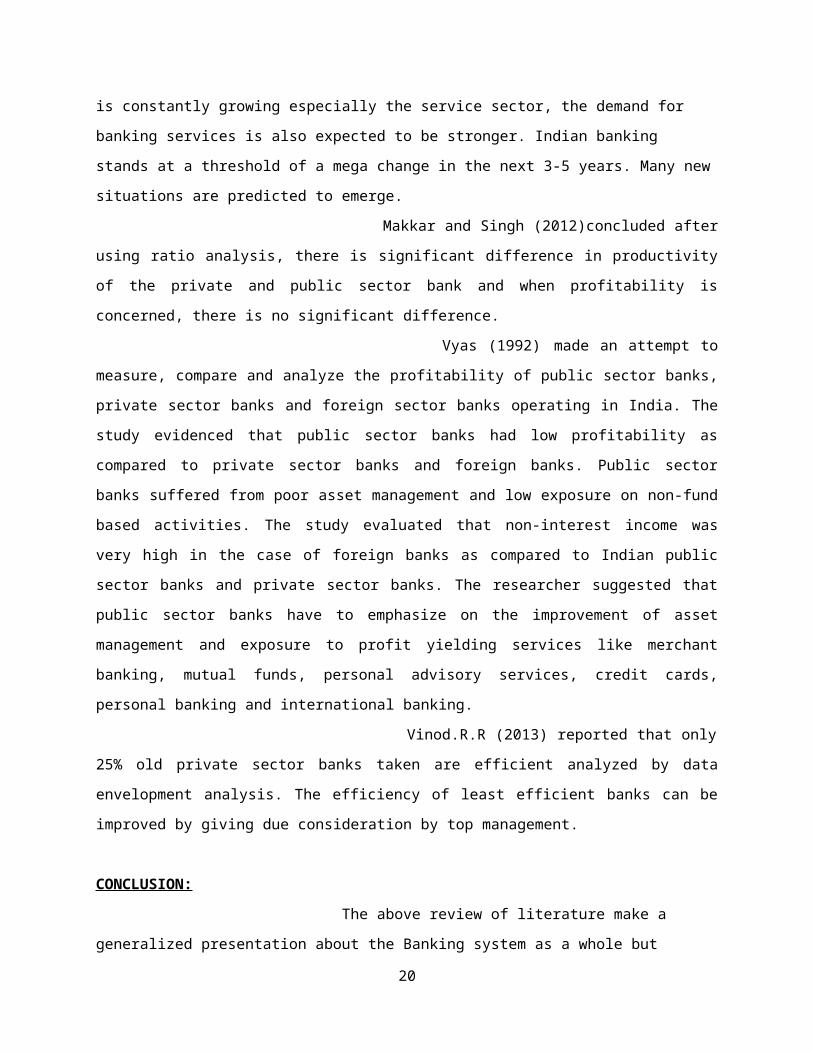
position. As Indian economy is constantly growing especially the service sector, the demand for banking
services is also expected to be stronger. Indian banking stands at a threshold of a mega change in the next
3-5 years. Many new situations are predicted to emerge.
Makkar and Singh (2012)concluded after using ratio analysis, there is significant
difference in productivity of the private and public sector bank and when profitability is concerned, there
is no significant difference.
12
Vyas (1992) made an attempt to measure, compare and analyze the profitability of
public sector banks, private sector banks and foreign sector banks operating in India. The study evidenced
that public sector banks had low profitability as compared to private sector banks and foreign banks.
Public sector banks suffered from poor asset management and low exposure on non-fund based activities.
The study evaluated that non-interest income was very high in the case of foreign banks as compared to
Indian public sector banks and private sector banks. The researcher suggested that public sector banks
have to emphasize on the improvement of asset management and exposure to profit yielding services like
merchant banking, mutual funds, personal advisory services, credit cards, personal banking and
international banking.
Vinod.R.R (2013) reported that only 25% old private sector banks taken are efficient
analyzed by data envelopment analysis. The efficiency of least efficient banks can be improved by giving
due consideration by top management.
CONCLUSION:
The above review of literature make a generalized presentation about the Banking
system as a whole but neglects in-depth investigation into the profitability and productivity position of
banks. The present study was made to bridge this gap in the existing body of knowledge. This study
evaluated the performance of ICICI bank on the basis of profitability analysis and analyzed the factors
determining the profitability of ICICI bank with the help of multiple regression technique.
Chapter 3
RESEARCH METHODOLOGY
13
Research methodology is a may be understood as a science of studying how research is done
scientifically. So, the research methodology not only talks about the research method but also considers
the logic behind the method used in the context of the research study. To achieve the proposed objectives
of the study, ICICI Bank was selected for the study. ICICI Bank is having good geographical coverage
and stock market presence so all the data needed for the study was easily available.
3.1 Data Collection
3.2 Sampling size
3.3 Sampling Units
3.4 Data Analysis Tools
3.4.1 Profitability
3.4.2 Productivity
3.4.3 Compounded Annual Growth Rate (CAGR)
3.1 DATA COLLECTION
The required data for the study was both Primary and Secondary in nature and the data has been collected
from the audited reports of the company. The sources of data was from the annual reports of the company
from the year 2009- 10 to 2013-14, external resources through like Business Magazines, Generals,
Internet, Websites and Research Papers etc. Whereas Primary data has been collected from the managers
of selected branches of ICICI Bank in Ludhiana through questionnaire.
3.2 Sampling size:
Total 20 officers has been selected from 20 different branches of ICICI Bank.
3.3 Sampling Location:
15 Branches has been selected from Ludhiana city
ICICI Bank Ballowal
ICICI Bank Focal Point
ICICI Bank Fountain Chowk
ICICI Bank Doraha
ICICI Bank Dugri
ICICI Bank Kitchlu Nagar
14
ICICI Bank Model town
ICICI Bank Sunder Nagar
ICICI Bank Sarabha Nagar
ICICI Bank Feroz Gandhi Market
ICICI Bank Lakha
ICICI Bank Mullanpur
ICICI Bank Badowal kalan
ICICI Bank Machhiwara
ICICI Bank Sahnewal.
5 Branches has been selected from Jalandhar city
ICICI Bank Post office Road, Near Ambedkar chowk, Near Nakodar
ICICI Bank, Adarsh Nagar
ICICI Bank, New Grain Market
ICICI Bank, Model Town.
ICICI Bank, Civil Lines.
3.4 Data Analysis Tools
A five years period (2009- 10 to 2013-14) has been selected for evaluating the
performance.
The study uses Ratio analysis to compare profitability and productivity of different
categories of banks. Ratio analysis is a powerful tool of financial analysis. In financial analysis ratios are
generally used as benchmarks for evaluating a firm’s position or performance. The absolute values may
not provide us meaningful values until and unless they are related to some other relevant information.
Ratios represent the relationship between two or more variables. Ratios help to summarize large data to
draw qualitative judgments about the firm’s performance. The common denominator used for developing
the various profitability ratios is business volume (deposits + advances). The banks generally use
calculate spread ratio as % of total assets. The total assets are accounting (Balance sheet) figures, which
are based on historical costs and hence are not very suitable to evaluate the current performance of the
banks. In order to have a suitable indicator for evaluating current bank performance we have used the
volume of business (Advances + Deposits) in the denominator. It is like using Gross profit ratio (Gross
profit/sales) as a substitute for Return on Total asset (Profit/ Total asset) as an indicator of the profitability
15
of a business organization. Productivity has been measured in terms of the outputs (like Business,
deposits, advances) per input (employee/branch).
3.4.1 Profitability
The term profitability is related measure where profit is expressed as a percentage of
total business. There are several measures to calculate profitability ratios. Some researchers take ROA,
ROE and Cost to Income to evaluate the profitability of the banks and some take spread and burden as
profitability measure. In this study profitability is taken as the difference of spread ratio and burden ratio
i.e difference of income and expenditure. No doubt profitability is the most important and reliable
indicator as it gives a broad indication of a bank to raise its income level. The improved profitability is
the good indicator of performance of the bank. Higher the profitability leads to higher satisfaction to
shareholders, managers, customers as well in the terms of better services and high technology. Now these
days’ banks spending are more as compared to previous era. To come up with high tech, banks are
spending heavily on upcoming new technologies to make Indian banking world class. And this is the
reason of high operating expenditure in banks. This expense may costs in short run but definitely it proves
fruitful and indispensible in long run.
3.4.2 Productivity
Productivity is an economic measure of output per unit of input. The concept of
productivity is more easily applied to industrial settings while it is more difficult to define and measure in
the context of services sector, including the banking industry. In the present study deposits per employee
and total expense are taken as input, advances per employee and total income, are taken as output for
measuring productivity of banks.
The ratios used for measuring the profitability of the banks are as:
1. Interest earned ratio (r) = Total interest earned / Volume of business
2. Interest paid ratio (p) = Total interest paid / Volume of business
3. Non-interest income ratio (n) =Total income – interest income / Volume of business
4. Other operating expenses ratio(o) = Total expenses – interest expenses / Volume of business
5. Establishment expenses ratio (m) = Establishment expenses / Volume of business
The following equations are derived from the above ratios:
16
1. Spread ratio (s) = Interest earned ratio – Interest paid ratio (r-p)
2.Burden ratio (b) = Other operating expenses ratio – Non interest income ratio(o-n)
The profitability ratio is worked out as follows:
Profitability ratio = Spread ratio – Burden ratio
The ratios used for measuring Productivity are:
1. Deposit per employee = Total Deposit/Total Staff
2. Advances per employee Ratio = Total Advances/ Total Staff
3. Total Business per employee = Total Business/ Total Staff
4. Deposit per Branch Ratio = Total Deposits/ No. of Branches
5. Advances per Branch Ratio = Total Advances/ No. of Branches
6. Total Business per Branch = Total Business/ No. of Branches
Productivity Analysis
Productivity is a vital indicator of economic performance of an economic system.
Productivity is not an end in itself. In fact, it is a mechanism for improving the material quality of life.
Productivity is fundamental to progress throughout the world. It is at the heart of economic growth and
development, improvements in standards of living and quality of life.
Definition
Productivity is defined as the goods and services produced per unit of labour, capital or
both. The ratio of output to labour and capital is a total productivity measure. In simple words,
productivity is the output per unit of input employed. The basic definition of productivity is:
PRODUCTIVITY = TOTAL OUTPUT
INPUT
3.4.3 Compounded Annual Growth Rate (CAGR)
Compounded Annual Growth rate (CAGR) is a business and investing specific term
for the smoothed annualized gain of an investment over a given time period. CAGR is not an accounting
term, but remains widely used, particularly in growth industries or to compare the growth rates of two
17
investments because CAGR dampens the effect of volatility of periodic returns that can render arithmetic
means irrelevant. CAGR is often used to describe the growth over a period of time of some element of the
business, for example revenue, units delivered, registered users, etc. In the present study CAGR is used to
find the yearly growth in productivity and profitability of the public and private sector banks. Following
formula has been used to calculate the CAGR.
CHAPTER 4
RESULTS AND DISCUSSION
18
Major Indicators of Productivity
4.1 Employee Productivity
4.1.1 Deposit per Employee
4.1.2 Advances per Employee
4.1.3 Advance +Deposits per Employee
4.2 Branch Productivity
4.2.1 Deposit per Branch Ratio
4.2.2 Advances per Branch
4.2.3 Total Business per Branch
4.3 Profitability Ratios
4.3.1 Interest Spread
4.3.2 Adjusted Cash Margin
4.3.3 Net Profit Margin
4.3.4 Return on Net Worth
4.3.5 Return on Assets excluding Revaluations
4.4 Analysis of factors Affecting Profitability and Productivity
Major Indicators of Productivity
4.1 Employee Productivity
Human resource is the most important asset of an organization and banking business is
no exception to it. But Indian PSBs are known for their excessive staff strength, it affects their
productivity. In the present study, employee productivity of PSBs has been evaluated by taking eight
ratios in consideration. A brief summary of all these ratios are as under:
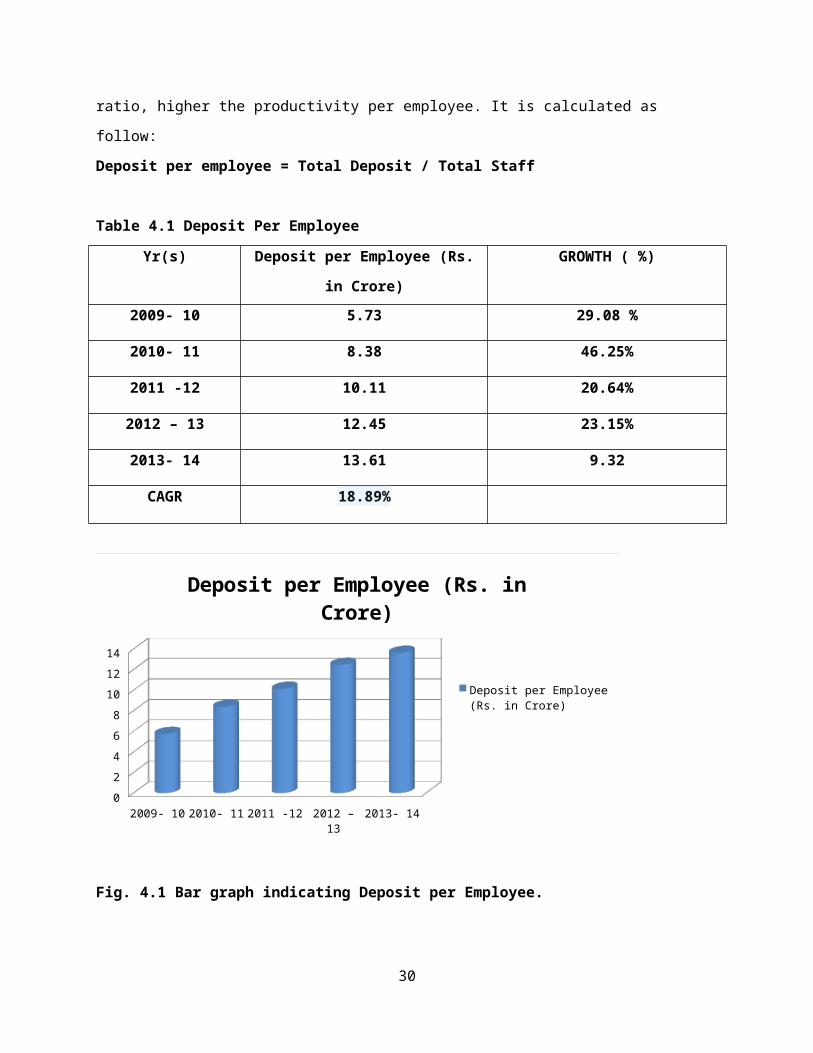
4.1.1 Deposit per Employee:
This ratio reveals the deposit-collection capacity of an employee. Higher the deposit
per employee ratio, higher the productivity per employee. It is calculated as follow:
Deposit per employee = Total Deposit / Total Staff
Table 4.1 Deposit Per Employee
Yr(s) Deposit per Employee (Rs. in Crore) GROWTH ( %)
19
2009- 10 5.73 29.08 %
2010- 11 8.38 46.25%
2011 -12 10.11 20.64%
2012 – 13 12.45 23.15%
2013- 14 13.61 9.32
CAGR 18.89%
2009- 10 2010- 11 2011 -12 2012 – 13 2013- 140
2
4
6
8
10
12
14
Deposit per Employee (Rs. in Crore)
Deposit per Employee (Rs. in Crore)
Fig. 4.1 Bar graph indicating Deposit per Employee.
Interpretation:
Above table and graph shows that in ICICI Bank average deposits per employee was
Rs. 13.61crores during the period of 2013-14 , whereas it was5.73 in 2009-2013.This shows that it is
continuously increasing from 2009-2013. Higher the deposit per employee ratio, higher the productivity
per employee. Which means the productivity per employee has been increased through the last 5 years.
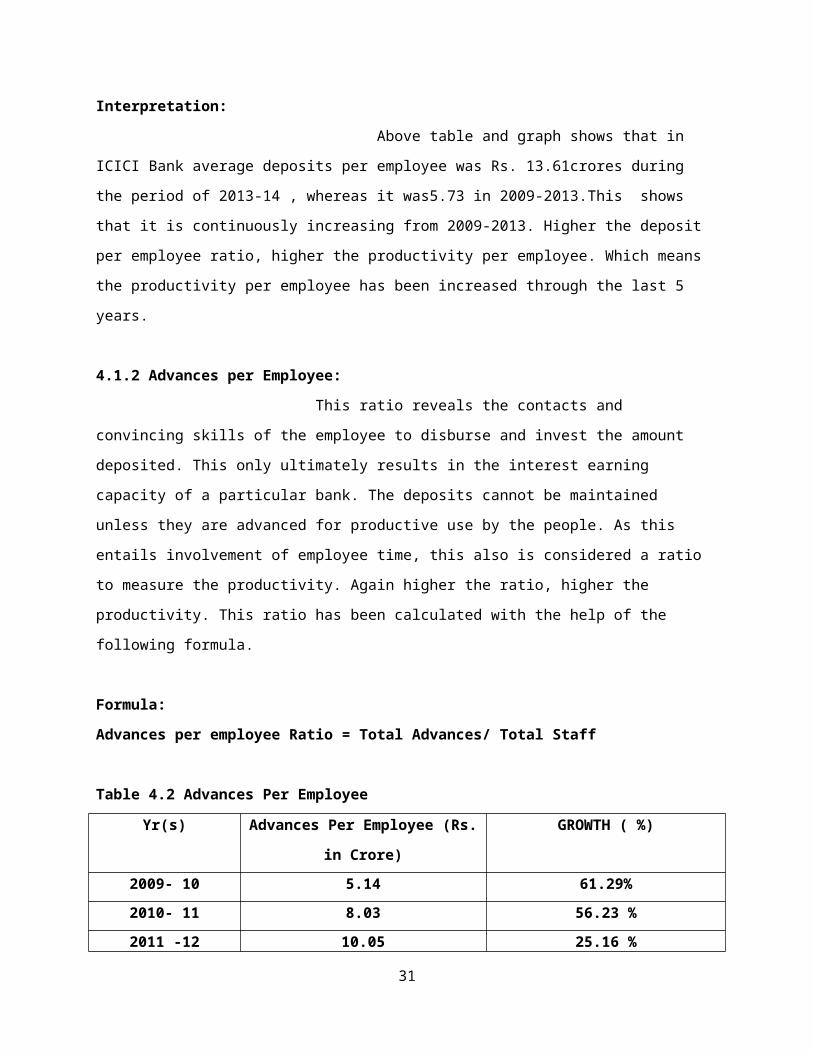
4.1.2 Advances per Employee:
This ratio reveals the contacts and convincing skills of the employee to disburse and
invest the amount deposited. This only ultimately results in the interest earning capacity of a particular
bank. The deposits cannot be maintained unless they are advanced for productive use by the people. As
20

this entails involvement of employee time, this also is considered a ratio to measure the productivity.
Again higher the ratio, higher the productivity. This ratio has been calculated with the help of the
following formula.
Formula:
Advances per employee Ratio = Total Advances/ Total Staff
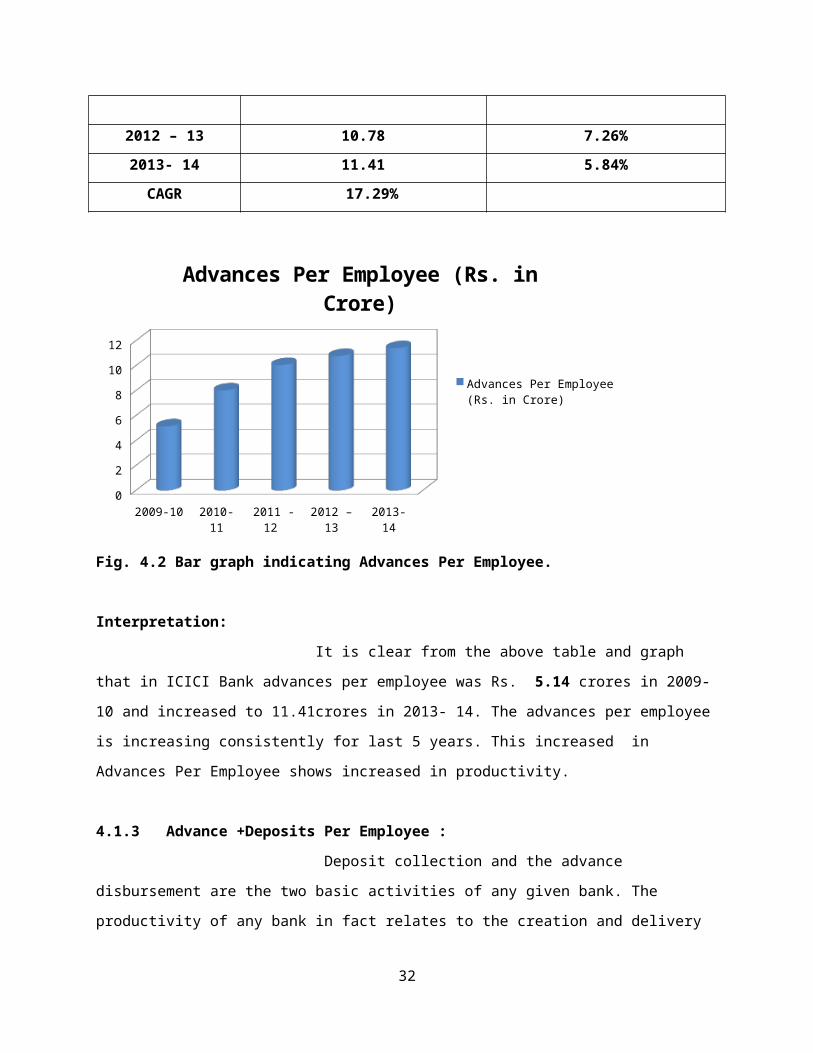
Table 4.2 Advances Per Employee
Yr(s) Advances Per Employee (Rs. in
Crore)
GROWTH ( %)
2009- 10 5.14 61.29%
2010- 11 8.03 56.23 %
2011 -12 10.05 25.16 %
2012 – 13 10.78 7.26%
2013- 14 11.41 5.84%
CAGR 17.29%
2009-10 2010- 11 2011 -12 2012 – 13 2013- 140
2
4
6
8
10
12
Advances Per Employee (Rs. in Crore)
Advances Per Employee (Rs. in Crore)
Fig. 4.2 Bar graph indicating Advances Per Employee.
Interpretation:
It is clear from the above table and graph that in ICICI Bank advances per employee was
Rs. 5.14 crores in 2009-10 and increased to 11.41crores in 2013- 14. The advances per employee is
21

increasing consistently for last 5 years. This increased in Advances Per Employee shows increased in
productivity.
4.1.3 Advance +Deposits Per Employee :
Deposit collection and the advance disbursement are the two basic activities of any given
bank. The productivity of any bank in fact relates to the creation and delivery of capital. Here creation
means deposits and delivery means advances. Both together are the net measure of productivity.
Table 4.3 Advances Per Employee (Rs. in Crore)
Yr(s) Advances Per Employee (Rs. in
Crore)
GROWTH ( %)
2009- 10 10.87 39.72%
2010- 11 16.41 50.97 %
2011 -12 20.16 22.85 %
2012 – 13 21.45 6.40 %
2013- 14 22.67 5.69 %
CAGR 15.84 %
2009-10 2010- 11 2011 -12 2012 – 13 2013- 140
5
10
15
20
25
Advances Per Employee (Rs. in Crore)
Advances Per Employee (Rs. in Crore)
Fig 4.3 Bar graph indicating Advances Per Employee
22
Interpretation:
Above table and graph depicts that in ICICI Bank average Advance +Deposits per
Employee was Rs. 22.67 crores in 2013-14 which is increasing side from last five years. Advances Per
Employee is continuously increasingly for last 5 years. This increasing ratio, shows that the employee
of the bank is better and the productivity of the bank is more.
4.2 Branch Productivity
Concept of Productivity in Banking The concept and definition of productivity as applied in manufacturing
industries cannot be applied as such in banking industry because it is primarily a service
industry. In the field of banking, the various products are accounts, drafts, exchange remittances,
cheques, travellers cheques, credit cards, debit cards, services for guarantees, various kinds of
loans like housing loan, education loan, car loan etc. Identification and measurement of output in
banking is very difficult exercise as it is not possible to bring various services to measure output.
However, banking being an important economic activity cannot afford to loose sight of the
concept of productivity. Application of the concept in the Indian banking industry becomes all
the more difficult, as it gets associated with such diverse aspects like operational cost
effectiveness, profitability, customer services, priority sector lending, mobilization of deposits,
deployment of credit in rural and backward regions. But as we know that banks are the mirror of
an economy. Therefore better functioning of banking sector may lead to the overall improvement
of the economy. In fact, banks act as a link between those who want to save and those who want
to invest, so improvement in the productivity of the banking sector is very much needed who
want to save and obviously, difficulty is not in applying the broader concept of productivity as
ratio of output and input, but is in measuring output in the form of services.
While evaluating the results in terms of infrastructural facilities utilized by the banks at various locations,
places, again eight indicators have been used. A brief summary of these ratios are as under:
4.2.1 Deposit per Branch Ratio:
A Branch is the initial organizational unit in any bank with similar environment and
clientele. This also follows the similar policies, methodologies and structure in a particular bank. In order
23
to smoothen out the individual differences, this seems to be a better unit for measuring productivity. It
reflects the organizational effectiveness of the bank.
Deposit per Branch Ratio = Total Deposits/ No. of Branches
Table 4.4 Deposit Per Branch Ratio
Yr(s) Deposit per Branch Ratio
(Rs. In Crore)
GROWTH ( %)
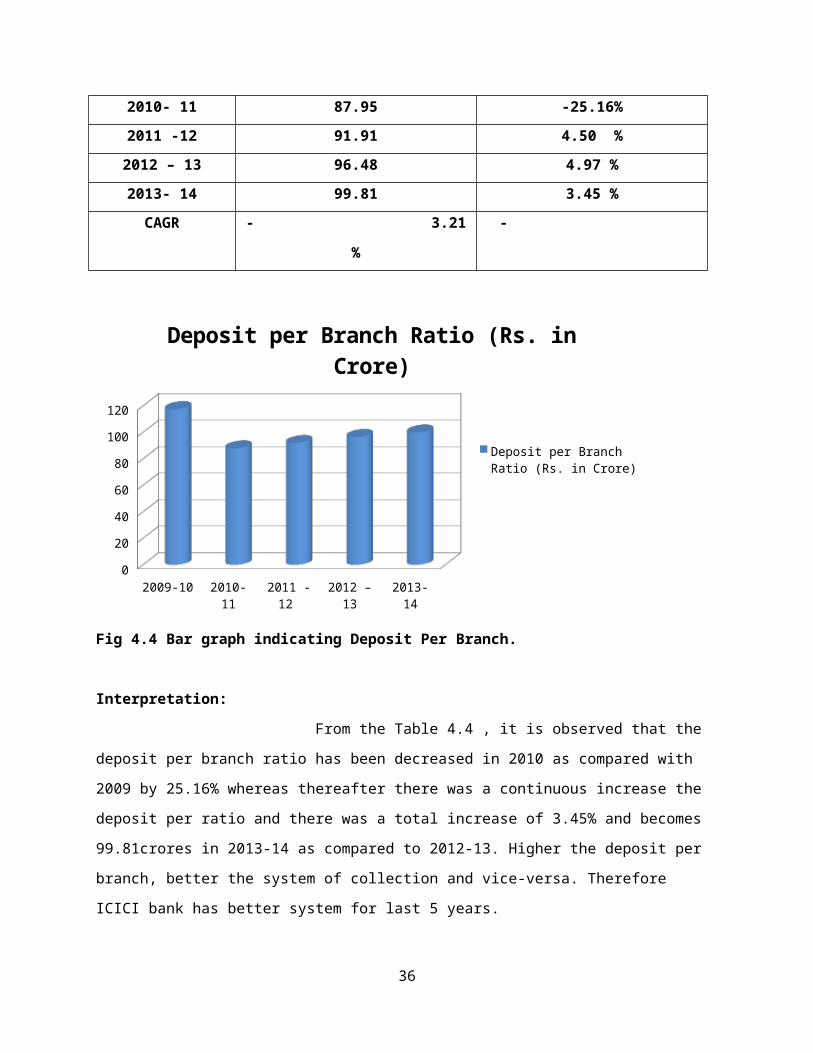
2009- 10 117.52 5.36 %
2010- 11 87.95 -25.16%
2011 -12 91.91 4.50 %
2012 – 13 96.48 4.97 %
2013- 14 99.81 3.45 %
CAGR - 3.21
%
-
2009-10 2010- 11 2011 -12 2012 – 13 2013- 140
20
40
60
80
100
120
Deposit per Branch Ratio (Rs. in Crore)
Deposit per Branch Ratio (Rs. in Crore)
Fig 4.4 Bar graph indicating Deposit Per Branch.
Interpretation:
From the Table 4.4 , it is observed that the deposit per branch ratio has been decreased in
24
2010 as compared with 2009 by 25.16% whereas thereafter there was a continuous increase the deposit
per ratio and there was a total increase of 3.45% and becomes 99.81crores in 2013-14 as compared to
2012-13. Higher the deposit per branch, better the system of collection and vice-versa. Therefore ICICI
bank has better system for last 5 years.
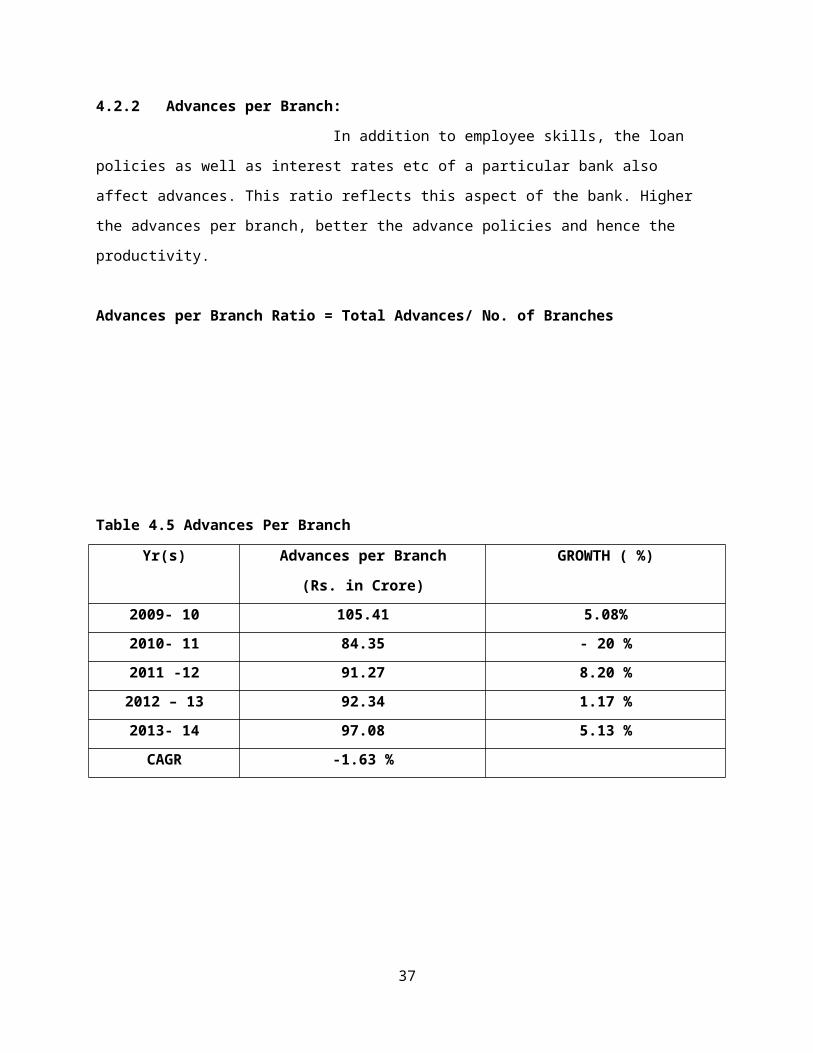
4.2.2 Advances per Branch:
In addition to employee skills, the loan policies as well as interest rates etc of a particular
bank also affect advances. This ratio reflects this aspect of the bank. Higher the advances per branch,
better the advance policies and hence the productivity.
Advances per Branch Ratio = Total Advances/ No. of Branches
Table 4.5 Advances Per Branch
Yr(s) Advances per Branch
(Rs. in Crore)
GROWTH ( %)
2009- 10 105.41 5.08%
2010- 11 84.35 - 20 %
2011 -12 91.27 8.20 %
2012 – 13 92.34 1.17 %
2013- 14 97.08 5.13 %
CAGR -1.63 %
25
2009-10 2010- 11 2011 -12 2012 – 13 2013- 140
20
40
60
80
100
120
Advances per Branch (Rs. in Crore)
Advances per Branch (Rs. in Crore)
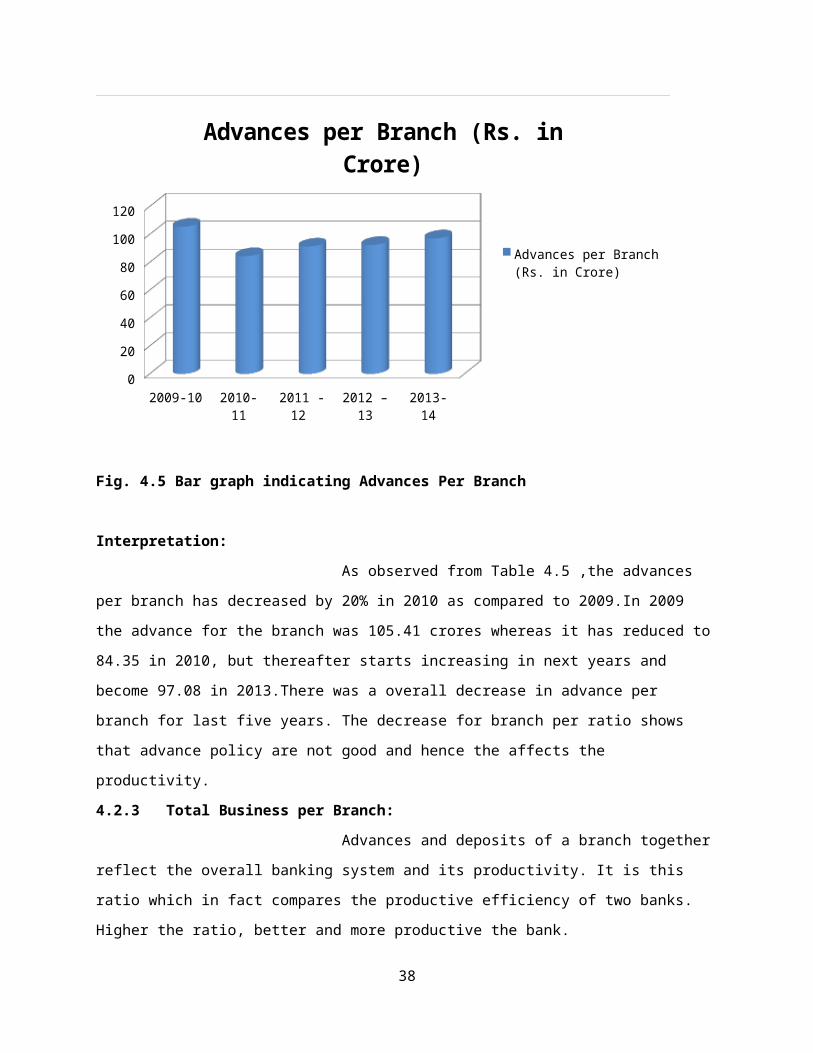
Fig. 4.5 Bar graph indicating Advances Per Branch
Interpretation:
As observed from Table 4.5 ,the advances per branch has decreased by 20% in 2010 as
compared to 2009.In 2009 the advance for the branch was 105.41 crores whereas it has reduced to 84.35
in 2010, but thereafter starts increasing in next years and become 97.08 in 2013.There was a overall
decrease in advance per branch for last five years. The decrease for branch per ratio shows that advance
policy are not good and hence the affects the productivity.
4.2.3 Total Business per Branch:
Advances and deposits of a branch together reflect the overall banking system and its
productivity. It is this ratio which in fact compares the productive efficiency of two banks. Higher the
ratio, better and more productive the bank.
Total Business per Branch = Total Business/ No. of Branches
Table 4.6 Total Business Per Branch
Yr(s) Total Business per Branch (Rs. in
Crore)
GROWTH ( %)
26
2009- 10 222.93 1.02%
2010- 11 172.31 -22.71%
2011 -12 183.18 6.31 %
2012 – 13 187.45 2.33 %
2013- 14 192.09 2.48 %
CAGR -2.93 %
2009- 10 2010- 11 2011 -12 2012 – 13 2013- 140
50
100
150
200
250
Total Business per Branch (Rs. in Crore)
Total Business per Branch (Rs. in Crore)
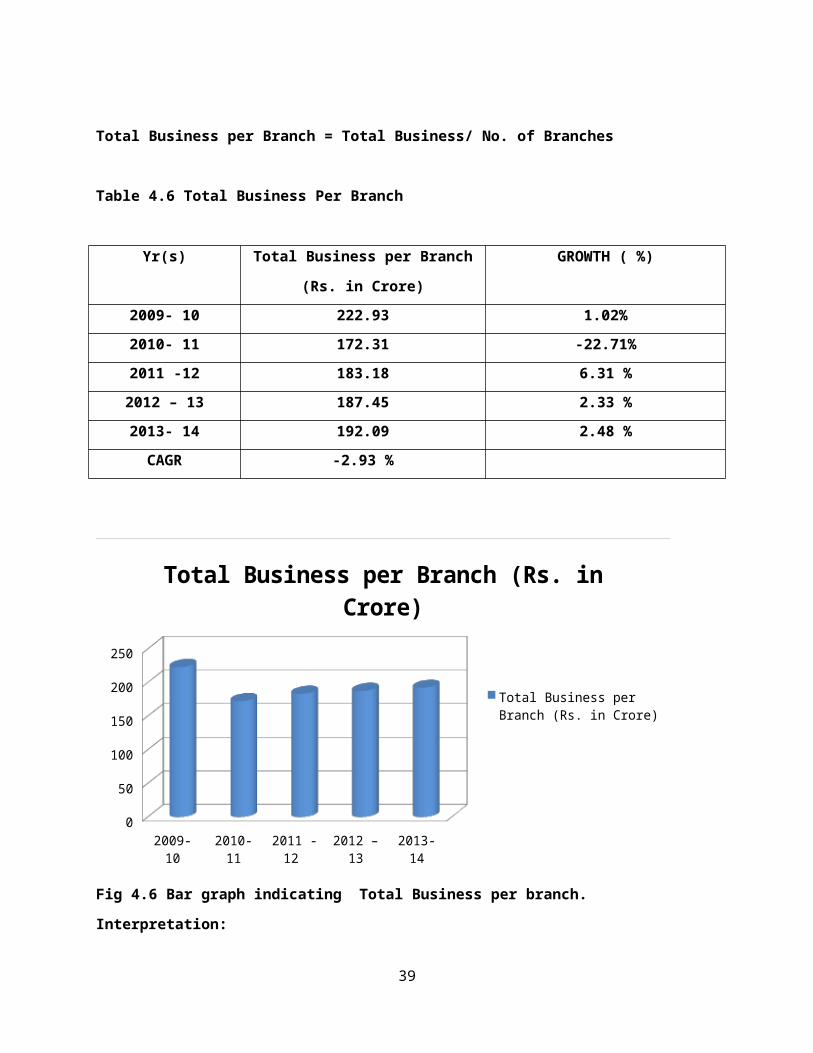
Fig 4.6 Bar graph indicating Total Business per branch.
Interpretation:
From the table 4.6 , it was observed that Total business per branch has increased
from last four years respectively. there was a growth of 2.48% in 2014 as compared to 2013 .The business
per branch ratio was initially decreased to 2010 to 172.31 crores as compared to 222.93 crores in
2009 .The increasing ratio shows that the bank is productive from last four years.
4.3 Profitability Ratios
DEFINITION of 'Profitability Ratios'
A class of financial metrics that are used to assess a business's ability to generate earnings as
compared to its expenses and other relevant costs incurred during a specific period of time. For
27

most of these ratios, having a higher value relative to a competitor's ratio or the same ratio from a
previous period is indicative that the company is doing well.
4.3.1 INTEREST SPREAD
Extent to which interest earning capacity of an entity exceeds or falls short of its interest cost obligations.
Formula:
(Interest earned ÷ Interest-earning assets) - (Interest paid ÷ Interest-costing liabilities).
Interest spread is the difference between the average lending rate and the average borrowing rate
for a bank or other financial institution. It is:
(interest income ÷interest earning assets) - (interest expense ÷interest bearing liabilities)
This is very similar to interest margin. If a bank's lending was exactly equal to its borrowings
(i.e. deposits plus other borrowing) the two numbers would be identical. In reality, bank also has
its shareholder's funds available to lend, but at the same time its lending is constrained by reserve
requirements.
Table 4.7 Interest Spread
Yr(s) Interest Spread GROWTH ( %)
2009- 10 5.66
2010- 11 6.95 22.79 %
2011 -12 7.45 7.19 %
2012 – 13 7.82 5 %
2013- 14 7.35 - 6.01 %
CAGR 5.36 %
28

2009- 10 2010- 11 2011 -12 2012 – 13 2013- 140
1
2
3
4
5
6
7
8
Interest Spread
Interest Spread
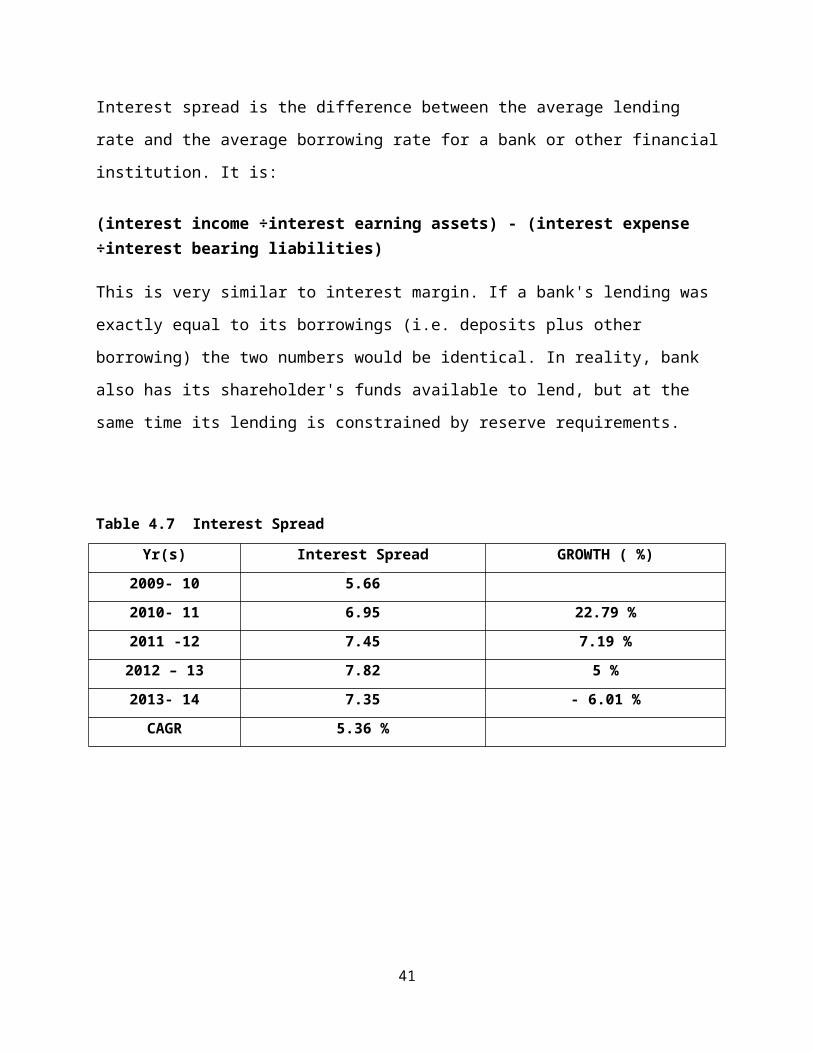
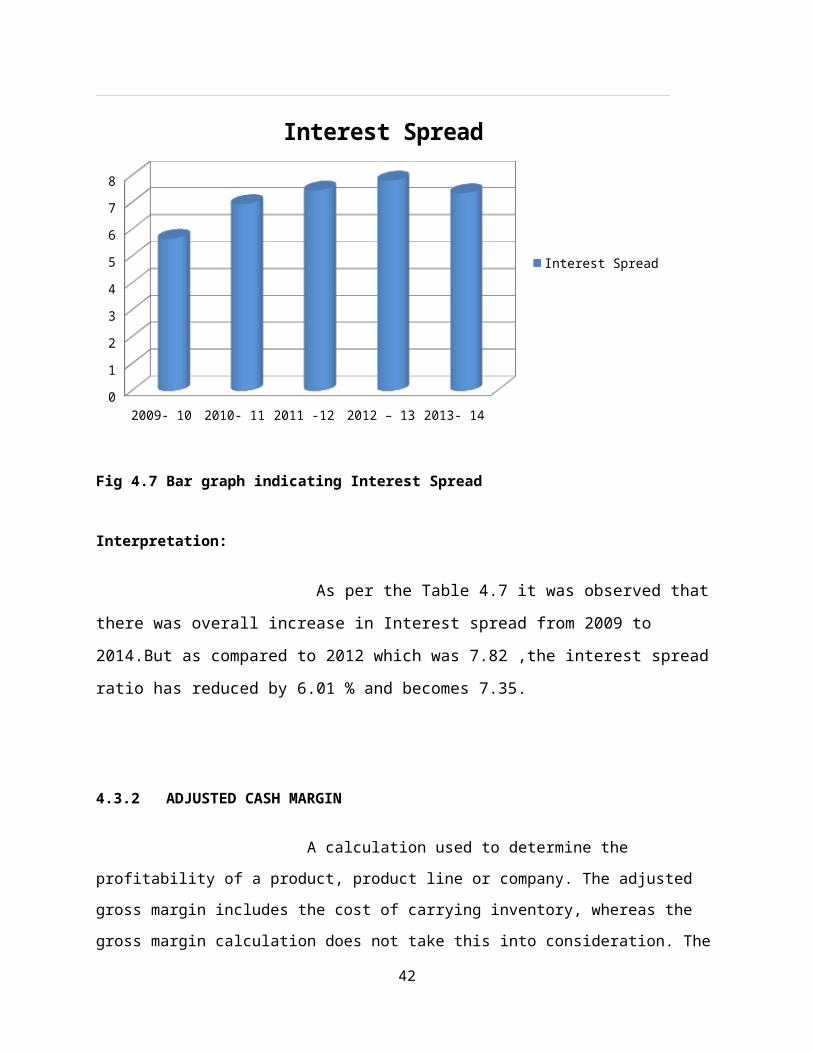
Fig 4.7 Bar graph indicating Interest Spread
Interpretation:
As per the Table 4.7 it was observed that there was overall increase in Interest
spread from 2009 to 2014.But as compared to 2012 which was 7.82 ,the interest spread ratio has
reduced by 6.01 % and becomes 7.35.
4.3.2 ADJUSTED CASH MARGIN
A calculation used to determine the profitability of a product,
product line or company. The adjusted gross margin includes the cost of
carrying inventory, whereas the gross margin calculation does not take this into
consideration. The adjusted gross margin, therefore, provides a more accurate
look at the profitability of a product than the gross margin allows. The equation
is as follows:
29
n Period Gross Profit Dollars – n Period Carrying Cost Dollars
n Period Sales Dollars
Table 4.8 Adjusted Cash Margin
Yr(s) Adjusted Cash Margin(%) GROWTH ( %)
2009- 10 13.64 16.8%
2010- 11 17.27 26.61 %
2011 -12 15.85 - 8.22 %
2012 – 13 18.20 14.83 %
2013- 14 19.02 4.51 %
CAGR 6.88 %
2009-10 2010- 11 2011 -12 2012 – 13 2013- 140
2
4
6
8
10
12
14
16
18
20
Adjusted Cash Margin(%)
Adjusted Cash Margin(%)
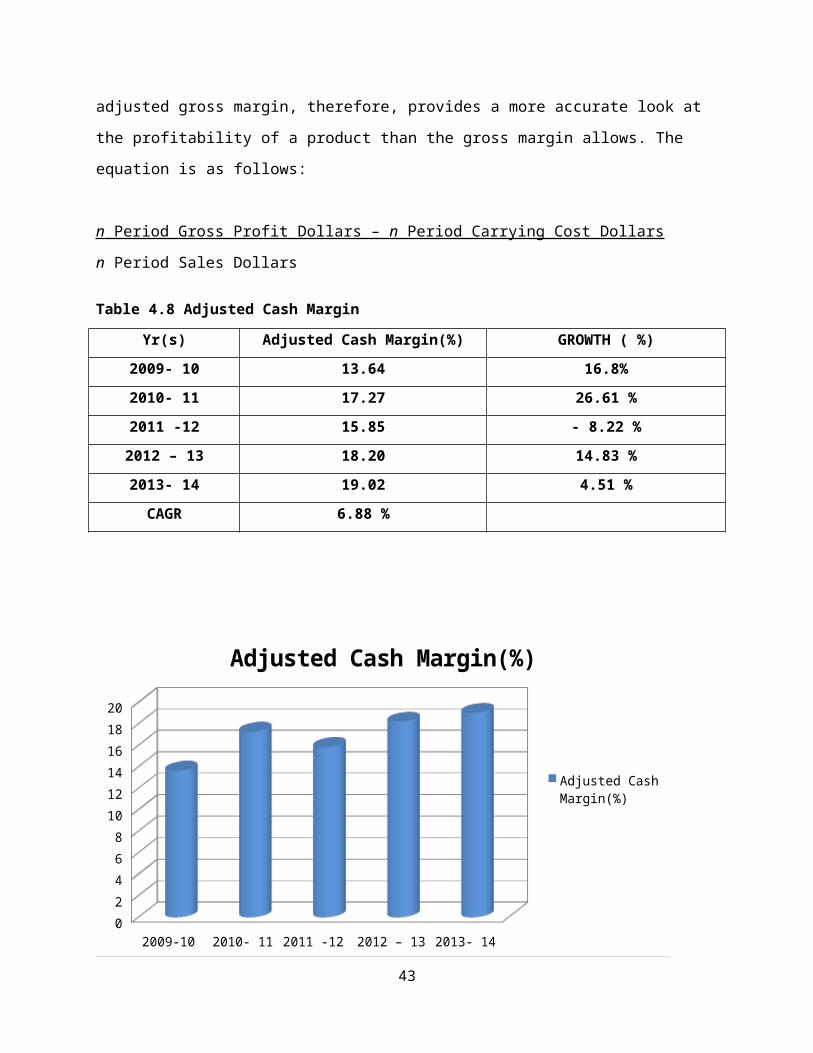
Fig 4.8 Bar graph indicating Adjusted Cash Margin
Iterpretation:
As observed from the Table 4.8 the Adjusted cash Margin is
increasing from last three years , there was a increase of 4.5% in 2014 as
compared to 2013.As the Adjusted cash margin increasing value shows that the
30
profitability of product increases .An increasing operating cash margin shows
that Bank is earning more cash, it is an indication of high earning quality.
4.3.3 NET PROFIT MARGING
The ratio of net profits to revenues for a company or business segment - typically
expressed as a percentage – that shows how much of each dollar earned by the company is
translated into profits. Net margins can generally be calculated as:
Table 4.9 Net Profit Margin
Yr(s) Net Profit Margin GROWTH ( %)
2009- 10 12.17 15.34%
2010- 11 15.79 29.75 %
2011 -12 15.75 -0.25 %
2012 – 13 17.19 9.14 %
2013- 14 17.96 4.78 %
CAGR 8.09%
31
2009-10 2010- 11 2011 -12 2012 – 13 2013- 140
2
4
6
8
10
12
14
16
18
Net Profit Margin
Net Profit Margin
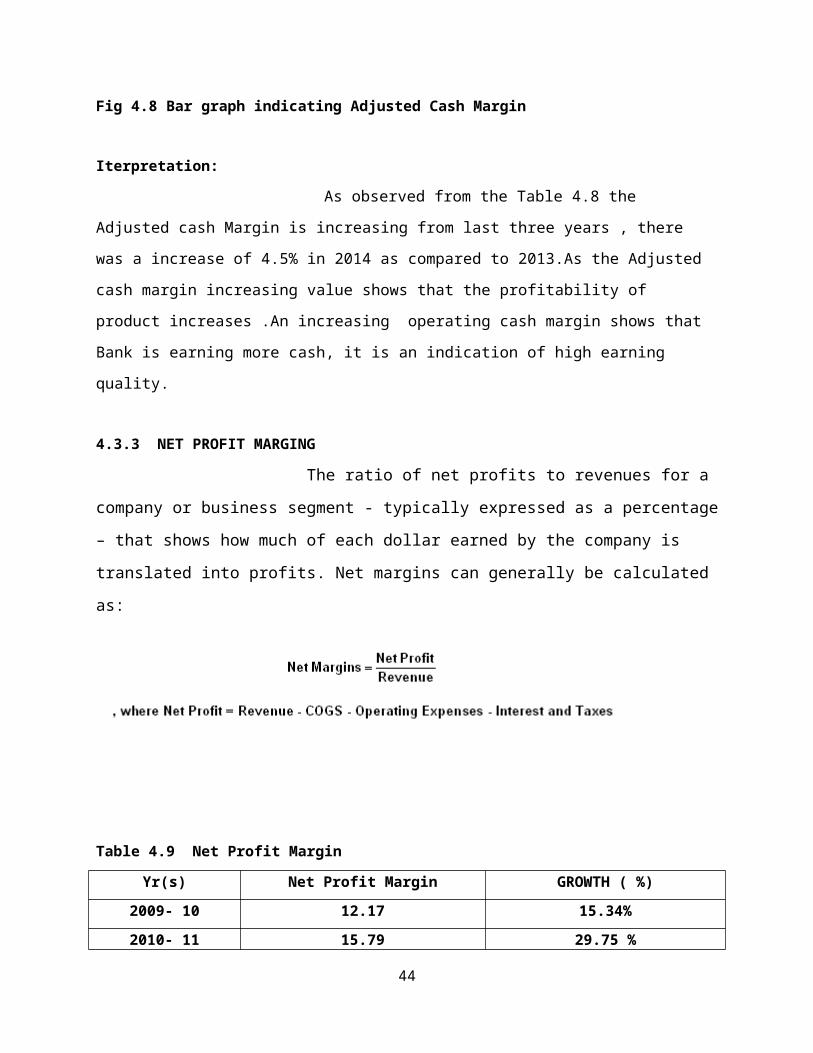
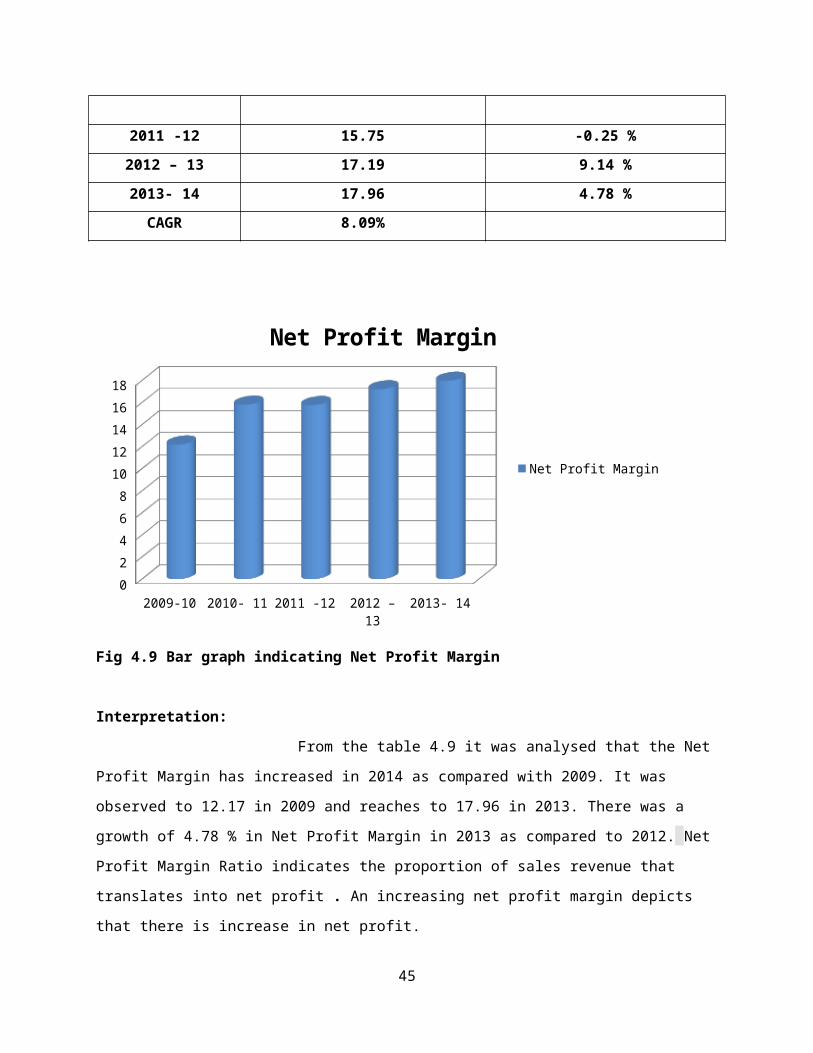
Fig 4.9 Bar graph indicating Net Profit Margin
Interpretation:
From the table 4.9 it was analysed that the Net Profit Margin has increased in 2014 as
compared with 2009. It was observed to 12.17 in 2009 and reaches to 17.96 in 2013. There was a growth
of 4.78 % in Net Profit Margin in 2013 as compared to 2012. Net Profit Margin Ratio indicates the
proportion of sales revenue that translates into net profit . An increasing net profit margin depicts that
there is increase in net profit.
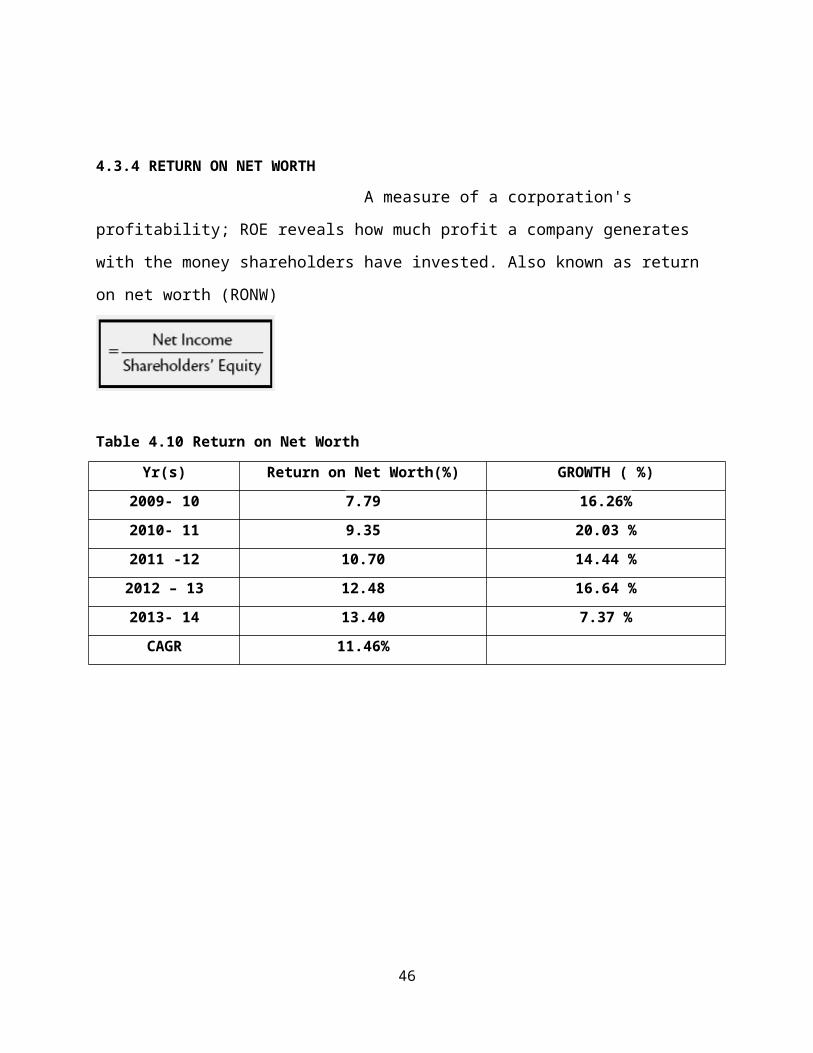
4.3.4 RETURN ON NET WORTH
A measure of a corporation's profitability; ROE reveals how much profit a
company generates with the money shareholders have invested. Also known as return on net
worth (RONW)
Table 4.10 Return on Net Worth
Yr(s) Return on Net Worth(%) GROWTH ( %)
32

2009- 10 7.79 16.26%
2010- 11 9.35 20.03 %
2011 -12 10.70 14.44 %
2012 – 13 12.48 16.64 %
2013- 14 13.40 7.37 %
CAGR 11.46%
2009- 10 2010- 11 2011 -12 2012 – 13 2013- 140
2
4
6
8
10
12
14
Return on Net Worth(%)
Return on Net Worth(%)
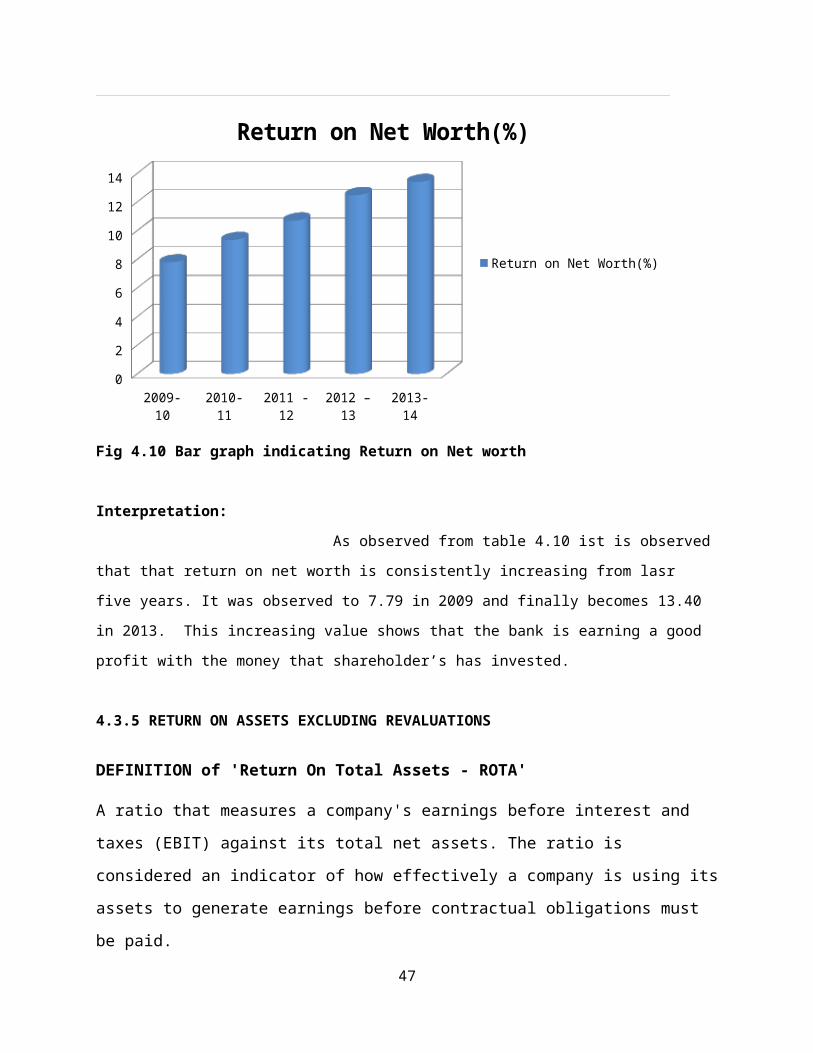
Fig 4.10 Bar graph indicating Return on Net worth
Interpretation:
As observed from table 4.10 ist is observed that that return on net worth is consistently
increasing from lasr five years. It was observed to 7.79 in 2009 and finally becomes 13.40 in 2013. This
increasing value shows that the bank is earning a good profit with the money that shareholder’s has
invested.
4.3.5 RETURN ON ASSETS EXCLUDING REVALUATIONS
DEFINITION of 'Return On Total Assets - ROTA'
33
A ratio that measures a company's earnings before interest and taxes (EBIT) against its total net
assets. The ratio is considered an indicator of how effectively a company is using its assets to
generate earnings before contractual obligations must be paid.
To calculate ROTA:
Table 4.11 Return on Assets Excluding Revaluations
Yr(s) Return on Assets Excluding
Revaluations
GROWTH ( %)
2009- 10 463.01 7.38%
2010- 11 478.31 3.31%
2011 -12 524.01 9.55
2012 – 13 578.21 10.34 %
2013- 14 633.92 9.63 %
CAGR 6.49%
2009-10 2010- 11 2011 -12 2012 – 13 2013- 140
100
200
300
400
500
600
700
Return on Assets Excluding Revaluations
Return on Assets Excluding Revaluations
34
Fig 4.11 Bar graph indicating Return on Assets Excluding Revaluations
Interpretation:
From the table 4.11 it was observed that the return on asserts
excluding revaluations there has been increase of 9.63 %in 2013- 14 as
compared with 2012-13. This increasing return on asserts excluding
revaluations shows that banks is using its assets to generate earnings effectively.
4.4 Analysis of factors affecting profitability and productivity
This part covers the analysis of questionnaire.
To get the information about practice of performance budgeting for evaluating branch
Performance first question was asked. It was found that all the surveyed branches of ICICI Bank follows
performance budgeting.
Second question was asked , and it was found that firstly the branches fixes the target for
itself and ultimately these are approved by Regional offices.
Bar graph 4.12 Basis of fixation of performance standards
35
Past tr
ends
Future
Potentiali
ties
Staff ca
pabiliti
es
Branch
Locati
on
All of th
e above
0
2
4
6
8
10
12
14
NO. OF RESPONDENTS
NO. OF RESPONDENTS
Above question on what basis these performance standards are fixed, the above chart
4.12 indicates that these are fixed by the branch keeping in mind the mixture of past performance, future
potentialities, staff capability and branch location as evident from the feedback of respondents. But quite
surprisingly some officers told that their standards are solely based on one or other thing.
Fourth question was asked to determine important areas of banking operations. Here
officers rearded that profit is the most important criteria in their view for better controlling the operations
inspite of the fact that to a greater extent it is dependent on deposits mobilized and advances lent by bank.
Bar graph 4.13 Relative important areas of banking operations
36
Profits
Deposit
s
Recove
ry
Advances
Branch
Expan
sion
Forei
gn Ex
chan
ge
Custom Se
rvice
Trained
Man
power0
1
2
3
4
5
6
NO. OF RESPONDENTS
To know about the periodicity of performance evaluation, flexibity of standards and
nature of punitive action taken or to be taken, next four questions were asked.
Bar graph 4.13 Time interval for evaluating performance of the branch
Monthly Quarterly Half yearly Yearly0
1
2
3
4
5
6
7
8
9
10
NO. OF RESPONDENTS
From the bar graph 4.13 it was observed that the Branch performance is evaluated at the end
37
of each quarter.
Bar graph 4.14 Can these performance standards be modified during Financial year depending
upon earlier performance shown by the branch
YES NO0
2
4
6
8
10
12
14
16
18
NO. OF RESPONDENTS
NO. OF RESPONDENTS
Against pre-determined standards. If some factors beyond the control of branch are
operational, then these standards are modified as the earliest possible by restoring to same procedure as
used in initial standard fixation. But this practice does not serve any purpose unless and until any punitive
action is taken at any level for not meeting the targets, which quite shabbily is not done in ICICI Bank. It
was observed that the respondents in that regard are of the view that in future branch managers should be
held responsible for loose performance and actions like lower performance rating or withholding their
increments etc. are to be taken.
The next question was asked to have a feel of the critical success factor of ICICI Bank. It
was found that the most important factor contributing to the rapid growth of ICICI Bank, in opinion of
respondents is higher productivity of staff as it got maximum positive feedback from respondents, which
is shown in bar graph 4.15
Bar graph 4.15 Factors contributing to the rapid growth of ICICI BANK
38
Strong c
apita
l base
Profes
sional
Staff
Bank I
mage
Higher
Producti
vity
Branch
network
TOTA
L0
2
4
6
8
10
12
14
16
18
20
NO. OF RESPONDENTS
Next question provided information that because of stringent collection efforts put
by bank staff the bank has been able to have lower level of NPA’s then the banking system. Bar graph
4.16 shows that besides this proper credit appraisal mechanism and complete follow-up of loan towards
the end purpose are also responsible for this .
Bar graph 4.16 Reason for lower NPA,s in ICICI Bank.
Proper
credit a
ppraisal
mech
anism
Complete f
ollow up of th
e loan
Lower
credit e
xposu
re to prio
rity s
ector
High Pro
ductivit
y
Pressu
re on gu
arantors
0
2
4
6
8
NO. OF RESPONDENTS
NO. OF RESPONDENTS
Because of mounting competition Banks are also feeling the pressure, so to determine
39
the future complimentary services next question was asked .Officers view that insurance is the most
important other service which bank can best provide to its customers along with other services. Besides
this bank can also look upon stock depository, Online stock trading etc.
Bar graph 4.17 Complementary Services for the Future
On line T
rading
Stock
Dep
ository
Insura
nce
Man
agem
ent ,F
inancia
l consu
ltancy
Credit r
ating
Underwriti
ng0
1
2
3
4
5
6
7
NO. OF RESPONDENTS
In this question it was observed that the critical measure, which can significantly
improved the current profit performance of ICICI Bank, is to increase staff accountability .It got 12
positive feedback from officers .Besides this reduction in Govt. stake and cost cuttings can improve the
profits.
Bar graph 4.18 Measures which can be taken to further improve the profit performance of ICICI
40
Bank
Selec
tive clo
sure
of loss
making b
ranch
es
Relocati
ng of s
ome bran
ches
Cost cu
tting
Tech
nological
adva
ncemen
t
Increasi
ng acco
untabilit
y
Impro
ving e
xisting p
roduct
mix
Reducti
on in Govt.
Stak
e
TOTA
L02468
101214161820
NO. OF RESPONDENTS
Bar graph 4.18 Excess manpower strength of your bank before VRS
Heavil
y ove
rstaff
ed
Overst
affed
Adequate
ly sta
ffed
Understaff
ed
Heavil
y unders
taffed
0
2
4
6
8
10
12
14
16
NO. OF RESPONDENTS
NO. OF RESPONDENTS
As per the Bar Graph 4.18 the query was about excess manpower strength of bank.
Officer regarded that even before introduction of voluntary retirement schemes (VRS), their bank was
adequately staffed. As per bar graph 4.19 but still if staff strength is to be reduced then VRS is better
option than compulsory retirement schemes. Introduction of compulsory retirement schemes is fear to
have more adverse affects than the positive.
Bar graph 4.19 If ICICI BANK is having excess staff then what is the right step to reduce the flab
41
of ICICI Bank
Voluntary r
etire
ment s
chem
e
Compulsory
retire
ment s
chem
e02468
1012141618
NO. OF RESPONDENTS
Bar graph 4.20 Factors critical for high productivity of employees of ICICI bank
Commitmen
t of e
mployees
Lesser
bureaucra
cy
Training o
f employe
es
Control o
ver e
mployees
Lesser
staff
0
2
4
6
8
10
12
NO. OF RESPONDENTS
As per Bar graph 4.20 the productivity level shown by ICICI Bank is comparatively
high because of excellent commitment level shown by bank staff to its works. Besides this lesser staff
strength than banking system is also responsible for this. Feedback of the respondents on this question
shown in bar graph 4.20.
CHAPTER V
42
SUMMARY
5.1 Conclusion:
Private bank in India has got a great response in term of services and quality banking .
Ratio analysis has been used in this research as it is considered as a powerful tool to analyze the
productivity and profitability of the various categories of banks. Profitability ratio provides the definitive
evaluation of the overall motivating force for any economic activity .Profitability acts as a yardstick to
measure the effectiveness and efficiency of business efforts for the growth and success .The common
denominator used for developing various profitability ratios is business volume (deposits + advances).
Productivity is measured in terms of the output per unit of input where output is taken as volume of the
business and input is taken as employee per bank during the year. Various tables show the calculation of
productivity and profitability of the ICICI Bank.
In order to remove subjectivity in banking sector, major steps like Prudential Norms,
Income Recognition Provisioning should have been taken. It is suggested that to correct the impact of
directed investments on profitability reserve requirements should be reduced.
The performance of bank is known through SWOT- Analysis. It mainly helps to know
the strength and weakness of bank and how to improve will be known through converting the
opportunities into strengths. It also helps for the competitive environment among the banks.
Strengths:
1.Availability of funds = Because of the recession in the economy and volatility in capital market,
consumers prefer to deposit their money in banks. ICICI bank is showing average growth of 19 % as
against 16 % in that regard of banking system. It also shows higher customers confidence placed in the
bank.
2.Banking network = ICICI bank is growing in number of branches that the banking system. ICICI bank
has a current network of 4050 branches, enabling it an access to large number of investors to improve its
profitability.
3.Strong capital base = as bank is showing consistent profitability, it helps to improve the capital base of
the bank to undertake various expansions programmes besides maintaining the interest of shareholders in
the scrip.
4.Low cost income rate= Because of lower cost – income ratio than the banking system ICICI bank has
43
been able to show more growth in profits than the overall baking system.
Weakness:
1.Loan deployment = Because of recession in the economy bank has huge idle resources to adversely
affect the return on assets and networth. This problem is further augmented by cautions approach towards
lending adopted by the bank management.
2.Less income from other sources = Since spreads are increasing slowly , it is necessary for the bank to
improve their income from other sources.
3.Rising cost income ratio = Since bank has not become as much techno savvy as many other banks, so at
a time when cost income ratio is going down in whole banking system it has gone up in ICICI bank
causing a serious concern for its future profitability.
Opportunities:
1. Universal banking = Banks have moved along the value chain to provide their customers more products
and services. The opening of the insurance sector for the banks further boosts this opportunity up.
2. Differential interest rates = As RBI control over banks reduces; they will have greater flexibility to fix
their own interest rate in deposits depending upon position of their profitability.
3.High household savings = Household savings have been increasing drastically over the years and
investments in capital marketers is becoming highly volatile, so banks have the opportunity to raise funds
at their expense.
4.Internet Banking = The advances in information technology has made banking far more easier. B- to –
B transactions can be effectively carried out through internet banking to considerably improve the quality
of services provided to customers.
5.3 Recommendations and Suggestions
Productivity and profitability are interrelated. Though productivity is not the sole
factor, it is an important factor influencing profitability. The key to increase profitability is increased
productivity. Public sector banks have not been as profitable as the other banks primarily because of two
reasons – Low Productivity and High Burden ratio. To overcome these drawbacks private banks should
chalk out a program to increase productivity. We have the following suggestions for the private sector
banks.
1.They should reduce overstaffing – Though public sector banks have been trying to reduce the number of
staff employed and has been successful in reducing the number from 8.73 lakhs to 7.52 lakhs, but they
need to improve further. They should go for a second round of VRS to reduce the staff further.
44
2.They should have a strategic tie up with the rural regional banks - for reaching the far-fetched areas
instead of opening branches themselves in the areas which cannot provide them the break even business.
3.They should embrace latest technology, as it will further help to improve profitability and productivity.
4.Banks should move towards the concept of universal banking by diversifying its operations in both
banking and non- banking sectors like entering into insurance arena.
5.Restructuring of bank branches in terms of closure or re- locating of loss making branches should be
taken at fast speed backed with deep analysis.
6.Developing a long term relationship with the customers requires an understanding of their concerns,
desires and motivation. The key to such a relationship is a change in culture of bank staff.
7.The surest way of containing NPAs is to prevent their occurrences, so proper risk management system
should be put in placed in banks and further, existing NPAs should be prevented from going down to
lower level.
5.2 SCOPE OF THE STUDY:
There are total 33 private banks in India for the present, so far for detailed
investigation ICICI Bank was selected for the study. ICICI bank is one of the four big banks in India. And
accounting for a greater proportion of total banking system. Besides this, ICICI bank is having good
geographical coverage and stock market presence so all the data needed for the study was easily available.
Because of limited time and resources the study was confined only to the state of Punjab so all the
branches of ICICI bank consistituted the population frame. By using simple convenience method .20
Branch officers were selected from the ICICI bank branches which were selected for the sample.
The study shows the role of profitability position of private sector banks in india. It
is the process of comparing income to output and determining how much profit was made during a
specific time period .A properly conducted profitability analysis provides invaluable evidence concerning
the earning potential of a company and the effectiveness of the management.
REFERENCES
45
Angadi V.B and Devraj V.J. (12008) Productivity and Profitability of Banks in India. Econ &
Pol18:160-170
Aggarwal M. (2012) Relative Productivity of Public Sector Banks: An Application of DEA. Ind Mgmt
Stud9:13-24.
Arora S. and Kaur S (2013) Financial Performance of Indian Banking Sector in Post-Reforms Era.The
Ind J of Comm59.
Arora U. and Verma R. (2005) Banking Sector Reforms and Performance Evaluation of Public Sector
Banks in India, Punj J of Buss Stud1:11-25.
Bodla, S.B.; and Verma, R. (2006) “Evaluating Performance of Banks Through CAMEL Model: A
Case Study of Bank Management”, The ICFAI J of Bank Mgmt3:49-63.
Chandan C and Rajput P. K. (2002) Profitability Analysis of Banks in India – A Multiple Regression
Approach, Ind Mgmt Stud J2:119-129.
Chawla A.S.(1988)Indian Banking towards 21st Century, Deep & Deep Publications Pvt.Ltd., New
Delhi.
Cheema C.S and Agarwal M. (2002) Productivity in Commercial Banks: A DEA Approach . The Buss
Rev8.
Chen,Y.T.; and Yeh, L.T. (1998), A Study of Efficiency Evaluation in Taiwan’s Banks.Intl J
of Service Industry Mgmt9: 402-415.
Das A (1997), Technical, Allocative and Scale Efficiency of Public Sector Banks in India,Res Bank of
Ind Occasional Papers. 18: 279-301.
Dwivedi A.K,Charyulu,Kumara.(2011).Efficiency of Indian Banking Industry in the PostReform Era.
Working paper of SSRN.
Sekhar S. D. (2007)Trends in Growth and Development: Nationalised Banks in India. The Ind
Banker11: 28-32.
Ramamurthy K. R.(1998),Profitability and Productivity in Indian Banking,Chartered Financial
Analyst,53-54
Reserve Bank of India(2012-13) Reports on Report on Trend and Progress of Banking in India,
Mumbai: RBI
Rajput, Nandita, Gupta, Monica, (2011). Impact of IT on Indian Commercial Banking Industry:
DEAAnalysis. Global J of Entp Info Sys:17-31
Singla H(2008), Financial Performance of Banks in India, The ICFAI J of Bank Mgmt.7:50-62
Uppal R. K. (2010) Indian Banking: Emerging Issues and Enhancing Competitive Efficiency. The IUP
J of Buss7: 71-82.
46
Verma, Goyal. Jindal (2013) Profitability of Commercial Banks After The Reforms: A Study Of
Measuring the Profitability and Productivity of Banking Industry: ACase Study of Selected Selected
Banks. Int J of Res in Fin & Markt 3:20-29.
VITA
47

Name of the student : Pragya Jain
Father’s name : Mr.Manoj Jain
Mother’s name : Mrs. Poonam Jain
Nationality : Indian
Date of birth : November 29, 1991
Permanent home address : 503, Housefed Flats,
Pakhowal Road,
Ludhiana
EDUCATIONAL QUALIFICATION
Bachelor degree : B.Com
University and year of award : Delhi University,2013
% marks : 73.5%
Master’s degree
OCPA : 7.66
Title of Master’s Thesis : “STUDY OF PRODUCTIVITY & PROFITABILITY OF
SELECTED BANK IN PUNJAB”
QUESTIONNARE
48
1. Is there any practice of Performance Budgeting for evaluating branch Performance ?
2. At what level these performance standards are fixed? (Please tick one)
Branch level
Regional level
Zonal level
National Level
Co-ordination Between some Levels(Specify)
3. On what basis these performance standards are fixed?
Past trends
Future Potentialities
Staff capabilities
Branch Location
All of the above
Any other (place Specify)
4. What areas of banking operations are important for standard fixation for Icici Bnak in your
Opinion ( Rank by Assigning 1 to most important and 8 to least important)
Profits
Deposits
Recovery
Advances
Foreign Exchange
Branch Expansion
Custom Service
Trained Manpower
5. At what time interval, performance of the branch is evaluated against the fixed standards?
Monthly
Quarterly
Half yearly
Yearly
49
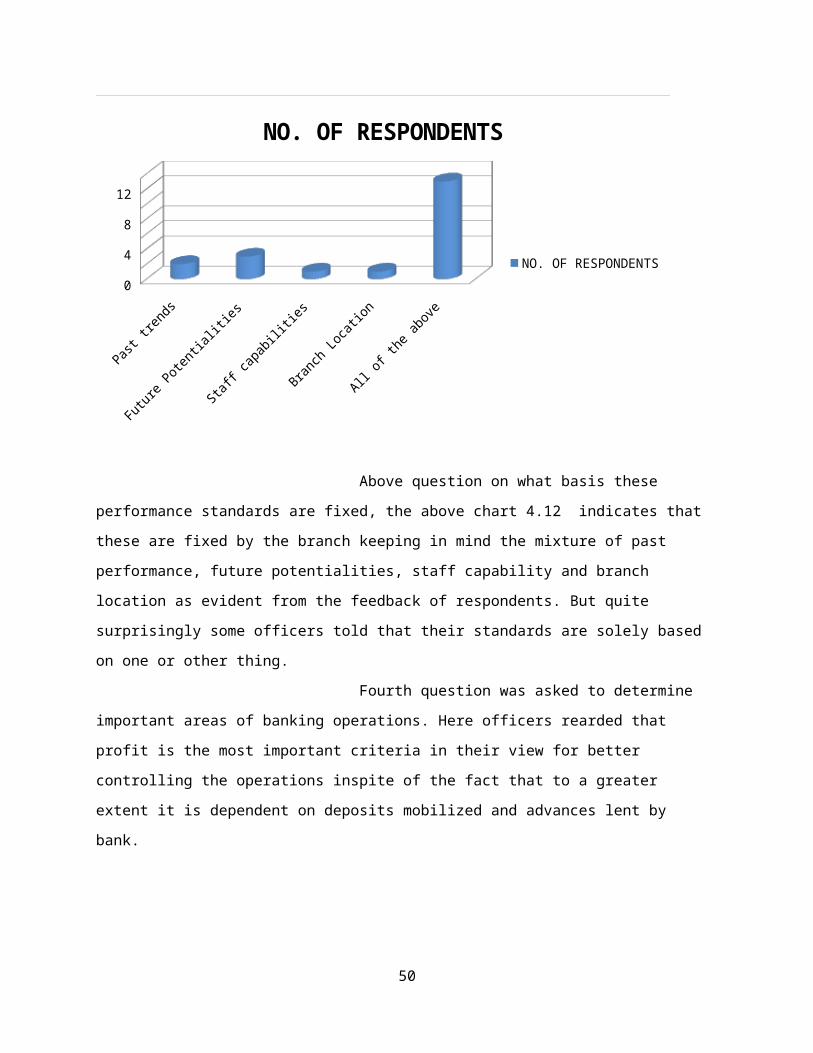
6. Can these performance standards be modified during Financial year depending upon earlier
performance shown by the branch? YES/NO
7. What factor is contributing to the rapid growth of ICICI BANK?
(Please tick the appropriate)
Strong capital base
Professional Staff
Bank Image
Higher Productivity
Branch network
Any other (please specify)
8. What is the most important reason that the ICICI BANK is having Lower NPA,s than the whole
Banking system? (Please tick the appropriate)
Proper credit appraisal mechanism
Complete follow up of the loan
Lower credit exposure to priority sector
Stringent collection efforts of employees
Pressure on guarantors
Any other ( Please specify)
9. What other services , do you think that ICICI Bank can best provide to its customers?
On line Trading
Stock Depository
Insurance
Management ,Financial consultancy
Credit rating
Underwriting
10. What other measure can be taken to further improve the profit performance of ICICI Bank?
Selective closure of loss making branches
Relocating of some branches
Cost cutting
50
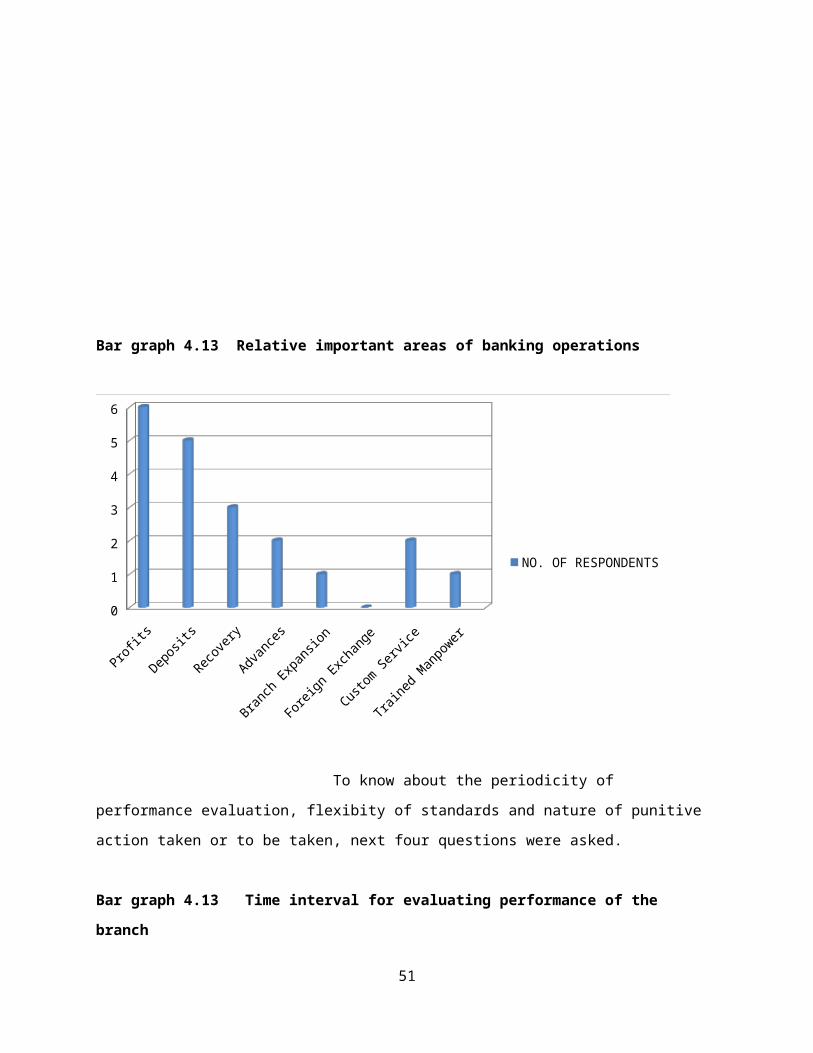
Technological advancement
Increasing accountability
Improving existing product mix
Reduction in Govt. Stake
Any other(Please specify)
11. What are your views about the manpower strength of your bank before VRS?
Heavily overstaffed
Overstaffed
Adequately staffed
Understaffed
Heavily understaffed
12. If ICICI BANK is having excess staff then what is the right step to reduce the flab of ICICI
Bank?
Voluntary retirement scheme
Compulsory retirement scheme
13. What factors are critical for high productivity of employees of ICICI bank ?
Commitment of employees
Lesser bureaucracy
Training of employees
Control over employees
Lesser staff
51