iame 2014 survey paper
DESCRIPTION
Factors influential to seaport pricingTRANSCRIPT
Port Infrastructure Pricing: Findings from a Survey of International SeaportsYapa Mahinda Bandara PhD Candidate, Department of Maritime and Logistics Management, Australian Maritime College, University of Tasmania [email protected]
Dr Hong-Oanh Nguyen
Senior Lecturer, Department of Maritime and Logistics Management, Australian Maritime College, University of Tasmania [email protected]
Dr Peggy Shu-Ling Chen
Senior Lecturer, Department of Maritime and Logistics Management, Australian Maritime College, University of Tasmania [email protected]
International Association of Maritime Economists Conference 2014, Norfolk, Virginia
Structure
• Introduction
• Research questions
• Data collection and method
• Analysis results
• Implications
• Conclusions
• Future research
Introduction• Transformation of seaport in to autonomous
business entities
• Emergence of landlord model ports
• Increasing importance of port pricing policy
• Port infrastructure tariffs as one of the major source of revenue for ports
Port infrastructure pricing
• What knowledge port authorities possess and to what extent they are applied in port pricing
• What factors they (need to) consider in designing infrastructure tariffs
• What factors influence the tariff practices of ports
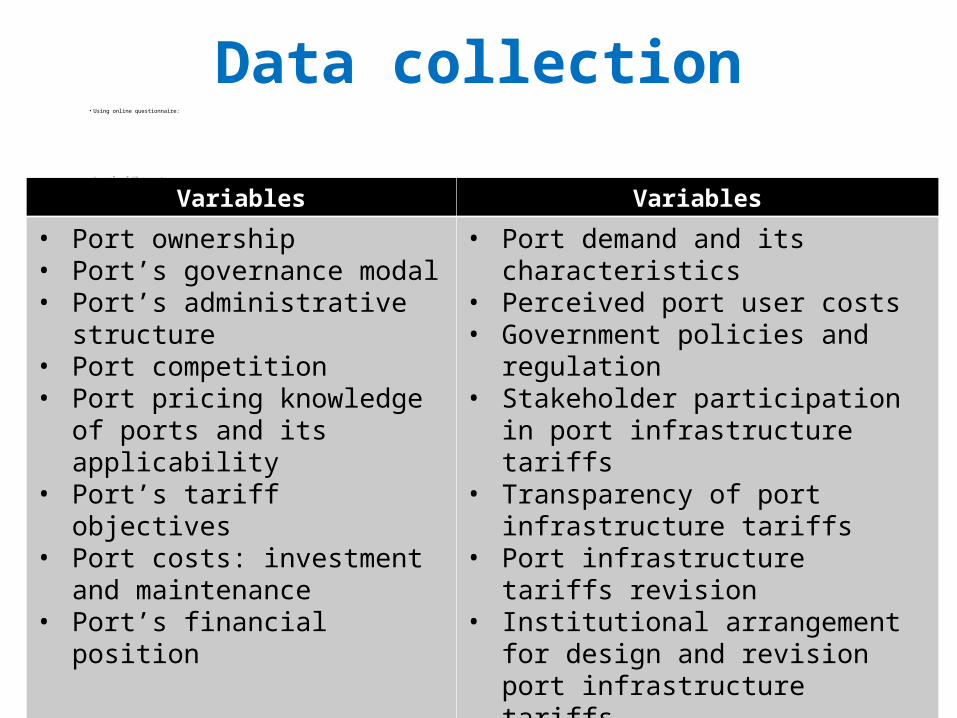
Data collection• Using online questionnaire:
• A sample of 67 seaports
Variables Variables
• Port ownership • Port’s governance modal• Port’s administrative structure• Port competition• Port pricing knowledge of ports
and its applicability• Port’s tariff objectives• Port costs: investment and
maintenance• Port’s financial position
• Port demand and its characteristics• Perceived port user costs• Government policies and regulation• Stakeholder participation in port
infrastructure tariffs• Transparency of port infrastructure
tariffs• Port infrastructure tariffs revision • Institutional arrangement for design
and revision port infrastructure tariffs
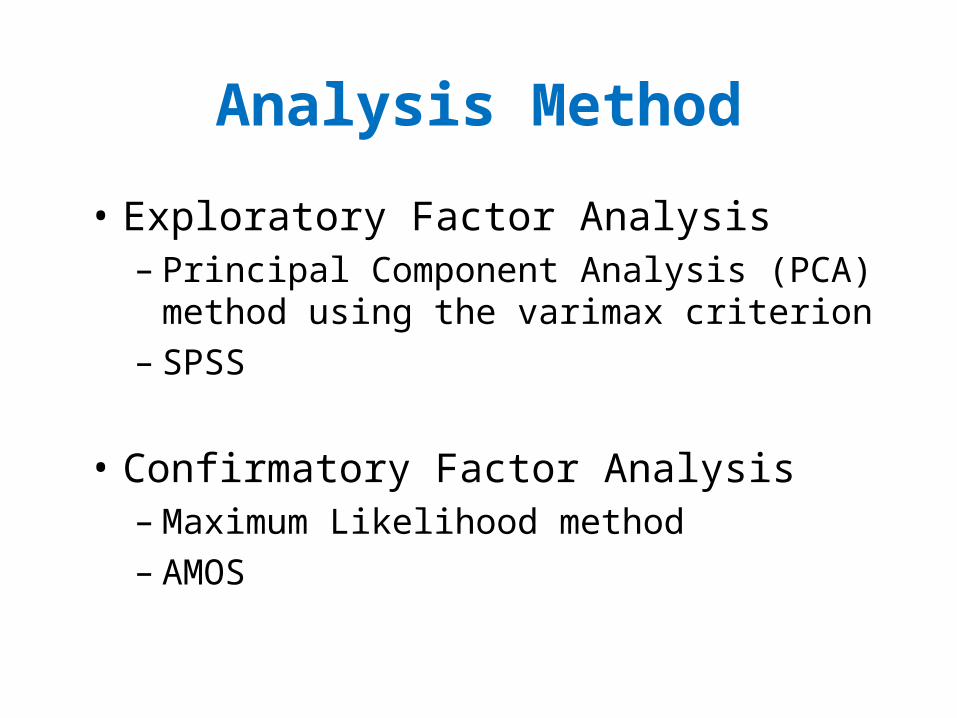
Analysis Method
• Exploratory Factor Analysis– Principal Component Analysis (PCA)
method using the varimax criterion – SPSS
• Confirmatory Factor Analysis– Maximum Likelihood method– AMOS
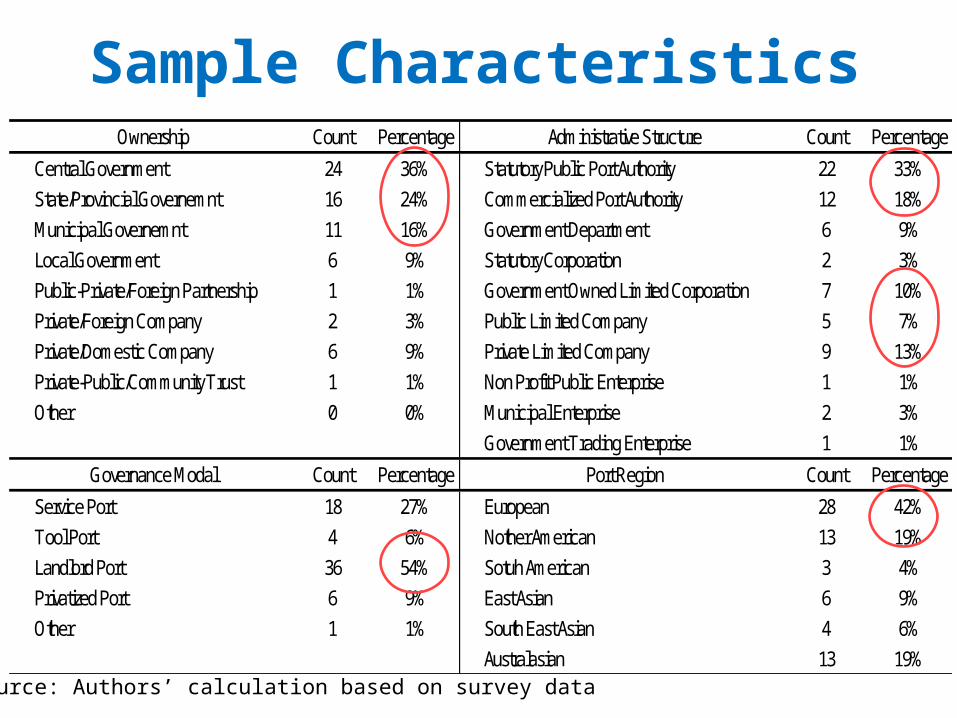
Sample CharacteristicsOwnership Count Percentage Administrative Structure Count Percentage
Central Government 24 36% Statutory Public Port Authority 22 33%State/Provincial Governemnt 16 24% Commercialized Port Authority 12 18%Municipal Governemnt 11 16% Government Department 6 9%Local Government 6 9% Statutory Corporation 2 3%Public-Private/Foreign Partnership 1 1% Government Owned Limited Corporation 7 10%Private/Foreign Company 2 3% Public Limited Company 5 7%Private/Domestic Company 6 9% Private Limited Company 9 13%Private-Public/Community T rust 1 1% Non Profit Public Enterprise 1 1%Other 0 0% Municipal Enterprise 2 3%
Government T rading Enterprise 1 1%
Governance Modal Count Percentage Port Region Count Percentage
Service Port 18 27% European 28 42%Tool Port 4 6% Nother American 13 19%Landlord Port 36 54% Sotuh American 3 4%Privatized Port 6 9% East Asian 6 9%Other 1 1% South East Asian 4 6%
Australasian 13 19%
Source: Authors’ calculation based on survey data
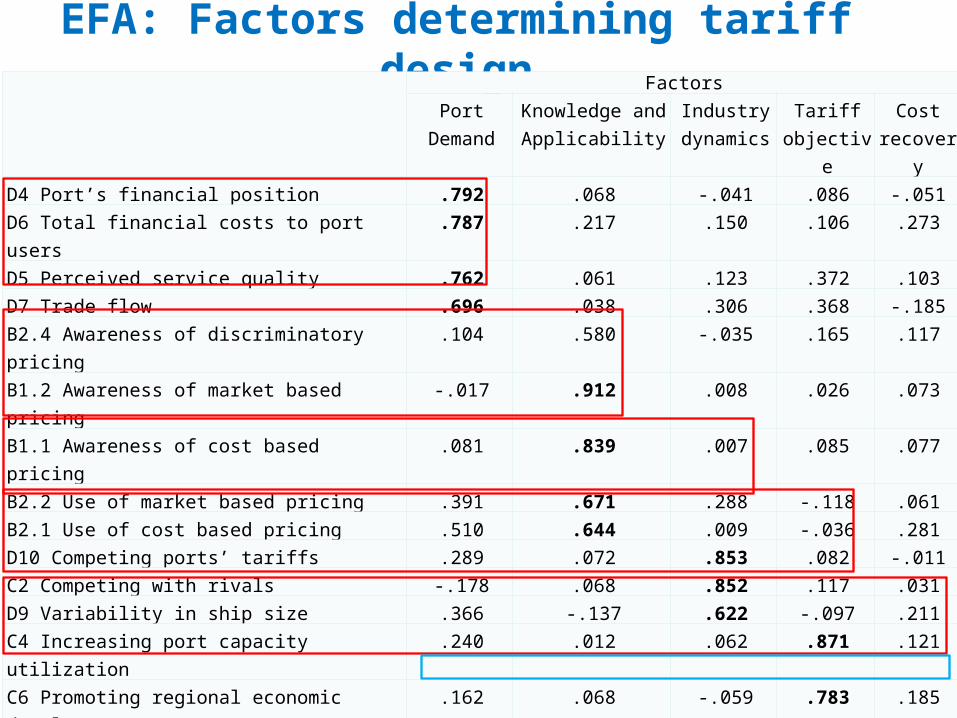
EFA: Factors determining tariff design
Factors
Port
Demand
Knowledge and
Applicability
Industry
dynamics
Tariff
objective
Cost
recovery
D4 Port’s financial position .792 .068 -.041 .086 -.051
D6 Total financial costs to port users .787 .217 .150 .106 .273
D5 Perceived service quality .762 .061 .123 .372 .103
D7 Trade flow .696 .038 .306 .368 -.185
B2.4 Awareness of discriminatory pricing .104 .580 -.035 .165 .117
B1.2 Awareness of market based pricing -.017 .912 .008 .026 .073
B1.1 Awareness of cost based pricing .081 .839 .007 .085 .077
B2.2 Use of market based pricing .391 .671 .288 -.118 .061
B2.1 Use of cost based pricing .510 .644 .009 -.036 .281
D10 Competing ports’ tariffs .289 .072 .853 .082 -.011
C2 Competing with rivals -.178 .068 .852 .117 .031
D9 Variability in ship size .366 -.137 .622 -.097 .211
C4 Increasing port capacity utilization .240 .012 .062 .871 .121
C6 Promoting regional economic development .162 .068 -.059 .783 .185
C3 Attracting specific cargo and port users .042 .247 .520 .669 .045
C1 Recovering investment costs -.014 .076 .019 .112 .902
C5 Covering operational costs .007 .182 .093 .255 .739
D1 Infrastructure investment cost .500 .144 .072 -.038 .685
Cronbach's Alpha 0.848 0.803 0.730 0.784 0.762
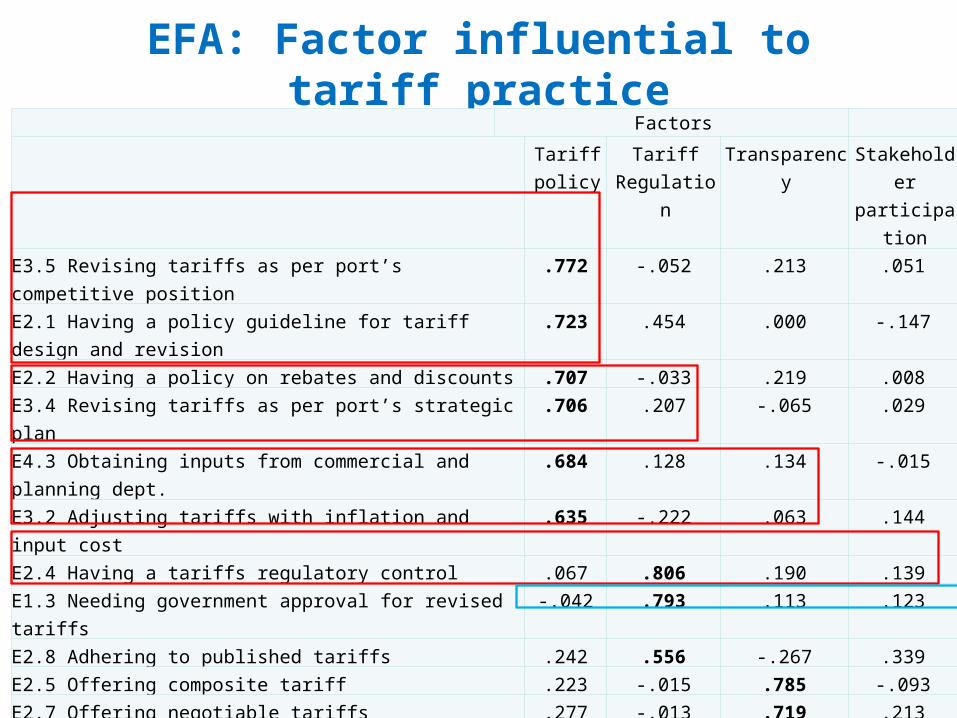
EFA: Factor influential to tariff practice Factors
Tariff
policy
Tariff
Regulation
Transparency Stakeholder
participation
E3.5 Revising tariffs as per port’s competitive position .772 -.052 .213 .051
E2.1 Having a policy guideline for tariff design and revision .723 .454 .000 -.147
E2.2 Having a policy on rebates and discounts .707 -.033 .219 .008
E3.4 Revising tariffs as per port’s strategic plan .706 .207 -.065 .029
E4.3 Obtaining inputs from commercial and planning dept. .684 .128 .134 -.015
E3.2 Adjusting tariffs with inflation and input cost .635 -.222 .063 .144
E2.4 Having a tariffs regulatory control .067 .806 .190 .139
E1.3 Needing government approval for revised tariffs -.042 .793 .113 .123
E2.8 Adhering to published tariffs .242 .556 -.267 .339
E2.5 Offering composite tariff .223 -.015 .785 -.093
E2.7 Offering negotiable tariffs .277 -.013 .719 .213
E2.9 Offering a lump sum port fee -.039 .341 .704 .184
E1.4 Obtaining feedback from port users .032 .159 .014 .926
E1.5 Obtaining feedback from port operators .007 .199 .236 .870
Reliability - Cronbach's Alpha 0.807 0.670 0.678 0.873Extraction Method: Principal Component AnalysisRotation Method: Varimax with Kaiser Normalization
a. Rotation converged in 5 iterationsKaiser–Meyer–Olkin measure of sampling adequacy is 0.683
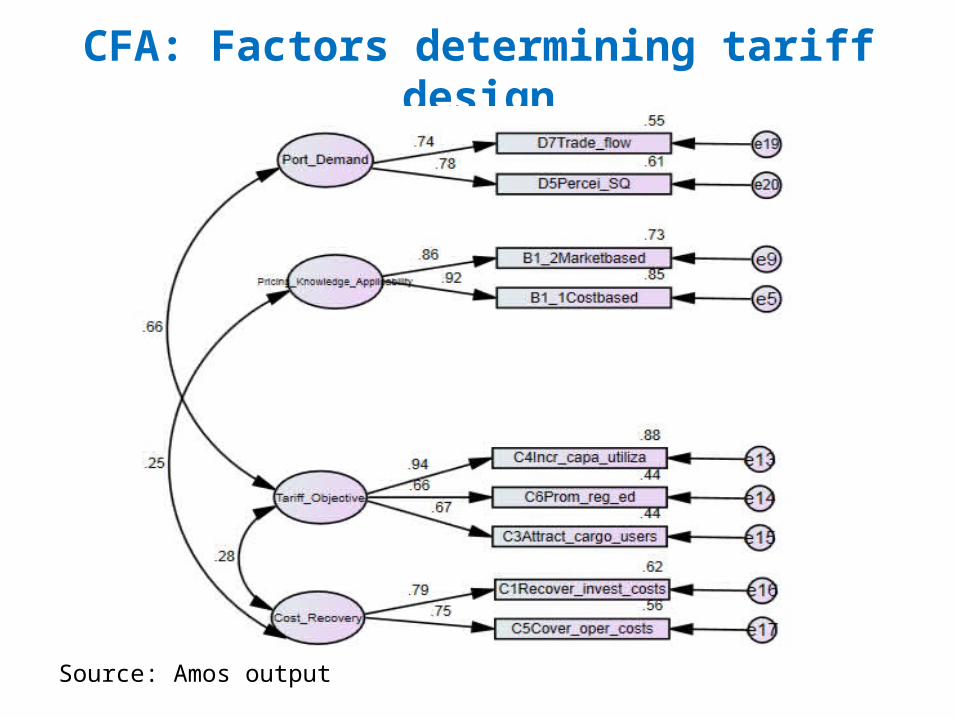
CFA: Factors determining tariff design
Source: Amos output
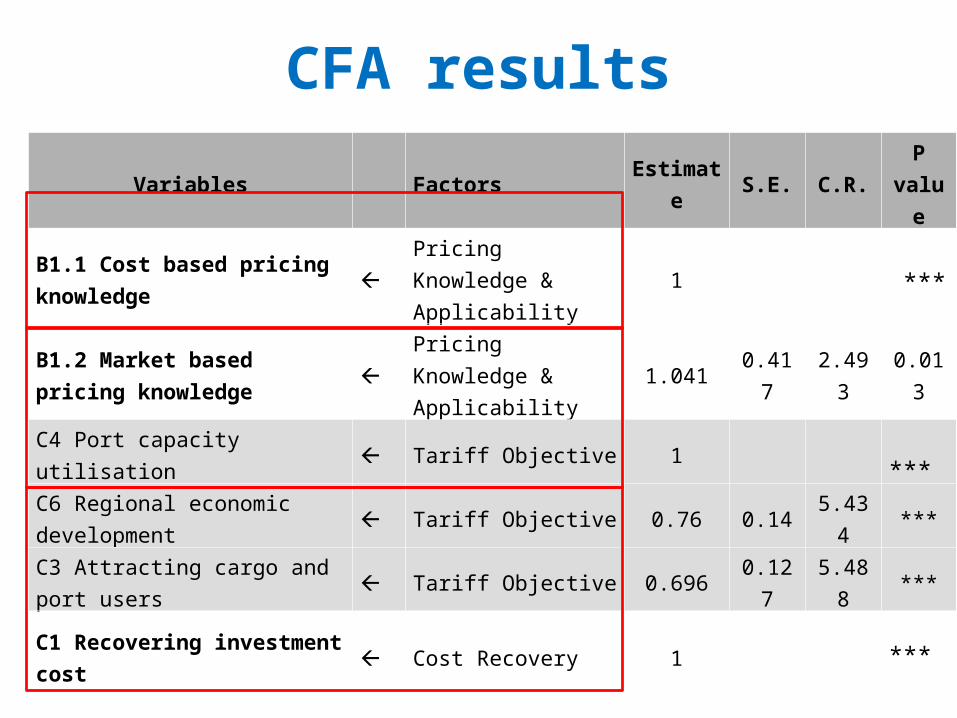
CFA results
Variables Factors Estimate S.E. C.R.P
value
B1.1 Cost based pricing
knowledge
Pricing Knowledge &
Applicability1
***
B1.2 Market based pricing
knowledge
Pricing Knowledge &
Applicability1.041 0.417 2.493 0.013
C4 Port capacity utilisation Tariff Objective 1 ***C6 Regional economic
development Tariff Objective 0.76 0.14 5.434 ***
C3 Attracting cargo and port
users Tariff Objective 0.696 0.127 5.488 ***
C1 Recovering investment
cost Cost Recovery 1
***
C5 Covering operational cost Cost Recovery 1 ***
D7 Trade flow Port Demand 0.902 0.207 4.367 ***
D5 Perceived service quality Port Demand 1 ***
Implications: Ports• need to account for port demand and its variability• need to consider total trade flow, service quality
when deciding the level of port infrastructure charge
• needs to look at the available knowledge base in the port organization and makes use of them in the tariff design process
• need to align infrastructure tariff design with the type of cargo, in turn which determines the type of port user
Implications: Ports….cont.• aim to recover the cost associated with
investment and operation of port infrastructure• need to establish a port tariff policy in which the
tariff designing and revision process is clearly outlined
• need to obtain the participation of various stakeholders in tariff revision process
• need to lift the level of transparency of port tariffs setting, thus they will not be subjected to criticism
Conclusion
• Factors affecting port infrastructure design: – port demand – port pricing knowledge and applicability,– Port competition and vessel size – tariff objective of the port and – consideration for cost recovery
Conclusion
• Factors influential to port infrastructure tariff practices: – the existence of a port infrastructure tariff
policy, – tariff regulation, – various stakeholders’ participation in tariff
revision and – the level of transparency
Future research
• look into the analysis of infrastructure tariff design in terms of different governance models
• individual port infrastructure charges can be empirically studied separately to identify specific nature of each charge in terms of its design and determination

THANK YOU• Reviewers of the research paper
• Special acknowledgement to port managers/authorities for taking part in the survey
• AusAid-Australia Award for funding