iab report on 2017 digital advertising spend the … · is now also visible with other media types...
TRANSCRIPT
IAB Report on 2017 Digital Advertising SpendThe NetherlandsPublished: April 2018
IAB Report on 2017 Digital Advertising Spend
2
Since 2010, IAB and Deloitte have been reporting on the Digital advertising spend in The Netherlands by publishing the Digital Ad Spend Study. The content of this full year study is driven by data and information gathered directly from the digital community, including publishers, advertisers and media planners.
The market analysis, in this 2017 report, is based on financial data supplied by 36 companies, including publishers, media agencies, ad networks and programmatic platforms. In this edition, for the first time, we report Digital Out of Home and Digital Audio Advertising as separate categories within the Digital Ad Spend.
Introduction
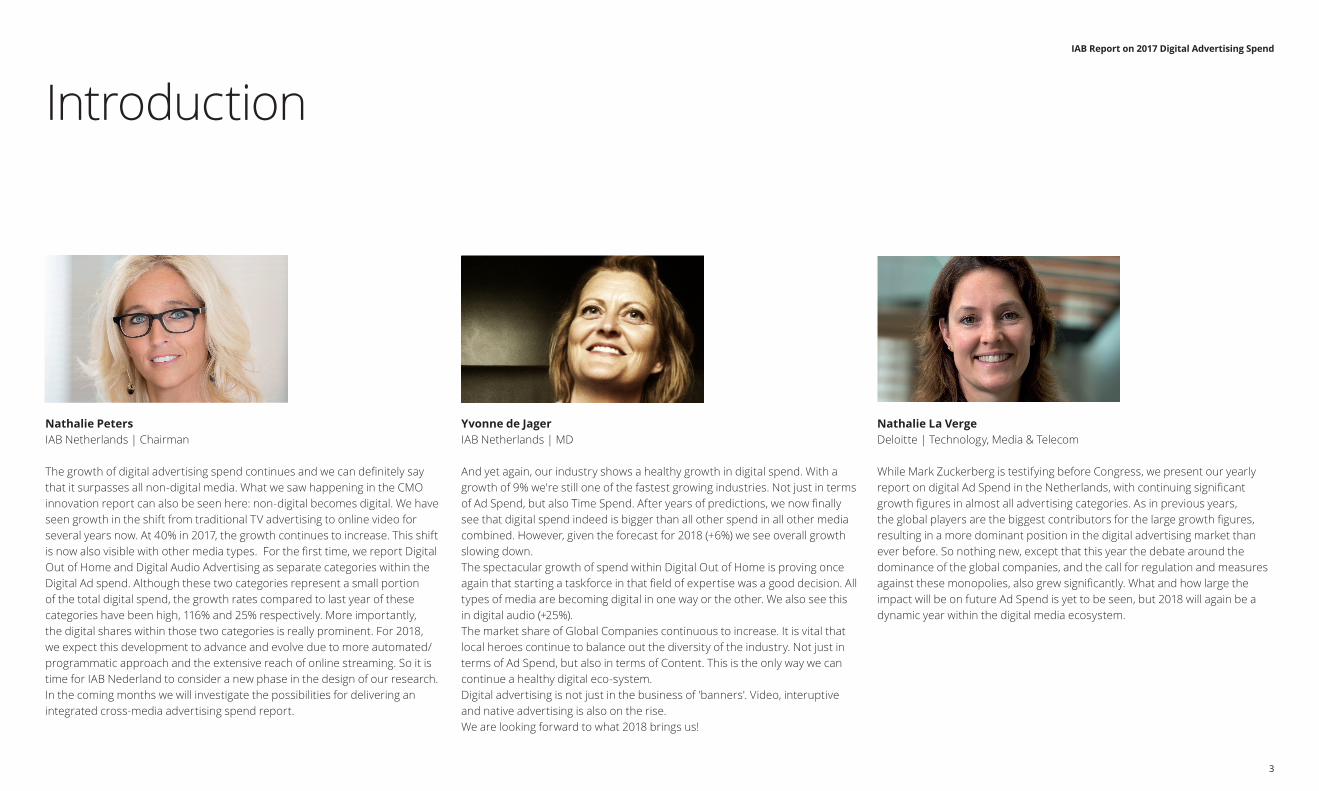
Nathalie PetersIAB Netherlands | Chairman
The growth of digital advertising spend continues and we can definitely say that it surpasses all non-digital media. What we saw happening in the CMO innovation report can also be seen here: non-digital becomes digital. We have seen growth in the shift from traditional TV advertising to online video for several years now. At 40% in 2017, the growth continues to increase. This shift is now also visible with other media types. For the first time, we report Digital Out of Home and Digital Audio Advertising as separate categories within the Digital Ad spend. Although these two categories represent a small portion of the total digital spend, the growth rates compared to last year of these categories have been high, 116% and 25% respectively. More importantly, the digital shares within those two categories is really prominent. For 2018, we expect this development to advance and evolve due to more automated/programmatic approach and the extensive reach of online streaming. So it is time for IAB Nederland to consider a new phase in the design of our research. In the coming months we will investigate the possibilities for delivering an integrated cross-media advertising spend report.
Yvonne de JagerIAB Netherlands | MD
And yet again, our industry shows a healthy growth in digital spend. With a growth of 9% we're still one of the fastest growing industries. Not just in terms of Ad Spend, but also Time Spend. After years of predictions, we now finally see that digital spend indeed is bigger than all other spend in all other media combined. However, given the forecast for 2018 (+6%) we see overall growth slowing down.The spectacular growth of spend within Digital Out of Home is proving once again that starting a taskforce in that field of expertise was a good decision. All types of media are becoming digital in one way or the other. We also see this in digital audio (+25%).The market share of Global Companies continuous to increase. It is vital that local heroes continue to balance out the diversity of the industry. Not just in terms of Ad Spend, but also in terms of Content. This is the only way we can continue a healthy digital eco-system. Digital advertising is not just in the business of 'banners'. Video, interuptive and native advertising is also on the rise. We are looking forward to what 2018 brings us!
Nathalie La VergeDeloitte | Technology, Media & Telecom
While Mark Zuckerberg is testifying before Congress, we present our yearly report on digital Ad Spend in the Netherlands, with continuing significant growth figures in almost all advertising categories. As in previous years, the global players are the biggest contributors for the large growth figures, resulting in a more dominant position in the digital advertising market than ever before. So nothing new, except that this year the debate around the dominance of the global companies, and the call for regulation and measures against these monopolies, also grew significantly. What and how large the impact will be on future Ad Spend is yet to be seen, but 2018 will again be a dynamic year within the digital media ecosystem.
IAB Report on 2017 Digital Advertising Spend
3
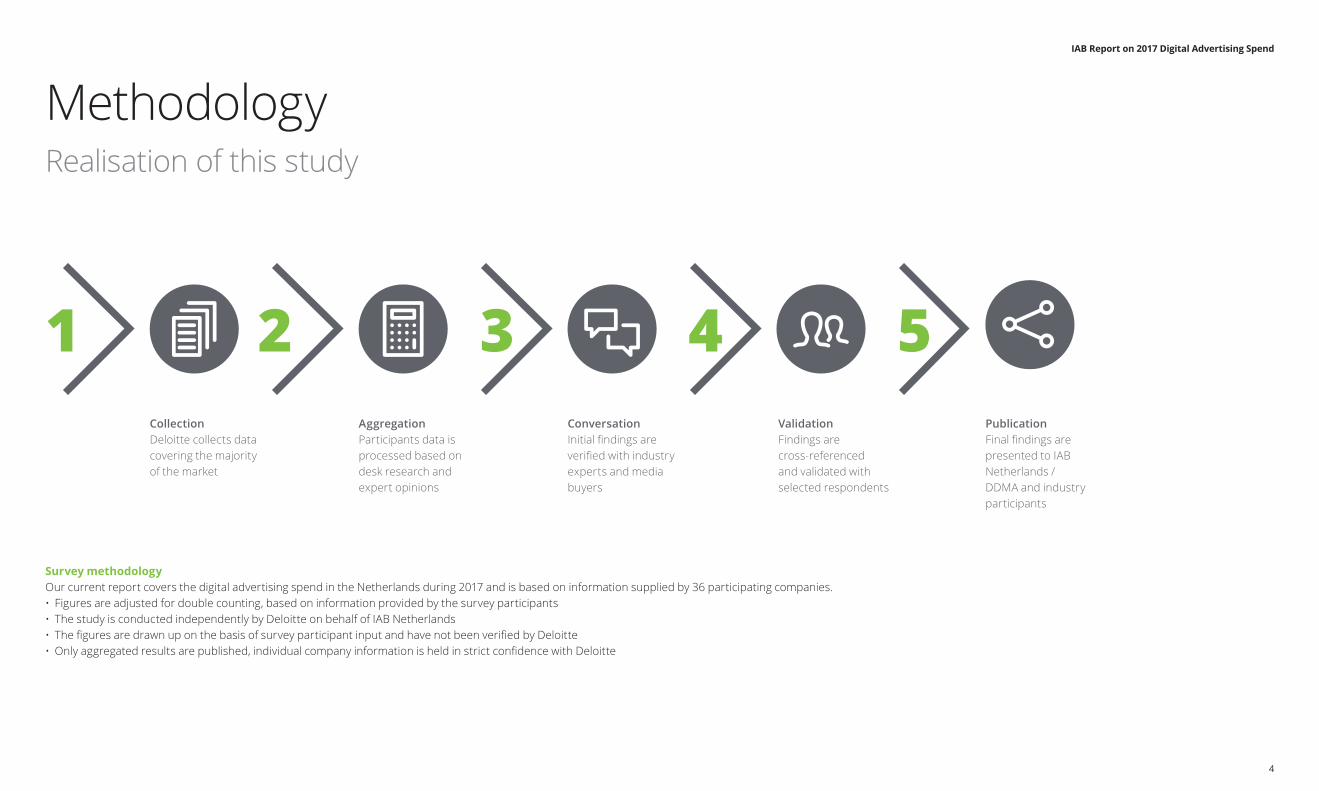
CollectionDeloitte collects data covering the majority of the market
AggregationParticipants data is processed based on desk research and expert opinions
ConversationInitial findings are verified with industry experts and media buyers
ValidationFindings are cross-referenced and validated with selected respondents
PublicationFinal findings are presented to IAB Netherlands /DDMA and industry participants
2 3 4 51
Survey methodologyOur current report covers the digital advertising spend in the Netherlands during 2017 and is based on information supplied by 36 participating companies.• Figures are adjusted for double counting, based on information provided by the survey participants• The study is conducted independently by Deloitte on behalf of IAB Netherlands• The figures are drawn up on the basis of survey participant input and have not been verified by Deloitte• Only aggregated results are published, individual company information is held in strict confidence with Deloitte
IAB Report on 2017 Digital Advertising Spend
4
Methodology Realisation of this study
PublicationFinal findings are presented to IAB Netherlands and industry participants
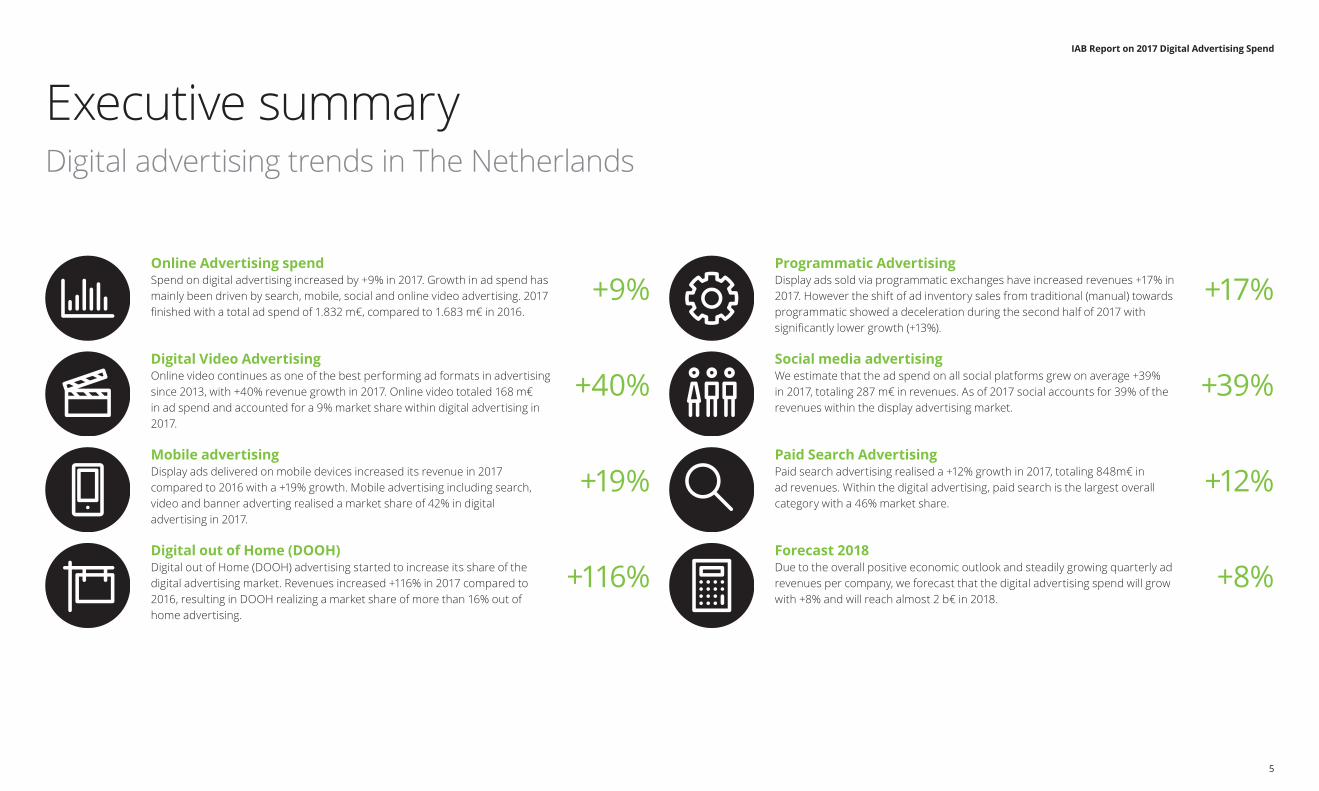
Online Advertising spendSpend on digital advertising increased by +9% in 2017. Growth in ad spend has mainly been driven by search, mobile, social and online video advertising. 2017 finished with a total ad spend of 1.832 m€, compared to 1.683 m€ in 2016.
Digital Video AdvertisingOnline video continues as one of the best performing ad formats in advertising since 2013, with +40% revenue growth in 2017. Online video totaled 168 m€ in ad spend and accounted for a 9% market share within digital advertising in 2017.
Mobile advertisingDisplay ads delivered on mobile devices increased its revenue in 2017 compared to 2016 with a +19% growth. Mobile advertising including search, video and banner adverting realised a market share of 42% in digital advertising in 2017.
Digital out of Home (DOOH)Digital out of Home (DOOH) advertising started to increase its share of the digital advertising market. Revenues increased +116% in 2017 compared to 2016, resulting in DOOH realizing a market share of more than 16% out of home advertising.
Programmatic AdvertisingDisplay ads sold via programmatic exchanges have increased revenues +17% in 2017. However the shift of ad inventory sales from traditional (manual) towards programmatic showed a deceleration during the second half of 2017 with significantly lower growth (+13%).
Social media advertisingWe estimate that the ad spend on all social platforms grew on average +39% in 2017, totaling 287 m€ in revenues. As of 2017 social accounts for 39% of the revenues within the display advertising market.
Paid Search AdvertisingPaid search advertising realised a +12% growth in 2017, totaling 848m€ in ad revenues. Within the digital advertising, paid search is the largest overall category with a 46% market share.
Forecast 2018Due to the overall positive economic outlook and steadily growing quarterly ad revenues per company, we forecast that the digital advertising spend will grow with +8% and will reach almost 2 b€ in 2018.
IAB Report on 2017 Digital Advertising Spend
5
Executive summary Digital advertising trends in The Netherlands
+9% +17%
+40% +39%
+116% +8%
+19% +12%
IAB Report on 2017 Digital Advertising Spend
6
Economic context
IAB Report on 2017 Digital Advertising Spend
7
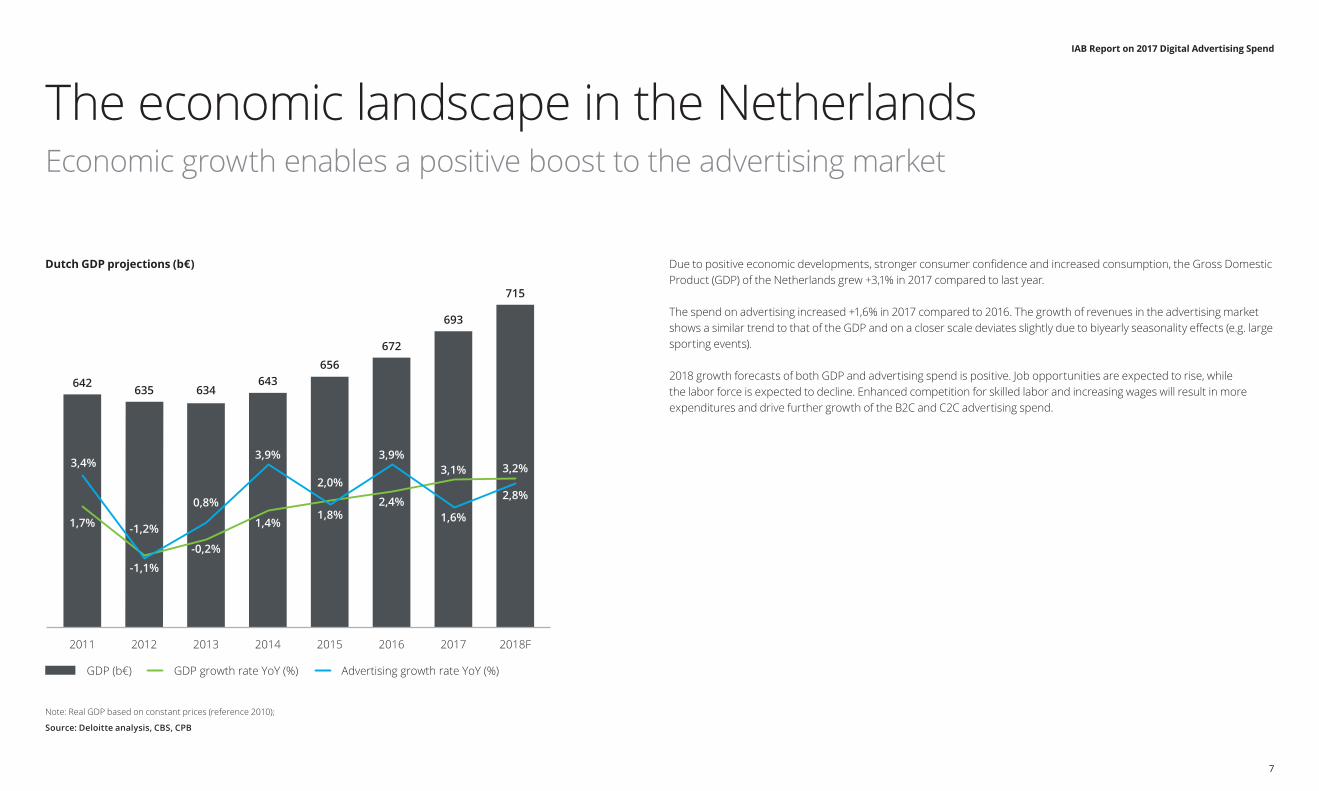
Dutch GDP projections (b€)
Note: Real GDP based on constant prices (reference 2010);
Source: Deloitte analysis, CBS, CPB
Due to positive economic developments, stronger consumer confidence and increased consumption, the Gross Domestic Product (GDP) of the Netherlands grew +3,1% in 2017 compared to last year.
The spend on advertising increased +1,6% in 2017 compared to 2016. The growth of revenues in the advertising market shows a similar trend to that of the GDP and on a closer scale deviates slightly due to biyearly seasonality effects (e.g. large sporting events).
2018 growth forecasts of both GDP and advertising spend is positive. Job opportunities are expected to rise, while the labor force is expected to decline. Enhanced competition for skilled labor and increasing wages will result in more expenditures and drive further growth of the B2C and C2C advertising spend.
The economic landscape in the NetherlandsEconomic growth enables a positive boost to the advertising market
2011 2012 2013 2014 2015 2016 2017 2018F
GDP (b€) GDP growth rate YoY (%)
642 635 634643
656672
693
Advertising growth rate YoY (%)
1,7%
-1,1%
-0,2%
1,4%
2,0%
2,4%
3,1% 3,2%3,4%
-1,2%
0,8%
3,9%
1,8%
3,9%
1,6%
2,8%
715
IAB Report on 2017 Digital Advertising Spend
8
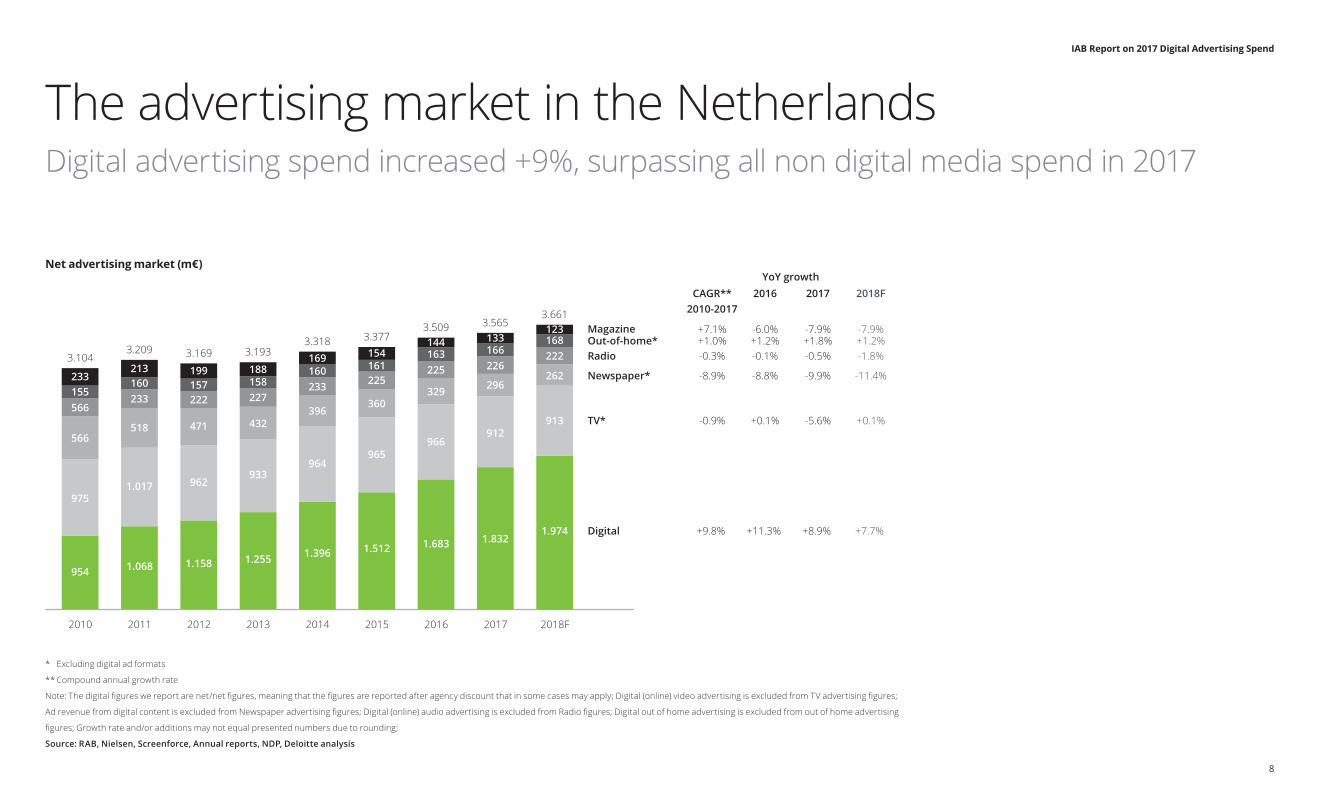
Net advertising market (m€)
* Excluding digital ad formats
** Compound annual growth rate
Note: The digital figures we report are net/net figures, meaning that the figures are reported after agency discount that in some cases may apply; Digital (online) video advertising is excluded from TV advertising figures;
Ad revenue from digital content is excluded from Newspaper advertising figures; Digital (online) audio advertising is excluded from Radio figures; Digital out of home advertising is excluded from out of home advertising
figures; Growth rate and/or additions may not equal presented numbers due to rounding;
Source: RAB, Nielsen, Screenforce, Annual reports, NDP, Deloitte analysis
The advertising market in the NetherlandsDigital advertising spend increased +9%, surpassing all non digital media spend in 2017
2010 2011 2012 2013
954 1.068 1.158 1.255
9751.017 962
933
566518 471 432
2014
1.396
964
396
2015 2016 2017 2018F
1.512
965
360
1.683
966
329
1.832
912
296
1.974
913
262
566155233
233160213
222157199
227158188
233160169
225161154
225163144
226166133
222168123 Magazine
Out-of-home*Radio
Newspaper*
TV*
Digital
YoY growth
-6.0%
2016
+0.1%
+11.3%
-7.9%
2018F
+0.1%
+7.7%
+7.1%
CAGR**2010-2017
-0.9%
+9.8%
-7.9%+1.2% +1.2%+1.0% +1.8%-0.1% -1.8%-0.3% -0.5%
-8.8% -11.4%-8.9% -9.9%
2017
-5.6%
+8.9%
3.1043.209 3.169 3.193
3.318 3.3773.509 3.565
3.661
IAB Report on 2017 Digital Advertising Spend
9
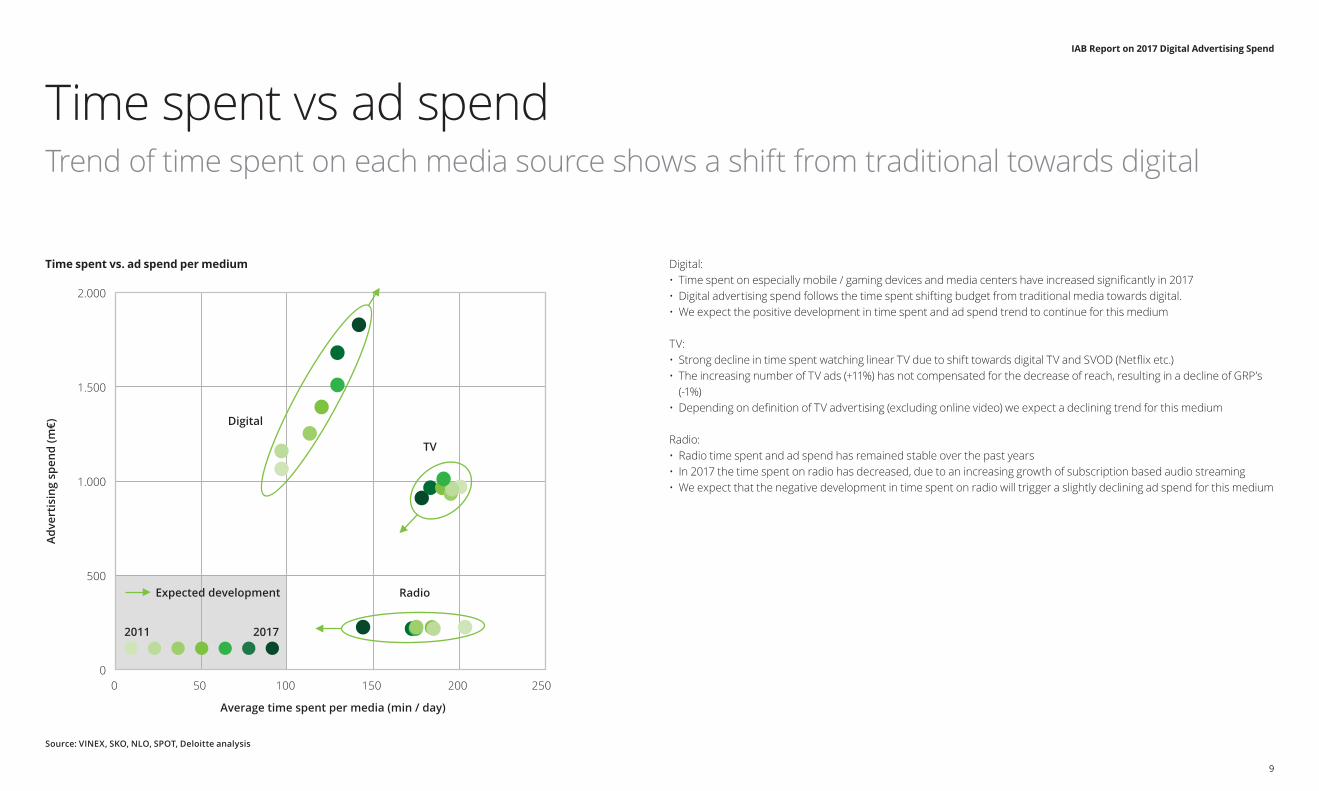
Time spent vs. ad spend per medium
Source: VINEX, SKO, NLO, SPOT, Deloitte analysis
Digital:• Time spent on especially mobile / gaming devices and media centers have increased significantly in 2017 • Digital advertising spend follows the time spent shifting budget from traditional media towards digital.• We expect the positive development in time spent and ad spend trend to continue for this medium
TV:• Strong decline in time spent watching linear TV due to shift towards digital TV and SVOD (Netflix etc.)• The increasing number of TV ads (+11%) has not compensated for the decrease of reach, resulting in a decline of GRP’s
(-1%)• Depending on definition of TV advertising (excluding online video) we expect a declining trend for this medium
Radio:• Radio time spent and ad spend has remained stable over the past years• In 2017 the time spent on radio has decreased, due to an increasing growth of subscription based audio streaming• We expect that the negative development in time spent on radio will trigger a slightly declining ad spend for this medium
Time spent vs ad spendTrend of time spent on each media source shows a shift from traditional towards digital
0
500
1.000
1.500
2.000
0 50 100 150 200 250
Digital
TV
Radio
Average time spent per media (min / day)
Adve
rtis
ing
spen
d (m
€)
Expected development
20172011
IAB Report on 2017 Digital Advertising Spend
10
Digital advertising
IAB Report on 2017 Digital Advertising Spend
11
Digital ad spend 2016 Digital ad spend 2017
Note: The figures we report are net/net figures, meaning that the figures are reported after agency discount that in some cases may apply; Search
numbers are estimated based on annual reports, media buyers and media agencies feedback; Classifieds, directories & listings are based on a limited
number of data points; Growth rate and/or additions may not equal presented numbers due to rounding off; Due to limited data points in the other and
classifieds category we are unable to separate the mobile share within these categories
Source: Survey respondents, Media buyers, Annual reports, Deloitte analysis
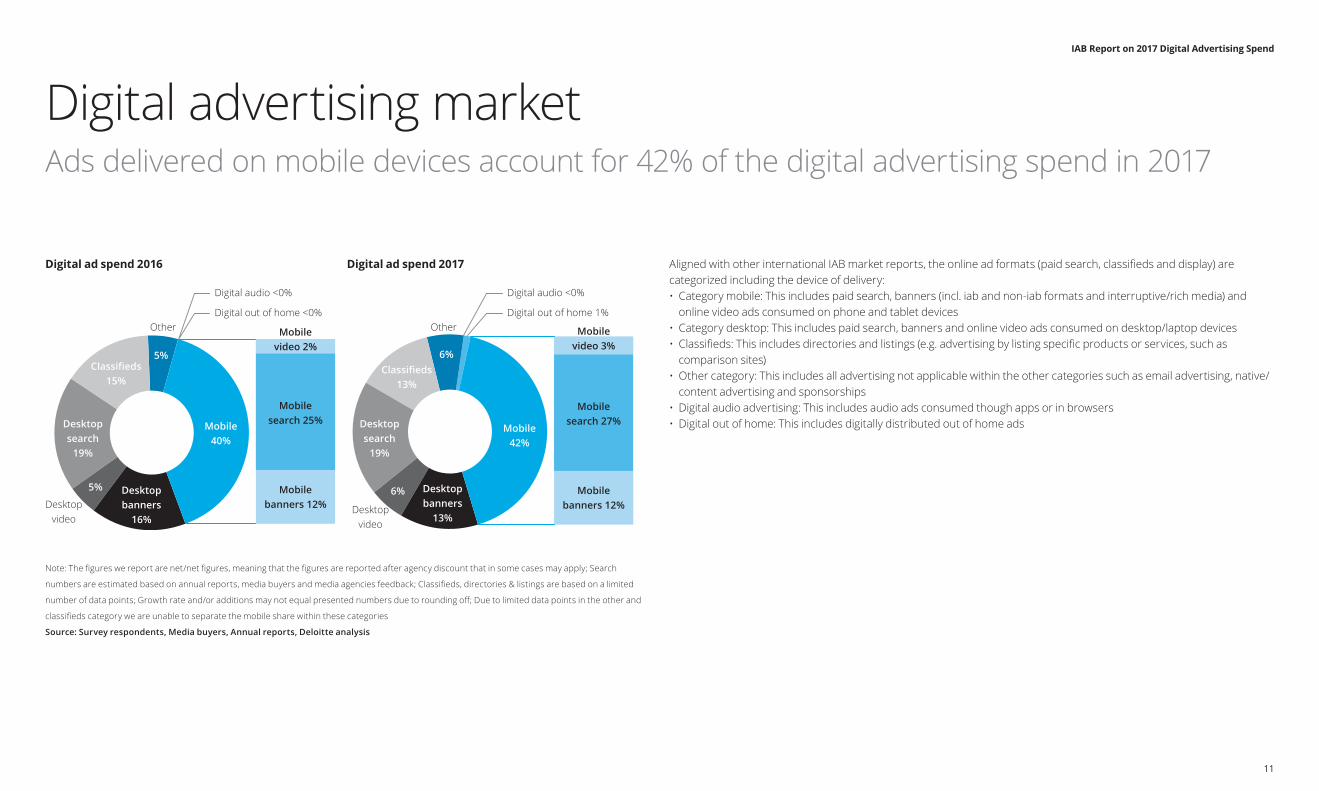
Aligned with other international IAB market reports, the online ad formats (paid search, classifieds and display) are categorized including the device of delivery:• Category mobile: This includes paid search, banners (incl. iab and non-iab formats and interruptive/rich media) and
online video ads consumed on phone and tablet devices • Category desktop: This includes paid search, banners and online video ads consumed on desktop/laptop devices• Classifieds: This includes directories and listings (e.g. advertising by listing specific products or services, such as
comparison sites)• Other category: This includes all advertising not applicable within the other categories such as email advertising, native/
content advertising and sponsorships• Digital audio advertising: This includes audio ads consumed though apps or in browsers• Digital out of home: This includes digitally distributed out of home ads
Digital advertising marketAds delivered on mobile devices account for 42% of the digital advertising spend in 2017
Mobile42%
Desktopbanners
13%
6%
Desktopsearch
19%
Classifieds13%
6%
Mobile40%
Desktopbanners
16%
5%
Desktopsearch
19%
Classifieds15%
5%
Mobilebanners 12%
Mobilesearch 27%
Mobilevideo 3%
Mobilebanners 12%
Mobilesearch 25%
Mobilevideo 2%
Desktopvideo
Desktopvideo
Other Other
Digital audio <0%
Digital out of home <0%
Digital audio <0%
Digital out of home 1%
IAB Report on 2017 Digital Advertising Spend
12
Online advertising market (m€)
Note: The figures we report are net/net figures, meaning that the figures are reported after agency discount that in some cases may apply; Search
numbers are estimated based on annual reports, media buyers and media agencies feedback; Classifieds, directories & listings are based on a limited
number of data points; Shares and/or additions may not equal presented numbers due to rounding off;
Source: Survey respondents, Media buyers, Annual reports, Deloitte analysis
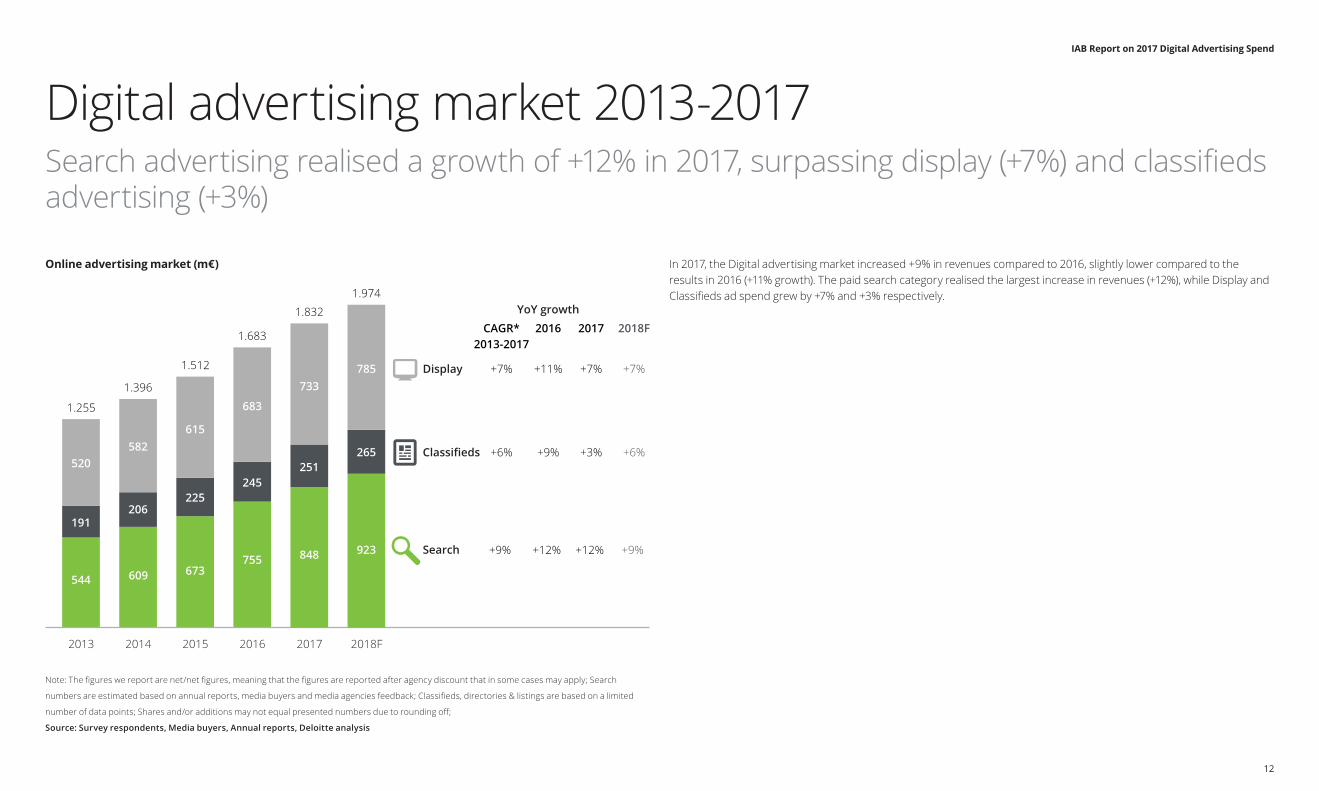
In 2017, the Digital advertising market increased +9% in revenues compared to 2016, slightly lower compared to the results in 2016 (+11% growth). The paid search category realised the largest increase in revenues (+12%), while Display and Classifieds ad spend grew by +7% and +3% respectively.
Digital advertising market 2013-2017Search advertising realised a growth of +12% in 2017, surpassing display (+7%) and classifieds advertising (+3%)
2013 2014 2015 2016
544 609 673755
191206
225245
520582
615
683
Display
Classifieds
Search
2017
848
251
733
2018F
923
265
785
YoY growth
+11%
2016
+9%
+12%
+7%
2018F
+6%
+9%
+7%
CAGR*2013-2017
+6%
+9%
+7%
2017
+3%
+12%
1.255
1.396
1.512
1.683
1.832
1.974
IAB Report on 2017 Digital Advertising Spend
13
Average Digital advertising revenue growth per company size in 2017
Note: Revenue growth rate is calculated on a L4L basis; Global companies include global search and social publishers; Definition share global vs local
figure has been changed and now includes all digital ad spend, compared to display advertising only
Source: Survey respondents, Annual reports, Deloitte analysis, WARC
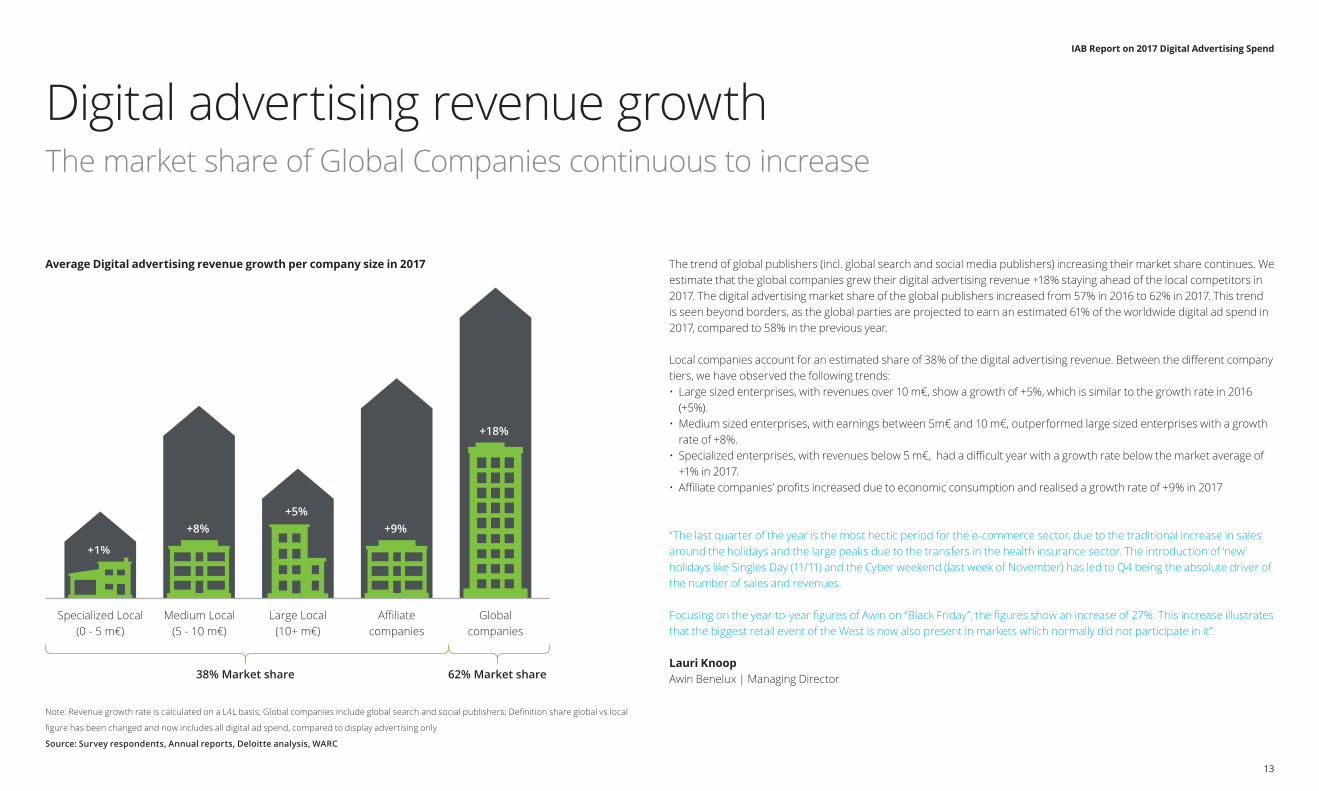
The trend of global publishers (incl. global search and social media publishers) increasing their market share continues. We estimate that the global companies grew their digital advertising revenue +18% staying ahead of the local competitors in 2017. The digital advertising market share of the global publishers increased from 57% in 2016 to 62% in 2017. This trend is seen beyond borders, as the global parties are projected to earn an estimated 61% of the worldwide digital ad spend in 2017, compared to 58% in the previous year.
Local companies account for an estimated share of 38% of the digital advertising revenue. Between the different company tiers, we have observed the following trends:• Large sized enterprises, with revenues over 10 m€, show a growth of +5%, which is similar to the growth rate in 2016
(+5%). • Medium sized enterprises, with earnings between 5m€ and 10 m€, outperformed large sized enterprises with a growth
rate of +8%.• Specialized enterprises, with revenues below 5 m€, had a difficult year with a growth rate below the market average of
+1% in 2017.• Affiliate companies’ profits increased due to economic consumption and realised a growth rate of +9% in 2017
“The last quarter of the year is the most hectic period for the e-commerce sector, due to the traditional increase in sales around the holidays and the large peaks due to the transfers in the health insurance sector. The introduction of ‘new’ holidays like Singles Day (11/11) and the Cyber weekend (last week of November) has led to Q4 being the absolute driver of the number of sales and revenues.
Focusing on the year-to-year figures of Awin on “Black Friday”, the figures show an increase of 27%. This increase illustrates that the biggest retail event of the West is now also present in markets which normally did not participate in it”.
Lauri KnoopAwin Benelux | Managing Director
Digital advertising revenue growthThe market share of Global Companies continuous to increase
Specialized Local(0 - 5 m€)
Medium Local(5 - 10 m€)
Large Local(10+ m€)
Affiliatecompanies
Globalcompanies
+8% +9%
+1%
+18%
+5%
38% Market share 62% Market share
IAB Report on 2017 Digital Advertising Spend
14
Traditional vs digital advertising
IAB Report on 2017 Digital Advertising Spend
15
Market share digital vs traditional out of home advertising
Source: Nielsen, Annual reports, Survey Respondents, Deloitte analysis
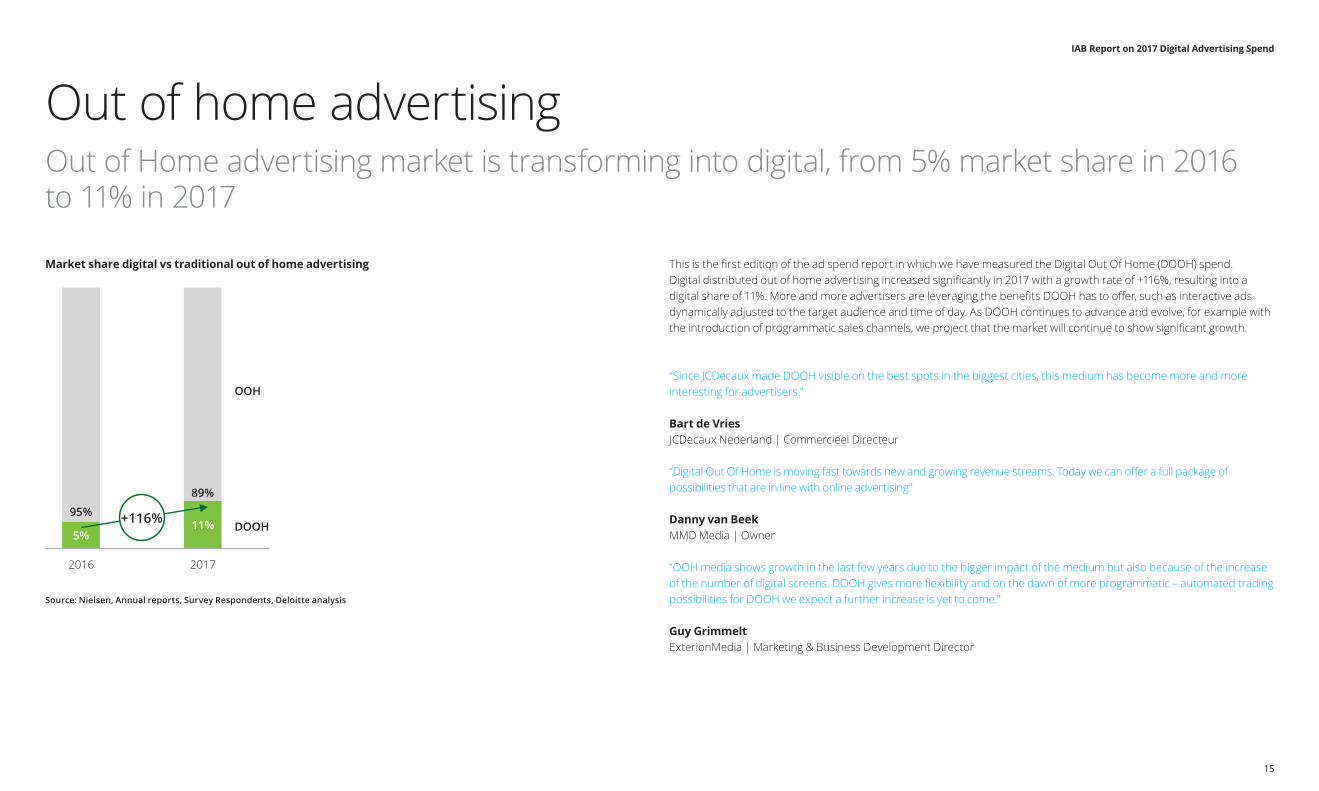
This is the first edition of the ad spend report in which we have measured the Digital Out Of Home (DOOH) spend. Digital distributed out of home advertising increased significantly in 2017 with a growth rate of +116%, resulting into a digital share of 11%. More and more advertisers are leveraging the benefits DOOH has to offer, such as interactive ads dynamically adjusted to the target audience and time of day. As DOOH continues to advance and evolve, for example with the introduction of programmatic sales channels, we project that the market will continue to show significant growth.
“Since JCDecaux made DOOH visible on the best spots in the biggest cities, this medium has become more and more interesting for advertisers.”
Bart de VriesJCDecaux Nederland | Commercieel Directeur
“Digital Out Of Home is moving fast towards new and growing revenue streams. Today we can offer a full package of possibilities that are in line with online advertising”
Danny van BeekMMD Media | Owner
“OOH media shows growth in the last few years due to the bigger impact of the medium but also because of the increase of the number of digital screens. DOOH gives more flexibility and on the dawn of more programmatic – automated trading possibilities for DOOH we expect a further increase is yet to come.”
Guy GrimmeltExterionMedia | Marketing & Business Development Director
Out of home advertisingOut of Home advertising market is transforming into digital, from 5% market share in 2016 to 11% in 2017
2016 2017
5%11%
95%
89%
OOH
DOOH+116%
IAB Report on 2017 Digital Advertising Spend
16
Market share online video vs tv advertising
Source: Nielsen, Screenforce, Annual reports, Survey Respondents, Deloitte analysis
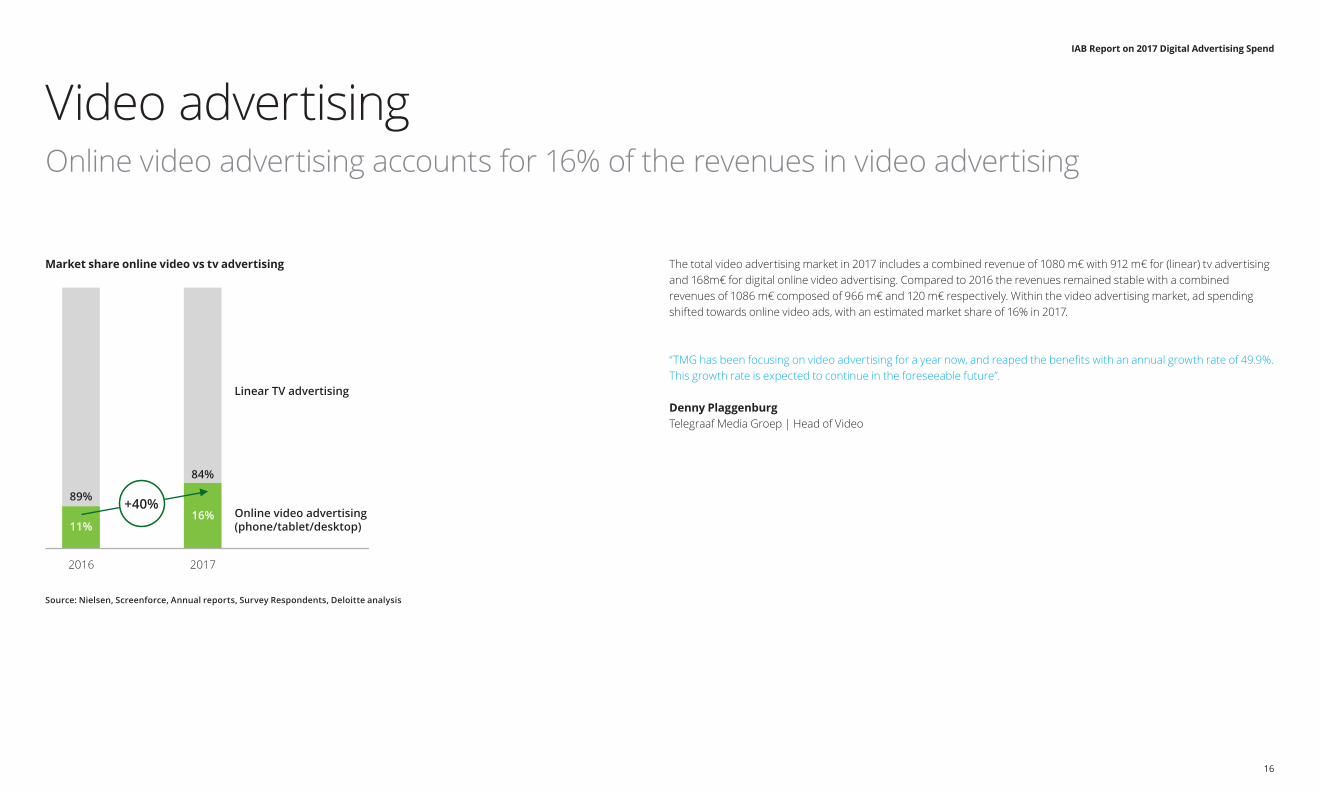
The total video advertising market in 2017 includes a combined revenue of 1080 m€ with 912 m€ for (linear) tv advertising and 168m€ for digital online video advertising. Compared to 2016 the revenues remained stable with a combined revenues of 1086 m€ composed of 966 m€ and 120 m€ respectively. Within the video advertising market, ad spending shifted towards online video ads, with an estimated market share of 16% in 2017.
“TMG has been focusing on video advertising for a year now, and reaped the benefits with an annual growth rate of 49.9%. This growth rate is expected to continue in the foreseeable future”.
Denny Plaggenburg Telegraaf Media Groep | Head of Video
Video advertisingOnline video advertising accounts for 16% of the revenues in video advertising
2016 2017
11%16%
89%
84%
Linear TV advertising
Online video advertising(phone/tablet/desktop)
+40%
IAB Report on 2017 Digital Advertising Spend
17
Market share digital vs traditional audio advertising
Source: RAB, Nielsen, Annual reports, Survey Respondents, Deloitte analysis
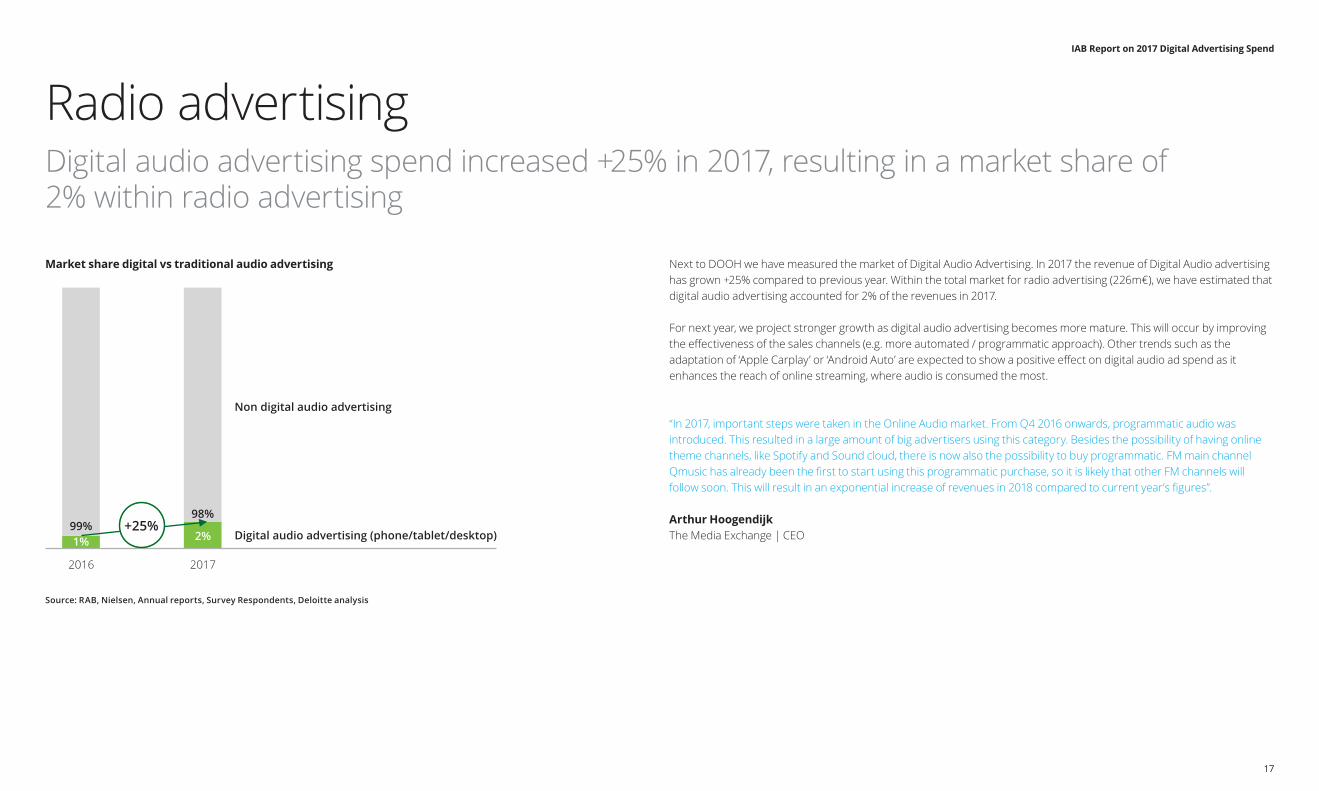
Next to DOOH we have measured the market of Digital Audio Advertising. In 2017 the revenue of Digital Audio advertising has grown +25% compared to previous year. Within the total market for radio advertising (226m€), we have estimated that digital audio advertising accounted for 2% of the revenues in 2017.
For next year, we project stronger growth as digital audio advertising becomes more mature. This will occur by improving the effectiveness of the sales channels (e.g. more automated / programmatic approach). Other trends such as the adaptation of ‘Apple Carplay’ or ‘Android Auto’ are expected to show a positive effect on digital audio ad spend as it enhances the reach of online streaming, where audio is consumed the most.
“In 2017, important steps were taken in the Online Audio market. From Q4 2016 onwards, programmatic audio was introduced. This resulted in a large amount of big advertisers using this category. Besides the possibility of having online theme channels, like Spotify and Sound cloud, there is now also the possibility to buy programmatic. FM main channel Qmusic has already been the first to start using this programmatic purchase, so it is likely that other FM channels will follow soon. This will result in an exponential increase of revenues in 2018 compared to current year’s figures”.
Arthur HoogendijkThe Media Exchange | CEO
Radio advertisingDigital audio advertising spend increased +25% in 2017, resulting in a market share of 2% within radio advertising
2016 2017
1% 2%99%
98%
Non digital audio advertising
Digital audio advertising (phone/tablet/desktop)+25%
IAB Report on 2017 Digital Advertising Spend
18
Display advertising
IAB Report on 2017 Digital Advertising Spend
19
Market share digital vs traditional audio advertising
Source: Survey respondents, Deloitte analysis
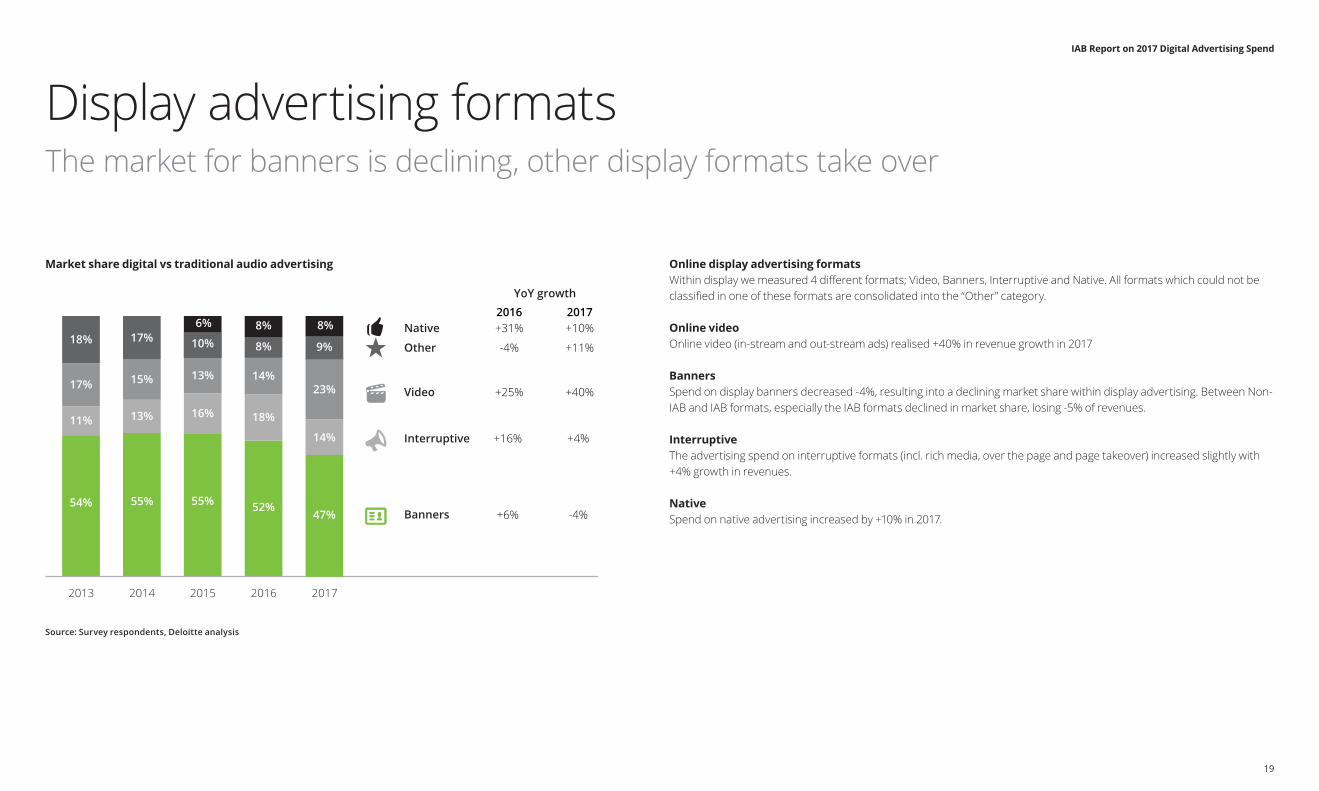
Online display advertising formats Within display we measured 4 different formats; Video, Banners, Interruptive and Native. All formats which could not be classified in one of these formats are consolidated into the “Other” category.
Online video Online video (in-stream and out-stream ads) realised +40% in revenue growth in 2017
Banners Spend on display banners decreased -4%, resulting into a declining market share within display advertising. Between Non-IAB and IAB formats, especially the IAB formats declined in market share, losing -5% of revenues.
Interruptive The advertising spend on interruptive formats (incl. rich media, over the page and page takeover) increased slightly with +4% growth in revenues.
NativeSpend on native advertising increased by +10% in 2017.
Display advertising formatsThe market for banners is declining, other display formats take over
2013 2014 2015 2016
54% 55% 55% 52%
11% 13% 16% 18%
17% 15% 13% 14%
18% 17% 10%
6% 8%
8% Other
Native
Interruptive
Video
Banners
2017
47%
14%
23%
9%
8%
YoY growth
-4%
+31%2016
+25%
+16%
+6%
+11%
+10%2017
+40%
+4%
-4%
IAB Report on 2017 Digital Advertising Spend
20
Video advertising (m€) / YoY advertising spend growth (%)
Source: Annual reports, Media Buyers, IAB UK/US, Survey respondents, Deloitte analysis
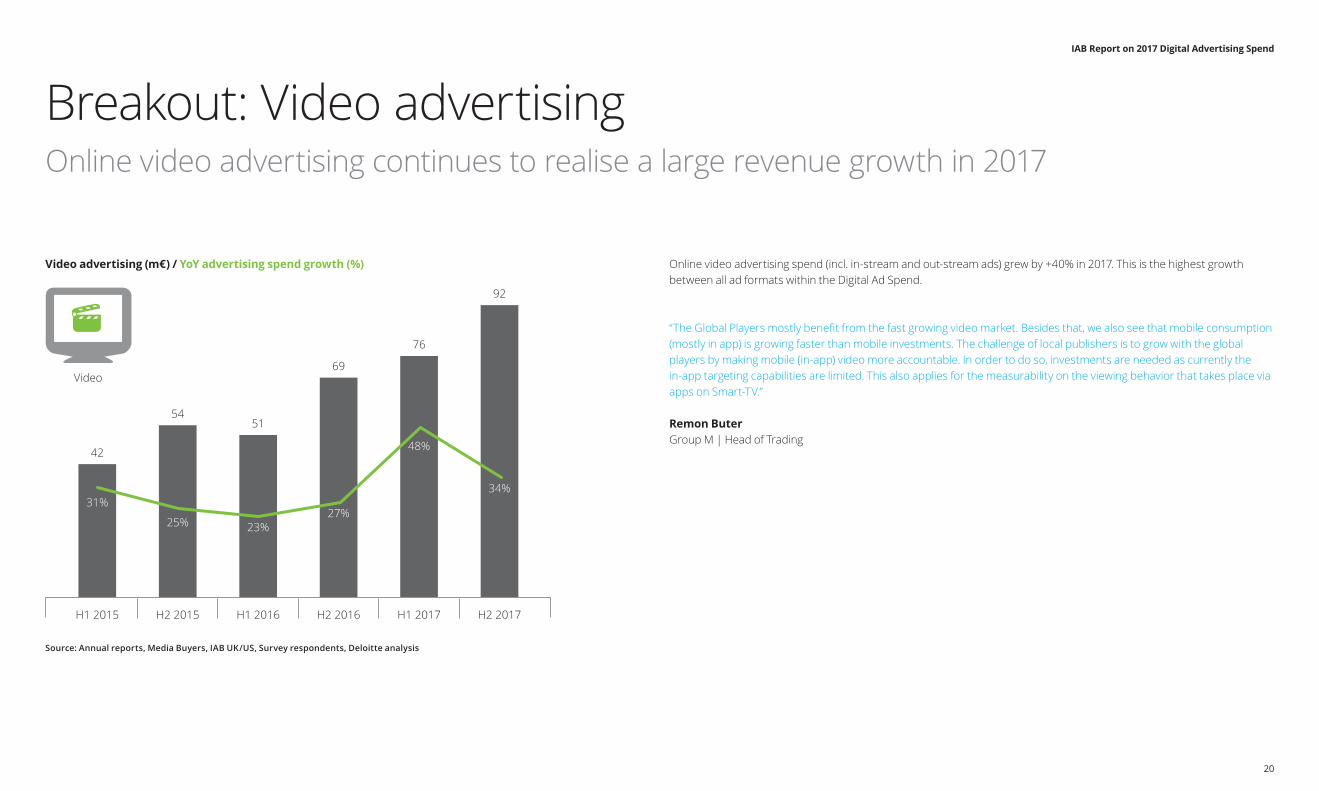
Online video advertising spend (incl. in-stream and out-stream ads) grew by +40% in 2017. This is the highest growth between all ad formats within the Digital Ad Spend.
“The Global Players mostly benefit from the fast growing video market. Besides that, we also see that mobile consumption (mostly in app) is growing faster than mobile investments. The challenge of local publishers is to grow with the global players by making mobile (in-app) video more accountable. In order to do so, investments are needed as currently the in-app targeting capabilities are limited. This also applies for the measurability on the viewing behavior that takes place via apps on Smart-TV.”
Remon ButerGroup M | Head of Trading
Breakout: Video advertisingOnline video advertising continues to realise a large revenue growth in 2017
42
54
92
51
69
76
31%34%
23%25%27%
48%
H1 2015 H2 2015 H1 2016 H2 2016 H1 2017 H2 2017
Video
IAB Report on 2017 Digital Advertising Spend
21
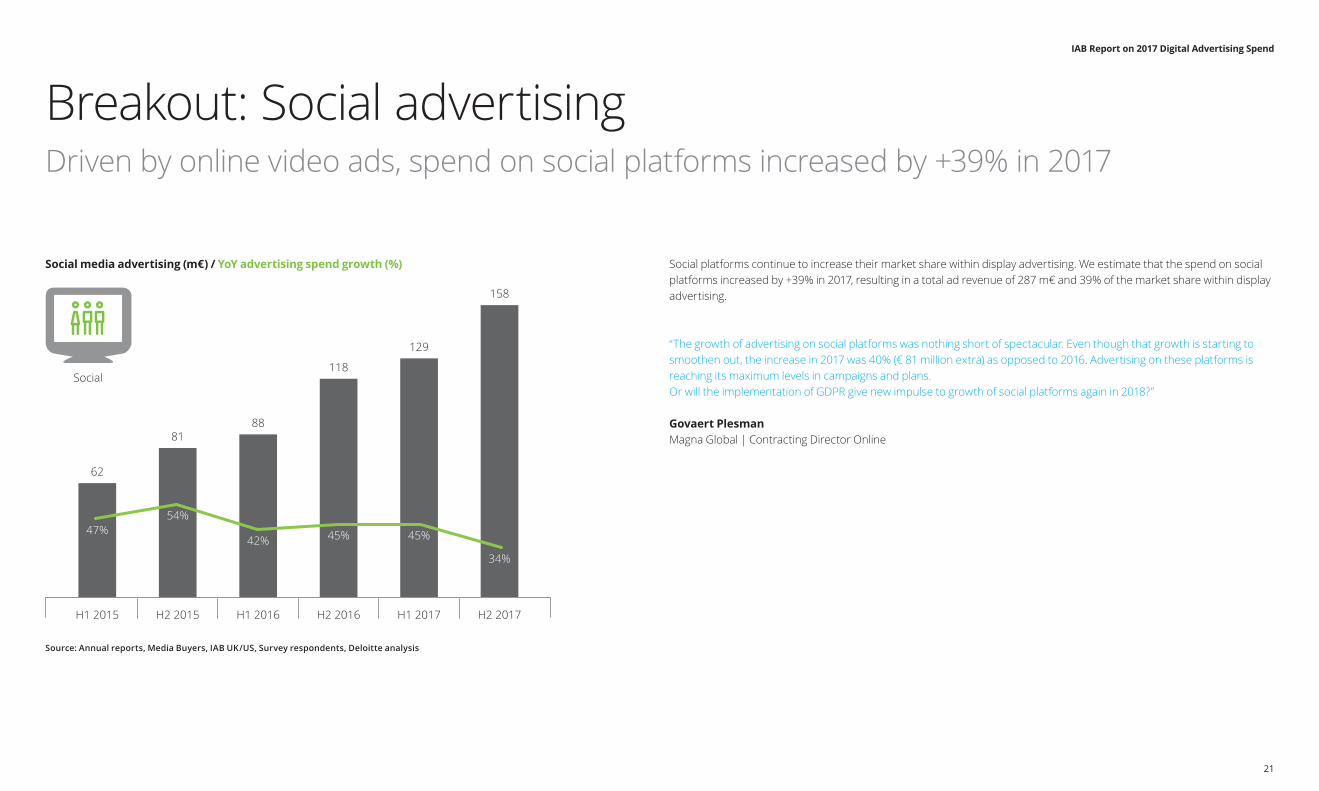
Social media advertising (m€) / YoY advertising spend growth (%)
Source: Annual reports, Media Buyers, IAB UK/US, Survey respondents, Deloitte analysis
Social platforms continue to increase their market share within display advertising. We estimate that the spend on social platforms increased by +39% in 2017, resulting in a total ad revenue of 287 m€ and 39% of the market share within display advertising.
“The growth of advertising on social platforms was nothing short of spectacular. Even though that growth is starting to smoothen out, the increase in 2017 was 40% (€ 81 million extra) as opposed to 2016. Advertising on these platforms is reaching its maximum levels in campaigns and plans.Or will the implementation of GDPR give new impulse to growth of social platforms again in 2018?”
Govaert PlesmanMagna Global | Contracting Director Online
Breakout: Social advertisingDriven by online video ads, spend on social platforms increased by +39% in 2017
62
81
158
88
118
129
47%
34%42%
54%
45% 45%
H1 2015 H2 2015 H1 2016 H2 2016 H1 2017 H2 2017
Social
IAB Report on 2017 Digital Advertising Spend
22
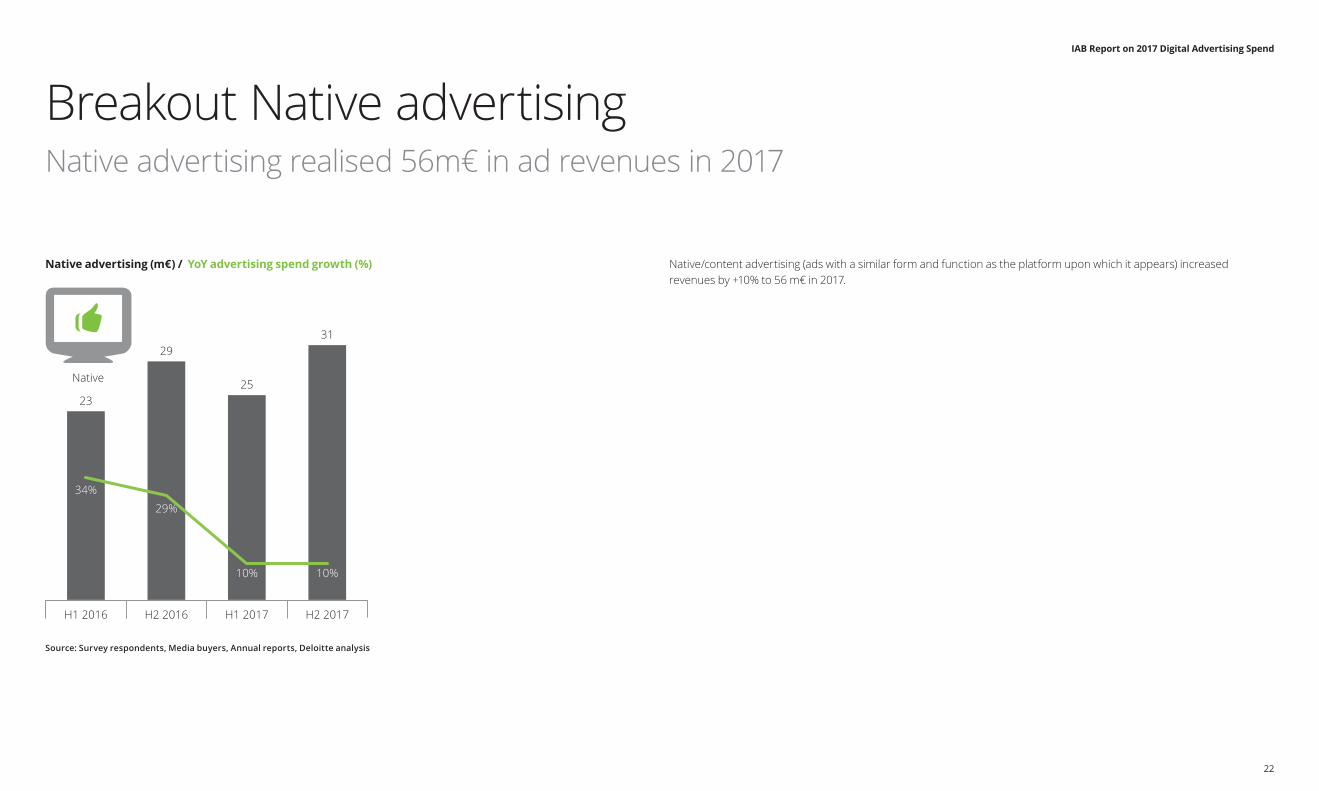
Native advertising (m€) / YoY advertising spend growth (%)
Source: Survey respondents, Media buyers, Annual reports, Deloitte analysis
Native/content advertising (ads with a similar form and function as the platform upon which it appears) increased revenues by +10% to 56 m€ in 2017.
“Since JCDecaux made DOOH visible on the best spots in the biggest cities, this medium has become more and more interesting for advertisers.”
Bart de VriesJCDecaux Nederland | Commercieel Directeur
“OOH media shows growth in the last few years due to the bigger impact of the medium but also because of the increase of the number of digital screens. DOOH gives more flexibility and on the dawn of more programmatic – automated trading possibilities for DOOH we expect a further increase is yet to come.”
Guy GrimmeltExterionMedia | Marketing & Business Development Director
Breakout Native advertisingNative advertising realised 56m€ in ad revenues in 2017
31
23
29
25
10%
34%29%
10%
H1 2015 H2 2015H1 2016 H2 2016 H1 2017 H2 2017
Native
IAB Report on 2017 Digital Advertising Spend
23
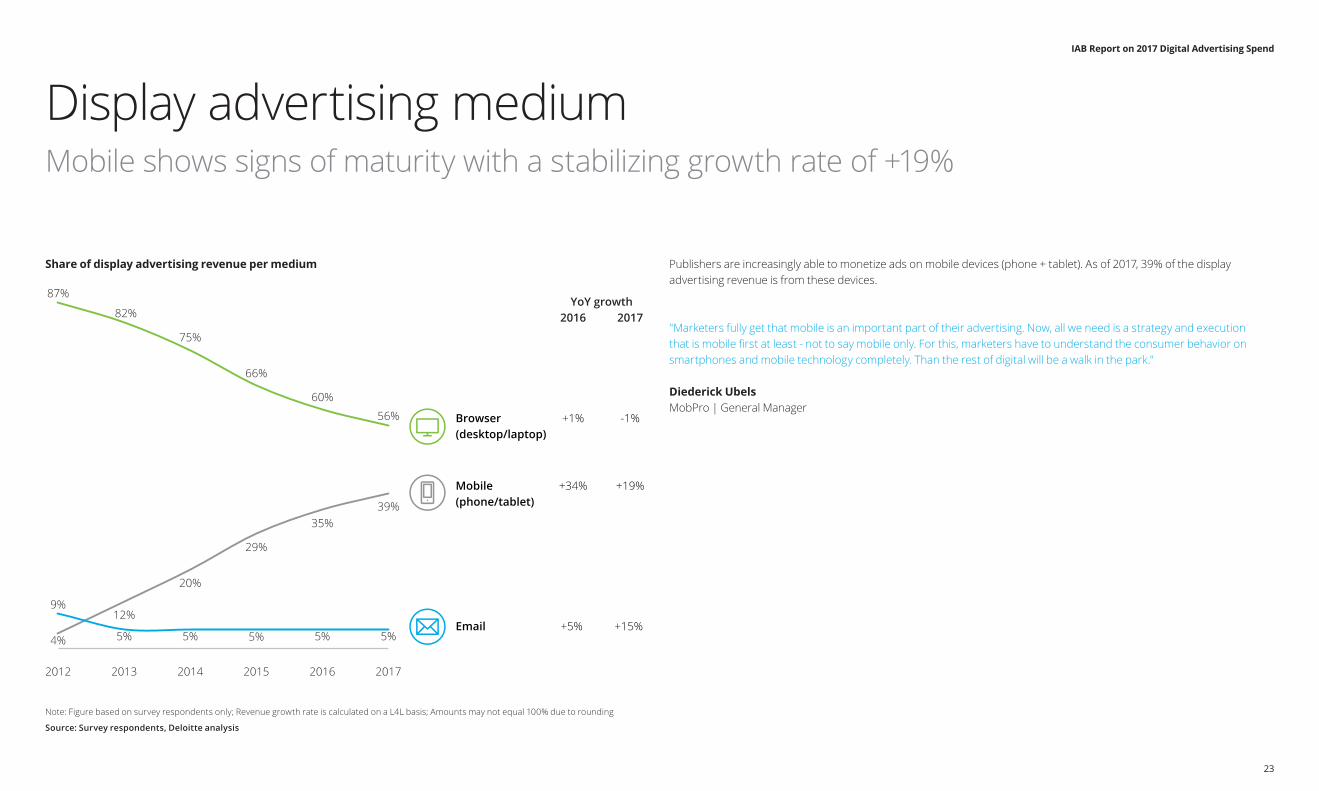
Share of display advertising revenue per medium
Note: Figure based on survey respondents only; Revenue growth rate is calculated on a L4L basis; Amounts may not equal 100% due to rounding
Source: Survey respondents, Deloitte analysis
Publishers are increasingly able to monetize ads on mobile devices (phone + tablet). As of 2017, 39% of the display advertising revenue is from these devices.
"Marketers fully get that mobile is an important part of their advertising. Now, all we need is a strategy and execution that is mobile first at least - not to say mobile only. For this, marketers have to understand the consumer behavior on smartphones and mobile technology completely. Than the rest of digital will be a walk in the park."
Diederick UbelsMobPro | General Manager
Display advertising mediumMobile shows signs of maturity with a stabilizing growth rate of +19%
Browser(desktop/laptop)
Mobile(phone/tablet)
87%
82%
75%
66%
60%
56%
4%
12%
20%
29%
35%39%
9%
5% 5% 5% 5% 5%
2012 2013 2014 2015 2016 2017
YoY growth
-1%
+19%
+15%
2016 2017
+1%
+34%
+5%
IAB Report on 2017 Digital Advertising Spend
24
Programmatic advertising
IAB Report on 2017 Digital Advertising Spend
25
Display advertising revenue through programmatic exchanges (m€) / YoY advertising spend growth (%)
Source: Ad spend and programmatic survey respondents, Deloitte analysis
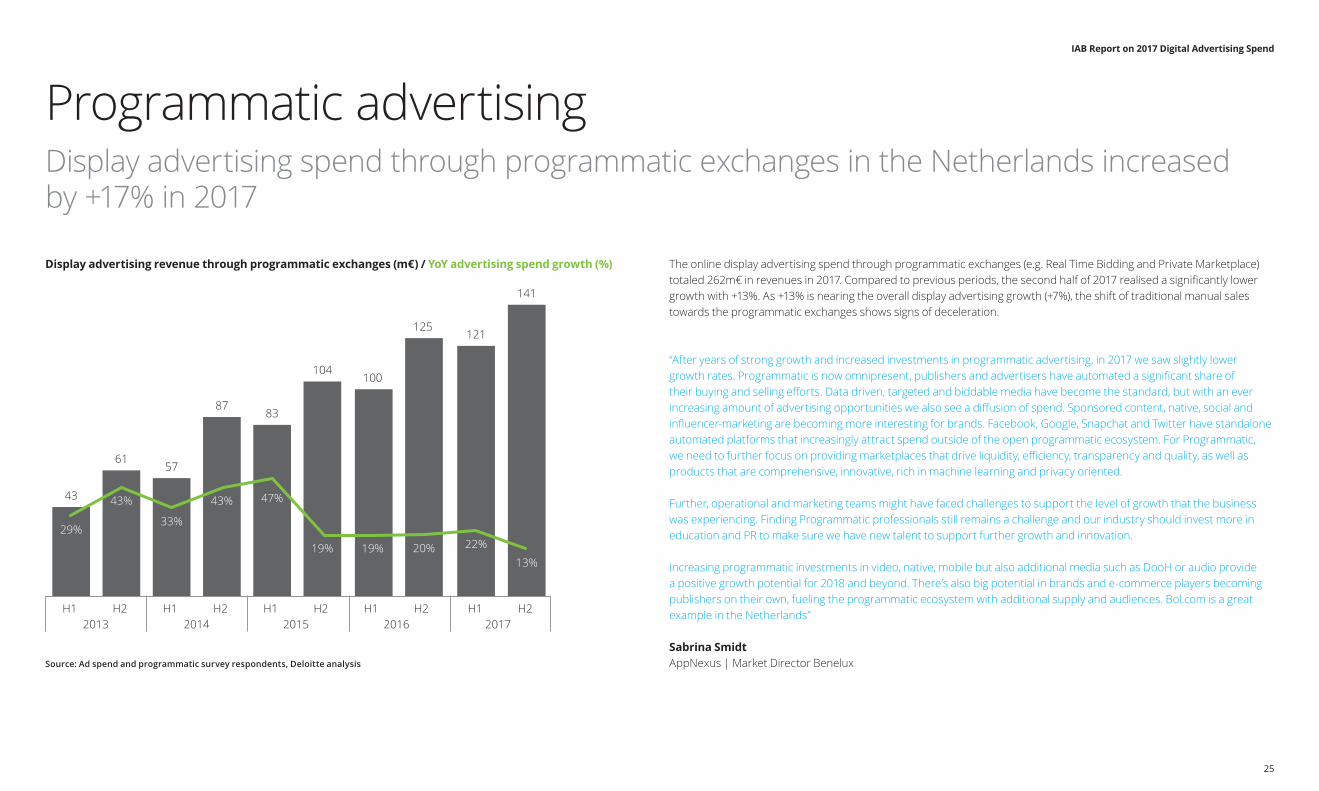
The online display advertising spend through programmatic exchanges (e.g. Real Time Bidding and Private Marketplace) totaled 262m€ in revenues in 2017. Compared to previous periods, the second half of 2017 realised a significantly lower growth with +13%. As +13% is nearing the overall display advertising growth (+7%), the shift of traditional manual sales towards the programmatic exchanges shows signs of deceleration.
“After years of strong growth and increased investments in programmatic advertising, in 2017 we saw slightly lower growth rates. Programmatic is now omnipresent, publishers and advertisers have automated a significant share of their buying and selling efforts. Data driven, targeted and biddable media have become the standard, but with an ever increasing amount of advertising opportunities we also see a diffusion of spend. Sponsored content, native, social and influencer-marketing are becoming more interesting for brands. Facebook, Google, Snapchat and Twitter have standalone automated platforms that increasingly attract spend outside of the open programmatic ecosystem. For Programmatic, we need to further focus on providing marketplaces that drive liquidity, efficiency, transparency and quality, as well as products that are comprehensive, innovative, rich in machine learning and privacy oriented.
Further, operational and marketing teams might have faced challenges to support the level of growth that the business was experiencing. Finding Programmatic professionals still remains a challenge and our industry should invest more in education and PR to make sure we have new talent to support further growth and innovation. Increasing programmatic investments in video, native, mobile but also additional media such as DooH or audio provide a positive growth potential for 2018 and beyond. There’s also big potential in brands and e-commerce players becoming publishers on their own, fueling the programmatic ecosystem with additional supply and audiences. Bol.com is a great example in the Netherlands”
Sabrina SmidtAppNexus | Market Director Benelux
Programmatic advertisingDisplay advertising spend through programmatic exchanges in the Netherlands increased by +17% in 2017
43
6157
8783
104100
125121
141
29%
43%
33%
43% 47%
19% 19% 20% 22%13%
H1 H2 H1 H2 H1 H2 H1 H2 H1 H2 2013 2014 2015 2016 2017
IAB Report on 2017 Digital Advertising Spend
26
Share manual vs programmatic sold display advertising revenue
Note: Figure based on survey respondents only; Top 5 local publishers 2016 figure changed due to revised respondent data
Source: Survey respondents, Deloitte analysis
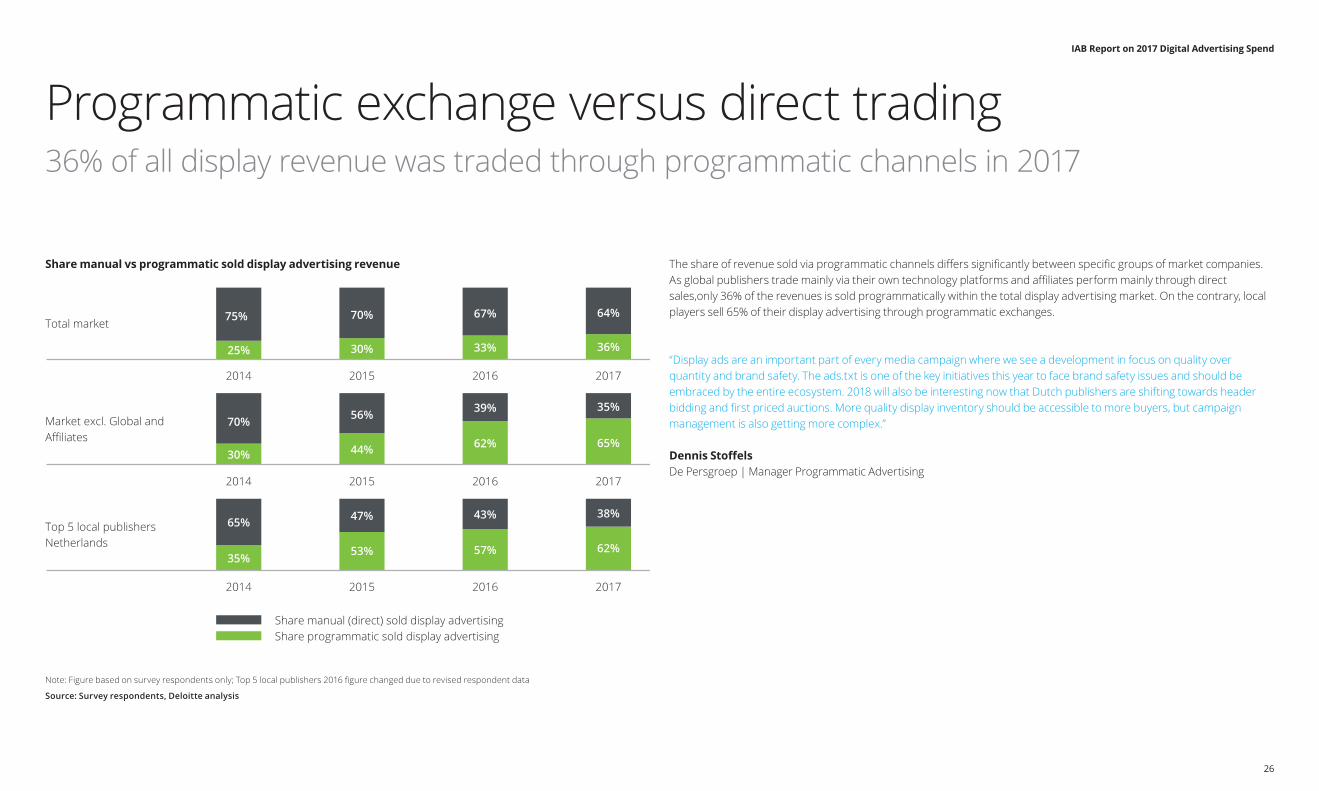
The share of revenue sold via programmatic channels differs significantly between specific groups of market companies. As global publishers trade mainly via their own technology platforms and affiliates perform mainly through direct sales,only 36% of the revenues is sold programmatically within the total display advertising market. On the contrary, local players sell 65% of their display advertising through programmatic exchanges.
“Display ads are an important part of every media campaign where we see a development in focus on quality over quantity and brand safety. The ads.txt is one of the key initiatives this year to face brand safety issues and should be embraced by the entire ecosystem. 2018 will also be interesting now that Dutch publishers are shifting towards header bidding and first priced auctions. More quality display inventory should be accessible to more buyers, but campaign management is also getting more complex.”
Dennis StoffelsDe Persgroep | Manager Programmatic Advertising
Programmatic exchange versus direct trading36% of all display revenue was traded through programmatic channels in 2017
2014 2015 2016 2017
Share manual (direct) sold display advertisingShare programmatic sold display advertising
25% 30%
67% 64%75% 70%
33% 36%
2014 2015 2016 2017
30% 44%
39% 35%70% 56%
62% 65%
2014 2015 2016 2017
35% 53%
43% 38%65% 47%
57% 62%
Total market
Market excl. Global and Affiliates
Top 5 local publishers Netherlands
IAB Report on 2017 Digital Advertising Spend
27
Outlook
IAB Report on 2017 Digital Advertising Spend
28
Average growth projection for 2018 by respondents
Source: Survey respondents, Deloitte analysis
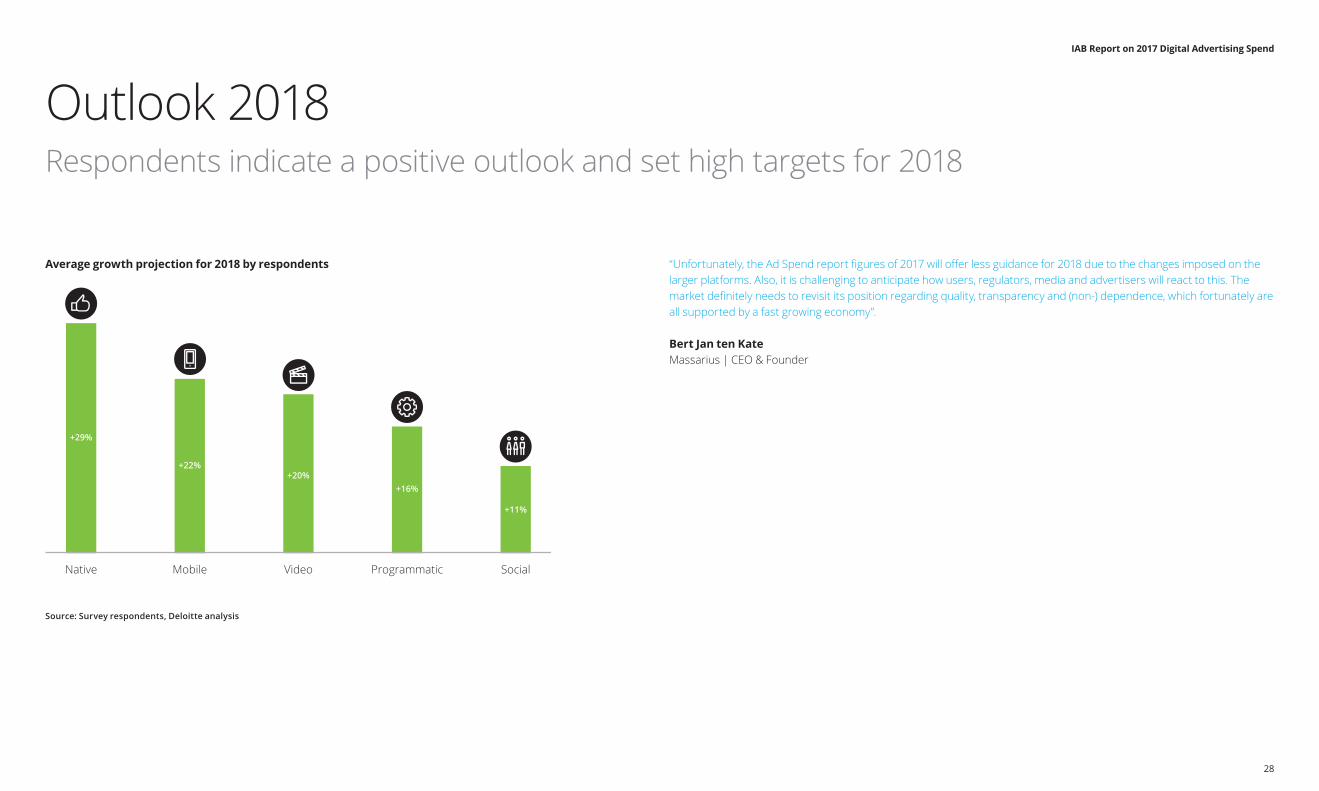
“Unfortunately, the Ad Spend report figures of 2017 will offer less guidance for 2018 due to the changes imposed on the larger platforms. Also, it is challenging to anticipate how users, regulators, media and advertisers will react to this. The market definitely needs to revisit its position regarding quality, transparency and (non-) dependence, which fortunately are all supported by a fast growing economy”.
Bert Jan ten KateMassarius | CEO & Founder
Outlook 2018Respondents indicate a positive outlook and set high targets for 2018
Native Mobile Video Programmatic Social
+29%
+22%+20%
+16%
+11%
IAB Report on 2017 Digital Advertising Spend
29
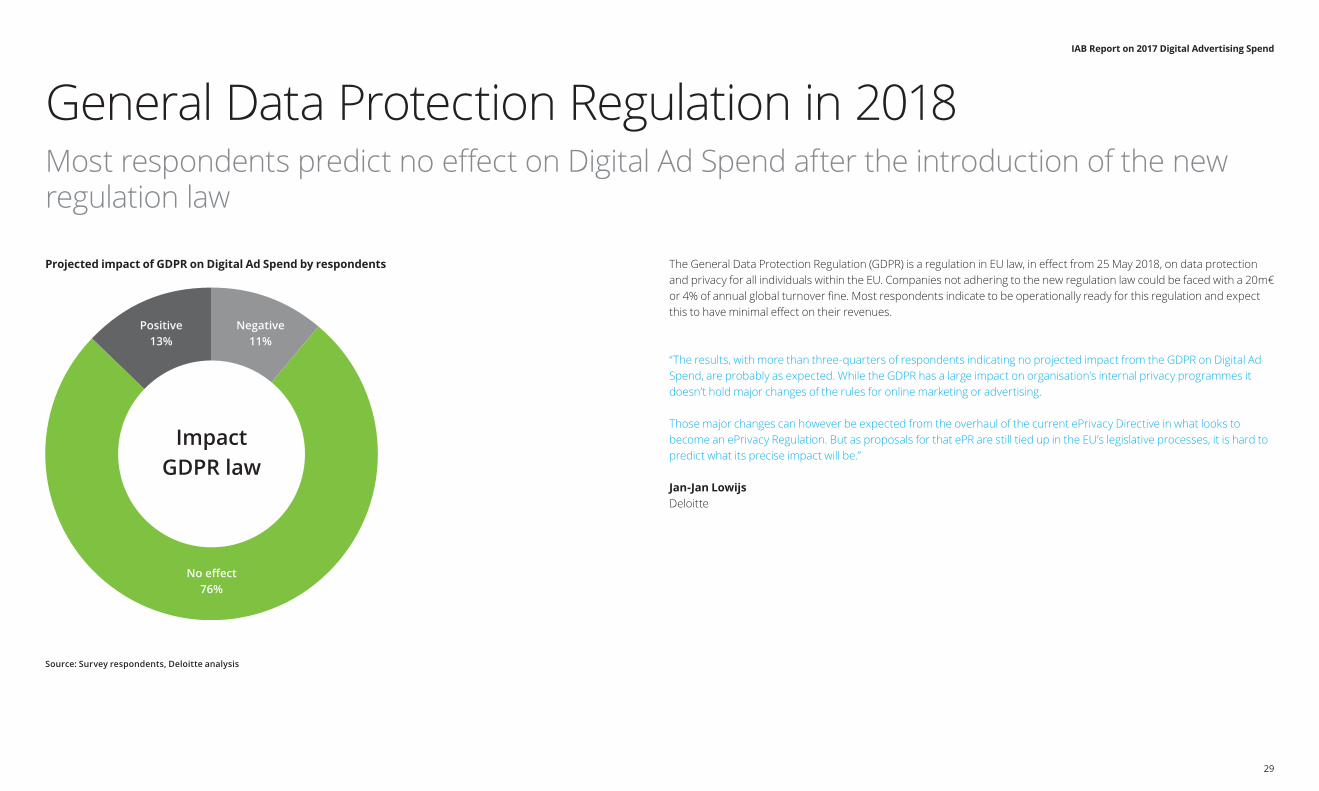
Projected impact of GDPR on Digital Ad Spend by respondents
Source: Survey respondents, Deloitte analysis
The General Data Protection Regulation (GDPR) is a regulation in EU law, in effect from 25 May 2018, on data protection and privacy for all individuals within the EU. Companies not adhering to the new regulation law could be faced with a 20m€ or 4% of annual global turnover fine. Most respondents indicate to be operationally ready for this regulation and expect this to have minimal effect on their revenues.
“The results, with more than three-quarters of respondents indicating no projected impact from the GDPR on Digital Ad Spend, are probably as expected. While the GDPR has a large impact on organisation’s internal privacy programmes it doesn’t hold major changes of the rules for online marketing or advertising.
Those major changes can however be expected from the overhaul of the current ePrivacy Directive in what looks to become an ePrivacy Regulation. But as proposals for that ePR are still tied up in the EU’s legislative processes, it is hard to predict what its precise impact will be.”
Jan-Jan LowijsDeloitte
General Data Protection Regulation in 2018Most respondents predict no effect on Digital Ad Spend after the introduction of the new regulation law
No effect76%
ImpactGDPR law
Positive13%
Negative11%
IAB Report on 2017 Digital Advertising Spend
30
Methodology
IAB Report on 2017 Digital Advertising Spend
31
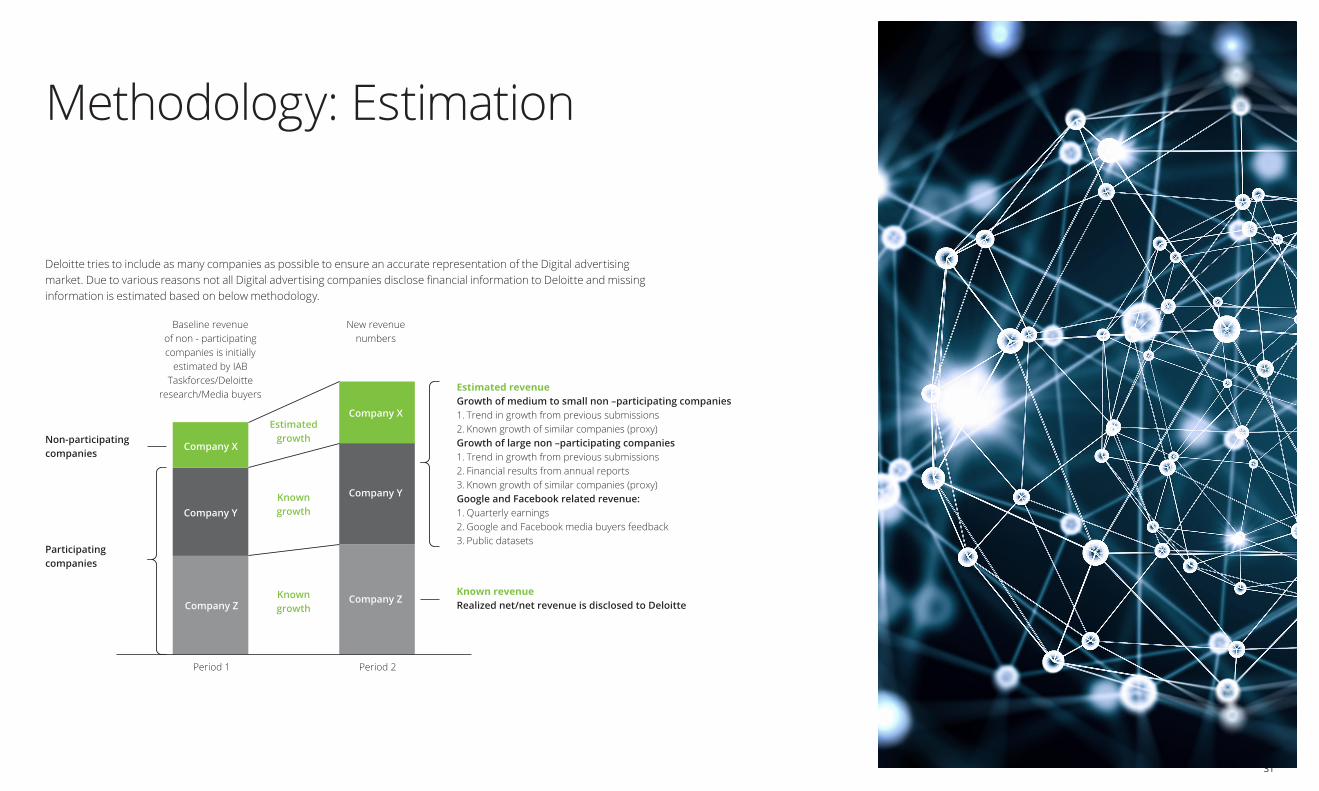
Deloitte tries to include as many companies as possible to ensure an accurate representation of the Digital advertising market. Due to various reasons not all Digital advertising companies disclose financial information to Deloitte and missing information is estimated based on below methodology.
Methodology: Estimation
Company Z Company Z
Company Y
Company Y
Period 1 Period 2
Company X
Company X Non-participatingcompanies
Participating companies
Estimatedgrowth
Knowngrowt
Knowngrowth
h
New revenuenumbers
Baseline revenueof non - participatingcompanies is initially
estimated by IABTaskforces/Deloitte
research/Media buyersEstimated revenueGrowth of medium to small non –participating companies 1. Trend in growth from previous submissions2. Known growth of similar companies (proxy)Growth of large non –participating companies1. Trend in growth from previous submissions2. Financial results from annual reports3. Known growth of similar companies (proxy)Google and Facebook related revenue:1. Quarterly earnings2. Google and Facebook media buyers feedback3. Public datasets
Known revenueRealized net/net revenue is disclosed to Deloitte
IAB Report on 2017 Digital Advertising Spend
32
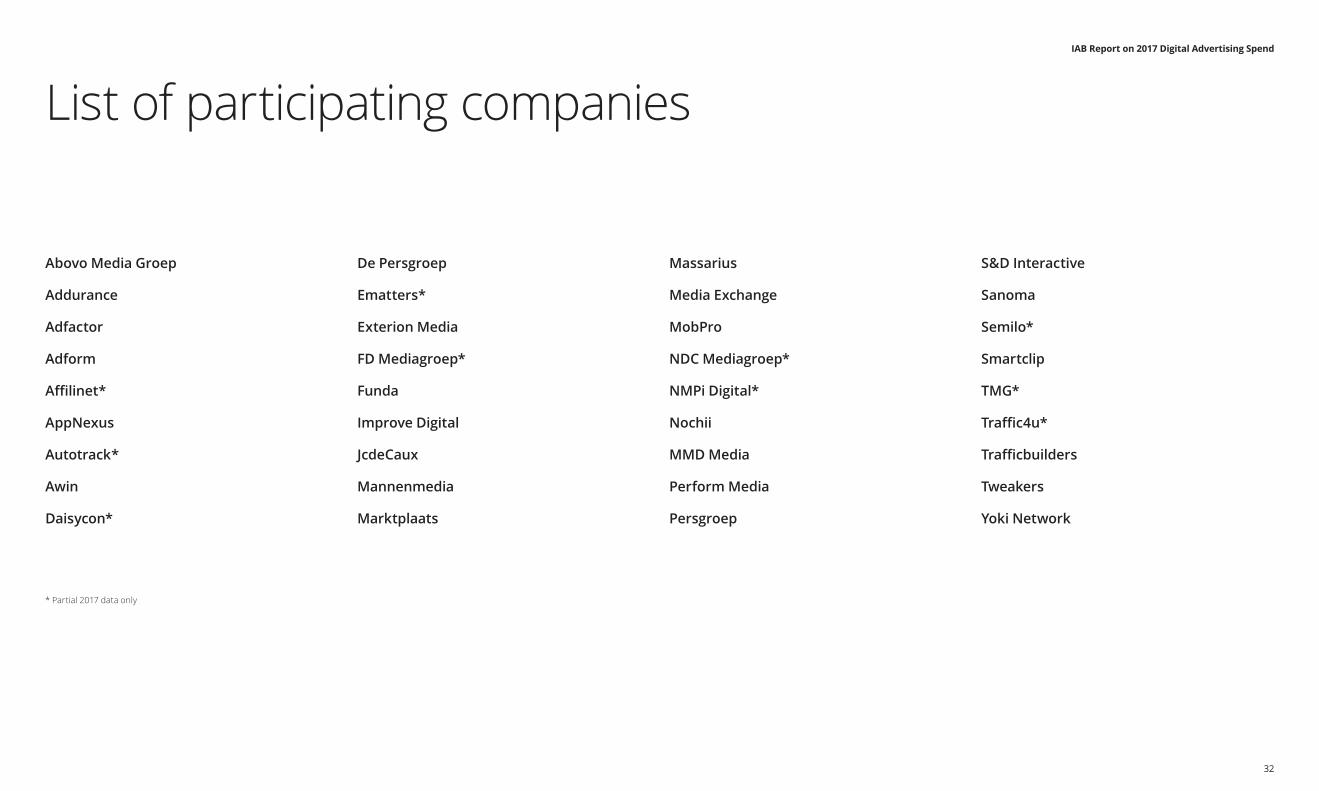
List of participating companies
Abovo Media Groep
Addurance
Adfactor
Adform
Affilinet*
AppNexus
Autotrack*
Awin
Daisycon*
De Persgroep
Ematters*
Exterion Media
FD Mediagroep*
Funda
Improve Digital
JcdeCaux
Mannenmedia
Marktplaats
Massarius
Media Exchange
MobPro
NDC Mediagroep*
NMPi Digital*
Nochii
MMD Media
Perform Media
Persgroep
S&D Interactive
Sanoma
Semilo*
Smartclip
TMG*
Traffic4u*
Trafficbuilders
Tweakers
Yoki Network
* Partial 2017 data only
IAB Report on 2017 Digital Advertising Spend
33
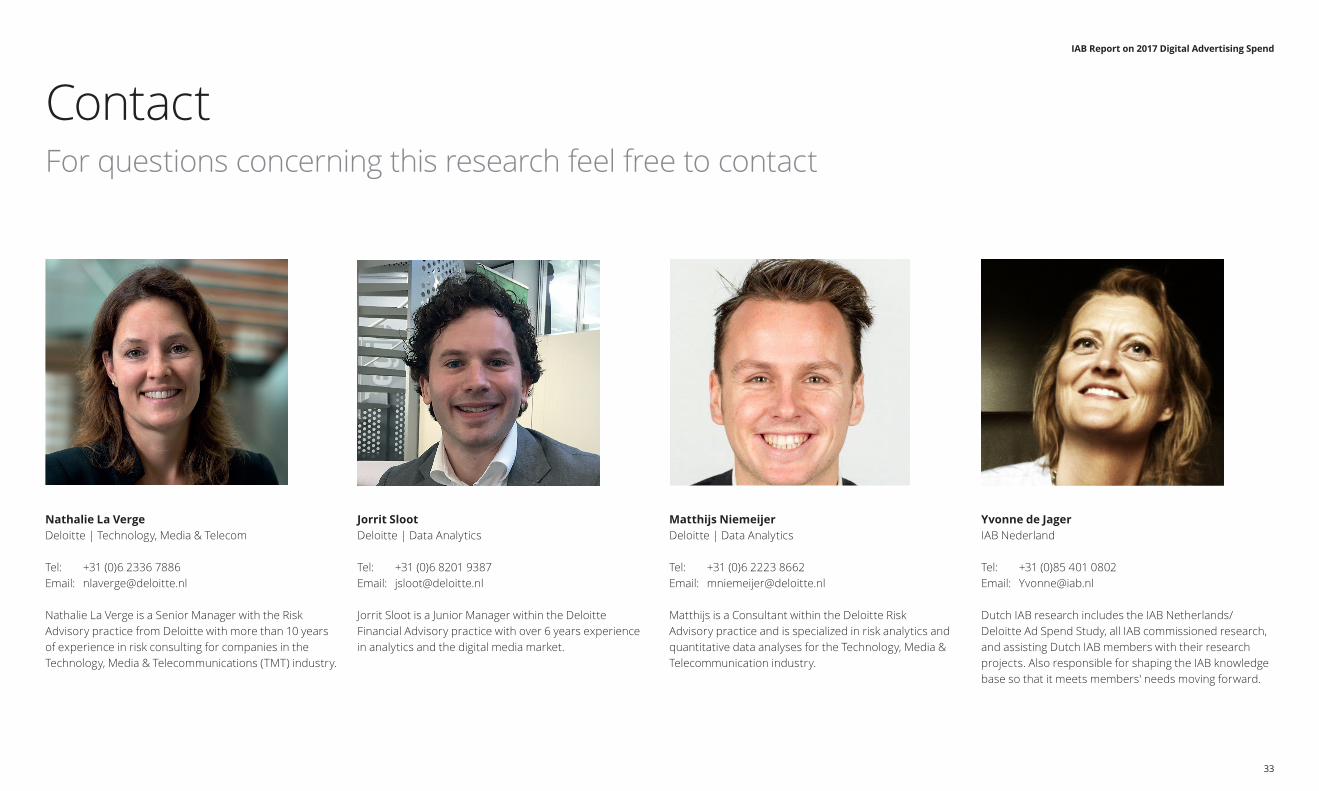
Nathalie La VergeDeloitte | Technology, Media & Telecom
Tel: +31 (0)6 2336 7886Email: [email protected]
Nathalie La Verge is a Senior Manager with the Risk Advisory practice from Deloitte with more than 10 years of experience in risk consulting for companies in the Technology, Media & Telecommunications (TMT) industry.
Jorrit SlootDeloitte | Data Analytics
Tel: +31 (0)6 8201 9387Email: [email protected]
Jorrit Sloot is a Junior Manager within the Deloitte Financial Advisory practice with over 6 years experience in analytics and the digital media market.
Matthijs NiemeijerDeloitte | Data Analytics
Tel: +31 (0)6 2223 8662Email: [email protected]
Matthijs is a Consultant within the Deloitte Risk Advisory practice and is specialized in risk analytics and quantitative data analyses for the Technology, Media & Telecommunication industry.
Yvonne de JagerIAB Nederland
Tel: +31 (0)85 401 0802Email: [email protected]
Dutch IAB research includes the IAB Netherlands/ Deloitte Ad Spend Study, all IAB commissioned research, and assisting Dutch IAB members with their research projects. Also responsible for shaping the IAB knowledge base so that it meets members' needs moving forward.
ContactFor questions concerning this research feel free to contact
IAB Report on 2017 Digital Advertising Spend
34
IAB Nederland wordt gesponsord doorIAB Nederland is sponsored by
Deloitte refers to one or more of Deloitte Touche Tohmatsu Limited ("DTTL"), its global network of member firms, and their related entities. DTTL (also referred to as "Deloitte Global") and each of its member firms are legally separate and independent entities. DTTL does not provide services to clients. Please see www.deloitte.nl/about to learn more.
Deloitte is a leading global provider of audit and assurance, consulting, financial advisory, risk advisory, tax and related services. Our network of member firms in more than 150 countries serves four out of five Fortune Global 500® companies. Learn how Deloitte’s approximately 264,000 people make an impact that matters at www.deloitte.nl.
This communication contains general information only, and none of Deloitte Touche Tohmatsu Limited, its member firms, or their related entities (collectively, the “Deloitte network”) is, by means of this communication, rendering professional advice or services. Before making any decision or taking any action that may affect your finances or your business, you should consult a qualified professional adviser. No entity in the Deloitte network shall be responsible for any loss whatsoever sustained by any person who relies on this communication.
© 2018 Deloitte The Netherlands