i3 1 q16 innovation-monitor-slides
TRANSCRIPT
Q1 2016 Innovation Monitor
Presented by i3
Sponsored by:
Industry Trends
Top Venture Deals & Corporate Investors
Exits: M&A Highlights
Contents
Industry Trends
Top Venture Deals & Corporate Investors
Exits: M&A Highlights
Contents
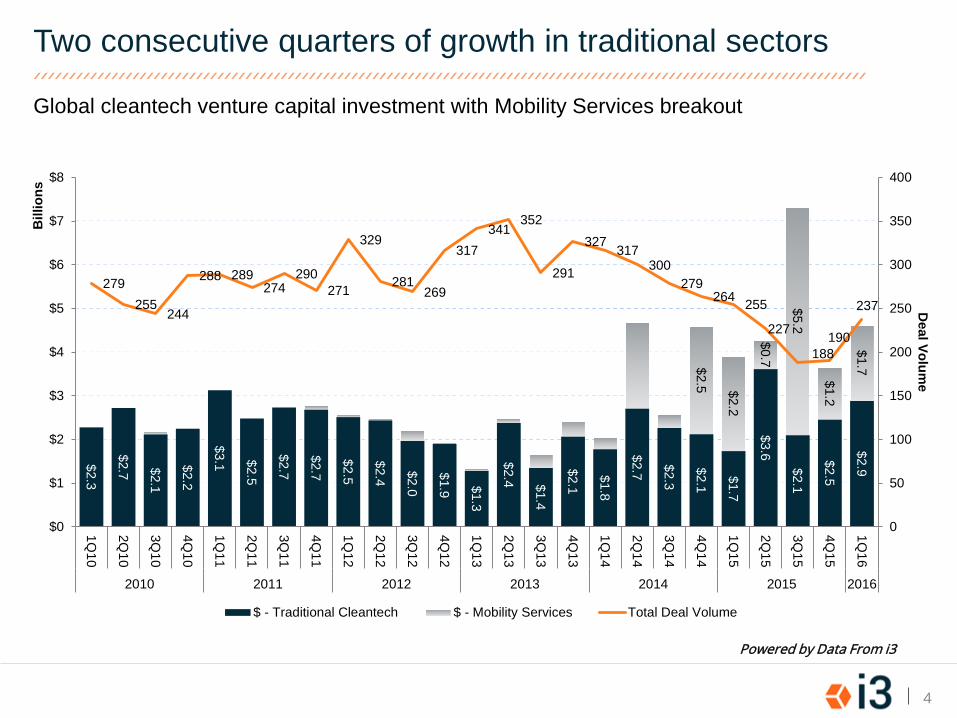
Global cleantech venture capital investment with Mobility Services breakout
4
Two consecutive quarters of growth in traditional sectors
Powered by Data From i3
$2.3
$2.7
$2.1
$2.2
$3.1
$2.5
$2.7
$2.7
$2.5
$2.4
$2.0
$1.9
$1.3
$2.4 $1.4
$2.1
$1.8
$2.7
$2.3
$2.1
$1.7
$3.6 $2.1
$2.5
$2.9
$2.5 $2.2
$0.7
$5.2
$1.2
$1.7
279 255
244
288 289 274
290 271
329
281 269
317 341
352
291
327 317 300
279 264 255
227
188 190
237
0
50
100
150
200
250
300
350
400
$0
$1
$2
$3
$4
$5
$6
$7
$8
1Q10
2Q10
3Q10
4Q10
1Q11
2Q11
3Q11
4Q11
1Q12
2Q12
3Q12
4Q12
1Q13
2Q13
3Q13
4Q13
1Q14
2Q14
3Q14
4Q14
1Q15
2Q15
3Q15
4Q15
1Q16
2010 2011 2012 2013 2014 2015 2016
Deal Volum
e B
illio
ns
$ - Traditional Cleantech $ - Mobility Services Total Deal Volume
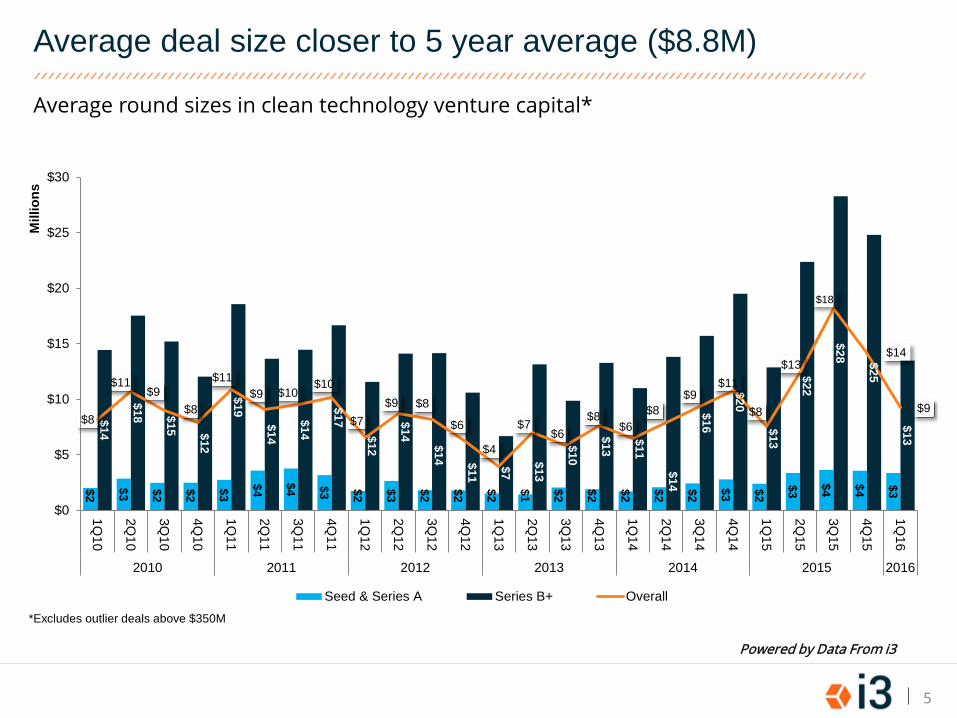
Average deal size closer to 5 year average ($8.8M)
Average round sizes in clean technology venture capital*
Powered by Data From i3
5
$2
$3
$2
$2
$3
$4
$4
$3
$2
$3
$2
$2
$2
$1
$2
$2
$2
$2
$2
$3
$2
$3
$4
$4
$3
$14
$18 $15 $12
$19 $14
$14
$17 $12
$14 $14 $11
$7
$13
$10
$13
$11
$14
$16
$20
$13
$22
$28 $25
$13
$8
$11 $9
$8
$11 $9 $10
$10
$7 $9 $8
$6
$4
$7 $6
$8 $6
$8 $9
$11
$8
$13
$18
$14
$9
$0
$5
$10
$15
$20
$25
$30
1Q10
2Q10
3Q10
4Q10
1Q11
2Q11
3Q11
4Q11
1Q12
2Q12
3Q12
4Q12
1Q13
2Q13
3Q13
4Q13
1Q14
2Q14
3Q14
4Q14
1Q15
2Q15
3Q15
4Q15
1Q16
2010 2011 2012 2013 2014 2015 2016
Mill
ions
Seed & Series A Series B+ Overall*Excludes outlier deals above $350M
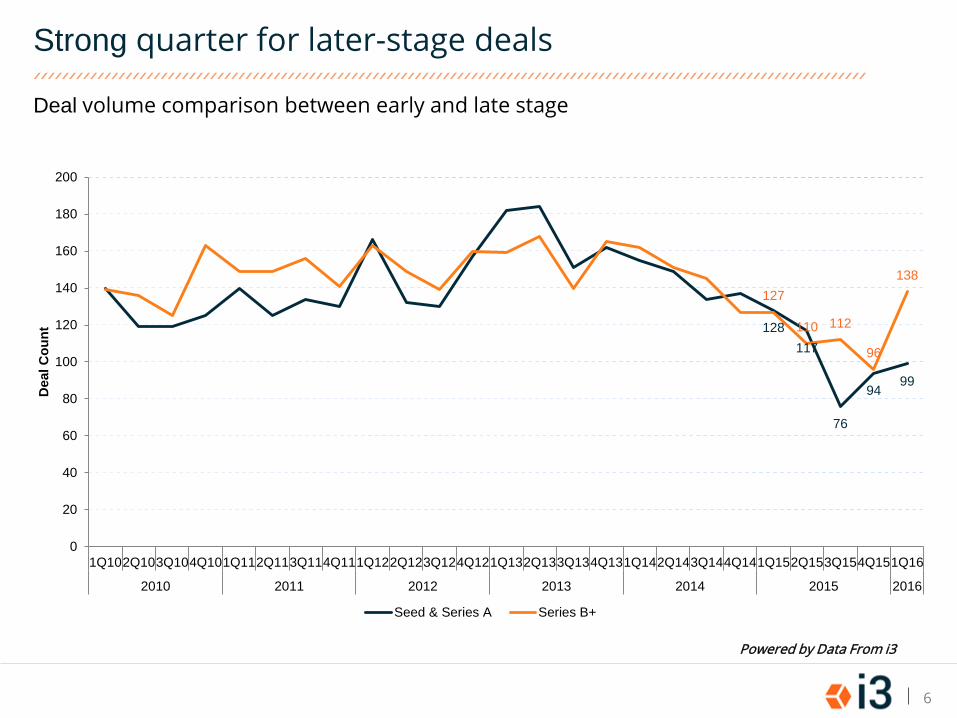
Strong quarter for later-stage deals
Deal volume comparison between early and late stage
Powered by Data From i3
6
128 117
76
94 99
127
110 112
96
138
0
20
40
60
80
100
120
140
160
180
200
1Q102Q103Q104Q101Q112Q113Q114Q111Q122Q123Q124Q121Q132Q133Q134Q131Q142Q143Q144Q141Q152Q153Q154Q151Q16
2010 2011 2012 2013 2014 2015 2016
Dea
l Cou
nt
Seed & Series A Series B+
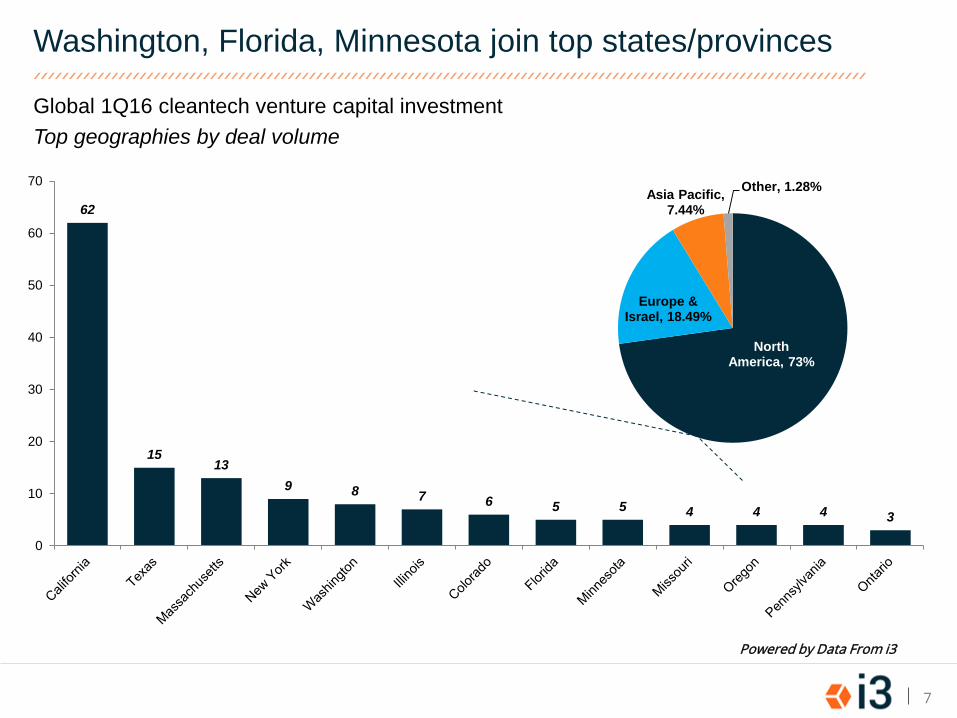
Global 1Q16 cleantech venture capital investment Top geographies by deal volume
Washington, Florida, Minnesota join top states/provinces
Powered by Data From i3
75.9%
7
62
15 13
9 8 7 6 5 5 4 4 4 3
0
10
20
30
40
50
60
70
North America, 73%
Europe & Israel, 18.49%
Asia Pacific, 7.44%
Other, 1.28%
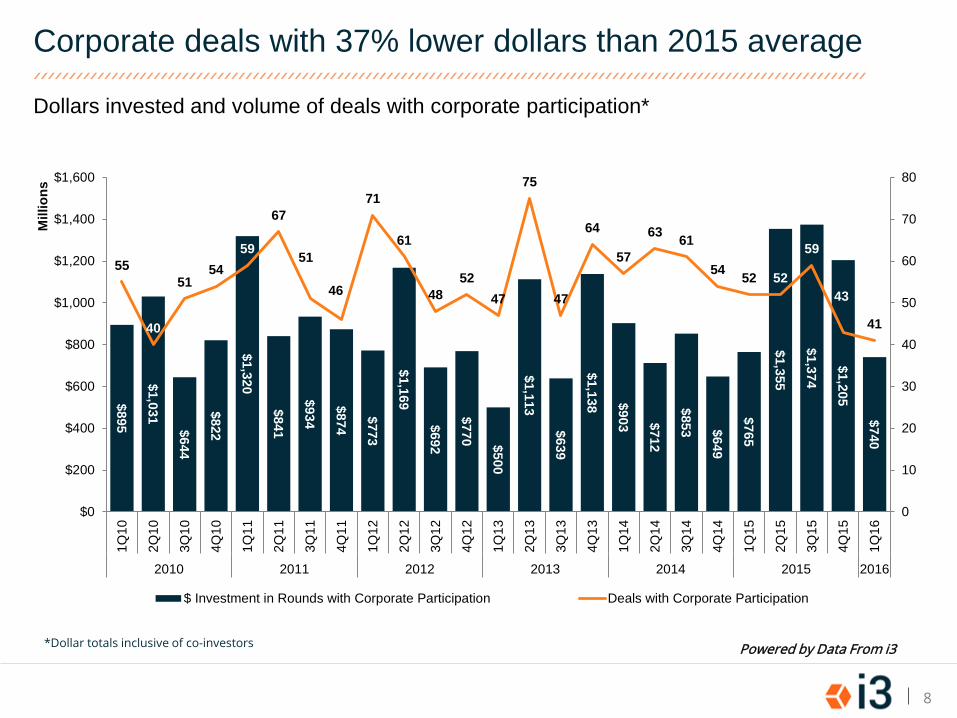
Corporate deals with 37% lower dollars than 2015 average
Dollars invested and volume of deals with corporate participation*
Powered by Data From i3
8
*Dollar totals inclusive of co-investors
$895
$1,031 $644
$822
$1,320
$841
$934
$874
$773
$1,169
$692
$770 $500
$1,113
$639
$1,138
$903 $712
$853 $649
$765
$1,355
$1,374
$1,205
$740
55
40
51 54
59
67
51
46
71
61
48 52
47
75
47
64
57
63 61
54 52 52
59
43
41
0
10
20
30
40
50
60
70
80
$0
$200
$400
$600
$800
$1,000
$1,200
$1,400
$1,600
1Q10
2Q10
3Q10
4Q10
1Q11
2Q11
3Q11
4Q11
1Q12
2Q12
3Q12
4Q12
1Q13
2Q13
3Q13
4Q13
1Q14
2Q14
3Q14
4Q14
1Q15
2Q15
3Q15
4Q15
1Q16
2010 2011 2012 2013 2014 2015 2016
Mill
ions
$ Investment in Rounds with Corporate Participation Deals with Corporate Participation
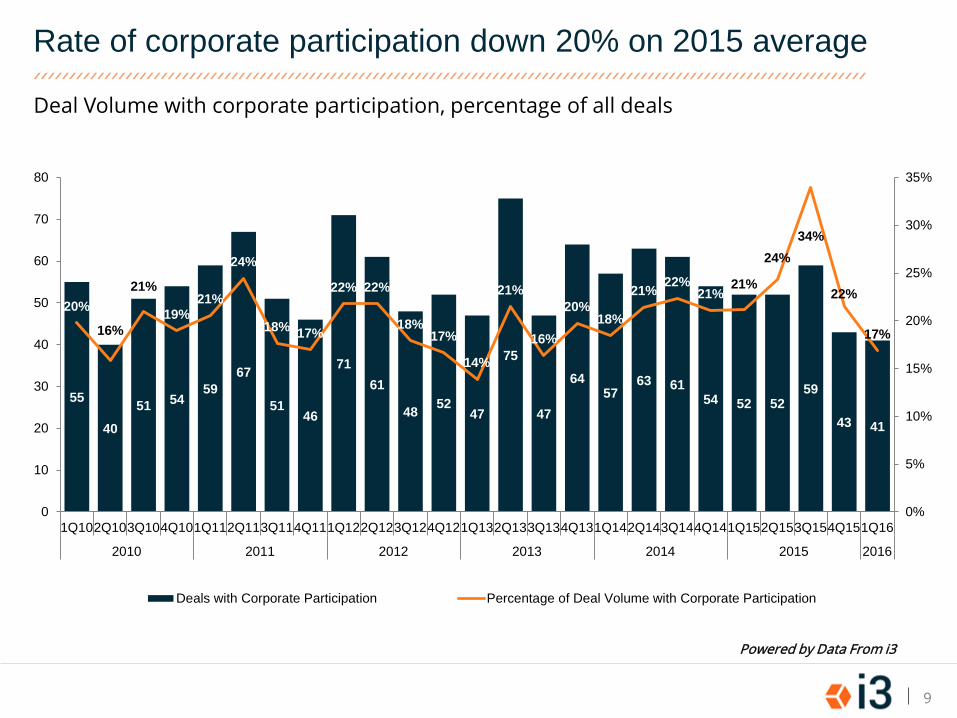
Rate of corporate participation down 20% on 2015 average
Powered by Data From i3
Deal Volume with corporate participation, percentage of all deals
9
55
40 51 54
59 67
51 46
71 61
48 52 47
75
47
64 57
63 61 54 52 52
59
43 41
20%
16%
21%
19% 21%
24%
18% 17%
22% 22%
18% 17%
14%
21%
16%
20% 18%
21% 22% 21%
21%
24% 34%
22%
17%
0%
5%
10%
15%
20%
25%
30%
35%
0
10
20
30
40
50
60
70
80
1Q102Q103Q104Q101Q112Q113Q114Q111Q122Q123Q124Q121Q132Q133Q134Q131Q142Q143Q144Q141Q152Q153Q154Q151Q16
2010 2011 2012 2013 2014 2015 2016
Deals with Corporate Participation Percentage of Deal Volume with Corporate Participation
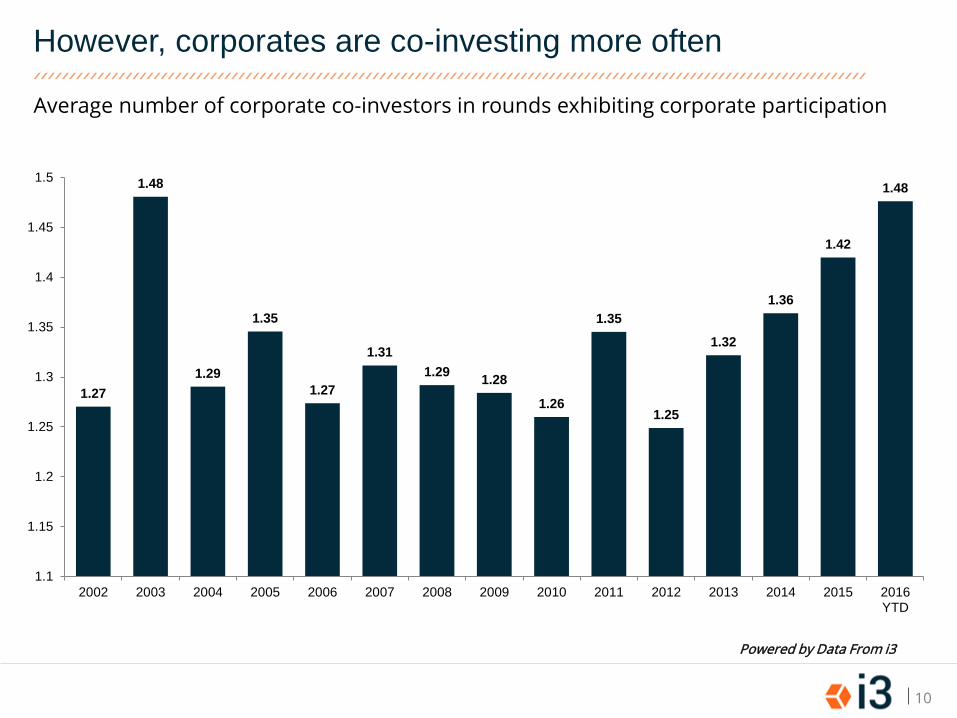
However, corporates are co-investing more often
Powered by Data From i3
Average number of corporate co-investors in rounds exhibiting corporate participation
10
1.27
1.48
1.29
1.35
1.27
1.31 1.29 1.28
1.26
1.35
1.25
1.32
1.36
1.42
1.48
1.1
1.15
1.2
1.25
1.3
1.35
1.4
1.45
1.5
2002 2003 2004 2005 2006 2007 2008 2009 2010 2011 2012 2013 2014 2015 2016YTD
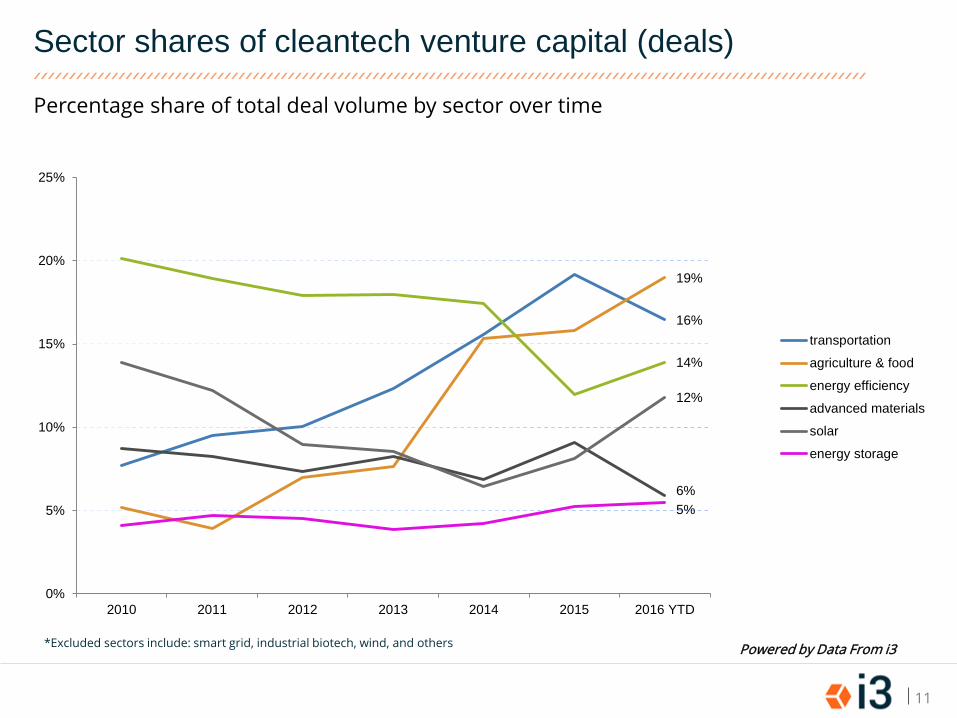
Sector shares of cleantech venture capital (deals)
Powered by Data From i3 *Excluded sectors include: smart grid, industrial biotech, wind, and others
11
Percentage share of total deal volume by sector over time
16%
19%
14%
6%
12%
5%
0%
5%
10%
15%
20%
25%
2010 2011 2012 2013 2014 2015 2016 YTD
transportation
agriculture & food
energy efficiency
advanced materials
solar
energy storage
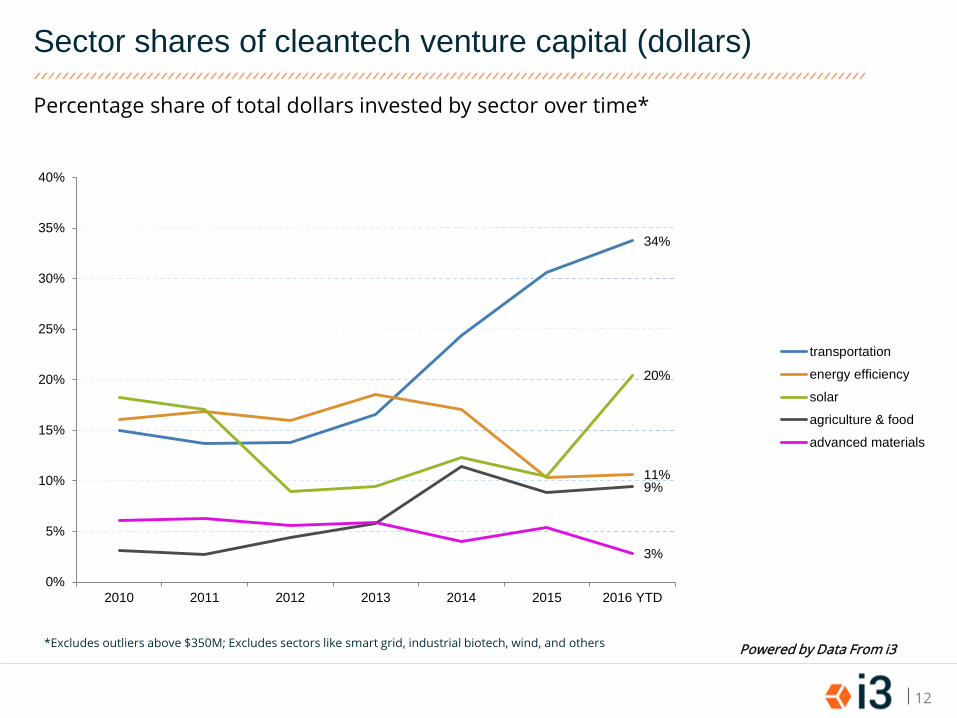
Sector shares of cleantech venture capital (dollars)
Powered by Data From i3 *Excludes outliers above $350M; Excludes sectors like smart grid, industrial biotech, wind, and others
12
Percentage share of total dollars invested by sector over time*
34%
11%
20%
9%
3%
0%
5%
10%
15%
20%
25%
30%
35%
40%
2010 2011 2012 2013 2014 2015 2016 YTD
transportation
energy efficiency
solar
agriculture & food
advanced materials
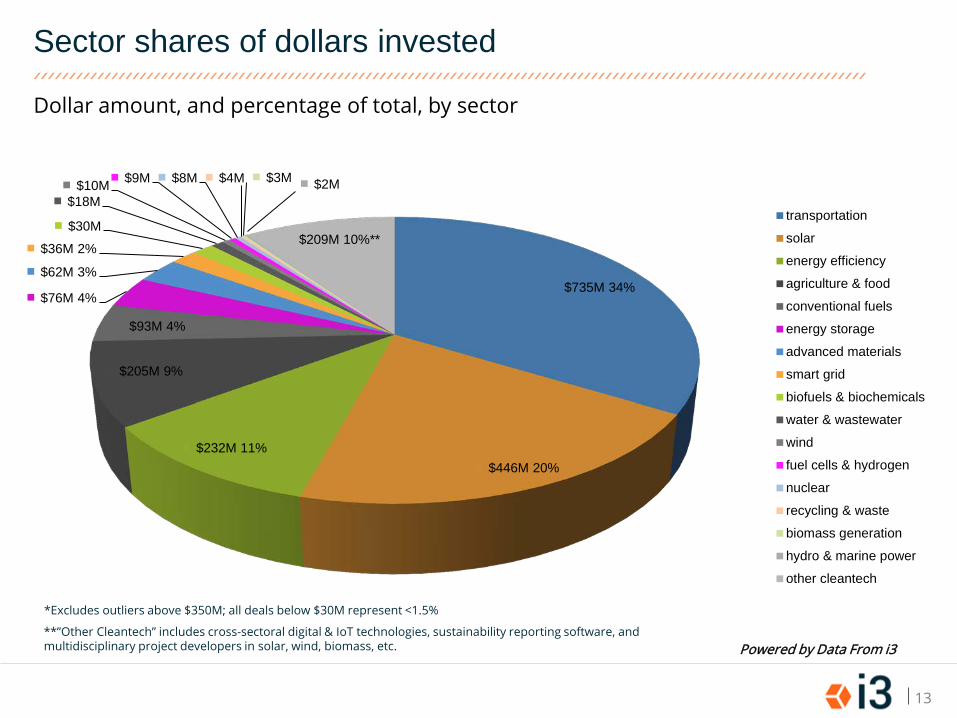
Sector shares of dollars invested
Powered by Data From i3
*Excludes outliers above $350M; all deals below $30M represent <1.5%
13
Dollar amount, and percentage of total, by sector
$735M 34%
$446M 20% $232M 11%
$205M 9%
$93M 4%
$76M 4%
$62M 3%
$36M 2% $30M
$18M $10M $9M $8M $4M $3M $2M
$209M 10%**
transportation
solar
energy efficiency
agriculture & food
conventional fuels
energy storage
advanced materials
smart grid
biofuels & biochemicals
water & wastewater
wind
fuel cells & hydrogen
nuclear
recycling & waste
biomass generation
hydro & marine power
other cleantech
**”Other Cleantech” includes cross-sectoral digital & IoT technologies, sustainability reporting software, and multidisciplinary project developers in solar, wind, biomass, etc.
Industry Trends
Top Venture Deals & Corporate Investors
Exits: M&A Highlights
Contents
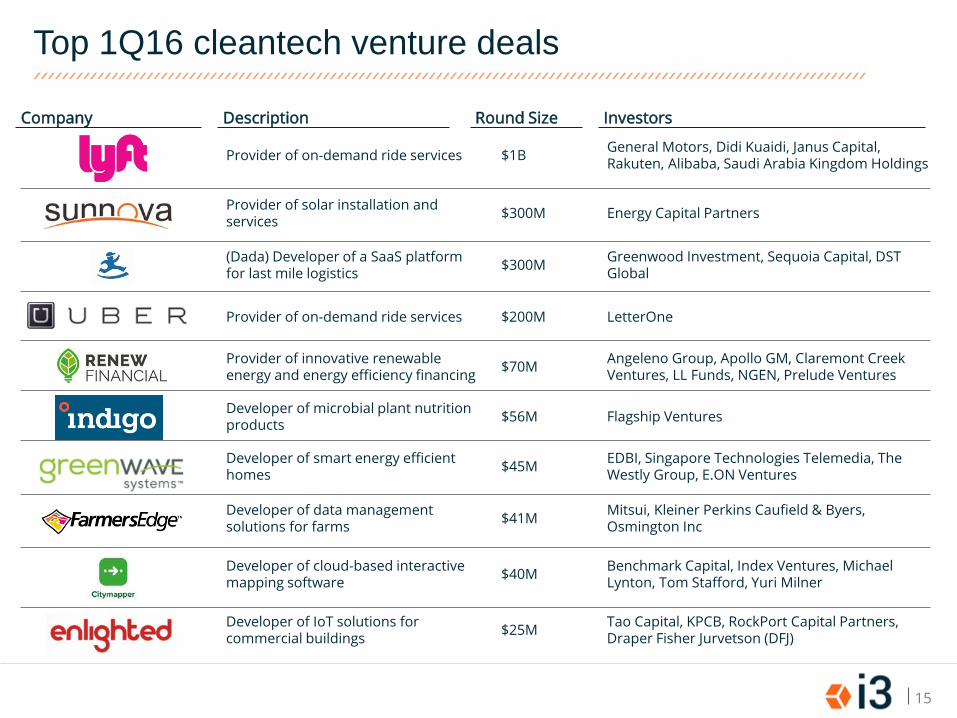
Top 1Q16 cleantech venture deals
Description Round Size Investors Company
Provider of on-demand ride services $1B General Motors, Didi Kuaidi, Janus Capital, Rakuten, Alibaba, Saudi Arabia Kingdom Holdings
Provider of solar installation and services $300M Energy Capital Partners
(Dada) Developer of a SaaS platform for last mile logistics $300M Greenwood Investment, Sequoia Capital, DST
Global
Provider of on-demand ride services $200M LetterOne
Provider of innovative renewable energy and energy efficiency financing $70M Angeleno Group, Apollo GM, Claremont Creek
Ventures, LL Funds, NGEN, Prelude Ventures
Developer of microbial plant nutrition products $56M Flagship Ventures
Developer of smart energy efficient homes $45M EDBI, Singapore Technologies Telemedia, The
Westly Group, E.ON Ventures
Developer of data management solutions for farms $41M Mitsui, Kleiner Perkins Caufield & Byers,
Osmington Inc
Developer of cloud-based interactive mapping software $40M Benchmark Capital, Index Ventures, Michael
Lynton, Tom Stafford, Yuri Milner
Developer of IoT solutions for commercial buildings $25M Tao Capital, KPCB, RockPort Capital Partners,
Draper Fisher Jurvetson (DFJ)
15
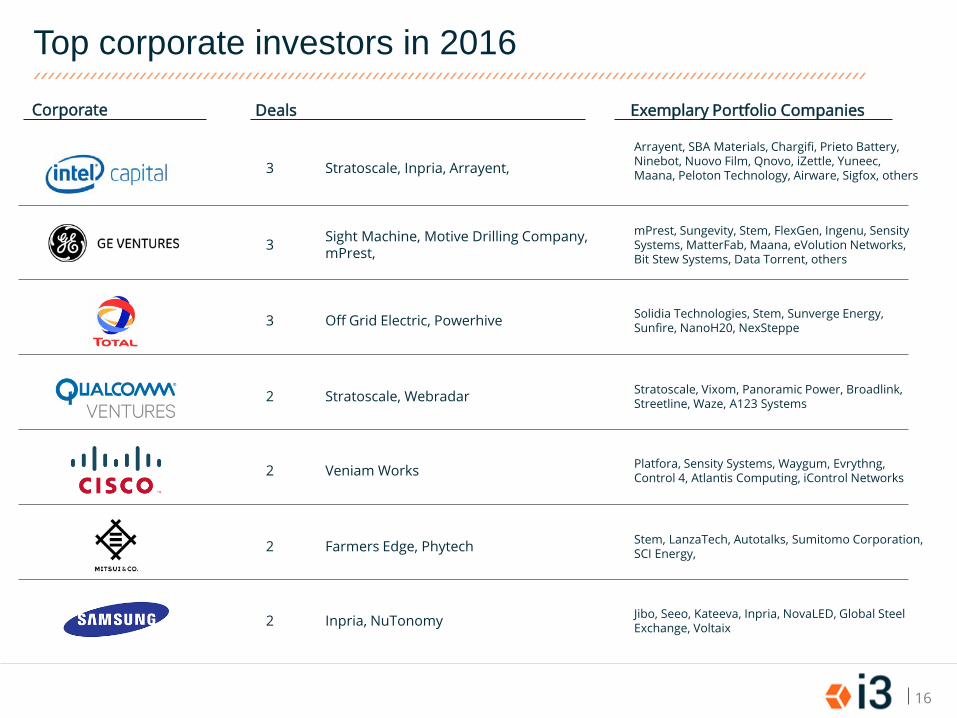
Top corporate investors in 2016
Deals Exemplary Portfolio Companies Corporate
16
3 Stratoscale, Inpria, Arrayent, Arrayent, SBA Materials, Chargifi, Prieto Battery, Ninebot, Nuovo Film, Qnovo, iZettle, Yuneec, Maana, Peloton Technology, Airware, Sigfox, others
3 Sight Machine, Motive Drilling Company, mPrest,
mPrest, Sungevity, Stem, FlexGen, Ingenu, Sensity Systems, MatterFab, Maana, eVolution Networks, Bit Stew Systems, Data Torrent, others
3 Off Grid Electric, Powerhive Solidia Technologies, Stem, Sunverge Energy, Sunfire, NanoH20, NexSteppe
2 Stratoscale, Webradar Stratoscale, Vixom, Panoramic Power, Broadlink, Streetline, Waze, A123 Systems
2 Veniam Works Platfora, Sensity Systems, Waygum, Evrythng, Control 4, Atlantis Computing, iControl Networks
2 Farmers Edge, Phytech Stem, LanzaTech, Autotalks, Sumitomo Corporation, SCI Energy,
2 Inpria, NuTonomy Jibo, Seeo, Kateeva, Inpria, NovaLED, Global Steel Exchange, Voltaix
Industry Trends
Top Venture Deals & Corporate Investors
Exits: M&A Highlights
Contents
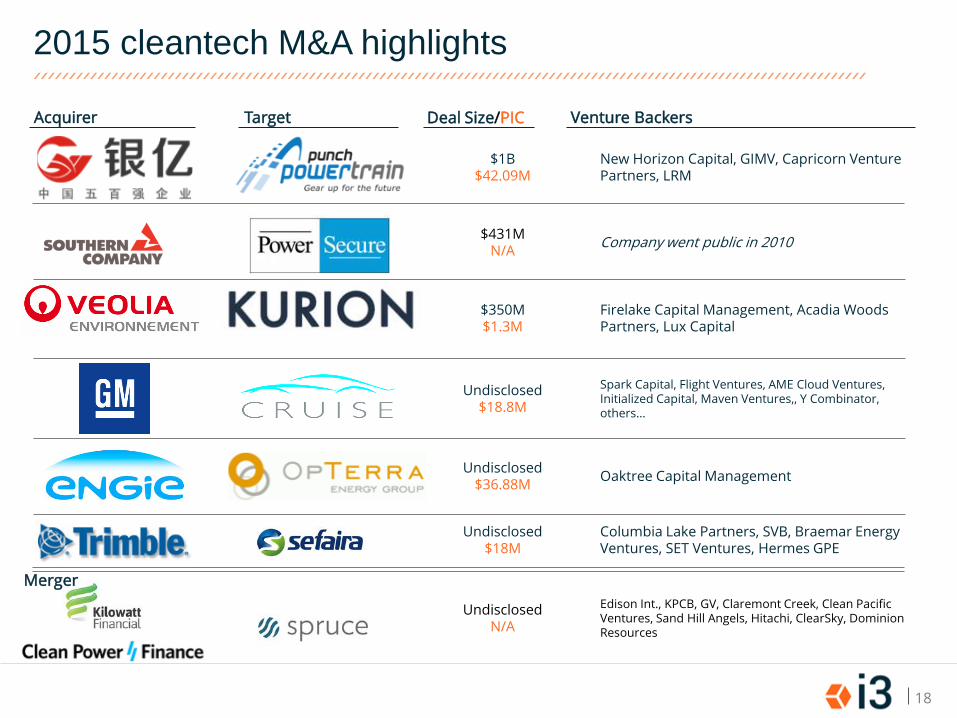
2015 cleantech M&A highlights
Acquirer Target Venture Backers Deal Size/PIC
$1B $42.09M
New Horizon Capital, GIMV, Capricorn Venture Partners, LRM
$431M N/A Company went public in 2010
$350M $1.3M
Firelake Capital Management, Acadia Woods Partners, Lux Capital
Undisclosed $18.8M
Spark Capital, Flight Ventures, AME Cloud Ventures, Initialized Capital, Maven Ventures,, Y Combinator, others…
Undisclosed $36.88M Oaktree Capital Management
Undisclosed $18M
Columbia Lake Partners, SVB, Braemar Energy Ventures, SET Ventures, Hermes GPE
Undisclosed N/A
Edison Int., KPCB, GV, Claremont Creek, Clean Pacific Ventures, Sand Hill Angels, Hitachi, ClearSky, Dominion Resources
18
Merger