i. performance and asset allocation - tmrs 8 q4 2016 staff report... · 2 i. performance and asset...
TRANSCRIPT


2
I. Performance and Asset Allocation
• Asset Allocation: Current and Target Allocations (page 4)
• Performance by Asset Class (page 5)
II. Public Equities • Asset Class Overview (page 7) • Portfolio Management Structure (page 8) • Allocation (page 9-10) • Managers’ Proxy Votes (11) • Performance (page 12-13)
III. Fixed Income
• Core Fixed Income • Asset Class Overview (page 15) • Portfolio Management Structure (page 16) • Allocation (page 17) • Performance (page 18)
• Non-Core Fixed Income • Asset Class Overview (page 19) • Portfolio Management Structure (page 20) • Allocation (page 21) • Performance (page 22)
IV. Real Estate
• Asset Class Overview (page 24) • Portfolio Management Structure (page 25) • Allocation (page 26) • Performance (page 27-29)
V. Real Return • Asset Class Overview (page 31) • Portfolio Management Structure (page 32-33) • Allocation (page 34) • Managers’ Proxy Votes (page 35) • Performance (page 36)
VI. Absolute Return
• Asset Class Overview (page 38) • Portfolio Management Structure (page 39) • Allocation (page 40) • Performance (page 41)
VII. Private Equity
• Asset Class Overview (pages 43) • Portfolio Management Structure (page 44) • Allocation (page 45-46) • Performance (page 47)
VIII. Compliance • Compliance Overview (page 49) • Investment Guideline Compliance (page 50) • Pacing Plan Update (page 51)
IX. Risk Management
• Overview (page 53) • Updates (page 54)

3
I. Performance and Asset Allocation

4
0.0%
5.0%
10.0%
15.0%
20.0%
25.0%
30.0%
Core FixedIncome
US Equities Non-USEquities
Real Return Real Estate PrivateEquity
AbsoluteReturn
Non-CoreFixed Income
CashEquivalents
Perc
ent A
lloca
ted
TMRS Investment Portfolio Asset Allocation as of 12/31/2016
Current Allocation
Allocation RecognizingUnfunded Commitments
Target Allocation

5
1 Year Performance 5 Year Performance
*Real Estate return as of prior quarter end (real estate returns are available on a quarterly basis only) ^Performance is the annualized return since inception, since performance history is less than 5 years Source: State Street Investment Services
7.0%
2.9%
7.6%
13.2%
3.5%
6.9%
12.3%
2.3%
6.8%
2.7%
13.6% 12.7%
4.4% 4.0%
10.0%
0.3% 0.0%
5.0%
10.0%
15.0%
20.0%TMRSBenchmark
6.5%
2.4% 3.8%
14.5%
5.7%
2.2%
11.7%
2.5%
6.2%
2.2% 2.2%
14.7%
5.4%
1.0%
12.4%
0.9%
0.0%
5.0%
10.0%
15.0%
20.0%TMRSBenchmark

6

7
US Equity
Objective Intended to provide capital appreciation and is structured using a Core-Satellite Approach with
the overall objective of exceeding its benchmark performance net of fees over rolling five year periods.
Satellite strategies (Active and Rules-Based strategies with an active component) are expected to add excess return within established tracking error limits and will meet quality, diversification, and liquidity guidelines as specified in the Managers’ contracts.
International Equity
Objective Intended to provide capital appreciation and diversification, and is structured using a Core-
Satellite Approach with the overall objective of exceeding its benchmark performance net of fees over rolling five year periods.
Satellite strategies (Active and Rules-Based strategies with an active component) are expected to add excess return within established tracking error limits and will meet quality, diversification, and liquidity guidelines as specified in the Managers’ contracts or otherwise agreed to in writing between TMRS and the Investment Manager.
8
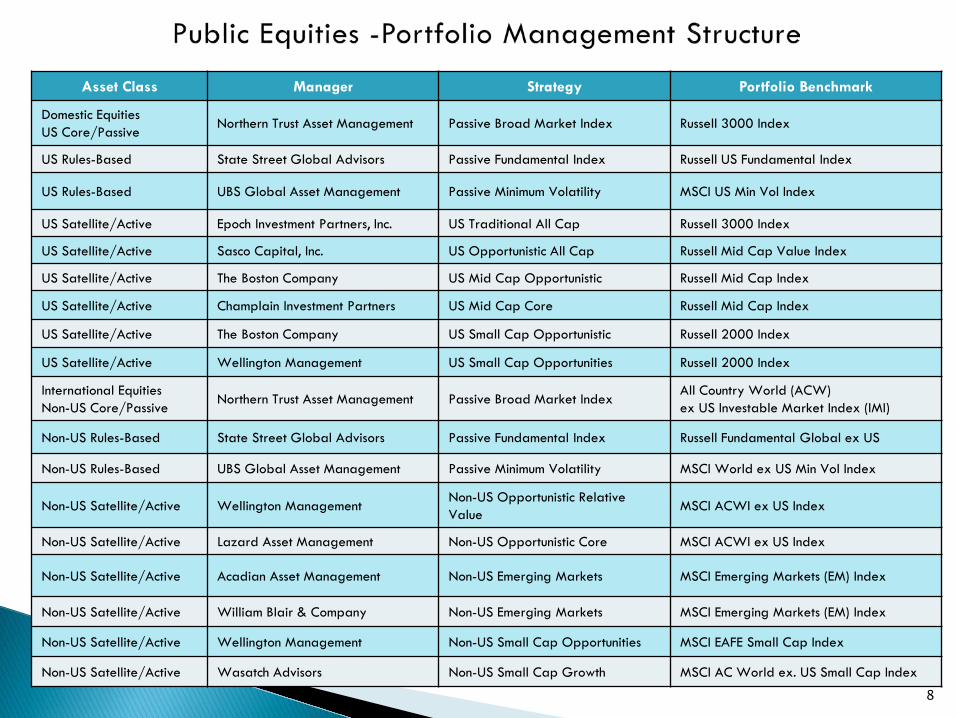
Asset Class Manager Strategy Portfolio Benchmark
Domestic Equities US Core/Passive
Northern Trust Asset Management Passive Broad Market Index Russell 3000 Index
US Rules-Based State Street Global Advisors Passive Fundamental Index Russell US Fundamental Index
US Rules-Based UBS Global Asset Management Passive Minimum Volatility MSCI US Min Vol Index
US Satellite/Active Epoch Investment Partners, Inc. US Traditional All Cap Russell 3000 Index
US Satellite/Active Sasco Capital, Inc. US Opportunistic All Cap Russell Mid Cap Value Index
US Satellite/Active The Boston Company US Mid Cap Opportunistic Russell Mid Cap Index
US Satellite/Active Champlain Investment Partners US Mid Cap Core Russell Mid Cap Index
US Satellite/Active The Boston Company US Small Cap Opportunistic Russell 2000 Index
US Satellite/Active Wellington Management US Small Cap Opportunities Russell 2000 Index
International Equities Non-US Core/Passive
Northern Trust Asset Management Passive Broad Market Index All Country World (ACW) ex US Investable Market Index (IMI)
Non-US Rules-Based State Street Global Advisors Passive Fundamental Index Russell Fundamental Global ex US
Non-US Rules-Based UBS Global Asset Management Passive Minimum Volatility MSCI World ex US Min Vol Index
Non-US Satellite/Active Wellington Management Non-US Opportunistic Relative Value
MSCI ACWI ex US Index
Non-US Satellite/Active Lazard Asset Management Non-US Opportunistic Core MSCI ACWI ex US Index
Non-US Satellite/Active Acadian Asset Management Non-US Emerging Markets MSCI Emerging Markets (EM) Index
Non-US Satellite/Active William Blair & Company Non-US Emerging Markets MSCI Emerging Markets (EM) Index
Non-US Satellite/Active Wellington Management Non-US Small Cap Opportunities MSCI EAFE Small Cap Index
Non-US Satellite/Active Wasatch Advisors Non-US Small Cap Growth MSCI AC World ex. US Small Cap Index

9
% of Total Fund as of 12/31/2016*
PASSIVE Portfolio Managers
Market Value % of Total Portfolio
US CORE EQUITY: NTGI Russell 3000 4,605,230,623 18.4%
NON-US CORE EQUITY: NTGI ACW ex. US IMI
2,434,845,867 9.7%
TOTAL: 7,040,076,490 28.1%
ACTIVE Portfolio Managers
Market Value % of Total Portfolio
US RULES-BASED EQUITY:
671,057,521 2.7%
US ACTIVE EQUITY: 1,468,436,594 5.9%
NON-US RULES-BASED EQUITY:
490,959,812 1.9%
NON-US ACTIVE EQUITY:
1,201,322,629 4.8%
TOTAL: 3,831,776,555 15.3%
NOTE: Percentages may not be exact due to rounding *Prelim market values per State Street Analytics
28.1%
15.3% 17.5% 17.5%
0.0%
5.0%
10.0%
15.0%
20.0%
25.0%
30.0%
PASSIVE Portfolio ACTIVE Portfolio
Current Allocation Target Allocation
5.9% 4.8%
2.7%
1.9%
8.75% 8.75%
0%1%2%3%4%5%6%7%8%9%
10%
US ACTIVEPortfolio
NON-USACTIVEPortfolio
Current Active Current RB Target Allocation

10 As of 12/31/2016
US Passive 18.4% Non-US Passive
9.7%
Non-US RB Active 1.9%
Non-US Active 4.8% US Active 5.9%
US RB Active 2.7%
Current Allocation By Asset Category vs. Total Portfolio
Russell 3000 US Passive
42.4%
ACW ex. US IMI non-US Passive
22.4%
2.1%
2.4%
1.9%
1.7%
1.7% 1.6%
2.0% 2.1% 2.3% 2.1%
2.0% 2.2%
2.5% 2.5%
3.1%
3.1%
Current Allocation by Manager vs. Total Equity Portfolio
Russell 3000
ACWI ex. US IMI
SSgA Global ex. US
UBS World ex. US MV
Wellington Intl Horizons
Lazard Intl Equity Plus
Acadian EM
William Blair EM
Wasatch Intl SC
Wellington Intl SC
Epoch
Sasco
The Boston Co. MC
Champlain
The Boston Co. SC
Wellington US SC
SSgA US Fund
UBS US MV
11
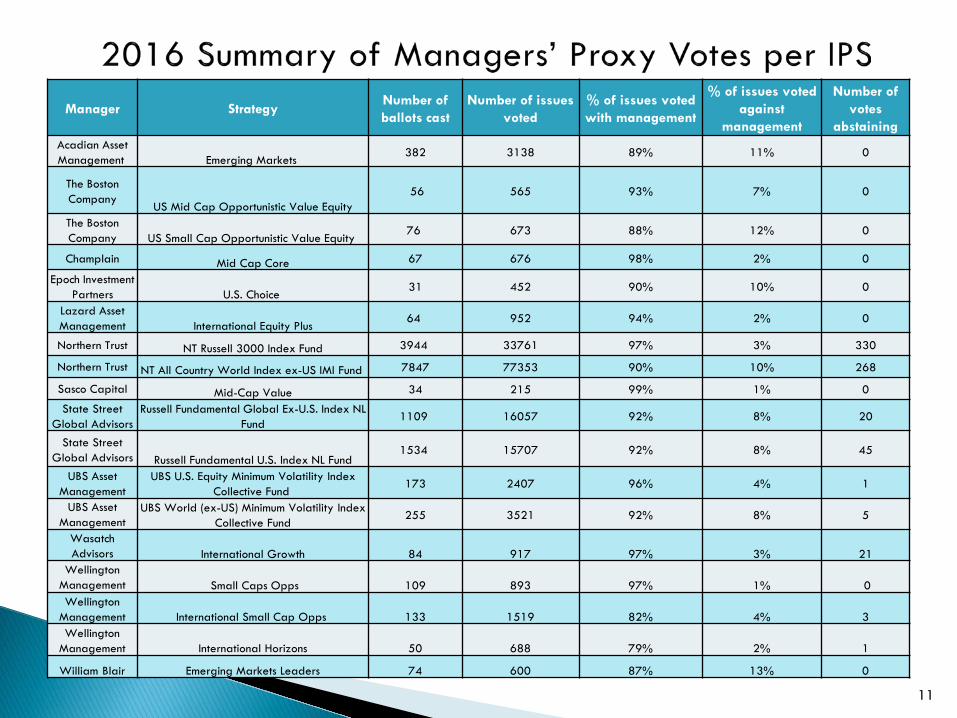
Manager Strategy Number of ballots cast
Number of issues voted
% of issues voted with management
% of issues voted against
management
Number of votes
abstaining Acadian Asset Management Emerging Markets
382 3138 89% 11% 0
The Boston Company
US Mid Cap Opportunistic Value Equity 56 565 93% 7%
0
The Boston Company US Small Cap Opportunistic Value Equity
76 673 88% 12% 0
Champlain Mid Cap Core 67 676 98% 2% 0
Epoch Investment Partners U.S. Choice
31 452 90% 10% 0
Lazard Asset Management International Equity Plus
64 952 94% 2% 0
Northern Trust NT Russell 3000 Index Fund 3944 33761 97% 3% 330
Northern Trust NT All Country World Index ex-US IMI Fund 7847 77353 90% 10% 268
Sasco Capital Mid-Cap Value 34 215 99% 1% 0
State Street Global Advisors
Russell Fundamental Global Ex-U.S. Index NL Fund
1109 16057 92% 8% 20
State Street Global Advisors Russell Fundamental U.S. Index NL Fund
1534 15707 92% 8% 45
UBS Asset Management
UBS U.S. Equity Minimum Volatility Index Collective Fund
173 2407 96% 4% 1
UBS Asset Management
UBS World (ex-US) Minimum Volatility Index Collective Fund
255 3521 92% 8% 5
Wasatch Advisors International Growth 84 917 97% 3% 21
Wellington Management Small Caps Opps 109 893 97% 1% 0 Wellington
Management International Small Cap Opps 133 1519 82% 4% 3 Wellington
Management International Horizons 50 688 79% 2% 1
William Blair Emerging Markets Leaders 74 600 87% 13% 0

12
Source: State Street Investment Analytics - Final
MKT VAL % of plan 1 Month 3 Months YTD 1 Yr. 3 Yrs. 5 Yrs. 7 Yrs. 10 Yrs. ITD Incept Date
NGR0A06 - TMRS - TOTAL DOMESTIC EQUITY 6,744,316,200.37 26.87 1.96 4.28 13.17 13.17 8.25 14.46 12.77 7.68 01-01-08 TMRS - RUSSELL 3000 DAILY 1.95 4.21 12.74 12.74 8.43 14.67 12.92 7.79 01-01-08
Excess 0.01 0.07 0.44 0.44 -0.19 -0.21 -0.16 -0.11 NGR6 - TMRS - RUSSELL 3000 INDEX FUND (NL) 4,605,575,976.04 18.35 1.96 4.23 12.74 12.74 8.42 14.64 12.90 14.83 12-01-08
RUSSELL 3000 (DAILY) 1.95 4.21 12.74 12.74 8.43 14.67 12.92 14.85 12-01-08 Excess 0.00 0.02 0.01 0.01 -0.01 -0.02 -0.03 -0.02 NGTM - SSGA RUSSELL RAFI US 332,070,579.93 1.32 2.04 6.15 16.93 16.93 8.42 13.11 02-01-13
Russell RAFI U.S. Index 2.08 6.27 17.26 17.26 8.59 13.30 02-01-13 Excess -0.04 -0.13 -0.32 -0.32 -0.17 -0.20 NGTN - UBS US EQUITY MIN VOL FUND NL 338,958,902.33 1.35 2.38 0.17 10.54 10.54 10.72 14.17 01-01-13
MSCI USA Minimum Volatility Index-Net 2.32 -0.04 9.84 9.84 10.08 13.49 01-01-13 Excess 0.06 0.20 0.70 0.70 0.63 0.68 NGTY - EPOCH U.S. CHOICE 247,386,770.52 0.99 1.91 4.12 5.08 5.08 6.32 6.32 01-01-14
RUSSELL 3000 (DAILY) 1.95 4.21 12.74 12.74 8.43 8.43 01-01-14 Excess -0.04 -0.09 -7.65 -7.65 -2.11 -2.11 NGTZ - SASCO U.S. CONTRARIAN VALUE 225,014,581.56 0.90 -0.44 2.10 18.02 18.02 2.91 2.91 01-01-14
Russell Midcap Value Total Return Index 1.78 5.52 20.00 20.00 9.45 9.45 01-01-14 Excess -2.22 -3.43 -1.98 -1.98 -6.54 -6.54 NGUG - THE BOSTON COMPANY OPP VALUE 217,205,395.66 0.87 1.81 8.07 16.46 16.46 3.25 12-01-14
RUSSELL MIDCAP (DAILY) 1.14 3.21 13.80 13.80 5.25 12-01-14 Excess 0.67 4.87 2.66 2.66 -2.00 NGUF - CHAMPLAIN MID-CAP CORE 243,210,737.96 0.97 1.85 4.12 19.25 19.25 9.22 12-01-14
RUSSELL MIDCAP (DAILY) 1.14 3.21 13.80 13.80 5.25 12-01-14 Excess 0.72 0.91 5.46 5.46 3.97 NGUR - BOSTON CO US SM CAP OPPORTUNISTIC VALUE 267,529,337.52 1.07 3.30 8.59 16.11 16.11 10.17 09-01-15
RUSSELL 2000 (DAILY) 2.80 8.83 21.31 21.31 14.30 09-01-15 Excess 0.49 -0.25 -5.20 -5.20 -4.13 NGUN - WELLINGTON US SMALL CAP OPP 267,355,063.77 1.07 2.47 7.98 18.32 18.32 12.00 12-01-15
RUSSELL 2000 (DAILY) 2.80 8.83 21.31 21.31 13.95 12-01-15 Excess -0.33 -0.85 -2.98 -2.98 -1.95

13
Source: State Street Investment Analytics - Final
MKT VAL % of plan 1 Month 3 Months YTD 1 Yr. 3 Yrs. 5 Yrs. 7 Yrs. 10 Yrs. ITD Incept Date
NGR0A07 - TMRS - TOTAL INTERNATIONAL EQUITY 4,127,271,568.49 16.44 2.10 -2.97 3.50 3.50 -1.08 5.69 3.09 -0.60 01-01-08 INTL EQ ACTIVE WEIGHTED INDEX(DAILY) 2.50 -1.57 4.41 4.41 -1.44 5.35 2.81 -0.87 01-01-08
Excess -0.40 -1.39 -0.91 -0.91 0.37 0.35 0.28 0.28 NGTA - NTGI ACWI ex. US IMI (NL) 2,434,957,289.28 9.70 2.52 -1.56 4.64 4.64 -1.24 5.57 4.67 09-01-10
TMRS MSCI ACWI ex-US IMI NET (DAILY) 2.50 -1.57 4.41 4.41 -1.44 5.35 4.47 09-01-10 Excess 0.02 0.02 0.23 0.23 0.20 0.23 0.20 NGTP - SSGA RUSSELL RAFI GLOBAL EX-US 231,074,836.56 0.92 3.32 2.12 11.60 11.60 -0.57 3.35 02-01-13
Russell RAFI Global ex-U.S. Index NET 3.49 2.42 12.28 12.28 -0.30 3.52 02-01-13 Excess -0.18 -0.30 -0.69 -0.69 -0.27 -0.18 NGTQ - UBS WORLD EX US MIN VOL FD NL 259,858,788.51 1.04 1.86 -5.70 1.60 1.60 3.91 6.65 01-01-13
MSCI world ex USA Minimum Volatility-Net 1.81 -5.77 1.33 1.33 3.81 6.59 01-01-13 Excess 0.04 0.07 0.26 0.26 0.10 0.06 NGT9 - LAZARD INT'L EQUITY PLUS 189,322,937.36 0.75 2.56 -3.55 0.85 0.85 -3.07 09-01-14
MSCI AC WORLD ex US (NET) 2.56 -1.25 4.50 4.50 -4.33 09-01-14 Excess 0.00 -2.30 -3.64 -3.64 1.27 NGT8 - WELLINGTON INT'L HORIZONS 201,368,877.57 0.80 3.08 -3.67 -1.98 -1.98 -0.46 09-01-14
MSCI AC WORLD ex US (NET) 2.56 -1.25 4.50 4.50 -4.33 09-01-14 Excess 0.52 -2.41 -6.47 -6.47 3.87 NGUP - WILLIAM BLAIR EMERGING MARKETS 175,465,958.97 0.70 -1.04 -7.91 3.65 3.65 3.40 09-01-15
MSCI EMERGING MARKETS 0.22 -4.16 11.19 11.19 6.35 09-01-15 Excess -1.26 -3.75 -7.53 -7.53 -2.95 NGUQ - ACADIAN EMERGING MARKETS 185,006,966.65 0.74 0.38 -3.90 13.56 13.56 7.06 09-01-15
MSCI EMERGING MARKETS IMI INDEX (NET) 0.17 -4.45 9.90 9.90 6.05 09-01-15 Excess 0.21 0.55 3.66 3.66 1.01 NGUX - WASATCH INT'L SMALL CAP GROWTH 220,619,890.06 0.88 -1.08 -10.97 -6.75 -6.75 -6.75 01-01-16
MSCI ACWI Ex US Small Cap (DAILY) 2.12 -3.52 3.91 3.91 3.91 01-01-16 Excess -3.20 -7.45 -10.66 -10.66 -10.66 NGUY - WELLINGTON INT'L SMALL CAP OPP 229,596,023.53 0.91 2.46 -5.09 -2.59 -2.59 -2.59 01-01-16
MSCI EAFE SMALL CAP NET 2.87 -2.86 2.18 2.18 2.18 01-01-16 Excess -0.40 -2.23 -4.77 -4.77 -4.77

14
III. Fixed Income

15
US Core Fixed Income Objective
Purpose is to diversify the risk of the overall investment portfolio with a secondary goal of capital preservation.
Performance objective is to exceed the Barclay’s US Aggregate Bond Index net of fees over rolling five-year periods and within tracking errors as specified in the Manager contracts, determined according to the specific strategies employed.
Investment Philosophy- BlackRock Top down determination of investment themes are based on bottom-up inputs. Investment
themes establish parameters for sector, sub-sector and security selection. Macro overlays for duration and volatility are viewed as a separate sector and used opportunistically.
Investment Philosophy- PIMCO PIMCO’s investment philosophy is driven by diversifying strategies and focuses on longer
term secular (3-5 year) trends. Seek to add value through top down strategies including interest rate exposures, duration,
volatility, yield curve positioning and sector rotation. Employ “bottom-up” strategies through in depth credit analysis and specific security
selection.

16
Manager Strategy Portfolio Benchmark
BlackRock US Core (enhanced index) Barclays US Aggregate Bond Index
PIMCO Active Core Plus Barclays US Aggregate Bond Index

17
As of December 31, 2016
NOTE: Percentages may not be exact due to rounding
Core Weighting vs. Target
19.2%
10.0%
9.2%
0.0%
5.0%
10.0%
15.0%
20.0%
25.0%
Actual Target Difference
Mandate Market Value % of Total Fund
CORE FIXED INCOME
BlackRock $3,088,424,493 12.30%
PIMCO $1,721,297,039 6.86%
TOTAL $4,809,721,532 19.16%

18 Source: State Street Investment Analytics
MKT VAL % of plan 1 Month 3 Months YTD 1 Yr. 3 Yrs. 5 Yrs. 7 Yrs. 10 Yrs. ITD Incept Date
NGR0A03 - TMRS - TOTAL CORE FIXED INCOME 4,809,721,532.25 19.16 0.17 -2.86 2.89 2.89 3.08 2.40 3.74 4.23 7.82 01-01-89
TMRS - Total Fixed Income Index (Daily) 0.14 -2.98 2.65 2.65 3.03 2.23 3.63 4.05 7.27 01-01-89
Excess 0.03 0.11 0.25 0.25 0.05 0.16 0.12 0.18 0.55
NGR4 - TMRS - BLACKROCK CORE FIXED INCOME 3,088,424,493.18 12.30 0.21 -2.79 2.94 2.94 3.19 2.43 3.74 3.64 10-01-09
TMRS-Custom Core Fixed Income Index (Daily) 0.14 -2.98 2.65 2.65 3.03 2.23 3.63 3.53 10-01-09
Excess 0.06 0.18 0.29 0.29 0.16 0.19 0.12 0.11
NGR9 - TMRS PIMCO CORE PLUS FIXED INC 1,721,297,039.05 6.86 0.11 -2.98 2.83 2.83 2.75 2.37 3.65 02-01-10
BBG BARC Agg (Dly) 0.14 -2.98 2.65 2.65 3.03 2.23 3.44 02-01-10
Excess -0.03 -0.01 0.19 0.19 -0.28 0.14 0.21

19
Objective The purpose is to enhance total return through income and capital appreciation and provide
diversification to the total investment portfolio. This allocation may be managed actively and/or passively through multiple managers in consideration of manager concentration risk.
The Performance Objectives is to exceed the returns of a blended benchmark comprised of the Barclays US Corporate High Yield Index 50%, the JPM GBI-EM Global Diversified Index (USD Unhedged) 25%, and JPM CEMBI Broad Diversified Index 25%, net of fees over rolling five-year periods and within tracking errors as specified in the manager contracts or otherwise agreed to in writing, determined according to the specific strategies employed.

20
Manager Strategy Allocated/Committed Portfolio Benchmark
Highland Capital Bank Loan/CLO Debt $ 375,000,000 Credit Suisse Leveraged Loan Index
Guggenheim Bank Loan/CLO Debt $ 375,000,000 Credit Suisse Leveraged Loan Index
Voya RMBS/CMBS $ 375,000,000 33% Barclays US Agg Corp Index and 67% Barclays US Corp High Yield Index
Ellington RMBS/CMBS $ 375,000,000 33% Barclays US Agg Corp Index and 67% Barclays US Corp High Yield Index
Alliance Bernstein** EMD $ 240,000,000 20% JP Morgan EMBI, 40% JP Morgan CEMBI and 40% JP Morgan GBI
Bluebay** EMD $ 240,000,000 20% JP Morgan EMBI, 40% JP Morgan CEMBI and 40% JP Morgan GBI
Golub* Direct Lending $ 300,000,000
H.I.G. Whitehorse* Direct Lending $ 150,000,000
TCW* Direct Lending $ 300,000,000
White Oak* Direct Lending $ 200,000,000
Marathon SPS* Opportunistic Credit $ 150,000,000
Marathon ECO* Opportunistic Credit $ 100,000,000
Marathon CLO* Opportunistic Credit
$ 50,000,000
PIMCO COF II* Opportunistic Credit $ 200,000,000
Beach Point Opportunistic Credit $ 200,000,000
Columbia** High Yield $ 300,000,000 BofA Merrill Lynch US High Yield Constrained Index
Neuberger Berman** High Yield $ 300,000,000 BofA Merrill Lynch US High Yield Constrained Index
Adams Street** Direct Lending $ 200,000,000
Bain** Opportunistic Credit $ 100,000,000
GoldenTree** Opportunistic Credit $ 200,000,000
Waterfall** Opportunistic Credit $ 200,000,000
Note: * Partially funded ** Approved. Funding pending.

21
As of December 31, 2016
Non-Core Weighting vs. Target
NOTE: Percentages may not be exact due to rounding * Partially funded ** Approved. Funding pending + On a committed basis
Mandate Market Value % of Total Fund
NON-CORE FIXED INCOME Guggenheim $407,591,449 1.62% Highland $407,970,649 1.63% Voya $401,097,579 1.60% Ellington $399,825,599 1.59% Alliance Bernstein** $240,000,000 0.96% Bluebay** $240,000,000 0.96% Golub* $300,000,000 1.20% H.I.G. Whitehorse* $150,000,000 0.60% TCW* $300,000,000 1.20% White Oak* $200,000,000 0.80% Adams Street** $200,000,000 0.80% Marathon SPS* $150,000,000 0.60% Marathon ECO* $100,000,000 0.40% Marathon CLO* $50,000,000 0.20% PIMCO COF II* $200,000,000 0.80% Beach Point $206,091,200 0.82% Columbia** $300,000,000 1.20% Neuberger Berman** $300,000,000 1.20% Bain** $100,000,000 0.40% GoldenTree** $200,000,000 0.80% Waterfall** $200,000,000 0.80% TOTAL $5,052,576,476 20.13%
20.1% 20.0%
0.1%
0.0%
5.0%
10.0%
15.0%
20.0%
25.0%
Actual+ Target Difference

22 Source: State Street Investment Analytics
Non-Core Fixed Income Performance
Period Ending December 31, 2016 (Net All)
MKT VAL % of plan 1 Month 3 Months YTD 1 Yr. 3 Yrs. 5 Yrs. 7 Yrs. 10 Yrs. ITD Incept Date
NGR0A11 - TOTAL NON-CORE FIXED INCOME 2,092,565,799.99 8.34 1.09 2.19 7.62 7.62 3.81 10-01-14 TOT NON-CORE FIXED INCOME INDEX 1.59 -0.99 13.56 13.56 2.18 10-01-14
Excess -0.49 3.18 -5.94 -5.94 1.64 NGT6 - BANDERA II - GUGGENHEIM 407,591,448.77 1.62 0.85 1.76 8.33 8.33 4.25 10-01-14 CS Leveraged Loan Index 1.15 2.25 9.88 9.88 3.92 10-01-14
Excess -0.29 -0.49 -1.55 -1.55 0.32 NGT5 - BANDERA I - HIGHLAND 407,970,649.26 1.63 1.98 3.73 12.57 12.57 4.52 10-01-14 CS Leveraged Loan Index 1.15 2.25 9.88 9.88 3.92 10-01-14
Excess 0.83 1.48 2.69 2.69 0.59 NGUB - VOYA NON CORE FIXED INCOME 401,097,579.03 1.60 0.51 1.65 4.75 4.75 3.61 01-01-15 Non Agency RMBS/CMBS Strategy Index 1.46 0.23 13.41 13.41 4.78 01-01-15
Excess -0.95 1.43 -8.66 -8.66 -1.18 NGUD - ELLINGTON NON CORE FIXED INC 399,825,599.06 1.59 0.58 1.54 5.42 5.42 3.47 01-01-15 Non Agency RMBS/CMBS Strategy Index 1.46 0.23 13.41 13.41 4.78 01-01-15
Excess -0.88 1.31 -7.99 -7.99 -1.32 NGRV - GOLUB CAPITAL PEARLS DLP LP 51,765,132.73 0.21 0.28 1.91 4.53 07-01-16 NGXA - MARATHON SPS FUND, L.P. 66,851,822.25 0.27 -0.25 3.06 4.01 08-01-16 MARATHON SPS FUND Index -0.25 3.06 4.01 08-01-16 Excess 0.00 0.00 0.00 NGXB - PIMCO CORP OP FD II ONSHORE LP 25,657,149.72 0.10 6.90 4.31 4.31 10-01-16 TOT NON-CORE FIXED INCOME INDEX 1.59 -0.99 -0.99 10-01-16 Excess 5.32 5.30 5.30 NGXD - BEACH POINT TOTAL RET FD II LP 206,091,200.00 0.82 1.70 2.56 2.56 10-01-16 TOT NON-CORE FIXED INCOME INDEX 1.59 -0.99 -0.99 10-01-16 Excess 0.11 3.54 3.54 NGRU - WHITE OAK SUMMIT FUND, L.P 90,210,750.57 0.36 1.81 1.88 3.54 05-01-16 NGSV - MARATHON CLO EQUITY FD, L.P. 4,621,579.21 0.02 0.00 -0.02 11-01-16 TOT NON-CORE FIXED INCOME INDEX 1.59 -0.97 11-01-16 Excess -1.59 0.94 NGXE - TCW ASSET MANAGEMENT LLC 9,900,000.01 0.04 12-01-16 CS Leveraged Loan Index 1.15 12-01-16 Excess NGXF - H.I.G. WHITEHORSE CAPITAL, LLC 9,912,500.01 0.04 0.00 0.00 12-01-16 CS Leveraged Loan Index 1.15 1.15 12-01-16 Excess -1.15 -1.15 NGSW - MARATHON ECO FUND III, LP 11,070,389.37 0.04 -0.27 -0.24 -0.24 10-01-16 TOT NON-CORE FIXED INCOME INDEX 1.59 -0.99 -0.99 10-01-16 Excess -1.86 0.75 0.75

23
IV. Real Estate

24
Objective To enhance total return and provide diversification to the overall investment portfolio. Due to the illiquid and cyclical nature of the real estate asset class, Staff and the Real Estate
Investment Consultant recommend that the target allocation be invested over a multi-year period in order to avoid considerable vintage year risks.
Performance Objective Long term performance objective is a real rate of return (adjusted for inflation) of five percent
(5%) net of investment management fees. The real estate portfolio is expected to generate returns net of all fees and expenses, in excess
of their respective indices, over rolling five year investment time horizons.
25
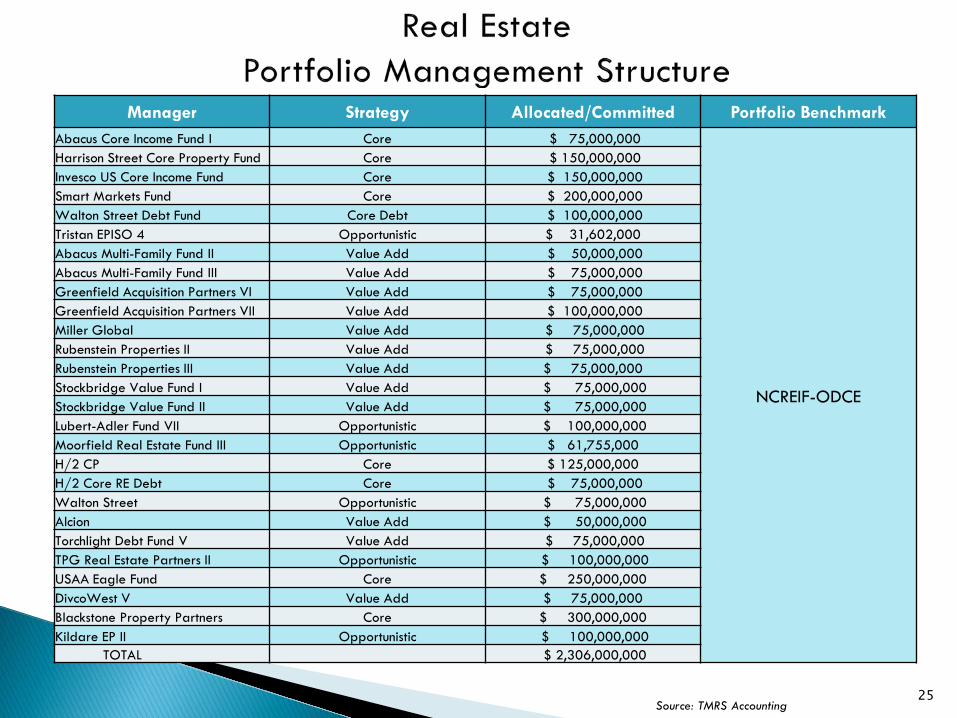
Manager Strategy Allocated/Committed Portfolio Benchmark Abacus Core Income Fund I Core $ 75,000,000
NCREIF-ODCE
Harrison Street Core Property Fund Core $ 150,000,000 Invesco US Core Income Fund Core $ 150,000,000 Smart Markets Fund Core $ 200,000,000 Walton Street Debt Fund Core Debt $ 100,000,000 Tristan EPISO 4 Opportunistic $ 31,602,000 Abacus Multi-Family Fund II Value Add $ 50,000,000 Abacus Multi-Family Fund III Value Add $ 75,000,000 Greenfield Acquisition Partners VI Value Add $ 75,000,000 Greenfield Acquisition Partners VII Value Add $ 100,000,000 Miller Global Value Add $ 75,000,000 Rubenstein Properties II Value Add $ 75,000,000 Rubenstein Properties III Value Add $ 75,000,000 Stockbridge Value Fund I Value Add $ 75,000,000 Stockbridge Value Fund II Value Add $ 75,000,000 Lubert-Adler Fund VII Opportunistic $ 100,000,000 Moorfield Real Estate Fund III Opportunistic $ 61,755,000 H/2 CP Core $ 125,000,000 H/2 Core RE Debt Core $ 75,000,000 Walton Street Opportunistic $ 75,000,000 Alcion Value Add $ 50,000,000 Torchlight Debt Fund V Value Add $ 75,000,000 TPG Real Estate Partners II Opportunistic $ 100,000,000 USAA Eagle Fund Core $ 250,000,000 DivcoWest V Value Add $ 75,000,000 Blackstone Property Partners Core $ 300,000,000 Kildare EP II Opportunistic $ 100,000,000
TOTAL $ 2,306,000,000
Source: TMRS Accounting

26 Source: Courtland Q3 2016 Report
Property Type Diversification Based on Market Value Geographic Diversification Based on Market Value
Sector Diversification Based on Market Value

27 Source: State Street Investment Analytics, December 31, 2016 Report
MKT VAL % of plan 1 Month 3 Months YTD 1 Yr. 3 Yrs. 5 Yrs. 7 Yrs. 10 Yrs. ITD Incept Date
NGR0A09 - TMRS - TOTAL REAL ESTATE 2,133,170,547.95 8.50 2.49 2.60 12.33 12.33 14.52 11.72 11.32 11-01-11
TOTAL REAL ESTATE INDEX 2.07 2.07 9.98 9.98 12.44 12.39 12.72 11-01-11
Excess 0.42 0.53 2.36 2.36 2.09 -0.67 -1.39
NGR0A10 - PRIVATE REAL ESTATE EX LIQUID FUNDS 1,995,566,047.94 7.95 2.60 2.60 12.40 12.40 14.80 12.32 11.90 11-01-11
NCREIF ODCE 1 QTR LAG 2.07 2.07 10.08 10.08 12.45 12.40 12.73 11-01-11
Excess 0.54 0.54 2.32 2.32 2.35 -0.08 -0.83
NGTD - SMART MARKETS FUND LP 305,051,465.01 1.22 2.75 2.75 10.00 10.00 11.60 11.11 11.11 01-01-12
NCREIF ODCE 1 QTR LAG 2.07 2.07 10.08 10.08 12.45 12.40 12.40 01-01-12
Excess 0.69 0.69 -0.08 -0.08 -0.85 -1.28 -1.28
NGTE - HARRISON ST REAL ESTATE - CORE OPEN END 222,839,009.66 0.89 1.40 1.40 9.02 9.02 9.94 9.28 9.28 01-01-12
NCREIF ODCE 1 QTR LAG 2.07 2.07 10.08 10.08 12.45 12.40 12.40 01-01-12
Excess -0.67 -0.67 -1.06 -1.06 -2.51 -3.12 -3.12
NGTF - GREENFIELD ACQUISITION PTRS VI 36,722,163.11 0.15 0.72 0.72 0.77 0.77 11.17 11.43 07-01-12
NCREIF ODCE 1 QTR LAG 2.07 2.07 10.08 10.08 12.45 12.42 07-01-12
Excess -1.34 -1.34 -9.31 -9.31 -1.28 -0.99
NGTG - STOCKBRIDGE VALUE FUND 27,227,628.72 0.11 3.31 3.31 17.17 17.17 22.41 22.53 10-01-12
NCREIF ODCE 1 QTR LAG 2.07 2.07 10.08 10.08 12.45 12.53 10-01-12
Excess 1.24 1.24 7.09 7.09 9.96 10.00
NGTH - WALTON ST REAL ESTATE FUND VII 57,622,888.05 0.23 2.96 2.96 11.36 11.36 19.56 17.71 07-01-13
NCREIF ODCE 1 QTR LAG 2.07 2.07 10.08 10.08 12.45 12.89 07-01-13
Excess 0.90 0.90 1.28 1.28 7.11 4.81
NGTI - ABACUS MULTI-FAMILY PTRS II 5,295,925.66 0.02 2.91 2.91 37.04 37.04 35.21 26.39 08-01-12
NCREIF ODCE 1 QTR LAG 2.07 2.07 10.08 10.08 12.45 12.67 08-01-12
Excess 0.84 0.84 26.96 26.96 22.76 13.72
NGTJ - RUBENSTEIN PROPERTIES FUND II 45,481,902.92 0.18 0.88 0.88 0.25 0.25 19.09 14.05 04-01-13
NCREIF ODCE 1 QTR LAG 2.07 2.07 10.08 10.08 12.45 12.78 04-01-13
Excess -1.19 -1.19 -9.83 -9.83 6.64 1.27

28 Source: State Street Investment Analytics, December 31, 2016 Report
MKT VAL % of plan 1 Month 3 Months YTD 1 Yr. 3 Yrs. 5 Yrs. 7 Yrs. 10 Yrs. ITD Incept Date
NGTL - MILLER GLOBAL FUND VII 28,643,926.76 0.11 4.63 4.63 13.16 13.16 24.21 13.71 10-01-12
NCREIF ODCE 1 QTR LAG 2.07 2.07 10.08 10.08 12.45 12.53 10-01-12
Excess 2.56 2.56 3.08 3.08 11.76 1.18
NGTV - LUBERT-ADLER FUND VII 85,228,761.87 0.34 0.13 0.13 6.90 6.90 1.98 1.98 01-01-14
NCREIF ODCE 1 QTR LAG 2.07 2.07 10.08 10.08 12.45 12.45 01-01-14
Excess -1.94 -1.94 -3.18 -3.18 -10.47 -10.47
NGTX - ABACUS CORE INCOME FUND I LP 68,833,491.08 0.27 2.10 2.10 15.70 15.70 8.73 8.73 01-01-14
NCREIF ODCE 1 QTR LAG 2.07 2.07 10.08 10.08 12.45 12.45 01-01-14
Excess 0.04 0.04 5.62 5.62 -3.72 -3.72
NGTW - INVESCO ADVISERS, INC. 185,476,634.75 0.74 3.02 3.02 12.72 12.72 11.57 11.57 01-01-14
NCREIF ODCE 1 QTR LAG 2.07 2.07 10.08 10.08 12.45 12.45 01-01-14
Excess 0.96 0.96 2.64 2.64 -0.88 -0.88
NGT3 - GREENFIELD ACQ PART VII LP 87,839,406.83 0.35 0.57 0.57 13.80 13.80 13.22 01-01-15
NCREIF ODCE 1 QTR LAG 2.07 2.07 10.08 10.08 12.48 01-01-15
Excess -1.49 -1.49 3.72 3.72 0.74
NGT4 - STOCKBRIDGE VALUE FD II LP 60,075,976.36 0.24 4.21 4.21 15.00 15.00 12.11 02-01-15
NCREIF ODCE 1 QTR LAG 2.07 2.07 10.08 10.08 13.08 02-01-15
Excess 2.14 2.14 4.92 4.92 -0.97
NGUJ - ABACUS MULTI-FAMILY III 42,794,885.21 0.17 6.08 6.08 32.85 32.85 7.27 02-01-15
NCREIF ODCE 1 QTR LAG 2.07 2.07 10.08 10.08 13.08 02-01-15
Excess 4.01 4.01 22.77 22.77 -5.82
NGUL - MOORFIELD REAL ESTATE III 27,185,522.39 0.11 -8.09 -8.09 19.89 19.89 10.82 02-01-15
NCREIF ODCE 1 QTR LAG 2.07 2.07 10.08 10.08 13.08 02-01-15
Excess -10.16 -10.16 9.81 9.81 -2.27
NGUH - WALTON STREET REAL ESTATE DEBT FUND 38,683,807.04 0.15 1.85 1.85 5.07 5.07 4.67 12-01-15
NCREIF ODCE 1 QTR LAG 2.07 2.07 10.08 10.08 12.96 12-01-15
Excess -0.22 -0.22 -5.01 -5.01 -8.30

29 Source: State Street Investment Analytics, December 31, 2016 Report
MKT VAL % of plan 1 Month 3 Months YTD 1 Yr. 3 Yrs. 5 Yrs. 7 Yrs. 10 Yrs. ITD Incept Date
NGAS - TORCHLIGHT DEBT OPP FUND V,LP 19,507,481.25 0.08 9.83 9.83 11.66 11.66 10.70 12-01-15 NCREIF ODCE 1 QTR LAG 2.07 2.07 10.08 10.08 12.96 12-01-15
Excess 7.76 7.76 1.58 1.58 -2.26 NGAR - TPG REAL ESTATE PART II, LP 38,468,195.54 0.15 28.70 28.70 79.45 79.45 71.44 12-01-15
NCREIF ODCE 1 QTR LAG 2.07 2.07 10.08 10.08 12.96 12-01-15 Excess 26.64 26.64 69.37 69.37 58.47 NGAP - ALCION RE PART FD III-B,LP 10,322,737.98 0.04 -5.24 -5.24 -4.63 -4.63 -3.98 11-01-15
NCREIF ODCE 1 QTR LAG 2.07 2.07 10.08 10.08 12.00 11-01-15 Excess -7.30 -7.30 -14.71 -14.71 -15.98 NGAM - EUROPEAN PROPERTY INV SPECIAL 4,954,330.21 0.02 5.76 5.76 2.23 2.23 2.06 12-01-15
NCREIF ODCE 1 QTR LAG 2.07 2.07 10.08 10.08 12.96 12-01-15 Excess 3.69 3.69 -7.85 -7.85 -10.91 NGAQ - USAA EAGLE REAL ESTATE FD 202,303,888.28 0.81 3.19 3.19 9.94 9.94 9.13 12-01-15
NCREIF ODCE 1 QTR LAG 2.07 2.07 10.08 10.08 12.96 12-01-15 Excess 1.12 1.12 -0.14 -0.14 -3.83 NGAV - H/2 CP CORE RE DEBT FUND,LP 76,496,700.00 0.30 2.75 2.75 4.86 04-01-16
NCREIF ODCE 1 QTR LAG 2.07 2.07 6.52 04-01-16 Excess 0.68 0.68 -1.66 NGRY - DIVCOWEST FUND V 3,542,819.26 0.01 12-01-16 NCREIF ODCE 1 QTR LAG 2.07 12-01-16 Excess NGRZ - BLACKSTONE PROPERTY PARTNERS 299,999,983.71 1.20 0.00 0.00 12-01-16 NCREIF ODCE 1 QTR LAG 2.07 2.07 12-01-16 Excess -2.07 -2.07 NGAN - RUBENSTEIN PROP FD III LP 14,966,516.25 0.06 -3.92 -3.92 -3.92 10-01-16 NCREIF ODCE 1 QTR LAG 2.07 2.07 2.07 10-01-16 Excess -5.98 -5.98 -5.98 NGR0A017 - REAL ESTATE LIQUID FUNDS 137,604,500.00 0.55 0.89 2.53 11.79 11.79 8.58 11-01-15 NGAU - H/2 CP, LP 137,604,500.00 0.55 0.89 2.53 11.79 11.79 8.58 11-01-15
NCREIF OPEN FUND INDEX (DAILY) 2.11 2.11 8.77 8.77 10.55 11-01-15 Excess -1.23 0.41 3.02 3.02 -1.96

30
V. Real Return

31
Objective Purpose is to enhance total return and provide diversification and hedge against inflation risks
to the overall investment portfolio. Due to the varied nature of the Real Return space the portfolio will include strategies across a
variety of real asset types as well as a number of investment vehicle types in order to maintain a diversified approach.
Performance Objective Long term performance objective over a period 5 years or a full market cycle is a real rate of
return (adjusted for inflation) of CPI + 400 basis points. On a short term basis the real return portfolio is expected to generate returns net of all fees
and expenses, in excess of their respective indices individually and in excess of the Barclay’s World Government Inflation Linked Bond Index for the portfolio as a whole.

32
Manager Strategy Portfolio Benchmark
Colchester Active Global Linkers Barclays World Govt Infl-Linked Bond Index
Nuveen
Real Asset Income – Public Securities
28% S&P Global Infrastructure Index, 21% FTSE EPRA/NAREIT Developed Index, 18% Wells Fargo Hybrid and Preferred Securities REIT Index, 15% Barclays Global Capital Securities Index, 18% Barclays U.S. Corporate High Yield Index
Cohen & Steers Real Asset Multi-Strategy 27.5% Bloomberg Commodity Index, 27.5% FTSE NAREIT Developed Real Estate Index (Net), 15% Dow Jones Brookfield Global Infrastructure Index, 15% S&P Global Natural Resources Index—Net), 10% BAML US Corporate Index, 1–3 Years and 5% Gold Index

33
Manager Strategy Allocated/Committed Portfolio Benchmark
Magnetar Energy Finance $100,000,000
Barclays World Govt Infl-
Linked Bond Index
Orion Mining Finance
$100,000,000
Amerra Agriculture Finance $100,000,000
Brookfield Infrastructure $150,000,000
Source: TMRS Accounting

34
*Source: Colchester 1. Barclays World Government Inflation-Linked Bond Index USD Unhedged 2. TMRS inception date Feb. 1, 2011 3. Annualized returns since inception

35
Quarter Ending Manager Strategy Number of ballots cast
Number of issues voted
% of issues voted with
management
% of issues voted against management
Number of votes
abstaining
3/31/2016 Nuveen Asset Management Real Asset Income 0 0 NA NA NA
6/30/2016 Nuveen Asset Management Real Asset Income 68 611 87.69% 12.31% 2
9/30/2016 Nuveen Asset Management Real Asset Income 15 109 94.50% 5.50% 0
12/31/2016 Nuveen Asset Management Real Asset Income 20 104 85.44% 14.56% 0
3/31/2016 Cohen & Steers Real Assets Multi-
Strat 9 92 98.90% 1.09% 0
Since inception through 9/30/16 Cohen & Steers
Real Assets Multi-Strat 11 114 94.70% 5.30% 0
12/31/2016 Cohen & Steers Real Assets Multi-
Strat 78 127 88.98% 9.45% 0

36 Source: State Street Investment Analytics
MKT VAL % of plan 1 Month 3 Months YTD 1 Yr. 3 Yrs. 5 Yrs. 7 Yrs. 10 Yrs. ITD Incept Date
NGR0A08 - TMRS - TOTAL REAL RETURN 2,301,882,917.93 9.17 1.07 -3.13 6.90 6.90 1.68 2.18 3.00 02-01-11
BBG BARC Wld Inf-Lk Bd TR 0.82 -5.31 4.02 4.02 1.05 0.98 2.47 02-01-11
Excess 0.25 2.18 2.87 2.87 0.63 1.20 0.53
NGR0A020 - REAL RETURN PUBLIC MARKETS 2,148,334,900.10 8.56 1.37 -3.12 6.06 6.06 1.41 2.02 2.86 02-01-11
BBG BARC Wld Inf-Lk Bd TR 0.82 -5.31 4.02 4.02 1.05 0.98 2.47 02-01-11
Excess 0.55 2.18 2.04 2.04 0.36 1.04 0.40
NGTB - COLCHEST GLBL INFLTN-LINK BNDS 644,009,010.53 2.57 0.08 -5.38 1.98 1.98 0.09 1.22 2.18 02-01-11
BBG BARC Wld Inf-Lk Bd TR 0.82 -5.31 4.02 4.02 1.05 0.98 2.47 02-01-11
Excess -0.74 -0.07 -2.05 -2.05 -0.96 0.24 -0.28
NGRQ - NUVEEN REAL ASSET INCOME 738,657,442.96 2.94 2.01 -3.15 5.08 04-01-16
Nuveen Custom Benchmark 2.26 -3.12 3.86 04-01-16
Excess -0.25 -0.03 1.22
NGRS - COHEN & STEERS REAL ASSET 765,668,446.60 3.05 1.87 0.81 5.24 06-01-16
Cohen & Steers Custom Benchmark 2.02 -1.29 2.95 06-01-16
Excess -0.15 2.10 2.29
NGR0A019 - REAL RETURN PRIVATE MARKETS 153,548,017.83 0.61 -3.01 -3.10 10.09 02-01-16
Real Return Private Market Index -3.01 -3.10 10.09 02-01-16
Excess 0.00 0.00 0.00
NGRP - MTP ENERGY OPPORTUNITIES FD II 30,223,673.96 0.12 1.55 1.60 8.64 02-01-16
MTP ENERGY OPPORTUNITIES FD II Index 1.55 1.60 8.64 02-01-16
Excess 0.00 0.00 0.00
NGSH - ORION MINE FINANCE FD II 37,857,814.42 0.15 10.45 10.54 14.62 06-01-16
ORION MINE FINANCE FD II Index 10.45 10.54 14.62 06-01-16
Excess 0.00 0.00 0.00
NGSR - BROOKFIELD INFRA PRTNR FD III 26,284,862.15 0.10 11.87 11.87 11.87 08-01-16
NGRW - AMERRA AGRI FUND III 59,181,667.29 0.24 -0.95 -1.26 -1.26 08-01-16
Amerra Agri Fund III Index -0.95 -1.26 -1.26 08-01-16
Excess 0.00 0.00 0.00

37
VI. Absolute Return

38
Objective Purpose is to diversify equity and credit market risk by targeting hedge fund return streams
that are independent of the directionality of the broad stock and bond markets. The ARS portfolio will be invested in a wide variety of hedge fund strategies, with specific constraints on overall portfolio risk and individual manager exposure.
Performance objective is to exceed the benchmark, defined as the HFRI Fund of Funds Diversified Index, net of fees, and to earn in excess of the appropriate long-term benchmark (3-month LIBOR + 500 basis points) on an ongoing rolling 5-year period.
Investment Philosophy Predicated on manager skill in:
Rotating (long/short trading) market factors based on valuation Navigating less liquid, non public and opaque markets Navigating special situations Predicting and capturing market trends
Accordingly, ARS is not an “asset class” (or market sector)

39
Manager Strategy Committed Capital Portfolio Benchmark
Blackstone Customized Fund of One $1,050,000,000
HFRI Fund of Funds Diversified Index
Alyeska Fund Direct Manager $75,000,000
Graticule Asia Macro Fund Direct Manager $125,000,000
Varde Investment Partners Direct Manager $115,000,000
Myriad Opportunities Fund Direct Manager $100,000,000
Roystone Capital Fund Direct Manager $60,000,000
Southpoint Fund Direct Manager $60,000,000
Man AHL Hydrogen LLC Direct Manager $90,000,000
PDT Mosaic Fund Direct Manager $90,000,000
DSAM Long/Short Equity Fund Direct Manager $75,000,000
East Lodge Capital Credit Opportunities Fund
Direct Manager $120,000,000
River Birch Partners Direct Manager 75,000,000
Field Street Partners Direct Manager $60,000,000
Pharo Gaia Fund Direct Manager $100,000,000
D.E. Shaw Valence Fund, L.L.C. Direct Manager $73,000,000
Redmile Capital Fund, LP Direct Manager $60,000,000

40 Source: BAAM; State Street
Equity, 16%
Credit, 27%
Relative Value, 18%Event Driven,
4%
Multi-Strat, 8%
Macro/CTA, 26%
Direct Portfolio Aggregated Manager Exposures
Equity, 15%
Credit, 31%
Relative Value, 21%
Event Driven, 10%
Multi-Strat, 7%
Macro/CTA, 16%
BAAM Aggregated Manager Exposures
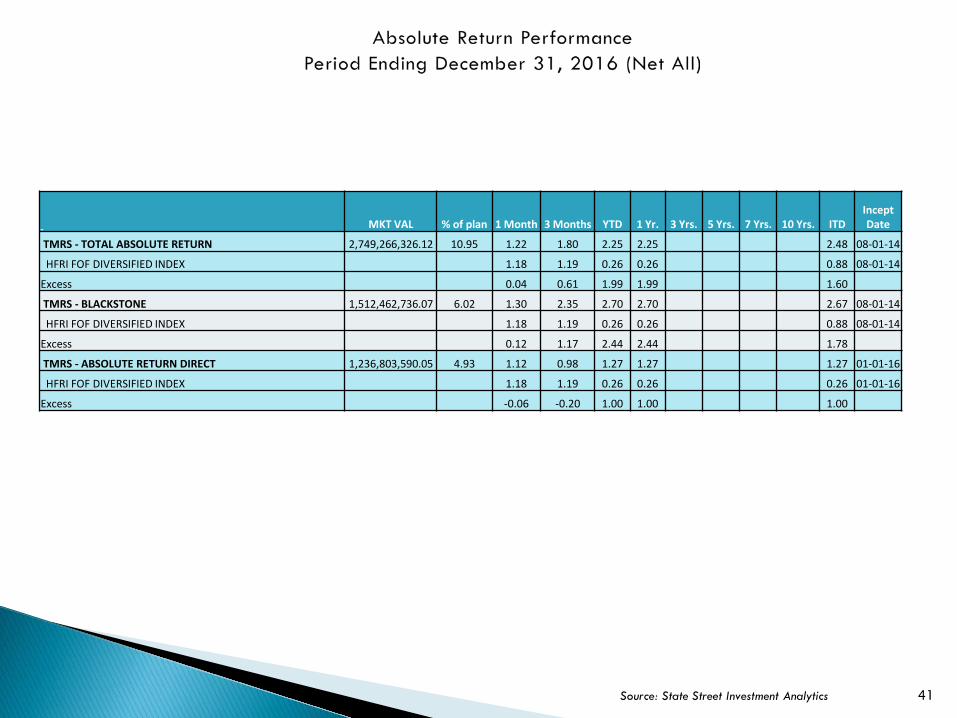
41 Source: State Street Investment Analytics
MKT VAL % of plan 1 Month 3 Months YTD 1 Yr. 3 Yrs. 5 Yrs. 7 Yrs. 10 Yrs. ITD Incept Date
TMRS - TOTAL ABSOLUTE RETURN 2,749,266,326.12 10.95 1.22 1.80 2.25 2.25 2.48 08-01-14
HFRI FOF DIVERSIFIED INDEX 1.18 1.19 0.26 0.26 0.88 08-01-14
Excess 0.04 0.61 1.99 1.99 1.60
TMRS - BLACKSTONE 1,512,462,736.07 6.02 1.30 2.35 2.70 2.70 2.67 08-01-14
HFRI FOF DIVERSIFIED INDEX 1.18 1.19 0.26 0.26 0.88 08-01-14
Excess 0.12 1.17 2.44 2.44 1.78
TMRS - ABSOLUTE RETURN DIRECT 1,236,803,590.05 4.93 1.12 0.98 1.27 1.27 1.27 01-01-16
HFRI FOF DIVERSIFIED INDEX 1.18 1.19 0.26 0.26 0.26 01-01-16
Excess -0.06 -0.20 1.00 1.00 1.00

42
VII. Private Equity

43
Objective The primary objective is to enhance the total return of the overall investment portfolio,
and secondarily to provide diversification. Private Equity investments are commingled funds structured as limited partnerships with capital commitments that are drawn down over time based on manager discretion. Potential distributions are made as a fund matures and investments are typically realized over an 8-12 year horizon.
The long term policy objective is to meet or exceed the Russell 3000 + 3.00% over periods of five years or greater.
Investment Philosophy Manager selection is critical, and managers add value through:
Reducing agency conflicts and aligning equity holder/executive incentives Investment structuring and balance sheet management Deep sector experience and creating operating efficiencies Navigating non-public information and capturing illiquidity premia
Note: Due to the illiquid nature of the Private Equity asset class, the target allocation will be invested over a multi-year period in order to avoid considerable vintage year risks.
44
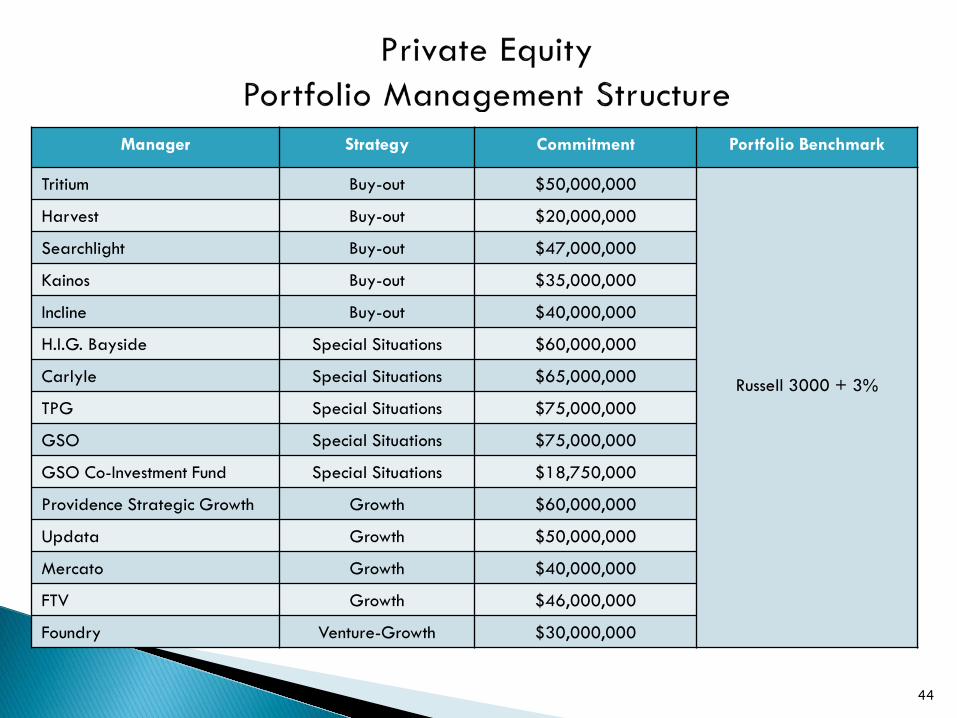
Manager Strategy Commitment Portfolio Benchmark
Tritium Buy-out $50,000,000
Russell 3000 + 3%
Harvest Buy-out $20,000,000
Searchlight Buy-out $47,000,000
Kainos Buy-out $35,000,000
Incline Buy-out $40,000,000
H.I.G. Bayside Special Situations $60,000,000
Carlyle Special Situations $65,000,000
TPG Special Situations $75,000,000
GSO Special Situations $75,000,000
GSO Co-Investment Fund Special Situations $18,750,000
Providence Strategic Growth Growth $60,000,000
Updata Growth $50,000,000
Mercato Growth $40,000,000
FTV Growth $46,000,000
Foundry Venture-Growth $30,000,000

45
Policy Strategy Range Control/Buy-out 40.0% to 75.0% Venture/Growth/Minority 5.0% to 25.0% Special Situations/Opportunistic 10.0% to 35.0%
NOTE: Percentages may not be exact due to rounding
28.7%
32.1%
39.1%
Figure 1 : Private Equity Strategy Diversification by Commitment
Buy-out (40.0% to75.0%)Growth (5.0% to25.0%)Special Situations(10.0% to 35.0%)
16.1%
18.1%
22.0%
43.8%
Figure 2 : Private Equity Target Diversification
Buy-out (40.0% to75.0%)Growth (5.0% to25.0%)Special Situations(10.0% to 35.0%)Un-allocated
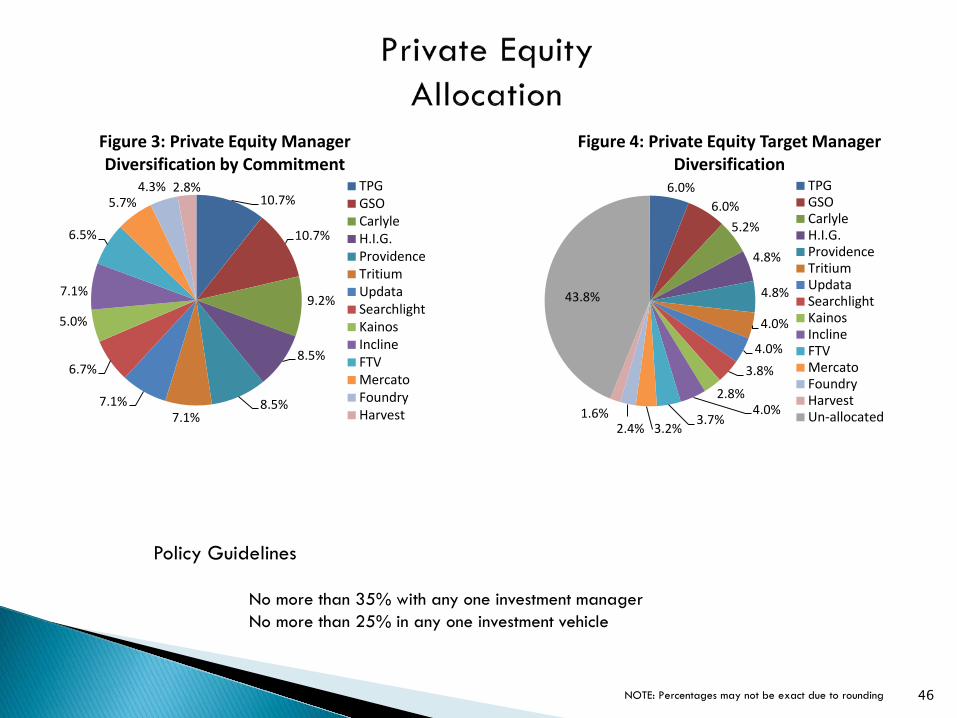
46 NOTE: Percentages may not be exact due to rounding
Policy Guidelines No more than 35% with any one investment manager No more than 25% in any one investment vehicle
10.7%
10.7%
9.2%
8.5%
8.5% 7.1%
7.1%
6.7%
5.0%
7.1%
6.5%
5.7% 4.3% 2.8%
Figure 3: Private Equity Manager Diversification by Commitment
TPGGSOCarlyleH.I.G.ProvidenceTritiumUpdataSearchlightKainosInclineFTVMercatoFoundryHarvest
6.0% 6.0%
5.2%
4.8%
4.8%
4.0%
4.0% 3.8%
2.8% 4.0%
3.7% 3.2% 2.4%
1.6%
43.8%
Figure 4: Private Equity Target Manager Diversification
TPGGSOCarlyleH.I.G.ProvidenceTritiumUpdataSearchlightKainosInclineFTVMercatoFoundryHarvestUn-allocated

47 Source: State Street Investment Analytics
MKT VAL % of plan 1 Month 3 Months YTD 1 Yr. 3 Yrs. 5 Yrs. 7 Yrs. 10 Yrs. ITD
Incept Date
TMRS TOTAL PRIVATE EQUITY 114,184,632.91 0.45 7.20 7.20 1.68 1.68 1.55 12-01-15
BUY-OUT TOTAL 35,699,350.12 0.14 9.19 9.19 23.91 23.91 21.85 12-01-15
SEARCHLIGHT CAPITAL II 16,532,795.87 0.07 17.25 17.25 43.54 02-01-16
HARVEST PARTNERS VII 59,231.10 0.00 -14.19 -14.19 -14.19 10-01-16
KAINOS CAPITAL PARTNERS II LP 272,182.00 0.00 12-01-16
TRITIUM I, L.P. 18,835,141.14 0.08 0.51 0.51 8.87 8.87 8.15 12-01-15
VENTURE-GROWTH TOTAL 35,722,665.24 0.14 26.90 26.91 -14.77 07-01-16
FOUNDRY GROUP NEXT FUND LP 6,662,949.38 0.03 -3.64 -3.62 -3.62 08-01-16
MERCATO PARTNERS GROWTH III LP 6,106,947.60 0.02 2.14 2.14 -27.35 07-01-16
UPDATE PARTNERS V LP 15,515,671.50 0.06 2.31 2.31 -5.32 07-01-16
PROVIDENCE STRATEGIC GROWTH II LP 7,437,096.76 0.03 12-01-16
FTV V
SPECIAL SITUATIONS SUB TOTAL 42,762,617.54 0.17 5.46 5.46 -0.13 03-01-16
H.I.G. BAYSIDE FUND IV 9,627,887.47 0.04 12.57 12.57 -3.19 03-01-16
CARLYLE ENERGY MEZZANINE FUND II 5,100,540.35 0.02 -3.02 -3.02 -13.59 03-01-16
TSSP ADJACENT OPPORTUNITIES FUND III 24,495,121.54 0.10 3.30 3.30 4.53 03-01-16
GSO Capital Opportunities Fund III LP 3,539,068.19 0.01 -1.37 -1.36 -1.36 10-01-16

48
VIII. Compliance

49
• IPS Objectives • The primary objective of Compliance is to implement a detailed compliance program which
uses a combination of daily, weekly and monthly testing of all testable parameters of the Investment Policy Statement and all Manager guidelines at the Manager, asset class and total fund level, as appropriate.
• Testing may be completed either through systematic resources (automated custodial compliance) or manually if necessary.
• Compliance personnel shall create and present a quarterly report to the Board with the results of the testing performed during each period.

50
Policy Guidelines
Core Fixed Income
Non-Core Fixed Income
Real Return (Colchester)
Domestic Equities
Global Equities
Credit Quality
Liquidity/Cash Management
Permissible/Prohibited Investments
Concentration Risk
Country/Region & Currency
Issue/Issuer
Sector & Asset Type
Interest Rate Risk N/A N/A
Spread Risk N/A N/A
383 separate compliance tests were run on TMRS portfolios as of December 31, 2016. There were no active violations of TMRS guidelines.

51
Topic Update Automate Tests TMRS continues to be the primary source for testing guideline compliance
using internally designed automation processes. Upon successful completion of the TMRS legal contract process, EAOS (State Street’s more comprehensive services; approved by the Board in December) will significantly improve the level of service and diligence we receive from State Street’s compliance staff, allowing TMRS compliance resources to be more efficiently utilized.
Policies & Procedures
PolicyHub has been fully implemented and is now being used within the Investment department to manage the IPS & internal procedures, providing a time-stamped history & well documented audit trail of procedures created, reviewed, & updated, as well as distribution to staff and staff acknowledgment of receipt and understanding.
Annual Guideline Compliance Review
The internal portion of the review is complete. However, the custodian portion is on hold until the EAOS (State Street) contract is completed.

52
IX. Risk Management

53
● Risk Report:
● Risk Report For December 2016 was unavailable at the time of this reports submission
● Final year end total fund holdings for running Risk Report became available February 9th
● Risk Report Takes 10 Business days from receipt of data
● Risk Management Objective ● Management of the risk of not achieving TMRS investment objectives.
● Risk Management Responsibilities: ● Defining investment risk management policy and strategy ● Building a risk aware culture ● Analytical tools for investment risk management ● Reporting on investment risk to the Board

54
1. Private market asset classes, like Real Estate, are priced quarterly with a quarter lag due to use of appraised value pricing in the absence of market prices. For some asset class funds in less liquid public markets this is also true, although to a lesser extent and the lag is only one month
Topic Update Board and Internal
Risk Reporting Providing quarterly Board Risk Reports for the total fund and internal asset class reports analyzing risk taken by our managers.
Specialized Risk Analysis
Applying and further developing specialized risk analysis solutions for Alternative Asset Class investments
Performance Attribution
Performance Attribution allows us to better distinguish manager skill from luck by breaking down (attributing) returns to specific manager decisions.
Data Management Solution to support
analysis and reporting
A Data Warehouse was developed to satisfy portfolio data needs of the Performance Attribution System. Have hired a new Investment Data Analyst to continue work on the Data Warehouse including; covering all account related data needs and converting to a more powerful IT platform.
Performance Reporting
Expanding and refining Performance Reporting procedures and methodology to incorporate new asset types, new investment vehicles, and increased transparency. Responsibility for performance reporting will be assumed by the proposed Investment Operations team.
Quantitative Portfolio Analysis
Monitoring advances in quantitative portfolio analysis to ensure that risk and performance analysis remain current at TMRS

DISCLOSURES
TMRS periodically discloses public information that is not excepted from disclosure under Section 552.0225(b) of the Texas Public Information Act. Information provided
by a manager, a general partner or other data provider to TMRS or a TMRS service provider, and contained in these materials, may have been independently produced or
modified by TMRS or the TMRS service provider.
55