hydrostatic response of submarine nickel …cradpdf.drdc-rddc.gc.ca/pdfs/unc82/p531305.pdf ·...
TRANSCRIPT
Defence R&D Canada – Atlantic
DEFENCE DÉFENSE&
Hydrostatic Response of Submarine Nickel
Aluminum Bronze Valves with Corrosion
Damage
B.K.C. Yuen1, T.S. Koko1 and R. Warner2
1Martec LimitedSuite 400, 1888 Brunswick StreetHalifax, Nova Scotia B3J 3J8
2Dalhousie UniversityDepartment of Mechanical EngineeringPO Box 1000Halifax, Nova Scotia B3J 2X4
Project Manager: Dr. T.S. Koko, 902-425-5101
Contract Number: W7707-078022/001/HAL
Contract Scientific Authority: Dr. Y. Wang, 902-427-3035
Contract Report
DRDC Atlantic CR 2008-105
July 2008
Copy No. _____
Defence Research andDevelopment Canada
Recherche et développementpour la défense Canada

This page intentionally left blank.
Hydrostatic Response of Submarine Nickel Aluminum Bronze Valves with Corrosion Damage
1B.K.C. Yuen , T.S. Koko1 and R. Warner2 1 Martec Limited Suite 400, 1888 Brunswick Street Halifax, Nova Scotia B3J 3J6 2 Dalhousie University Department of Mechanical Engineering PO BOX 1000 Halifax, Nova Scotia B3J 2X4 Project Manager: Dr. T.S. Koko, 902-425-5101 ext 243 Contract Number: W7707-078022/001/HAL Contract Scientific Authority: Dr. Y. Wang, 902-427-3035
Defence R&D Canada – Atlantic Contract Report DRDC Atlantic CR 2008-105 July 2008
Scientific Authority
Yueping Wang
Approved by
Calvin V. Hyatt
Head/Dockyard Laboratory (Atlantic)
Approved for release by
James L. Kennedy
DRP Chair
Terms of release: The scientific or technical validity of this Contract Report is entirely the responsibility of the contractor and the contents do not necessarily have the approval or endorsement of Defence R&D Canada.
© Her Majesty the Queen in Right of Canada, as represented by the Minister of National Defence, 2008
© Sa Majesté la Reine (en droit du Canada), telle que représentée par le ministre de la Défense nationale, 2008
Original signed by Yueping Wang
Original signed by Leon Cheng for
Original signed by Ron Kuwahara for
Abstract ……..
This study was undertaken to numerically investigate the behaviour of the submarine nickel aluminum bronze (NAB) valves (SW403 and SW226) with corrosion damage under hydrostatic loading at Defence R&D Canada – Atlantic (DRDC Atlantic), and to validate the numerical models using experimental results. Finite element analysis, involving nonlinear elastic plastic static analysis was performed using the implicit solver in LS-DYNA software system. The experimental testing showed that the smaller SW403 valve generally responded with lower strains than the larger SW226 valve at the same load. In addition, the strains in the body increased with corrosion damage, and were much higher than those in the neck. This was expected since there was no corrosion damage in the neck region, there should be no effect of corrosion damage on the circumferential strain in the neck. The finite element results for the axial strain in the body in general showed reasonably good agreement with the experimental results. However, the circumferential strain in both the body and the neck were in general underestimated. This indicates that further refinement of the finite element mesh is required.
Résumé ….....
La présente étude a été menée par R & D pour la Défense Canada – Atlantique (RDDC Atlantique) afin d’examiner, à l’aide d’une simulation numérique, la réaction des vannes en bronze au nickel-aluminium (BNA) (SW403 et SW226) endommagées par la corrosion lors d’un chargement hydrostatique et pour valider les modèles numériques à l’aide de résultats expérimentaux. La méthode d’analyse par éléments finis qui comprend une analyse statique non-linéaire élastoplastique a été effectuée à l’aide du résolveur implicite du logiciel LS-DYNA. Les essais ont démontré que, de façon générale, la vanne de plus petite taille SW403 présente moins de déformations pour le même chargement que la vanne de plus grande taille SW226. Par ailleurs, le nombre de déformations dans le corps augmente avec l’étendue de la corrosion et elles y sont beaucoup plus nombreuses que dans le col, chose qui était à prévoir. En effet, s’il n’y a pas de dommages dus à la corrosion dans la région du col, il ne devrait pas avoir de déformations longitudinales dus à la corrosion sur le col. En générale, les résultats des analyses par éléments finis pour la déformation longitudinale sur le corps sont semblablement les mêmes que lors des essais. Cependant, les déformations transversales sur le corps et le col de la vanne ont été sous-estimés, indiquant qu’il serait nécessaire d’améliorer le réseau maillé des éléments finis.
DRDC Atlantic CR 2008-105 i

This page intentionally left blank.
ii DRDC Atlantic CR 2008-105
Executive summary
Hydrostatic Response of Submarine Nickel Aluminum Bronze Valves with Corrosion Damage
B.K.C. Yuen; T.S. Koko; R. Warner; DRDC Atlantic CR 2008-105; Defence R&D Canada – Atlantic. July 2008.
Introduction or background: This study was undertaken in support of on-going mid-life evaluations of the Victoria Class submarine nickel aluminum bronze valves. In order for the valves to perform their intended functions, it is important that the integrity (structural and water tightness) of the valves is maintained under all operational loading conditions throughout the life of the vessel. The objective of this study is to numerically investigate the behaviour of the submarine nickel aluminum bronze (NAB) valves (SW403 and SW226) with corrosion damage under hydrostatic loading, and to validate the numerical models using experimental results. Corrosion damage was simulated by gradually removing material from the inside the valve body. Finite element models of the valve systems were then developed to simulate the hydrostatic test configuration developed at DRDC Atlantic. Finite element analysis, involving nonlinear elastic plastic static analysis was performed using the implicit solver in LS-DYNA software system.
Results: The experimental testing showed that the smaller SW403 valve generally responded with lower strains than the larger SW226 valve at the same load. In addition, the strains in the body increased with corrosion damage, and were much higher than those in the neck. This was expected since there was no corrosion damage in the neck region, there should be no effect of corrosion damage on the circumferential strain in the neck. The finite element results for the axial strain in the body in general showed reasonably good agreement with the experimental results. However, the circumferential strain in both the body and the neck were in general underestimated.
Significance: The numerical modeling capabilities of the two valve systems have been developed to predict the response of the damage containing valves under hydrostatic loading conditions. The numerical modeling results have shown reasonably good results in predicting the axial strains under various loading conditions. Once properly validated, this numerical modeling approach can be used for fitness-for-service assessments of damage containing (NAB) valves in the Victoria class submarine seawater systems, assessment of the current standards that govern valve management practice, to quantify the levels of conservatism, and for optimization of experimental valve assessment trials.
Future plans: The effects of issues such as mesh size, element formulation, element order and material properties will be investigated. Addressing these issues would improve the accuracy of the FE models so that they more closely match experimental measurements and further increase confidence in their reliability. Hydrostatic testing of more valve systems (at least two more) will be performed. Numerical simulations of these valves will also be performed to further validate the numerical approach. Once validated, the numerical models can be used to generate performance charts for existing and new valve designs. In addition, numerical modelling capabilities for prediction of dynamic loading response of the damage containing valves will also be developed and validated using dynamic loading test results.
DRDC Atlantic CR 2008-105 iii

Sommaire .....
Réaction hydrostatique des vannes de sous-marins en bronze au nickel-aluminium endommagées par la corrosion
B.K.C. Yuen; T.S. Koko; R. Warner; DRDC Atlantic CR 2008-105; R & D pour la Défense Canada – Atlantique. Juillet 2008.
Introduction ou contexte : La présente étude a été menée en soutien aux évaluations continues de mi-durée des vannes en bronze au nickel-aluminium (BNA) des sous-marins de classe Victoria. Pour que les vannes puissent effectuer leurs fonctions prévues, il est important que leur intégrité (structurale et leur étanchéité à l’eau) soit maintenue dans toutes les conditions de chargement opérationnelles pour la durée complète du sous-marin. L’objectif de la présente étude est d’examiner, à l’aide d’une simulation numérique, la réaction des vannes en bronze au nickel-aluminium (SW403 et SW226) endommagées par la corrosion lors d’un chargement hydrostatique et pour valider les modèles numériques à l’aide de résultats expérimentaux. Les dommages dus à la corrosion ont été simulés en enlevant graduellement du matériau à l’intérieur du corps de la vanne. Des modèles à éléments finis ont ensuite été élaborés pour simuler l’essai hydrostatique conçu par RDDC Atlantique. La méthode d’analyse par éléments finis, qui comprend une analyse statique non-linéaire élastoplastique, a été effectuée à l’aide du résolveur implicite du logiciel LS-DYNA.
Résultats : Les essais ont démontré que, de façon générale, la vanne de plus petite taille SW403 présente moins de déformations pour le même chargement que la vanne de plus grande taille SW226. Par ailleurs, le nombre de déformations sur le corps augmente avec l’étendue de la corrosion et elles y sont beaucoup plus nombreuses que sur le col, chose qui était à prévoir. En effet, s’il n’y a pas de dommages dus à la corrosion dans la région du col, il ne devrait pas avoir de déformations longitudinales dues à la corrosion sur le col. En générale, les résultats des analyses par éléments finis pour la déformation longitudinale sur le corps sont semblablement les mêmes que lors des essais. Cependant, les déformations transversales sur le corps et le col de la vanne ont été sous-estimées.
Importance : Les fonctions de modélisation numérique des deux vannes ont été élaborées pour prédire la réaction des vannes endommagées par la corrosion à un chargement hydrostatique. La modélisation numérique s’est avérée plutôt bonne pour prédire les déformations longitudinales sous divers chargements. Une fois bien validée, la modélisation numérique pourra être utilisée pour évaluer l’aptitude au service des vannes BNA endommagées dans les systèmes d’eau de mer des sous-marins de classe Victoria, pour évaluer les normes actuelles qui gouvernent la gestion des vannes, pour définir de façon quantitative les degrés de modération à appliquer et pour optimiser les essais expérimentaux des vannes.
Perspectives : Les impacts des facteurs comme la dimension du réseau maillé, la formulation des éléments, l’ordre des éléments et les propriétés des matériaux seront évaluées. L’examen de ces facteurs permettrait d’améliorer l’exactitude des modèles à éléments finis pour qu’ils puissent correspondre davantage aux mesures expérimentales et permettrait aussi d’augmenter la confiance en leur fiabilité. Au moins deux autres vannes seront soumises à des essais hydrostatiques. Des simulations numériques des vannes seront également effectuées pour valider
iv DRDC Atlantic CR 2008-105

l’approche numérique. Une fois validés, les modèles numériques peuvent être utilisés pour créer des graphiques de performance pour les vannes actuelles et futures. De plus, les fonctions de la modélisation numérique permettant de prédire la réaction des vannes endommagées au chargement dynamique seront également élaborées et validées à l’aide des résultats de l’essai du chargement dynamique.
DRDC Atlantic CR 2008-105 v

This page intentionally left blank.
vi DRDC Atlantic CR 2008-105
Table of contents
................................................................................................................................. i Abstract ……..................................................................................................................................... i Résumé ….....
........................................................................................................................ iii Executive summary.................................................................................................................................. iv Sommaire .....
........................................................................................................................... vii Table of contents................................................................................................................................. ix List of figures
................................................................................................................................. xiii List of tables...................................................................................................................... xiv Acknowledgements
............................................................................................................................... 1 1 Introduction1.1 ................................................................................................................... 1 Background1.2 .................................................................................................... 1 Objectives and Scope1.3 ..................................................................................... 2 Organization of this Document
................................................................................................................. 3 2 Problem Description2.1 ..................................................................... 3 Configuration of Submarine NAB Valves2.2 .................................................................................................. 3 Hydrostatic Load Tests2.3 ................................................................................................................. 3 Requirements
............................................................................... 7 3 Geometric Configurations of NAB Valves3.1 ................................................................................................................... 7 Introduction3.2 SW403 Valve................................................................................................................. 7 3.3 SW226 Valve................................................................................................................. 8
.................................................................................. 15 4 Finite Element Models of NAB Valves4.1 ............................................................................................. 15 Finite Element Approach4.2 ................................................................................................ 15 Finite Element Meshes4.3 ......................................................................................................... 15 Mesh Refinement4.4 ...................................................................................................... 16 Material Properties4.5 ................................................................................................... 16 Boundary Conditions4.6 .................................................................................................... 17 Hydrostatic Loading
...................................................................... 20 5 Response of NAB Valves to Hydrostatic Load5.1 SW403 Valve............................................................................................................... 20
5.1.1 ................................................................ 21 Initial Wall Thickness of 10.2 mm5.1.2 ................................... 21 After the First Wall Thickness Reduction to 5.1 mm
5.2 SW226 Valve............................................................................................................... 22 5.2.1 ................................................................ 22 Initial Wall Thickness of 10.4 mm5.2.2 ................................... 23 After the First Wall Thickness Reduction to 5.5 mm5.2.3 ............................... 23 After the Second Wall Thickness Reduction to 3.5 mm5.2.4 .................................. 24 After the Third Wall Thickness Reduction to 2.0 mm
DRDC Atlantic CR 2008-105 vii
5.3 ............................................ 25 Effect of Corrosion Degradation on Valve Performance ...................................................................... 53 6 Summary, Conclusions and Recommendations
6.1 .......................................................................................... 53 Summary and Conclusions6.2 ....................................................................................................... 54 Recommendations
............................................................................................................................... 56 References ....... ............................. 57 Annex A CAD Drawings of NAB Valves after Wall Thickness Reductions
..................................................................... 61 List of symbols/abbreviations/acronyms/initialisms.............................................................................................................................. 63 Distribution list
viii DRDC Atlantic CR 2008-105

List of figures
........................................................ 4 Figure 1: Typical NAB Valves on Victoria Class Submarine.
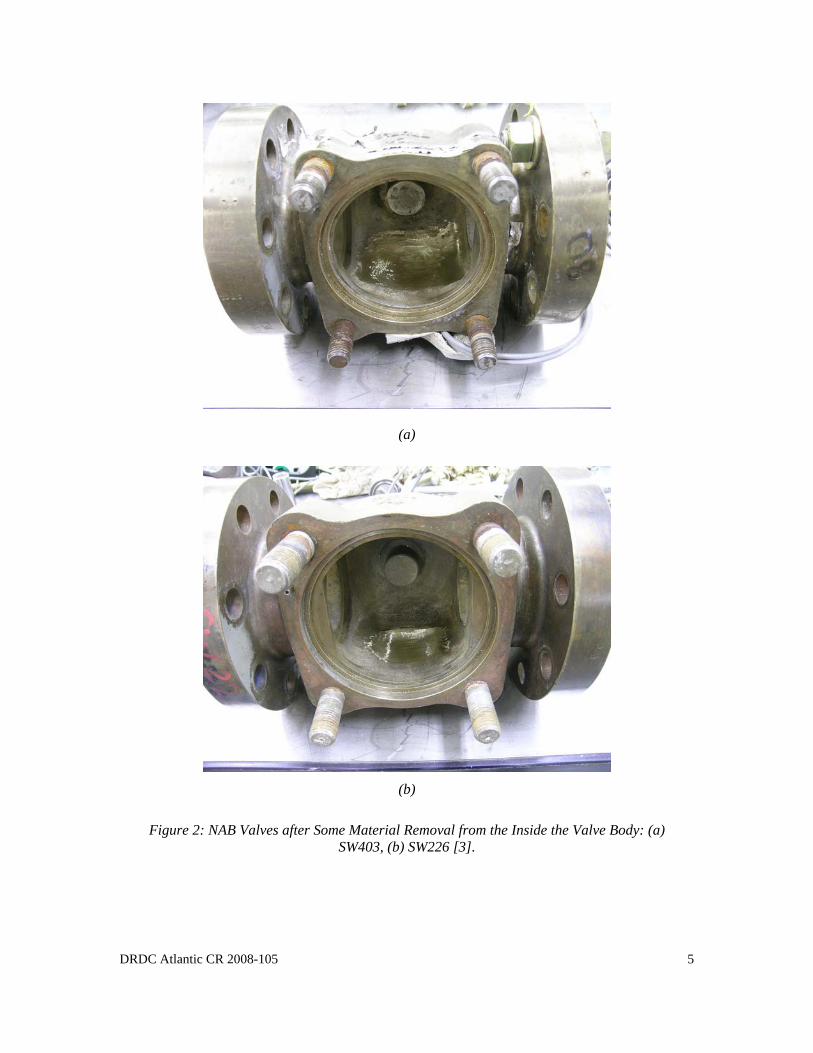
Figure 2: NAB Valves after Some Material Removal from the Inside the Valve Body: (a) SW403, (b) SW226 [3].................................................................................................. 5
................................................................................. 6 Figure 3: Hydrostatic Test Configuration [3].
...................................... 6 Figure 4: Instrumentation of the Strain Gauges on the SW226 Valve [3].
...................................................... 9 Figure 5: Picture of CMM at the AMG, Dalhousie University.
................. 10 Figure 6: Picture Showing How Valve Dimensions are Measurements on the CMM.
Figure 7: (a) SW403 Valve Assembly, (b) SW403 Valve Body Showing the Thickness Reduction Region........................................................................................................ 11
Figure 8: (a) Section View of the SW403 Valve Showing Uneven Thickness of Valve Body, (b) Section View of the SW403 Valve after the First Thickness Reduction............... 12
Figure 9: (a) SW226 Valve Assembly, (b) SW226 Valve Body Showing the Thickness Reduction Region........................................................................................................ 13
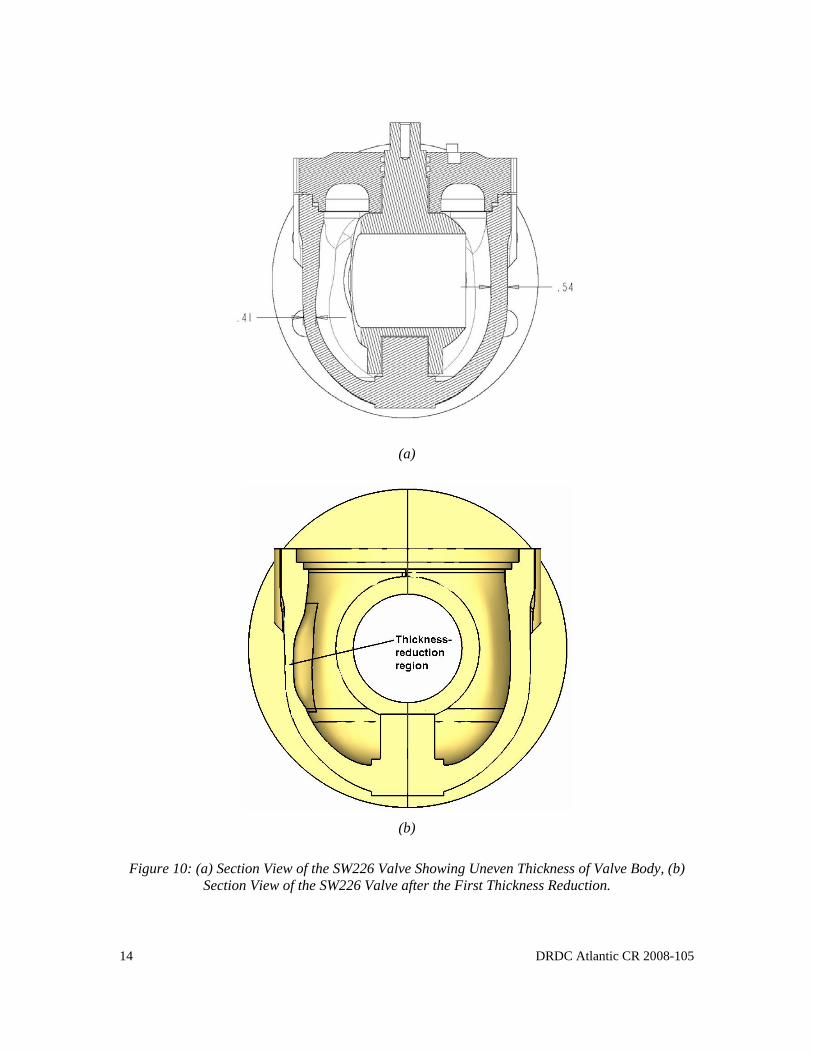
Figure 10: (a) Section View of the SW226 Valve Showing Uneven Thickness of Valve Body, (b) Section View of the SW226 Valve after the First Thickness Reduction............... 14
................................. 18 Figure 11: Section View of the Bonnet-Bolt Interface of a Typical Model.
........... 18 Figure 12: Finite Element Mesh used for the SW403 Valve with Initial Wall Thickness.
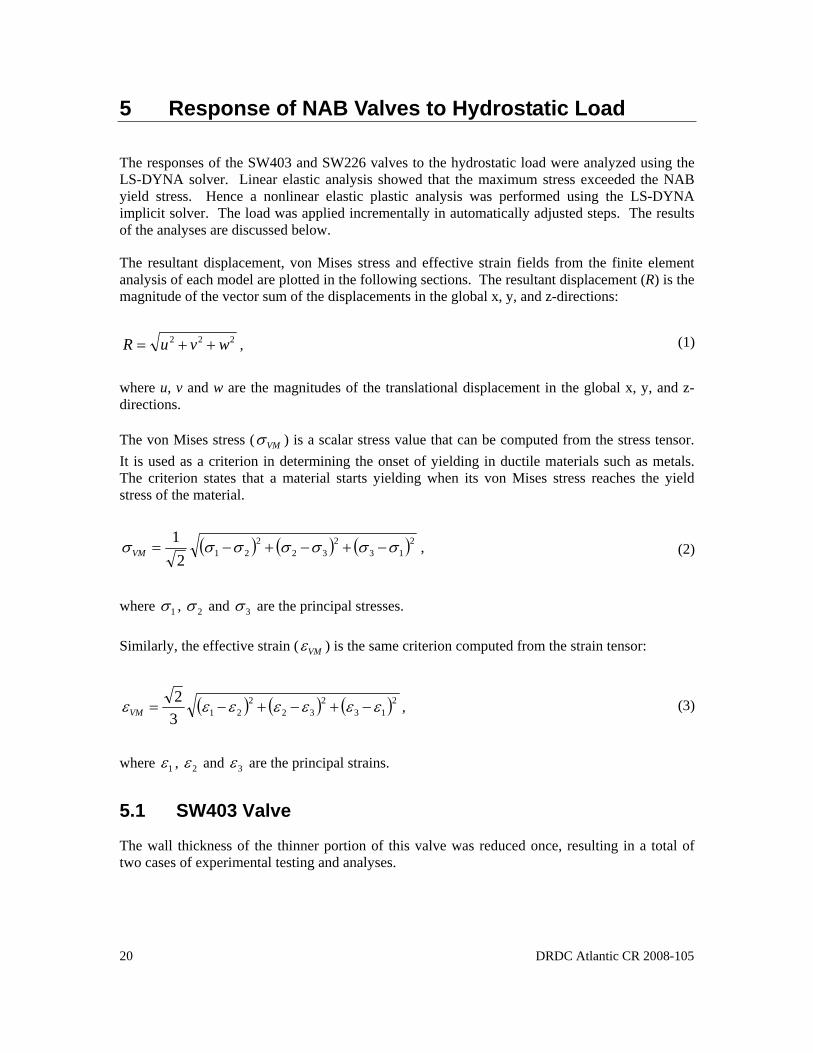
........... 19 Figure 13: Finite Element Mesh used for the SW226 Valve with Initial Wall Thickness.
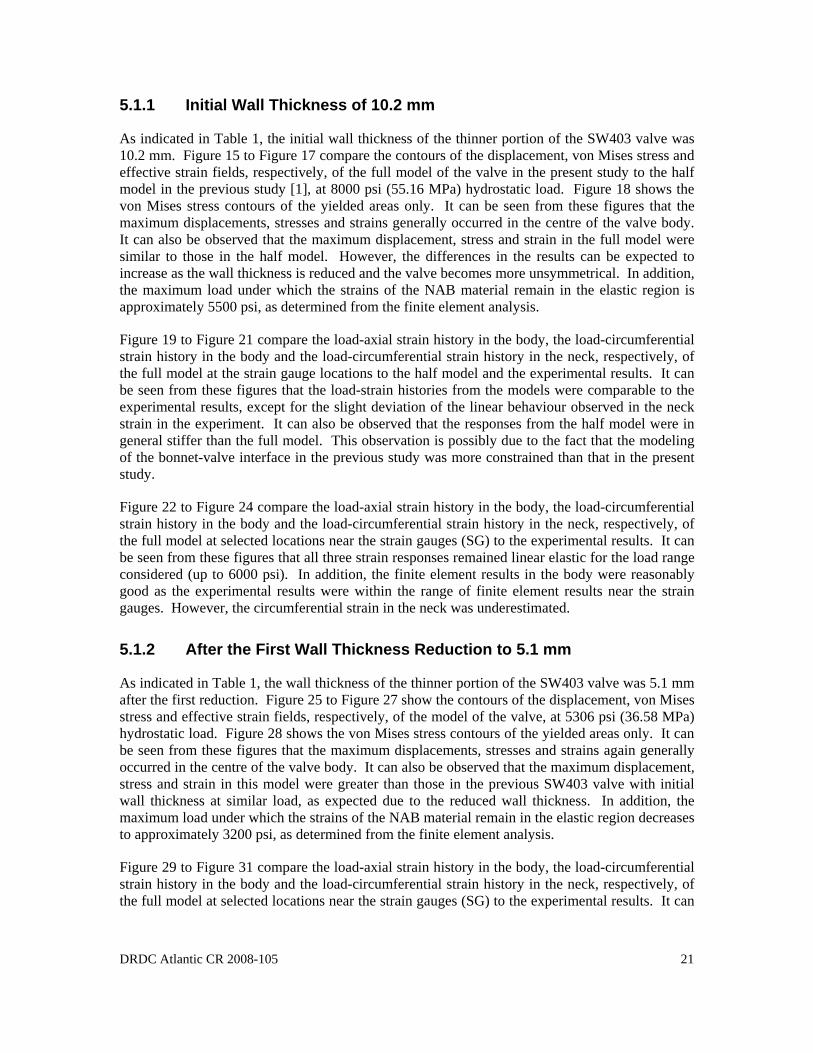
................................................................. 19 Figure 14: Boundary Conditions for a Typical Model.
Figure 15: Displacement Contours of the SW403 Valve with Initial Wall Thickness (10.2 mm) at 8000 psi (55.16 MPa) Hydrostatic Load: (a) Full Model, (b) Half Model. .... 27
Figure 16: von Mises Stress Contours of the SW403 Valve with Initial Wall Thickness (10.2 mm) at 8000 psi (55.16 MPa) Hydrostatic Load: (a) Full Model, (b) Half Model. .... 28
Figure 17: Effective Strain Contours of the SW403 Valve with Initial Wall Thickness (10.2 mm) at 8000 psi (55.16 MPa) Hydrostatic Load: (a) Full Model, (b) Half Model. .... 29
Figure 18: von Mises Stress Contours of the Yielded Areas of the SW403 Valve with Initial Wall Thickness (10.2 mm) at 8000 psi (55.16 MPa) Hydrostatic Load: (a) Full Model, (b) Half Model. ............................................................................................... 30
Figure 19: Comparison of Experimental, Full Model and Half Model Load-Axial Strain History at the Body of the SW403 Valve with Initial Wall Thickness (10.2 mm). .... 31
Figure 20: Comparison of the Experimental, Full Model and Half Model Load-Circumferential Strain History at the Body of the SW403 Valve with Initial Wall Thickness (10.2 mm)................................................................................................... 31
DRDC Atlantic CR 2008-105 ix
Figure 21: Comparison of the Experimental, Full Model and Half Model Load-Circumferential Strain History at the Neck of the SW403 Valve with Initial Wall Thickness (10.2 mm)................................................................................................... 32
Figure 22: Comparison of the Experimental and FE Load-Axial Strain History at Selected Locations on the Body of the SW403 Valve with Initial Wall Thickness (10.2 mm). ............................................................................................................................ 32
Figure 23: Comparison of the Experimental and FE Load-Circumferential Strain History at Selected Locations on the Body of the SW403 Valve with Initial Wall Thickness (10.2 mm). ................................................................................................................... 33
Figure 24: Comparison of the Experimental and FE Load-Circumferential Strain History at Selected Locations on the Neck of the SW403 Valve with Initial Wall Thickness (10.2 mm). ................................................................................................................... 33
Figure 25: Displacement Contours of the SW403 Valve after the First Wall Thickness Reduction (5.1 mm) at 5306 psi (36.58 MPa) Hydrostatic Load. ............................... 34
Figure 26: von Mises Stress Contours of the SW403 Valve after the First Wall Thickness Reduction (5.1 mm) at 5306 psi (36.58 MPa) Hydrostatic Load. ............................... 34
Figure 27: Effective Strain Contours of the SW403 Valve after the First Wall Thickness Reduction (5.1 mm) at 5306 psi (36.58 MPa) Hydrostatic Load. ............................... 35
Figure 28: von Mises Stress Contours of the Yielded Areas of the SW403 Valve after the First Wall Thickness Reduction (5.1 mm) at 5306 psi (36.58 MPa) Hydrostatic Load. ........................................................................................................................... 35
Figure 29: Comparison of the Experimental and FE Load-Axial Strain History at Selected Locations on the Body of the SW403 Valve after the First Wall Thickness Reduction (5.1 mm). ................................................................................................... 36
Figure 30: Comparison of the Experimental and FE Load-Circumferential Strain History at Selected Locations on the Body of the SW403 Valve after the First Wall Thickness Reduction (5.1 mm). .................................................................................. 36
Figure 31: Comparison of the Experimental and FE Load-Circumferential Strain History at Selected Locations on the Neck of the SW403 Valve after the First Wall Thickness Reduction (5.1 mm). .................................................................................. 37
Figure 32: Displacement Contours of the SW226 Valve with Initial Wall Thickness (10.4 mm) at 5323 psi (36.70 MPa) Hydrostatic Load......................................................... 37
Figure 33: von Mises Stress Contours of the SW226 Valve with Initial Wall Thickness (10.4 mm) at 5323 psi (36.70 MPa) Hydrostatic Load......................................................... 38
Figure 34: Effective Strain Contours of the SW226 Valve with Initial Wall Thickness (10.4 mm) at 5323 psi (36.70 MPa) Hydrostatic Load......................................................... 38
Figure 35: von Mises Stress Contours of the Yielded Areas of the SW226 Valve with Initial Wall Thickness (10.4 mm) at 5323 psi (36.70 MPa) Hydrostatic Load...................... 39
Figure 36: Comparison of the Experimental and FE Load-Axial Strain History at Selected Locations on the Body of the SW226 Valve with Initial Wall Thickness (10.4 mm). ............................................................................................................................ 39
x DRDC Atlantic CR 2008-105
Figure 37: Comparison of the Experimental and FE Load-Circumferential Strain History at Selected Locations on the Body of the SW226 Valve with Initial Wall Thickness (10.4 mm). ................................................................................................................... 40
Figure 38: Comparison of the Experimental and FE Load-Circumferential Strain History at Selected Locations on the Neck of the SW226 Valve with Initial Wall Thickness (10.4 mm). ................................................................................................................... 40
Figure 39: Displacement Contours of the SW226 Valve after the First Wall Thickness Reduction (5.5 mm) at 5278 psi (36.39 MPa) Hydrostatic Load. ............................... 41
Figure 40: von Mises Stress Contours of the SW226 Valve after the First Wall Thickness Reduction (5.5 mm) at 5278 psi (36.39 MPa) Hydrostatic Load. ............................... 41
Figure 41: Effective Strain Contours of the SW226 Valve after the First Wall Thickness Reduction (5.5 mm) at 5278 psi (36.39 MPa) Hydrostatic Load. ............................... 42
Figure 42: von Mises Stress Contours of the Yielded Areas of the SW226 Valve after the First Wall Thickness Reduction (5.5 mm) at 5278 psi (36.39 MPa) Hydrostatic Load. ........................................................................................................................... 42
Figure 43: Comparison of the Experimental and FE Load-Axial Strain History at Selected Locations on the Body of the SW226 Valve after the First Wall Thickness Reduction (5.5 mm). ................................................................................................... 43
Figure 44: Comparison of the Experimental and FE Load-Circumferential Strain History at Selected Locations on the Body of the SW226 Valve after the First Wall Thickness Reduction (5.5 mm). .................................................................................. 43
Figure 45: Comparison of the Experimental and FE Load-Circumferential Strain History at Selected Locations on the Neck of the SW226 Valve after the First Wall Thickness Reduction (5.5 mm). .................................................................................. 44
Figure 46: Displacement Contours of the SW226 Valve after the Second Wall Thickness Reduction (3.5 mm) at 5323 psi (36.70 MPa) Hydrostatic Load. ............................... 44
Figure 47: von Mises Stress Contours of the SW226 Valve after the Second Wall Thickness Reduction (3.5 mm) at 5323 psi (36.70 MPa) Hydrostatic Load. ............................... 45
Figure 48: Effective Strain Contours of the SW226 Valve after the Second Wall Thickness Reduction (3.5 mm) at 5323 psi (36.70 MPa) Hydrostatic Load. ............................... 45
Figure 49: von Mises Stress Contours of the Yielded Areas of the SW226 Valve after the Second Wall Thickness Reduction (3.5 mm) at 5323 psi (36.70 MPa) Hydrostatic Load. ........................................................................................................................... 46
Figure 50: Comparison of the Experimental and FE Load-Axial Strain History at Selected Locations on the Body of the SW226 Valve after the Second Wall Thickness Reduction (3.5 mm). ................................................................................................... 46
Figure 51: Comparison of the Experimental and FE Load-Circumferential Strain History at Selected Locations on the Body of the SW226 Valve after the Second Wall Thickness Reduction (3.5 mm). .................................................................................. 47
DRDC Atlantic CR 2008-105 xi

Figure 52: Comparison of the Experimental and FE Load-Circumferential Strain History at Selected Locations on the Neck of the SW226 Valve after the Second Wall Thickness Reduction (3.5 mm). .................................................................................. 47
Figure 53: Displacement Contours of the SW226 Valve after the Third Wall Thickness Reduction (2.0 mm) at 5337 psi (36.80 MPa) Hydrostatic Load. ............................... 48
Figure 54: von Mises Stress Contours of the SW226 Valve after the Third Wall Thickness Reduction (2.0 mm) at 5337 psi (36.80 MPa) Hydrostatic Load. ............................... 48
Figure 55: Effective Strain Contours of the SW226 Valve after the Third Wall Thickness Reduction (2.0 mm) at 5337 psi (36.80 MPa) Hydrostatic Load. ............................... 49
Figure 56: von Mises Stress Contours of the Yielded Areas of the SW226 Valve after the Third Wall Thickness Reduction (2.0 mm) at 5337 psi (36.80 MPa) Hydrostatic Load. ........................................................................................................................... 49
Figure 57: Comparison of the Experimental and FE Load-Axial Strain History at Selected Locations on the Body of the SW226 Valve after the Third Wall Thickness Reduction (2.0 mm). ................................................................................................... 50
Figure 58: Comparison of the Experimental and FE Load-Circumferential Strain History at Selected Locations on the Body of the SW226 Valve after the Third Wall Thickness Reduction (2.0 mm). .................................................................................. 50
Figure 59: Comparison of the Experimental and FE Load-Circumferential Strain History at Selected Locations on the Neck of the SW226 Valve after the Third Wall Thickness Reduction (2.0 mm). .................................................................................. 51
...... 51 Figure 60: Effect of Corrosion Degradation on the Axial Strain of the SW226 Valve Body.
Figure 61: Effect of Corrosion Degradation on the Circumferential Strain of the SW226 Valve Body.................................................................................................................. 52
Figure 62: Effect of Corrosion Degradation on the Maximum Load under Which the Strains of the SW226 NAB Material Remain in the Elastic Region as Determined from the Finite Element Analyses........................................................................................ 52
Figure A-63: Section View of the SW403 Valve with Initial Wall Thickness (10.2 mm): (a) Vertical View, (b) Horizontal View. ........................................................................... 57
Figure A-64: Section View of the SW403 Valve after the First Wall Thickness Reduction (5.1 mm): (a) Vertical View, (b) Horizontal View............................................................. 57
Figure A-65: Section View of the SW226 Valve with Initial Wall Thickness (10.4 mm): (a) Vertical View, (b) Horizontal View. ........................................................................... 58
Figure A-66: Section View of the SW226 Valve after the First Wall Thickness Reduction (5.5 mm): (a) Vertical View, (b) Horizontal View............................................................. 58
Figure A-67: Section View of the SW226 Valve after the Second Wall Thickness Reduction (3.5 mm): (a) Vertical View, (b) Horizontal View...................................................... 59
Figure A-68: Section View of the SW226 Valve after the Third Wall Thickness Reduction (2.0 mm): (a) Vertical View, (b) Horizontal View...................................................... 59
xii DRDC Atlantic CR 2008-105
List of tables
Table 1: Statistics of the SW403 and SW226 Valve Finite Element Models................................ 17 ......................................................................................................... 17 Table 2: Material Properties.
Table 3: Comparison of Experimental Strains of the SW403 and SW226 Valves at 1500 psi (10.34 MPa) Hydrostatic Load.................................................................................... 26
Table 4: Approximate Maximum Load under Which the Strains of the NAB Material Remain in the Elastic Region as Determined from the Finite Element Analyses. ................... 26
DRDC Atlantic CR 2008-105 xiii

Acknowledgements
The authors are grateful to Dr. Y. Wang of DRDC Atlantic for several meaningful discussions and assistance with the interpretation of the experimental results. The assistance and support of Dr. K.O. Shahin of Martec are also gratefully acknowledged.
xiv DRDC Atlantic CR 2008-105
1 Introduction
1.1 Background
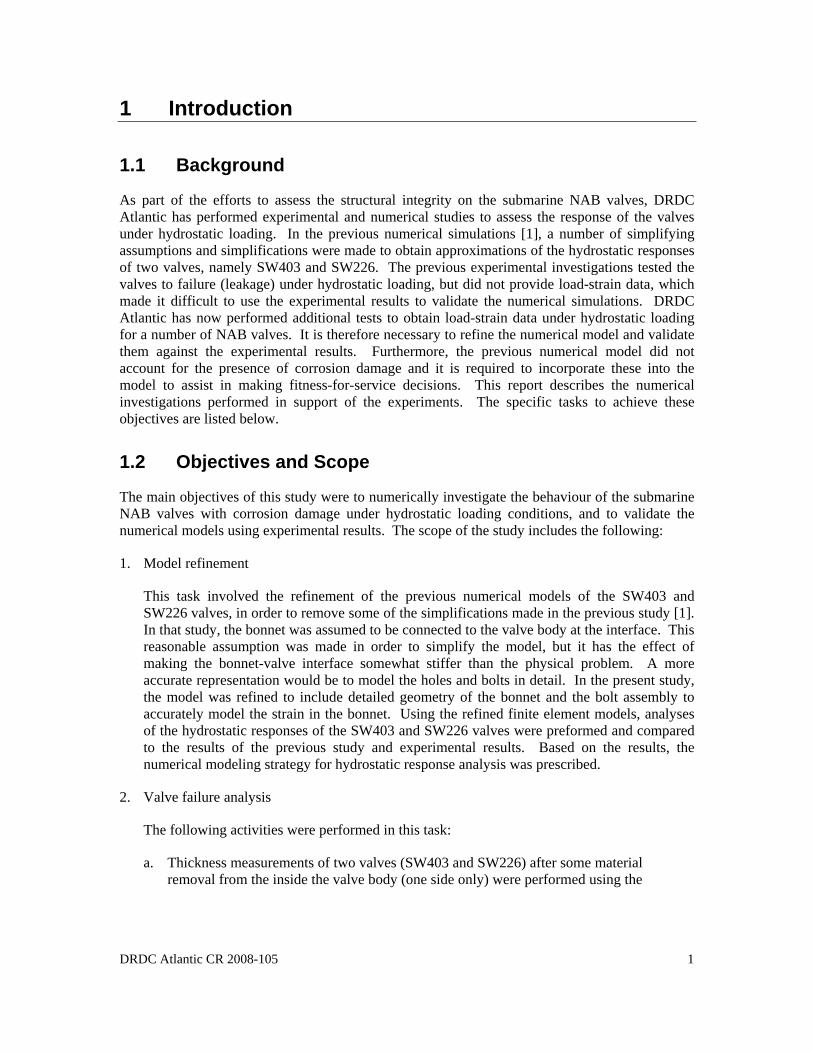
As part of the efforts to assess the structural integrity on the submarine NAB valves, DRDC Atlantic has performed experimental and numerical studies to assess the response of the valves under hydrostatic loading. In the previous numerical simulations [1], a number of simplifying assumptions and simplifications were made to obtain approximations of the hydrostatic responses of two valves, namely SW403 and SW226. The previous experimental investigations tested the valves to failure (leakage) under hydrostatic loading, but did not provide load-strain data, which made it difficult to use the experimental results to validate the numerical simulations. DRDC Atlantic has now performed additional tests to obtain load-strain data under hydrostatic loading for a number of NAB valves. It is therefore necessary to refine the numerical model and validate them against the experimental results. Furthermore, the previous numerical model did not account for the presence of corrosion damage and it is required to incorporate these into the model to assist in making fitness-for-service decisions. This report describes the numerical investigations performed in support of the experiments. The specific tasks to achieve these objectives are listed below.
1.2 Objectives and Scope
The main objectives of this study were to numerically investigate the behaviour of the submarine NAB valves with corrosion damage under hydrostatic loading conditions, and to validate the numerical models using experimental results. The scope of the study includes the following:
1. Model refinement
This task involved the refinement of the previous numerical models of the SW403 and SW226 valves, in order to remove some of the simplifications made in the previous study [1]. In that study, the bonnet was assumed to be connected to the valve body at the interface. This reasonable assumption was made in order to simplify the model, but it has the effect of making the bonnet-valve interface somewhat stiffer than the physical problem. A more accurate representation would be to model the holes and bolts in detail. In the present study, the model was refined to include detailed geometry of the bonnet and the bolt assembly to accurately model the strain in the bonnet. Using the refined finite element models, analyses of the hydrostatic responses of the SW403 and SW226 valves were preformed and compared to the results of the previous study and experimental results. Based on the results, the numerical modeling strategy for hydrostatic response analysis was prescribed.
2. Valve failure analysis
The following activities were performed in this task:
a. Thickness measurements of two valves (SW403 and SW226) after some material removal from the inside the valve body (one side only) were performed using the
DRDC Atlantic CR 2008-105 1
CMM machine at Dalhousie University. The previous valve geometry data for each valve were used as baseline data for the measurement.
b. Development of numerical models of two valves (SW403 and SW226) based on the new thickness data in the predefined thickness reduction region.
c. Analysis of the hydrostatic response of the valves with reduced wall thickness at the specified region. Comparison with the strain data obtained from the experiments.
1.3 Organization of this Document
The remainder of this document is organized as follows:
• Chapter 2 provides a description of the problem, where details of the NAB valve configurations, loading conditions and analysis requirements are presented;
• Chapter 3 describes of the measurements taken to completely define the valve geometries and CAD drawings of the valves are presented;
• Chapter 4 provides details of the finite element models used to analyze the NAB valves;
• Chapter 5 discusses the analysis of the NAB valves subject to hydrostatic loading; and
• Chapter 6 provides a summary of the work, conclusions reached and recommendations for future work.
2 DRDC Atlantic CR 2008-105

2 Problem Description
2.1 Configuration of Submarine NAB Valves
Figure 1 shows pictures of typical valves on the Victoria Class submarines and Figure 2 shows pictures of the valves after some material removal from the inside the valve body in this study. These valves are cast from nickel aluminum bronze (NAB) material, and are designed for a safe commission life (SCL) of 15 years [2]. As the valves approach their design SCL, DRDC has initiated studies to conduct the fitness-for-purpose evaluations under various loading and environmental conditions, and maintenance and repair scenarios. One of these studies involved experimental investigations into the behaviour of valves with corrosion damage under hydrostatic loading conditions. The present study seeks to support the experimental studies, using numerical simulation. Description of the experimental set-ups is provided below.
2.2 Hydrostatic Load Tests
Figure 3 shows the experimental setup during hydrostatic testing. Each valve was pressurized gradually and manually inside the test container to a preset pressure and then gradually decreased to zero. Each valve was also instrumented with three strain gauges to capture the axial and the circumferential strain in the valve body and the circumferential strain in the neck, as shown in Figure 4. The data on both the hydrostatic pressure and the strains were recorded during the test using a data acquisition system. The valves tested included valves designated as SW403 and SW226. In addition, the wall thickness of the thinner portion of the valves was gradually reduced by material removal as shown in Figure 2, resulting in a total of two and four cases being tested for the SW403 and the SW226 valve, respectively.
2.3 Requirements
It was required to numerically simulate the hydrostatic responses of two valves designated as SW403 and SW226 with reduced wall thickness at the specified region, and to compare the numerical results to experimental results, where available.
DRDC Atlantic CR 2008-105 3
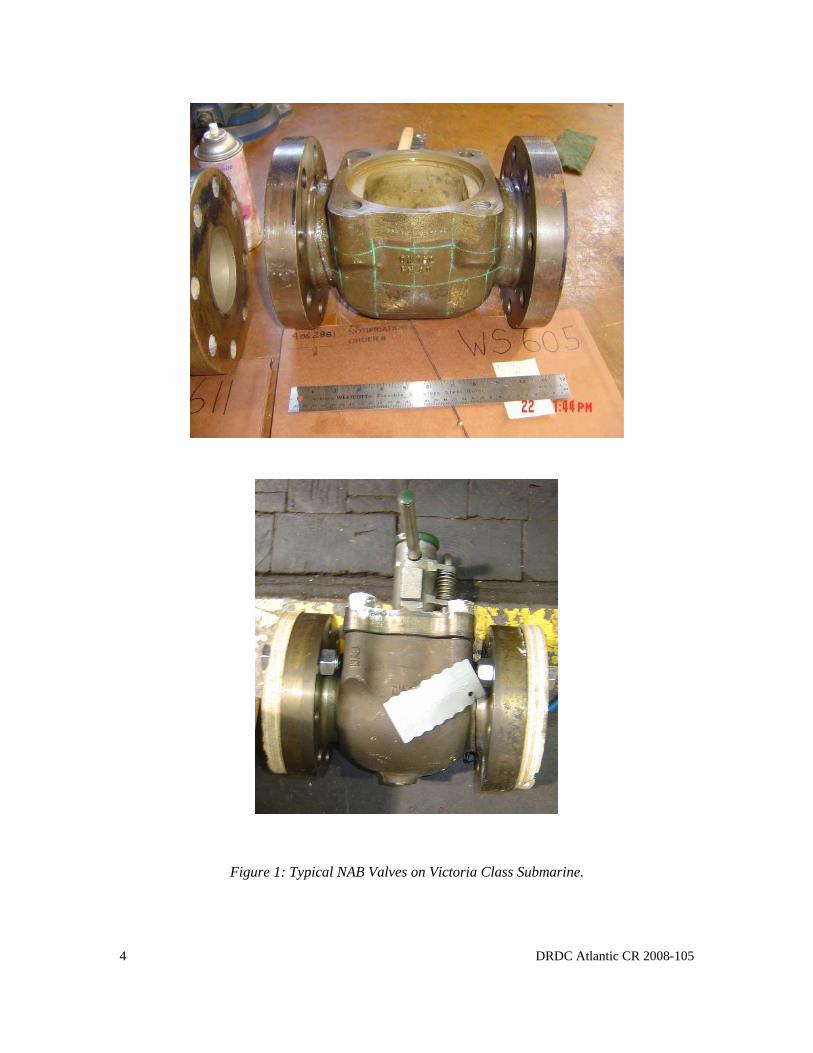
Figure 1: Typical NAB Valves on Victoria Class Submarine.
4 DRDC Atlantic CR 2008-105
(a)
(b)
Figure 2: NAB Valves after Some Material Removal from the Inside the Valve Body: (a) SW403, (b) SW226 [3].
DRDC Atlantic CR 2008-105 5

Test container
Data acquisition system
Test pump unit
Figure 3: Hydrostatic Test Configuration [3].
Neck (Circumferential)
Body (Circumferential)
Body (Axial)
Figure 4: Instrumentation of the Strain Gauges on the SW226 Valve [3].
6 DRDC Atlantic CR 2008-105
3 Geometric Configurations of NAB Valves
3.1 Introduction
CAD drawings of the valve geometries were not available, so in this study, it was required to first take measurements of the valve dimensions in order to produce CAD drawings of the valves. Due to the complexity of the valve geometries, it was decided that measurements of the valve dimensions be carried out using a Coordinate Measuring Machine (CMM), rather than hand tools. The CMM machine at the Advanced Manufacturing Group (AMG) of Dalhousie University was selected for this purpose, due to the capabilities, proximity and availability of the facility to the project team. The machine is a Mitutoyo BHN305 model, which is a 3 axis computer numerical controlled (CNC) Coordinate Measuring Machine (CMM) that is used to measure part features such as holes, cones, arcs, spheres, surfaces, etc. Features that cannot be measured with conventional hand tools are easily measured to a high degree of precision with the CMM. Figure 5 shows a picture of the CMM. It has the following capabilities (http://nscadcam.dal.ca/cmm_info.htm):
Work piece Capacity: Measuring range (l x w x h) 315 x 490 x 290 mmWorking area 529 x 920 mm Maximum work piece height 365 mm Maximum work piece mass 150 kg
Figure 6 shows pictures of how measurements typical valve components are made with the CMM.
The CMM directly interfaces with CAD packages, such as Pro Engineer, to produce 3-D geometries of the objects. The CAD software package will then provide IGES or STEP files that can be easily accessed by finite element packages. CAD drawings of the valves were developed in Pro Engineer, based on measurements taken with the CMM machine. Details are provided in the following sections.
3.2 SW403 Valve
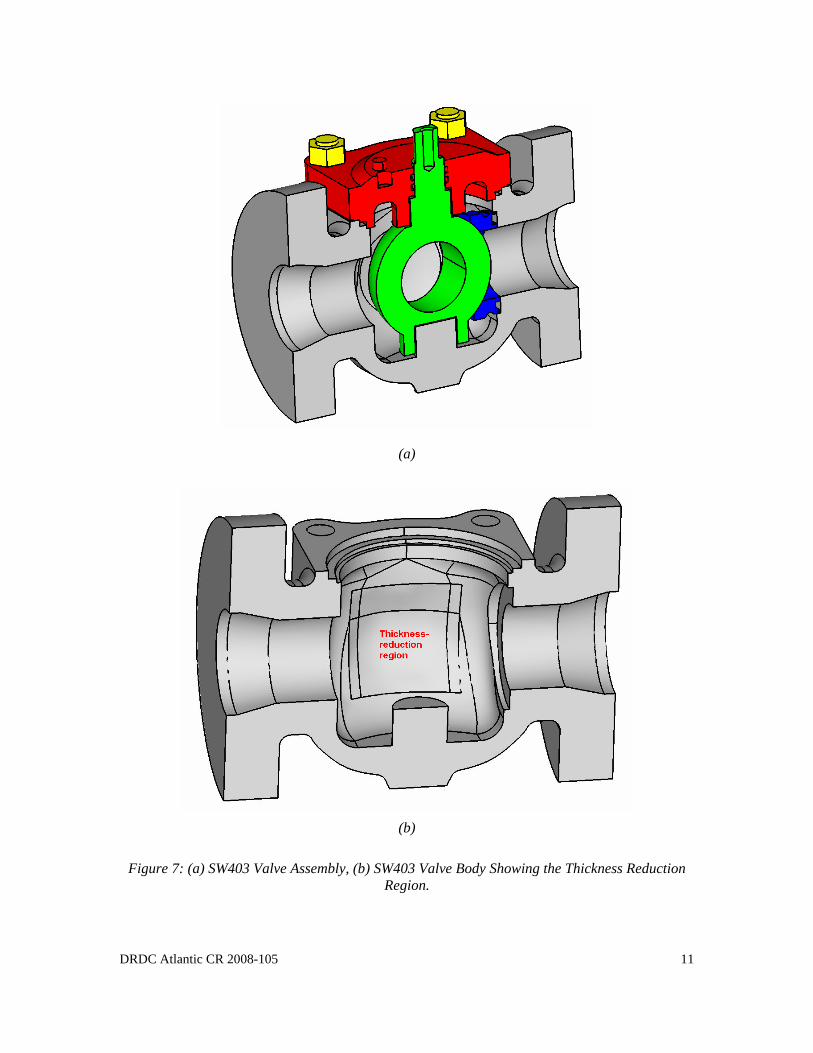
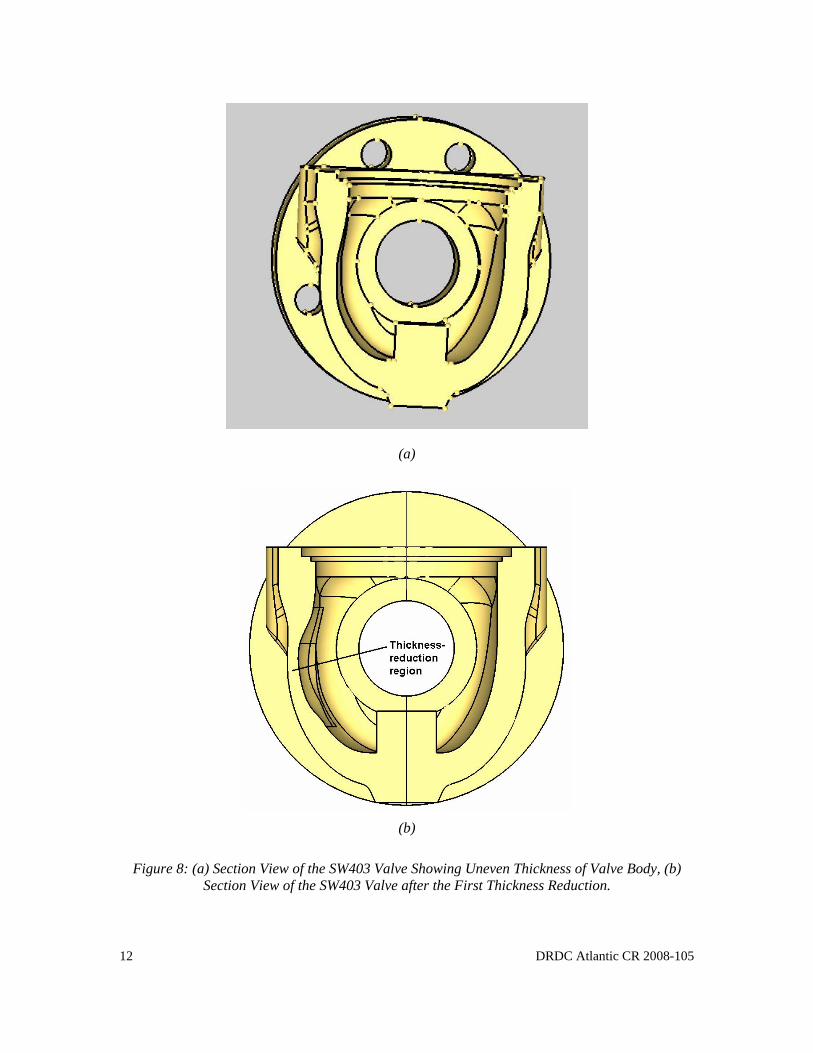
Figure 7(a) shows e-drawing of the SW403 valve assembly, comprising of the valve body (grey), ball (green), bonnet or valve cover (red), the spacer (blue) and the bolts (yellow). Only half of the valve assembly is shown. However, it should be pointed out that the valve was not completely symmetrical about the axial plane that passes through the centre of the valve, as can be seen from the section view of the valve in Figure 8(a). Thus, a full model was used in this study as opposed to a symmetric model used in the previous study [1], as discussed later in Chapter 4. In addition, the wall thickness of the thinner portion of the valve body was reduced once by material removal to simulate corrosion. Figure 7(b) shows e-drawing of the SW403 valve body with the thickness reduction region and Figure 8(b) shows the section view of the valve after the thickness reduction. Detailed dimensions and views of the valve assemble are provided in Annex A.
DRDC Atlantic CR 2008-105 7
3.3 SW226 Valve
Figure 9(a) shows e-drawings of the SW226 valve assembly, comprising of the valve body (grey), ball (green), bonnet or valve cover (cyan) the spacer (blue) and the bolts (yellow). Only half of the valve assembly is shown. However, it should be pointed out again that the valve was not completely symmetrical about the axial plane that passes through the centre of the valve, as can be seen from the section view of the valve in Figure 10(a). Thus, a full model was again used in this study as opposed to a symmetric model used in the previous study [1], as discussed later in Chapter 4. In addition, the wall thickness of the thinner portion of the valve body was gradually reduced three times by material removal to simulate corrosion. Figure 9(b) shows e-drawing of the SW226 valve body with the thickness reduction region and Figure 10(b) shows the section view of the valve after the first thickness reduction. It should be noted that the overall dimensions of the SW226 valve were larger than those of the SW403, but both valves have similar wall thickness around the valve mid-body. Detailed dimensions and views of the valve assemble after thickness reductions are provided in Annex A. Details of the initial valves can be found in the Appendix A of [1].
8 DRDC Atlantic CR 2008-105
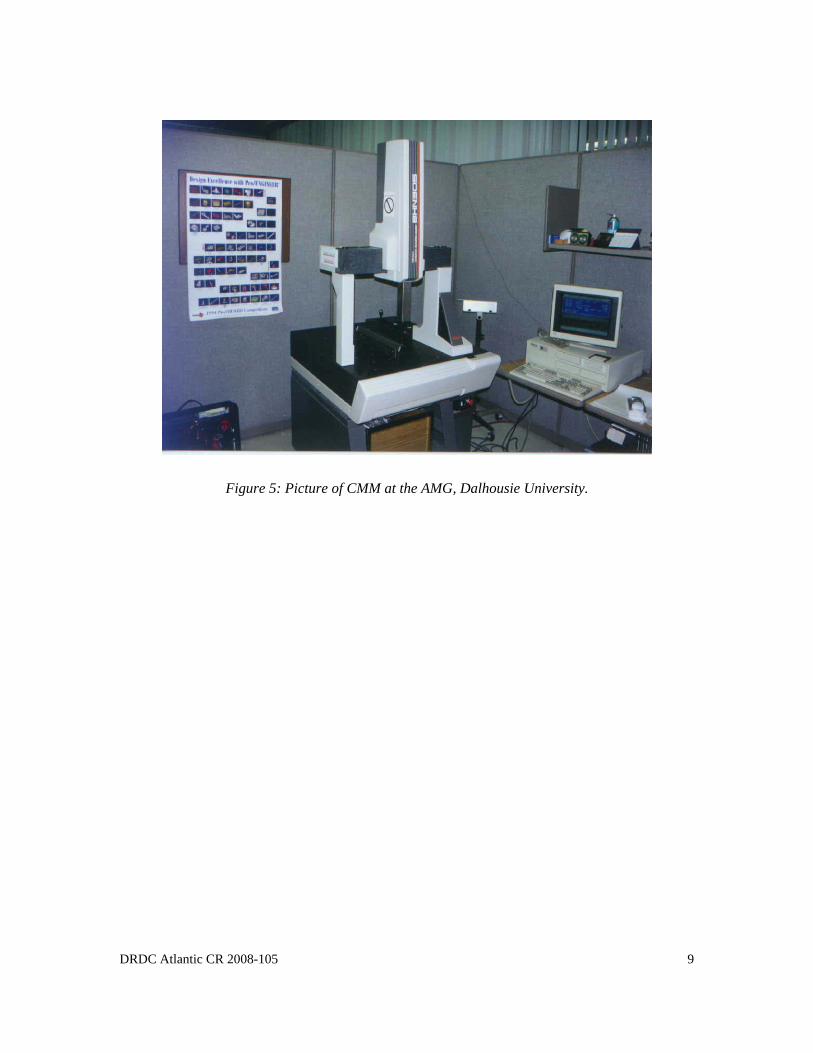
Figure 5: Picture of CMM at the AMG, Dalhousie University.
DRDC Atlantic CR 2008-105 9
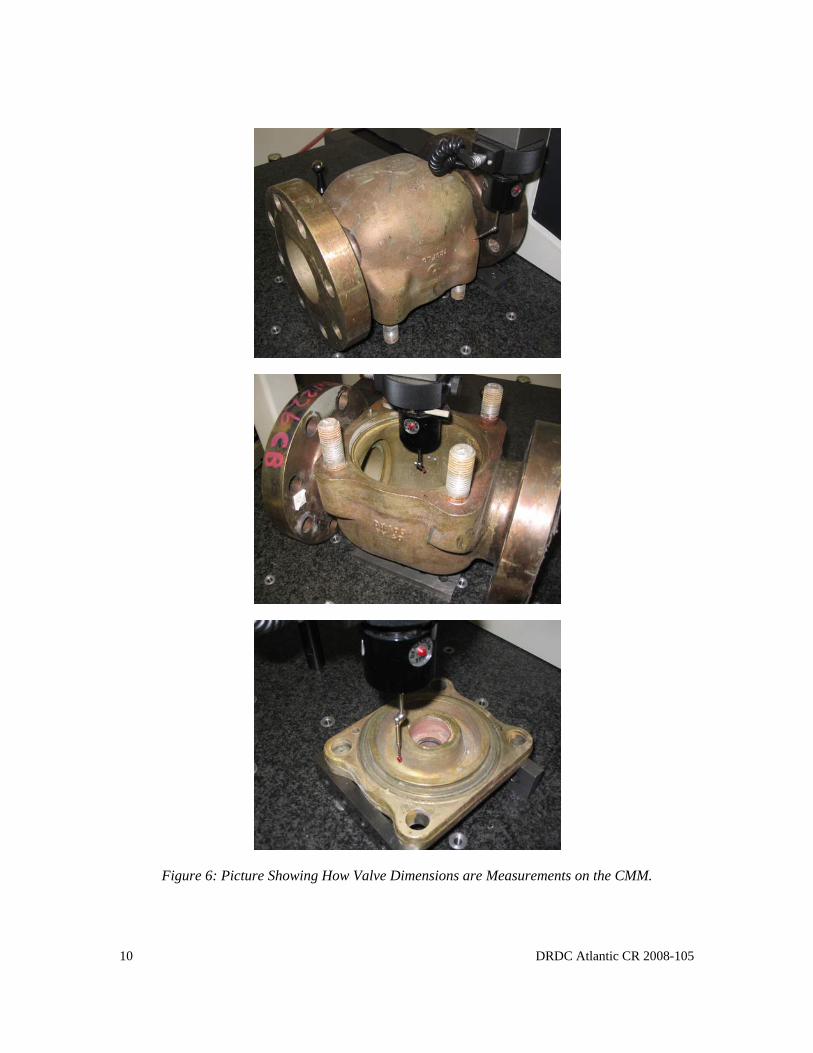
Figure 6: Picture Showing How Valve Dimensions are Measurements on the CMM.
10 DRDC Atlantic CR 2008-105
(a)
(b)
Figure 7: (a) SW403 Valve Assembly, (b) SW403 Valve Body Showing the Thickness Reduction Region.
DRDC Atlantic CR 2008-105 11
(a)
(b)
Figure 8: (a) Section View of the SW403 Valve Showing Uneven Thickness of Valve Body, (b) Section View of the SW403 Valve after the First Thickness Reduction.
12 DRDC Atlantic CR 2008-105

(a)
(b)
Figure 9: (a) SW226 Valve Assembly, (b) SW226 Valve Body Showing the Thickness Reduction Region.
DRDC Atlantic CR 2008-105 13
(a)
(b)
Figure 10: (a) Section View of the SW226 Valve Showing Uneven Thickness of Valve Body, (b) Section View of the SW226 Valve after the First Thickness Reduction.
14 DRDC Atlantic CR 2008-105
4 Finite Element Models of NAB Valves
4.1 Finite Element Approach
The finite element modeling and analysis approach adopted in the study was governed by the need to adequately model the complex geometric configurations of the valves assemblies, as well as the nonlinear static behaviours of the systems under the intense hydrostatic loads. The approach consisted of the use of the HyperMesh [4], LS-DYNA [5] finite element software suites. HyperMesh was used to generate the finite element models. This software has capabilities for directly importing solid models from CAD software such as Pro Engineer [6] that was used to model the geometric configurations of the system, and has very robust solid finite element modeling features. On the other hand, the LS-DYNA suite was used to perform the static elastic-plastic responses of the valve systems. The software has a wide range of elements, explicit and implicit solvers for performing static and dynamic analysis, and capabilities for handling both material and geometric nonlinearities. Details of the finite element models and analysis results are provided in the following sections.
4.2 Finite Element Meshes
As discussed in Chapter 3, the geometric configurations of the valves assemblies were defined and modeled in the Pro Engineer CAD software package. The geometries were then exported as STEP assembly files for import into HyperMesh.
Due to the complexity of the valve geometry, and in order to accurately model its geometry, it was decided to use tetrahedral finite elements to model the valve configuration. Besides, Hypermesh provides a convenient auto mesh capability to generate solid finite element meshes for complex geometries, which is only available for meshing with tetrahedral elements.
The tetrahedral elements do not provide the same level of accuracy as the hexahedral (brick) elements. It is usually necessary to use finer tetrahedral element meshes in order to obtain reasonably accurate results. To this end investigations were performed to determine the level of tetrahedral finite element mesh refinement required to produce the same level of accuracy as the hexahedral elements. These preliminary investigations enabled the determination of the level of mesh refinement required to provide reasonable balance between accuracy and computational resources (storage space and run times). The meshes used in this study were found to provide smooth contours of displacements and stresses/strains.
4.3 Mesh Refinement
In the present study, the previous finite element models of the valves were refined, in order to remove some of the simplifications made in the previous study [1]. As mentioned in Chapter 3, in the previous study, symmetry about an axial plane that passes through the centre of the valve was invoked to reduce the sizes of the models, in anticipation of the large transient nonlinear elastic-plastic analyses. The thinner portion of the valve was modeled as this would govern the valve behaviour. However, in the present study, the wall thickness of the thinner portion of the
DRDC Atlantic CR 2008-105 15
valve body was gradually reduced, making the valve increasingly unsymmetrical about the axial plane. Thus, the modeling of the full valve was deemed to be more appropriate for the present study.
In addition, in the previous study, the bonnet was assumed to be connected to the valve body at the interface. This reasonable assumption was made in order to simplify the model, but it has the effect of making the bonnet-valve interface somewhat stiffer than the physical problem. A more accurate representation would be to model the holes and the bolts in detail. In the present study, the model was refined to include detailed geometry of the bonnet and the bolt assembly to accurately model the strain in the bonnet. Figure 11 shows the section view of the bonnet-bolt interface of a typical model. An appropriate contact penalty stiffness scale factor on avoiding nodal penetration was assigned to the bonnet-bolt interface for each model.
Figure 12 shows the complete view of the SW403 valve model with initial wall thickness. The wall thickness of the thinner portion of this valve was reduced once, resulting in a total of two cases of experimental testing and analyses. Figure 13 shows the complete view of the SW226 valve model with initial wall thickness. The wall thickness of the thinner portion of this valve was reduced three times, resulting in a total of four cases of experimental testing and analyses. The model statistics are provided in Table 1.
4.4 Material Properties
The valve are made of nickel aluminum bronze (NAB) material composed approximately of 9-10% aluminum, 5% nickel, 5% iron, and the balance being copper [2], while the bolts and the valve end cover plates are made of 44W steel. The valve materials can be assumed to be both homogeneous and isotropic, which means they have the same physical and mechanical properties throughout their volumes and have these same properties in all directions, such that the stress-strain relationship obtained using standard test in uni-axis specimen can be used in 3-d numerical simulation. The mechanical properties of these materials, obtained from Refs [7] and [8], are summarized in Table 2. All materials are assumed to behave in an elastic-plastic manner, and are modeled with Material Type 24 in LS-DYNA [5], which treats the stress-strain relationship by a bilinear stress-strain curve by defining the yield stress and the tangent (plastic) modulus.
4.5 Boundary Conditions
Figure 14 shows the boundary conditions used for a typical model. The pretension in the bolts was assumed to keep the top of the bolts from moving. Thus, the boundary conditions applied were:
a. u = v = w = θ = θ = θx y z = 0 at the top of the bolts and the bolt contact faces on the valve end cover plates
where u, v, w are the translational displacements in the global x, y, and z-directions, respectively, and θx, θ , θy z are the rotations about the respective global axial directions, respectively.
16 DRDC Atlantic CR 2008-105
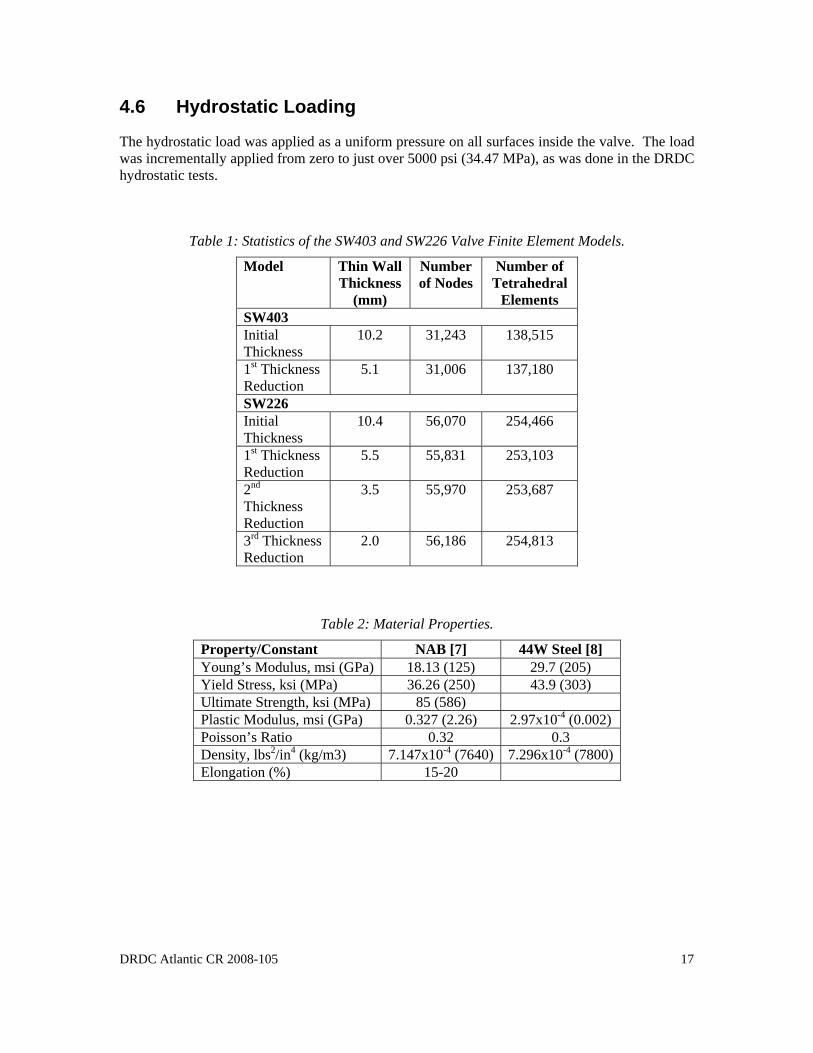
4.6 Hydrostatic Loading
The hydrostatic load was applied as a uniform pressure on all surfaces inside the valve. The load was incrementally applied from zero to just over 5000 psi (34.47 MPa), as was done in the DRDC hydrostatic tests.
Table 1: Statistics of the SW403 and SW226 Valve Finite Element Models.
Model Thin Wall Thickness
(mm)
Number of Nodes
Number of Tetrahedral
Elements SW403 Initial Thickness
10.2 31,243 138,515
st1 Thickness Reduction
5.1 31,006 137,180
SW226 Initial Thickness
10.4 56,070 254,466
st1 Thickness Reduction
5.5 55,831 253,103
nd2 Thickness Reduction
3.5 55,970 253,687
rd3 Thickness Reduction
2.0 56,186 254,813
Table 2: Material Properties.
Property/Constant NAB [7] 44W Steel [8] Young’s Modulus, msi (GPa) 18.13 (125) 29.7 (205) Yield Stress, ksi (MPa) 36.26 (250) 43.9 (303) Ultimate Strength, ksi (MPa) 85 (586) Plastic Modulus, msi (GPa) 0.327 (2.26) 2.97x10⁻⁴ (0.002) Poisson’s Ratio 0.32 0.3 Density, lbs2 4/in (kg/m3) 7.147x10⁻⁴ (7640) 7.296x10⁻⁴ (7800) Elongation (%) 15-20
DRDC Atlantic CR 2008-105 17
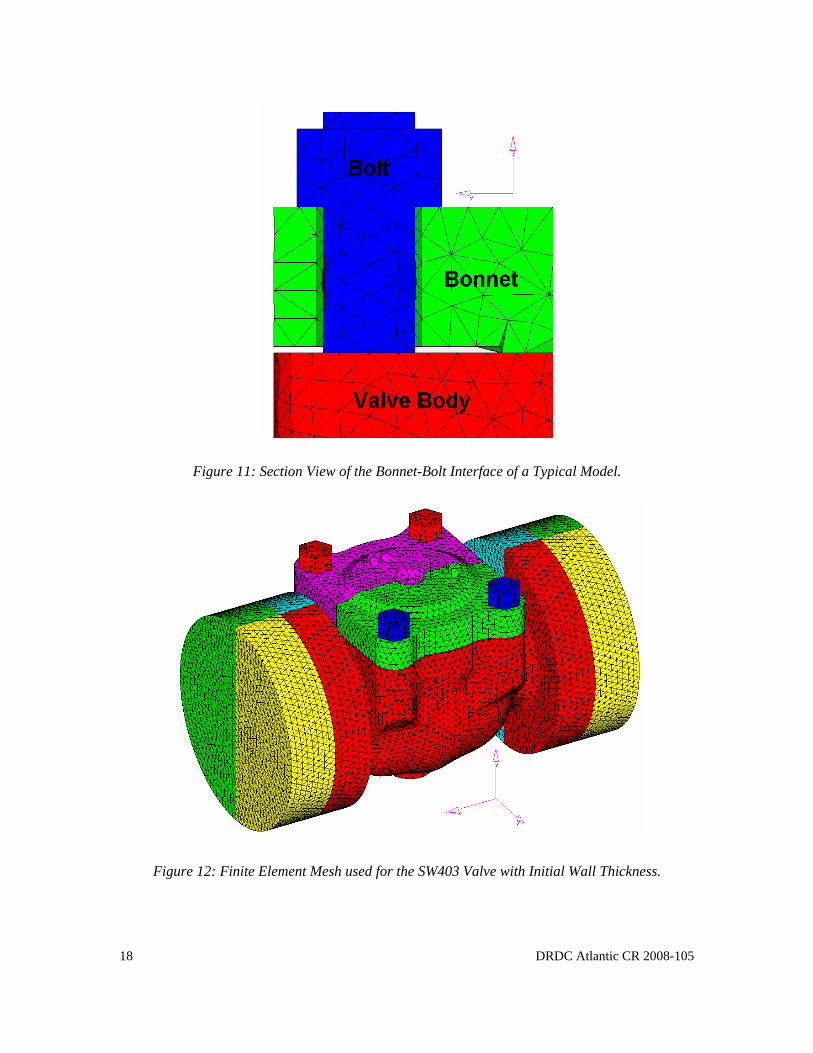
Figure 11: Section View of the Bonnet-Bolt Interface of a Typical Model.
Figure 12: Finite Element Mesh used for the SW403 Valve with Initial Wall Thickness.
18 DRDC Atlantic CR 2008-105
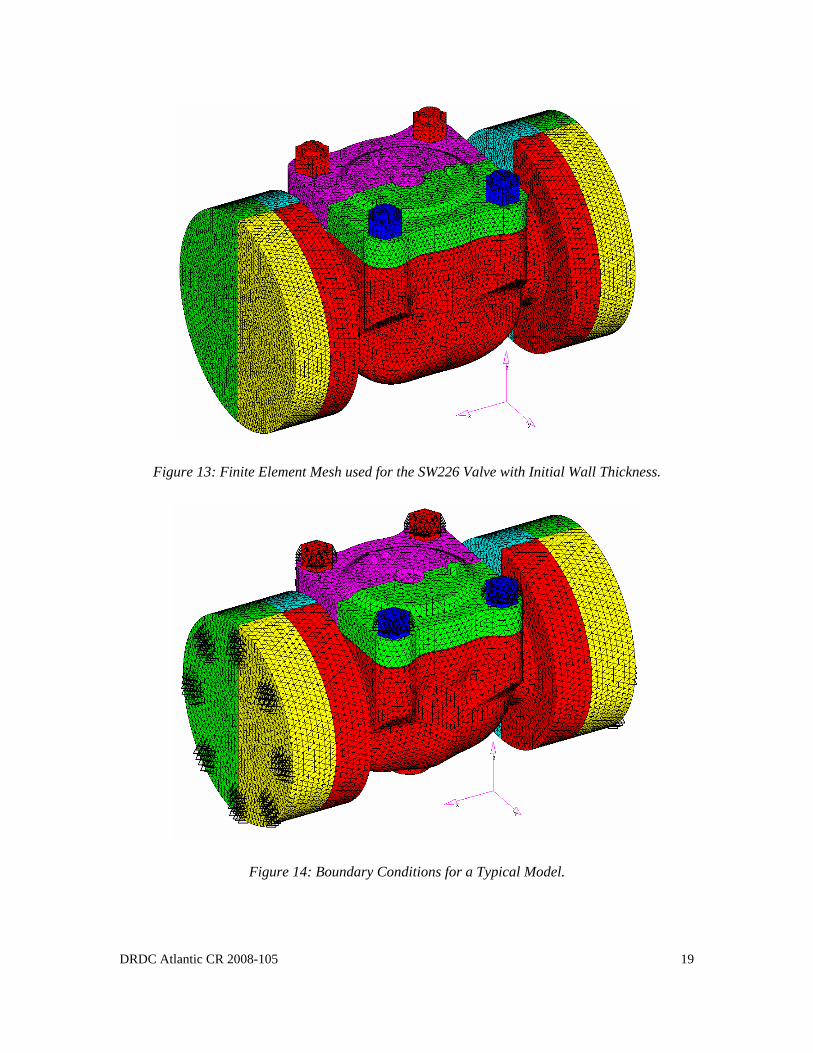
Figure 13: Finite Element Mesh used for the SW226 Valve with Initial Wall Thickness.
Figure 14: Boundary Conditions for a Typical Model.
DRDC Atlantic CR 2008-105 19
5 Response of NAB Valves to Hydrostatic Load
The responses of the SW403 and SW226 valves to the hydrostatic load were analyzed using the LS-DYNA solver. Linear elastic analysis showed that the maximum stress exceeded the NAB yield stress. Hence a nonlinear elastic plastic analysis was performed using the LS-DYNA implicit solver. The load was applied incrementally in automatically adjusted steps. The results of the analyses are discussed below.
The resultant displacement, von Mises stress and effective strain fields from the finite element analysis of each model are plotted in the following sections. The resultant displacement (R) is the magnitude of the vector sum of the displacements in the global x, y, and z-directions:
222 wvuR ++= (1),
where u, v and w are the magnitudes of the translational displacement in the global x, y, and z-directions.
VMσThe von Mises stress ( ) is a scalar stress value that can be computed from the stress tensor. It is used as a criterion in determining the onset of yielding in ductile materials such as metals. The criterion states that a material starts yielding when its von Mises stress reaches the yield stress of the material.
( ) ( ) ( )2132
322
2121 σσσσσσσ −+−+−=VM , (2)
where 1σ , 2σ and 3σ are the principal stresses.
VMεSimilarly, the effective strain ( ) is the same criterion computed from the strain tensor:
( ) ( ) ( )2132
322
2132 εεεεεεε −+−+−=VM (3),
3ε1ε 2ε, and are the principal strains. where
5.1 SW403 Valve
The wall thickness of the thinner portion of this valve was reduced once, resulting in a total of two cases of experimental testing and analyses.
20 DRDC Atlantic CR 2008-105
5.1.1 Initial Wall Thickness of 10.2 mm
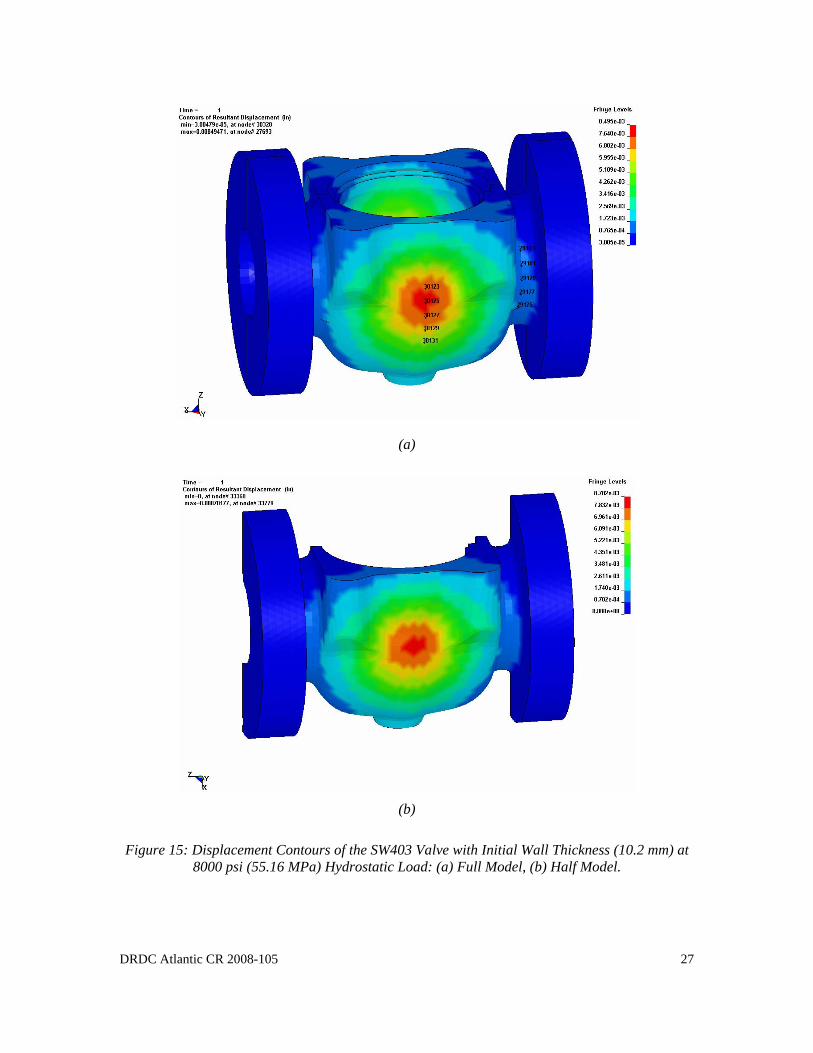
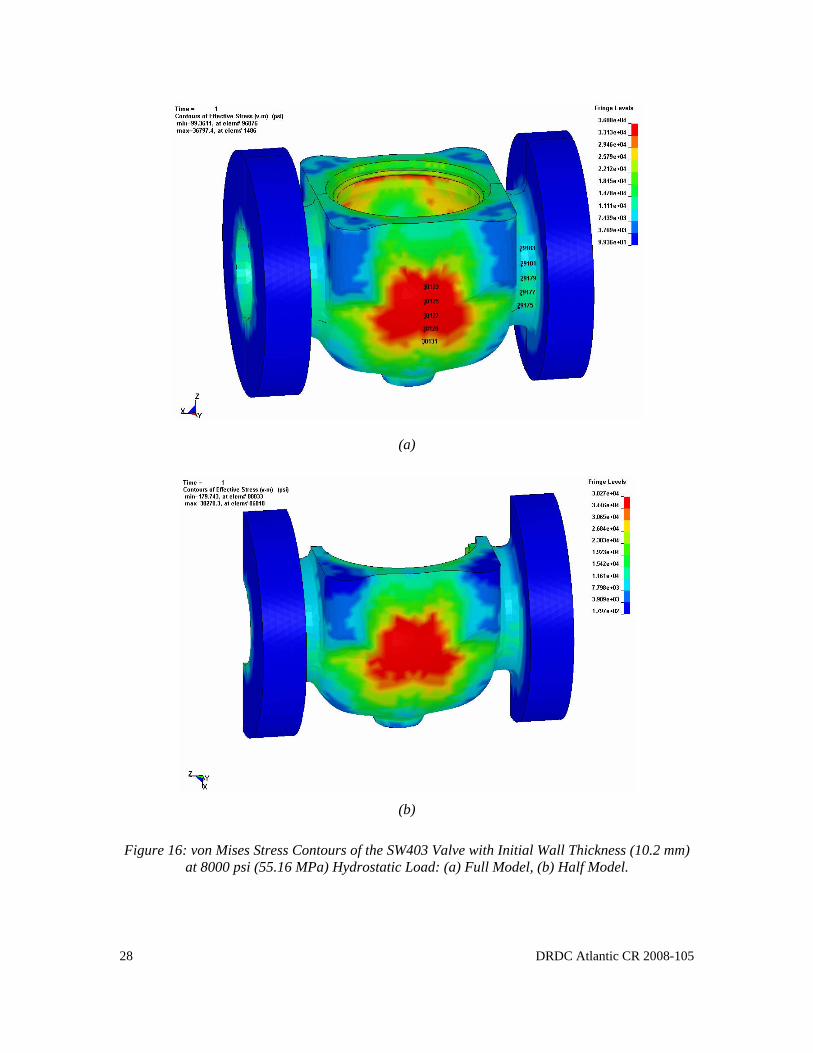
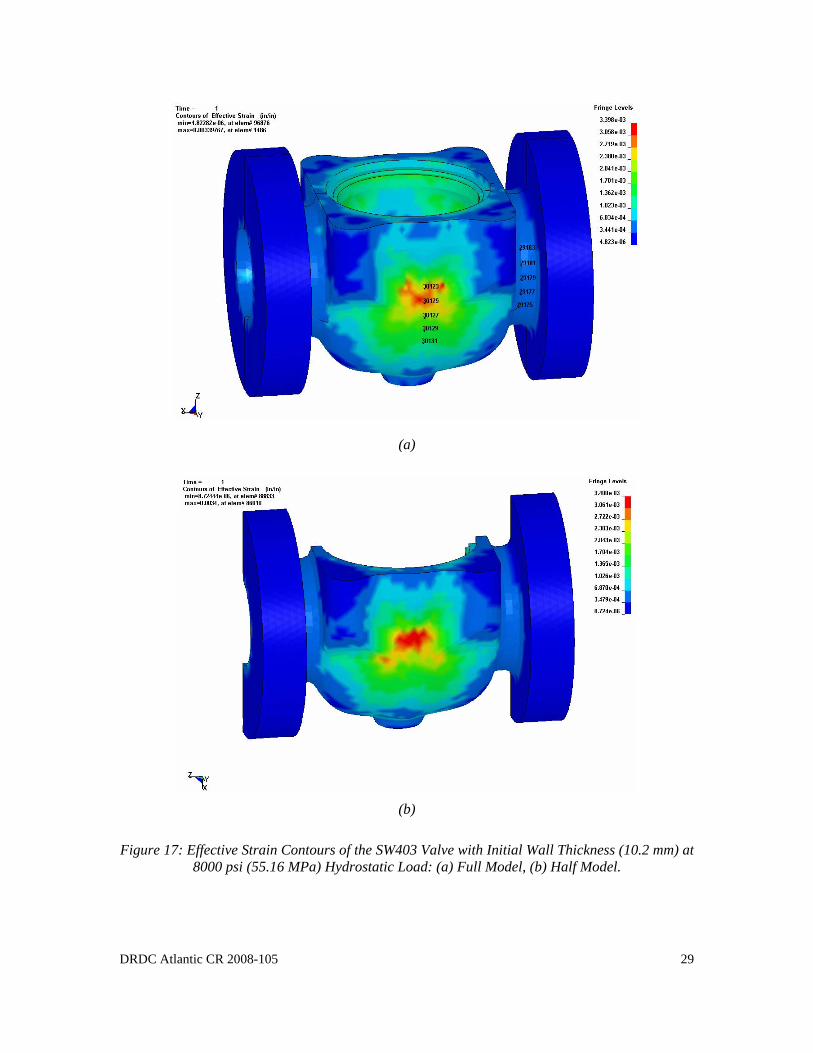
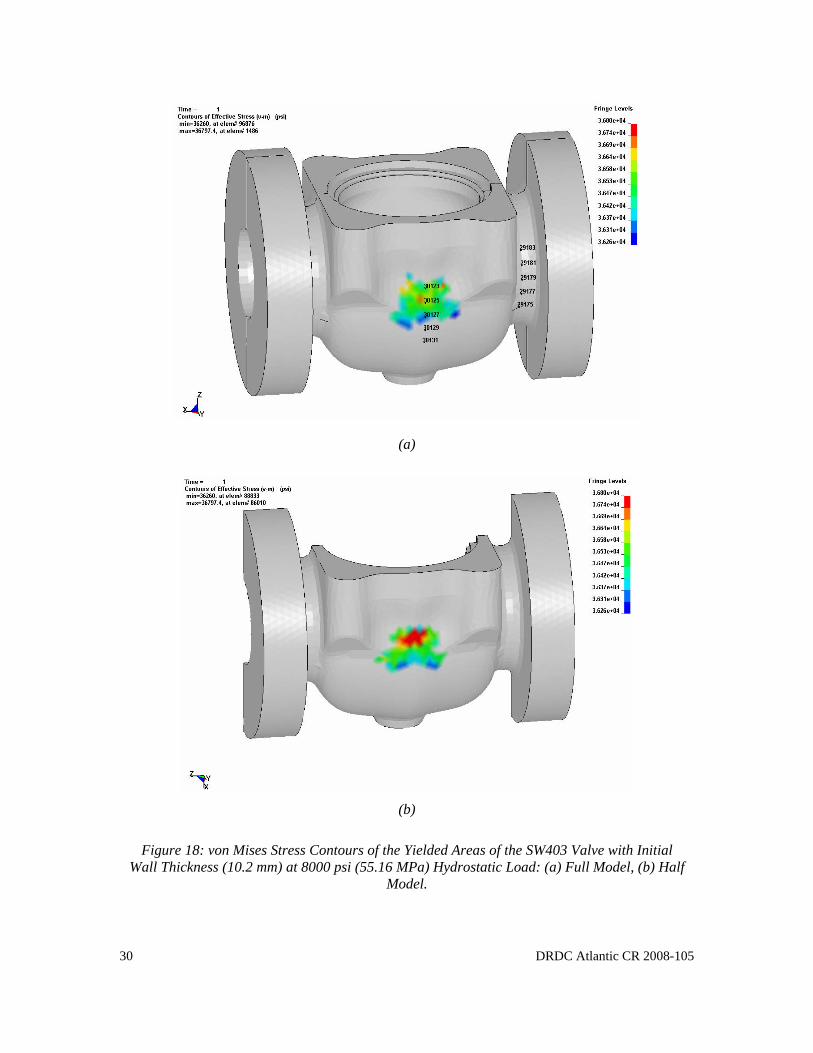
As indicated in Table 1, the initial wall thickness of the thinner portion of the SW403 valve was 10.2 mm. Figure 15 to Figure 17 compare the contours of the displacement, von Mises stress and effective strain fields, respectively, of the full model of the valve in the present study to the half model in the previous study [1], at 8000 psi (55.16 MPa) hydrostatic load. Figure 18 shows the von Mises stress contours of the yielded areas only. It can be seen from these figures that the maximum displacements, stresses and strains generally occurred in the centre of the valve body. It can also be observed that the maximum displacement, stress and strain in the full model were similar to those in the half model. However, the differences in the results can be expected to increase as the wall thickness is reduced and the valve becomes more unsymmetrical. In addition, the maximum load under which the strains of the NAB material remain in the elastic region is approximately 5500 psi, as determined from the finite element analysis.
Figure 19 to Figure 21 compare the load-axial strain history in the body, the load-circumferential strain history in the body and the load-circumferential strain history in the neck, respectively, of the full model at the strain gauge locations to the half model and the experimental results. It can be seen from these figures that the load-strain histories from the models were comparable to the experimental results, except for the slight deviation of the linear behaviour observed in the neck strain in the experiment. It can also be observed that the responses from the half model were in general stiffer than the full model. This observation is possibly due to the fact that the modeling of the bonnet-valve interface in the previous study was more constrained than that in the present study.
Figure 22 to Figure 24 compare the load-axial strain history in the body, the load-circumferential strain history in the body and the load-circumferential strain history in the neck, respectively, of the full model at selected locations near the strain gauges (SG) to the experimental results. It can be seen from these figures that all three strain responses remained linear elastic for the load range considered (up to 6000 psi). In addition, the finite element results in the body were reasonably good as the experimental results were within the range of finite element results near the strain gauges. However, the circumferential strain in the neck was underestimated.
5.1.2 After the First Wall Thickness Reduction to 5.1 mm
As indicated in Table 1, the wall thickness of the thinner portion of the SW403 valve was 5.1 mm after the first reduction. Figure 25 to Figure 27 show the contours of the displacement, von Mises stress and effective strain fields, respectively, of the model of the valve, at 5306 psi (36.58 MPa) hydrostatic load. Figure 28 shows the von Mises stress contours of the yielded areas only. It can be seen from these figures that the maximum displacements, stresses and strains again generally occurred in the centre of the valve body. It can also be observed that the maximum displacement, stress and strain in this model were greater than those in the previous SW403 valve with initial wall thickness at similar load, as expected due to the reduced wall thickness. In addition, the maximum load under which the strains of the NAB material remain in the elastic region decreases to approximately 3200 psi, as determined from the finite element analysis.
Figure 29 to Figure 31 compare the load-axial strain history in the body, the load-circumferential strain history in the body and the load-circumferential strain history in the neck, respectively, of the full model at selected locations near the strain gauges (SG) to the experimental results. It can
DRDC Atlantic CR 2008-105 21
be seen from these figures that the experimental strain responses showed signs of yielding in the body for the load range considered (up to 6000 psi). In addition, within the linear elastic region, the wall thickness reduction caused an increase of about 34% in the axial strain in the body, an increase of about 98% in the circumferential strain in the body and an increase of about 36% in the circumferential strain in the neck over the strains in the valve with initial wall thickness, as shown in Table 3, which summarizes the average experimental strains at 1500 psi hydrostatic load of each valve. Furthermore, the finite element results for the axial strain in the body were reasonably good as the experimental results were within the range of finite element results near the strain gauges. However, the circumferential strain in both the body and the neck were underestimated, especially in the body. It is expected that further model refinement, such as the use of higher order tetrahedral elements, may be required to improve the circumferential strain responses. This could not be carried out within the time frame of this project. However, the effect of such model refinement on the circumferential strains should be investigated in the future.
5.2 SW226 Valve
The wall thickness of the thinner portion of this valve was reduced three times, resulting in a total of four cases of experimental testing and analyses.
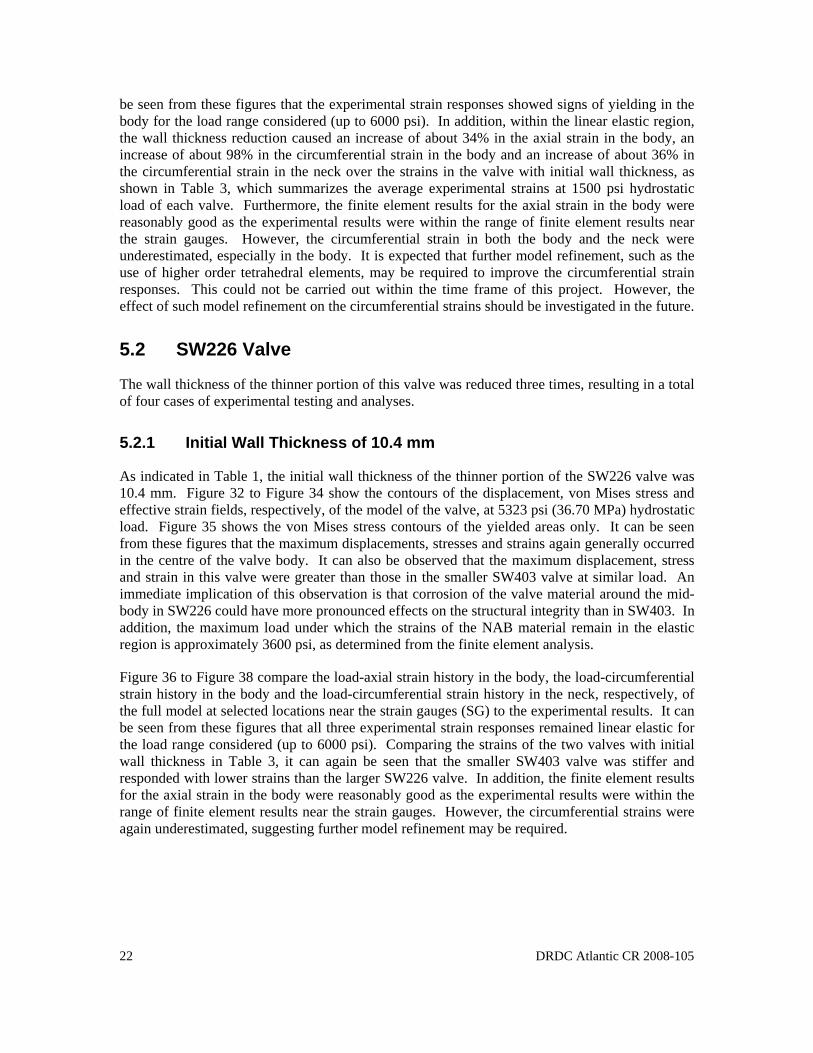
5.2.1 Initial Wall Thickness of 10.4 mm
As indicated in Table 1, the initial wall thickness of the thinner portion of the SW226 valve was 10.4 mm. Figure 32 to Figure 34 show the contours of the displacement, von Mises stress and effective strain fields, respectively, of the model of the valve, at 5323 psi (36.70 MPa) hydrostatic load. Figure 35 shows the von Mises stress contours of the yielded areas only. It can be seen from these figures that the maximum displacements, stresses and strains again generally occurred in the centre of the valve body. It can also be observed that the maximum displacement, stress and strain in this valve were greater than those in the smaller SW403 valve at similar load. An immediate implication of this observation is that corrosion of the valve material around the mid-body in SW226 could have more pronounced effects on the structural integrity than in SW403. In addition, the maximum load under which the strains of the NAB material remain in the elastic region is approximately 3600 psi, as determined from the finite element analysis.
Figure 36 to Figure 38 compare the load-axial strain history in the body, the load-circumferential strain history in the body and the load-circumferential strain history in the neck, respectively, of the full model at selected locations near the strain gauges (SG) to the experimental results. It can be seen from these figures that all three experimental strain responses remained linear elastic for the load range considered (up to 6000 psi). Comparing the strains of the two valves with initial wall thickness in Table 3, it can again be seen that the smaller SW403 valve was stiffer and responded with lower strains than the larger SW226 valve. In addition, the finite element results for the axial strain in the body were reasonably good as the experimental results were within the range of finite element results near the strain gauges. However, the circumferential strains were again underestimated, suggesting further model refinement may be required.
22 DRDC Atlantic CR 2008-105
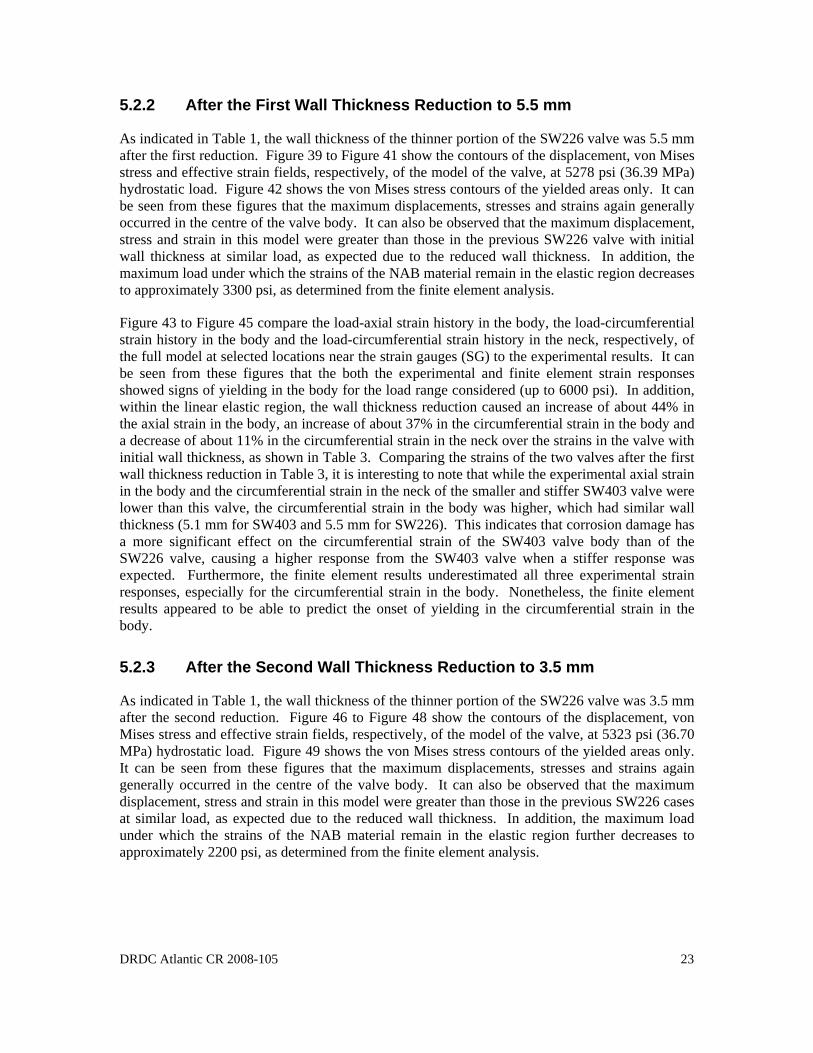
5.2.2 After the First Wall Thickness Reduction to 5.5 mm
As indicated in Table 1, the wall thickness of the thinner portion of the SW226 valve was 5.5 mm after the first reduction. Figure 39 to Figure 41 show the contours of the displacement, von Mises stress and effective strain fields, respectively, of the model of the valve, at 5278 psi (36.39 MPa) hydrostatic load. Figure 42 shows the von Mises stress contours of the yielded areas only. It can be seen from these figures that the maximum displacements, stresses and strains again generally occurred in the centre of the valve body. It can also be observed that the maximum displacement, stress and strain in this model were greater than those in the previous SW226 valve with initial wall thickness at similar load, as expected due to the reduced wall thickness. In addition, the maximum load under which the strains of the NAB material remain in the elastic region decreases to approximately 3300 psi, as determined from the finite element analysis.
Figure 43 to Figure 45 compare the load-axial strain history in the body, the load-circumferential strain history in the body and the load-circumferential strain history in the neck, respectively, of the full model at selected locations near the strain gauges (SG) to the experimental results. It can be seen from these figures that the both the experimental and finite element strain responses showed signs of yielding in the body for the load range considered (up to 6000 psi). In addition, within the linear elastic region, the wall thickness reduction caused an increase of about 44% in the axial strain in the body, an increase of about 37% in the circumferential strain in the body and a decrease of about 11% in the circumferential strain in the neck over the strains in the valve with initial wall thickness, as shown in Table 3. Comparing the strains of the two valves after the first wall thickness reduction in Table 3, it is interesting to note that while the experimental axial strain in the body and the circumferential strain in the neck of the smaller and stiffer SW403 valve were lower than this valve, the circumferential strain in the body was higher, which had similar wall thickness (5.1 mm for SW403 and 5.5 mm for SW226). This indicates that corrosion damage has a more significant effect on the circumferential strain of the SW403 valve body than of the SW226 valve, causing a higher response from the SW403 valve when a stiffer response was expected. Furthermore, the finite element results underestimated all three experimental strain responses, especially for the circumferential strain in the body. Nonetheless, the finite element results appeared to be able to predict the onset of yielding in the circumferential strain in the body.
5.2.3 After the Second Wall Thickness Reduction to 3.5 mm
As indicated in Table 1, the wall thickness of the thinner portion of the SW226 valve was 3.5 mm after the second reduction. Figure 46 to Figure 48 show the contours of the displacement, von Mises stress and effective strain fields, respectively, of the model of the valve, at 5323 psi (36.70 MPa) hydrostatic load. Figure 49 shows the von Mises stress contours of the yielded areas only. It can be seen from these figures that the maximum displacements, stresses and strains again generally occurred in the centre of the valve body. It can also be observed that the maximum displacement, stress and strain in this model were greater than those in the previous SW226 cases at similar load, as expected due to the reduced wall thickness. In addition, the maximum load under which the strains of the NAB material remain in the elastic region further decreases to approximately 2200 psi, as determined from the finite element analysis.
DRDC Atlantic CR 2008-105 23
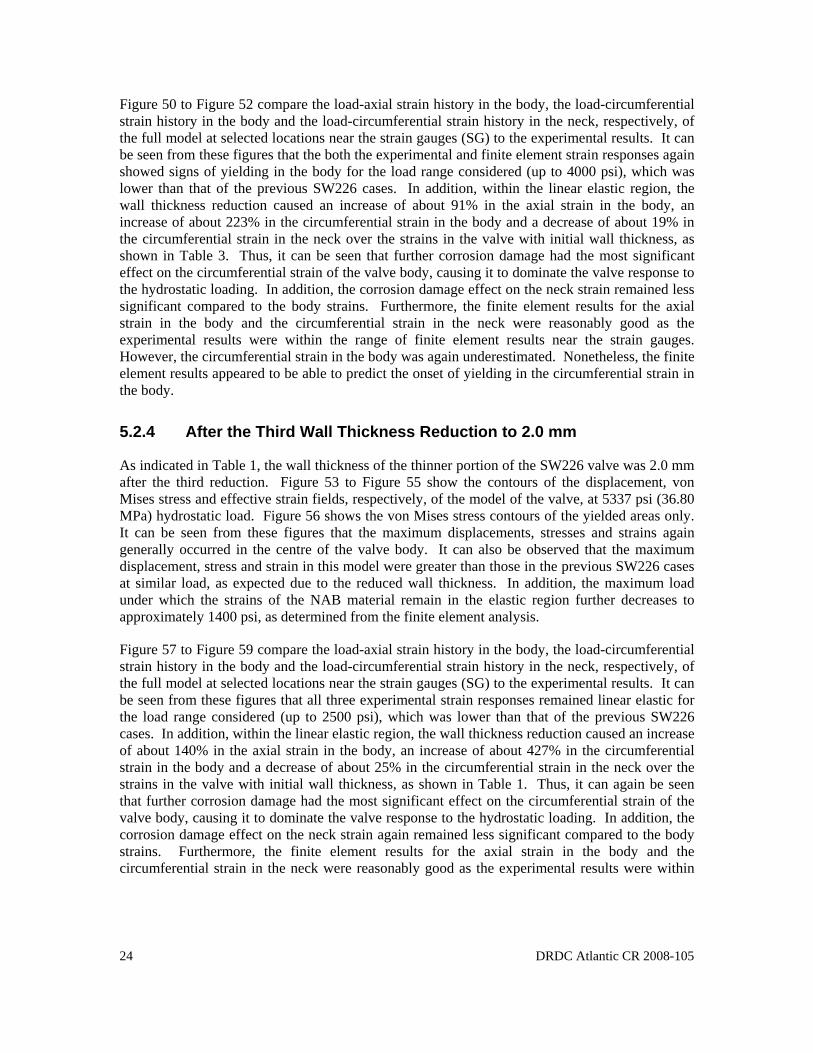
Figure 50 to Figure 52 compare the load-axial strain history in the body, the load-circumferential strain history in the body and the load-circumferential strain history in the neck, respectively, of the full model at selected locations near the strain gauges (SG) to the experimental results. It can be seen from these figures that the both the experimental and finite element strain responses again showed signs of yielding in the body for the load range considered (up to 4000 psi), which was lower than that of the previous SW226 cases. In addition, within the linear elastic region, the wall thickness reduction caused an increase of about 91% in the axial strain in the body, an increase of about 223% in the circumferential strain in the body and a decrease of about 19% in the circumferential strain in the neck over the strains in the valve with initial wall thickness, as shown in Table 3. Thus, it can be seen that further corrosion damage had the most significant effect on the circumferential strain of the valve body, causing it to dominate the valve response to the hydrostatic loading. In addition, the corrosion damage effect on the neck strain remained less significant compared to the body strains. Furthermore, the finite element results for the axial strain in the body and the circumferential strain in the neck were reasonably good as the experimental results were within the range of finite element results near the strain gauges. However, the circumferential strain in the body was again underestimated. Nonetheless, the finite element results appeared to be able to predict the onset of yielding in the circumferential strain in the body.
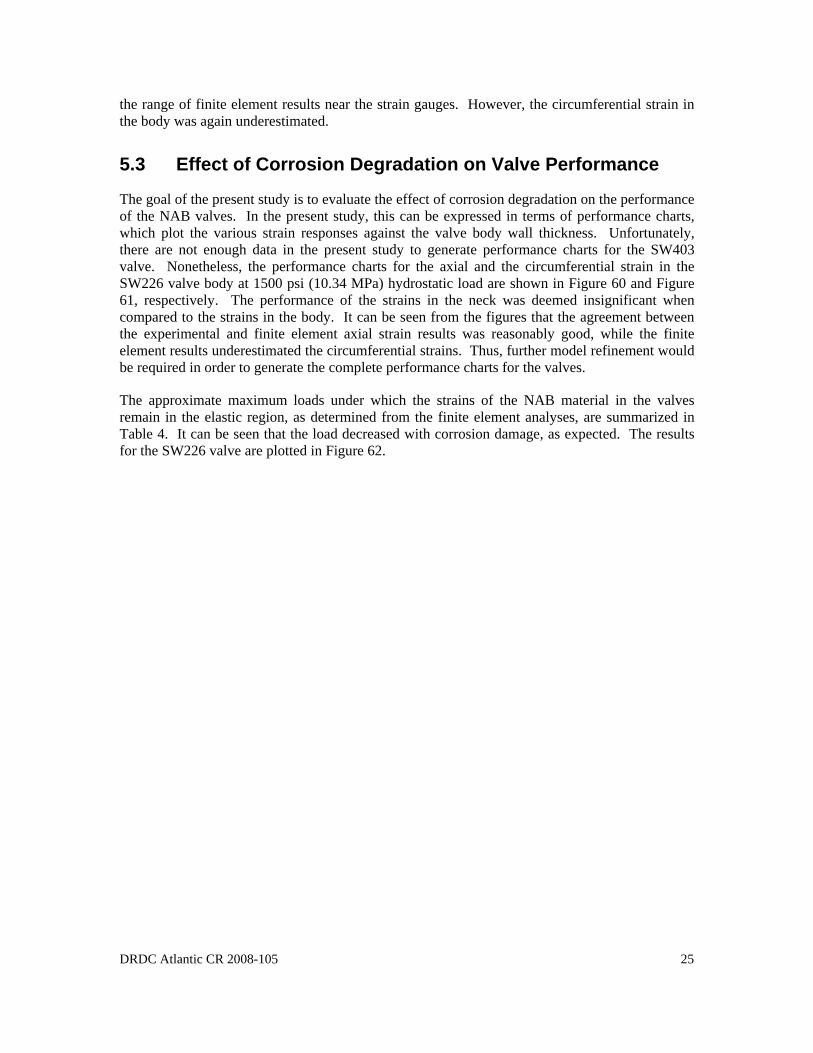
5.2.4 After the Third Wall Thickness Reduction to 2.0 mm
As indicated in Table 1, the wall thickness of the thinner portion of the SW226 valve was 2.0 mm after the third reduction. Figure 53 to Figure 55 show the contours of the displacement, von Mises stress and effective strain fields, respectively, of the model of the valve, at 5337 psi (36.80 MPa) hydrostatic load. Figure 56 shows the von Mises stress contours of the yielded areas only. It can be seen from these figures that the maximum displacements, stresses and strains again generally occurred in the centre of the valve body. It can also be observed that the maximum displacement, stress and strain in this model were greater than those in the previous SW226 cases at similar load, as expected due to the reduced wall thickness. In addition, the maximum load under which the strains of the NAB material remain in the elastic region further decreases to approximately 1400 psi, as determined from the finite element analysis.
Figure 57 to Figure 59 compare the load-axial strain history in the body, the load-circumferential strain history in the body and the load-circumferential strain history in the neck, respectively, of the full model at selected locations near the strain gauges (SG) to the experimental results. It can be seen from these figures that all three experimental strain responses remained linear elastic for the load range considered (up to 2500 psi), which was lower than that of the previous SW226 cases. In addition, within the linear elastic region, the wall thickness reduction caused an increase of about 140% in the axial strain in the body, an increase of about 427% in the circumferential strain in the body and a decrease of about 25% in the circumferential strain in the neck over the strains in the valve with initial wall thickness, as shown in Table 1. Thus, it can again be seen that further corrosion damage had the most significant effect on the circumferential strain of the valve body, causing it to dominate the valve response to the hydrostatic loading. In addition, the corrosion damage effect on the neck strain again remained less significant compared to the body strains. Furthermore, the finite element results for the axial strain in the body and the circumferential strain in the neck were reasonably good as the experimental results were within
24 DRDC Atlantic CR 2008-105
the range of finite element results near the strain gauges. However, the circumferential strain in the body was again underestimated.
5.3 Effect of Corrosion Degradation on Valve Performance
The goal of the present study is to evaluate the effect of corrosion degradation on the performance of the NAB valves. In the present study, this can be expressed in terms of performance charts, which plot the various strain responses against the valve body wall thickness. Unfortunately, there are not enough data in the present study to generate performance charts for the SW403 valve. Nonetheless, the performance charts for the axial and the circumferential strain in the SW226 valve body at 1500 psi (10.34 MPa) hydrostatic load are shown in Figure 60 and Figure 61, respectively. The performance of the strains in the neck was deemed insignificant when compared to the strains in the body. It can be seen from the figures that the agreement between the experimental and finite element axial strain results was reasonably good, while the finite element results underestimated the circumferential strains. Thus, further model refinement would be required in order to generate the complete performance charts for the valves.
The approximate maximum loads under which the strains of the NAB material in the valves remain in the elastic region, as determined from the finite element analyses, are summarized in Table 4. It can be seen that the load decreased with corrosion damage, as expected. The results for the SW226 valve are plotted in Figure 62.
DRDC Atlantic CR 2008-105 25
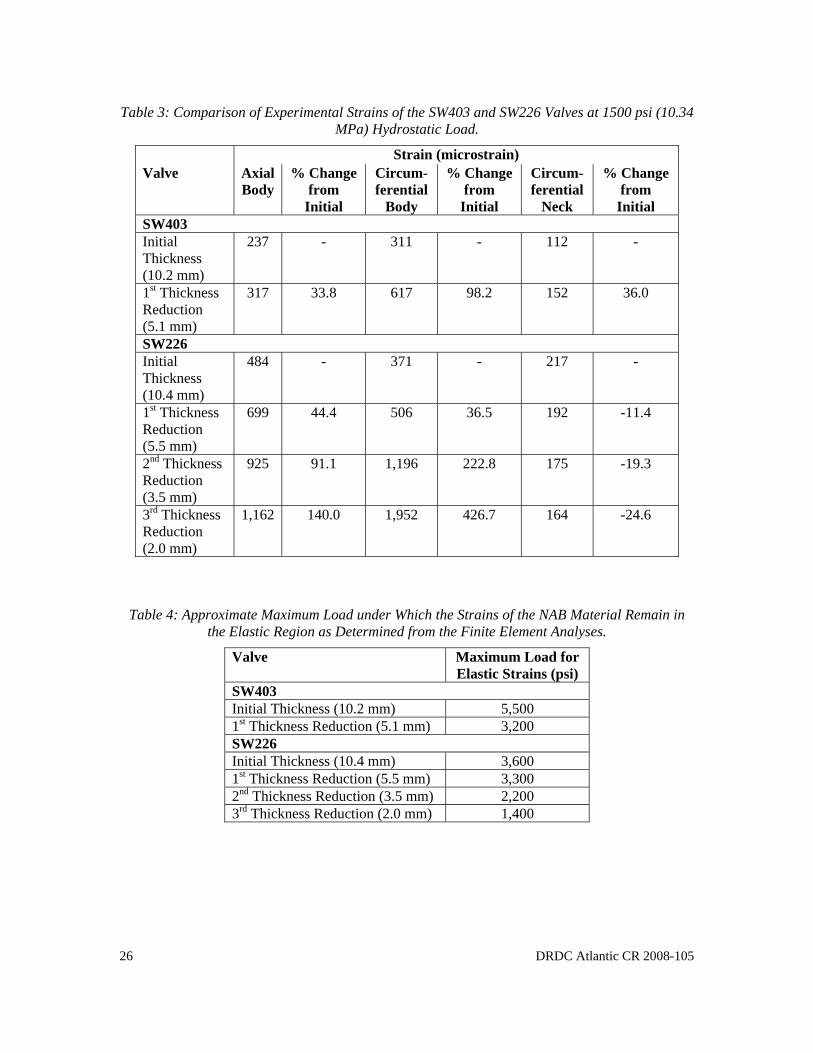
Table 3: Comparison of Experimental Strains of the SW403 and SW226 Valves at 1500 psi (10.34 MPa) Hydrostatic Load.
Strain (microstrain) % Change
from Initial
Circum-ferential
Neck
% Change from
Initial
Circum-ferential
Body
Valve Axial Body
% Change from
Initial SW403 Initial Thickness (10.2 mm)
237 - 311 - 112 -
st1 Thickness Reduction (5.1 mm)
317 33.8 617 98.2 152 36.0
SW226 Initial Thickness (10.4 mm)
484 - 371 - 217 -
st1 Thickness Reduction (5.5 mm)
699 44.4 506 36.5 192 -11.4
nd2 Thickness Reduction (3.5 mm)
925 91.1 1,196 222.8 175 -19.3
rd3 Thickness Reduction (2.0 mm)
1,162 140.0 1,952 426.7 164 -24.6
Table 4: Approximate Maximum Load under Which the Strains of the NAB Material Remain in the Elastic Region as Determined from the Finite Element Analyses.
Valve Maximum Load for Elastic Strains (psi)
SW403 Initial Thickness (10.2 mm) 5,500
st1 Thickness Reduction (5.1 mm) 3,200 SW226 Initial Thickness (10.4 mm) 3,600
st1 Thickness Reduction (5.5 mm) 3,300 nd2 Thickness Reduction (3.5 mm) 2,200 rd3 Thickness Reduction (2.0 mm) 1,400
26 DRDC Atlantic CR 2008-105
(a)
(b)
Figure 15: Displacement Contours of the SW403 Valve with Initial Wall Thickness (10.2 mm) at 8000 psi (55.16 MPa) Hydrostatic Load: (a) Full Model, (b) Half Model.
DRDC Atlantic CR 2008-105 27
(a)
(b)
Figure 16: von Mises Stress Contours of the SW403 Valve with Initial Wall Thickness (10.2 mm) at 8000 psi (55.16 MPa) Hydrostatic Load: (a) Full Model, (b) Half Model.
28 DRDC Atlantic CR 2008-105
(a)
(b)
Figure 17: Effective Strain Contours of the SW403 Valve with Initial Wall Thickness (10.2 mm) at 8000 psi (55.16 MPa) Hydrostatic Load: (a) Full Model, (b) Half Model.
DRDC Atlantic CR 2008-105 29
(a)
(b)
Figure 18: von Mises Stress Contours of the Yielded Areas of the SW403 Valve with Initial Wall Thickness (10.2 mm) at 8000 psi (55.16 MPa) Hydrostatic Load: (a) Full Model, (b) Half
Model.
30 DRDC Atlantic CR 2008-105

Figure 19: Comparison of Experimental, Full Model and Half Model Load-Axial Strain History at the Body of the SW403 Valve with Initial Wall Thickness (10.2 mm).
Figure 20: Comparison of the Experimental, Full Model and Half Model Load-Circumferential Strain History at the Body of the SW403 Valve with Initial Wall Thickness (10.2 mm).
DRDC Atlantic CR 2008-105 31
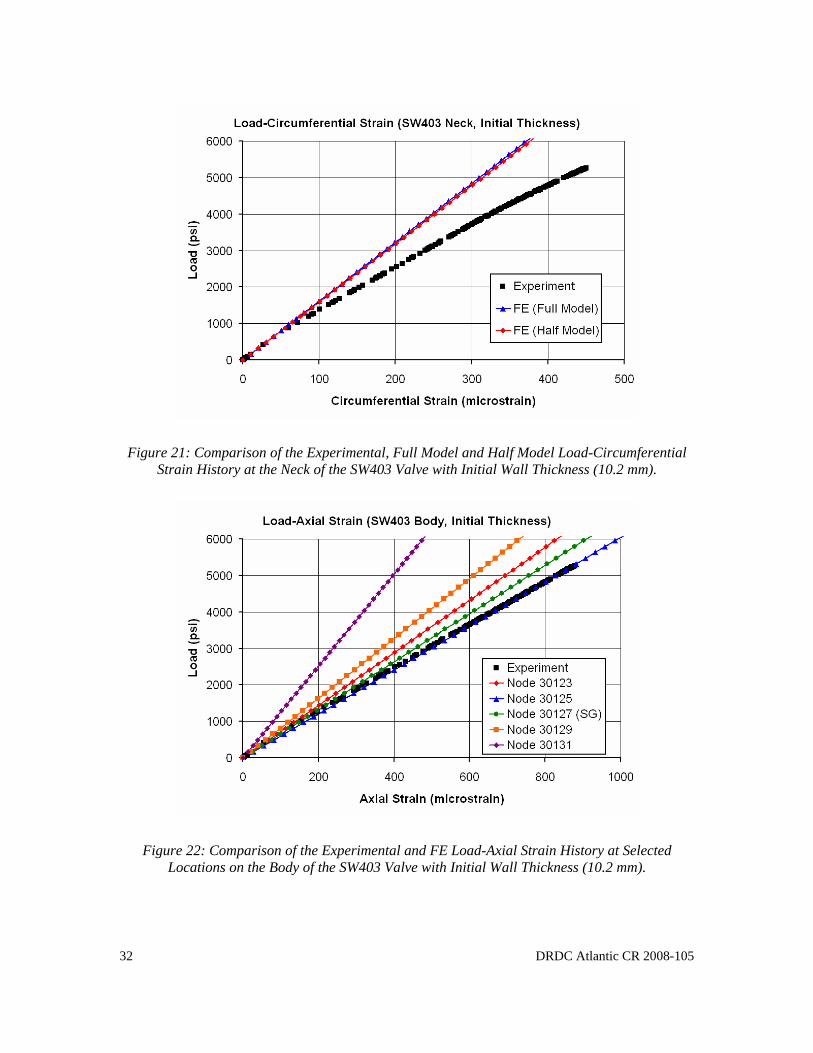
Figure 21: Comparison of the Experimental, Full Model and Half Model Load-Circumferential Strain History at the Neck of the SW403 Valve with Initial Wall Thickness (10.2 mm).
Figure 22: Comparison of the Experimental and FE Load-Axial Strain History at Selected Locations on the Body of the SW403 Valve with Initial Wall Thickness (10.2 mm).
32 DRDC Atlantic CR 2008-105
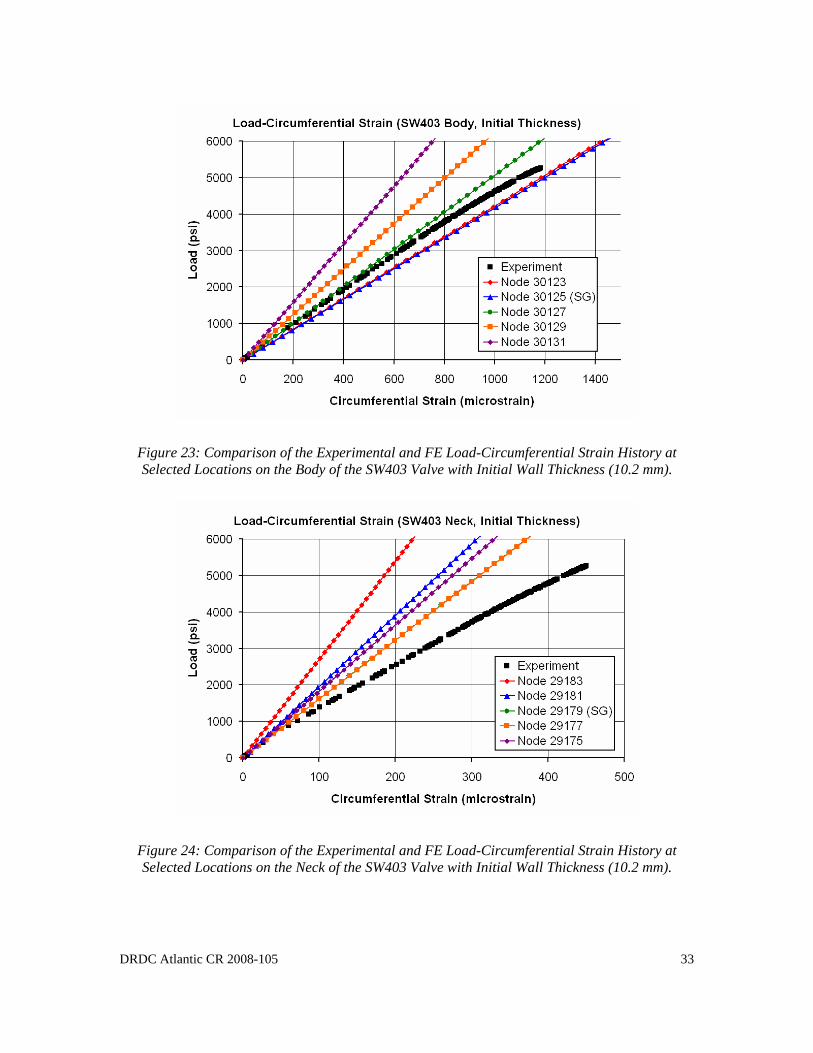
Figure 23: Comparison of the Experimental and FE Load-Circumferential Strain History at Selected Locations on the Body of the SW403 Valve with Initial Wall Thickness (10.2 mm).
Figure 24: Comparison of the Experimental and FE Load-Circumferential Strain History at Selected Locations on the Neck of the SW403 Valve with Initial Wall Thickness (10.2 mm).
DRDC Atlantic CR 2008-105 33
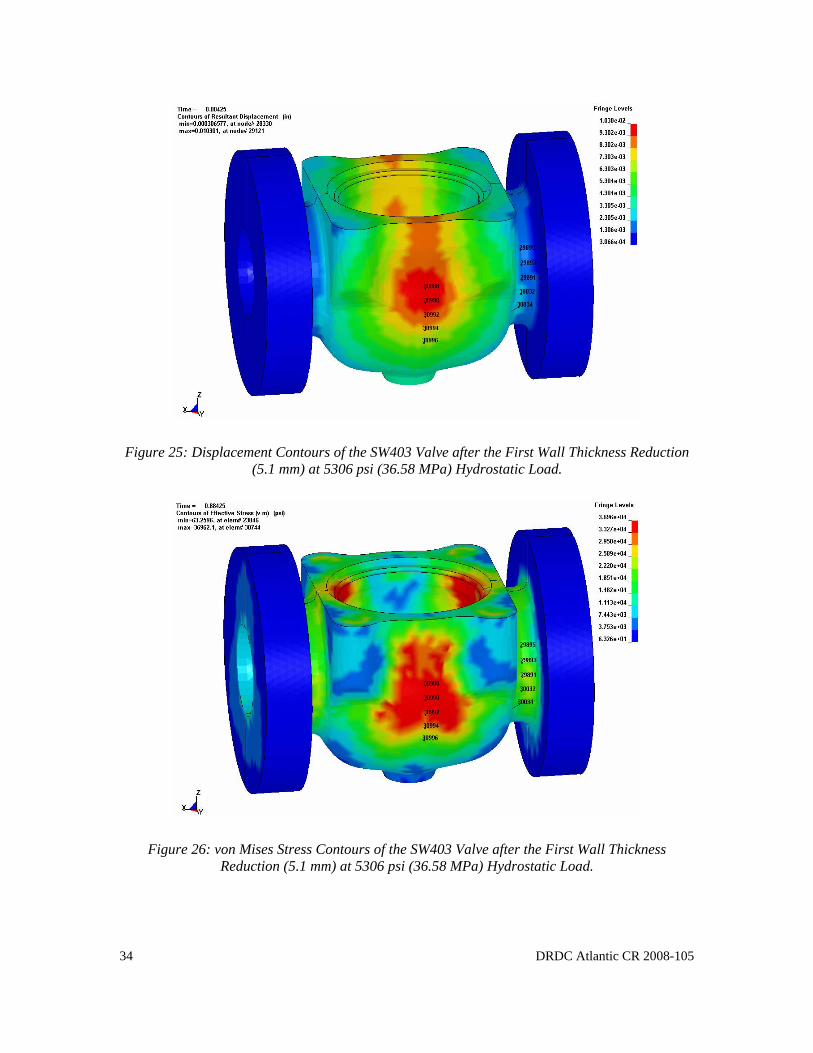
Figure 25: Displacement Contours of the SW403 Valve after the First Wall Thickness Reduction (5.1 mm) at 5306 psi (36.58 MPa) Hydrostatic Load.
Figure 26: von Mises Stress Contours of the SW403 Valve after the First Wall Thickness Reduction (5.1 mm) at 5306 psi (36.58 MPa) Hydrostatic Load.
34 DRDC Atlantic CR 2008-105
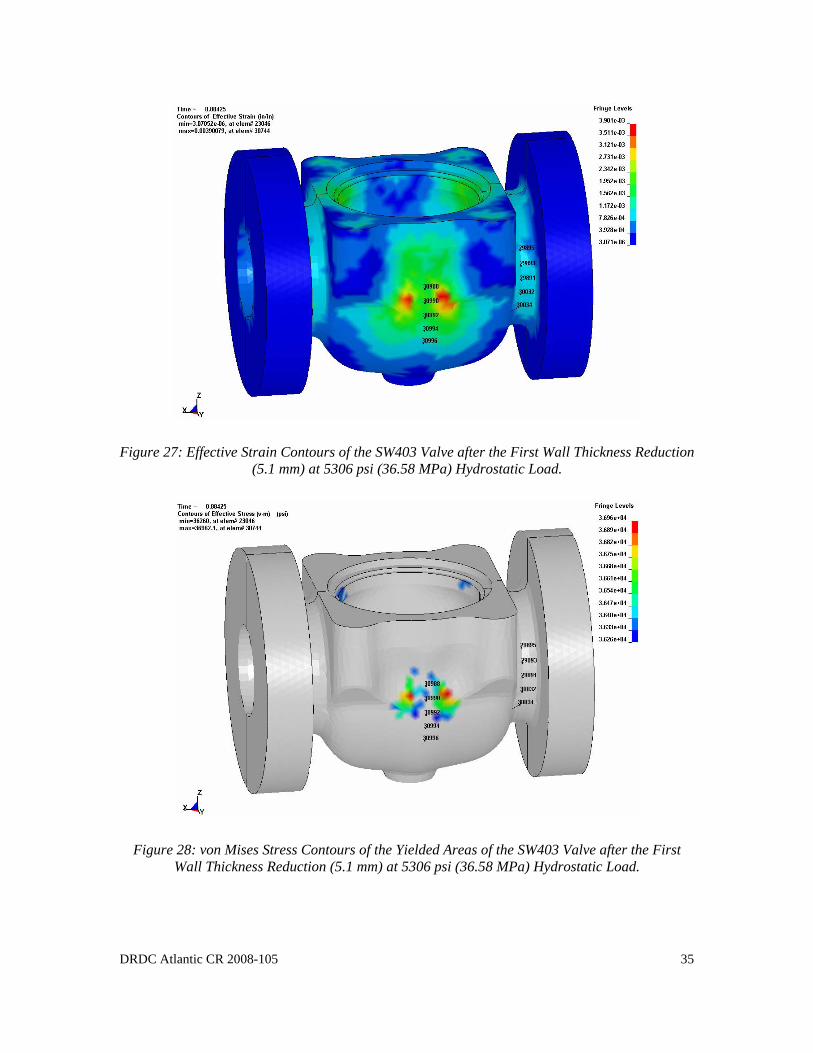
Figure 27: Effective Strain Contours of the SW403 Valve after the First Wall Thickness Reduction (5.1 mm) at 5306 psi (36.58 MPa) Hydrostatic Load.
Figure 28: von Mises Stress Contours of the Yielded Areas of the SW403 Valve after the First Wall Thickness Reduction (5.1 mm) at 5306 psi (36.58 MPa) Hydrostatic Load.
DRDC Atlantic CR 2008-105 35

Figure 29: Comparison of the Experimental and FE Load-Axial Strain History at Selected Locations on the Body of the SW403 Valve after the First Wall Thickness Reduction (5.1 mm).
Figure 30: Comparison of the Experimental and FE Load-Circumferential Strain History at Selected Locations on the Body of the SW403 Valve after the First Wall Thickness Reduction (5.1
mm).
36 DRDC Atlantic CR 2008-105

Figure 31: Comparison of the Experimental and FE Load-Circumferential Strain History at Selected Locations on the Neck of the SW403 Valve after the First Wall Thickness Reduction (5.1
mm).
Figure 32: Displacement Contours of the SW226 Valve with Initial Wall Thickness (10.4 mm) at 5323 psi (36.70 MPa) Hydrostatic Load.
DRDC Atlantic CR 2008-105 37
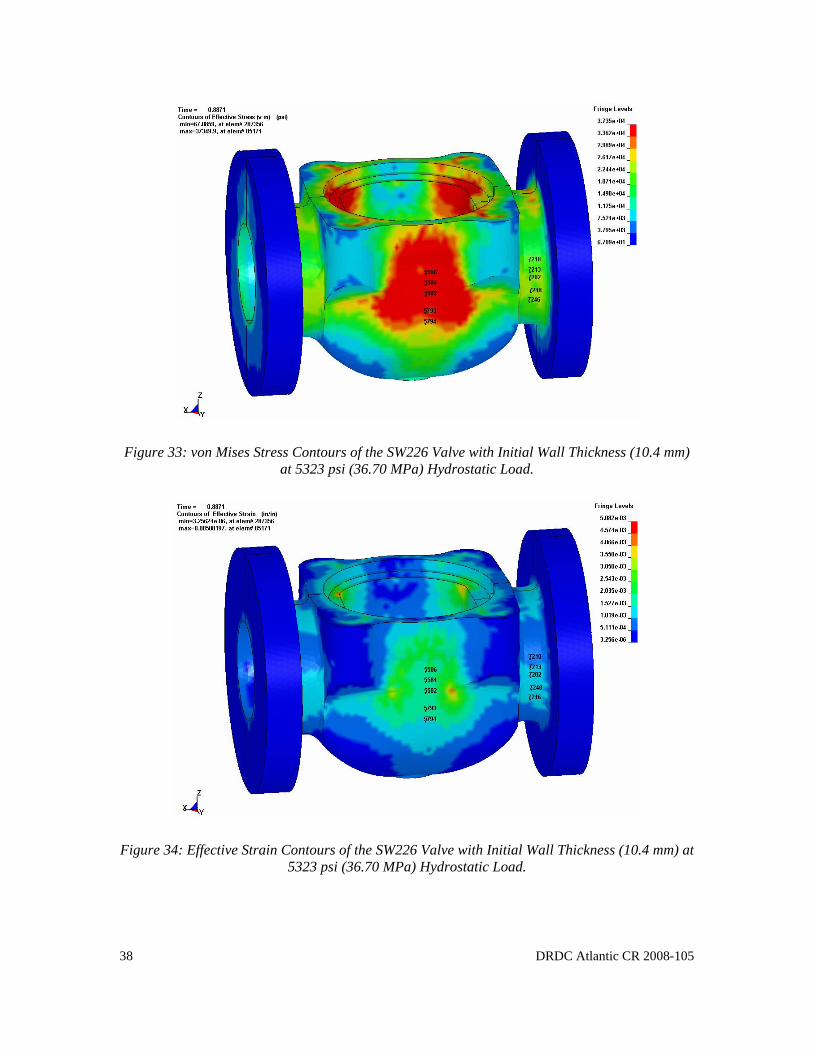
Figure 33: von Mises Stress Contours of the SW226 Valve with Initial Wall Thickness (10.4 mm) at 5323 psi (36.70 MPa) Hydrostatic Load.
Figure 34: Effective Strain Contours of the SW226 Valve with Initial Wall Thickness (10.4 mm) at 5323 psi (36.70 MPa) Hydrostatic Load.
38 DRDC Atlantic CR 2008-105
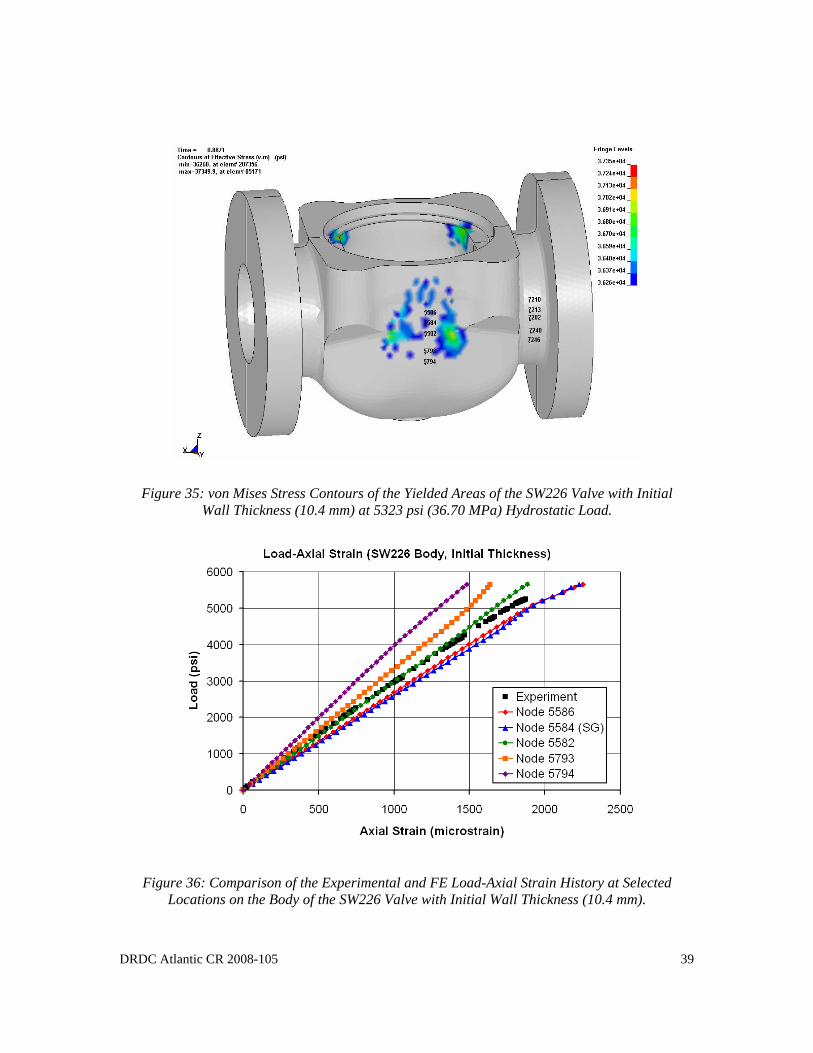
Figure 35: von Mises Stress Contours of the Yielded Areas of the SW226 Valve with Initial Wall Thickness (10.4 mm) at 5323 psi (36.70 MPa) Hydrostatic Load.
Figure 36: Comparison of the Experimental and FE Load-Axial Strain History at Selected Locations on the Body of the SW226 Valve with Initial Wall Thickness (10.4 mm).
DRDC Atlantic CR 2008-105 39
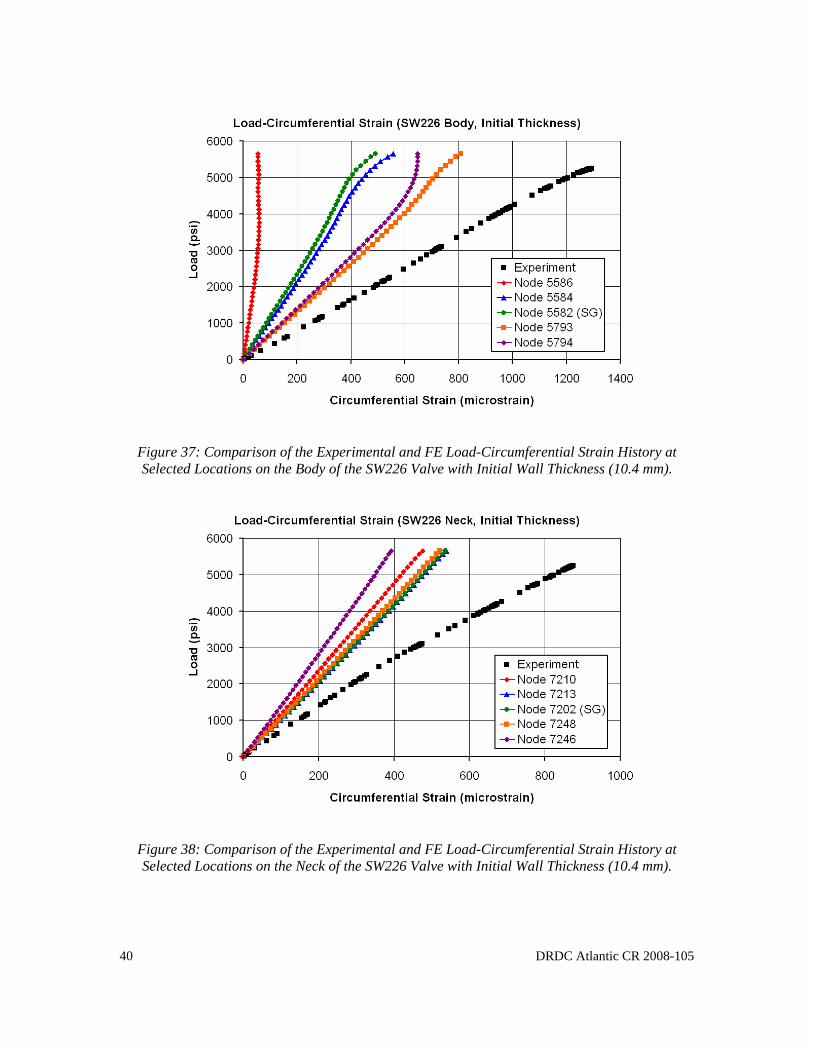
Figure 37: Comparison of the Experimental and FE Load-Circumferential Strain History at Selected Locations on the Body of the SW226 Valve with Initial Wall Thickness (10.4 mm).
Figure 38: Comparison of the Experimental and FE Load-Circumferential Strain History at Selected Locations on the Neck of the SW226 Valve with Initial Wall Thickness (10.4 mm).
40 DRDC Atlantic CR 2008-105
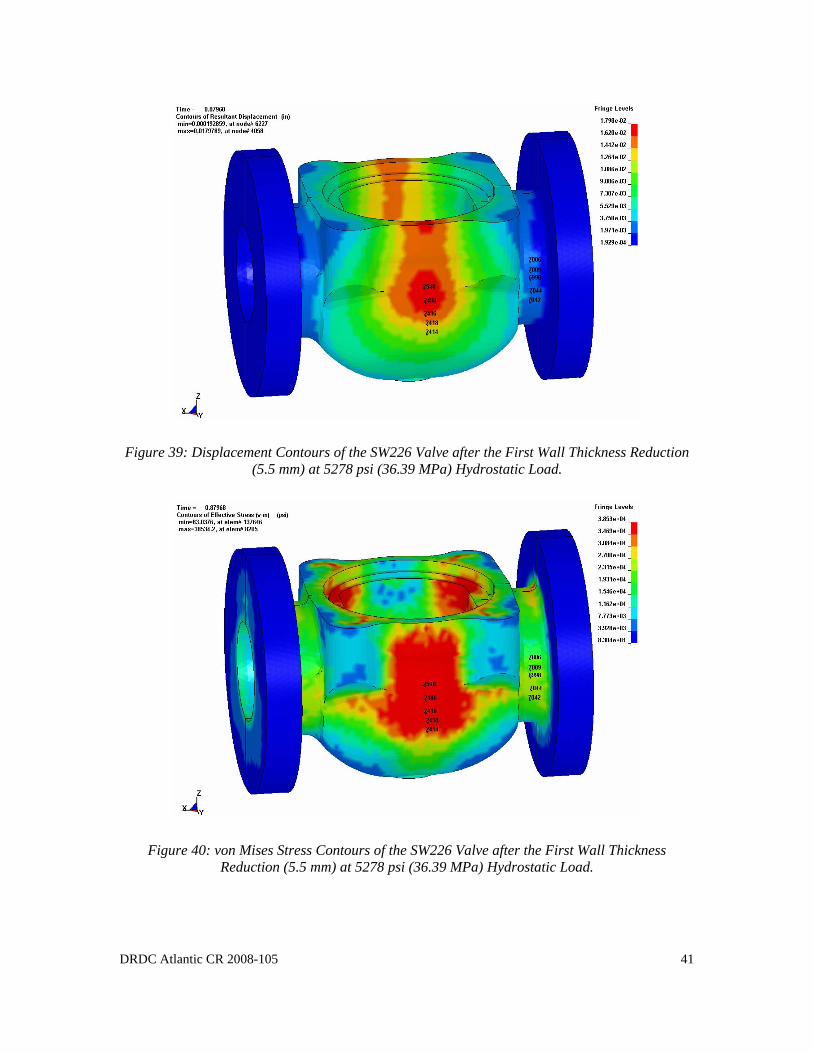
Figure 39: Displacement Contours of the SW226 Valve after the First Wall Thickness Reduction (5.5 mm) at 5278 psi (36.39 MPa) Hydrostatic Load.
Figure 40: von Mises Stress Contours of the SW226 Valve after the First Wall Thickness Reduction (5.5 mm) at 5278 psi (36.39 MPa) Hydrostatic Load.
DRDC Atlantic CR 2008-105 41
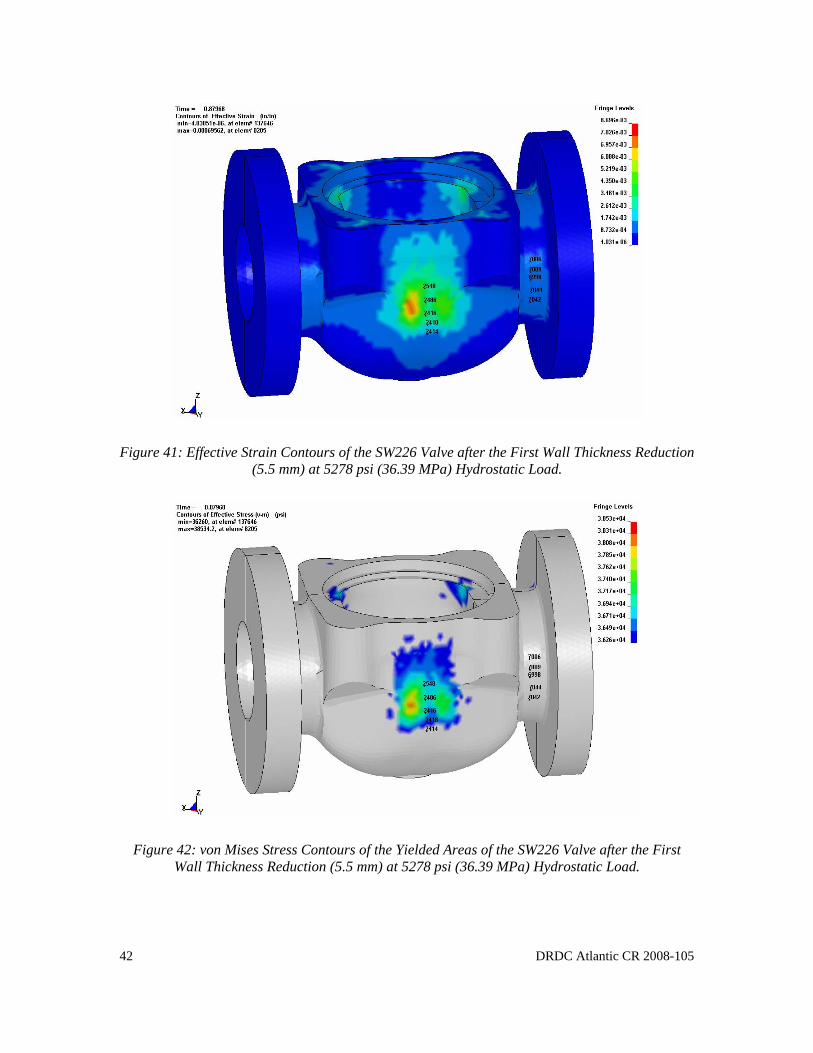
Figure 41: Effective Strain Contours of the SW226 Valve after the First Wall Thickness Reduction (5.5 mm) at 5278 psi (36.39 MPa) Hydrostatic Load.
Figure 42: von Mises Stress Contours of the Yielded Areas of the SW226 Valve after the First Wall Thickness Reduction (5.5 mm) at 5278 psi (36.39 MPa) Hydrostatic Load.
42 DRDC Atlantic CR 2008-105
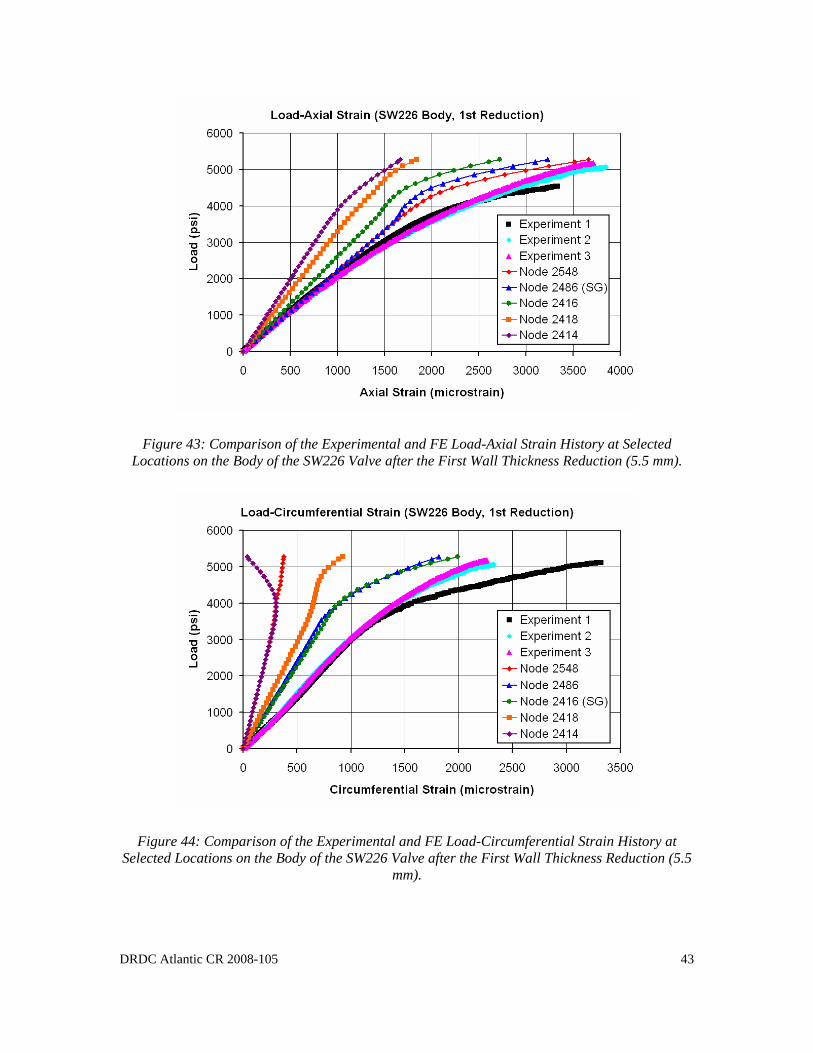
Figure 43: Comparison of the Experimental and FE Load-Axial Strain History at Selected Locations on the Body of the SW226 Valve after the First Wall Thickness Reduction (5.5 mm).
Figure 44: Comparison of the Experimental and FE Load-Circumferential Strain History at Selected Locations on the Body of the SW226 Valve after the First Wall Thickness Reduction (5.5
mm).
DRDC Atlantic CR 2008-105 43

Figure 45: Comparison of the Experimental and FE Load-Circumferential Strain History at Selected Locations on the Neck of the SW226 Valve after the First Wall Thickness Reduction (5.5
mm).
Figure 46: Displacement Contours of the SW226 Valve after the Second Wall Thickness Reduction (3.5 mm) at 5323 psi (36.70 MPa) Hydrostatic Load.
44 DRDC Atlantic CR 2008-105
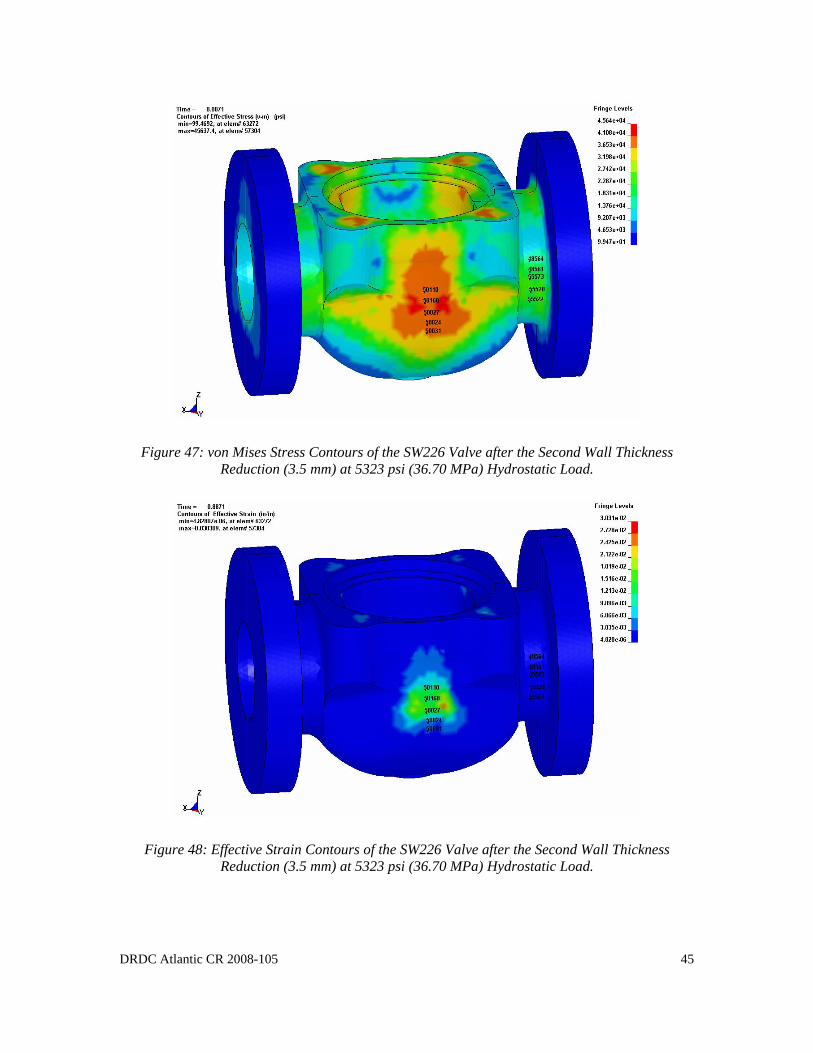
Figure 47: von Mises Stress Contours of the SW226 Valve after the Second Wall Thickness Reduction (3.5 mm) at 5323 psi (36.70 MPa) Hydrostatic Load.
Figure 48: Effective Strain Contours of the SW226 Valve after the Second Wall Thickness Reduction (3.5 mm) at 5323 psi (36.70 MPa) Hydrostatic Load.
DRDC Atlantic CR 2008-105 45
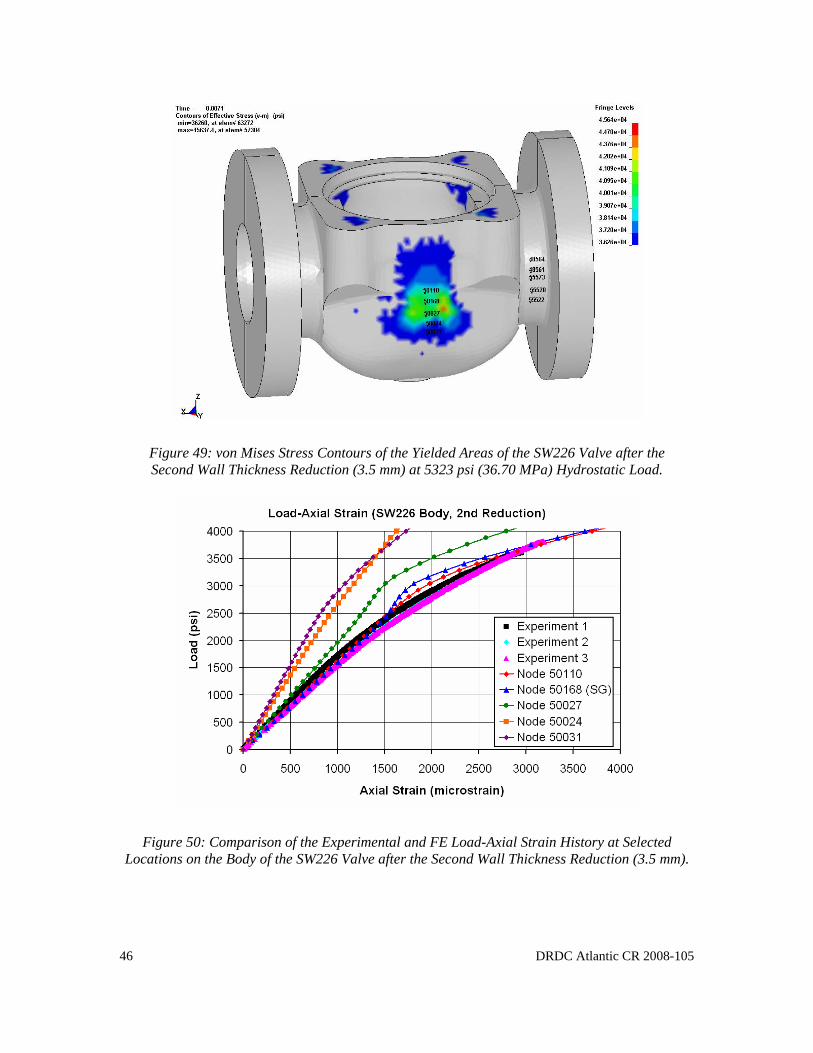
Figure 49: von Mises Stress Contours of the Yielded Areas of the SW226 Valve after the Second Wall Thickness Reduction (3.5 mm) at 5323 psi (36.70 MPa) Hydrostatic Load.
Figure 50: Comparison of the Experimental and FE Load-Axial Strain History at Selected Locations on the Body of the SW226 Valve after the Second Wall Thickness Reduction (3.5 mm).
46 DRDC Atlantic CR 2008-105
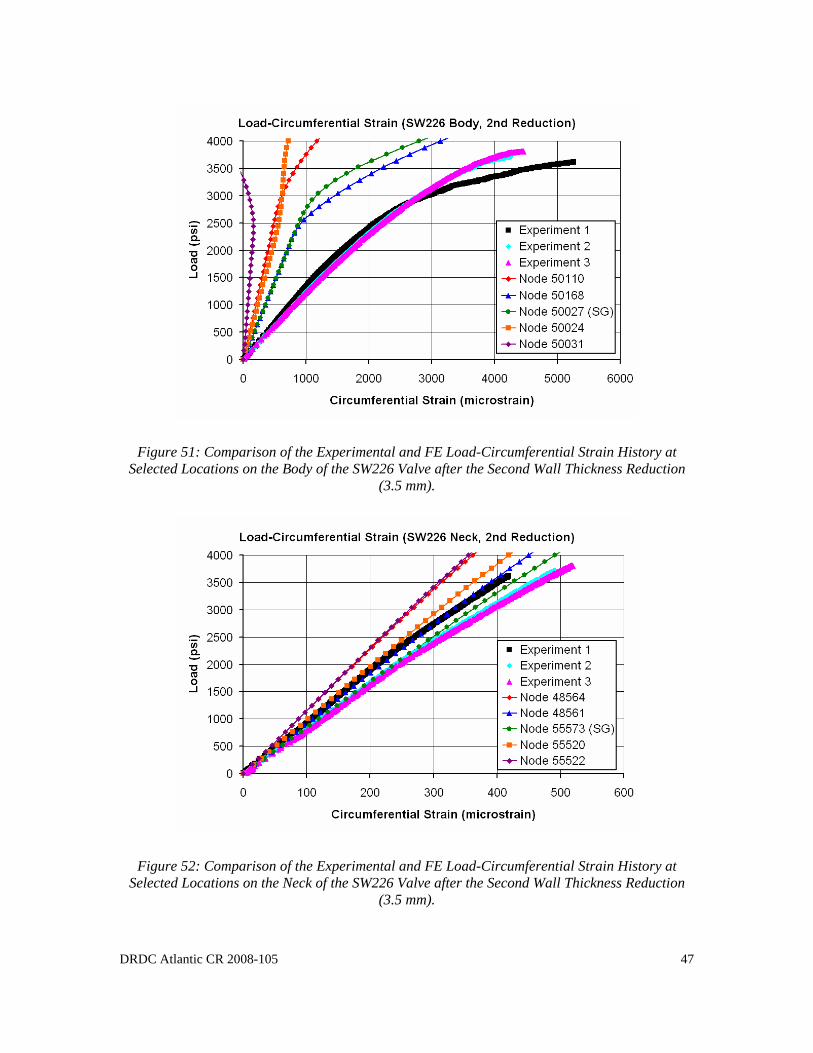
Figure 51: Comparison of the Experimental and FE Load-Circumferential Strain History at Selected Locations on the Body of the SW226 Valve after the Second Wall Thickness Reduction
(3.5 mm).
Figure 52: Comparison of the Experimental and FE Load-Circumferential Strain History at Selected Locations on the Neck of the SW226 Valve after the Second Wall Thickness Reduction
(3.5 mm).
DRDC Atlantic CR 2008-105 47
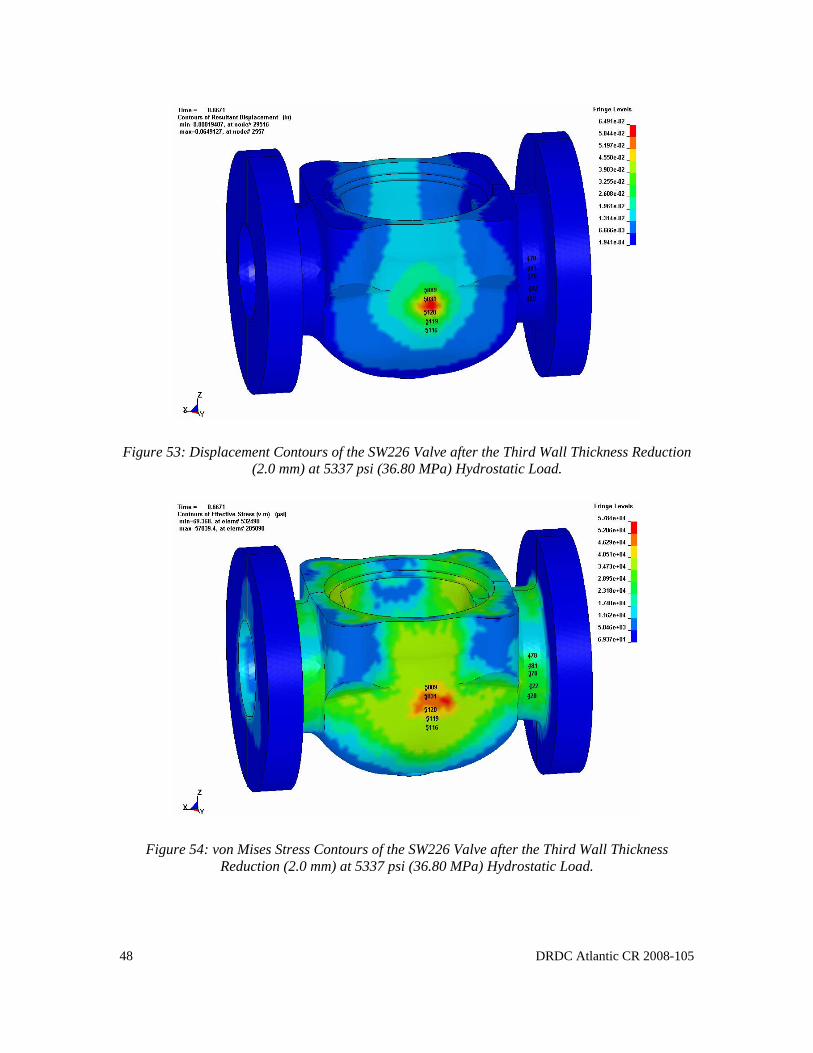
Figure 53: Displacement Contours of the SW226 Valve after the Third Wall Thickness Reduction (2.0 mm) at 5337 psi (36.80 MPa) Hydrostatic Load.
Figure 54: von Mises Stress Contours of the SW226 Valve after the Third Wall Thickness Reduction (2.0 mm) at 5337 psi (36.80 MPa) Hydrostatic Load.
48 DRDC Atlantic CR 2008-105
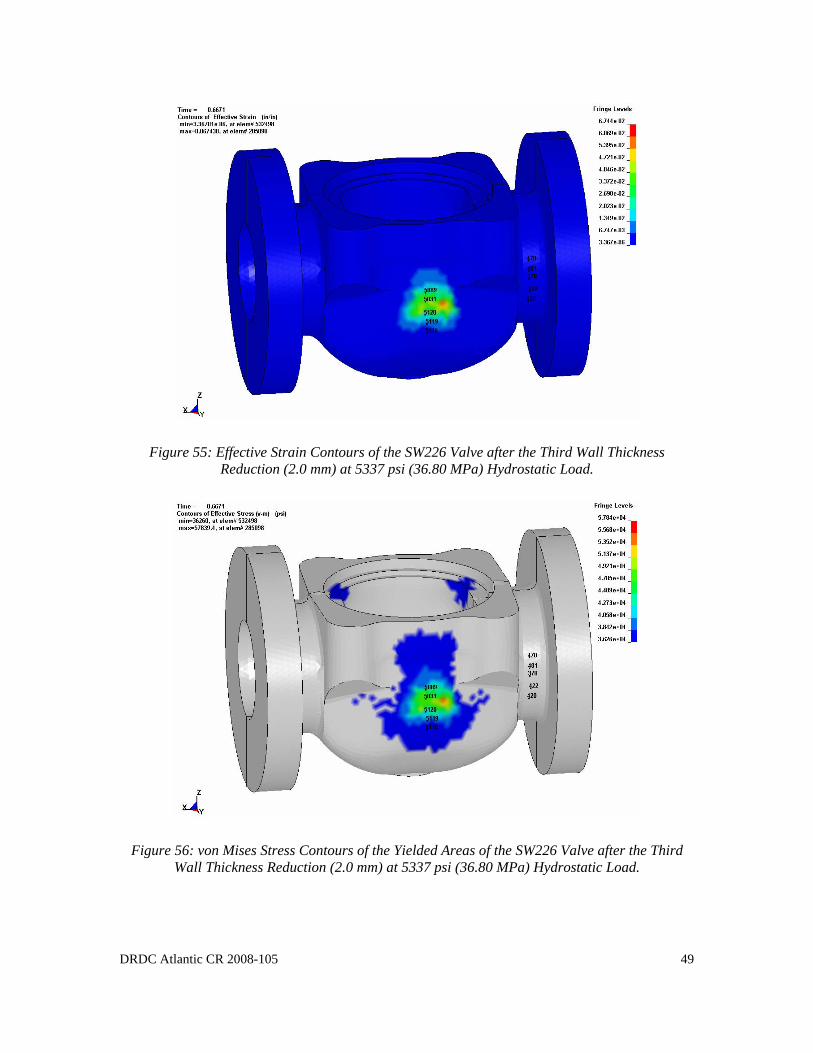
Figure 55: Effective Strain Contours of the SW226 Valve after the Third Wall Thickness Reduction (2.0 mm) at 5337 psi (36.80 MPa) Hydrostatic Load.
Figure 56: von Mises Stress Contours of the Yielded Areas of the SW226 Valve after the Third Wall Thickness Reduction (2.0 mm) at 5337 psi (36.80 MPa) Hydrostatic Load.
DRDC Atlantic CR 2008-105 49
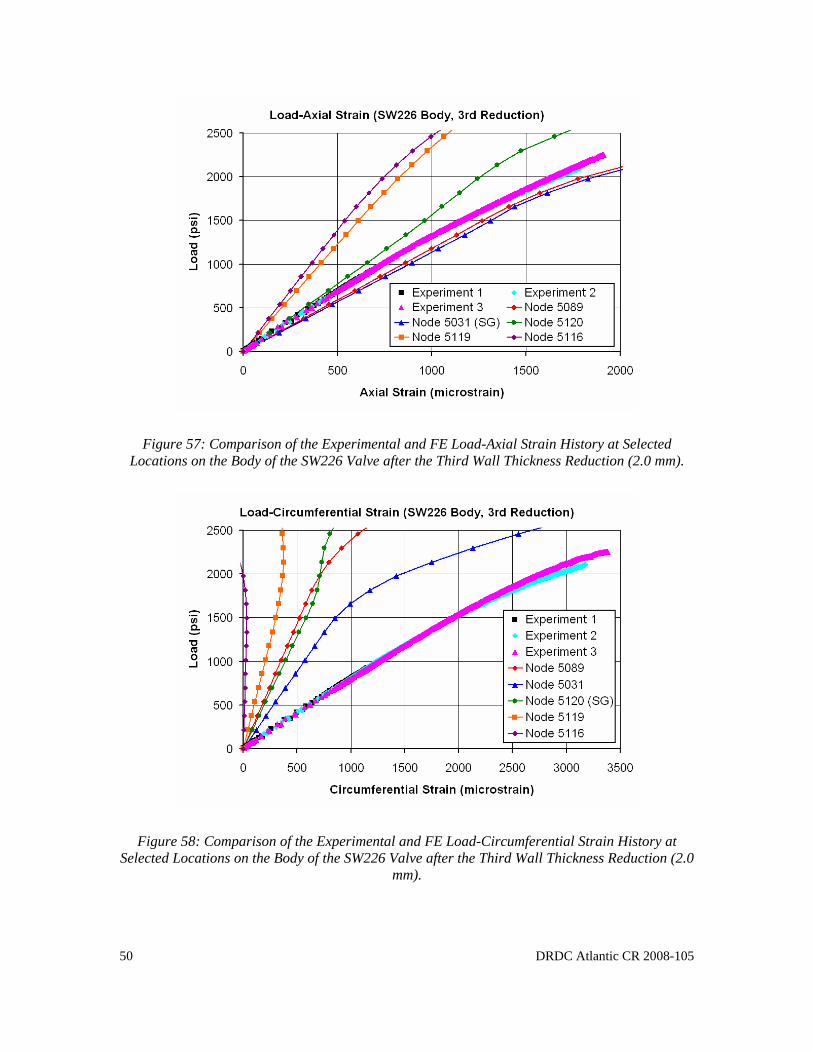
Figure 57: Comparison of the Experimental and FE Load-Axial Strain History at Selected Locations on the Body of the SW226 Valve after the Third Wall Thickness Reduction (2.0 mm).
Figure 58: Comparison of the Experimental and FE Load-Circumferential Strain History at Selected Locations on the Body of the SW226 Valve after the Third Wall Thickness Reduction (2.0
mm).
50 DRDC Atlantic CR 2008-105
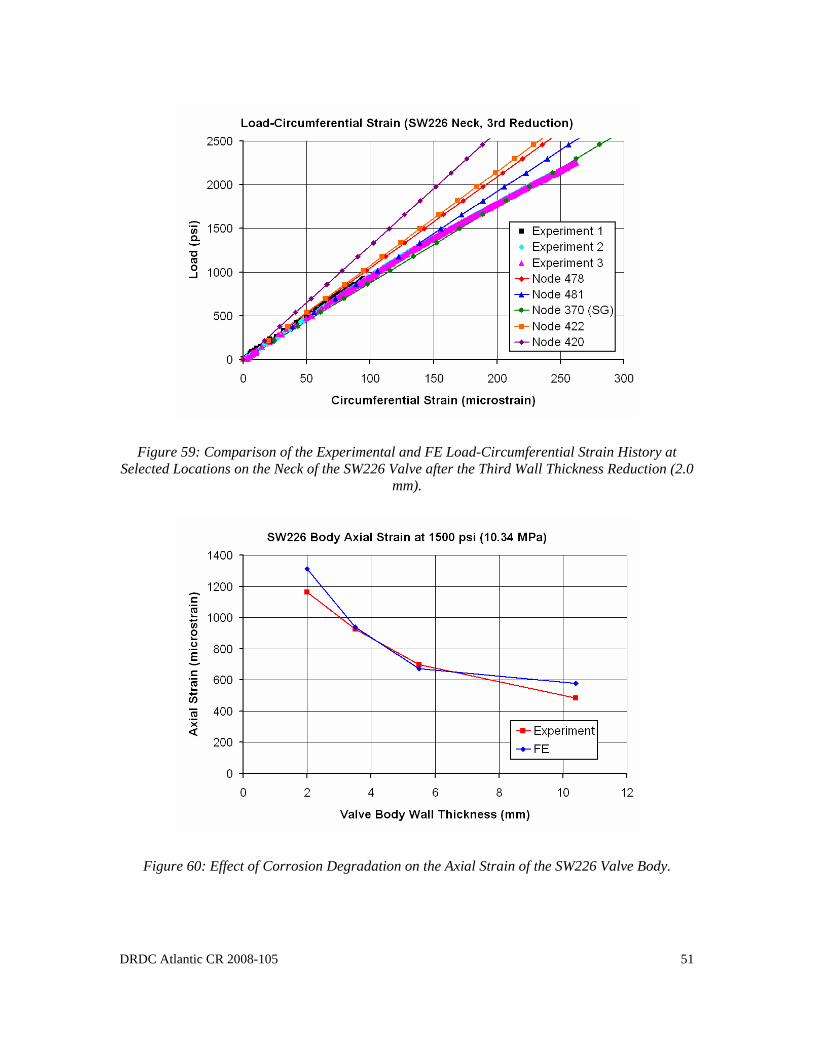
Figure 59: Comparison of the Experimental and FE Load-Circumferential Strain History at Selected Locations on the Neck of the SW226 Valve after the Third Wall Thickness Reduction (2.0
mm).
Figure 60: Effect of Corrosion Degradation on the Axial Strain of the SW226 Valve Body.
DRDC Atlantic CR 2008-105 51
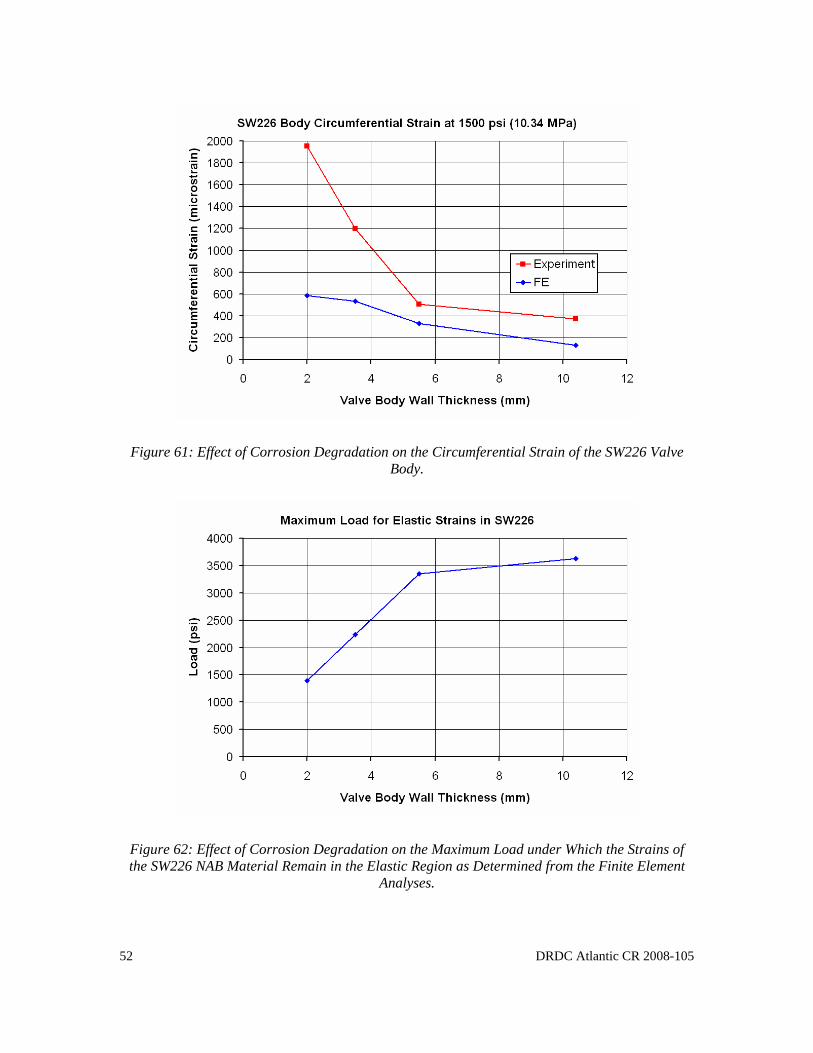
Figure 61: Effect of Corrosion Degradation on the Circumferential Strain of the SW226 Valve Body.
Figure 62: Effect of Corrosion Degradation on the Maximum Load under Which the Strains of the SW226 NAB Material Remain in the Elastic Region as Determined from the Finite Element
Analyses.
52 DRDC Atlantic CR 2008-105
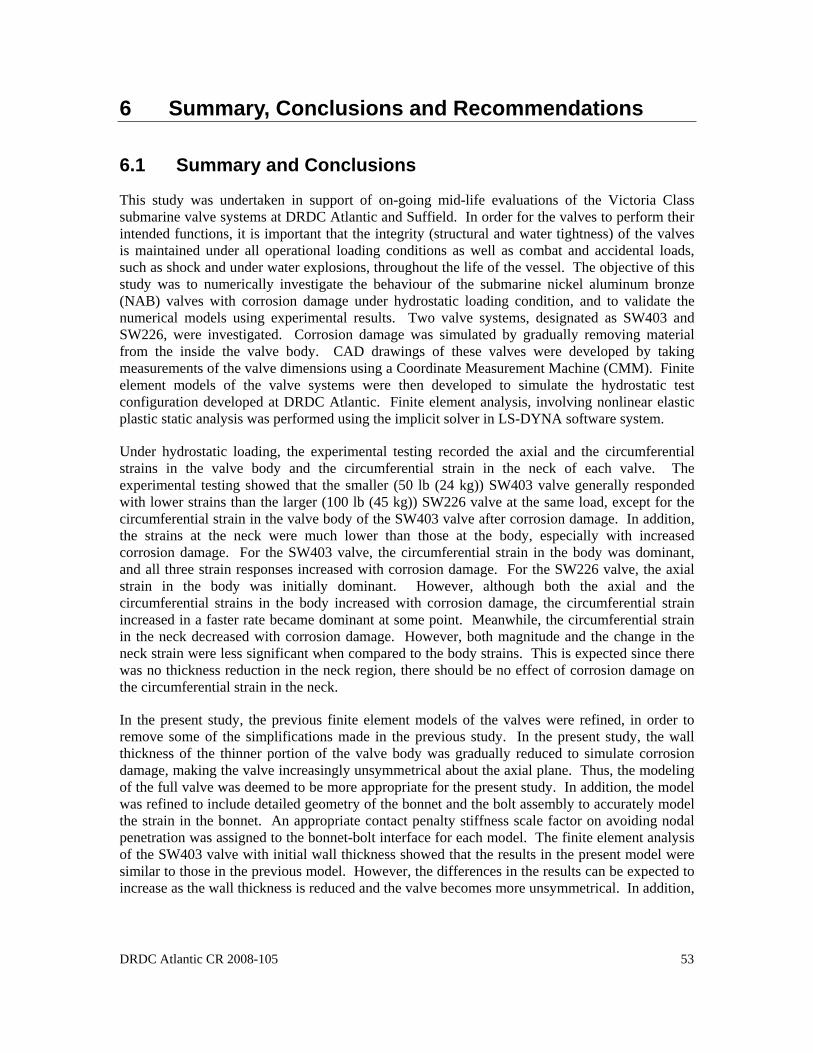
6 Summary, Conclusions and Recommendations
6.1 Summary and Conclusions
This study was undertaken in support of on-going mid-life evaluations of the Victoria Class submarine valve systems at DRDC Atlantic and Suffield. In order for the valves to perform their intended functions, it is important that the integrity (structural and water tightness) of the valves is maintained under all operational loading conditions as well as combat and accidental loads, such as shock and under water explosions, throughout the life of the vessel. The objective of this study was to numerically investigate the behaviour of the submarine nickel aluminum bronze (NAB) valves with corrosion damage under hydrostatic loading condition, and to validate the numerical models using experimental results. Two valve systems, designated as SW403 and SW226, were investigated. Corrosion damage was simulated by gradually removing material from the inside the valve body. CAD drawings of these valves were developed by taking measurements of the valve dimensions using a Coordinate Measurement Machine (CMM). Finite element models of the valve systems were then developed to simulate the hydrostatic test configuration developed at DRDC Atlantic. Finite element analysis, involving nonlinear elastic plastic static analysis was performed using the implicit solver in LS-DYNA software system.
Under hydrostatic loading, the experimental testing recorded the axial and the circumferential strains in the valve body and the circumferential strain in the neck of each valve. The experimental testing showed that the smaller (50 lb (24 kg)) SW403 valve generally responded with lower strains than the larger (100 lb (45 kg)) SW226 valve at the same load, except for the circumferential strain in the valve body of the SW403 valve after corrosion damage. In addition, the strains at the neck were much lower than those at the body, especially with increased corrosion damage. For the SW403 valve, the circumferential strain in the body was dominant, and all three strain responses increased with corrosion damage. For the SW226 valve, the axial strain in the body was initially dominant. However, although both the axial and the circumferential strains in the body increased with corrosion damage, the circumferential strain increased in a faster rate became dominant at some point. Meanwhile, the circumferential strain in the neck decreased with corrosion damage. However, both magnitude and the change in the neck strain were less significant when compared to the body strains. This is expected since there was no thickness reduction in the neck region, there should be no effect of corrosion damage on the circumferential strain in the neck.
In the present study, the previous finite element models of the valves were refined, in order to remove some of the simplifications made in the previous study. In the present study, the wall thickness of the thinner portion of the valve body was gradually reduced to simulate corrosion damage, making the valve increasingly unsymmetrical about the axial plane. Thus, the modeling of the full valve was deemed to be more appropriate for the present study. In addition, the model was refined to include detailed geometry of the bonnet and the bolt assembly to accurately model the strain in the bonnet. An appropriate contact penalty stiffness scale factor on avoiding nodal penetration was assigned to the bonnet-bolt interface for each model. The finite element analysis of the SW403 valve with initial wall thickness showed that the results in the present model were similar to those in the previous model. However, the differences in the results can be expected to increase as the wall thickness is reduced and the valve becomes more unsymmetrical. In addition,
DRDC Atlantic CR 2008-105 53
the finite element analyses showed that the maximum displacements, stresses and strains generally occurred in the centre of the valve body, with the smaller SW403 valve generally responding with lower values than the larger SW226 valve at the same load. Again, the strains at the neck were much lower than those at the body. Furthermore, the finite element results for the axial strain in the body were in general reasonably good as the experimental results were within the range of finite element results near the strain gauges. However, the circumferential strain in both the body and the neck were in general underestimated, especially in the body. This indicates that further refinement of the finite element mesh is required.
Finally, in the experiment, repeated testing was conducted under various hydrostatic loading conditions and residual plastic strains were observed in the valves with reduced wall thickness. However, in the comparison between the experimental and numerical modeling results, these residual strains were not taken into account. Nonetheless, the experimental data showed that there was little change in the linear portion of the load-strain curves between repeated testing at the same wall thickness, which is expected. Therefore, the comparison between the experimental and numerical modeling results should be valid for the linear portion of the load-strain curves at least, even without accounting for the repeated testing and residual strains in the numerical modeling. On the other hand, in two cases (the circumferential strain at the SW226 body after the first and the second wall thickness reduction), the yield stress appeared to have increased by the repeated testing, which is also expected but could not be captured by the present numerical modeling. One recommendation on how to improve the test method to obtain the best data for comparison purpose is to keep the load within the linear elastic region of the valve material in order to not introduce residual plastic strains in the valves.
6.2 Recommendations
The following are recommendations for future work:
1. The effects of issues such as mesh size, element formulation, element order and material properties should be investigated. For example, the underestimation of many of the experimental strains by the FE models suggests that the models were too stiff, such that the use of a finer mesh, an element formulation with nodal rotation or higher order elements might improve the FE results. Addressing these issues would improve the accuracy of the FE models so that they more closely match experimental measurements and further increase confidence in their reliability.
2. An assessment of other valve systems, especially the ones for which hydrostatic testing and UNDEX test results are available, should be performed. Numerical models of these valves should also be performed to further validate the numerical approach. Once properly validated, the numerical models can be used to generate performance charts for existing and new valve designs.
3. Experimentally-validated FE models for NAB valves could be extended to evaluate valve survivability under conditions beyond hydrostatic and SVTV UNDEX tests. For example, the SVTV experiments were designed based on UNDEX loading to hull-mounted valves, however, FE models could be used to evaluate shock loading to valves mounted on pipes.
54 DRDC Atlantic CR 2008-105

4. More data points should be generated to enhance corrosion degradation performance curves for the SW403 valve. In addition, the curves should be further refined after the improvements in the circumferential strain accuracy.
DRDC Atlantic CR 2008-105 55
References .....
[1] Koko, T.S., Warner, R., Yuen, B.K. and Norwood, M.E., “UNDEX Assessment of Submarine NAB Valve”, Martec Report No. TR-07-24, May 2007.
[2] Wang, Y. and Porter, J., “Hydrostatic testing and Destructive Examination of HMCS Victoria NAB Valves (WS611, WS605 and SAN802)”, DRDC Atlantic TM 2004-291, January 2005.
[3] Wang, Y. Private Communication, 2008.
[4] HyperWorks 8.0 User’s Manual. Altair Engineering, Inc. Troy, Michigan, 2006.
[5] LS-DYNA Keyword User’s Manual. Livermore Software Technology Corporation. Livermore, California, 2003.
[6] Getting Started with Pro/ENGINEER Wildfire 2.0: A Tutorial Based Guide to Workflow, Parametric Technology Corporation, Needham, MA, June 2004.
[7] Meigh, H. Appendix 3, In “Cast and Wrought Aluminium Bronzes: Properties, Processes and Structure.” 1st ed. London: IOM Communications Ltd., pp. 368-369, 2000.
[8] CISC, Handbook of Steel Construction, Sixth Edition, Willowdale, ON, 1995.
56 DRDC Atlantic CR 2008-105
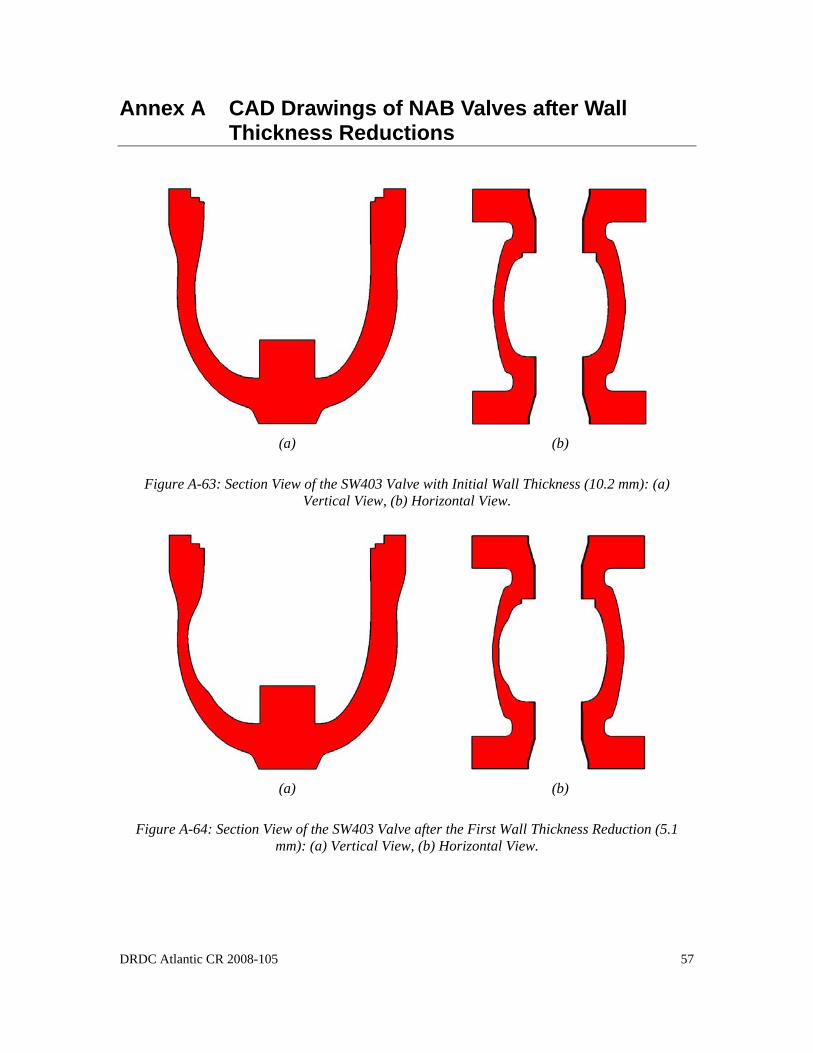
Annex A CAD Drawings of NAB Valves after Wall Thickness Reductions
(a) (b)
Figure A-63: Section View of the SW403 Valve with Initial Wall Thickness (10.2 mm): (a) Vertical View, (b) Horizontal View.
(a) (b)
Figure A-64: Section View of the SW403 Valve after the First Wall Thickness Reduction (5.1 mm): (a) Vertical View, (b) Horizontal View.
DRDC Atlantic CR 2008-105 57
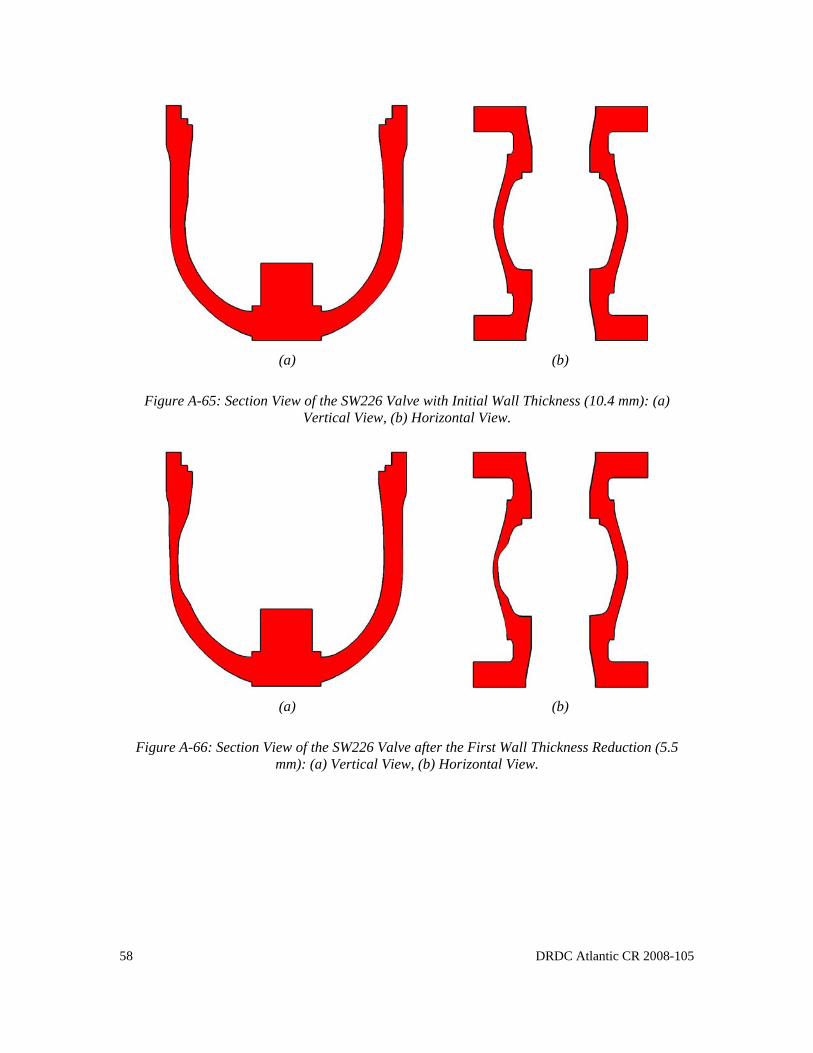
(a) (b)
Figure A-65: Section View of the SW226 Valve with Initial Wall Thickness (10.4 mm): (a) Vertical View, (b) Horizontal View.
(a) (b)
Figure A-66: Section View of the SW226 Valve after the First Wall Thickness Reduction (5.5 mm): (a) Vertical View, (b) Horizontal View.
58 DRDC Atlantic CR 2008-105
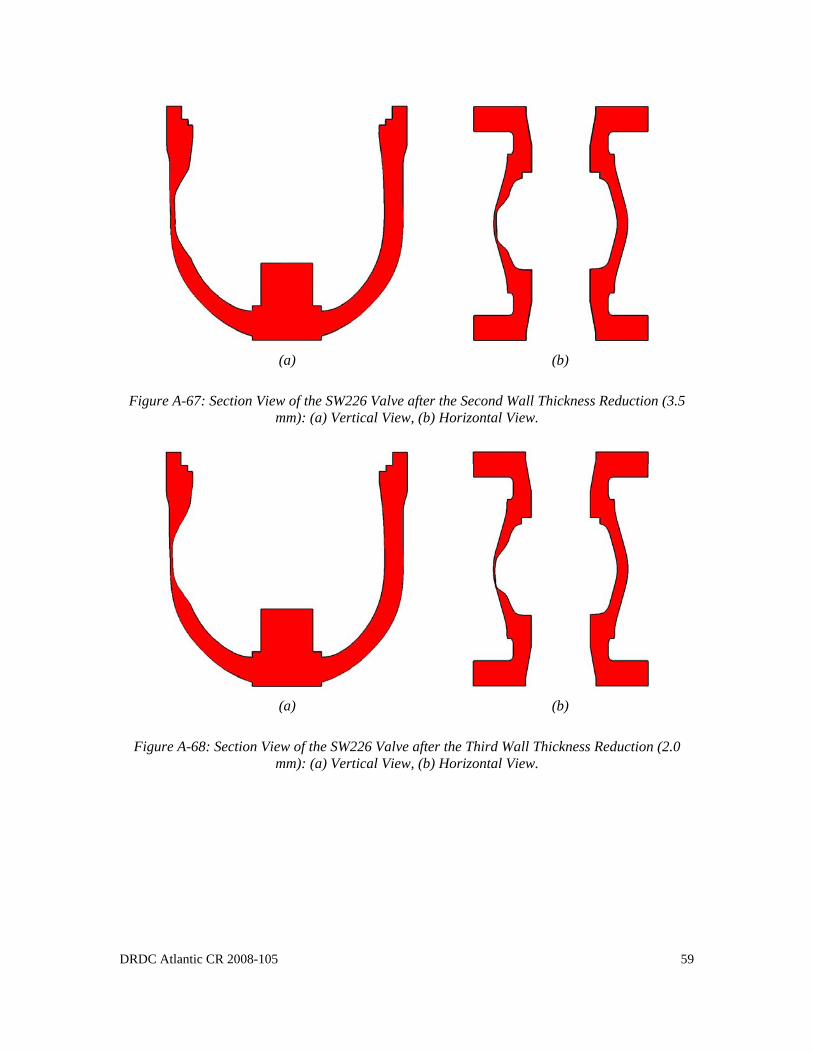
(a) (b)
Figure A-67: Section View of the SW226 Valve after the Second Wall Thickness Reduction (3.5 mm): (a) Vertical View, (b) Horizontal View.
(a) (b)
Figure A-68: Section View of the SW226 Valve after the Third Wall Thickness Reduction (2.0 mm): (a) Vertical View, (b) Horizontal View.
DRDC Atlantic CR 2008-105 59

This page intentionally left blank.
60 DRDC Atlantic CR 2008-105

List of symbols/abbreviations/acronyms/initialisms
AMG Advanced Manufacturing Group
CAD Computer-Aided Design
CMM Coordinate Measuring Machine
DRDC Defence Research & Development Canada
NAB Nickel Aluminum Bronze
SVTV Submarine Valve Test Vehicle
UNDEX Underwater Explosion
DRDC Atlantic CR 2008-105 61

This page intentionally left blank.
62 DRDC Atlantic CR 2008-105
Distribution list
Document No.: DRDC Atlantic CR 2008-105
LIST PART 1: Internal Distribution by Centre
2 Yueping Wang: 1 CD, 1 hard copy 1 Yves Perron 1 John Porter 1 H/DL(A) 1 H/DL(P) 5 DRDC Atlantic Library: 4 CDs, 1 hard copy
11 TOTAL LIST PART 1
LIST PART 2: External Distribution by DRDKIM LCdr. C.R. Brown: 1 CD, 1 hard copy 2 DMEPM(SM) 4-2 NDHQ/Louis St-Laurent Building 555 Boul de la Carriere Hull, QC K1A 0K2 Mr. Peter Heppleston 1 DMEPM(SM) 4-4-4 NDHQ/Louis St-Laurent Building 555 Boul de la Carriere Hull, QC K1A 0K2 Ms. Alanna Jorgensen 1 DMEPM(SM) 4-4 NDHQ/Louis St-Laurent Building 555 Boul de la Carriere Hull, QC K1A 0K2
Ms. Sue Dickout 1 DMSS 2-4 NDHQ/Louis St-Laurent Building 555 Boul de la Carriere Hull, QC K1A 0K2 MARLANT HQ/ N42 FTA/SSO Subs, 1 hard copy 1 CFB Halifax, Bldg D-200 P.O. Box 99000 Stn Forces Halifax, Nova Scotia, Canada B3K 5X5
DRDC Atlantic CR 2008-105 63
64 DRDC Atlantic CR 2008-105
1 MARPAC HQ/ JTF(P)HQ DCOS FTA/SSO subs, 1 hard copy CFB Esquimalt PO BOX 17000 Stn Forces Victoria, BC V9A 7N2
1 NDHQ/DRDC/DRDKIM 3 1 Library and Archives Canada
9 TOTAL LIST PART 2
20 TOTAL COPIES REQUIRED
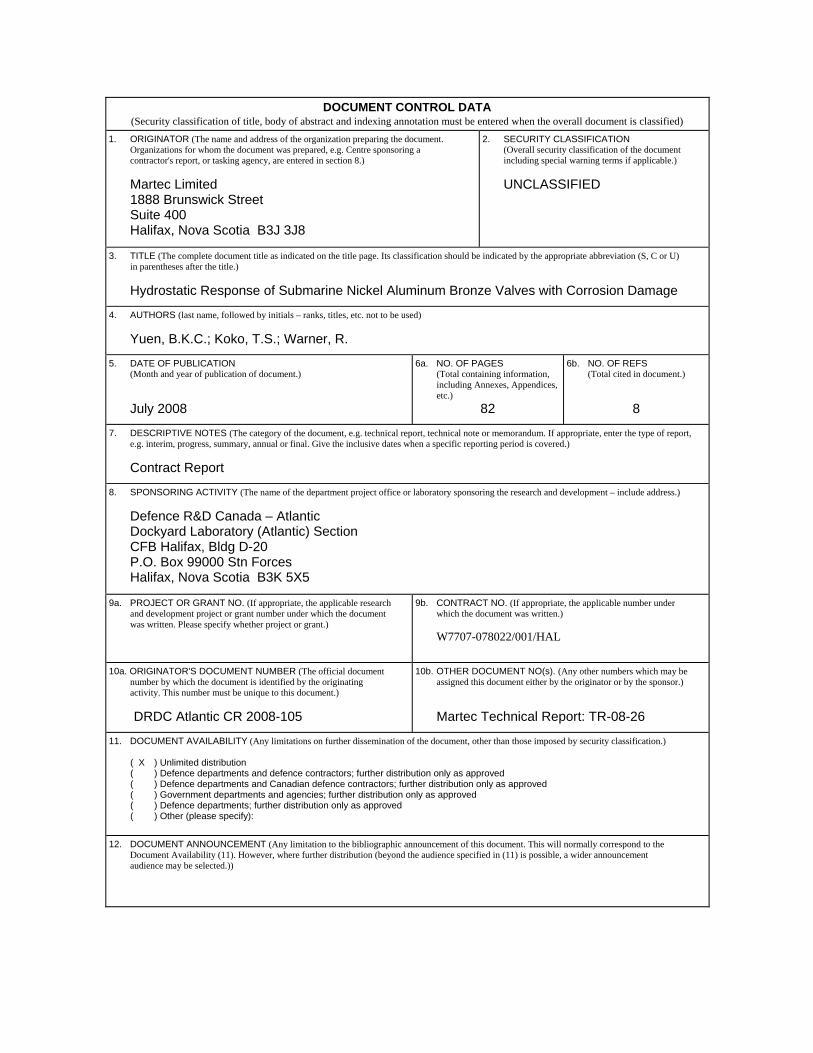
DOCUMENT CONTROL DATA (Security classification of title, body of abstract and indexing annotation must be entered when the overall document is classified)
1. ORIGINATOR (The name and address of the organization preparing the document. Organizations for whom the document was prepared, e.g. Centre sponsoring a contractor's report, or tasking agency, are entered in section 8.) Martec Limited 1888 Brunswick Street Suite 400 Halifax, Nova Scotia B3J 3J8
2. SECURITY CLASSIFICATION (Overall security classification of the document including special warning terms if applicable.)
UNCLASSIFIED
3. TITLE (The complete document title as indicated on the title page. Its classification should be indicated by the appropriate abbreviation (S, C or U) in parentheses after the title.) Hydrostatic Response of Submarine Nickel Aluminum Bronze Valves with Corrosion Damage
4. AUTHORS (last name, followed by initials – ranks, titles, etc. not to be used) Yuen, B.K.C.; Koko, T.S.; Warner, R.
5. DATE OF PUBLICATION (Month and year of publication of document.) July 2008
6a. NO. OF PAGES (Total containing information, including Annexes, Appendices, etc.)
82
6b. NO. OF REFS (Total cited in document.)
8 7. DESCRIPTIVE NOTES (The category of the document, e.g. technical report, technical note or memorandum. If appropriate, enter the type of report,
e.g. interim, progress, summary, annual or final. Give the inclusive dates when a specific reporting period is covered.) Contract Report
8. SPONSORING ACTIVITY (The name of the department project office or laboratory sponsoring the research and development – include address.) Defence R&D Canada – Atlantic Dockyard Laboratory (Atlantic) Section CFB Halifax, Bldg D-20 P.O. Box 99000 Stn Forces Halifax, Nova Scotia B3K 5X5
9a. PROJECT OR GRANT NO. (If appropriate, the applicable research and development project or grant number under which the document was written. Please specify whether project or grant.)
9b. CONTRACT NO. (If appropriate, the applicable number under which the document was written.)
W7707-078022/001/HAL
10a. ORIGINATOR'S DOCUMENT NUMBER (The official document number by which the document is identified by the originating activity. This number must be unique to this document.) DRDC Atlantic CR 2008-105
10b. OTHER DOCUMENT NO(s). (Any other numbers which may be assigned this document either by the originator or by the sponsor.) Martec Technical Report: TR-08-26
11. DOCUMENT AVAILABILITY (Any limitations on further dissemination of the document, other than those imposed by security classification.)
( X ) Unlimited distribution ( ) Defence departments and defence contractors; further distribution only as approved ( ) Defence departments and Canadian defence contractors; further distribution only as approved ( ) Government departments and agencies; further distribution only as approved ( ) Defence departments; further distribution only as approved ( ) Other (please specify):
12. DOCUMENT ANNOUNCEMENT (Any limitation to the bibliographic announcement of this document. This will normally correspond to the Document Availability (11). However, where further distribution (beyond the audience specified in (11) is possible, a wider announcement audience may be selected.))

13. ABSTRACT T (A brief and factual summary of the document. It may also appear elsewhere in the body of the document itself. It is highly desirable that the abstract of classified documents be unclassified. Each paragraph of the abstract shall begin with an indication of the security classification of the information in the paragraph (unless the document itself is unclassified) represented as (S), (C), (R), or (U). It is not necessary to include here abstracts in both official languages unless the text is bilingual.)
This study was undertaken to numerically investigate the behaviour of the submarine nickelaluminum bronze (NAB) valves (SW403 and SW226) with corrosion damage under hydrostaticloading at Defence R&D Canada – Atlantic (DRDC Atlantic), and to validate the numericalmodels using experimental results. Finite element analysis, involving nonlinear elastic plasticstatic analysis was performed using the implicit solver in LS-DYNA software system. Theexperimental testing showed that the smaller SW403 valve generally responded with lowerstrains than the larger SW226 valve at the same load. In addition, the strains in the bodyincreased with corrosion damage, and were much higher than those in the neck. This wasexpected since there was no corrosion damage in the neck region, there should be no effect ofcorrosion damage on the circumferential strain in the neck. The finite element results for theaxial strain in the body in general showed reasonably good agreement with the experimentalresults. However, the circumferential strain in both the body and the neck were in generalunderestimated. This indicates that further refinement of the finite element mesh is required.
La présente étude a été menée par R & D pour la Défense Canada – Atlantique (RDDCAtlantique) afin d’examiner, à l’aide d’une simulation numérique, la réaction des vannes enbronze au nickel-aluminium (BNA) (SW403 et SW226) endommagées par la corrosion lorsd’un chargement hydrostatique et pour valider les modèles numériques à l’aide de résultatsexpérimentaux. La méthode d’analyse par éléments finis qui comprend une analyse statiquenon-linéaire élastoplastique a été effectuée à l’aide du résolveur implicite du logiciel LS-DYNA. Les essais ont démontré que, de façon générale, la vanne de plus petite taille SW403présente moins de déformations pour le même chargement que la vanne de plus grande tailleSW226. Par ailleurs, le nombre de déformations dans le corps augmente avec l’étendue de lacorrosion et elles y sont beaucoup plus nombreuses que dans le col, chose qui était à prévoir. Eneffet, s’il n’y a pas de dommages dus à la corrosion dans la région du col, il ne devrait pas avoirde déformations longitudinales dus à la corrosion sur le col. En générale, les résultats desanalyses par éléments finis pour la déformation longitudinale sur le corps sont semblablementles mêmes que lors des essais. Cependant, les déformations transversales sur le corps et le col dela vanne ont été sous-estimés, indiquant qu’il serait nécessaire d’améliorer le réseau maillé deséléments finis.
14. KEYWORDS, DESCRIPTORS or IDENTIFIERS (Technically meaningful terms or short phrases that characterize a document and could be helpful in cataloguing the document. They should be selected so that no security classification is required. Identifiers, such as equipment model designation, trade name, military project code name, geographic location may also be included. If possible keywords should be selected from a published thesaurus, e.g. Thesaurus of Engineering and Scientific Terms (TEST) and that thesaurus identified. If it is not possible to select indexing terms which are Unclassified, the classification of each should be indicated as with the title.) nickel aluminum bronze, submarine valve, corrosion damage, hydrostatic testing, finite element analysis, performance chart

This page intentionally left blank.