hydrology the flow or movement of water. hydrologic cycle
TRANSCRIPT
Hydrology
The flow or movement of water
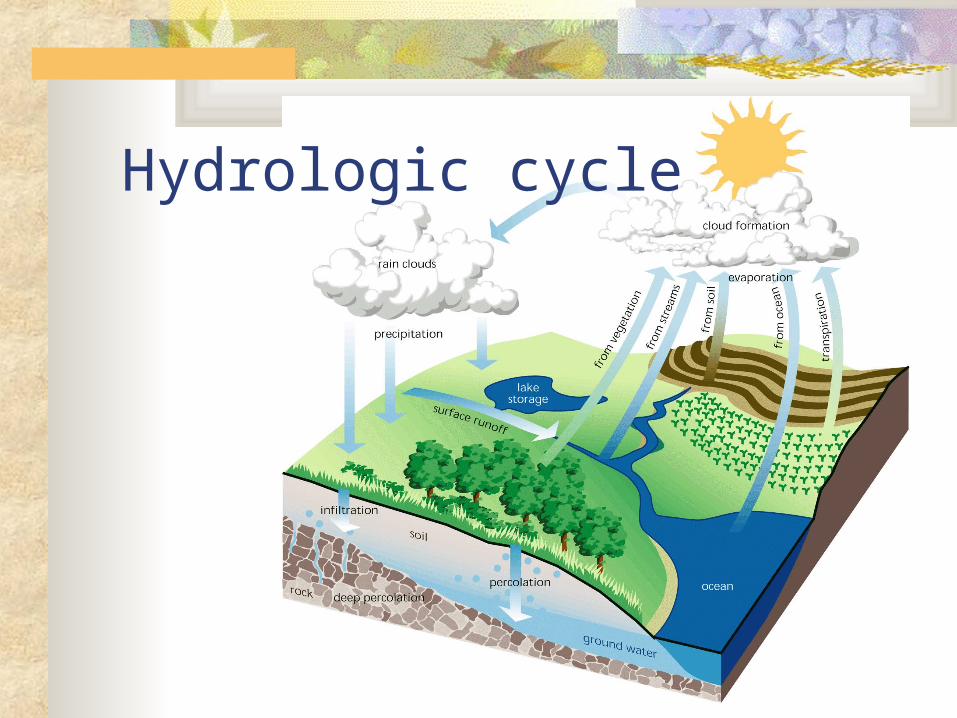
Hydrologic cycle
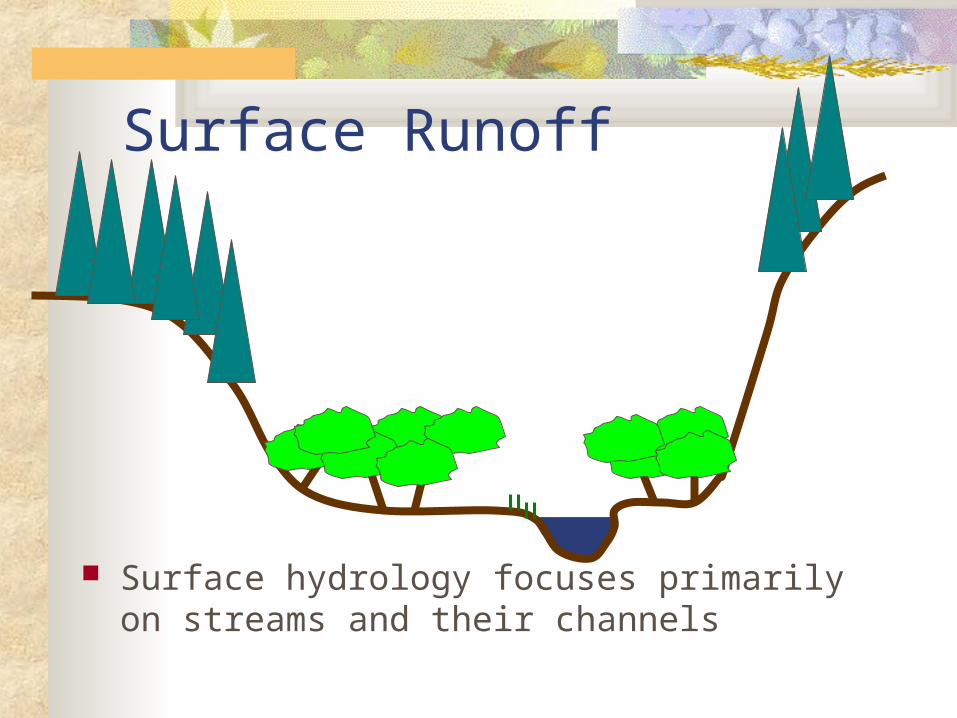
Surface Runoff
Surface hydrology focuses primarily on streams and their channels
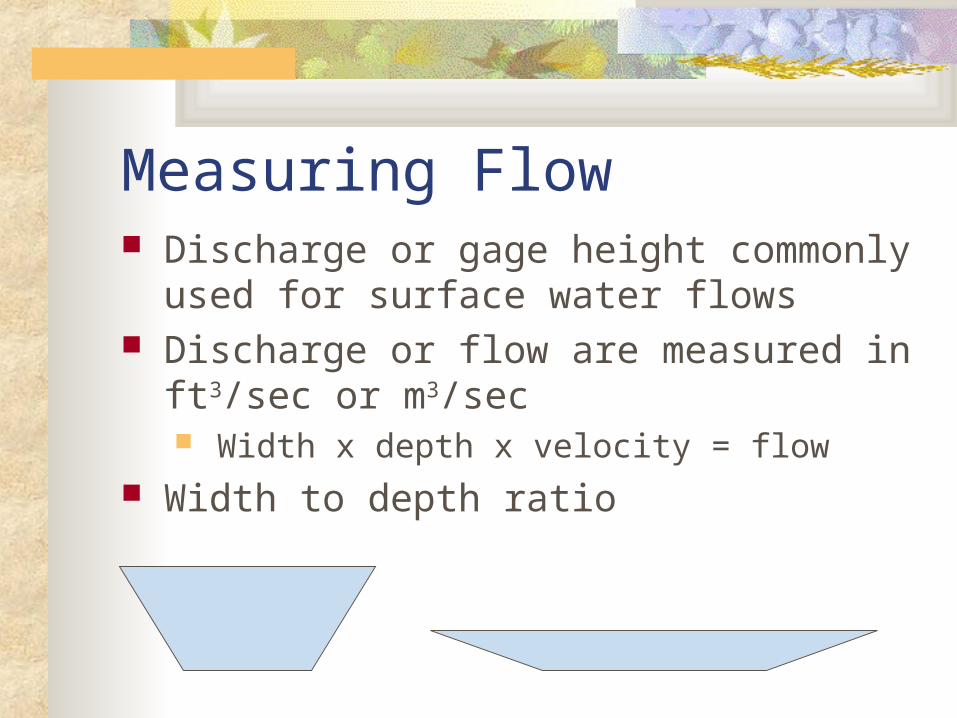
Measuring Flow Discharge or gage height commonly used
for surface water flows Discharge or flow are measured in ft3/sec
or m3/sec Width x depth x velocity = flow
Width to depth ratio
Hydrographs Graph of a stream’s discharge over time “Real-time” and historical data may be
available through Water Resources Dept, your local watermaster or USGS http://waterdata.usgs.gov/nwis
Water Year = Oct - Sept
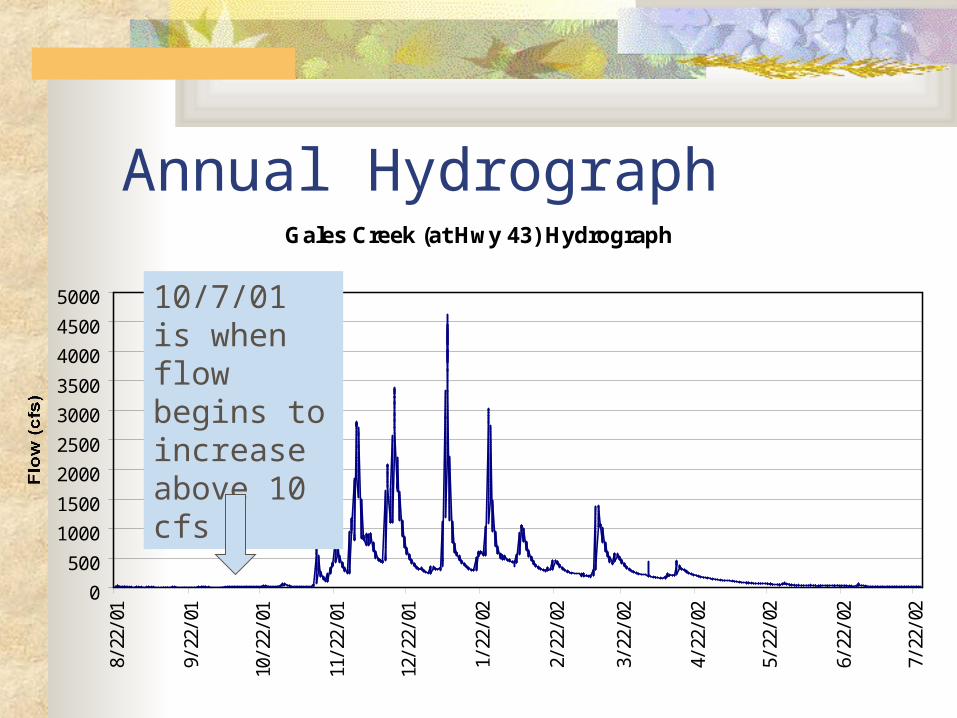
Annual HydrographGales Creek (at Hwy 43) Hydrograph
0
500
1000
1500
2000
2500
3000
3500
4000
4500
5000
8/22/01
9/22/01
10/22/01
11/22/01
12/22/01
1/22/02
2/22/02
3/22/02
4/22/02
5/22/02
6/22/02
7/22/02
10/7/01 is when flow begins to increase above 10 cfs
Peak Flows Watermaster has determined 1,873 cfs to
be “flood stage” for this site Gales Creek exceeded this level 4 times in
water year 2001 Highest discharge for year = 4,622 csf on
1/8/02
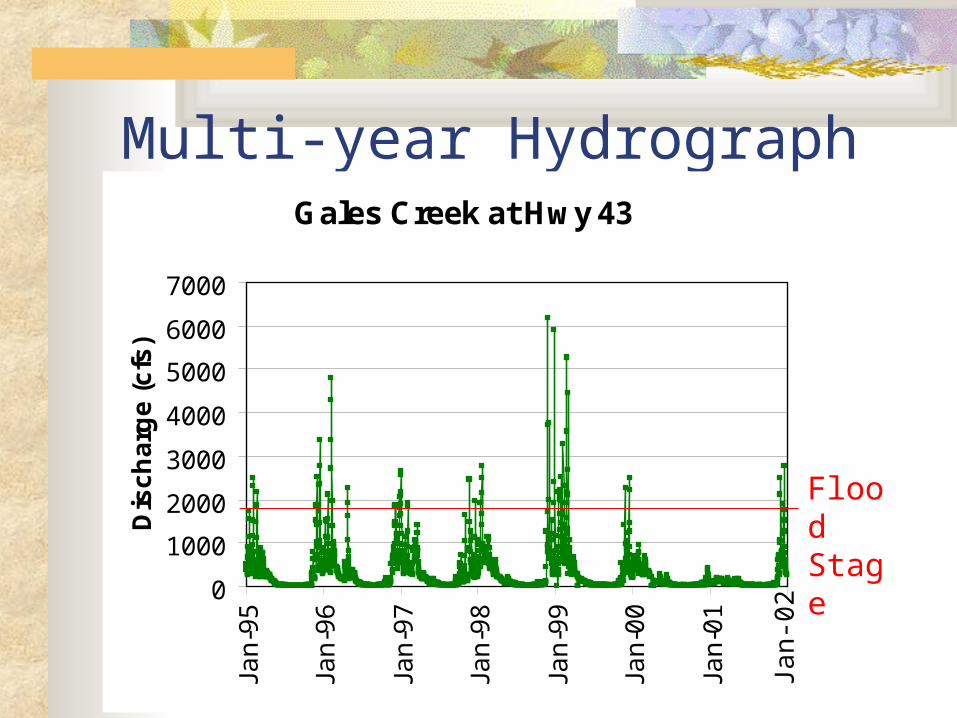
Multi-year HydrographGales Creek at Hwy 43
0
1000
2000
3000
4000
5000
6000
7000
Jan-95
Jan-96
Jan-97
Jan-98
Jan-99
Jan-00
Jan-01
Dis
ch
arg
e (
cfs
)
Jan-02
Flood Stage
Flood Frequency Gales Creek appears to reach “flood stage”
at least once per year (except 2001) 1999 appears to have highest discharge for
the 8 years we have data for – even higher than 1996
What makes a 100-year flood?
Flood Frequency Find maximum annual discharges
Can query “Peak Streamflow” on USGS site Rank peak discharges from largest to
smallest Calculate recurrence interval (RI)
RI = # years + 1
flood rank
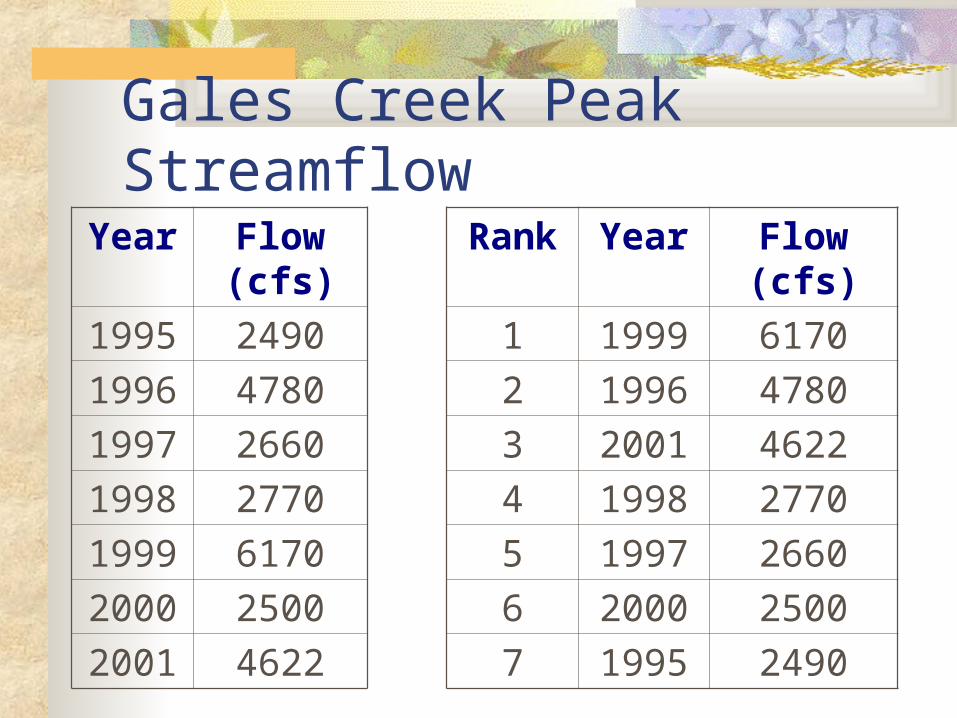
Gales Creek Peak StreamflowYear Flow
(cfs)
1995 2490
1996 4780
1997 2660
1998 2770
1999 6170
2000 2500
2001 4622
Rank Year Flow (cfs)
1 1999 6170
2 1996 4780
3 2001 4622
4 1998 2770
5 1997 2660
6 2000 2500
7 1995 2490
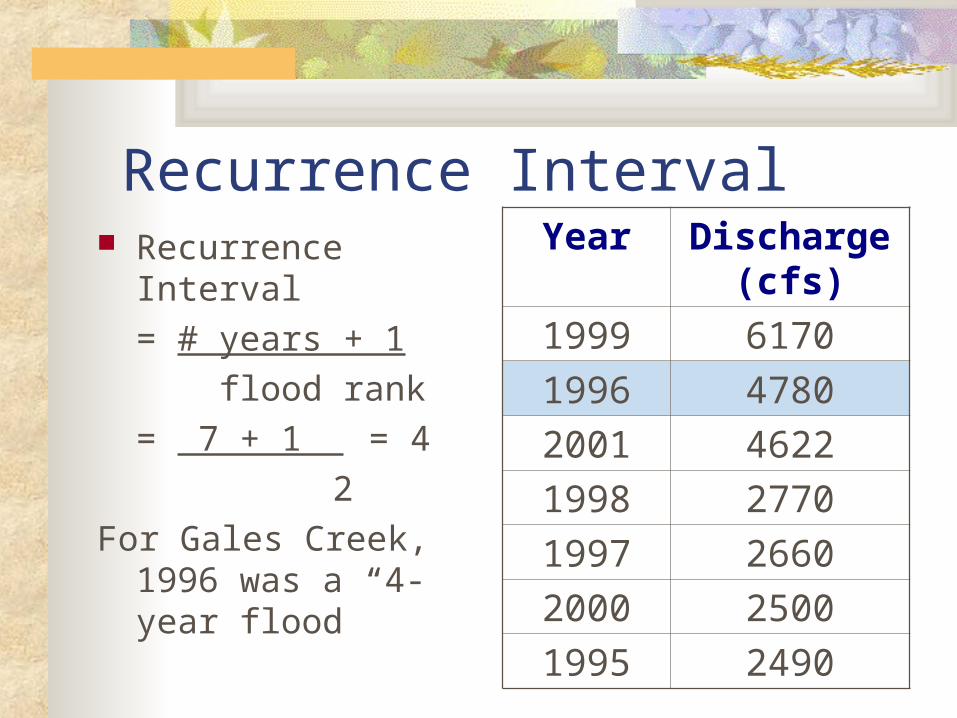
Recurrence Interval Recurrence Interval
= # years + 1
flood rank
= 7 + 1 = 4
2
For Gales Creek, 1996 was a “4-year flood”
Year Discharge (cfs)
1999 6170
1996 4780
2001 4622
1998 2770
1997 2660
2000 2500
1995 2490
100-Year Flood Requires 99 years of data Only the largest flood during that 100 year
period would be a “100-year flood” Very few sites with 100 years of data The Flood of 1996 was far from a 100-year
event
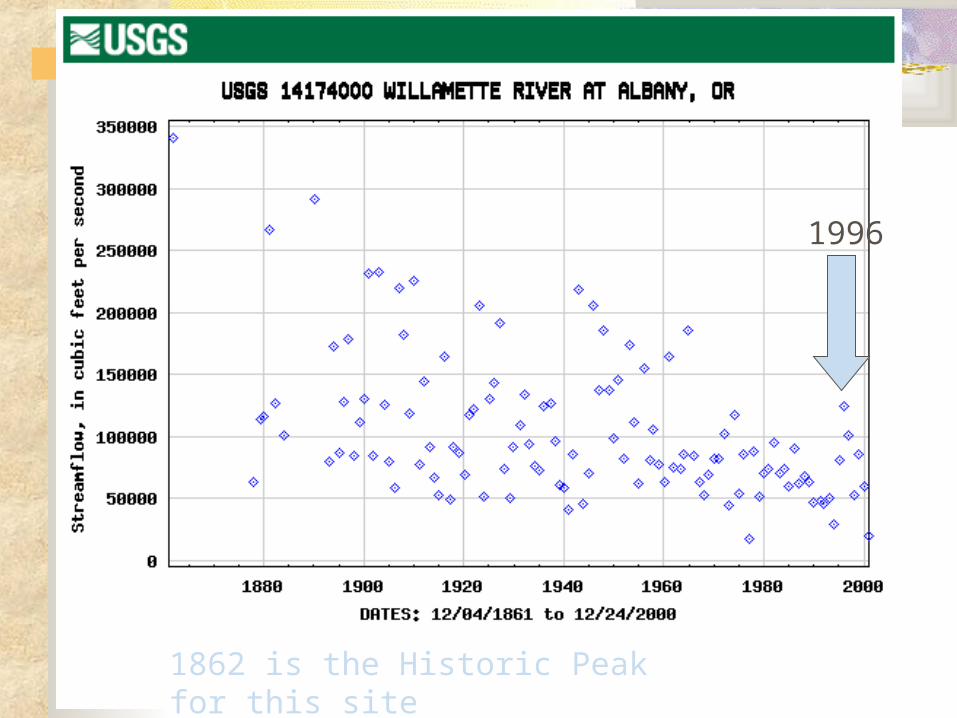
1862 is the Historic Peak for this site
1996
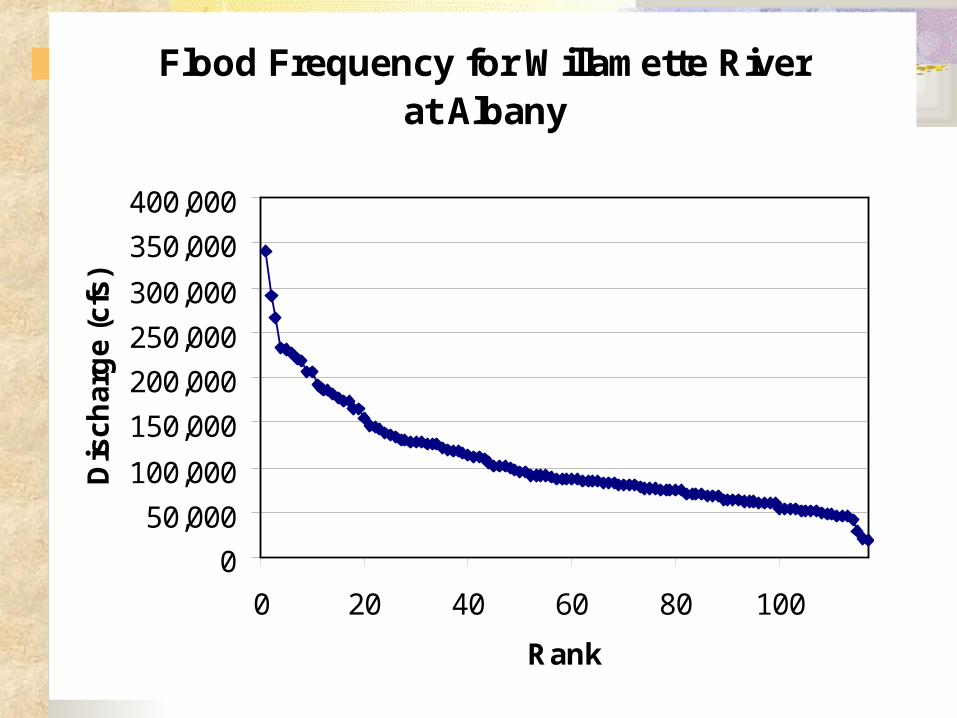
Flood Frequency for Willamette River at Albany
0
50,000
100,000
150,000
200,000
250,000
300,000
350,000
400,000
0 20 40 60 80 100
Rank
Dis
ch
arg
e (
cfs
)
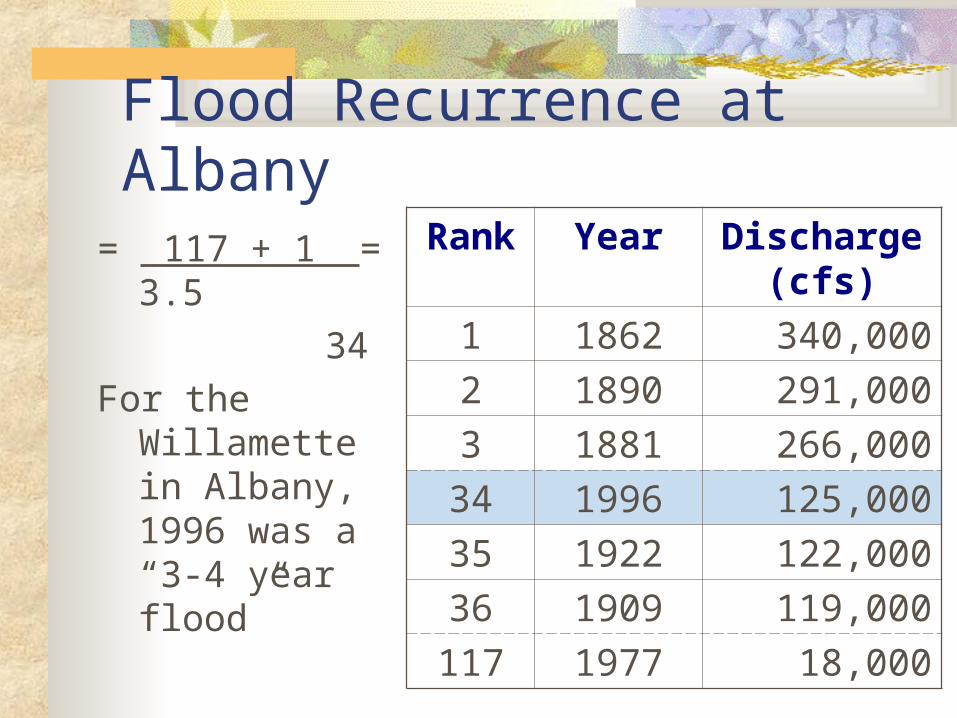
Flood Recurrence at Albany= 117 + 1 = 3.5
34
For the Willamette in Albany, 1996 was a “3-4 year flood”
Rank Year Discharge (cfs)
1 1862 340,000
2 1890 291,000
3 1881 266,000
34 1996 125,000
35 1922 122,000
36 1909 119,000
117 1977 18,000
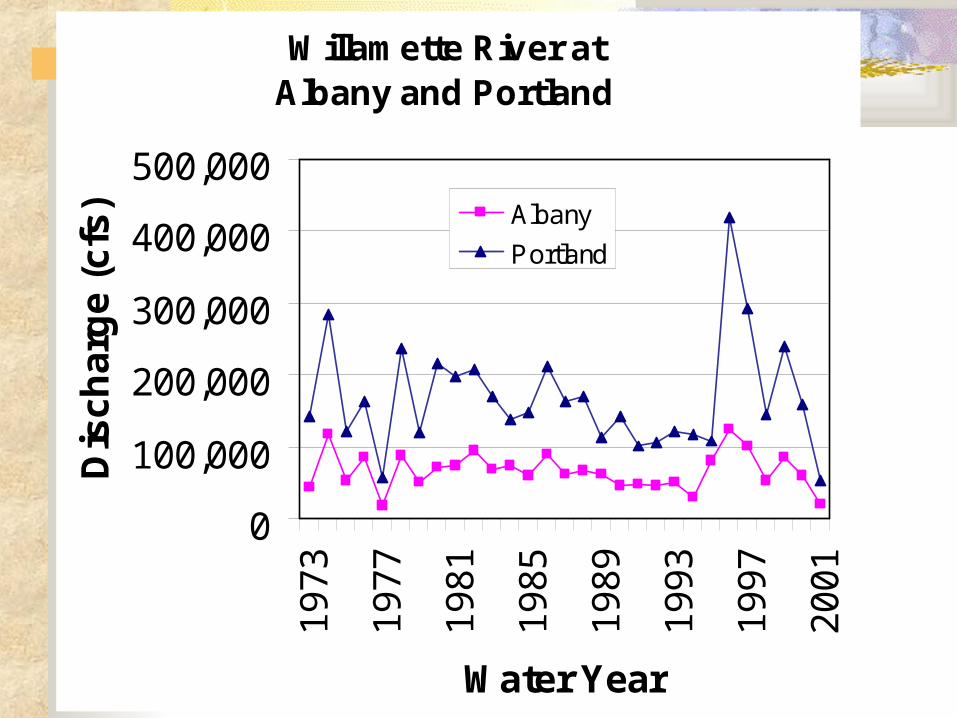
Willamette River at Albany and Portland
0
100,000
200,000
300,000
400,000
500,000
1973
1977
1981
1985
1989
1993
1997
2001
Water Year
Dis
ch
arg
e (
cfs
) Albany
Portland
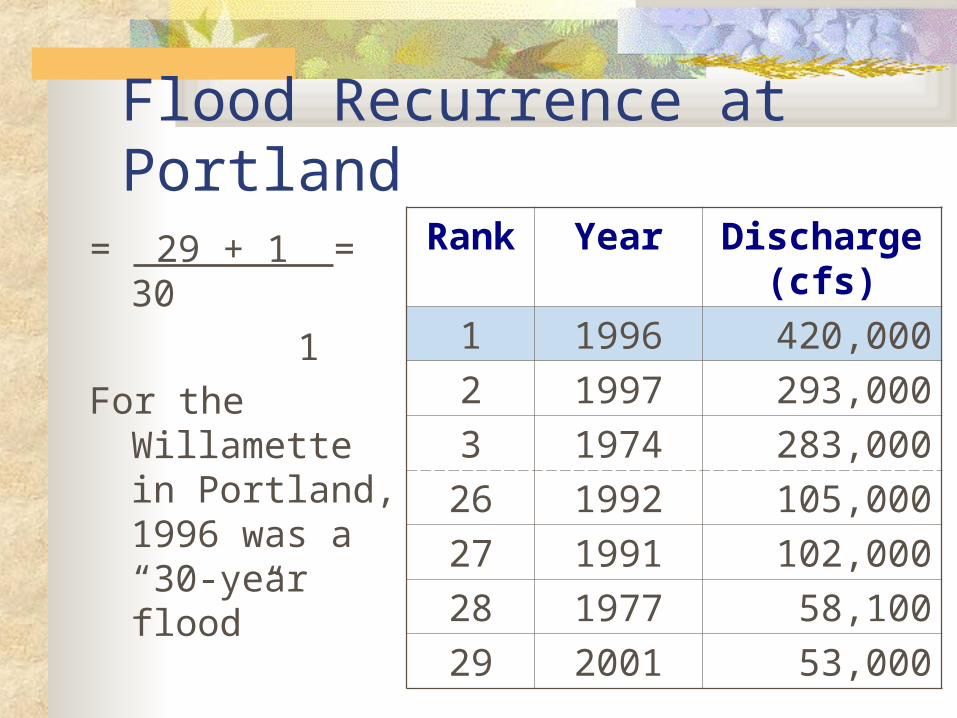
Flood Recurrence at Portland= 29 + 1 = 30
1
For the Willamette in Portland, 1996 was a “30-year flood”
Rank Year Discharge (cfs)
1 1996 420,000
2 1997 293,000
3 1974 283,000
26 1992 105,000
27 1991 102,000
28 1977 58,100
29 2001 53,000
Stream Channel The energy from gradient can alter the
Sinuosity Entrenchment Width to Depth Ratio
of a stream channel below bankfull
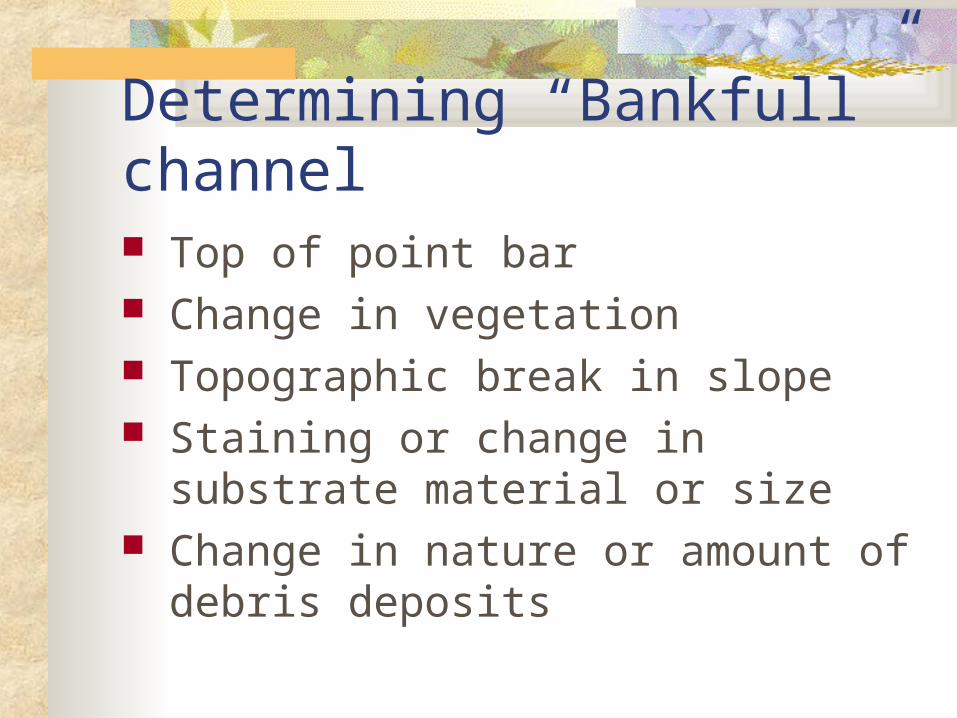
Determining “Bankfull” channel Top of point bar Change in vegetation Topographic break in slope Staining or change in substrate material or
size Change in nature or amount of debris
deposits
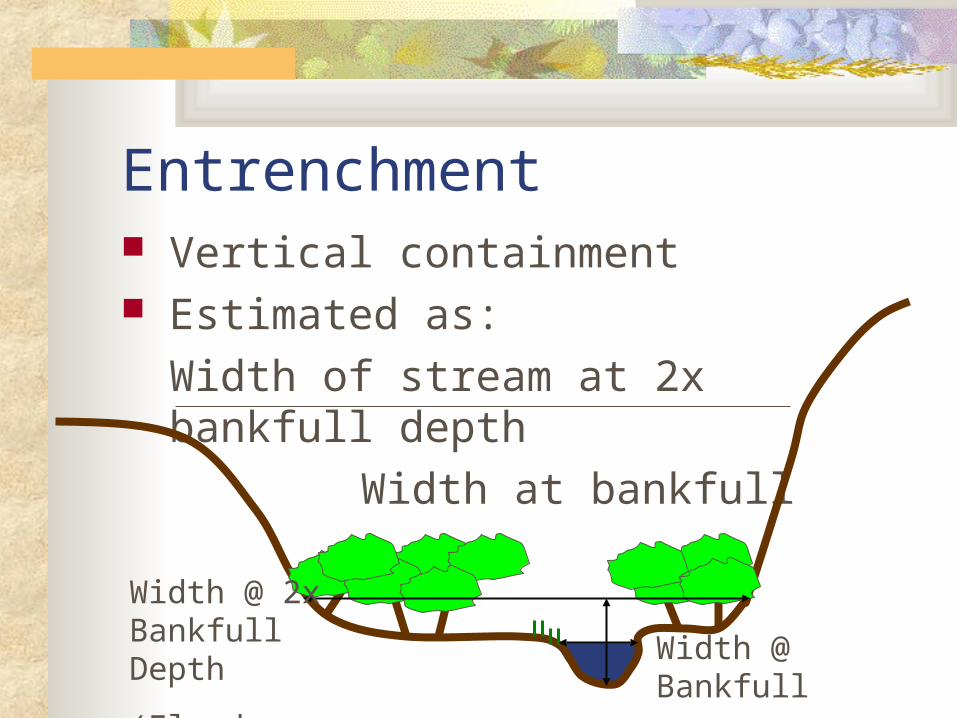
Entrenchment Vertical containment Estimated as:
Width of stream at 2x bankfull depth
Width at bankfull
Width @ 2x Bankfull Depth
(Floodprone Width)Width @ Bankfull
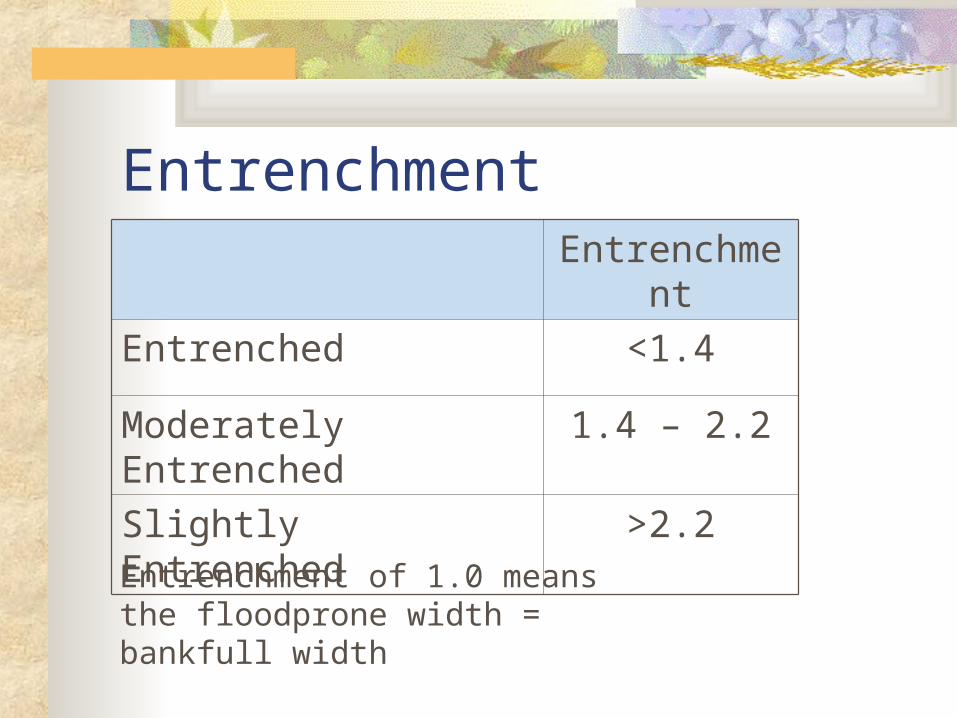
EntrenchmentEntrenchment
Entrenched <1.4
Moderately Entrenched 1.4 – 2.2
Slightly Entrenched >2.2
Entrenchment of 1.0 means the floodprone width = bankfull width
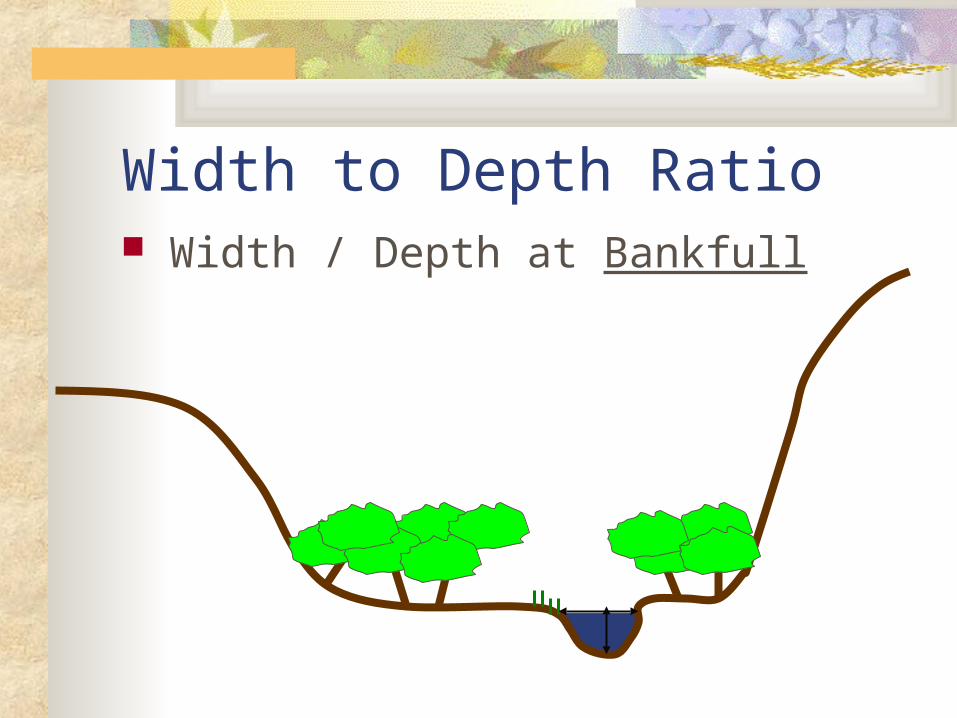
Width to Depth Ratio Width / Depth at Bankfull
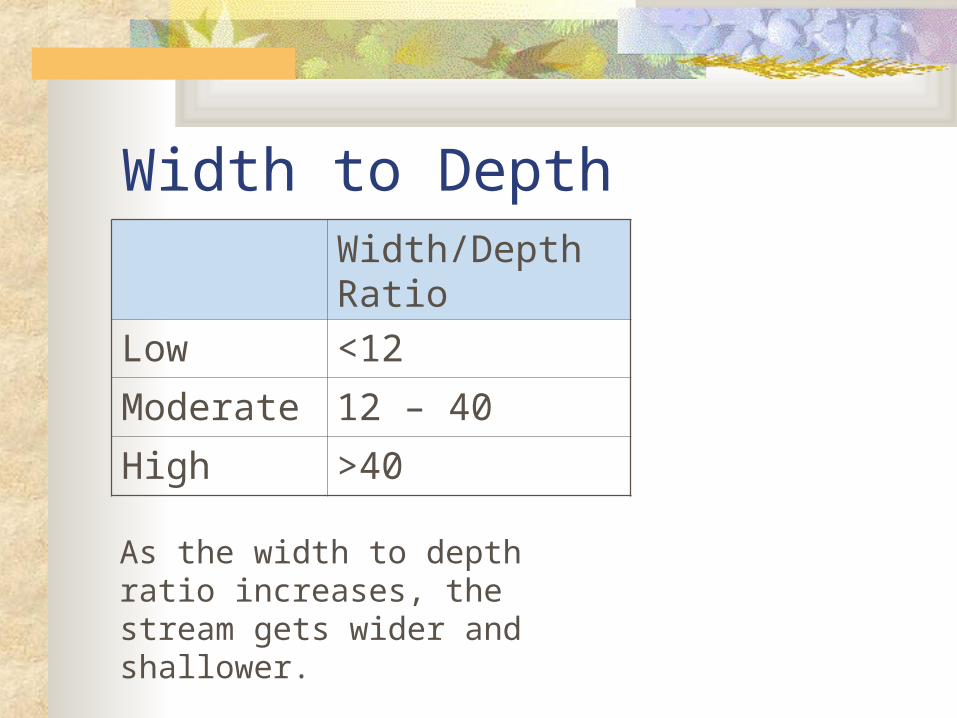
Width to DepthWidth/Depth Ratio
Low <12
Moderate 12 – 40
High >40
As the width to depth ratio increases, the stream gets wider and shallower.
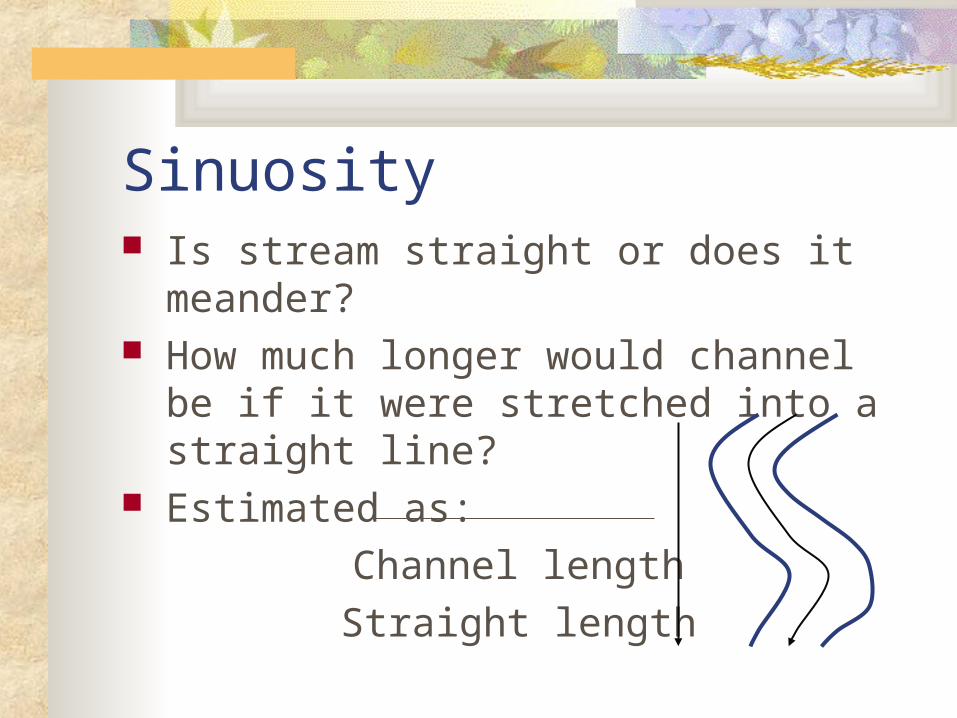
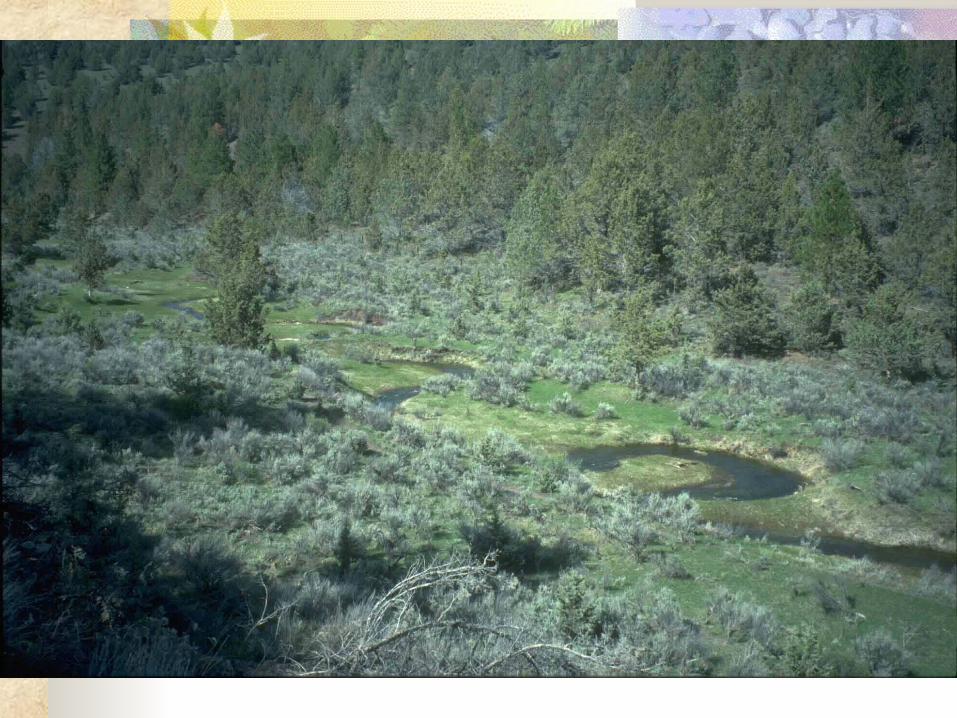
Sinuosity Is stream straight or does it meander? How much longer would channel be if it
were stretched into a straight line? Estimated as:
Channel length
Straight length
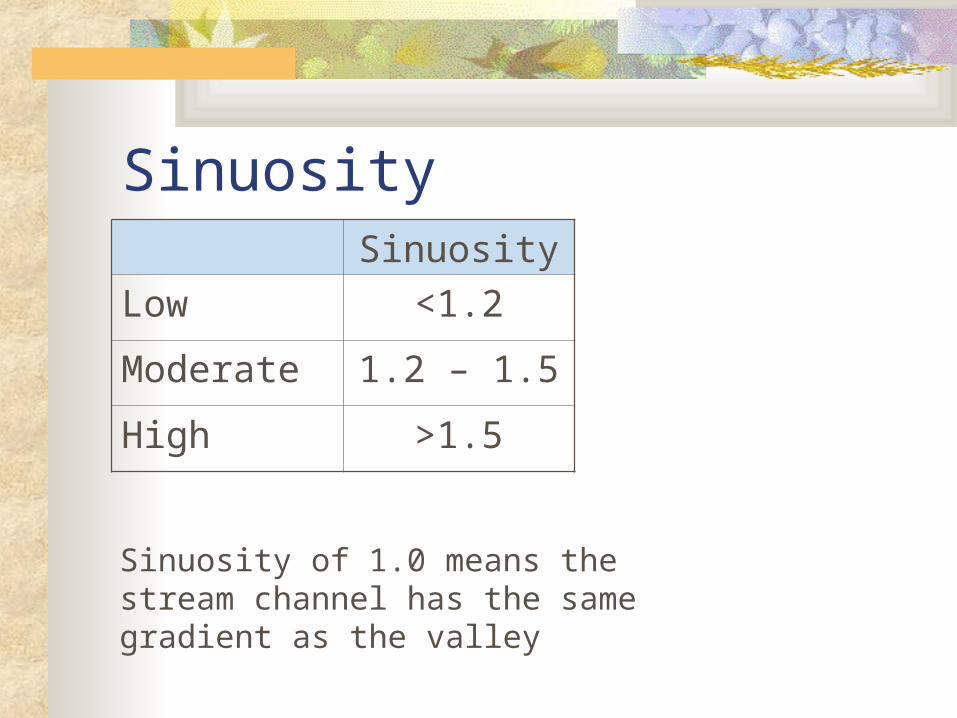
SinuositySinuosity
Low <1.2
Moderate 1.2 – 1.5
High >1.5
Sinuosity of 1.0 means the stream channel has the same gradient as the valley
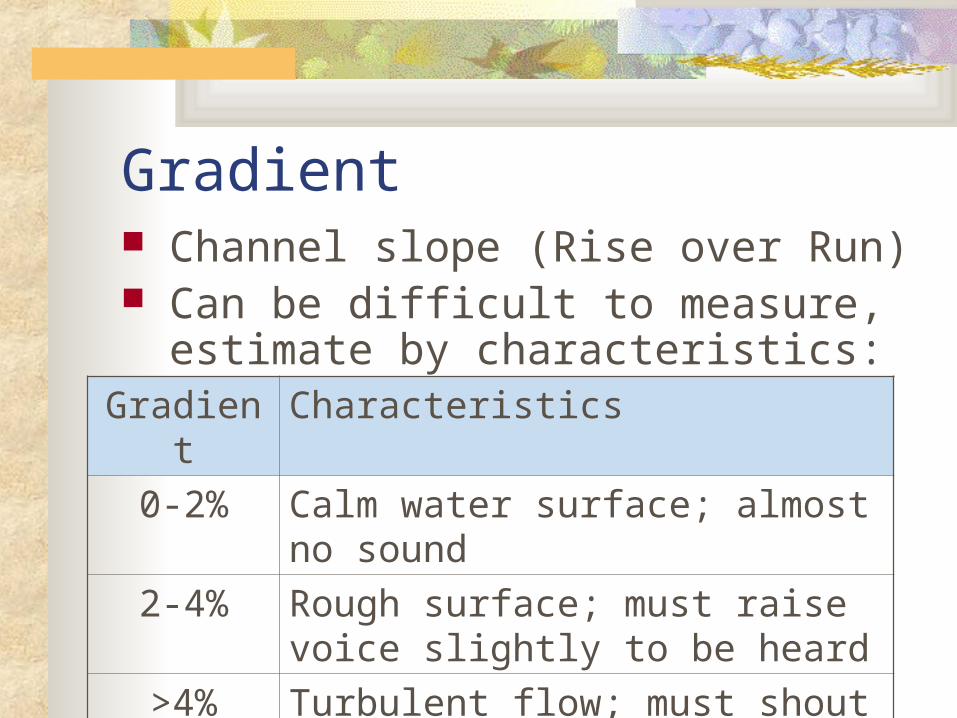
Gradient Channel slope (Rise over Run) Can be difficult to measure, estimate by
characteristics:Gradient Characteristics
0-2% Calm water surface; almost no sound
2-4% Rough surface; must raise voice slightly to be heard
>4% Turbulent flow; must shout to be heard
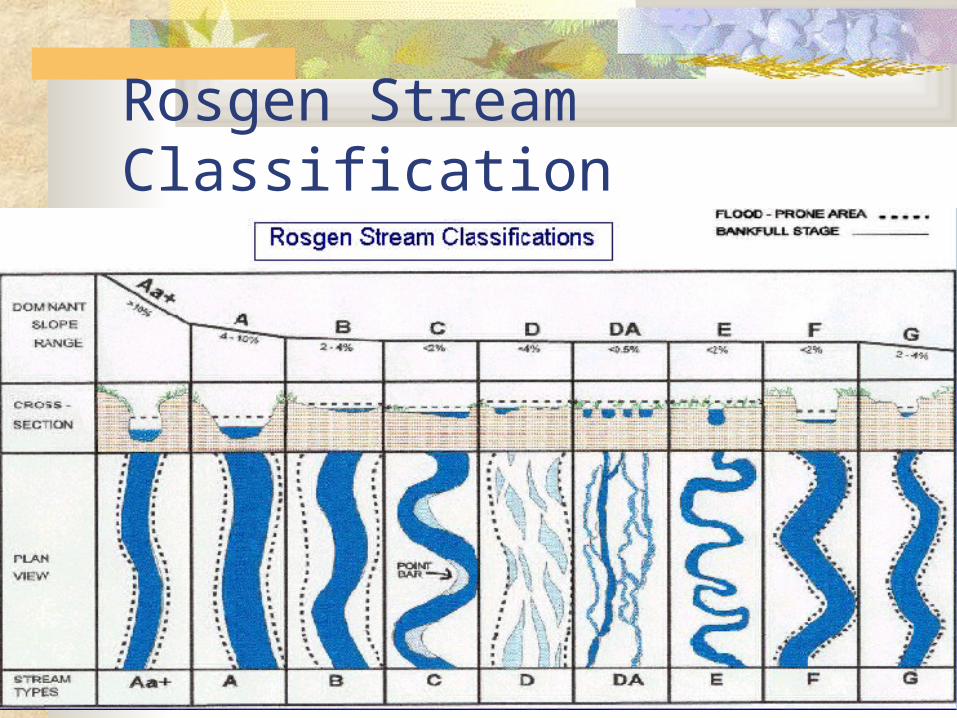
Rosgen Stream Classification