hydrographic toxicity evaluation of highway … toxicity evaluation of highway stormwater runoff...
TRANSCRIPT
Hydrographic Toxicity Evaluation of Highway Stormwater Runoff
FINAL DRAFT REPORT
Prepared for: California Department of Transportation
Division of Environmental Analysis 1120 N Street
Sacramento, CA 95814
Prepared by : Chris Stransky
Nautilus Environmental 5550 Morehouse Dr., Suite 150
San Diego, CA 92121
Masoud Kayhanian Center for Environmental and Water Resources Engineering
Department of Civil and Environmental Engineering One Shields Avenue, Engineering III
University of California Davis, California 95616
Simlin Lau and Michael Stenstrom
Department of Civil and Environmental Engineering 5714 Boelter Hall
University of California Los Angeles, CA 90095-1593
May 2005
Hydrographic Toxicity Evaluation of Highway Stormwater Runoff
TABLE OF CONTENTS
LIST IF TABLES …………………………………………………………………………. iii
LIST OF FIGURES ………………………………………………………………………. iv
ABBREVIATIONS ……………………………………………………………………….. vi
ADA STATEMENT ……………………………………………………………………… vii
EXECUTIVE SUMMARY………………………………………………………………….. 1
1. INTRODUCTION …………………………………………………………………. 3
2. METHODS AND MATERIALS ………………………………………………………….. 4
2.1. Test materials ………………………………………………………………………… 4
2.2 Organism Procurement and Handling …………………………………………….. 7
2.2.1 Fathead minnow …………………………………………………………….. 7 2.2.2 Ceriodaphnia dubia ………………………………………………………… 7
2.3 Chronic Toxicity Screen Methods …………………………………………………. 7
2.3.1 Fathead Minnow 7-Day Survival and Growth …………………………… 10 2.3.2 Water Flea 7-Day Survival and Reproduction ………………………….. 11
2.4 TIE Test Procedures ………………………………………………………………... 11
2.4.1 Baseline ……………………………………………………………………………… 18 2.4.2 EDTA Metal Chelation ……………………………………………………………… 18 2.4.3 Oxidant Reduction ………………………………………………………………….. 18 2.4.4 C18 Solid-Phase Extraction ……………………………………………………….. 19 2.4.6 Aeration Treatment …………………………………………………………………. 19 2.4.7 Graduated pH Adjustment …………………………………………………………. 19 2.4.8 Zeolite Extraction ……………………………………………………………………. 19 2.4.9 Post-Zeolite Ammonia Spikes …………………………………………………….. 19 2.4.10 Post-Zeolite EDTA Addition ……………………………………………………….. 20
2.5 Analytical Chemistry …………………………………………………………. 20
2.6 Statistical Analyses ………………………………………………………….. 21
May 2005 i
Hydrographic Toxicity Evaluation of Highway Stormwater Runoff
3. RESULTS AND DISCUSSION ………………………………………………….. 22
3.1 Stormwater Screening Tests ……………………………………………………… 22
3.1.1 First-Flush Effect and Degree of Toxicity ……………………………………….. 22 3.1.2 Toxicity Test Relationships ……………………………………………………….. 23
3.2 Toxicity Identification Evaluations (TIE) …………………………………………. 49
3.2.1 TIE Assessment for Storm Event 8 ……………………………………… 49 3.2.2 TIE Assessment for Storm Event 9 ……………………………………… 61 3.2.3 Summary of Major Sources of Toxicity (Storms 8 and 9) …………….. 67
3.3 Use of Analytical Chemistry Data to Estimate Effects …………………………. 68
3.3.1 Screening Test Chemistry versus Toxicity Relationships ……………… 76
3.4 Use of Toxicity Data for Stormwater Treatment BMP Performance Evaluation 86
3.5 QA/QC ……………………………………………………………………………….. 88
4. REFERENCES …………………………………………………………………………. 90
May 2005 ii
Hydrographic Toxicity Evaluation of Highway Stormwater Runoff
List of Tables Table 1. Sample Dates, Sample Identification, and Concentrations Tested ……….. 5
Table 2. Test Conditions and QA/QC Summary for the Fathead Minnow
7-Day Survival and Growth Test ………………………………………………. 8
Table 3. Test Conditions and QA/QC Summary for the Water Flea
7-Day Survival and Reproduction Test ……………………………………….. 9
Table 4. Summary of TIE Treatments Performed and Target Toxicants …………… 13
Table 5. Summary of Stormwater Samples Tested using TIE Methodologies……… 14
Table 6. Test Conditions and QA/QC Summary for the Fathead Minnow
96-hr Acute Survival Test ……………………………………………………… 16
Table 7. Test Conditions and QA/QC Summary for the Water Flea
96-hr Acute Survival Test ………………………………………………………. 17
Table 8. Percent of Grab Samples Exhibiting Acute and Chronic Toxicity ………….. 24
Table 9. Spearman Rank Relationships for Toxicity Testing Endpoints ……………… 26
Table 10. Un-ionized Ammonia Acute LC50 Values for Ceriodaphnia
and P. promelas – Nautilus Internal Reference Toxicant
Data and Published Literature Values ………………………………………… 59
Table 11. Summary of Selected Trace Metals Results Pre and
Post-Zeolite Extractions (Storm 8 TIE) ………………………………………. 60
Table 12. Summary of Surfactant Concentrations in Initial Grab Samples
from Storms 8 and 9. ………………………………………………………….. 70
Table 13. Summary of Analytical Chemistry Results Provided to
Nautilus by UCLA (Turbidity, Conductivity, Hardness,
COD, DOC, Oil and Grease, Total Ammonia, Nitrite, and Nitrate) ………… 71
Table 14. Summary of Analytical Chemistry Results Provided to
Nautilus by UCLA (Dissolved Trace Metals) ………………………………… 72
Table 15. Selected Toxicity Data Published for Metals and
Surfactants of Potential Concern for P. promelas …………………………… 73
Table 16. Selected Toxicity Data Published for Metals and
Surfactants of Potential Concern for C. dubia ……………………………… 74
May 2005 iii
Hydrographic Toxicity Evaluation of Highway Stormwater Runoff
List of Figures
Figure. Summary of Toxicity Screening Results in Undiluted
Samples - P. promelas Survival, Storm 2 (Mean ± 1SD). ………………… 27
Figure. Summary of Toxicity Screening Results in Undiluted
Samples - P. promelas Growth, Storm 2 (Mean ± 1SD)…………………… 28
Figure. Summary of Toxicity Screening Results in Undiluted
Samples - P. promelas Survival, Storm 6 (Mean ± 1SD)…………………… 29
Figure. Summary of Toxicity Screening Results in Undiluted
Samples - P. promelas Growth, Storm 6 (Mean ± 1SD)……………………. 30
Figure. Summary of Toxicity Screening Results in Undiluted
Samples - P. promelas Survival, Storm 7 (Mean ± 1SD)……………………. 31
Figure. Summary of Toxicity Screening Results in Undiluted
Samples - P. promelas Growth, Storm 7 (Mean ± 1SD)…………………….. 32
Figure. Summary of Toxicity Screening Results in Undiluted
Samples - P. promelas Survival, Storm 8 (Mean ± 1SD). ……………………33
Figure. Summary of Toxicity Screening Results in Undiluted
Samples - P. promelas Growth, Storm 8 (Mean ± 1SD). …………………… 34
Figure. Summary of Toxicity Screening Results in Undiluted
Samples - P. promelas Survival, Storm 9 (Mean ± 1SD)……………………. 35
Figure 10. Summary of Toxicity Screening Results in Undiluted
Samples – P. promelas Growth, Storm 9 (Mean ± 1SD)……………………. 36
Figure 11. Summary of Toxicity Screening Results in Undiluted
Samples - C. dubia Survival and Reproduction, Storm 2 (Mean ± 1SD)…… 37
Figure 12. Summary of Toxicity Screening Results in Undiluted
Samples - C. dubia Survival and Reproduction, Storm 4 (Mean ± 1SD)….. 39
Figure 13. Summary of Toxicity Screening Results in Undiluted
Samples - C. dubia Survival and Reproduction, Storm 6 (Mean ± 1SD)….. 39
Figure 14. Summary of Toxicity Screening Results in Undiluted
Samples - C. dubia Survival and Reproduction, Storm 7 (Mean ± 1SD)….. 40
May 2005 iv

Hydrographic Toxicity Evaluation of Highway Stormwater Runoff
Figure 15. Summary of Toxicity Screening Results in Undiluted
Samples - C. dubia Survival and Reproduction, Storm 8 (Mean ± 1SD)….. 41
Figure 16. Summary of Toxicity Screening Results in Undiluted
Samples - C. dubia Survival and Reproduction, Storm 9 (Mean ± 1SD)…... 42
Figure 17. LC and EC50 Point Estimate Results for P. promelas - Site 1………………. 43
Figure 18. LC and EC50 Point Estimate Results for P. promelas - Site 2……………… 44
Figure 19. LC and EC50 Point Estimate Results for P. promelas - Site 3……………… 45
Figure 20. LC and EC50 Point Estimate Results for C. dubia - Site 1………………….. 46
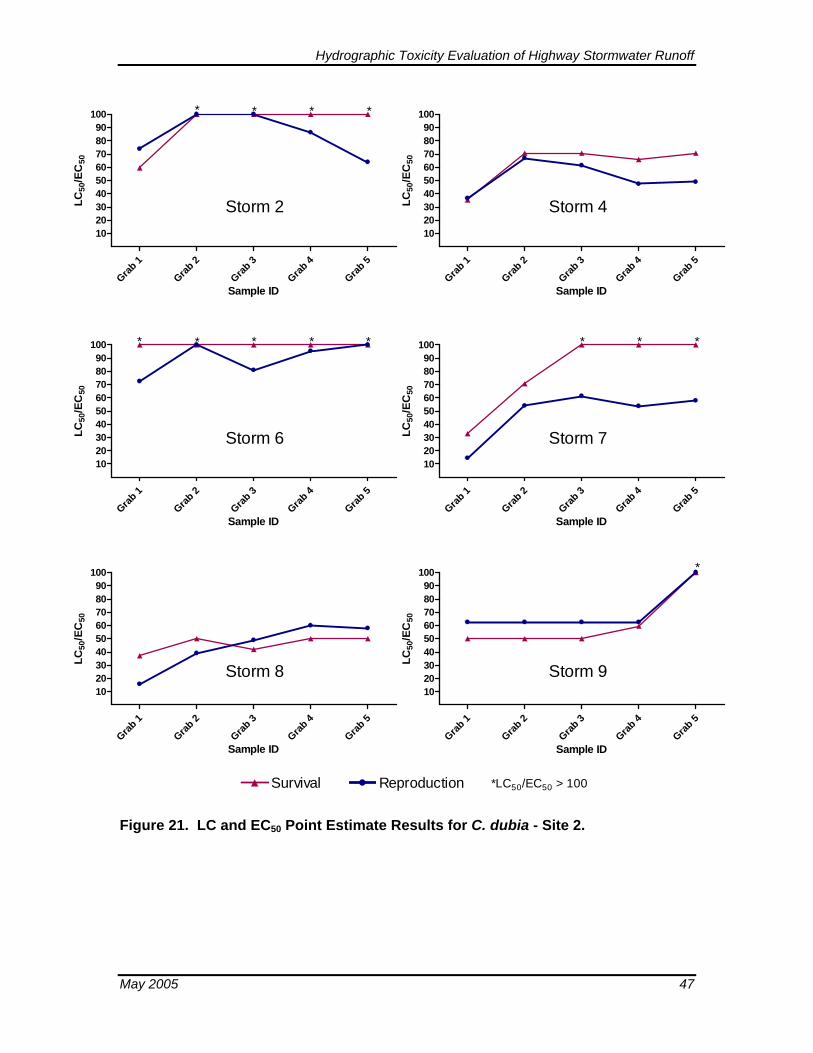
Figure 21. LC and EC50 Point Estimate Results for C. dubia - Site 2………………….. 47
Figure 22. LC and EC50 Point Estimate Results for C. dubia - Site 3………………….. 48
Figure 23. EDTA Addition Results for Storm 8, Site 2 Grab
Samples using P. promelas and C. dubia…………………………………….. 51
Figure 24. TIE Treatment Results for Storm 8, Site 2 Composite …………………….. 52
Figure 25. EDTA Addition Results for Storm 8, Site 3 Grab
Samples using P. promelas and C. dubia……………………………………. 55
Figure 26. TIE Treatment Results for Storm 8, Site 3 Composite …………………….. 56
Figure 27. Relationship Between Un-ionized Ammonia and
Toxicity in TIE Treatments for Storm 8. ………………………………………. 58
Figure 28. TIE Results for Storm 9, Site 2 Grab Samples using P. promelas…………. 62
Figure 29. TIE Results for Storm 9, Site 2 Grab Samples using C. dubia……………… 63
Figure 30. TIE Results for Storm 9, Site 3 Grab Samples using P. promelas…………. 65
Figure 31. TIE Results for Storm 9, Site 3 Grab Samples using C. dubia…………….. 66
Figure 32. Distribution of Selected Analytical Parameters and Relation to
7-Day Survival of Fathead Minnows (All available screening data) ………… 79
Figure 33. Distribution of Selected Analytical Parameters and Relation to
7-Day Survival of C. dubia (All available screening data) ………………….. 81
Figure 34. Distribution of Selected Analytical Parameters and Relation to
Reproduction of C. dubia (All available screening data) …………………… 83
Figure 35. Relationship Between Surfactant Concentrations and
Survival of P. promelas and C. dubia (Storms 8 and 9) ……………………… 85 May 2005 v
Hydrographic Toxicity Evaluation of Highway Stormwater Runoff
Abbreviations
BMP Best Management Practice CASQA California Stormwater Quality Association CEL Calscience Environmental Laboratories, Inc. COD Chemical Oxygen Demand DO Dissolved Oxygen DOC Dissolved Organic Carbon EC50 Median Effect Concentration EDTA Ethylenediaminetetraacetate EPA Environmental Protection Agency HCl Hydrochloric Acid LAS Linear Alkylbenzene Sulfonates LC50 Median Lethal Concentration LOEC Lowest Observed Effect Concentration MBAS Methylene Blue Activated Substances NaOH Sodium Hydroxide NOEC No Observed Effect Concentration QA/QC Quality Assurance/Quality Control SCCWRP Southern California Coastal Water Research Project STS Sodium Thiosulfate SWRCB State Water Resources Control Board TIE Toxicity Identification Evaluation UCD University of California Davis UCLA University of California Los Angeles YCT Yeast, Cerophyll, Trout Chow
May 2005 vi
Hydrographic Toxicity Evaluation of Highway Stormwater Runoff
ADA Statement
For individuals with sensory disabilities, this document is available in alternate
format upon request. Please call or write to Mike Farmer, Caltrans Division of
Environmental Analysis, P.O. Box 942874, MS 27, Sacramento, CA 94274-0001.
(916) 653-8896 Voice or dial 711 to use a relay service.
May 2005 vii
Hydrographic Toxicity Evaluation of Highway Stormwater Runoff
EXECUTIVE SUMMARY
A suite of chronic freshwater bioassays was conducted on stormwater runoff samples collected from three highway sites in West Los Angeles near UCLA during six rainstorm events between October 26, 2004 and April 28, 2005. Testing was performed using the water flea, Ceriodaphnia dubia, and the fathead minnow, Pimephales promelas. The cause of observed toxicity was evaluated for the March 18 and April 28, 2005 storm events by performing a series of Toxicity Identification Evaluation (TIE) procedures using both test species.
Testing was performed in support of a long-term hydrographic evaluation of stormwater highway runoff initiated by the California Department of Transportation (the Department). This study is a component of a coordinated effort between Civil and Environmental Engineering at both the University of California Los Angeles (UCLA), and the University of California Davis (UCD). All toxicity tests were performed by Nautilus Environmental, a certified laboratory located in San Diego, California. Stormwater samples were collected at regular intervals from highway storm drains during the first eight hours of each storm event. Five grab samples were collected at 15-minute intervals during the first hour of the storm, followed by as many as seven additional grab samples collected hourly. Flow-weighted composite samples from each site were also tested when sample volume was sufficient.
A summary of primary findings is presented below:
First-Flush Effect and Degree of Toxicity, and Species Relationships
• A majority of sample events exhibited toxicity to both C. dubia and P. promelas in at least some of the grab samples tested at each location.
• A stormwater first-flush effect was almost always observed; with a greater frequency and magnitude of toxicity in the first several grab samples collected during each storm event. Occasionally, toxicity was not related to the first-flush samples. In some cases toxicity occurred in grab samples collected later during a storm with no apparent first-flush effect. In addition, toxicity in some groups of samples from a single location appeared in later grab samples after the effects of a first-flush effect were reduced or disappeared.
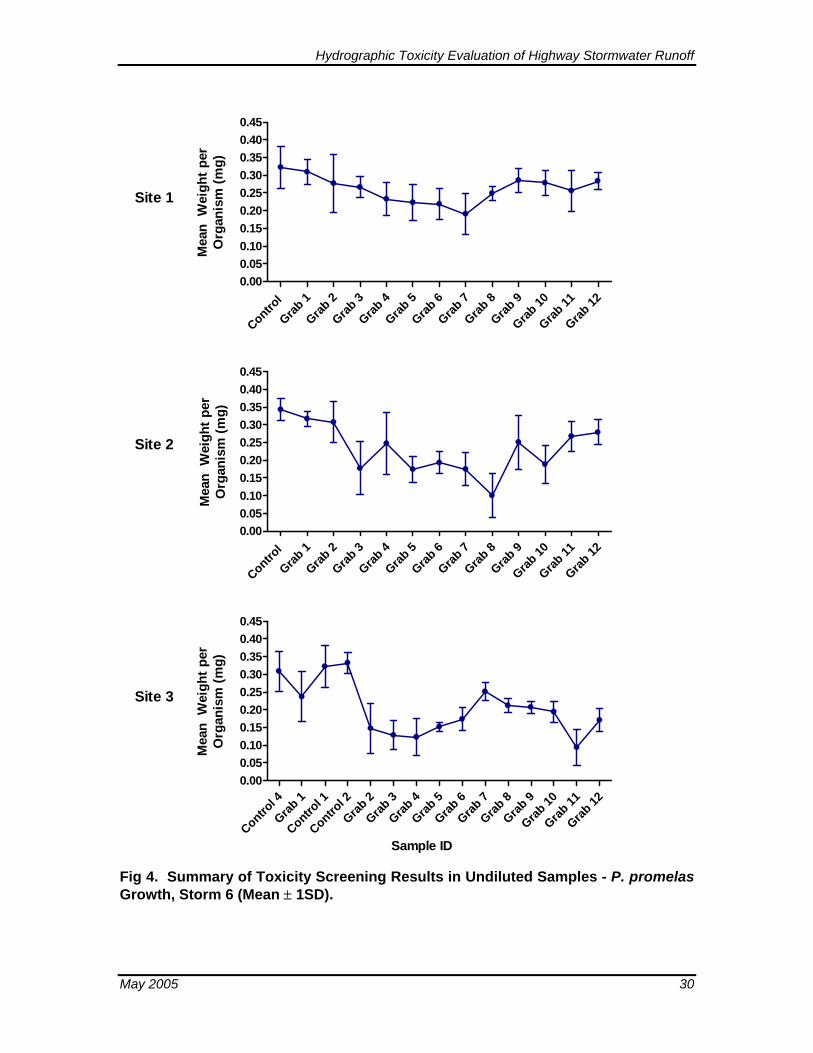
• Toxicity in samples collected after the first hour of each storm was often not correlated between the two test species (e.g. Storm 6, Sites 1,2, and 3). Generally, samples from Site 1 appeared to be the least toxic among the three sites, with samples from Site 2 being the most toxic.
May 2005 1
Hydrographic Toxicity Evaluation of Highway Stormwater Runoff
Toxicity Test Relationships
• P. promelas was more sensitive than C. dubia to most stormwater samples tested. Sublethal endpoints for both test species were most sensitive than survival.
• In some cases, relationships between test species correlate well and, in other cases, very little relation is observed between species.
• A majority of composite samples were non-toxic for both test species even when a strong first-flush effect was observed.
• Toxicity relationships and chemistry data suggest that toxicants of concern may differ depending on when the samples are collected during a storm event.
Major Sources of Toxicity (Storms 8 and 9)
• The Phase I and limited Phase II TIE treatments proved to be very effective at identifying primary classes of compounds and suggesting specific chemicals (primarily copper) responsible for observed toxicity. Additional TIE steps will be required to further identify and confirm toxicants of concern.
• Cationic trace metals are a primary class of compounds of concern in a majority of samples tested.
• A nonpolar organic and/or surfactant was identified as the primary class of compound responsible for toxicity in one sample tested.
• Based on pH-related effects, copper appears to be the primary metal responsible for toxicity to both C. dubia and P. promelas in most samples tested.
• EDTA was consistently less effective at completely reducing toxicity to P. promelas relative to its success for C. dubia. This indicates that some other compound (possibly a surfactant) that is more toxic to P. promelas than C. dubia is causing toxicity in some of the samples. Ammonia was near levels of potential concern but ruled out as a primary toxicant responsible for observed toxicity during the screening tests.
• Evidence suggested that chemicals responsible for toxicity can differ between storm events at the same location.
Screening Test Chemistry versus Toxicity Relationships
• In general, there is agreement between a number of elevated chemical parameters and toxicity, as expected. Overall, however, chemistry and toxicity relationships were rather poor at evaluating cause and effect relationships.
May 2005 2
Hydrographic Toxicity Evaluation of Highway Stormwater Runoff
1. INTRODUCTION
A number of municipalities and state organizations are allocating major resources to ensure that urban runoff from rain events is sufficiently treated to prevent observable impact in the receiving environment. A wide range of constructive Best Management Practices (BMPs) is being implemented to remove organic and inorganic pollutants in order to protect aquatic and terrestrial species in and around receiving waters. The performance of these BMPs is usually measured based on reduction of pollutant concentrations or removal of mass. An alternative approach that is currently applied in some monitoring programs is to base the design and performance of these BMPs on toxicity reduction; a measure of toxicity may provide a more direct measurement of potential receiving water impacts to aquatic organisms. Knowledge of roadway runoff toxicity is therefore essential.
Unfortunately, few studies have been conducted on runoff that is predominantly or exclusively from roadways, and toxicity may vary widely depending on both the source and the type of sample. For example, a study conducted by BASMAA (1996) for roadway runoff as well as other types of urban runoff showed incidences of toxicity to Ceriodaphnia dubia in all sample types. However, toxicity in roadway runoff samples was usually sub-lethal (e.g. reduced reproduction), whereas samples from other land use areas were often acutely toxic (i.e. caused mortality). In contrast, two other toxicity studies conducted by Pitt et al. (1995) and Marsalek et al. (1999) showed greater toxicity in roadway runoff compared to samples from other land uses. Hence, the degree of toxicity in roadway runoff may differ from that in other types of urban runoff.
In addition to variation in the degree of toxicity in different sample types, causes of toxicity also vary. The primary causes of toxicity for roadway runoff in the BASMAA (1996) study were found to be non-polar organics and metallo-organics. Toxicity of runoff from the other studies was perhaps partially due to the presence of deicing chemicals.
This study was specifically undertaken to determine not just the degree and causes of toxicity in highway runoff, but also how toxicity may vary during a storm event. Special emphasis was given to evaluate the toxicity of stormwater runoff during the early stage (first-flush) of the events. Specific objectives of the study were:
1. To evaluate the first-flush effect and degree of toxicity,
2. To determine the major potential sources of toxicity, and
3. To evaluate relationships between chemistry and toxicity data.
May 2005 3
Hydrographic Toxicity Evaluation of Highway Stormwater Runoff
2. MATERIALS AND METHODS
2.1. Test Materials
Three highway sites used as part of this study were the same sites used for the Department First Flush characterization study. These monitoring sites are reported in the Department database as site 7-201, 7-202 and 7-203 and herewith denoted as site 1, 2 and 3, respectively. UCLA personnel collected and transported all stormwater samples to Nautilus Environmental (Nautilus) in San Diego, CA. All bioassay testing was conducted at Nautilus. Sample collection and transport was coordinated by UCLA research team. Each sample collected was identified with a storm number, a site number, and grab number. Samples were sent to Nautilus on the day of collection in 4-L cubitainers held in ice chests. Appropriate chain-of-custody procedures were followed during all phases of sample collection and transport. A summary of sample collection dates, identification, and concentrations tested is provided in Table 1.
Immediately upon arrival at Nautilus, an aliquot of each sample was drawn and the following water quality characteristics were measured and recorded in the laboratory sample check-in log sheet:
• Arrival temperature
• Dissolved oxygen
• pH
• Alkalinity
• Hardness
• Conductivity
Temperature and conductivity were measured using an Orion Model 130 meter. Dissolved oxygen (DO) was measured using a YSI Model 55 meter. An Orion Model 250A+ meter was used to measure pH. Alkalinity and hardness were determined using Hach titrimetric test kits. Immediately after subsampling for the above measurements, the samples were placed in a cold room maintained at 4 ± 2°C.
May 2005 4
Hydrographic Toxicity Evaluation of Highway Stormwater Runoff
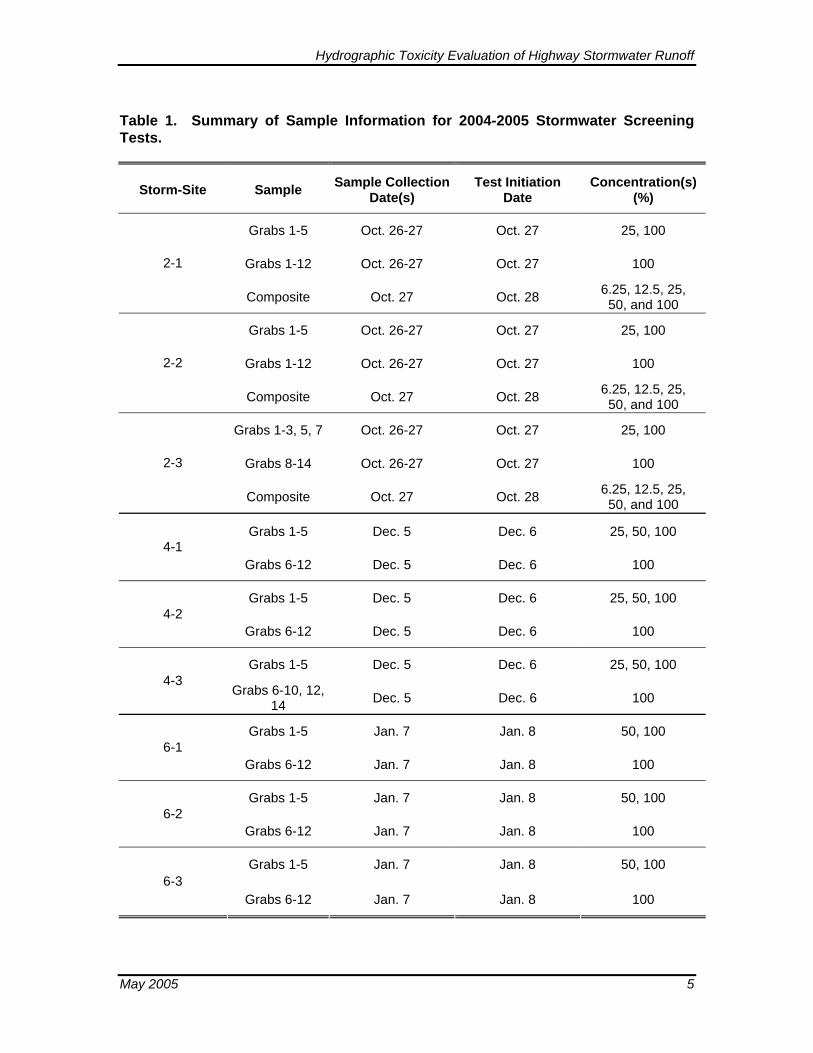
Table 1. Summary of Sample Information for 2004-2005 Stormwater Screening Tests.
Storm-Site Sample Sample Collection Date(s)
Test Initiation Date
Concentration(s) (%)
Grabs 1-5 Oct. 26-27 Oct. 27 25, 100
Grabs 1-12 Oct. 26-27 Oct. 27 100 2-1
Composite Oct. 27 Oct. 28 6.25, 12.5, 25, 50, and 100
Grabs 1-5 Oct. 26-27 Oct. 27 25, 100
Grabs 1-12 Oct. 26-27 Oct. 27 100 2-2
Composite Oct. 27 Oct. 28 6.25, 12.5, 25, 50, and 100
Grabs 1-3, 5, 7 Oct. 26-27 Oct. 27 25, 100
Grabs 8-14 Oct. 26-27 Oct. 27 100 2-3
Composite Oct. 27 Oct. 28 6.25, 12.5, 25, 50, and 100
Grabs 1-5 Dec. 5 Dec. 6 25, 50, 100 4-1
Grabs 6-12 Dec. 5 Dec. 6 100
Grabs 1-5 Dec. 5 Dec. 6 25, 50, 100 4-2
Grabs 6-12 Dec. 5 Dec. 6 100
Grabs 1-5 Dec. 5 Dec. 6 25, 50, 100 4-3
Grabs 6-10, 12, 14 Dec. 5 Dec. 6 100
Grabs 1-5 Jan. 7 Jan. 8 50, 100 6-1
Grabs 6-12 Jan. 7 Jan. 8 100
Grabs 1-5 Jan. 7 Jan. 8 50, 100 6-2
Grabs 6-12 Jan. 7 Jan. 8 100
Grabs 1-5 Jan. 7 Jan. 8 50, 100 6-3
Grabs 6-12 Jan. 7 Jan. 8 100
May 2005 5
Hydrographic Toxicity Evaluation of Highway Stormwater Runoff
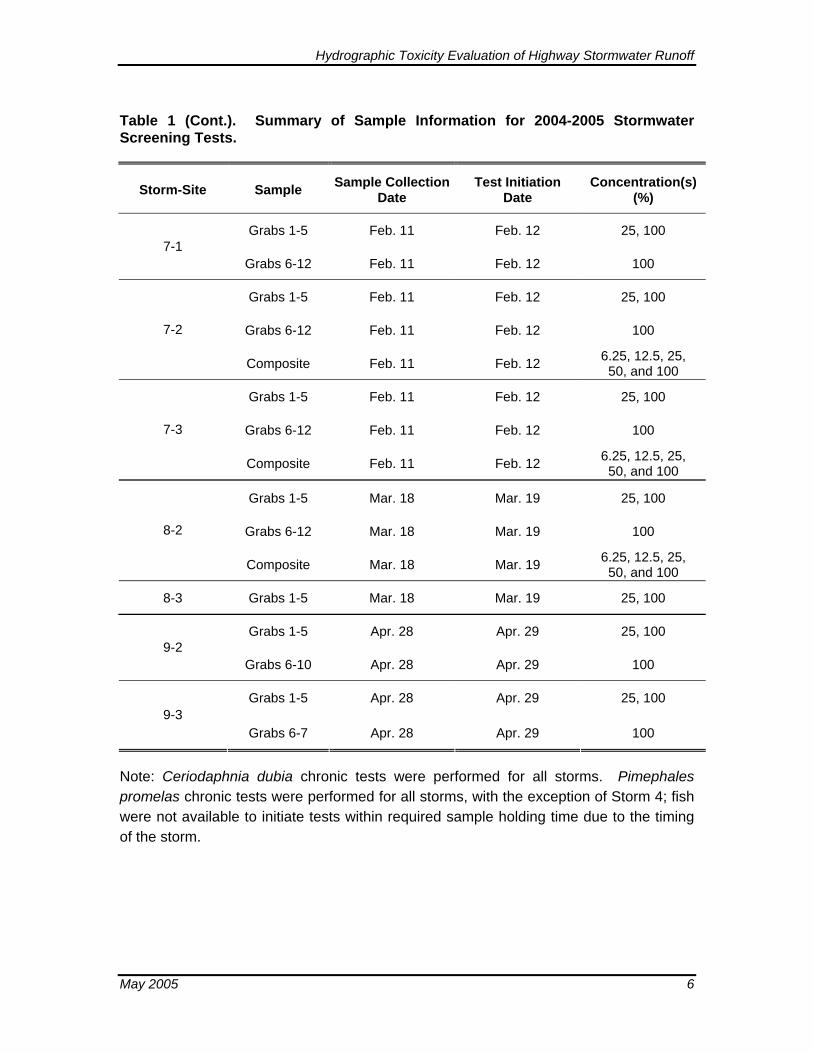
Table 1 (Cont.). Summary of Sample Information for 2004-2005 Stormwater Screening Tests.
Storm-Site Sample Sample Collection Date
Test Initiation Date
Concentration(s) (%)
Grabs 1-5 Feb. 11 Feb. 12 25, 100 7-1
Grabs 6-12 Feb. 11 Feb. 12 100
Grabs 1-5 Feb. 11 Feb. 12 25, 100
Grabs 6-12 Feb. 11 Feb. 12 100 7-2
Composite Feb. 11 Feb. 12 6.25, 12.5, 25, 50, and 100
Grabs 1-5 Feb. 11 Feb. 12 25, 100
Grabs 6-12 Feb. 11 Feb. 12 100 7-3
Composite Feb. 11 Feb. 12 6.25, 12.5, 25, 50, and 100
Grabs 1-5 Mar. 18 Mar. 19 25, 100
Grabs 6-12 Mar. 18 Mar. 19 100 8-2
Composite Mar. 18 Mar. 19 6.25, 12.5, 25, 50, and 100
8-3 Grabs 1-5 Mar. 18 Mar. 19 25, 100
Grabs 1-5 Apr. 28 Apr. 29 25, 100 9-2
Grabs 6-10 Apr. 28 Apr. 29 100
Grabs 1-5 Apr. 28 Apr. 29 25, 100 9-3
Grabs 6-7 Apr. 28 Apr. 29 100
Note: Ceriodaphnia dubia chronic tests were performed for all storms. Pimephales promelas chronic tests were performed for all storms, with the exception of Storm 4; fish were not available to initiate tests within required sample holding time due to the timing of the storm.
May 2005 6
Hydrographic Toxicity Evaluation of Highway Stormwater Runoff
2.2. Organism Procurement and Handling
2.2.1 Pimephales promelas
Fish larvae (1 day old) were purchased from either Aquatic Biosystems, Inc. of Fort Collins, CO or Aquatox, Inc. of Hotsprings, AR. The organisms were placed in plastic bags containing oxygenated culture water, packed in insulted containers, and transported to Nautilus via overnight delivery service. Upon arrival, temperature, pH, DO, and conductivity were measured and recorded in a logbook. Fish larvae condition was also noted. The larvae were then acclimated to test dilution water and temperature, and observed prior to test initiation for any indications of stress (e.g. abnormal swimming behavior) or significant mortality (>10%). Fish larvae were fed Artemia nauplii to satiation during holding.
2.2.2 Ceriodaphnia dubia
Cultures of C. dubia are maintained for use in testing at Nautilus. One week prior to test initiation, neonate (<24 hours old) water fleas were isolated from brood stock cultures and placed in individual holding cups containing clean culture water and food. Neonate selection for continuing culture is based on overall health and reproductive performance of the individuals in the current brood stock culture. Cups containing isolated females were placed in a polypropylene rack and the entire rack was placed in a temperature-controlled room maintained at 25 ± 1°C. Isolated females were transferred daily to cups containing fresh water and food. Neonates produced within the previous 24 hours were selected for testing if produced by individuals that had at least 3 broods of 8 or more neonates each over the course of the previous week.
2.3 Chronic Toxicity Screen Methods
Test conditions and QA/QC requirements for chronic P. promelas and Ceriodaphnia screening tests are summarized in Tables 2 and 3, respectively. Additional method details are provided in the text following the summary tables. Test procedures described below were conducted in accordance with methods published in the EPA document “Short-term Methods for Estimating the Chronic Toxicity of Effluents and Receiving Waters to Freshwater Organisms (EPA-821-R-02-013)” (EPA 2002a).
May 2005 7
Hydrographic Toxicity Evaluation of Highway Stormwater Runoff
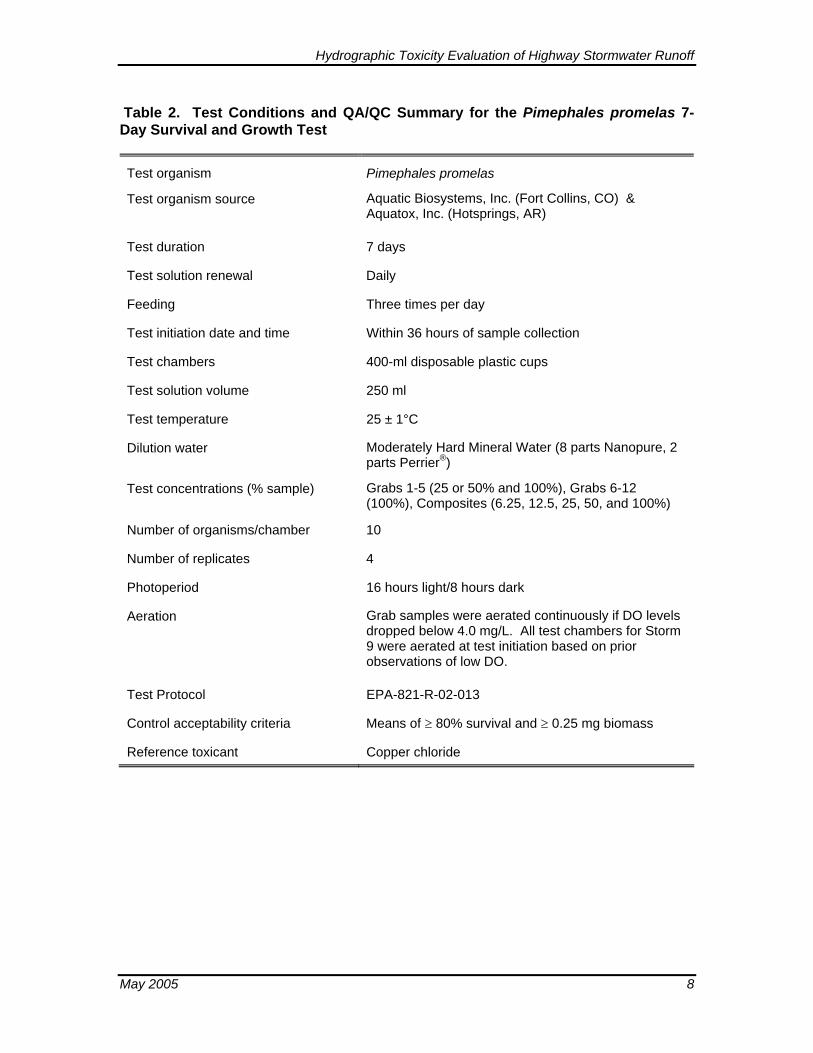
Table 2. Test Conditions and QA/QC Summary for the Pimephales promelas 7-Day Survival and Growth Test
Test organism Pimephales promelas
Test organism source Aquatic Biosystems, Inc. (Fort Collins, CO) & Aquatox, Inc. (Hotsprings, AR)
Test duration 7 days
Test solution renewal Daily
Feeding Three times per day
Test initiation date and time Within 36 hours of sample collection
Test chambers 400-ml disposable plastic cups
Test solution volume 250 ml
Test temperature 25 ± 1°C
Dilution water Moderately Hard Mineral Water (8 parts Nanopure, 2 parts Perrier®)
Test concentrations (% sample) Grabs 1-5 (25 or 50% and 100%), Grabs 6-12 (100%), Composites (6.25, 12.5, 25, 50, and 100%)
Number of organisms/chamber 10
Number of replicates 4
Photoperiod 16 hours light/8 hours dark
Aeration Grab samples were aerated continuously if DO levels dropped below 4.0 mg/L. All test chambers for Storm 9 were aerated at test initiation based on prior observations of low DO.
Test Protocol EPA-821-R-02-013
Control acceptability criteria Means of ≥ 80% survival and ≥ 0.25 mg biomass
Reference toxicant Copper chloride
May 2005 8
Hydrographic Toxicity Evaluation of Highway Stormwater Runoff
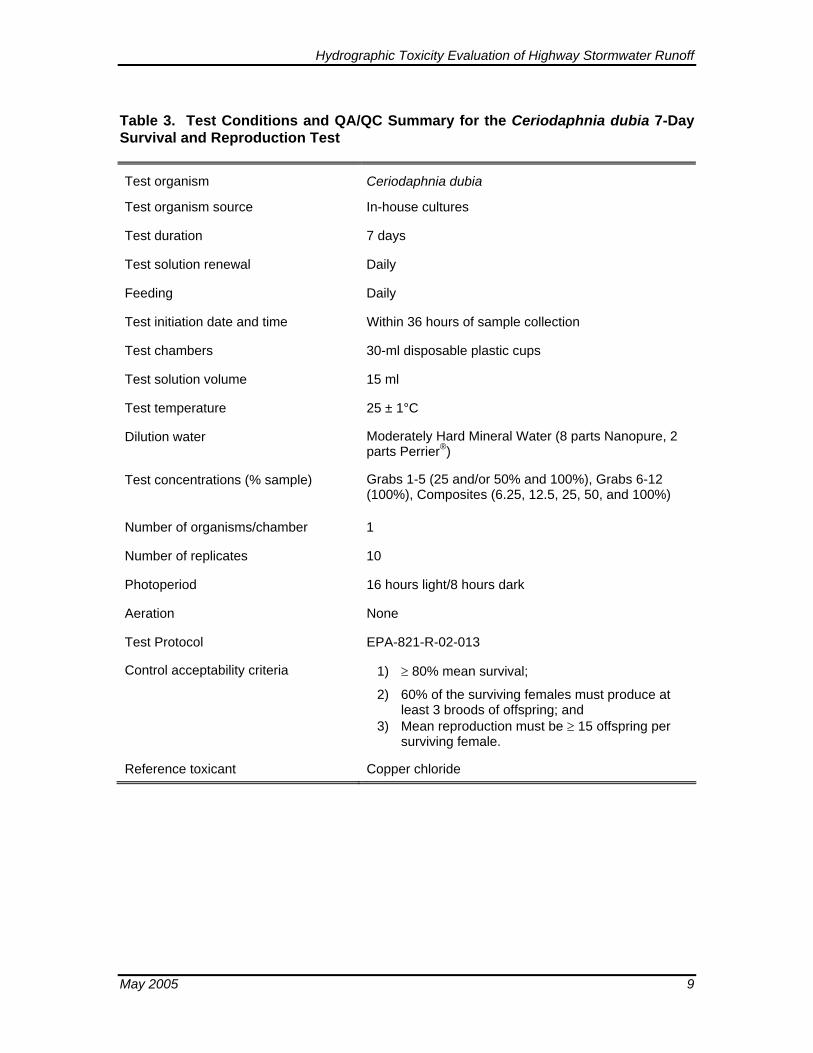
Table 3. Test Conditions and QA/QC Summary for the Ceriodaphnia dubia 7-Day Survival and Reproduction Test
Test organism Ceriodaphnia dubia
Test organism source In-house cultures
Test duration 7 days
Test solution renewal Daily
Feeding Daily
Test initiation date and time Within 36 hours of sample collection
Test chambers 30-ml disposable plastic cups
Test solution volume 15 ml
Test temperature 25 ± 1°C
Dilution water Moderately Hard Mineral Water (8 parts Nanopure, 2 parts Perrier®)
Test concentrations (% sample) Grabs 1-5 (25 and/or 50% and 100%), Grabs 6-12 (100%), Composites (6.25, 12.5, 25, 50, and 100%)
Number of organisms/chamber 1
Number of replicates 10
Photoperiod 16 hours light/8 hours dark
Aeration None
Test Protocol EPA-821-R-02-013
Control acceptability criteria 1) ≥ 80% mean survival;
2) 60% of the surviving females must produce at least 3 broods of offspring; and
3) Mean reproduction must be ≥ 15 offspring per surviving female.
Reference toxicant Copper chloride
May 2005 9
Hydrographic Toxicity Evaluation of Highway Stormwater Runoff
2.3.1 Pimephales promelas 7-Day Survival and Growth
This test estimates chronic toxicity by evaluating the survival and growth of larval fathead minnows over time. Larval fish (one day old at test initiation) were exposed to the samples for a period of seven days.
Test solutions were prepared using graduated cylinders and pipettes. Measurements of pH, DO, temperature, and conductivity were measured and recorded for each sample and control. Four replicate test chambers were prepared for each sample and control. Replicates consisted of 400-ml plastic cups containing 250 ml of test solution. Test solutions were acclimated to 25°C in a temperature-controlled environmental chamber prior to initiation.
Ten fish larvae were arbitrarily added to each test chamber. A second technician verified counts and condition of all test organisms before and after addition of the larvae to test chambers. A 16:8 hour light:dark illumination cycle was provided for the duration of the test. Test chambers were covered with a clear plexiglass sheet to prevent test solution contamination.
A number of grab sample test chambers were aerated at 24 hours and thereafter due to a rapid drop in DO to values less than 4.0 mg/L. Aeration was performed at a rate of approximately one to two bubbles per second through Tygon® microbore plastic tubing. Samples that required aeration are identified on the raw bench datasheets in Appendix D. All test chambers for Storm 9 were aerated at test initiation based on prior observations of low DO.
Test solutions were renewed once per day, and organisms were fed Artemia nauplii three times per day. Temperature, pH, DO, and conductivity were measured daily in both freshly prepared test renewal solution, and test solution collected from the test chambers for each concentration and control. Survival status was recorded for organisms in each test chamber once per day. At test termination, final observations were made and test animals were prepared for weight determination.
Fish weights were determined by placing fish from each test chamber on individual tared aluminum pans and drying them in an oven at 60°C for 24 hours. After drying, fish were weighed on a Mettler 240AE balance to the nearest 0.01 mg.
Concurrent positive control reference toxicant tests were conducted as a measure of consistent organism sensitivity, as well as continuing laboratory proficiency with the method. Nominal concentrations of 240, 120, 60, 30, 15, and 0 µg/L copper (II) chloride (as copper) were prepared and tested. The LC50/EC50 values were compared to historical values obtained at Nautilus (Appendix G).
May 2005 10
Hydrographic Toxicity Evaluation of Highway Stormwater Runoff
2.3.2 Ceriodaphnia dubia 7-Day Survival and Reproduction
This test estimates chronic toxicity by evaluating survival and reproduction of individual water fleas over time. Water fleas (<24 hours old at test initiation) were exposed to the samples for a period of seven days.
Test solutions were prepared using graduated cylinders and pipettes. A diet of yeast, cerophyll, trout chow (YCT) and Selenastrum suspension was added to each test sample and control prior to distribution to test chambers. Measurements of pH, DO, temperature, and conductivity were measured and recorded for each sample and control. Ten replicate test chambers were prepared for each sample and control. Replicates consisted of 30-ml disposable plastic cups containing 15 ml of test solution. Test solutions were acclimated to 25°C in a temperature-controlled environmental chamber prior to initiation.
Test solutions were renewed, and organisms were fed once per day. Temperature, pH, DO, and conductivity were measured daily in both freshly prepared test renewal solution, and test solution collected from the test chambers for each sample and control. Survival status and reproductive output were recorded for each organism once per day. At test termination, final observations were made, water quality measurements taken, and test solution and organisms discarded.
Concurrent positive control reference toxicant tests were conducted as a measure of consistent organism sensitivity, as well as continuing laboratory proficiency with the method. Nominal concentrations of 200, 100, 50, 25, 12.5, and 0 µg/L copper (II) chloride (as copper) were prepared and tested. LC50 and IC50 values were compared to historical values obtained at Nautilus.
2.4 TIE Test Procedures
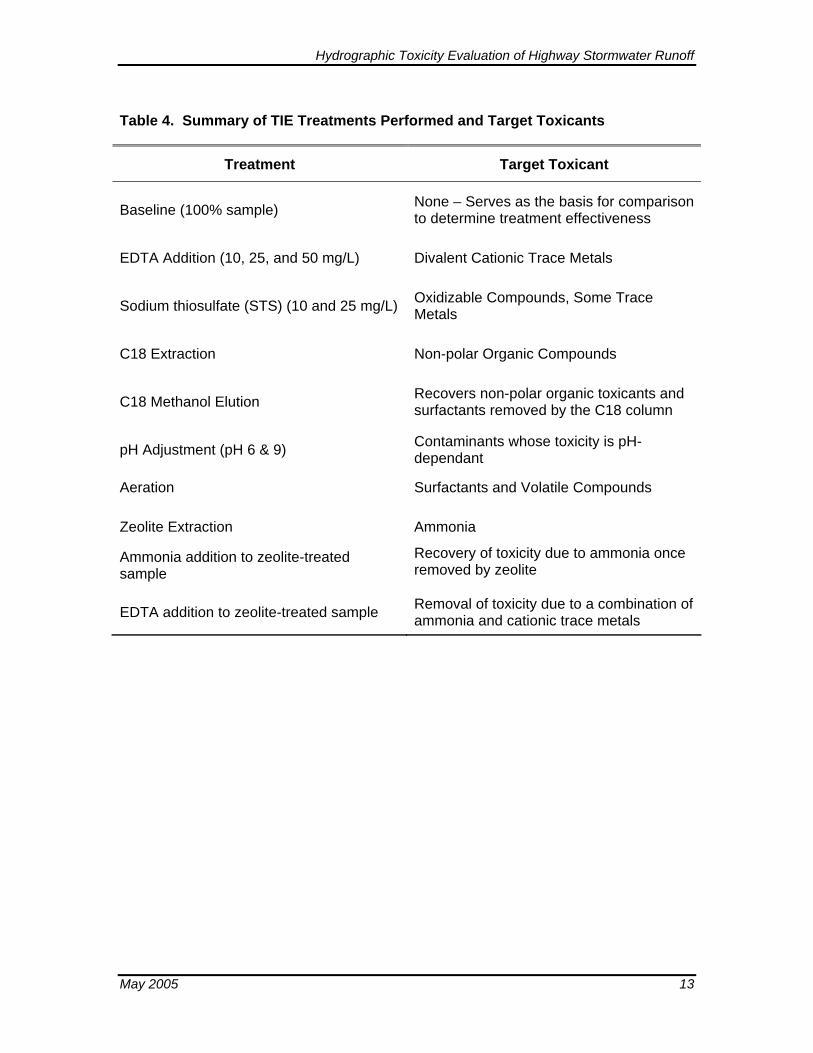
Methods generally followed EPA published methods including: 1) “Methods for Aquatic Toxicity Identification Evaluation - Phase I Toxicity Characterization Procedures, Second Edition (EPA/600/6-91/003)” (EPA 1991); 2) “Methods for Aquatic Toxicity Identification Evaluations - Phase II Toxicity Identification Procedures for Samples Exhibiting Acute and Chronic Toxicity (EPA/600/R-92/080)” (EPA 1993a); and 3) “Methods for Aquatic Toxicity Identification Evaluations - Phase III Toxicity Confirmation Procedures for Samples Exhibiting Acute and Chronic Toxicity (EPA/600/R-92/081)” (EPA 1993b). Descriptions of each TIE treatment used in this study are discussed below, and summarized in Table 4.
Grab samples that exhibited acute toxicity during the first hour of the storm in the screening tests (Grabs 1-5) were selected for TIEs. Due to limited sample volumes, TIE procedures were performed on select individual grab samples, as well as equal volume composite samples created from remaining Grab 1 through 5 samples. Treatments May 2005 11
Hydrographic Toxicity Evaluation of Highway Stormwater Runoff
were performed on full-strength sample, and in some instances, 50 percent dilutions. A complete summary of stormwater samples tested and TIE methodologies applied is provided in Table 5.
Effectiveness of the TIE procedures was evaluated using 96-hour P. promelas and C. dubia acute survival exposures. Acute test methodology followed that published in “Methods for Measuring the Acute Toxicity of Effluents and Receiving Waters to Freshwater and Marine Organisms (821-R-02-12),” (EPA 2002b) and is summarized in Tables 6 and 7 for P. promelas and C. dubia, respectively.
May 2005 12
Hydrographic Toxicity Evaluation of Highway Stormwater Runoff
Table 4. Summary of TIE Treatments Performed and Target Toxicants
Treatment Target Toxicant
Baseline (100% sample) None – Serves as the basis for comparison to determine treatment effectiveness
EDTA Addition (10, 25, and 50 mg/L) Divalent Cationic Trace Metals
Sodium thiosulfate (STS) (10 and 25 mg/L) Oxidizable Compounds, Some Trace Metals
C18 Extraction Non-polar Organic Compounds
C18 Methanol Elution Recovers non-polar organic toxicants and surfactants removed by the C18 column
pH Adjustment (pH 6 & 9) Contaminants whose toxicity is pH-dependant
Aeration Surfactants and Volatile Compounds
Zeolite Extraction Ammonia
Ammonia addition to zeolite-treated sample
Recovery of toxicity due to ammonia once removed by zeolite
EDTA addition to zeolite-treated sample Removal of toxicity due to a combination of ammonia and cationic trace metals
May 2005 13
Hydrographic Toxicity Evaluation of Highway Stormwater Runoff
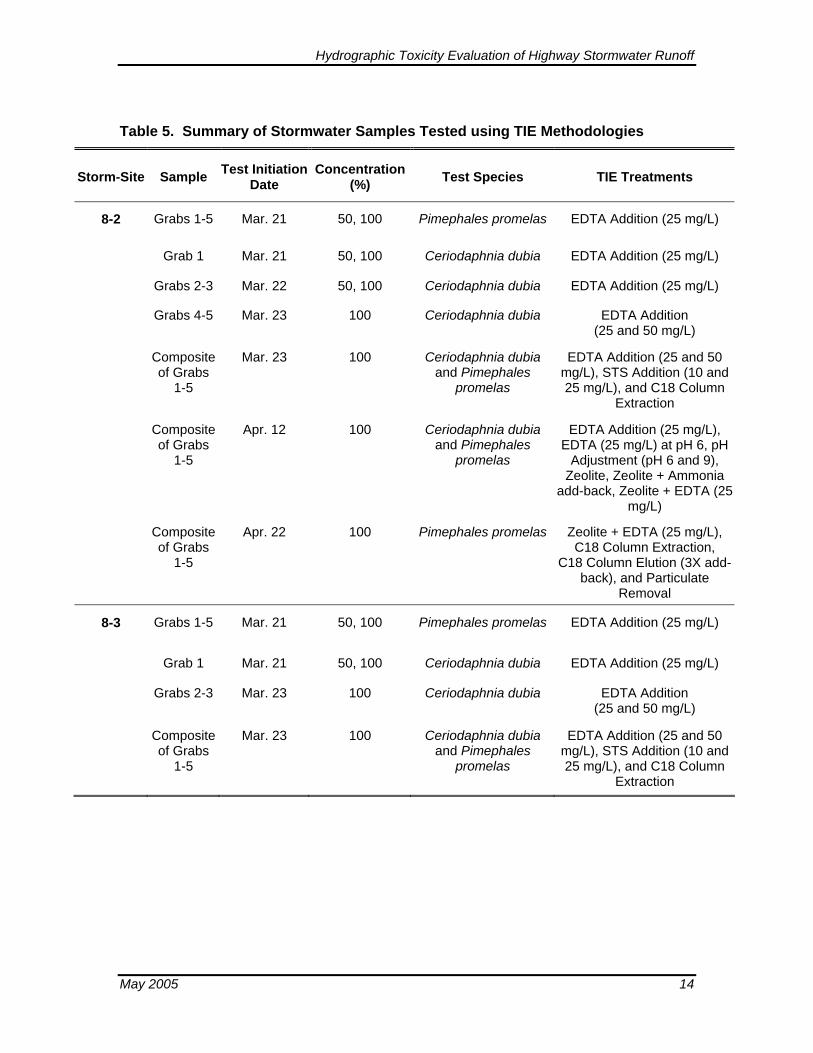
Table 5. Summary of Stormwater Samples Tested using TIE Methodologies
Storm-Site Sample Test Initiation Date
Concentration (%) Test Species TIE Treatments
8-2 Grabs 1-5 Mar. 21 50, 100 Pimephales promelas EDTA Addition (25 mg/L)
Grab 1 Mar. 21 50, 100 Ceriodaphnia dubia EDTA Addition (25 mg/L)
Grabs 2-3 Mar. 22 50, 100 Ceriodaphnia dubia EDTA Addition (25 mg/L)
Grabs 4-5 Mar. 23 100 Ceriodaphnia dubia EDTA Addition (25 and 50 mg/L)
Composite of Grabs
1-5
Mar. 23 100 Ceriodaphnia dubia and Pimephales
promelas
EDTA Addition (25 and 50 mg/L), STS Addition (10 and 25 mg/L), and C18 Column
Extraction
Composite of Grabs
1-5
Apr. 12 100 Ceriodaphnia dubia and Pimephales
promelas
EDTA Addition (25 mg/L), EDTA (25 mg/L) at pH 6, pH
Adjustment (pH 6 and 9), Zeolite, Zeolite + Ammonia
add-back, Zeolite + EDTA (25 mg/L)
Composite of Grabs
1-5
Apr. 22 100 Pimephales promelas Zeolite + EDTA (25 mg/L), C18 Column Extraction,
C18 Column Elution (3X add-back), and Particulate
Removal
8-3 Grabs 1-5 Mar. 21 50, 100 Pimephales promelas EDTA Addition (25 mg/L)
Grab 1 Mar. 21 50, 100 Ceriodaphnia dubia EDTA Addition (25 mg/L)
Grabs 2-3 Mar. 23 100 Ceriodaphnia dubia EDTA Addition (25 and 50 mg/L)
Composite of Grabs
1-5
Mar. 23 100 Ceriodaphnia dubia and Pimephales
promelas
EDTA Addition (25 and 50 mg/L), STS Addition (10 and 25 mg/L), and C18 Column
Extraction
May 2005 14
Hydrographic Toxicity Evaluation of Highway Stormwater Runoff
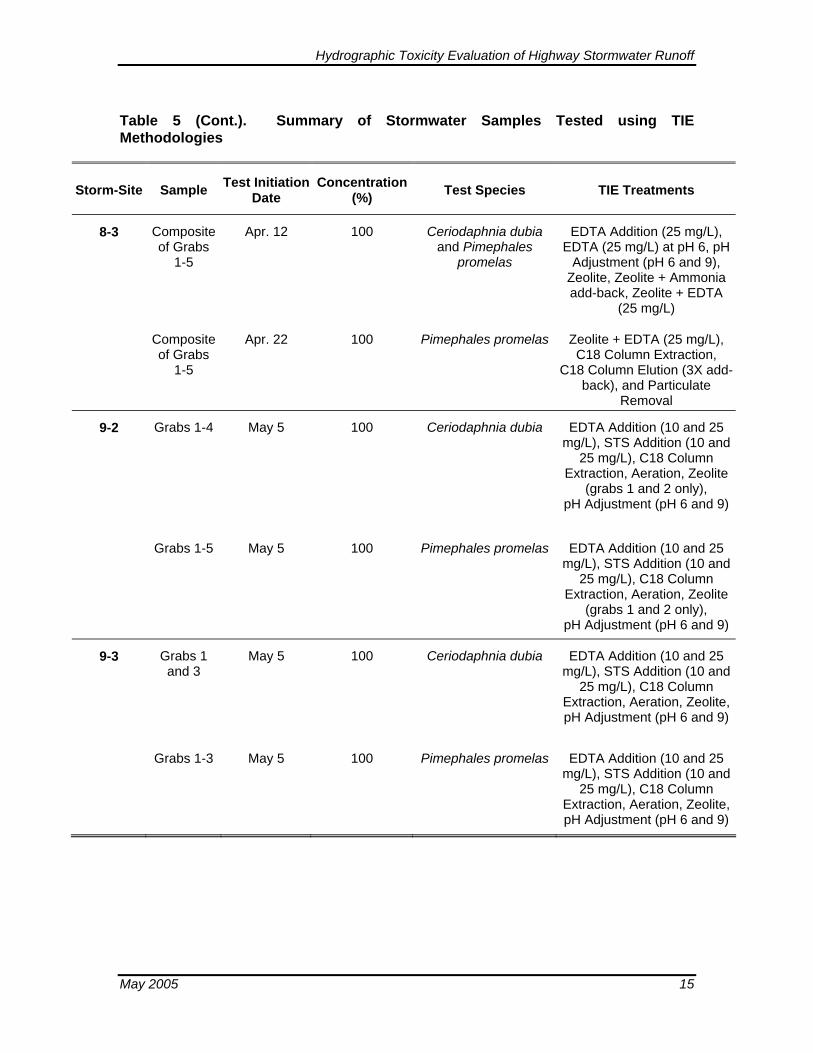
Table 5 (Cont.). Summary of Stormwater Samples Tested using TIE Methodologies
Storm-Site Sample Test Initiation Date
Concentration (%) Test Species TIE Treatments
8-3 Composite of Grabs
1-5
Apr. 12 100 Ceriodaphnia dubia and Pimephales
promelas
EDTA Addition (25 mg/L), EDTA (25 mg/L) at pH 6, pH
Adjustment (pH 6 and 9), Zeolite, Zeolite + Ammonia add-back, Zeolite + EDTA
(25 mg/L)
Composite of Grabs
1-5
Apr. 22 100 Pimephales promelas Zeolite + EDTA (25 mg/L), C18 Column Extraction,
C18 Column Elution (3X add-back), and Particulate
Removal
9-2 Grabs 1-4 May 5 100 Ceriodaphnia dubia EDTA Addition (10 and 25 mg/L), STS Addition (10 and
25 mg/L), C18 Column Extraction, Aeration, Zeolite
(grabs 1 and 2 only), pH Adjustment (pH 6 and 9)
Grabs 1-5 May 5 100 Pimephales promelas EDTA Addition (10 and 25 mg/L), STS Addition (10 and
25 mg/L), C18 Column Extraction, Aeration, Zeolite
(grabs 1 and 2 only), pH Adjustment (pH 6 and 9)
9-3 Grabs 1 and 3
May 5 100 Ceriodaphnia dubia EDTA Addition (10 and 25 mg/L), STS Addition (10 and
25 mg/L), C18 Column Extraction, Aeration, Zeolite, pH Adjustment (pH 6 and 9)
Grabs 1-3 May 5 100 Pimephales promelas EDTA Addition (10 and 25 mg/L), STS Addition (10 and
25 mg/L), C18 Column Extraction, Aeration, Zeolite, pH Adjustment (pH 6 and 9)
May 2005 15
Hydrographic Toxicity Evaluation of Highway Stormwater Runoff
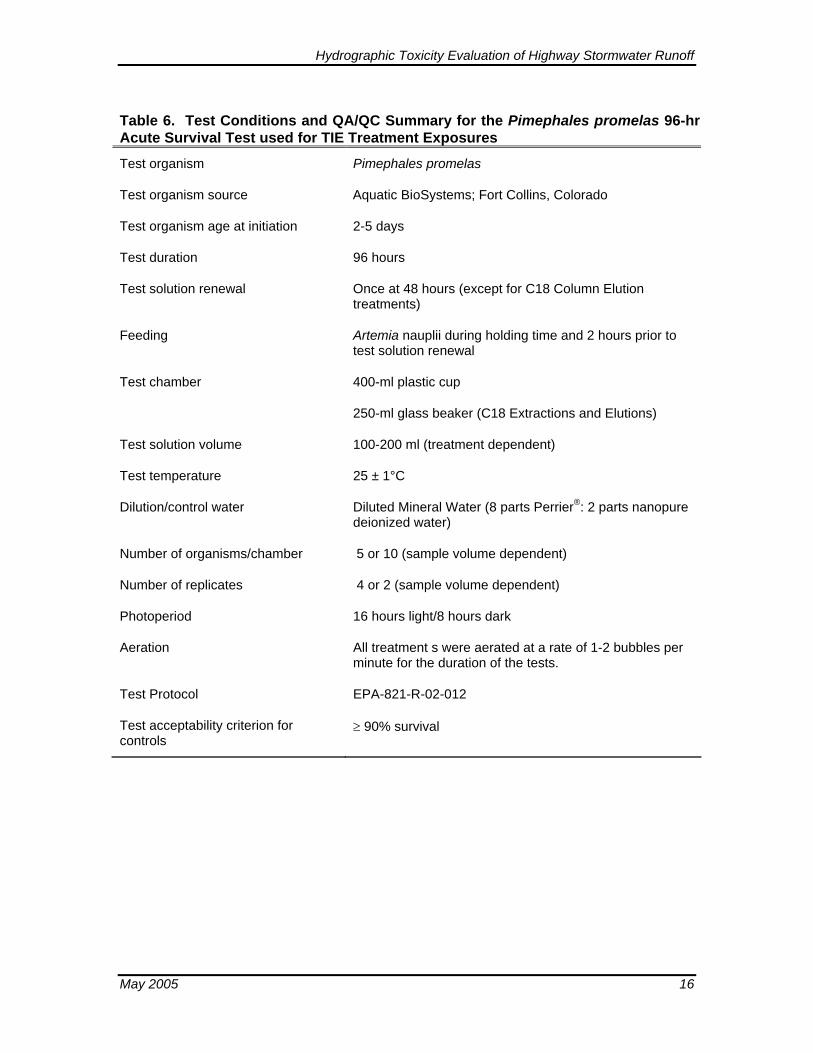
Table 6. Test Conditions and QA/QC Summary for the Pimephales promelas 96-hr Acute Survival Test used for TIE Treatment Exposures
Test organism Pimephales promelas
Test organism source Aquatic BioSystems; Fort Collins, Colorado
Test organism age at initiation 2-5 days
Test duration 96 hours
Test solution renewal Once at 48 hours (except for C18 Column Elution treatments)
Feeding Artemia nauplii during holding time and 2 hours prior to test solution renewal
Test chamber 400-ml plastic cup
250-ml glass beaker (C18 Extractions and Elutions)
Test solution volume 100-200 ml (treatment dependent)
Test temperature 25 ± 1°C
Dilution/control water Diluted Mineral Water (8 parts Perrier®: 2 parts nanopure deionized water)
Number of organisms/chamber 5 or 10 (sample volume dependent)
Number of replicates 4 or 2 (sample volume dependent)
Photoperiod 16 hours light/8 hours dark
Aeration All treatment s were aerated at a rate of 1-2 bubbles per minute for the duration of the tests.
Test Protocol EPA-821-R-02-012
Test acceptability criterion for controls
≥ 90% survival
May 2005 16
Hydrographic Toxicity Evaluation of Highway Stormwater Runoff
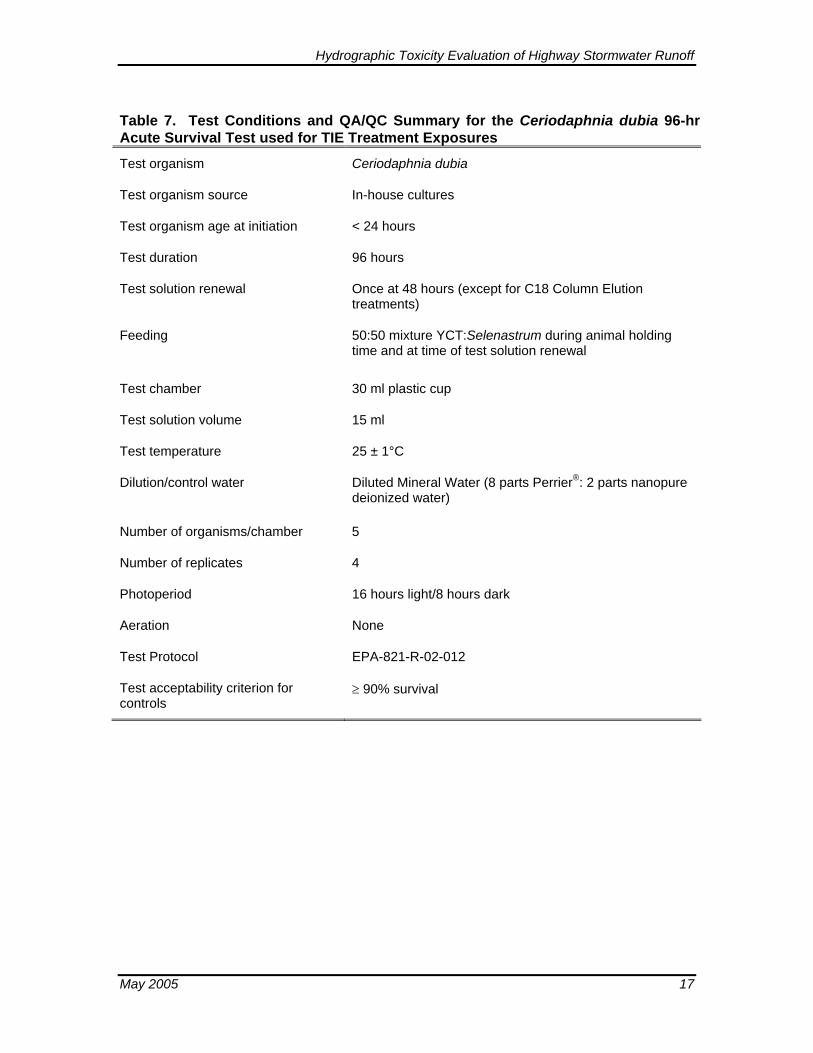
Table 7. Test Conditions and QA/QC Summary for the Ceriodaphnia dubia 96-hr Acute Survival Test used for TIE Treatment Exposures
Test organism Ceriodaphnia dubia
Test organism source In-house cultures
Test organism age at initiation < 24 hours
Test duration 96 hours
Test solution renewal Once at 48 hours (except for C18 Column Elution treatments)
Feeding 50:50 mixture YCT:Selenastrum during animal holding time and at time of test solution renewal
Test chamber 30 ml plastic cup
Test solution volume 15 ml
Test temperature 25 ± 1°C
Dilution/control water Diluted Mineral Water (8 parts Perrier®: 2 parts nanopure deionized water)
Number of organisms/chamber 5
Number of replicates 4
Photoperiod 16 hours light/8 hours dark
Aeration None
Test Protocol EPA-821-R-02-012
Test acceptability criterion for controls
≥ 90% survival
May 2005 17
Hydrographic Toxicity Evaluation of Highway Stormwater Runoff
2.4.1 Baseline
Baseline tests were performed on undiluted samples and 50% dilutions in some instances. Baseline testing was performed concurrent to all TIE manipulations and served as a basis to evaluate the effectiveness of the different TIE treatments.
2.4.2 EDTA Metal Chelation
The addition of ethylenediaminetetraacetic acid (EDTA) was used to determine the extent of toxicity attributable to divalent cationic trace metals (EPA 1991). EDTA chelates (i.e. tightly binds to molecular structure) cationic trace metals, thereby reducing their bioavailability.
EDTA was added to the method control and test samples at an exposure concentration of 25 mg/L. Several samples were also tested concurrently with 10 and 50 mg/L EDTA for comparison. The concentrations of EDTA used were below levels found to cause acute toxicity to fathead minnows and C. dubia, and should have provided sufficient capacity to bind available metals in the effluent based on the hardness of the samples.
2.4.3 Oxidant Reduction
This test was performed to determine whether effluent constituents, reduced by the addition of sodium thiosulfate (STS), were associated with observed toxicity. This procedure provides valuable information about chlorine toxicity. The addition of STS may also neutralize the toxicity of other chemicals used as disinfection agents (such as ozone and chloride), as well as chemicals formed during chlorination (mono and dichloramines), bromine, iodine, manganous ions, and some electrophilic organic chemicals. The toxicity of some cationic metals may also be reduced by the addition of STS (EPA 1991).
STS was added to the method controls and samples at exposure concentrations of 10 and 25 mg/L.
2.4.4 C18 Solid-Phase Extraction (SPE)
Solid-phase extraction (SPE) with a C18 column was used to determine the extent of toxicity associated with nonpolar organic compounds. It has been found that C18 columns also have the ability to remove some metal chelates (EPA 1991). Three ml capacity Supelco brand columns were used for this procedure. Approximately 1-L of sample and control water were passed through the columns as described in the test protocol. Post-extraction C18 columns were labeled, wrapped in an airtight resealable bag, and placed in a freezer at -10°C for potential subsequent Phase II testing.
May 2005 18
Hydrographic Toxicity Evaluation of Highway Stormwater Runoff
2.4.5 C18 Column Methanol Elutions
Non-polar organic compounds bound to C18 columns can be removed from the columns using methanol. This was performed by drawing 2 ml of 100% methanol through the columns using a peristaltic pump set at an approximate flow rate of 1 ml per minute. Extracts were collected into 2-ml amber glass Voa® vials.
The methanol extracts were then added to clean dilution water at concentrations that were 3 times that of the original stormwater sample. Concurrent method controls consisted of: 1) methanol extract passed through a clean C18 column; and 2) a methanol control equivalent to the highest concentration of methanol achieved in the tested fractions.
2.4.6 Aeration Treatment
The aeration test is designed to determine the degree of effluent toxicity attributable to volatile, sublatable, or oxidizable compounds (EPA 1991). Sublatable compounds include surface-active compounds such as resin acids, soaps, detergents, charged stabilization polymers, and coagulation polymers used in chemical manufacturing processes. The same procedure was conducted using laboratory water as a method control. To perform this treatment, 800 ml of test sample was vigorously aerated with a glass air stone in a 1-L glass graduated cylinder for one hour.
2.4.7 Graduated pH Adjustment
The toxicity of many compounds found in effluents is substantially affected by pH. Changes in pH may affect the solubility, stability, volatility, polarity, and speciation of many compounds (EPA 1991). Ammonia is a common toxicant of concern that increases in toxicity as pH increases.
Three pH treatments were tested on several samples: 1) the initial sample pH (baseline test); 2) pH 6 adjusted sample; and 3) pH 9 adjusted sample. Both sample and laboratory dilution water were pH adjusted with 0.1 N solutions of hydrochloric acid (HCl) or sodium hydroxide (NaOH) as described in the test protocol.
2.4.8 Zeolite Extraction
Ammonia was removed from the sample by gravity filtration of 1 L of sample through a Teflon separatory funnel filled with aquarium-grade zeolite at a rate of approximately 5 ml per minute. In addition to ammonia removal, zeolite also has the ability to remove particulates, surfactants, and some cationic trace metals (EPA 1993b).
To further evaluate zeolite’s effect on trace metals, pre- and post-zeolite extracted samples from Storm 8, Site 2 & 3 composites (an combination of equal volumes of each
May 2005 19
Hydrographic Toxicity Evaluation of Highway Stormwater Runoff
of the first 5 grabs from each site) were analyzed for a suite of cationic metals by Calscience Environmental Laboratories (CEL) located in Garden Grove, CA.
2.4.9 Post-Zeolite Ammonia Spikes
As an additional confirmation step, an attempt to recover toxicity following the zeolite treatment was performed by adding ammonia back to the post-zeolite effluent to the level measured in the original baseline sample. Ammonia was spiked into post-zeolite treated samples in an attempt to recover toxicity due to ammonia. This procedure provides an estimate of the proportion of toxicity removed by zeolite that is actually due to ammonia rather than some other constituent.
2.4.10 Post-Zeolite EDTA Addition
The combined contribution of toxicity of ammonia and cationic trace metals in several samples was evaluated by adding EDTA at a concentration of 25 mg/L to the post-zeolite extracted sample.
2.5 Analytical Chemistry
Due to their prevalence in stormwater runoff, surfactants were measured by analyzing methylene blue activated substances (MBAS) in the first five grab samples from Storms 8 and 9. MBAS includes a common group of surfactants known as linear alkyl sulfonates (LAS). Surfactants were analyzed by CEL following EPA Method 425.1.
UCLA provided results for analysis of turbidity, chemical oxygen demand (COD), dissolved organic carbon (DOC), oil and grease, ammonia, nitrite, nitrate, and a suite of dissolved trace metals for inclusion in this report.
In addition to analyses performed at UCLA, total ammonia was measured at Nautilus in a number of the samples for which TIE treatments were performed. Analyses were performed using the Hach colorimetric “Test ‘N Tube” Salicylate Method 10031 and a Hach DR2000 spectrophotometer. The Hach method cited is an EPA-accepted procedure equivalent to EPA Method 350.2. Concentrations of un-ionized ammonia were calculated using methods described in Hampson (1977). The un-ionized form of ammonia is the fraction most closely associated with toxicity to fish species (Thurston and Russo 1981).
May 2005 20
Hydrographic Toxicity Evaluation of Highway Stormwater Runoff
2.6 Statistical Analyses
Stormwater and reference toxicant data were analyzed using CETISTM Comprehensive Environmental Toxicity Information System and Database Software, Version 1.025B. Statistical differences from the control and No Observed Effect Concentrations (NOEC) were determined for each test using Dunnett’s, Wilcoxon Rank Sum, Steel’s Many-One Rank, or Fisher’s Exact Multiple Comparisons Tests. Median Lethal Concentration (LC50) or Median Effect Concentration (EC50) values were calculated for freshwater reference toxicant bioassays using Maximum Likelihood Probit, Trimmed Spearman-Karber, or Linear Interpolation Analyses. The choice of statistical method was dependent upon specific model assumptions met or not met by the data as addressed in EPA (2002a and 2002b).
The relationship between toxicological endpoints determined by Nautilus and various chemical data provided by UCLA was evaluated by performing Spearman Rank correlation analyses. Prior to this analysis, proportion data was arcsine square-root transformed and chemistry data was log transformed to normalize data distributions. These analyses were performed using Microsoft® Excel 2000. However, it is important to note that trace metal concentrations for only the first five storms were included, as concentrations for Storm 9 were not available at the time of this report. Remaining trace metal data will be included in correlation analysis in the final project report at a later date.
Best-fit regressions using a one-phase exponential decay model were used to graphically display relationships between toxicity endpoints and several chemical parameters. Regression analyses were performed using GraphPad Statistical Software Version 4.02.
May 2005 21
Hydrographic Toxicity Evaluation of Highway Stormwater Runoff
3. RESULTS AND DISCUSSION
3.1 Stormwater Screening Tests
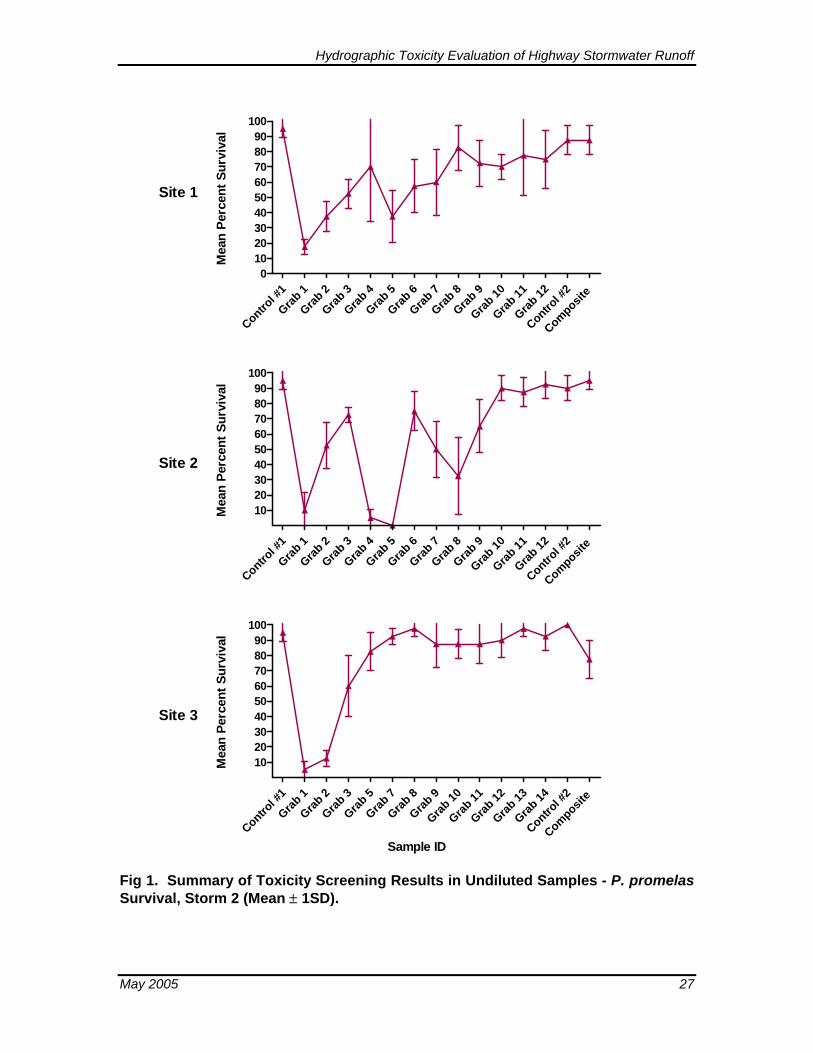
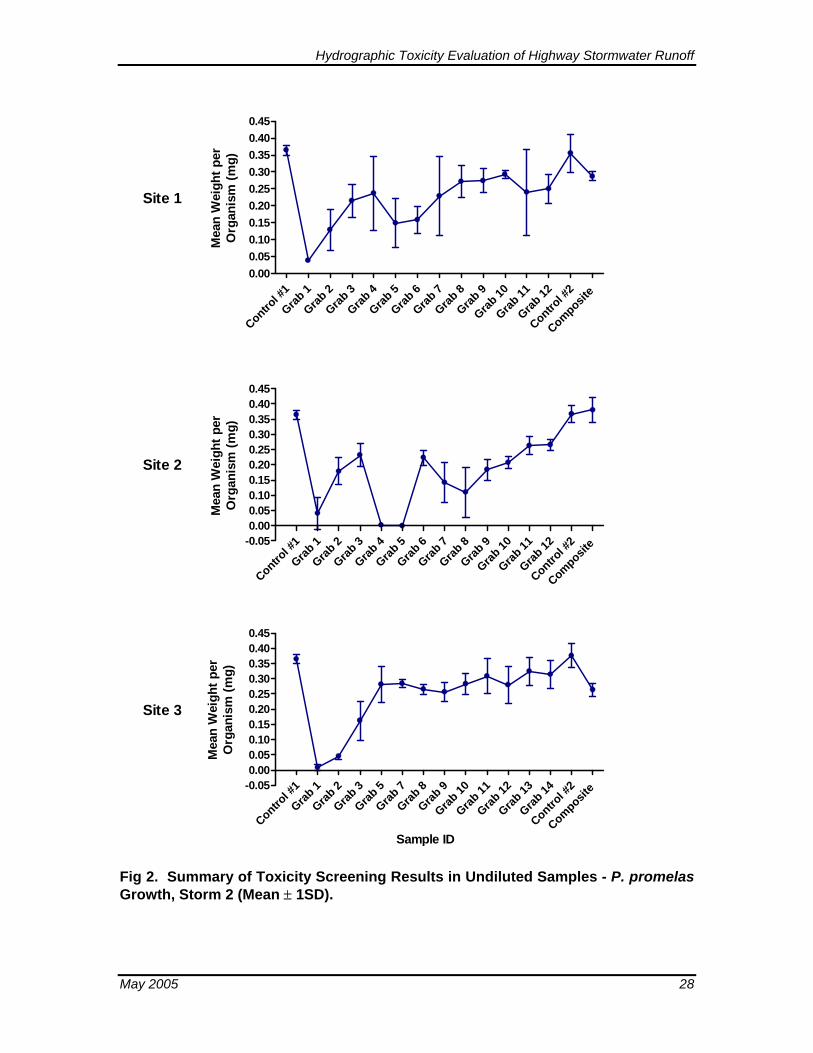
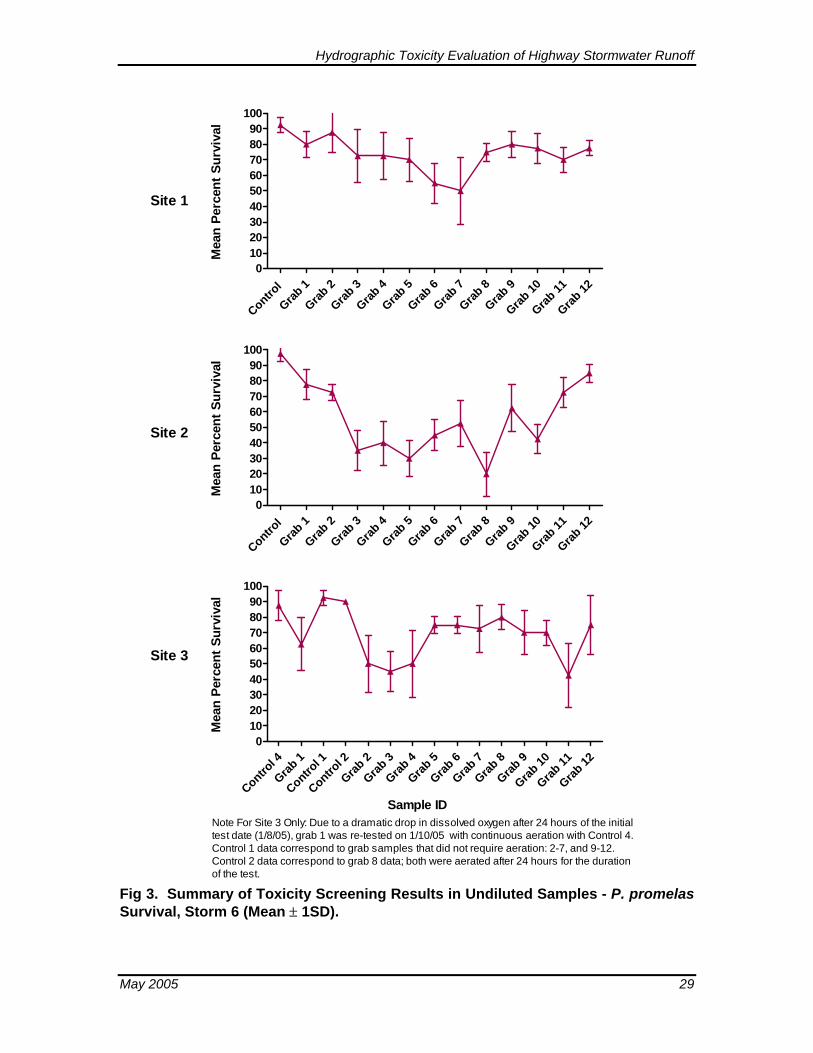
Summaries of mean toxicity screening results for all storms, sites, and samples are provided in Figures 1 through 10 for P. promelas, and Figures 11 through 16 for C. dubia. Point estimate LC and EC50 values for grab samples 1 through 5 for each site are summarized in Figures 17 through 19 and 20 through 22 for P. promelas and C. dubia, respectively.
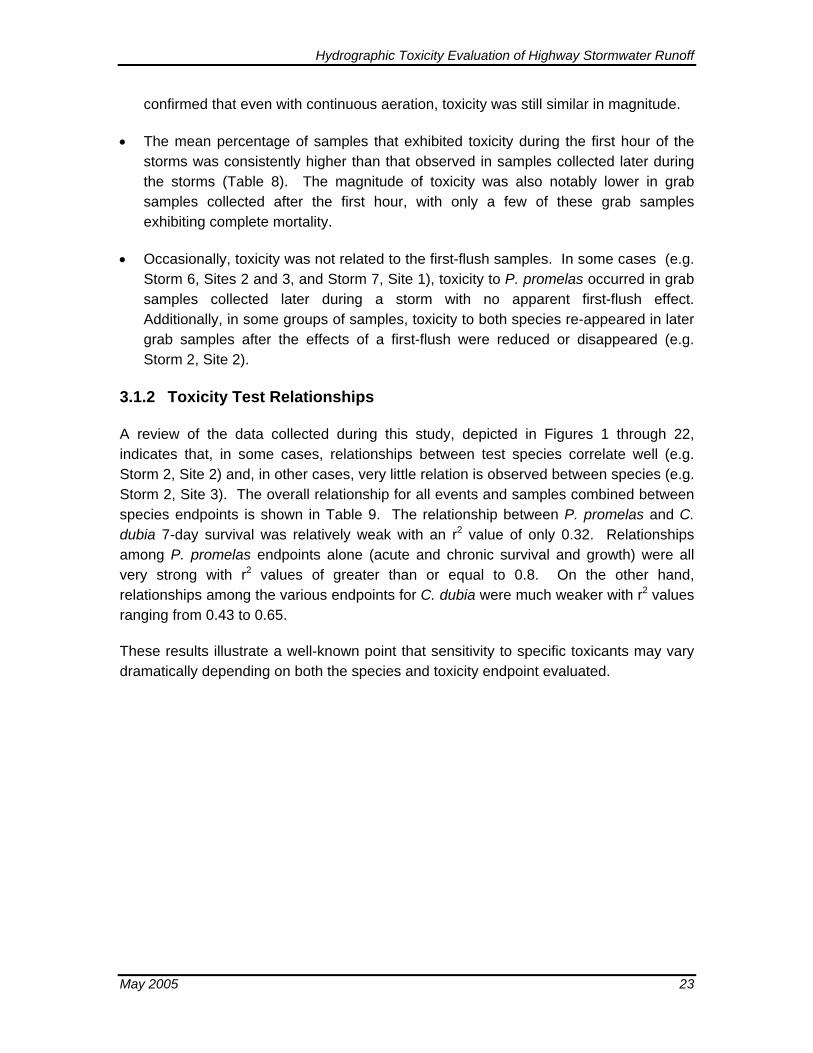
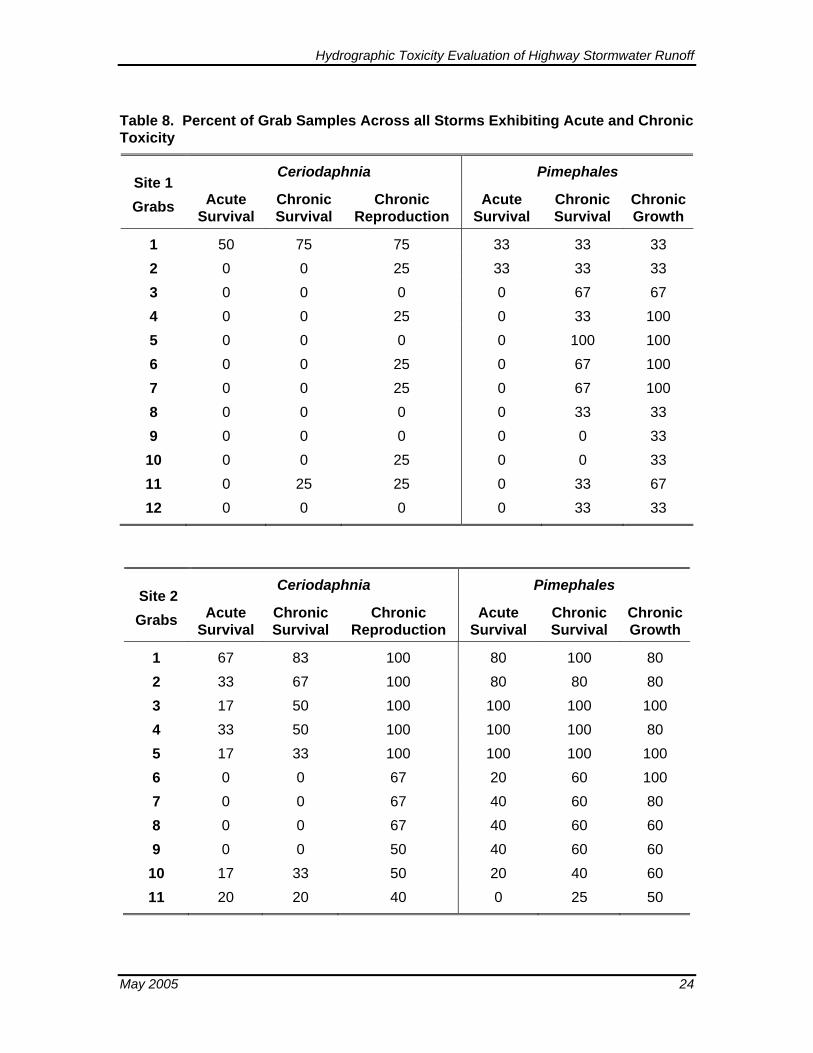
All storms tested (6 events at 2 or 3 locations) had a number of grab samples that were toxic to P. promelas, C. dubia, or both species. Only one set of samples from Storm 6 (Site 1) did not exhibit toxicity to C. dubia in any of the grab samples tested. One other set of samples from Storm 4 (Site 1) exhibited only minimal toxicity to C. dubia with only the first grab having an effect on survival. Each series of samples exhibited at least some lethal and/or sublethal toxicity to P. promelas. A summary of the percentage of all grab samples that exhibited acute and chronic toxicity from the three sites tested is provided in Table 8. A more detailed analysis of results follows.
3.1.1 First-Flush Effect and Degree of Toxicity
A summary of general observations about first-flush toxicity follows. The first-flush defined here represents the first 5 samples collected during the first hour of the storm, initial grab samples may refer to and part of the first-flush grouping, and a group of samples defined here includes all grabs collected during a single storm event at one location.
• A rather prominent first-flush effect was observed with both species for lethal and sublethal endpoints (Figures 1-16). Ten of 13 groups of grab samples exhibited an obvious first-flush effect with P. promelas. Almost all groups of samples (15 of 16) that exhibited at least some toxicity to C. dubia had an observable first-flush effect on toxicity. Of the samples considered first-flush samples (first five grabs), 95 percent were considered toxic to P. promelas, whereas 80 percent were toxic to C. dubia.
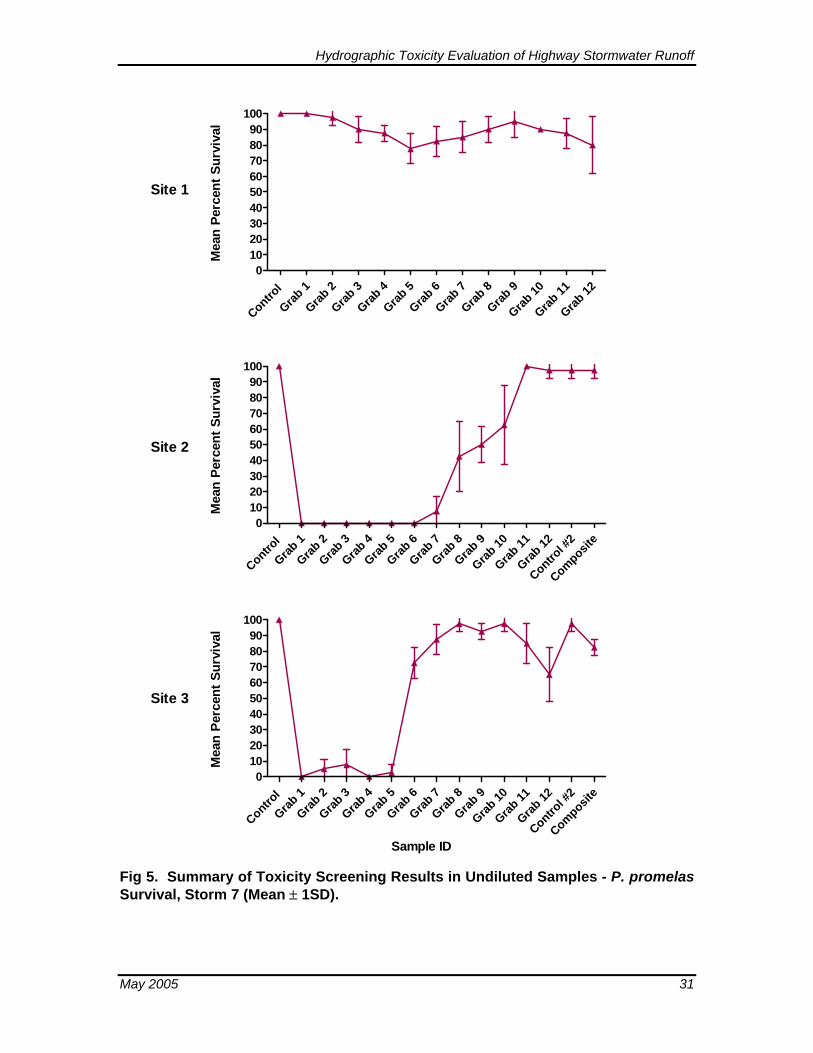
• Survival at the end of the 7-day exposure period in the first grab sample of each storm series was near zero in most samples for both test species. Three groups of samples had zero percent survival of C. dubia in multiple initial grab samples (up to grab 5). First-flush toxic effects were often observed more acutely for P. promelas than C. dubia, with complete mortality often occurring within the first 24 hours of exposure. A rapid decrease in dissolved oxygen in P. promelas test chambers for a number of initial grab samples may have slightly enhanced toxicity for this species, as described in the QA section. Retests on a number of samples, however,
May 2005 22
Hydrographic Toxicity Evaluation of Highway Stormwater Runoff
confirmed that even with continuous aeration, toxicity was still similar in magnitude.
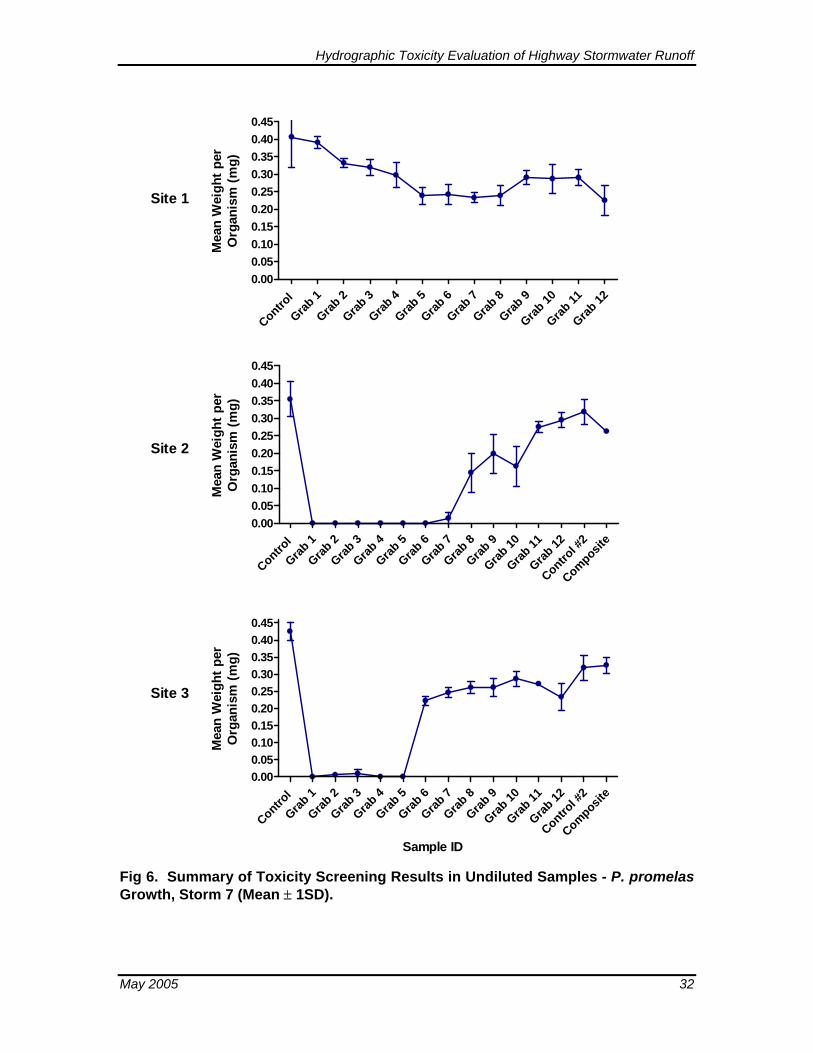
• The mean percentage of samples that exhibited toxicity during the first hour of the storms was consistently higher than that observed in samples collected later during the storms (Table 8). The magnitude of toxicity was also notably lower in grab samples collected after the first hour, with only a few of these grab samples exhibiting complete mortality.
• Occasionally, toxicity was not related to the first-flush samples. In some cases (e.g. Storm 6, Sites 2 and 3, and Storm 7, Site 1), toxicity to P. promelas occurred in grab samples collected later during a storm with no apparent first-flush effect. Additionally, in some groups of samples, toxicity to both species re-appeared in later grab samples after the effects of a first-flush were reduced or disappeared (e.g. Storm 2, Site 2).
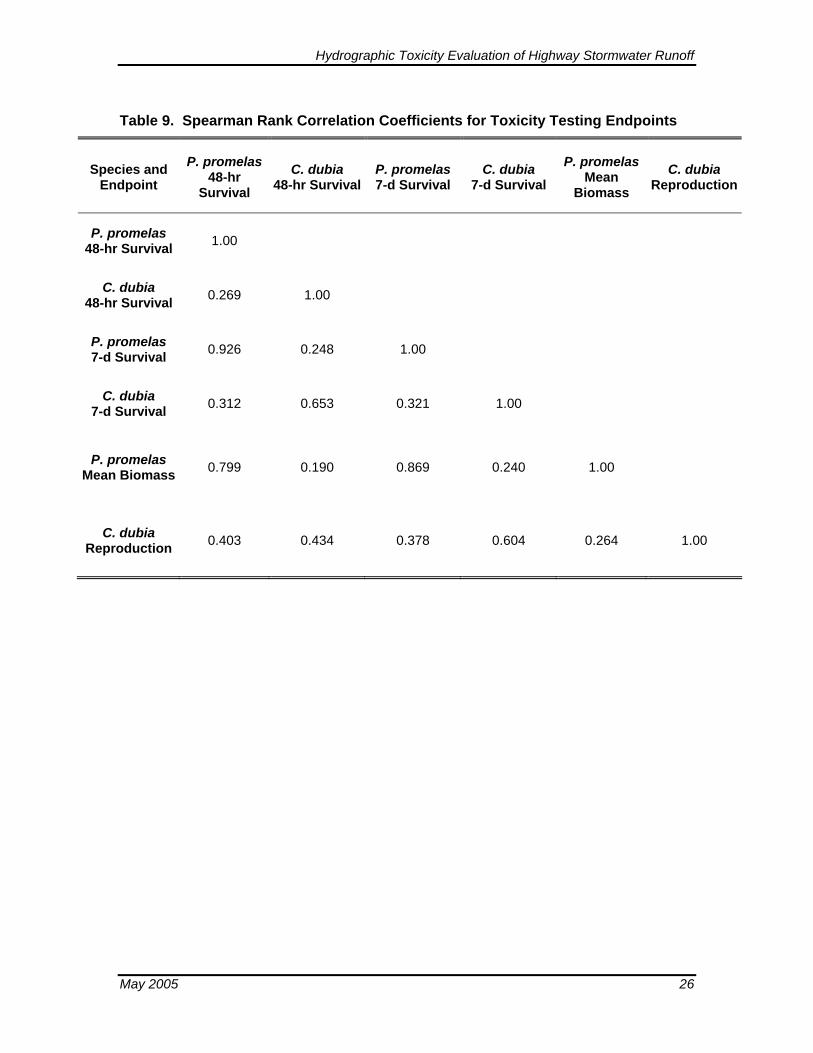
3.1.2 Toxicity Test Relationships
A review of the data collected during this study, depicted in Figures 1 through 22, indicates that, in some cases, relationships between test species correlate well (e.g. Storm 2, Site 2) and, in other cases, very little relation is observed between species (e.g. Storm 2, Site 3). The overall relationship for all events and samples combined between species endpoints is shown in Table 9. The relationship between P. promelas and C. dubia 7-day survival was relatively weak with an r2 value of only 0.32. Relationships among P. promelas endpoints alone (acute and chronic survival and growth) were all very strong with r2 values of greater than or equal to 0.8. On the other hand, relationships among the various endpoints for C. dubia were much weaker with r2 values ranging from 0.43 to 0.65.
These results illustrate a well-known point that sensitivity to specific toxicants may vary dramatically depending on both the species and toxicity endpoint evaluated.
May 2005 23
Hydrographic Toxicity Evaluation of Highway Stormwater Runoff
Table 8. Percent of Grab Samples Across all Storms Exhibiting Acute and Chronic Toxicity
Ceriodaphnia Pimephales Site 1 Grabs Acute
Survival Chronic Survival
Chronic Reproduction
Acute Survival
Chronic Survival
Chronic Growth
1 50 75 75 33 33 33 2 0 0 25 33 33 33 3 0 0 0 0 67 67 4 0 0 25 0 33 100 5 0 0 0 0 100 100 6 0 0 25 0 67 100 7 0 0 25 0 67 100 8 0 0 0 0 33 33 9 0 0 0 0 0 33
10 0 0 25 0 0 33 11 0 25 25 0 33 67 12 0 0 0 0 33 33
Ceriodaphnia Pimephales Site 2 Grabs Acute
Survival Chronic Survival
Chronic Reproduction
Acute Survival
Chronic Survival
Chronic Growth
1 67 83 100 80 100 80 2 33 67 100 80 80 80 3 17 50 100 100 100 100 4 33 50 100 100 100 80 5 17 33 100 100 100 100 6 0 0 67 20 60 100 7 0 0 67 40 60 80 8 0 0 67 40 60 60 9 0 0 50 40 60 60
10 17 33 50 20 40 60 11 20 20 40 0 25 50
May 2005 24
Hydrographic Toxicity Evaluation of Highway Stormwater Runoff
Table 8 (Cont.). Percent of Grab Samples Across all Storms Exhibiting Acute and Chronic Toxicity
Ceriodaphnia Pimephales Site 3 Grabs Acute
Survival Chronic Survival
Chronic Reproduction
Acute Survival
Chronic Survival
Chronic Growth
1 67 67 100 80 100 80 2 17 50 83 80 100 100 3 17 50 83 80 100 100 4 0 0 100 60 80 100 5 33 33 83 40 60 100 6 0 0 75 0 25 67 7 0 0 60 0 0 100 8 0 25 50 0 0 100 9 25 25 50 0 33 100
10 0 25 75 0 0 100 11 0 0 0 33 33 67 12 0 0 75 0 33 100 13 0 0 0 0 0 0 14 0 0 50 0 0 0
May 2005 25
Hydrographic Toxicity Evaluation of Highway Stormwater Runoff
Table 9. Spearman Rank Correlation Coefficients for Toxicity Testing Endpoints
Species and Endpoint
P. promelas 48-hr
Survival
C. dubia 48-hr Survival
P. promelas 7-d Survival
C. dubia 7-d Survival
P. promelas Mean
Biomass
C. dubia Reproduction
P. promelas 48-hr Survival 1.00
C. dubia 48-hr Survival 0.269 1.00
P. promelas 7-d Survival 0.926 0.248 1.00
C. dubia 7-d Survival 0.312 0.653 0.321 1.00
P. promelas Mean Biomass 0.799 0.190 0.869 0.240 1.00
C. dubia Reproduction 0.403 0.434 0.378 0.604 0.264 1.00
May 2005 26
Hydrographic Toxicity Evaluation of Highway Stormwater Runoff
Control #
1
Grab 1
Grab 2
Grab 3
Grab 4
Grab 5
Grab 6
Grab 7
Grab 8
Grab 9
Grab 10
Grab 11
Grab 12
Control #
2
Composite
0102030405060708090
100
Mea
n Pe
rcen
t Sur
viva
l
Control #
1
Grab 1
Grab 2
Grab 3
Grab 4
Grab 5
Grab 6
Grab 7
Grab 8
Grab 9
Grab 10
Grab 11
Grab 12
Control #
2
Composite
102030405060708090
100
Mea
n Pe
rcen
t Sur
viva
l
Control #
1
Grab 1
Grab 2
Grab 3
Grab 5
Grab 7
Grab 8
Grab 9
Grab 10
Grab 11
Grab 12
Grab 13
Grab 14
Control #
2
Composite
102030405060708090
100
Sample ID
Mea
n Pe
rcen
t Sur
viva
l
Site 1
Site 2
Site 3
Fig 1. Summary of Toxicity Screening Results in Undiluted Samples - P. promelas Survival, Storm 2 (Mean ± 1SD).
May 2005 27
Hydrographic Toxicity Evaluation of Highway Stormwater Runoff
Control #
1
Grab 1
Grab 2
Grab 3
Grab 4
Grab 5
Grab 6
Grab 7
Grab 8
Grab 9
Grab 10
Grab 11
Grab 12
Control #
2
Composite
0.000.050.100.150.200.250.300.350.400.45
Mea
n W
eigh
t per
Org
anis
m (m
g)
Control #
1
Grab 1
Grab 2
Grab 3
Grab 4
Grab 5
Grab 6
Grab 7
Grab 8
Grab 9
Grab 10
Grab 11
Grab 12
Control #
2
Composite -0.05
0.000.050.100.150.200.250.300.350.400.45
Mea
n W
eigh
t per
Org
anis
m (m
g)
Control #
1
Grab 1
Grab 2
Grab 3
Grab 5
Grab 7
Grab 8
Grab 9
Grab 10
Grab 11
Grab 12
Grab 13
Grab 14
Control #
2
Composite -0.05
0.000.050.100.150.200.250.300.350.400.45
Sample ID
Mea
n W
eigh
t per
Org
anis
m (m
g)
Site 1
Site 2
Site 3
Fig 2. Summary of Toxicity Screening Results in Undiluted Samples - P. promelas Growth, Storm 2 (Mean ± 1SD).
May 2005 28
Hydrographic Toxicity Evaluation of Highway Stormwater Runoff
Control
Grab 1
Grab 2
Grab 3
Grab 4
Grab 5
Grab 6
Grab 7
Grab 8
Grab 9
Grab 10
Grab 11
Grab 12
0102030405060708090
100
Mea
n Pe
rcen
t Sur
viva
l
Control
Grab 1
Grab 2
Grab 3
Grab 4
Grab 5
Grab 6
Grab 7
Grab 8
Grab 9
Grab 10
Grab 11
Grab 12
0102030405060708090
100
Mea
n Pe
rcen
t Sur
viva
l
Control 4
Grab 1
Control 1
Control 2
Grab 2
Grab 3
Grab 4
Grab 5
Grab 6
Grab 7
Grab 8
Grab 9
Grab 10
Grab 11
Grab 12
0102030405060708090
100
Sample ID
Mea
n Pe
rcen
t Sur
viva
lSite 1
Site 2
Site 3
Note For Site 3 Only: Due to a dramatic drop in dissolved oxygen after 24 hours of the initialtest date (1/8/05), grab 1 was re-tested on 1/10/05 with continuous aeration with Control 4.Control 1 data correspond to grab samples that did not require aeration: 2-7, and 9-12.Control 2 data correspond to grab 8 data; both were aerated after 24 hours for the durationof the test.
Fig 3. Summary of Toxicity Screening Results in Undiluted Samples - P. promelas Survival, Storm 6 (Mean ± 1SD).
May 2005 29
Hydrographic Toxicity Evaluation of Highway Stormwater Runoff
Control
Grab 1
Grab 2
Grab 3
Grab 4
Grab 5
Grab 6
Grab 7
Grab 8
Grab 9
Grab 10
Grab 11
Grab 12
0.000.050.100.150.200.250.300.350.400.45
Mea
n W
eigh
t per
Org
anis
m (m
g)
Control
Grab 1
Grab 2
Grab 3
Grab 4
Grab 5
Grab 6
Grab 7
Grab 8
Grab 9
Grab 10
Grab 11
Grab 12
0.000.050.100.150.200.250.300.350.400.45
Mea
n W
eigh
t per
Org
anis
m (m
g)
Control 4
Grab 1
Control 1
Control 2
Grab 2
Grab 3
Grab 4
Grab 5
Grab 6
Grab 7
Grab 8
Grab 9
Grab 10
Grab 11
Grab 12
0.000.050.100.150.200.250.300.350.400.45
Sample ID
Mea
n W
eigh
t per
Org
anis
m (m
g)Site 1
Site 2
Site 3
Fig 4. Summary of Toxicity Screening Results in Undiluted Samples - P. promelas Growth, Storm 6 (Mean ± 1SD).
May 2005 30
Hydrographic Toxicity Evaluation of Highway Stormwater Runoff
Control
Grab 1
Grab 2
Grab 3
Grab 4
Grab 5
Grab 6
Grab 7
Grab 8
Grab 9
Grab 10
Grab 11
Grab 12
0102030405060708090
100
Mea
n Pe
rcen
t Sur
viva
l
Control
Grab 1
Grab 2
Grab 3
Grab 4
Grab 5
Grab 6
Grab 7
Grab 8
Grab 9
Grab 10
Grab 11
Grab 12
Control #
2
Composite
0102030405060708090
100
Mea
n Pe
rcen
t Sur
viva
l
Control
Grab 1
Grab 2
Grab 3
Grab 4
Grab 5
Grab 6
Grab 7
Grab 8
Grab 9
Grab 10
Grab 11
Grab 12
Control #
2
Composite
0102030405060708090
100
Sample ID
Mea
n Pe
rcen
t Sur
viva
l
Site 1
Site 2
Site 3
Fig 5. Summary of Toxicity Screening Results in Undiluted Samples - P. promelas Survival, Storm 7 (Mean ± 1SD).
May 2005 31
Hydrographic Toxicity Evaluation of Highway Stormwater Runoff
Control
Grab 1
Grab 2
Grab 3
Grab 4
Grab 5
Grab 6
Grab 7
Grab 8
Grab 9
Grab 10
Grab 11
Grab 12
0.000.050.100.150.200.250.300.350.400.45
Mea
n W
eigh
t per
Org
anis
m (m
g)
Control
Grab 1
Grab 2
Grab 3
Grab 4
Grab 5
Grab 6
Grab 7
Grab 8
Grab 9
Grab 10
Grab 11
Grab 12
Control #
2
Composite
0.000.050.100.150.200.250.300.350.400.45
Mea
n W
eigh
t per
Org
anis
m (m
g)
Control
Grab 1
Grab 2
Grab 3
Grab 4
Grab 5
Grab 6
Grab 7
Grab 8
Grab 9
Grab 10
Grab 11
Grab 12
Control #
2
Composite
0.000.050.100.150.200.250.300.350.400.45
Sample ID
Mea
n W
eigh
t per
Org
anis
m (m
g)
Site 1
Site 2
Site 3
Fig 6. Summary of Toxicity Screening Results in Undiluted Samples - P. promelas Growth, Storm 7 (Mean ± 1SD).
May 2005 32
Hydrographic Toxicity Evaluation of Highway Stormwater Runoff
Control
Grab 1
Grab 2
Grab 3
Grab 4
Grab 5
Grab 6
Grab 7
Grab 8
Grab 9
Grab 10
Grab 11
Grab 12
Control #
2
Composite
0102030405060708090
100
Mea
n Pe
rcen
t Sur
viva
l
Control
Grab 1
Grab 2
Grab 3
Grab 4
Grab 5
0102030405060708090
100
Sample ID
Mea
n Pe
rcen
t Sur
viva
l
Site 2
Site 3
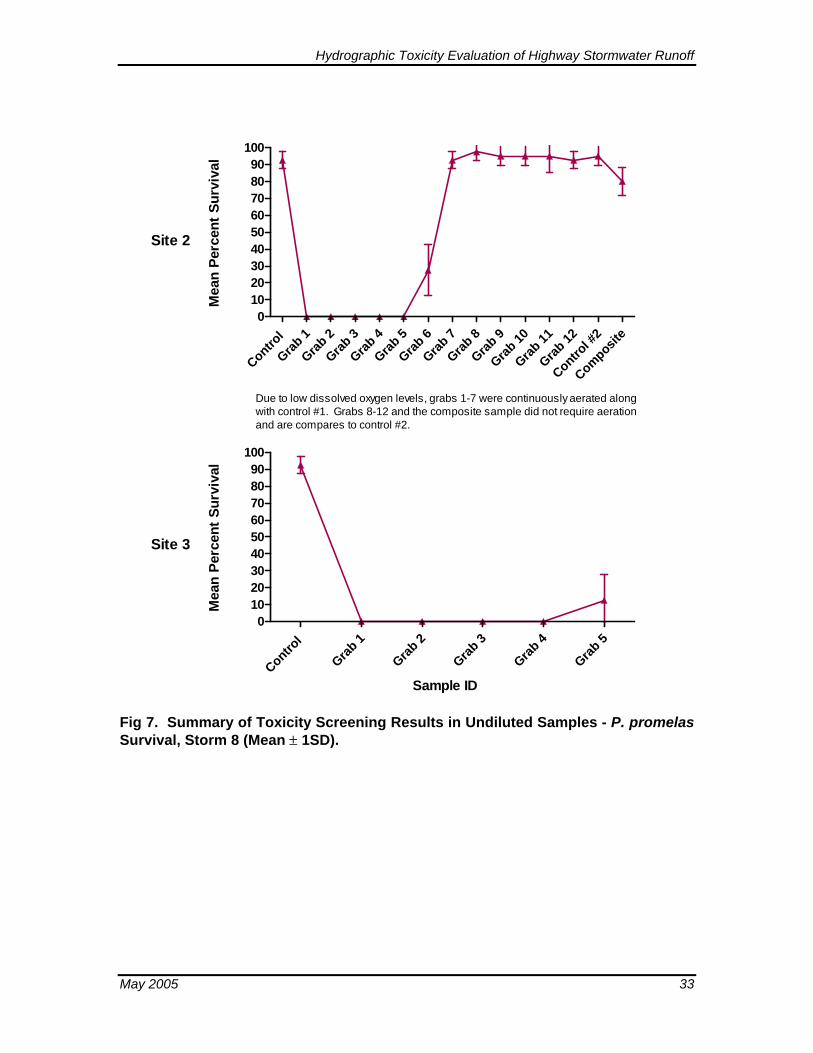
Due to low dissolved oxygen levels, grabs 1-7 were continuously aerated alongwith control #1. Grabs 8-12 and the composite sample did not require aerationand are compares to control #2.
Fig 7. Summary of Toxicity Screening Results in Undiluted Samples - P. promelas Survival, Storm 8 (Mean ± 1SD).
May 2005 33
Hydrographic Toxicity Evaluation of Highway Stormwater Runoff
Control
Grab 1
Grab 2
Grab 3
Grab 4
Grab 5
Grab 6
Grab 7
Grab 8
Grab 9
Grab 10
Grab 11
Grab 12
Control #
2
Composite
0.000.050.100.150.200.250.300.350.400.450.500.55
Mea
n W
eigh
t per
Org
anis
m (m
g)
Control
Grab 1
Grab 2
Grab 3
Grab 4
Grab 5
0.000.050.100.150.200.250.300.350.400.45
Sample ID
Mea
n W
eigh
t per
Org
anis
m (m
g)
Site 2
Site 3
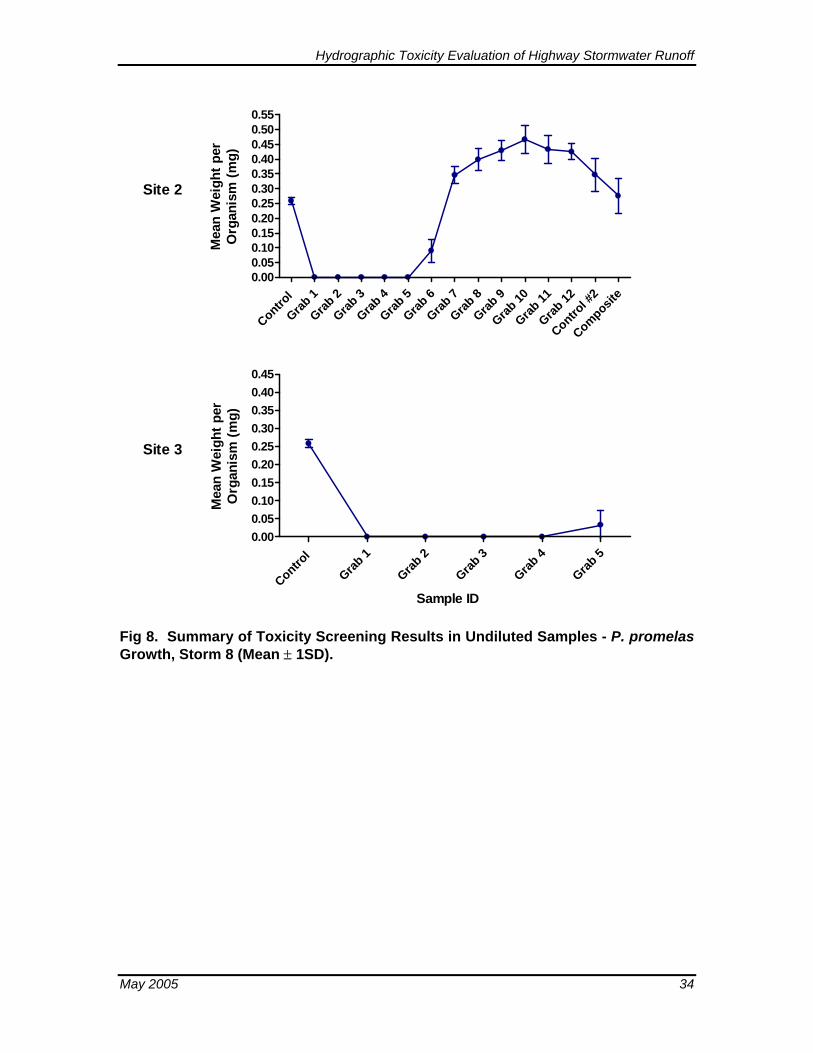
Fig 8. Summary of Toxicity Screening Results in Undiluted Samples - P. promelas Growth, Storm 8 (Mean ± 1SD).
May 2005 34
Hydrographic Toxicity Evaluation of Highway Stormwater Runoff
Control
Grab 1
Grab 2
Grab 3
Grab 4
Grab 5
Grab 6
Grab 7
Cond. Contro
l
Grab 8
Grab 9
Grab 10
0102030405060708090
100
Mea
n Pe
rcen
t Sur
viva
l
Control
Grab 1
Grab 2
Grab 3
Grab 4
Grab 5
Grab 6
Grab 7
0102030405060708090
100
Sample ID
Mea
n Pe
rcen
t Su
rviv
alSite 2
Site 3
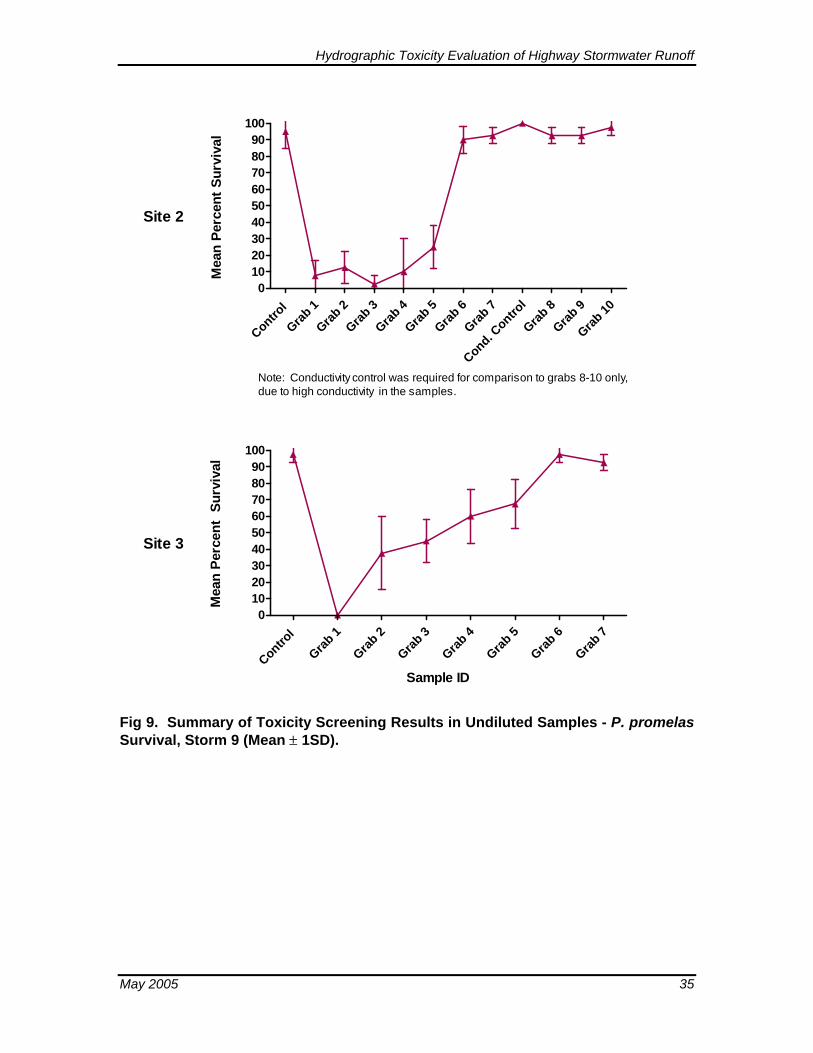
Note: Conductivity control was required for comparison to grabs 8-10 only,due to high conductivity in the samples.
Fig 9. Summary of Toxicity Screening Results in Undiluted Samples - P. promelas Survival, Storm 9 (Mean ± 1SD).
May 2005 35
Hydrographic Toxicity Evaluation of Highway Stormwater Runoff
Control
Grab 1
Grab 2
Grab 3
Grab 4
Grab 5
Grab 6
Grab 7
Cond. Contro
l
Grab 8
Grab 9
Grab 10
0.000.050.100.150.200.250.300.350.400.45
Mea
n W
eigh
t per
Org
anis
m (m
g)
Control
Grab 1
Grab 2
Grab 3
Grab 4
Grab 5
Grab 6
Grab 7
0.000.050.100.150.200.250.300.350.400.45
Sample ID
Mea
n W
eigh
t per
Org
anis
m (m
g)Site 2
Site 3
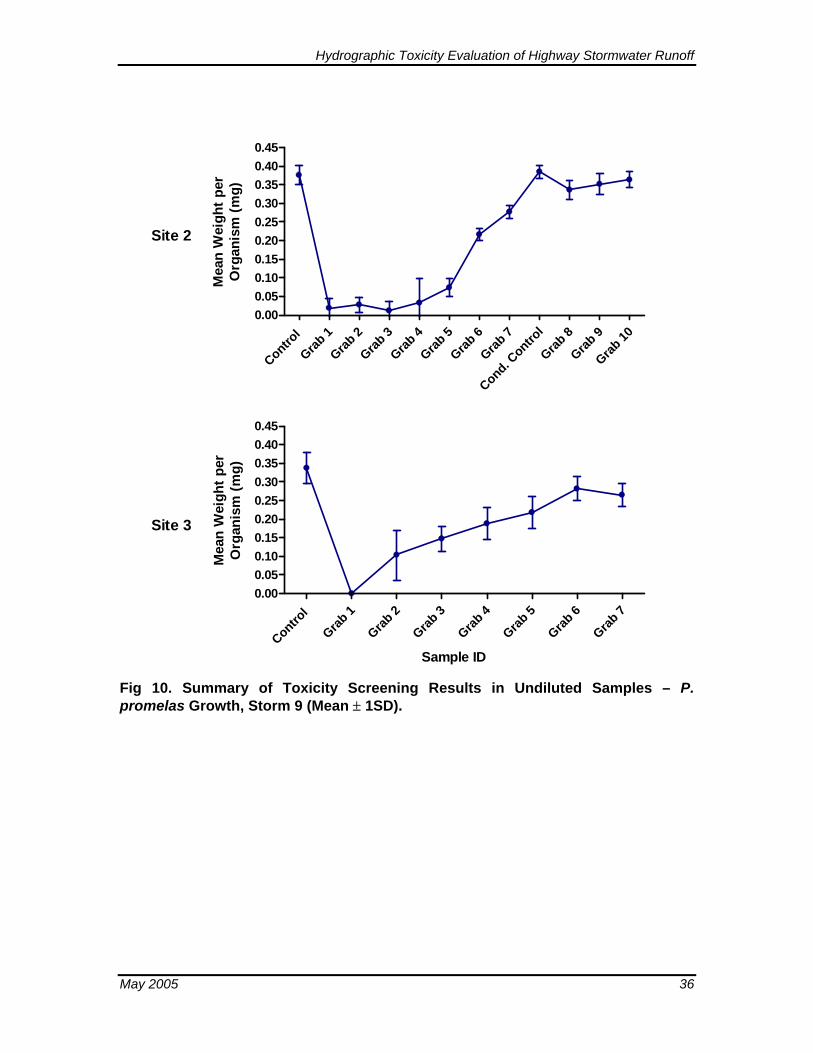
Fig 10. Summary of Toxicity Screening Results in Undiluted Samples – P. promelas Growth, Storm 9 (Mean ± 1SD).
May 2005 36
Hydrographic Toxicity Evaluation of Highway Stormwater Runoff
Control
Grab 1
Grab 2
Grab 3
Grab 4
Grab 5
Grab 6
Grab 7
Grab 8
Grab 9
Grab 10
Grab 11
Grab 12
Composite
0102030405060708090
100
05101520253035404550
Mea
n Pe
rcen
t Sur
viva
l
Mean N
umber of N
eonates
Control
Grab 1
Grab 2
Grab 3
Grab 4
Grab 5
Grab 6
Grab 7
Grab 8
Grab 9
Grab 10
Grab 11
Grab 12
Composite
0102030405060708090
100
05101520253035404550
Mea
n Pe
rcen
t Sur
viva
l
Mean N
umber of N
eonates
Control
Grab 1
Grab 2
Grab 3
Grab 5
Grab 7
Grab 8
Grab 9
Grab 10
Grab 11
Grab 12
Grab 13
Grab 14
Composite
0102030405060708090
100
0
10
20
30
40
50
Mean Number of NeonatesPercent Survival
Sample ID
Mea
n Pe
rcen
t Sur
viva
l
Mean N
umber of N
eonatesSite 1
Site 2
Site 3
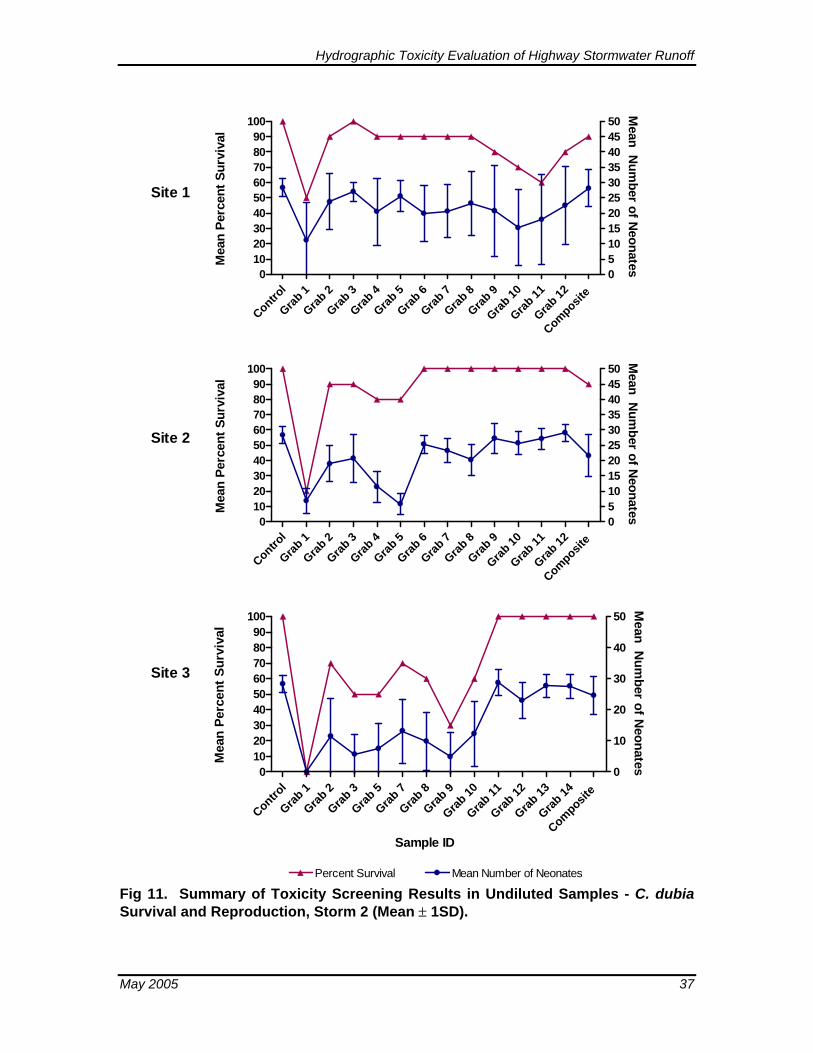
Fig 11. Summary of Toxicity Screening Results in Undiluted Samples - C. dubia Survival and Reproduction, Storm 2 (Mean ± 1SD).
May 2005 37
Hydrographic Toxicity Evaluation of Highway Stormwater Runoff
Control
Grab 1
Grab 2
Grab 3
Grab 4
Grab 5
Grab 6
Grab 7
Grab 8
Grab 9
Grab 10
Grab 11
Grab 12
0102030405060708090
100
05101520253035404550
Mea
n Pe
rcen
t Sur
viva
l
Mean N
umber of N
eonates
Control
Grab 1
Grab 2
Grab 3
Grab 4
Grab 5
Grab 6
Grab 7
Grab 8
Grab 9
Grab 10
Grab 11
Grab 12
0102030405060708090
100
0
10
20
30
40
50
Mea
n Pe
rcen
t Sur
viva
l
Mean N
umber of N
eonates
Control
Grab 1
Grab 2
Grab 3
Grab 4
Grab 5
Grab 6
Grab 7
Grab 8
Grab 9
Grab 10
Grab 12
Grab 14
0102030405060708090
100
0
10
20
30
40
50
Mean Number of NeonatesPercent Survival
Sample ID
Mea
n Pe
rcen
t Sur
viva
l
Mean N
umber of N
eonates
Site 1
Site 2
Site 3
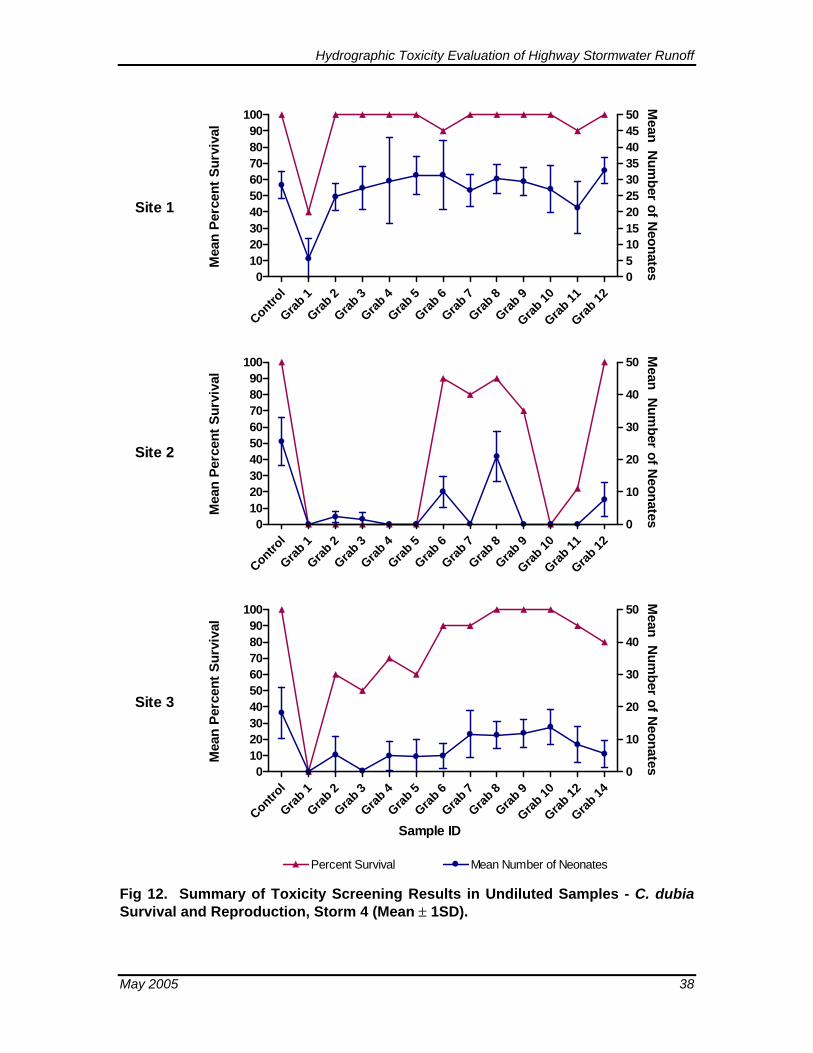
Fig 12. Summary of Toxicity Screening Results in Undiluted Samples - C. dubia Survival and Reproduction, Storm 4 (Mean ± 1SD).
May 2005 38
Hydrographic Toxicity Evaluation of Highway Stormwater Runoff
Control
Grab 1
Grab 2
Grab 3
Grab 4
Grab 5
Grab 6
Grab 7
Grab 8
Grab 9
Grab 10
Grab 11
Grab 12
0102030405060708090
100
05101520253035404550
Mea
n Pe
rcen
t Sur
viva
l
Mean N
umber of N
eonates
Control
Grab 1
Grab 2
Grab 3
Grab 4
Grab 5
Grab 6
Grab 7
Grab 8
Grab 9
Grab 10
Grab 11
Grab 12
0102030405060708090
100
05101520253035404550
Mea
n Pe
rcen
t Sur
viva
l
Mean N
umber of N
eonates
Control
Grab 1
Grab 2
Grab 3
Grab 4
Grab 5
Grab 6
Grab 7
Grab 8
Grab 9
Grab 10
Grab 11
Grab 12
0102030405060708090
100
05101520253035404550
Mean Number of NeonatesPercent Survival
Sample ID
Mea
n Pe
rcen
t Sur
viva
l
Mean N
umber of N
eonates
Site 1
Site 2
Site 3
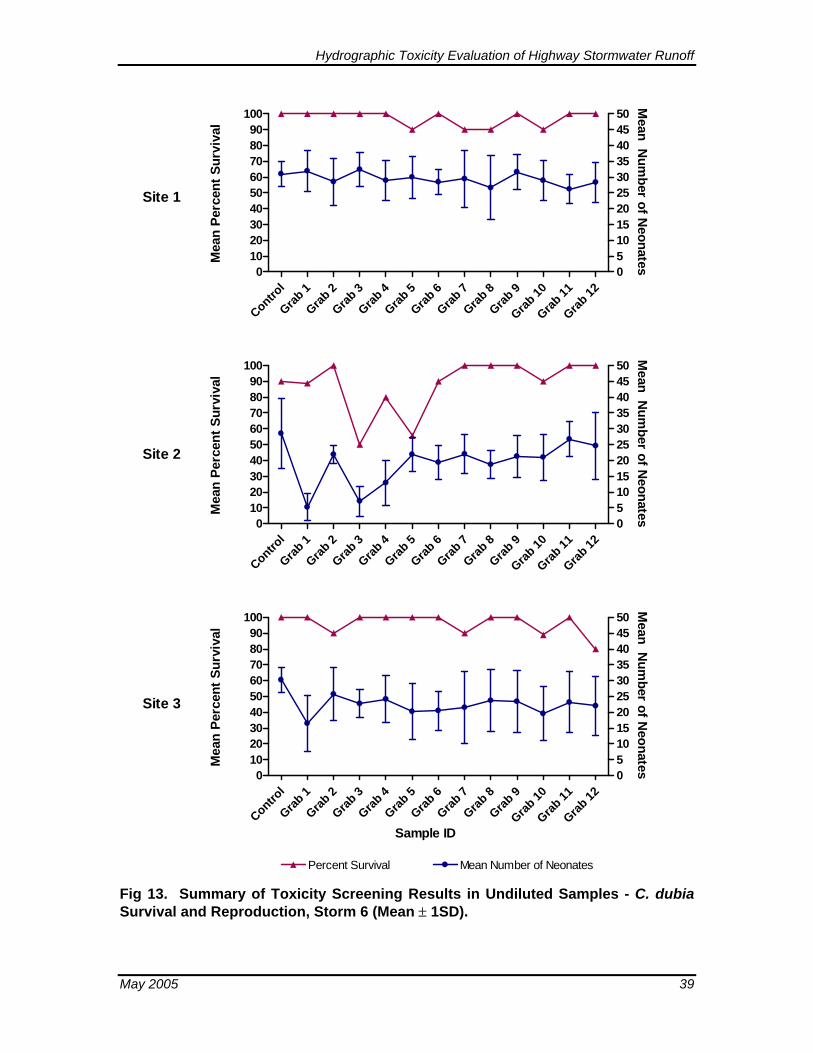
Fig 13. Summary of Toxicity Screening Results in Undiluted Samples - C. dubia Survival and Reproduction, Storm 6 (Mean ± 1SD).
May 2005 39
Hydrographic Toxicity Evaluation of Highway Stormwater Runoff
Control
Grab 1
Grab 2
Grab 3
Grab 4
Grab 5
Grab 6
Grab 7
Grab 8
Grab 9
Grab 10
Grab 11
Grab 12
0102030405060708090
100
05101520253035404550
Mea
n Pe
rcen
t Sur
viva
l
Mean N
umber of N
eonates
Control
Grab 1
Grab 2
Grab 3
Grab 4
Grab 5
Grab 6
Grab 7
Grab 8
Grab 9
Grab 10
Grab 11
Grab 12
Control #
2
Composite
0102030405060708090
100
05101520253035404550
Mea
n Pe
rcen
t Sur
viva
l
Mean N
umber of N
eonates
Control
Grab 1
Grab 2
Grab 3
Grab 4
Grab 5
Grab 6
Grab 7
Grab 8
Grab 9
Grab 10
Grab 11
Grab 12
Control #
2
Composite
0102030405060708090
100
05101520253035404550
Mean Number of NeonatesPercent Survival
Sample ID
Mea
n Pe
rcen
t Sur
viva
l
Mean N
umber of N
eonates
Site 1
Site 2
Site 3
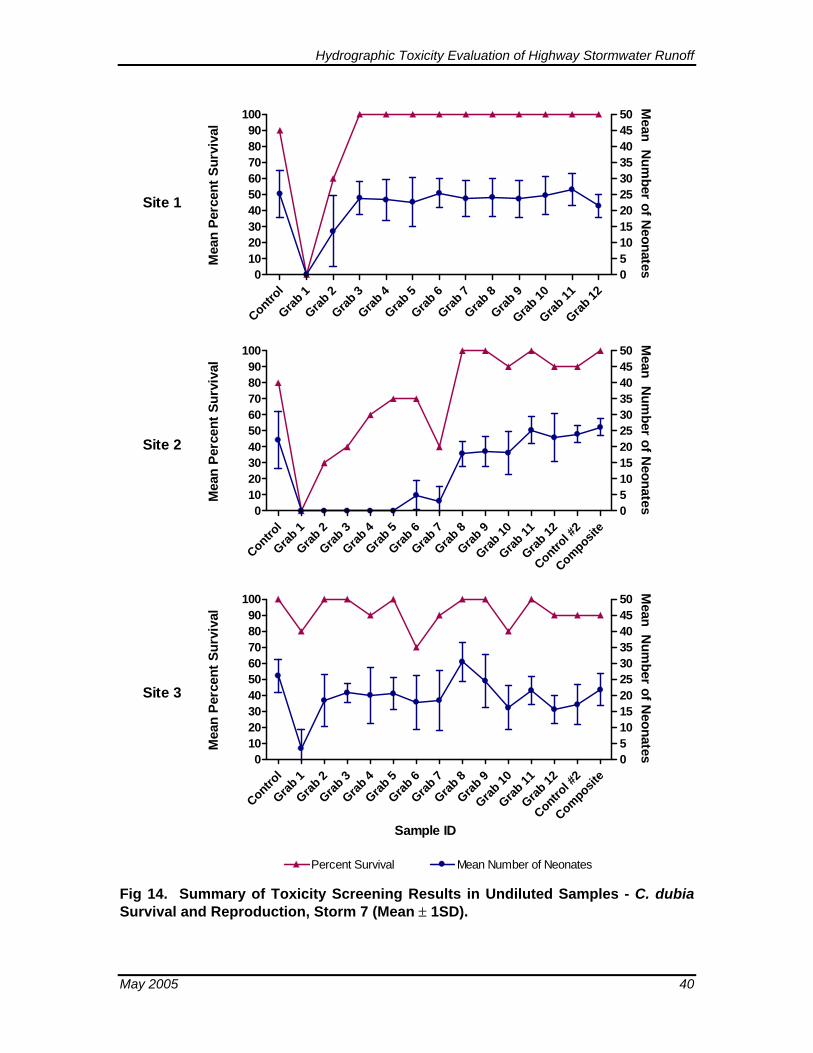
Fig 14. Summary of Toxicity Screening Results in Undiluted Samples - C. dubia Survival and Reproduction, Storm 7 (Mean ± 1SD).
May 2005 40
Hydrographic Toxicity Evaluation of Highway Stormwater Runoff
Control
Grab 1
Grab 2
Grab 3
Grab 4
Grab 5
Grab 6
Grab 7
Grab 8
Grab 9
Grab 10
Grab 11
Grab 12
Control #
2
Composite
0102030405060708090
100
05101520253035404550
Mea
n Pe
rcen
t Sur
viva
l
Mean N
umber of N
eonates
Control
Grab 1
Grab 2
Grab 3
Grab 4
Grab 5
0102030405060708090
100
05101520253035404550
Mean Number of NeonatesPercent Survival
Sample ID
Mea
n Pe
rcen
t Sur
viva
l
Mean N
umber of N
eonates
Site 2
Site 3
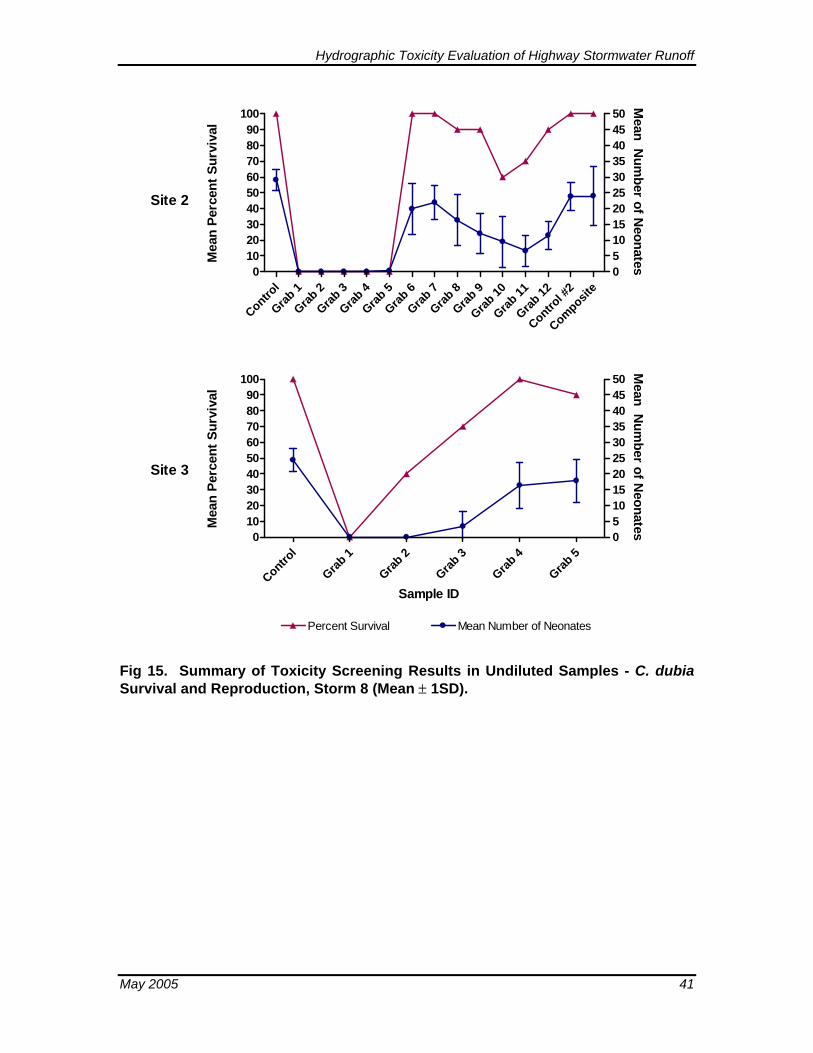
Fig 15. Summary of Toxicity Screening Results in Undiluted Samples - C. dubia Survival and Reproduction, Storm 8 (Mean ± 1SD).
May 2005 41
Hydrographic Toxicity Evaluation of Highway Stormwater Runoff
Control
Grab 1
Grab 2
Grab 3
Grab 4
Grab 5
Grab 6
Grab 7
0102030405060708090
100
05101520253035404550
Mea
n Pe
rcen
t Sur
viva
l
Mean N
umber of N
eonates
Control
Grab 1
Grab 2
Grab 3
Grab 4
Grab 5
Grab 6
Grab 7
Salinity
Contro
l
Grab 8
Grab 9
Grab 10
0102030405060708090
100
05101520253035404550
Percent Survival Mean Number of Neonates
Sample ID
Mea
n Pe
rcen
t Sur
viva
l
Mean N
umber of N
eonates
Site 2
Site 3
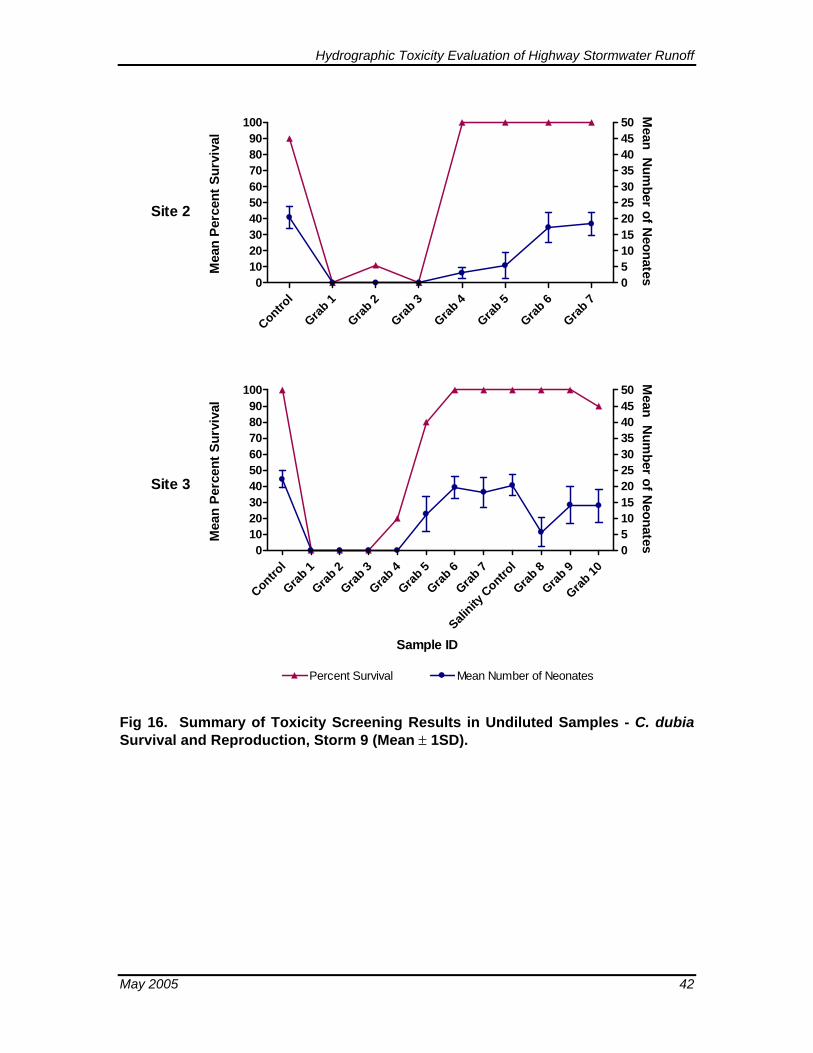
Fig 16. Summary of Toxicity Screening Results in Undiluted Samples - C. dubia Survival and Reproduction, Storm 9 (Mean ± 1SD).
May 2005 42
Hydrographic Toxicity Evaluation of Highway Stormwater Runoff
Grab 1 Grab 2 Grab 3 Grab 4 Grab 50
102030405060708090
100 * *
Sample ID
LC50
/EC
50
Grab 1 Grab 2 Grab 3 Grab 4 Grab 50
102030405060708090
100 * ** * *
Sample ID
LC50
/EC
50
Grab 1 Grab 2 Grab 3 Grab 4 Grab 50
102030405060708090
100 * ** * *
Sample ID
LC50
/EC
50
Storm 2 Storm 6
Storm 7 *LC50/EC50 > 100
Survival
Growth
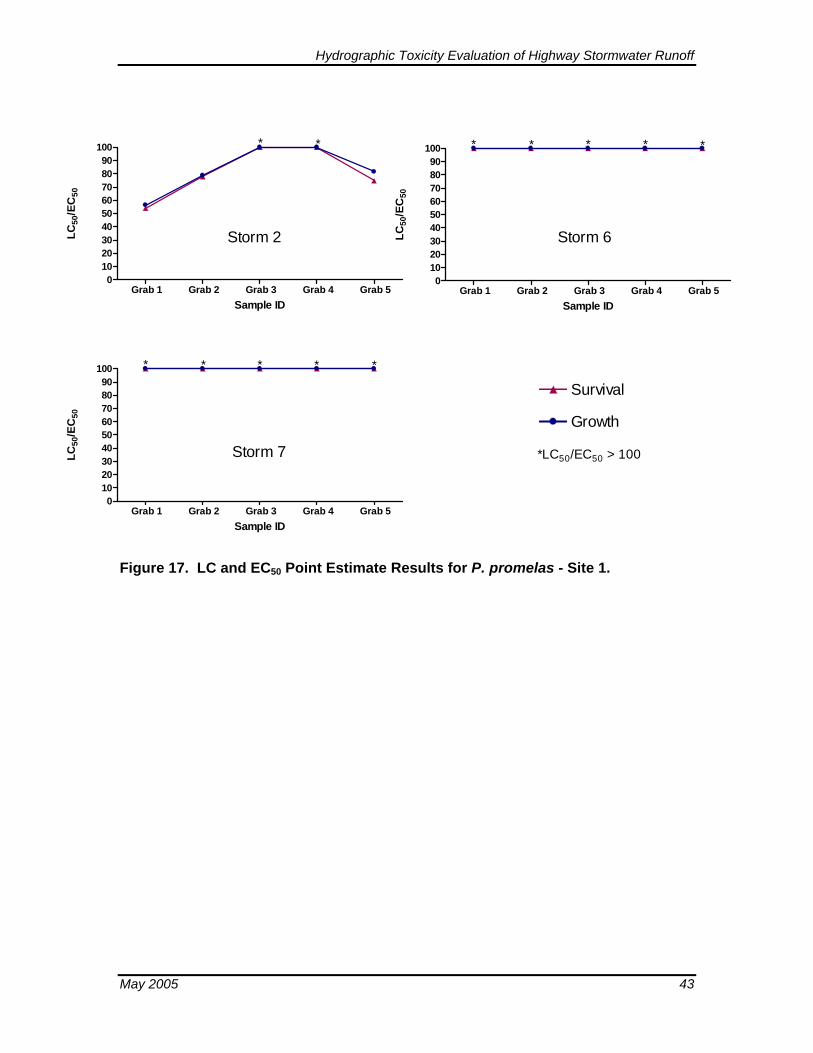
Figure 17. LC and EC50 Point Estimate Results for P. promelas - Site 1.
May 2005 43
Hydrographic Toxicity Evaluation of Highway Stormwater Runoff
Grab
1
Grab 2
Grab 3
Grab 4
Grab 5
102030405060708090
100 **
Sample ID
LC50
/EC
50
Grab 1
Grab 2
Grab 3
Grab 4
Grab 5
102030405060708090
100 ***
Sample ID
LC50
/EC
50
Gra 1b
Grab 2
Grab 3
Grab 4
Grab 5
102030405060708090
100
Sample ID
LC50
/EC
50
Grab 1
Grab 2
Grab 3
Grab 4
Grab 5
102030405060708090
100
Sample ID
LC50
/EC
50
Storm 2 Storm 6
Storm 7 Storm 8
Gra 1b
Grab 2
Grab 3
Grab 4
Grab 5
102030405060708090
100
Sample ID
LC50
/EC
50
Storm 9 *LC50/EC50 > 100
Survival
Growth
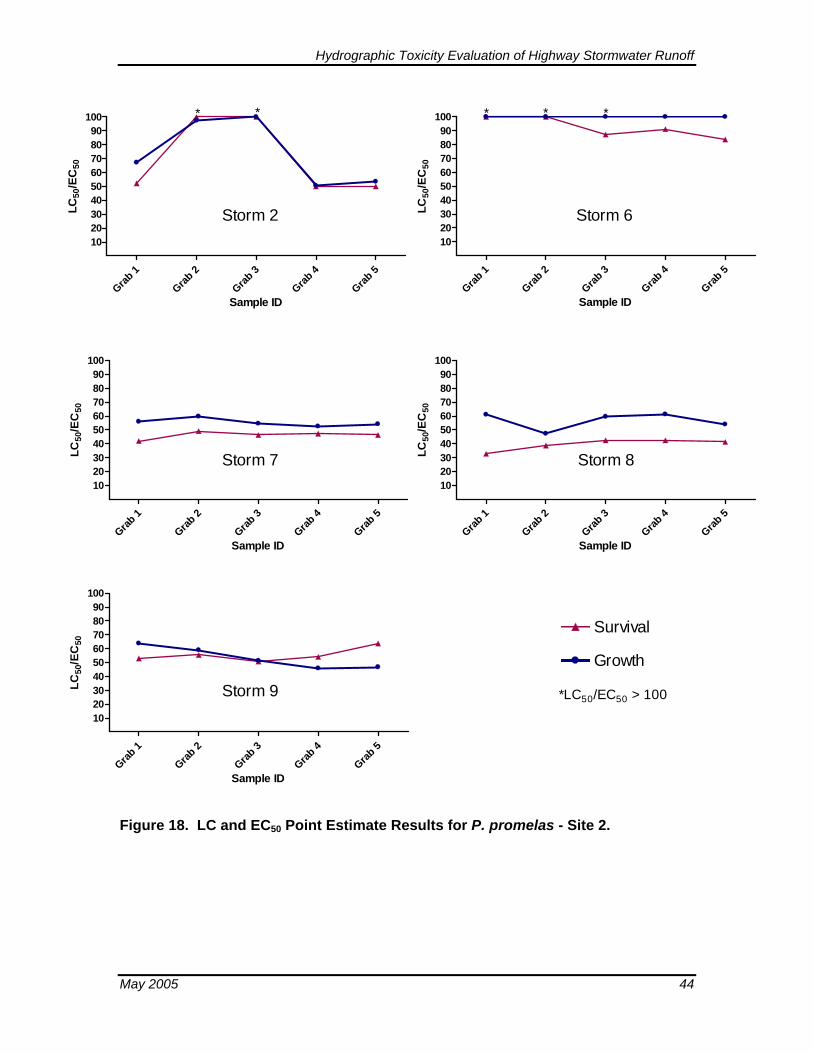
Figure 18. LC and EC50 Point Estimate Results for P. promelas - Site 2.
May 2005 44
Hydrographic Toxicity Evaluation of Highway Stormwater Runoff
Grab 1
Grab 2
Grab 3
Grab 5
Grab 7
102030405060708090
100 * * *
Sample ID
LC50
/EC
50
Grab 1
Grab 2
Grab 3
Grab 4
Grab 5
102030405060708090
100 * ** *
Sample ID
LC50
/EC
50
Grab 1
Grab 2
Grab 3
Grab 4
Grab 5
102030405060708090
100
Sample ID
LC50
/EC
50
Grab 1
Grab 2
Grab 3
Grab 4
Grab 5
102030405060708090
100
Sample ID
LC50
/EC
50
Storm 2 Storm 6
Storm 7 Storm 8
Survival
Growth
Grab 1
Grab 2
Grab 3
Grab 4
Grab 5
102030405060708090
100 * *
Sample ID
LC50
/EC
50
Storm 9 *LC50/EC50 > 100
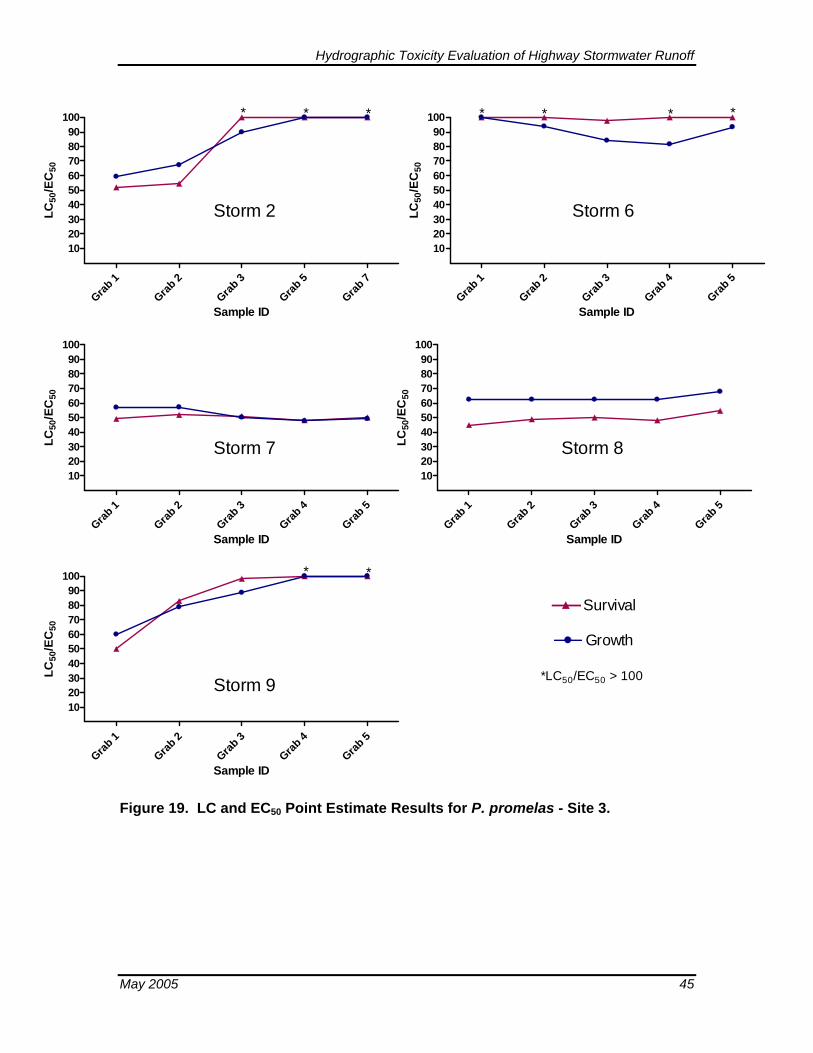
Figure 19. LC and EC50 Point Estimate Results for P. promelas - Site 3.
May 2005 45
Hydrographic Toxicity Evaluation of Highway Stormwater Runoff
Grab 1 Grab 2 Grab 3 Grab 4 Grab 50
102030405060708090
100 * * * **
Sample ID
LC50
/EC
50
Grab 1 Grab 2 Grab 3 Grab 4 Grab 50
102030405060708090
100 * * * *
Sample ID
LC50
/EC
50
Grab 1 Grab 2 Grab 3 Grab 4 Grab 50
102030405060708090
100 * * * **
Sample ID
LC50
/EC
50
Grab 1 Grab 2 Grab 3 Grab 4 Grab 50
102030405060708090
100
Sample ID
LC50
/EC
50
Storm 2 Storm 4
Storm 6 Storm 7
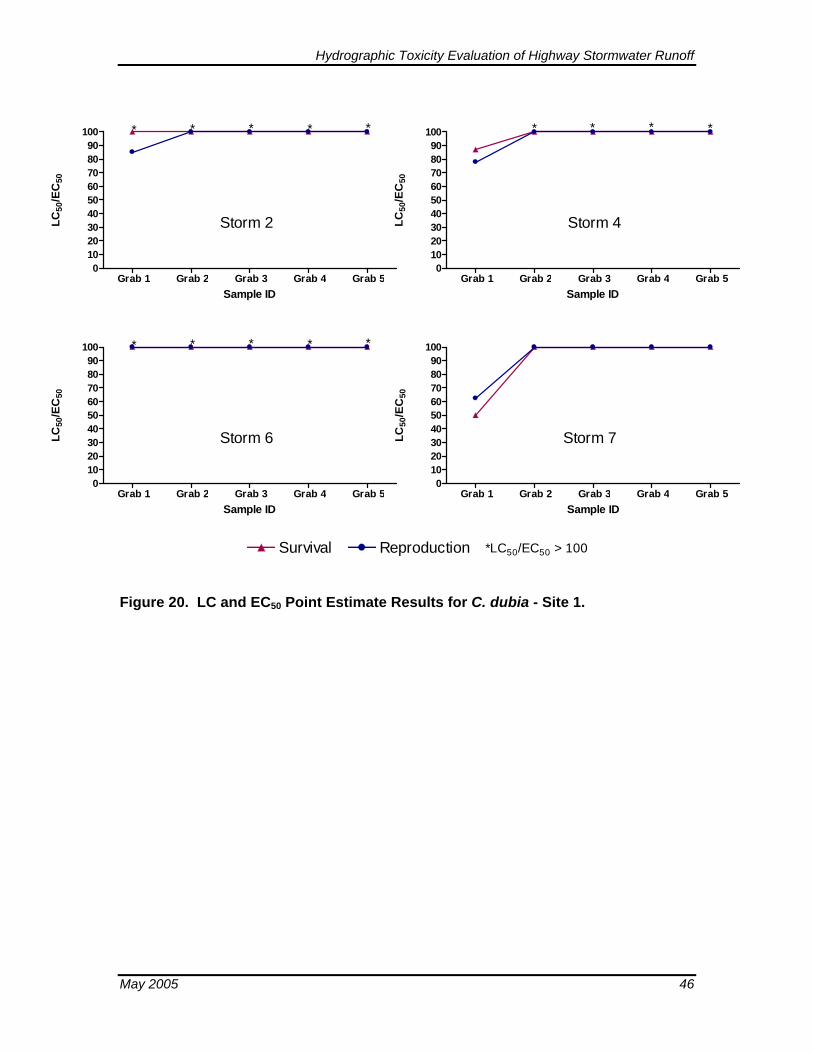
Survival Reproduction *LC50/EC50 > 100 Figure 20. LC and EC50 Point Estimate Results for C. dubia - Site 1.
May 2005 46
Hydrographic Toxicity Evaluation of Highway Stormwater Runoff
Grab
1
Grab 2
Grab 3
Grab 4
Grab 5
102030405060708090
100 * * * *
Sample ID
LC50
/EC
50
Grab 1
Grab 2
Grab 3
Grab 4
Grab 5
102030405060708090
100
Sample ID
LC50
/EC
50
Gr 1
ab
Grab 2
Grab 3
Grab 4
Grab 5
102030405060708090
100 * * * **
Sample ID
LC50
/EC
50
Grab 1
Grab 2
Grab 3
Grab 4
Grab 5
102030405060708090
100 * * *
Sample ID
LC50
/EC
50
G 1
rab
Grab 2
Grab 3
Grab 4
Grab 5
102030405060708090
100
Sample ID
LC50
/EC
50
Storm 2 Storm 4
Storm 8
Storm 7Storm 6
Grab 1
Grab 2
Grab 3
Grab 4
Grab 5
102030405060708090
100 *
Sample ID
LC50
/EC
50
Storm 9
Survival *LC50/EC50 > 100Reproduction
Figure 21. LC and EC50 Point Estimate Results for C. dubia - Site 2.
May 2005 47
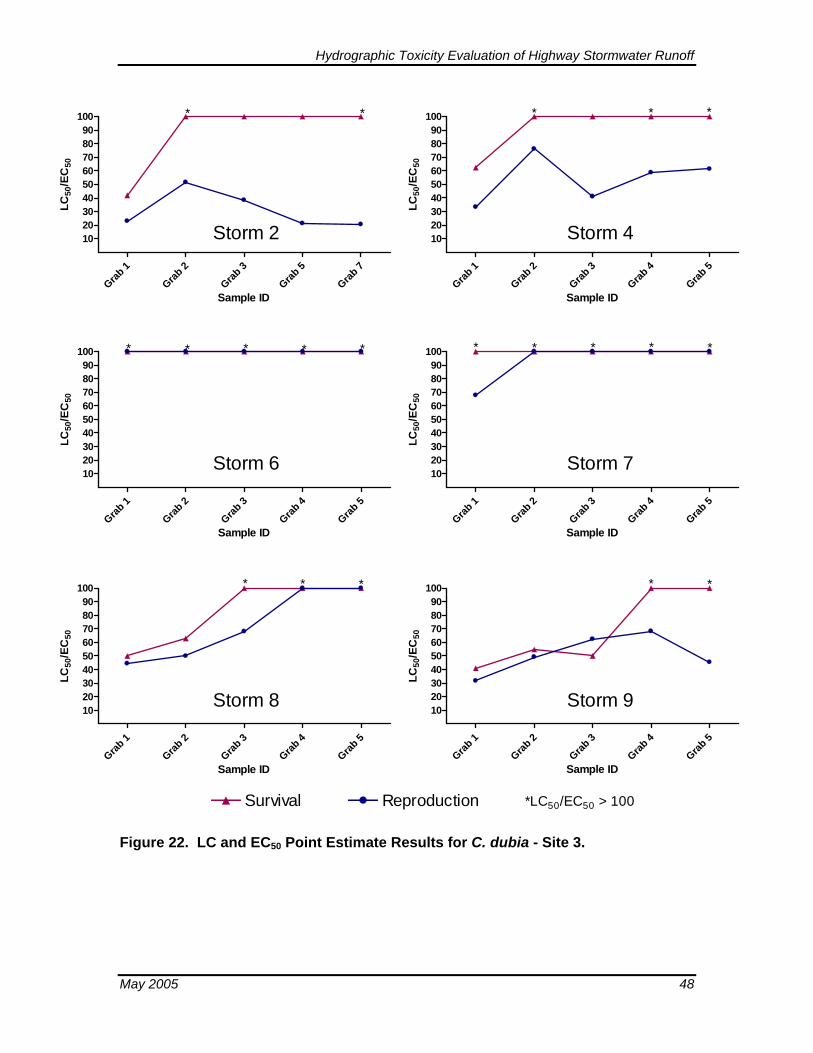
Hydrographic Toxicity Evaluation of Highway Stormwater Runoff
Grab 1
Grab 2
Grab 3
Grab 5
Grab 7
102030405060708090
100 * *
Sample ID
LC50
/EC
50
Grab 1
Grab 2
Grab 3
Grab 4
Grab 5
102030405060708090
100 * * *
Sample ID
LC50
/EC
50
Grab 1
Grab 2
Grab 3
Grab 4
Grab 5
102030405060708090
100 *
* * * *
Sample ID
LC50
/EC
50
Grab 1
Grab 2
Grab 3
Grab 4
Grab 5
102030405060708090
100 * ** * *
Sample ID
LC50
/EC
50
Grab 1
Grab 2
Grab 3
Grab 4
Grab 5
102030405060708090
100 * **
Sample ID
LC50
/EC
50
Storm 2 Storm 4
Storm 6 Storm 7
Grab 1
Grab 2
Grab 3
Grab 4
Grab 5
102030405060708090
100 **
Sample ID
LC50
/EC
50
Storm 8 Storm 9
ReproductionSurvival *LC50/EC50 > 100
Figure 22. LC and EC50 Point Estimate Results for C. dubia - Site 3.
May 2005 48
Hydrographic Toxicity Evaluation of Highway Stormwater Runoff
3.2 Toxicity Identification Evaluations (TIE)
TIEs performed during this study were designed to provide information related primarily to the class of compounds responsible for toxicity (Phase I TIE procedures) in as many samples as possible from the last two storm events tested (Storms 8 and 9). Although a weight-of-evidence approach, and some Phase II TIE procedures were used to identify a few primary toxicant suspects, further identification and confirmation of specific toxicants responsible for toxicity will require steps beyond those applied in this study. TIE results are summarized in Figures 23 through 26. Detailed data summaries for all TIE data are provided in Appendix C. Raw datasheets with daily counts and water quality information are provided in Appendix E.
3.2.1 TIE Assessment for Storm Event 8
Site 2, Grab Samples
Baseline and EDTA-amended sample results from the March 21, 2005 tests are provided for both P. promelas and C. dubia in Figure 23. EDTA was successful at removing some, but not all of the toxicity to P. promelas in all five grab samples. Grabs 1 and 2 were the most toxic, and EDTA had the least effect in these two samples. On the other hand, EDTA successfully removed all of the toxicity to C. dubia in Grabs 2-5, however, no toxicity was removed in Grab 1.
Site 2, Composite Samples
Results for a series of TIE treatments applied to Site 2 composite samples are provided in Figure 24.
The initial round of TIE treatments (EDTA, STS, and C18) was initiated on March 23, 2005. Similar to grab sample results for this site, EDTA was successful at reducing toxicity to P. promelas, while removing all toxicity to C. dubia. STS reduced toxicity slightly to C. dubia, and extraction through a C18 column reduced toxicity slightly to both species. In addition to oxidants, STS is also known to reduce toxicity to some trace metals including copper, cadmium, silver and selenium (Hockett and Mount 1996). This preliminary round of testing identified cationic trace metals as a primary class of toxicants of concern for both test species.
A second round of tests, initiated April 12, 2005, focused on potential effects due to both trace metals and ammonia. Ammonia appeared to be of potential concern to P. promelas based on its total concentration in Grabs 1-3 (12 to 20 mg/L). Total ammonia levels above approximately 10 mg/L are considered of toxicological concern for both species depending on pH (EPA 1993b, Nautilus 2001). It has been shown that P. promelas larvae are also more sensitive to ammonia than C. dubia following acute
May 2005 49
Hydrographic Toxicity Evaluation of Highway Stormwater Runoff
exposures (EPA 1993b, Nautilus 2001). This difference in sensitivity to ammonia might explain why EDTA was less effective at removing all of the toxicity to P. promelas during the initial round of tests.
Results of this second round confirmed the ability of EDTA to completely remove sample toxicity to C. dubia. EDTA, however, was less successful at reducing toxicity to P. promelas during this round. Zeolite completely removed toxicity to both P. promelas and C. dubia. Zeolite removes ammonia, but also removes some cationic trace metals and nonpolar organics (Schubauer-Berigan et al. 1993b). Through physical binding, zeolite may also remove particulates and other chemicals such as surfactants. Addition of ammonia in post-zeolite samples back to its original concentration recovered almost all observed toxicity to P. promelas, but was not toxic to C. dubia. This result provides strong evidence that ammonia contributed to observed toxicity to P. promelas, but not to C. dubia. A combined post-zeolite and EDTA treatment showed no effect due to the complete removal of toxicity by zeolite alone.
The un-ionized form of ammonia is the fraction most closely associated with toxicity to fish species and this form is pH-dependent where the proportion of un-ionized ammonia increases with increasing pH (Thurston and Russo 1981). Adjustment of the sample to pH 6 had no effect on P. promelas and slightly increased toxicity to C. dubia. This result is not consistent with ammonia toxicity, but is consistent with results that have found toxicity of some trace metals (copper and lead in particular) increases as pH decreases (Schubauer-Berigan et al. 1993a). Adjustment of the sample to pH 9 increased toxicity to P. promelas, which is consistent with ammonia toxicity, but decreased toxicity to C. dubia, which is consistent with toxicity due to some metals.
A subsequent series of TIE treatments was performed April 22, 2005 on the composite sample to determine whether the toxicant of concern may be a nonpolar organic and/or related to particulates that may have been be removed by the zeolite column. Extraction through zeolite and addition of EDTA again removed nearly all observed toxicity. Removal of particulates through centrifugation, and extraction of the sample through a C18 column failed to reduce toxicity. These results indicate that the toxicant of concern is likely not a nonpolar organic or particulate-related compound. A methanol extract from the C18 column concentrated 3X was not toxic, providing further supporting evidence that a nonpolar organic is likely not a toxicant of concern in this composite sample.
In summary, results based on toxicity data alone, indicate that toxicity in Storm 8, Site 2 samples to P. promelas appears to be due to a combination of both cationic trace metals and ammonia. With the exception of Grab sample 1, toxicity to C. dubia is likely due solely to cationic trace metals based on the specificity of the EDTA treatment.
May 2005 50
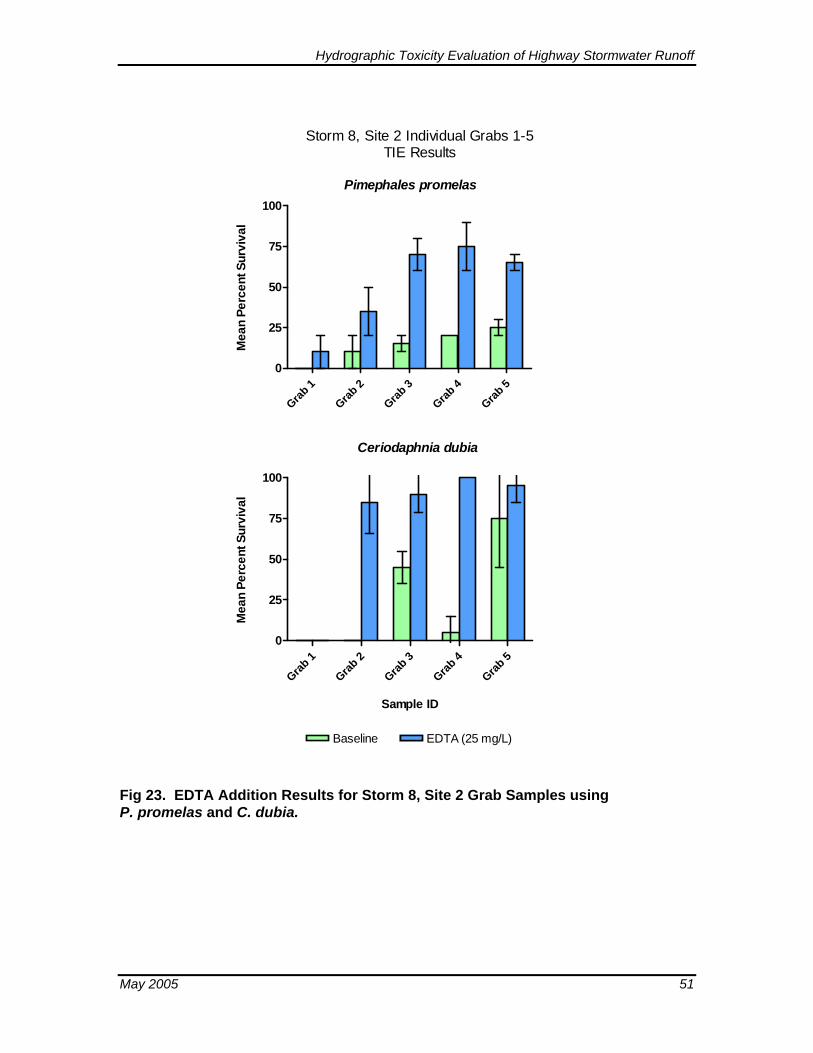
Hydrographic Toxicity Evaluation of Highway Stormwater Runoff
Grab 1
Grab 2
Grab 3
Grab 4
Grab 5
0
25
50
75
100Pimephales promelas
Mea
n Pe
rcen
t Sur
viva
l
Grab 1
Grab 2
Grab 3
Grab 4
Grab 5
0
25
50
75
100
EDTA (25 mg/L)Baseline
Ceriodaphnia dubia
Sample ID
Mea
n Pe
rcen
t Sur
viva
l
Storm 8, Site 2 Individual Grabs 1-5TIE Results
Fig 23. EDTA Addition Results for Storm 8, Site 2 Grab Samples using P. promelas and C. dubia.
May 2005 51
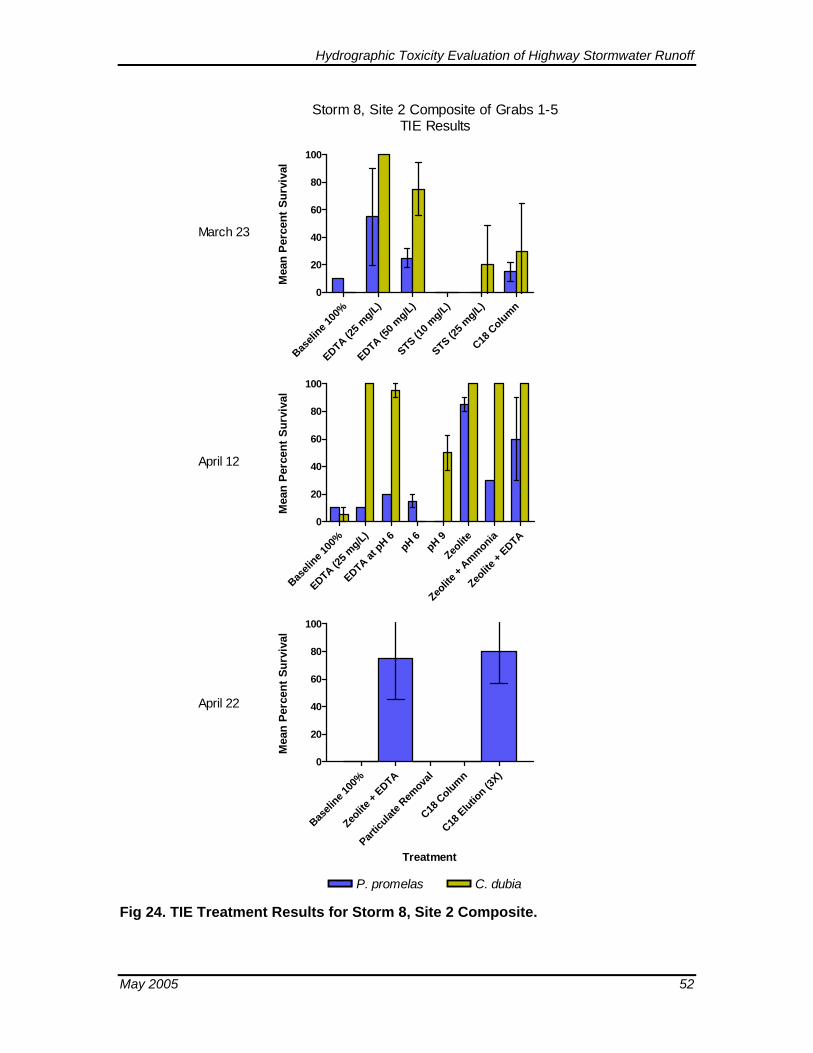
Hydrographic Toxicity Evaluation of Highway Stormwater Runoff
Baseli
ne 100
%
EDTA (25 m
g/L)
EDTA (50 m
g/L)
STS (10 m
g/L)
STS (25 m
g/L)
C18 C
olumn0
20
40
60
80
100
Mea
n Pe
rcen
t Sur
viva
l
P. promelas
Baseli
ne 100
%
EDTA (25 m
g/L)
EDTA at pH 6
pH 6pH 9
Zeolite
Zeolite
+ Ammonia
Zeolite
+ EDTA
0
20
40
60
80
100
Mea
n Pe
rcen
t Sur
viva
l
Baseli
ne 100
%
Zeolite
+ EDTA
Particu
late R
emova
l
C18 C
olumn
C18 Elutio
n (3X)
0
20
40
60
80
100
Treatment
Mea
n Pe
rcen
t Sur
viva
l
March 23
April 12
April 22
C. dubia
Storm 8, Site 2 Composite of Grabs 1-5TIE Results
Fig 24. TIE Treatment Results for Storm 8, Site 2 Composite.
May 2005 52
Hydrographic Toxicity Evaluation of Highway Stormwater Runoff
Site 3, Grab Samples
Baseline and EDTA-amended sample results are provided for both P. promelas and C. dubia in Figure 25. EDTA was successful at removing some but not all of the toxicity to P. promelas in Grab samples 2, 3, and 5. Toxicity was not reduced in Grabs 1 and 4. EDTA successfully removed toxicity to C. dubia in Grab sample 2. Similar to P. promelas, toxicity was not reduced in Grab 1. Toxicity in Grab sample 3 was no longer present in the Baseline sample.
Site 3, Composite Samples
Results for a series of TIE treatments for Site 3 composite samples are provided in Figure 26.
The initial round of TIE treatments (EDTA, STS, and C18) was initiated on March 23, 2005. Similar to grab samples for this site, EDTA was successful at slightly reducing toxicity of the composite to P. promelas. The composite was no longer toxic to C. dubia, thus limiting interpretation for this species. Addition of STS, as well as extraction through a C18 column also moderately reduced toxicity to P. promelas. This preliminary round of tests indicated that toxicity to P. promelas was due to a combination of cationic trace metals and some other toxicant(s).
A second round of tests (initiated April 12, 2005) focused on potential effects due to both trace metals and ammonia. As with Site 2, ammonia appeared to be of potential concern to P. promelas based on its total concentration in Grabs 1 and 2 with concentrations of 11.2 and 18 mg/L, respectively.
During this second round of testing, EDTA was no longer successful at reducing toxicity to P. promelas. Extraction through zeolite partially removed toxicity to P. promelas. Addition of ammonia in the post-zeolite sample back to its original concentration recovered some, but not all, observed toxicity. A combined post-zeolite and EDTA treatment was not successful at reducing toxicity beyond that accomplished by zeolite alone.
Adjustment of the sample to pH 6 slightly reduced toxicity while adjustment of the sample to pH 9 increased toxicity to P. promelas. These results are consistent with that expected for ammonia.
A subsequent series of tests was performed April 22, 2005 on the composite sample to determine whether the toxicant of concern may be a nonpolar organic and/or related to particulates that may be removed through the zeolite column. Extraction through zeolite and addition of EDTA again removed some toxicity, but not as much as that observed during the prior round of tests. The sample itself was also more toxic than that in prior
May 2005 53
Hydrographic Toxicity Evaluation of Highway Stormwater Runoff
tests. Removal of particulates through centrifugation failed to reduce toxicity. Extraction of the sample through a C18 column slightly reduced toxicity indicating potential contribution of toxicity due to nonpolar organics. A methanol extract from the C18 column concentrated 3X did recover some toxicity, but not enough to account for that observed in the Baseline sample.
In summary, results based on toxicity data alone, indicate that toxicity in Storm 8, Site 3 samples to P. promelas appears to be due to a combination of cationic metals, ammonia, and other unidentified toxicants. Toxicity to C. dubia in Grab sample 2 is likely due primarily to cationic trace metals based on the specificity of the EDTA treatment.
May 2005 54
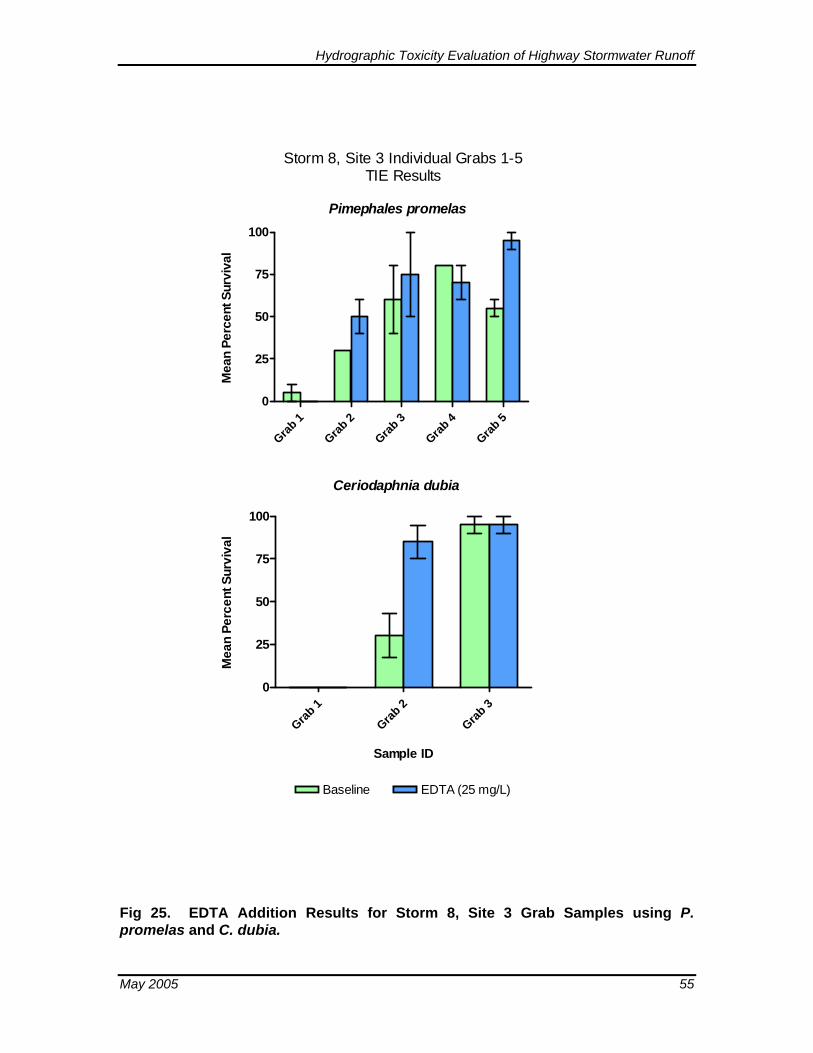
Hydrographic Toxicity Evaluation of Highway Stormwater Runoff
Grab 1
Grab 2
Grab 3
Grab 4
Grab 5
0
25
50
75
100
Pimephales promelasM
ean
Perc
ent S
urvi
val
Grab 1
Grab 2
Grab 3
0
25
50
75
100
Ceriodaphnia dubia
Baseline EDTA (25 mg/L)
Sample ID
Mea
n Pe
rcen
t Sur
viva
l
Storm 8, Site 3 Individual Grabs 1-5TIE Results
Fig 25. EDTA Addition Results for Storm 8, Site 3 Grab Samples using P. promelas and C. dubia.
May 2005 55
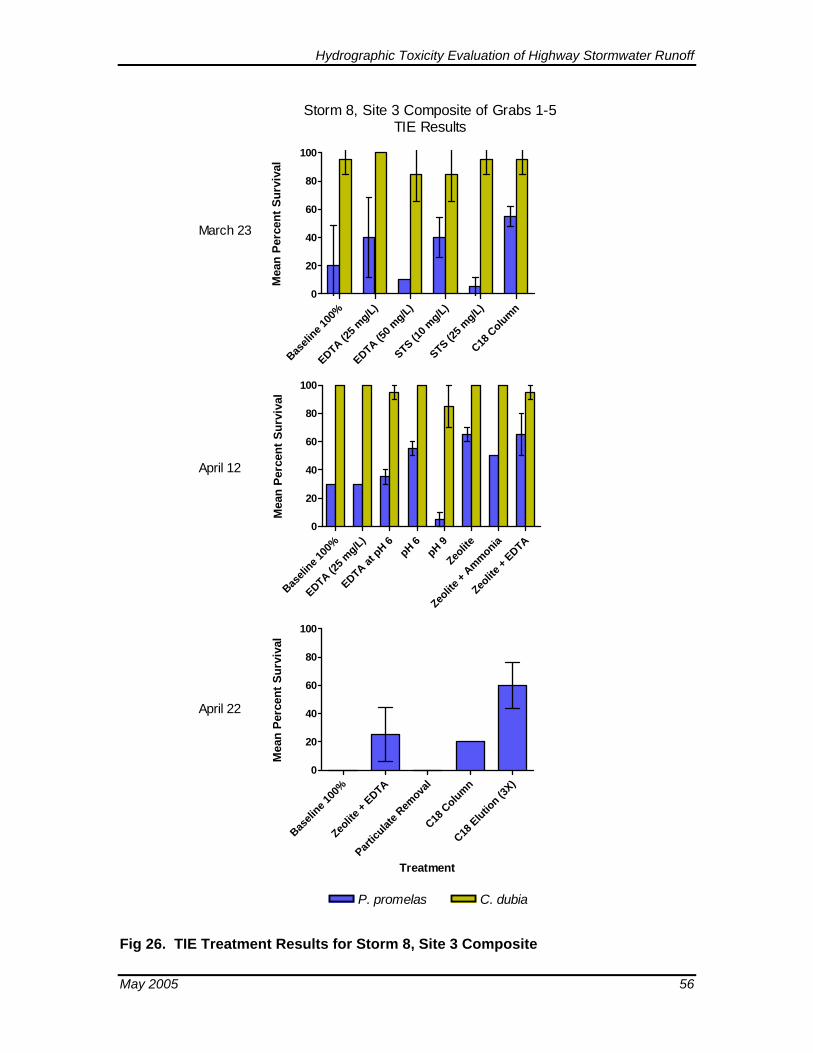
Hydrographic Toxicity Evaluation of Highway Stormwater Runoff
Baseli
ne 100
%
EDTA (25 m
g/L)
EDTA (50 m
g/L)
STS (10 m
g/L)
STS (25 m
g/L)
C18 C
olumn0
20
40
60
80
100
Mea
n Pe
rcen
t Sur
viva
l
P. promelas
Baseli
ne 100
%
EDTA (25 m
g/L)
EDTA at pH 6
pH 6pH 9
Zeolite
Zeolite
+ Ammonia
Zeolite
+ EDTA
0
20
40
60
80
100
Mea
n Pe
rcen
t Sur
viva
l
Baseli
ne 100
%
Zeolite
+ EDTA
Particu
late R
emova
l
C18 C
olumn
C18 Elutio
n (3X)
0
20
40
60
80
100
Treatment
Mea
n Pe
rcen
t Sur
viva
l
March 23
April 12
April 22
Storm 8, Site 3 Composite of Grabs 1-5TIE Results
C. dubia
Fig 26. TIE Treatment Results for Storm 8, Site 3 Composite
May 2005 56
Hydrographic Toxicity Evaluation of Highway Stormwater Runoff
Ammonia Toxicity
To further evaluate potential toxicity due to ammonia in Storm 8 samples, regression analyses were performed between un-ionized ammonia and survival for both sites and both test species among TIE treatments performed during the second round of tests initiated April 12, 2005 (Figure 27). LC50 values derived at Nautilus for both species are also displayed for comparison. Although the number of data points is limited, a strong relationship was observed for P. promelas in both Site 2 and 3 TIE treatments. C. dubia exhibited a poor relation for Site 2 but a strong relationship with Site 3. Relationships were primarily driven by a single data point (the pH 9 treatment) with a high level of un-ionized ammonia. Un-ionized ammonia in baseline samples, at 0.48 and 0.36 mg/L for Sites 2 and 3 respectively, were actually slightly less than the lowest LC50 values derived at Nautilus at a pH of approximately 7.8 to 8.0 for P. promelas (0.64 mg/L), and C. dubia (1.1 mg/L). The toxicity of un-ionized ammonia itself, however, is also pH-dependant, with greater toxicity at lower pH values (EPA 1993b). Estimated acute LC50 values for P. promelas at a pH of 7.0 are 0.48 and 0.27 mg/L un-ionized ammonia after 48 and 96-hour exposures, respectively (EPA 1993b). An estimated acute LC50 value for C. dubia at a pH of 7.0 is 0.53 mg/L un-ionized ammonia after a 48-hour exposure. A summary of ammonia LC50 values derived for C. dubia and P. promelas at Nautilus and those published in the literature is provided in Table 10.
The highest concentration of un-ionized ammonia in most original screening samples tested (0.02 to 0.09 mg/L) was much lower than that expected to cause toxicity. Grab 5 from Site 2 had an un-ionized ammonia concentration of 0.50 mg/L at pH 8.4, and the composite from this site had an un-ionized ammonia concentration of 0.25 mg/L at a pH of 8.6. Grab 5 from Site 3 had an un-ionized ammonia concentration of 0.21 mg/L at pH 8.4. The concentrations of un-ionized ammonia at these pH values is well below that expected to cause toxicity as well. These observations tend to suggest that those TIE results that implicate ammonia toxicity may actually be due to slight variations in pH during sample holding. It was observed that the fraction of un-ionized ammonia increased over time due to an upward pH drift of the samples during holding. This means that the contribution of toxicity due to ammonia will have increased over time between testing events.
This change in pH during holding may also partially explain why EDTA lost its ability to remove toxicity to P. promelas due to trace metals during the second round of tests for both composite samples. The proportion of toxicity due to ammonia increased and the increased pH likely reduced toxicity of trace metals.
In summary, it appears that the level of total ammonia in some initial stormwater grab samples may have caused toxicity to P. promelas during the TIE exposures depending on pH. However, toxicity in initial screening samples was likely not caused by ammonia, but some other toxicant(s) in addition to cationic trace metals. On the other hand,
May 2005 57
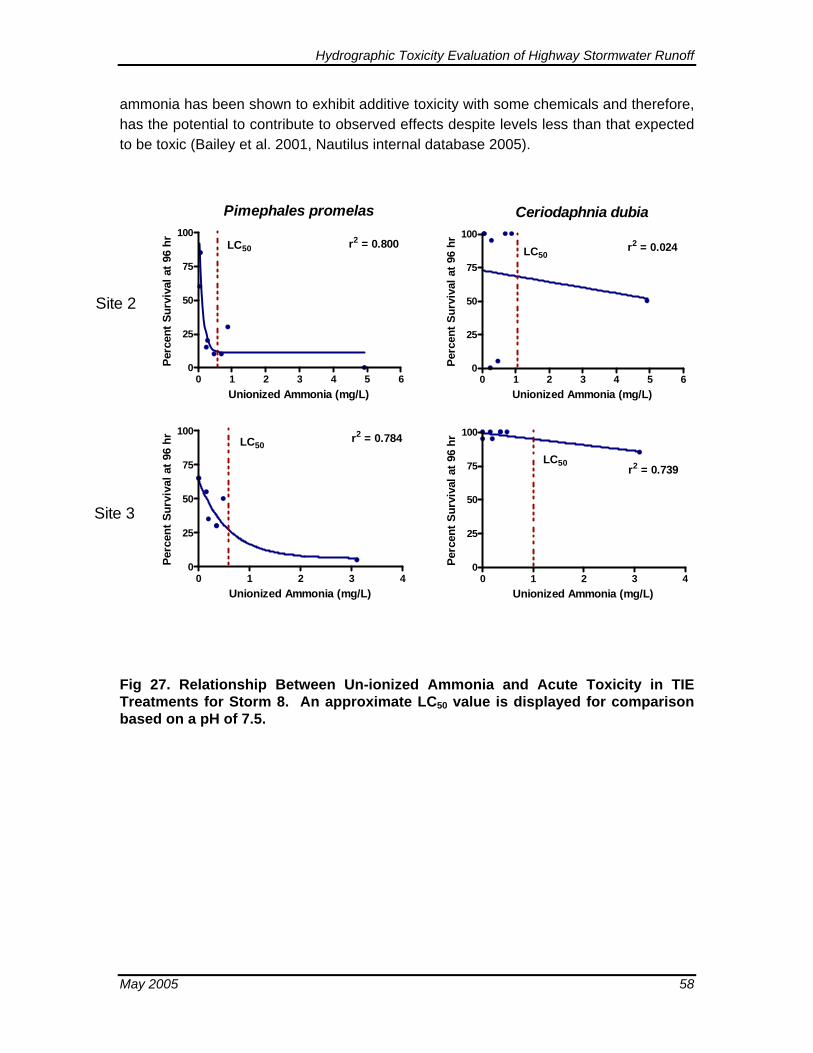
Hydrographic Toxicity Evaluation of Highway Stormwater Runoff
ammonia has been shown to exhibit additive toxicity with some chemicals and therefore, has the potential to contribute to observed effects despite levels less than that expected to be toxic (Bailey et al. 2001, Nautilus internal database 2005).
Pimephales promelas
0 1 2 3 4 5 60
25
50
75
100r2 = 0.800
Unionized Ammonia (mg/L)
Perc
ent S
urvi
val a
t 96
hr LC50
Ceriodaphnia dubia
0 1 2 3 4 5 60
25
50
75
100r2 = 0.024LC50
Unionized Ammonia (mg/L)
Perc
ent S
urvi
val a
t 96
hr
Site 2
0 1 2 3 40
25
50
75
100 r2 = 0.784
Unionized Ammonia (mg/L)
Perc
ent S
urvi
val a
t 96
hr LC50
0 1 2 3 40
25
50
75
100
r2 = 0.739LC50
Unionized Ammonia (mg/L)
Perc
ent S
urvi
val a
t 96
hr
Site 3
Fig 27. Relationship Between Un-ionized Ammonia and Acute Toxicity in TIE Treatments for Storm 8. An approximate LC50 value is displayed for comparison based on a pH of 7.5.
May 2005 58
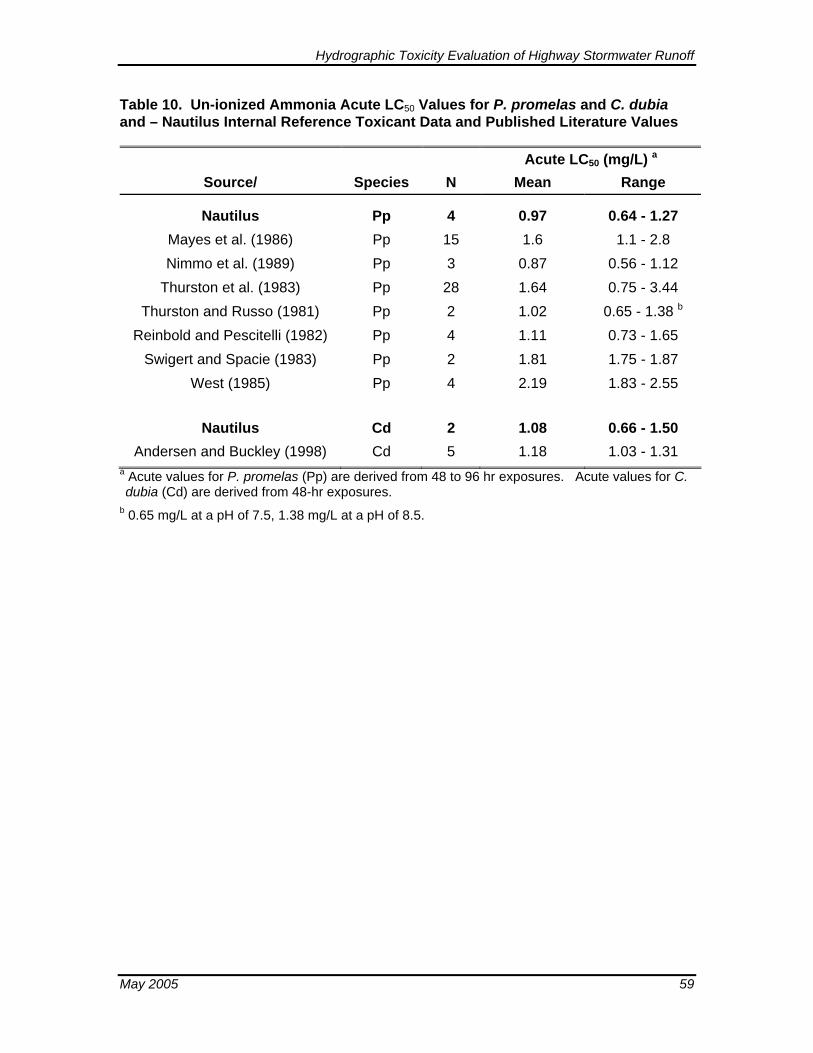
Hydrographic Toxicity Evaluation of Highway Stormwater Runoff
Table 10. Un-ionized Ammonia Acute LC50 Values for P. promelas and C. dubia and – Nautilus Internal Reference Toxicant Data and Published Literature Values
Acute LC50 (mg/L) a
Source/ Species N Mean Range
Nautilus Pp 4 0.97 0.64 - 1.27 Mayes et al. (1986) Pp 15 1.6 1.1 - 2.8 Nimmo et al. (1989) Pp 3 0.87 0.56 - 1.12
Thurston et al. (1983) Pp 28 1.64 0.75 - 3.44 Thurston and Russo (1981) Pp 2 1.02 0.65 - 1.38 b
Reinbold and Pescitelli (1982) Pp 4 1.11 0.73 - 1.65 Swigert and Spacie (1983) Pp 2 1.81 1.75 - 1.87
West (1985) Pp 4 2.19 1.83 - 2.55
Nautilus Cd 2 1.08 0.66 - 1.50 Andersen and Buckley (1998) Cd 5 1.18 1.03 - 1.31
a Acute values for P. promelas (Pp) are derived from 48 to 96 hr exposures. Acute values for C. dubia (Cd) are derived from 48-hr exposures.
b 0.65 mg/L at a pH of 7.5, 1.38 mg/L at a pH of 8.5.
May 2005 59
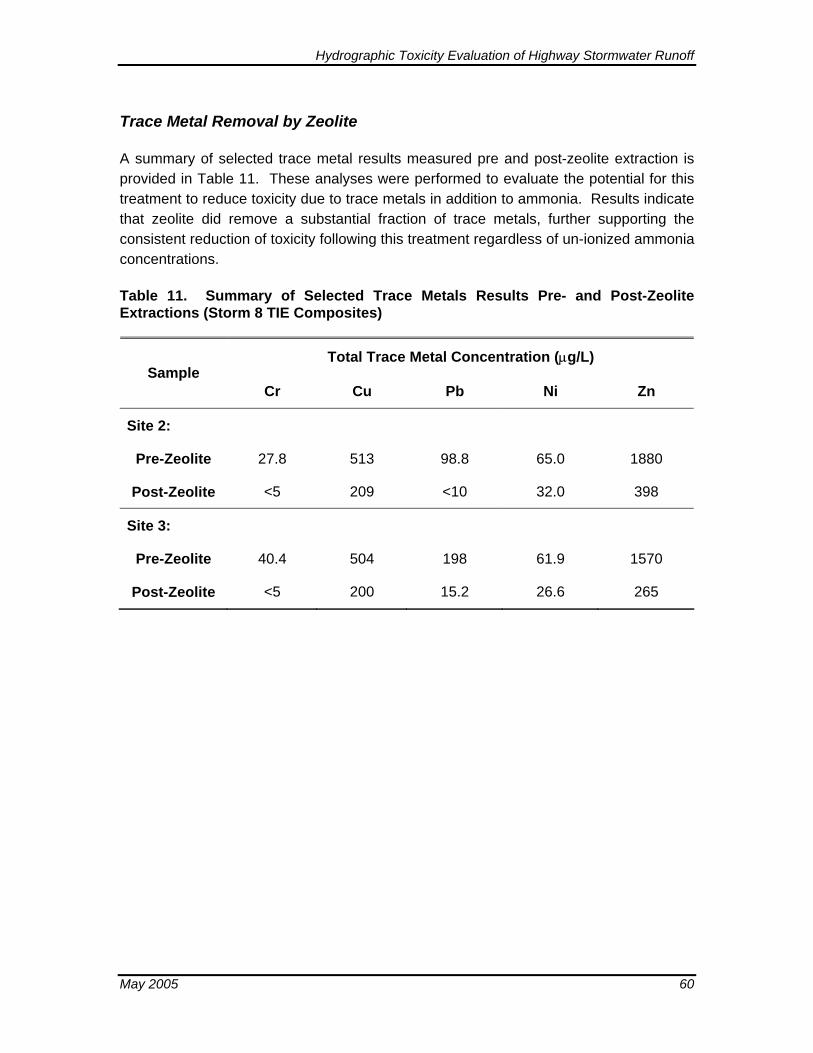
Hydrographic Toxicity Evaluation of Highway Stormwater Runoff
Trace Metal Removal by Zeolite
A summary of selected trace metal results measured pre and post-zeolite extraction is provided in Table 11. These analyses were performed to evaluate the potential for this treatment to reduce toxicity due to trace metals in addition to ammonia. Results indicate that zeolite did remove a substantial fraction of trace metals, further supporting the consistent reduction of toxicity following this treatment regardless of un-ionized ammonia concentrations.
Table 11. Summary of Selected Trace Metals Results Pre- and Post-Zeolite Extractions (Storm 8 TIE Composites)
Total Trace Metal Concentration (µg/L) Sample
Cr Cu Pb Ni Zn
Site 2:
Pre-Zeolite 27.8 513 98.8 65.0 1880
Post-Zeolite <5 209 <10 32.0 398
Site 3:
Pre-Zeolite 40.4 504 198 61.9 1570
Post-Zeolite <5 200 15.2 26.6 265
May 2005 60
Hydrographic Toxicity Evaluation of Highway Stormwater Runoff
3.2.2 TIE Assessment for Storm Event 9
Due to limited timeframe available prior to reporting, a single set of TIE treatments was performed on May 5, 2005. However, the samples and C18 columns remain archived at Nautilus in case further examination is desired. A summary of results obtained from these the treatments performed follows.
Site 2, Grab Samples
A summary of TIE results for Site 2 grab samples is provided for P. promelas and C. dubia in Figures 28 and 29, respectively. The addition of EDTA successfully removed toxicity in all grab samples tested for both species. Due to the specificity of this treatment, this result alone indicates that cationic trace metals are responsible for observed toxicity in all of these samples.
The pH 9 treatment also eliminated toxicity to P. promelas in all grabs samples tested (1 through 5), and substantially reduced toxicity to C. dubia in Grab samples 1 and 2. The pH 6 treatment, on the other hand, increased toxicity to P. promelas in Grab samples 1, 3, and 5, and to C. dubia in Grab sample 2. These results indicate that the cationic trace metals of concern in these grab samples likely include metals that increase in toxicity as pH decreases, such as copper and lead (Schubauer-Berigan et al. 1993a). The toxicity of some metals including cadmium, nickel, and zinc, have been found to increase in toxicity to C. dubia with increased pH. Based on toxicity and pH relationships observed during these tests, it is not likely that these three metals are responsible for observed toxicity. Interestingly, with one exception (Grab 2 with P. promelas), STS failed to reduce toxicity in any of the samples to both species. Addition of STS has been found to reduce acute toxicity to several cationic trace metals including copper, cadmium, silver, and selenium (Hockett and Mount 1996).
The zeolite extraction procedure was performed only on Grab samples 1 and 2 based on levels of total ammonia (15 and 7.2 mg/L) above that of potential concern depending on pH. Zeolite extraction was successful at removing toxicity for both species, however, as shown in Table 11, this treatment is also effective at removing a good proportion of some trace metals. Un-ionized ammonia concentrations of 0.04 to 0.28 mg/L during the screening tests is less than that expected to cause toxicity to either test species.
The C18 column also reduced or removed toxicity to P. promelas, but was unsuccessful at substantially reducing toxicity to C. dubia. This treatment also has the ability to substantially reduce concentrations of trace metals in the sample.
May 2005 61
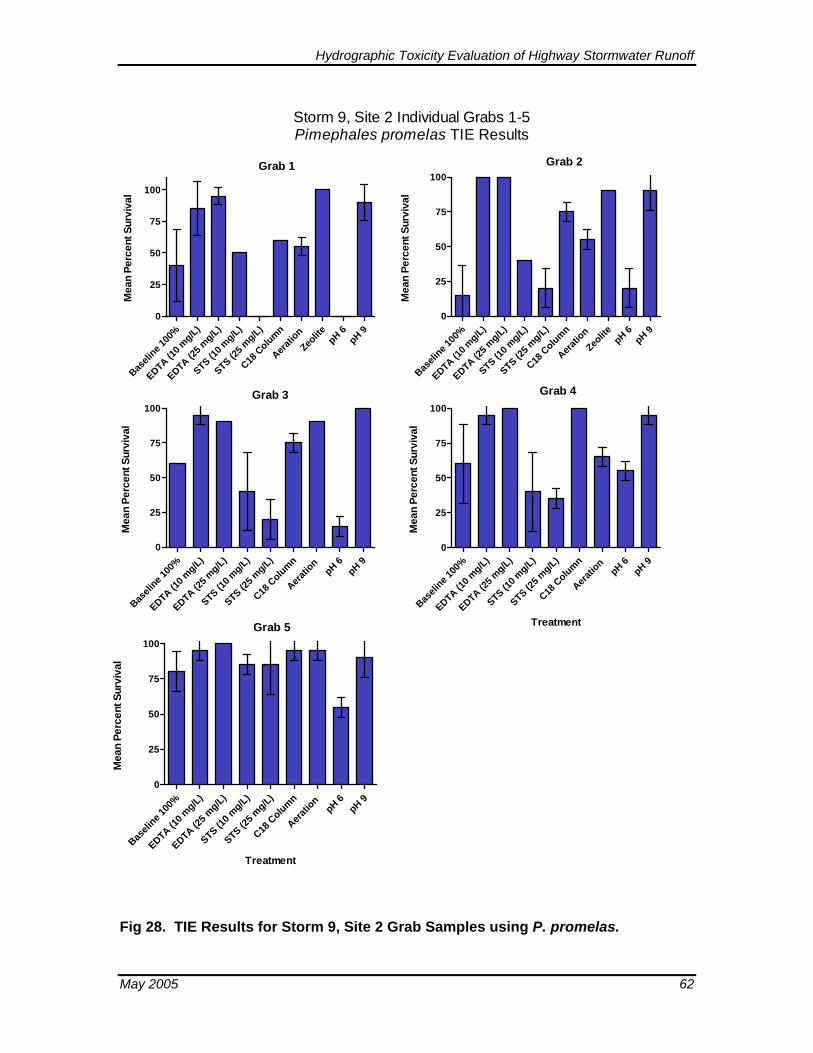
Hydrographic Toxicity Evaluation of Highway Stormwater Runoff
Baseli
ne 100
%
EDTA (10 m
g/L)
EDTA (25 m
g/L)
STS (10 m
g/L)
STS (25 m
g/L)
C18 C
olumn
Aeratio
n
Zeolite pH 6
pH 90
25
50
75
100
Grab 1
Mea
n Pe
rcen
t Sur
viva
l
Baseli
ne 100
%
EDTA (10 m
g/L)
EDTA (25 m
g/L)
STS (10 m
g/L)
STS (25 m
g/L)
C18 C
olumn
Aeratio
n
Zeolite pH 6
pH 90
25
50
75
100Grab 2
Mea
n Pe
rcen
t Sur
viva
l
Baseli
ne 100
%
EDTA (10 m
g/L)
EDTA (25 m
g/L)
STS (10 m
g/L)
STS (25 m
g/L)
C18 C
olumn
Aeratio
n pH 6
pH 90
25
50
75
100Grab 3
Mea
n Pe
rcen
t Sur
viva
l
Baseli
ne 100
%
EDTA (10 m
g/L)
EDTA (25 m
g/L)
STS (10 m
g/L)
STS (25 m
g/L)
C18 C
olumn
Aeratio
n pH 6
pH 90
25
50
75
100
Grab 4
Treatment
Mea
n Pe
rcen
t Sur
viva
l
Baseli
ne 100
%
EDTA (10 m
g/L)
EDTA (25 m
g/L)
STS (10 m
g/L)
STS (25 m
g/L)
C18 C
olumn
Aeratio
n pH 6
pH 90
25
50
75
100Grab 5
Treatment
Mea
n Pe
rcen
t Sur
viva
lStorm 9, Site 2 Individual Grabs 1-5Pimephales promelas TIE Results
Fig 28. TIE Results for Storm 9, Site 2 Grab Samples using P. promelas.
May 2005 62
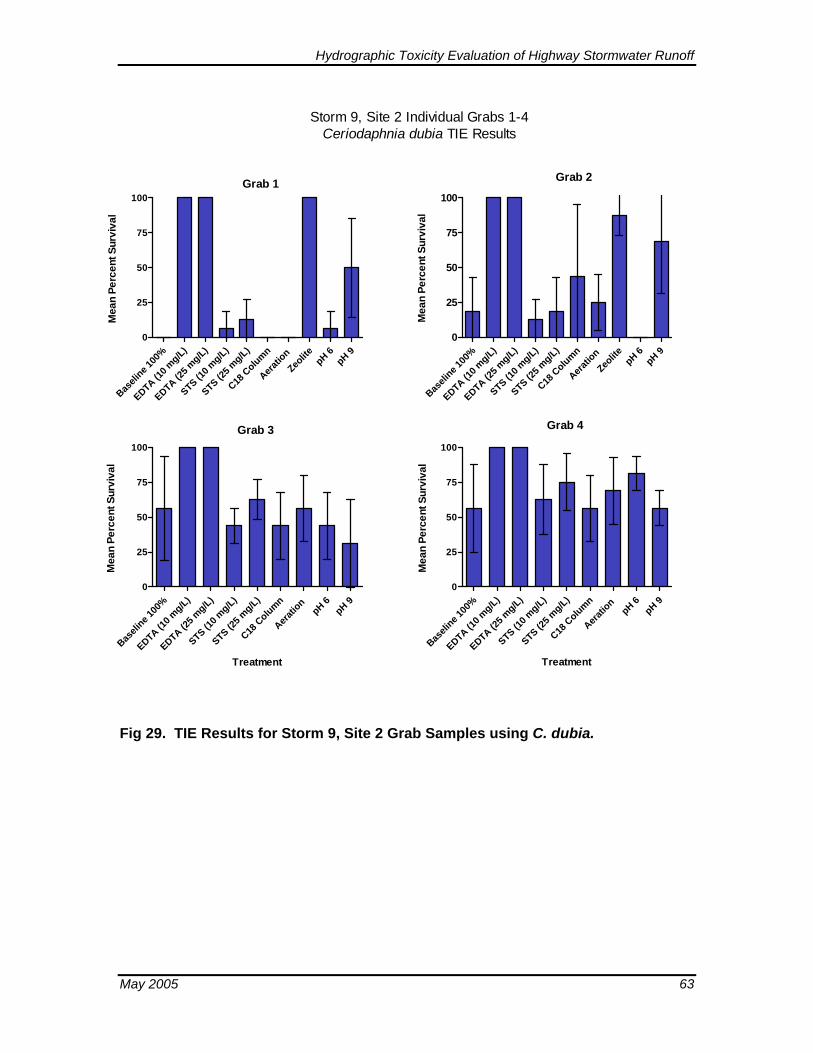
Hydrographic Toxicity Evaluation of Highway Stormwater Runoff
Baseli
ne 100
%
EDTA (10 m
g/L)
EDTA (25 m
g/L)
STS (10 m
g/L)
STS (25 m
g/L)
C18 C
olumn
Aeratio
n
Zeolite pH 6
pH 90
25
50
75
100Grab 1
Mea
n Pe
rcen
t Sur
viva
l
Baseli
ne 100
%
EDTA (10 m
g/L)
EDTA (25 m
g/L)
STS (10 m
g/L)
STS (25 m
g/L)
C18 C
olumn
Aeratio
n
Zeolite pH 6
pH 90
25
50
75
100
Grab 2
Mea
n Pe
rcen
t Sur
viva
l
Baseli
ne 100
%
EDTA (10 m
g/L)
EDTA (25 m
g/L)
STS (10 m
g/L)
STS (25 m
g/L)
C18 C
olumn
Aeratio
n pH 6
pH 90
25
50
75
100
Grab 3
Treatment
Mea
n Pe
rcen
t Sur
viva
l
Baseli
ne 100
%
EDTA (10 m
g/L)
EDTA (25 m
g/L)
STS (10 m
g/L)
STS (25 m
g/L)
C18 C
olumn
Aeratio
n pH 6
pH 90
25
50
75
100
Grab 4
Treatment
Mea
n Pe
rcen
t Sur
viva
l
Storm 9, Site 2 Individual Grabs 1-4Ceriodaphnia dubia TIE Results
Fig 29. TIE Results for Storm 9, Site 2 Grab Samples using C. dubia.
May 2005 63
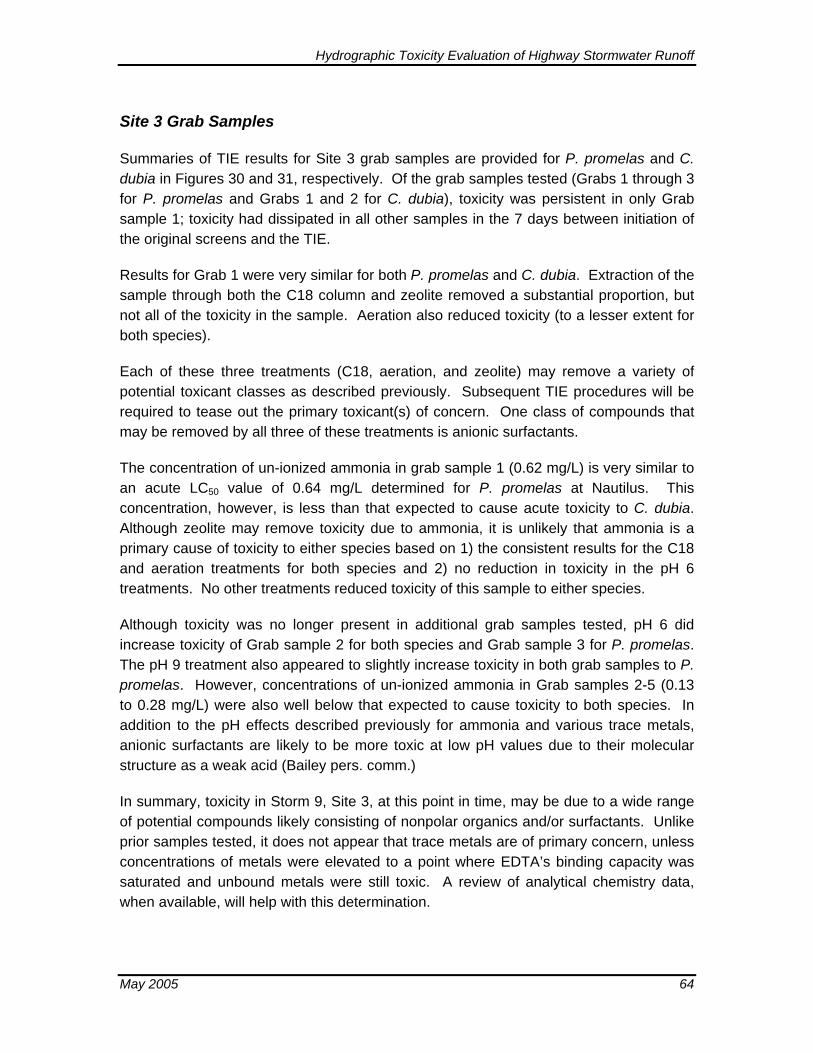
Hydrographic Toxicity Evaluation of Highway Stormwater Runoff
Site 3 Grab Samples
Summaries of TIE results for Site 3 grab samples are provided for P. promelas and C. dubia in Figures 30 and 31, respectively. Of the grab samples tested (Grabs 1 through 3 for P. promelas and Grabs 1 and 2 for C. dubia), toxicity was persistent in only Grab sample 1; toxicity had dissipated in all other samples in the 7 days between initiation of the original screens and the TIE.
Results for Grab 1 were very similar for both P. promelas and C. dubia. Extraction of the sample through both the C18 column and zeolite removed a substantial proportion, but not all of the toxicity in the sample. Aeration also reduced toxicity (to a lesser extent for both species).
Each of these three treatments (C18, aeration, and zeolite) may remove a variety of potential toxicant classes as described previously. Subsequent TIE procedures will be required to tease out the primary toxicant(s) of concern. One class of compounds that may be removed by all three of these treatments is anionic surfactants.
The concentration of un-ionized ammonia in grab sample 1 (0.62 mg/L) is very similar to an acute LC50 value of 0.64 mg/L determined for P. promelas at Nautilus. This concentration, however, is less than that expected to cause acute toxicity to C. dubia. Although zeolite may remove toxicity due to ammonia, it is unlikely that ammonia is a primary cause of toxicity to either species based on 1) the consistent results for the C18 and aeration treatments for both species and 2) no reduction in toxicity in the pH 6 treatments. No other treatments reduced toxicity of this sample to either species.
Although toxicity was no longer present in additional grab samples tested, pH 6 did increase toxicity of Grab sample 2 for both species and Grab sample 3 for P. promelas. The pH 9 treatment also appeared to slightly increase toxicity in both grab samples to P. promelas. However, concentrations of un-ionized ammonia in Grab samples 2-5 (0.13 to 0.28 mg/L) were also well below that expected to cause toxicity to both species. In addition to the pH effects described previously for ammonia and various trace metals, anionic surfactants are likely to be more toxic at low pH values due to their molecular structure as a weak acid (Bailey pers. comm.)
In summary, toxicity in Storm 9, Site 3, at this point in time, may be due to a wide range of potential compounds likely consisting of nonpolar organics and/or surfactants. Unlike prior samples tested, it does not appear that trace metals are of primary concern, unless concentrations of metals were elevated to a point where EDTA’s binding capacity was saturated and unbound metals were still toxic. A review of analytical chemistry data, when available, will help with this determination.
May 2005 64
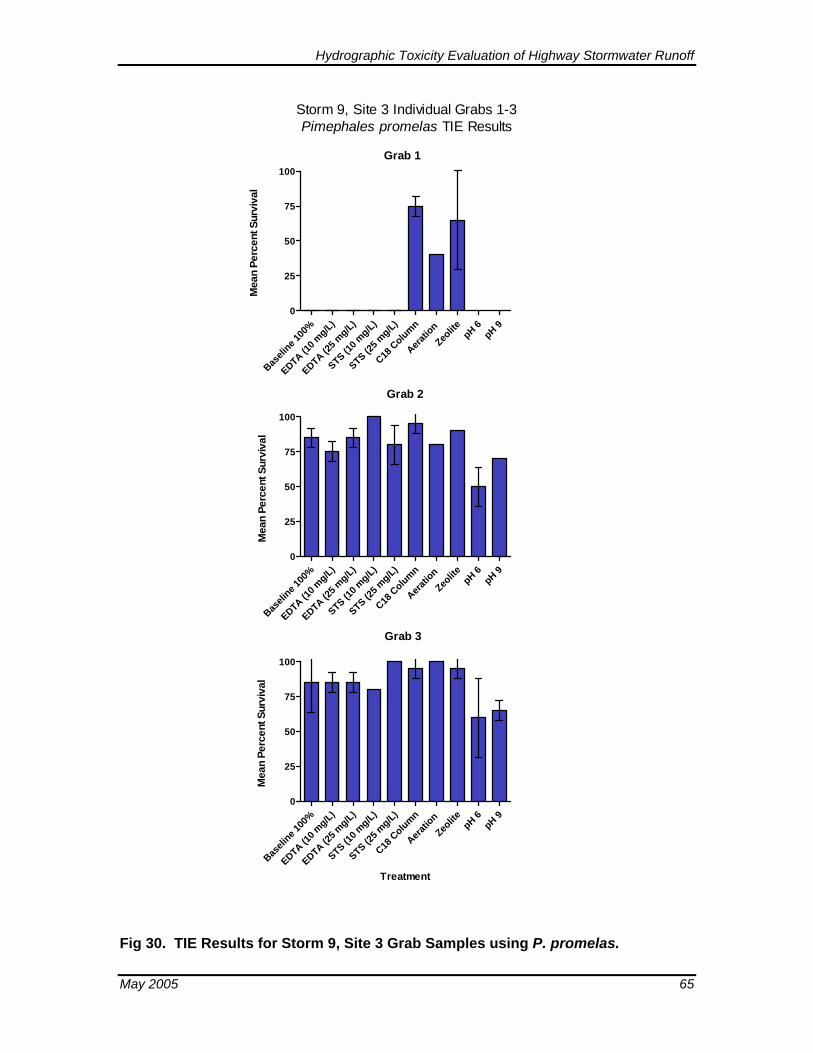
Hydrographic Toxicity Evaluation of Highway Stormwater Runoff
Baseli
ne 100
%
EDTA (10 m
g/L)
EDTA (25 m
g/L)
STS (10 m
g/L)
STS (25 m
g/L)
C18 C
olumn
Aeratio
n
Zeolite pH 6
pH 90
25
50
75
100Grab 1
Mea
n Pe
rcen
t Sur
viva
l
Baseli
ne 100
%
EDTA (10 m
g/L)
EDTA (25 m
g/L)
STS (10 m
g/L)
STS (25 m
g/L)
C18 C
olumn
Aeratio
n
Zeolite pH 6
pH 90
25
50
75
100
Grab 2
Mea
n Pe
rcen
t Sur
viva
l
Baseli
ne 100
%
EDTA (10 m
g/L)
EDTA (25 m
g/L)
STS (10 m
g/L)
STS (25 m
g/L)
C18 C
olumn
Aeratio
n
Zeolite pH 6
pH 90
25
50
75
100
Grab 3
Treatment
Mea
n Pe
rcen
t Sur
viva
l
Storm 9, Site 3 Individual Grabs 1-3Pimephales promelas TIE Results
Fig 30. TIE Results for Storm 9, Site 3 Grab Samples using P. promelas.
May 2005 65
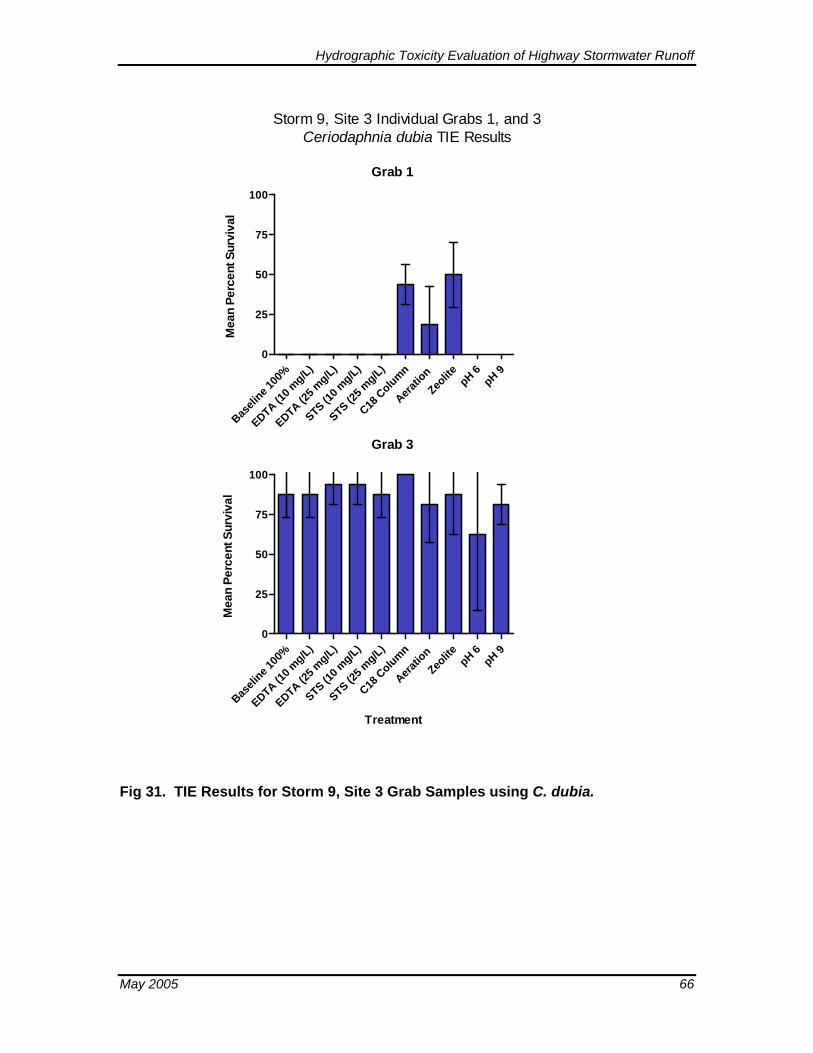
Hydrographic Toxicity Evaluation of Highway Stormwater Runoff
Baseli
ne 100
%
EDTA (10 m
g/L)
EDTA (25 m
g/L)
STS (10 m
g/L)
STS (25 m
g/L)
C18 C
olumn
Aeratio
n
Zeolite pH 6
pH 90
25
50
75
100
Grab 1
Mea
n Pe
rcen
t Sur
viva
l
Baseli
ne 100
%
EDTA (10 m
g/L)
EDTA (25 m
g/L)
STS (10 m
g/L)
STS (25 m
g/L)
C18 C
olumn
Aeratio
n
Zeolite pH 6
pH 90
25
50
75
100
Grab 3
Treatment
Mea
n Pe
rcen
t Sur
viva
l
Storm 9, Site 3 Individual Grabs 1, and 3Ceriodaphnia dubia TIE Results
Fig 31. TIE Results for Storm 9, Site 3 Grab Samples using C. dubia.
May 2005 66
Hydrographic Toxicity Evaluation of Highway Stormwater Runoff
3.2.3 Summary of Major Sources of Toxicity (Storms 8 and 9)
A few main points related to the TIE results are summarized below:
• The consistent success and specificity of the EDTA treatments for both test species suggests that cationic trace metals are a primary class of compounds of concern in a majority of samples tested.
• A nonpolar organic and/or surfactant was identified as the primary class of compound responsible for toxicity in one sample tested (Storm 9, Grab 1).
• Based on pH-related effects, copper appears to be the primary metal responsible for toxicity to both C. dubia and P. promelas in most samples tested. Zinc and nickel have been found to be more toxic to C. dubia at elevated pH, however, elevated pH actually reduced or removed toxicity in most samples tested with this treatment. Conversely, copper is known to increase in toxicity at low pH, which was observed in a number of Storm 9 grab samples for both test species. Upward drift of the pH 6 treatment during the TIE exposures may have limited the ability of this procedure to alter effects. Interestingly, STS is known to be effective at reducing toxicity to copper, however, this treatment was unsuccessful in almost all samples tested.
• Concentrations of total ammonia in a few initial first-flush grab samples (including those collected and tested with TIEs during Storms 8 and 9) were at levels of potential toxicological concern. However, the un-ionized fraction of ammonia, based on sample pH, in addition to combined results obtained from the TIE manipulations, indicated that this constituent was not a primary constituent responsible for observed toxicity. It is possible, however, that ammonia may have contributed partial toxicity in some samples through additive effects.
• C. dubia is more sensitive to trace metals than P. promelas. Despite this, EDTA was less effective at completely reducing toxicity to P. promelas. Ammonia may be contributing to P. promelas toxicity to some extent through additive toxicity or alternatively, some other compound that is more toxic to P. promelas than C. dubia is causing toxicity in some of the samples. Subsequent TIE studies are needed to further address these observations and hypotheses. Interestingly, P. promelas were generally more sensitive than C. dubia in all stormwater samples tested. In some instances, however, C. dubia was more sensitive than P. promelas. Based on C18 extraction results, the compound(s) of interest affecting P. promelas, in addition to trace metals, does not appear to be a nonpolar organic in Storm 8, Sites 2 and 3 and Storm 9, Site 2.
• Surfactants are one class of compound that may explain TIE results obtained for May 2005 67
Hydrographic Toxicity Evaluation of Highway Stormwater Runoff
both P. promelas and C. dubia in Storm 9. Available toxicity data suggests that P. promelas may be more sensitive to certain surfactants than C. dubia. It is recommended that this class of compounds be monitored in future sampling events based on concentrations found in samples collected during this study and evidence that this class of compounds may be responsible for some of the observed toxicity.
• TIE results were found to be consistent between storm events for Site 2, but differed dramatically for Site 3. This indicates that chemicals responsible for toxicity can differ between storm events at the same location.
3.3 Use of Analytical Chemistry Data to Estimate Effects
A summary of surfactant (as MBAS) analysis results obtained is provided in Table 12. Concentrations of MBAS ranged from 0.6 to 5.7 mg/L, with a general decreasing trend from Grab 1 forward. Concentrations of potential concern, depending on the type of surfactant, are in the range of approximately to 0.1 mg/L for P. promelas (Lewis 1991) and 0.2 to 4 mg/L for C. dubia (Ankley et al. 1990). Studies performed at Nautilus have identified toxicity of surfactants to P. promelas and C. dubia at MBAS levels of approximately 1.0 mg/L or greater.
Results (range, median, and mean values for each Site) for a suite of analyses provided to Nautilus by UCLA are summarized in Tables 13 and 14. Complete results for these data will be included in a separate report provided by UCLA. For comparison, a summary of selected toxicity data published for various metals and surfactants are provided for P. promelas and C. dubia in Tables 15 and 16, respectively.
The trace metals copper and zinc most often exceeded laboratory-derived levels found to cause toxicity. Toxicity of both copper and zinc has been found to be pH-dependant for both P. promelas and C. dubia. The toxicity of several trace metals to P. promelas and C. dubia was evaluated at a range of pH values (6.0 to 6.5, 7.0 to 7.5, and 8.0 to 8.5) by Schubauer-Berigan et al. (1993a). Toxicity of copper to both test species was found to increase substantially as the pH decreased. Toxicity of zinc to C. dubia, however, was found to decrease substantially as pH decreased. The response of P. promelas to zinc was less pronounced, with greatest toxicity observed at a mid-pH range of 7.0 to 7.5. Generally, the stormwater samples that were not aerated during the exposures were within a pH range of 6.0 to 7.5, whereas those that required aeration (P. promelas only), had pH values ranging from 7.5 to 8.5.
May 2005 68
Levels of copper were up to 51 times the lowest acute LC50 value reported for C. dubia (9.5 µg/L), and 32 times the lowest chronic LC50 value reported for P. promelas (15 µg/L) at a relevant pH range. For comparison, mean copper reference toxicant 7-day survival LC50 values for P. promelas and C. dubia derived at Nautilus (at a pH of approximately 7.9 to 8.3) are 114 and 72 µg/L, respectively. The mean concentrations of copper in the
Hydrographic Toxicity Evaluation of Highway Stormwater Runoff
first 5 grab samples from Site 2 (108 µg/L) and Site 3 (56 µg/L) stormwater grab samples are very similar to the chronic LC50 values derived at Nautilus for both species.
Levels of zinc were up to 12 times the lowest acute LC50 value reported for C. dubia (95 µg/L), and 3.4 times the lowest acute LC50 value reported for P. promelas (330 µg/L) at a relevant pH range. For comparison, a chronic LC50 value of approximately 240 µg/L has been determined at Nautilus at a pH of approximately 7.9 to 8.3. The overall mean concentrations of zinc in from Site 2 (108 µg/L) and Site 3 (181 µg/L) were greater than the lowest LC50 values reported in the literature, but less than those found at Nautilus. The mean for the first flush from Site 2, at 328 µg/L, however, exceeds all reported levels expected to cause toxicity to C. dubia.
Concentration of nickel did exceed values found to cause toxicity to C. dubia at a pH of greater than 8.0. Nickel toxicity to C. dubia is also pH-sensitive, with greater toxicity at higher pH values. However, pH of the test samples for this species were generally well below 8.0, thus limiting the toxicological concern due to this particular trace metal.
May 2005 69
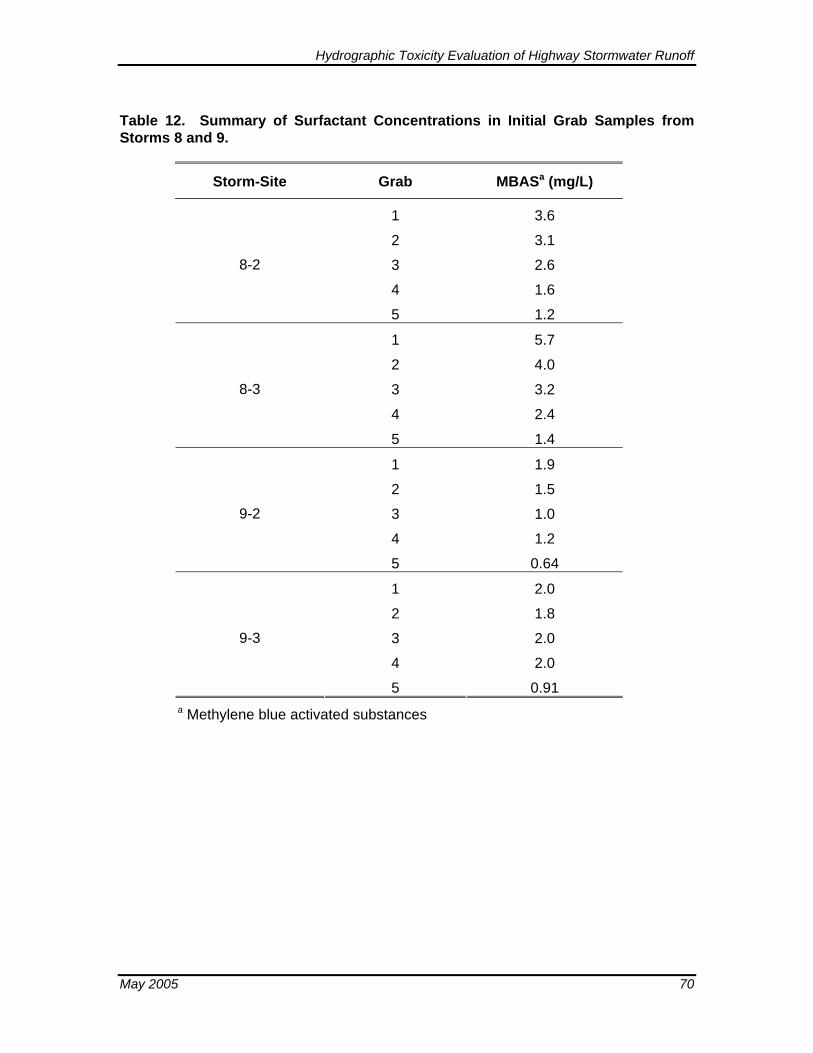
Hydrographic Toxicity Evaluation of Highway Stormwater Runoff
Table 12. Summary of Surfactant Concentrations in Initial Grab Samples from Storms 8 and 9.
Storm-Site Grab MBASa (mg/L)
1 3.6
2 3.1
3 2.6
4 1.6
8-2
5 1.2
1 5.7
2 4.0
3 3.2
4 2.4
8-3
5 1.4
1 1.9
2 1.5
3 1.0
4 1.2
9-2
5 0.64
1 2.0
2 1.8
3 2.0
4 2.0
9-3
5 0.91 a Methylene blue activated substances
May 2005 70
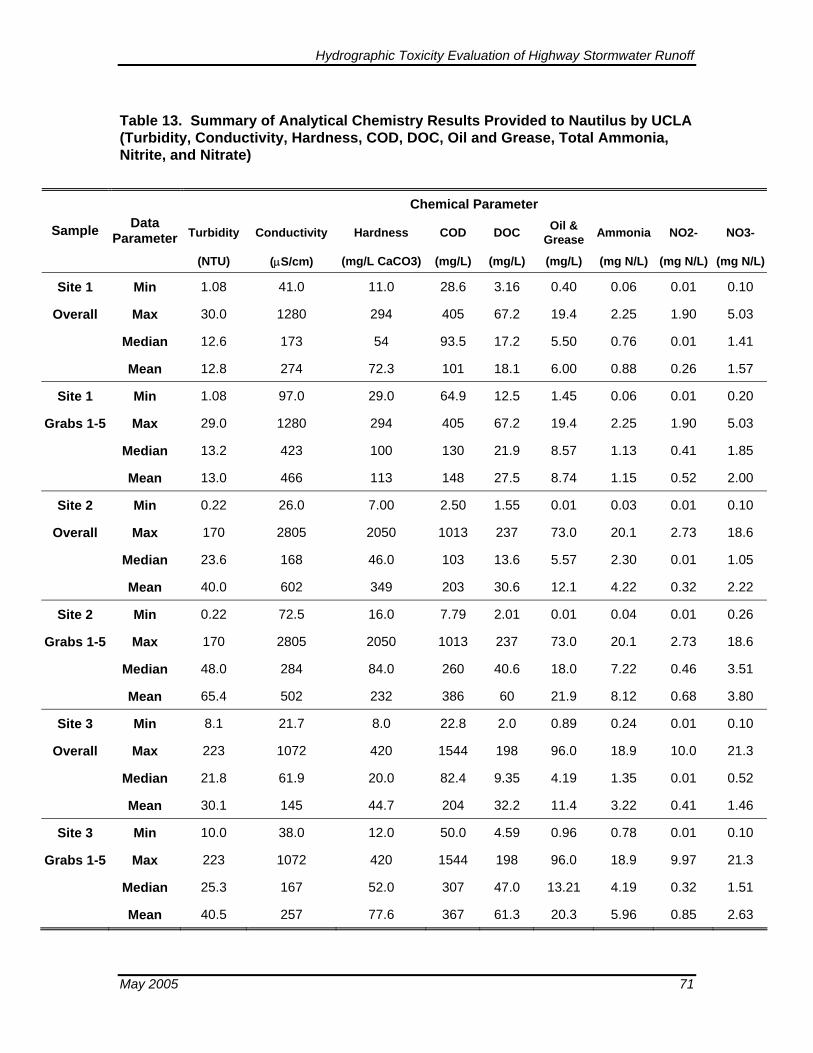
Hydrographic Toxicity Evaluation of Highway Stormwater Runoff
Table 13. Summary of Analytical Chemistry Results Provided to Nautilus by UCLA (Turbidity, Conductivity, Hardness, COD, DOC, Oil and Grease, Total Ammonia, Nitrite, and Nitrate)
Chemical Parameter
Turbidity Conductivity Hardness COD DOC Oil & Grease Ammonia NO2- NO3- Sample Data
Parameter (NTU) (µS/cm) (mg/L CaCO3) (mg/L) (mg/L) (mg/L) (mg N/L) (mg N/L) (mg N/L)
Site 1 Min 1.08 41.0 11.0 28.6 3.16 0.40 0.06 0.01 0.10
Overall Max 30.0 1280 294 405 67.2 19.4 2.25 1.90 5.03
Median 12.6 173 54 93.5 17.2 5.50 0.76 0.01 1.41
Mean 12.8 274 72.3 101 18.1 6.00 0.88 0.26 1.57
Site 1 Min 1.08 97.0 29.0 64.9 12.5 1.45 0.06 0.01 0.20
Grabs 1-5 Max 29.0 1280 294 405 67.2 19.4 2.25 1.90 5.03
Median 13.2 423 100 130 21.9 8.57 1.13 0.41 1.85
Mean 13.0 466 113 148 27.5 8.74 1.15 0.52 2.00
Site 2 Min 0.22 26.0 7.00 2.50 1.55 0.01 0.03 0.01 0.10
Overall Max 170 2805 2050 1013 237 73.0 20.1 2.73 18.6
Median 23.6 168 46.0 103 13.6 5.57 2.30 0.01 1.05
Mean 40.0 602 349 203 30.6 12.1 4.22 0.32 2.22
Site 2 Min 0.22 72.5 16.0 7.79 2.01 0.01 0.04 0.01 0.26
Grabs 1-5 Max 170 2805 2050 1013 237 73.0 20.1 2.73 18.6
Median 48.0 284 84.0 260 40.6 18.0 7.22 0.46 3.51
Mean 65.4 502 232 386 60 21.9 8.12 0.68 3.80
Site 3 Min 8.1 21.7 8.0 22.8 2.0 0.89 0.24 0.01 0.10
Overall Max 223 1072 420 1544 198 96.0 18.9 10.0 21.3
Median 21.8 61.9 20.0 82.4 9.35 4.19 1.35 0.01 0.52
Mean 30.1 145 44.7 204 32.2 11.4 3.22 0.41 1.46
Site 3 Min 10.0 38.0 12.0 50.0 4.59 0.96 0.78 0.01 0.10
Grabs 1-5 Max 223 1072 420 1544 198 96.0 18.9 9.97 21.3
Median 25.3 167 52.0 307 47.0 13.21 4.19 0.32 1.51
Mean 40.5 257 77.6 367 61.3 20.3 5.96 0.85 2.63
May 2005 71
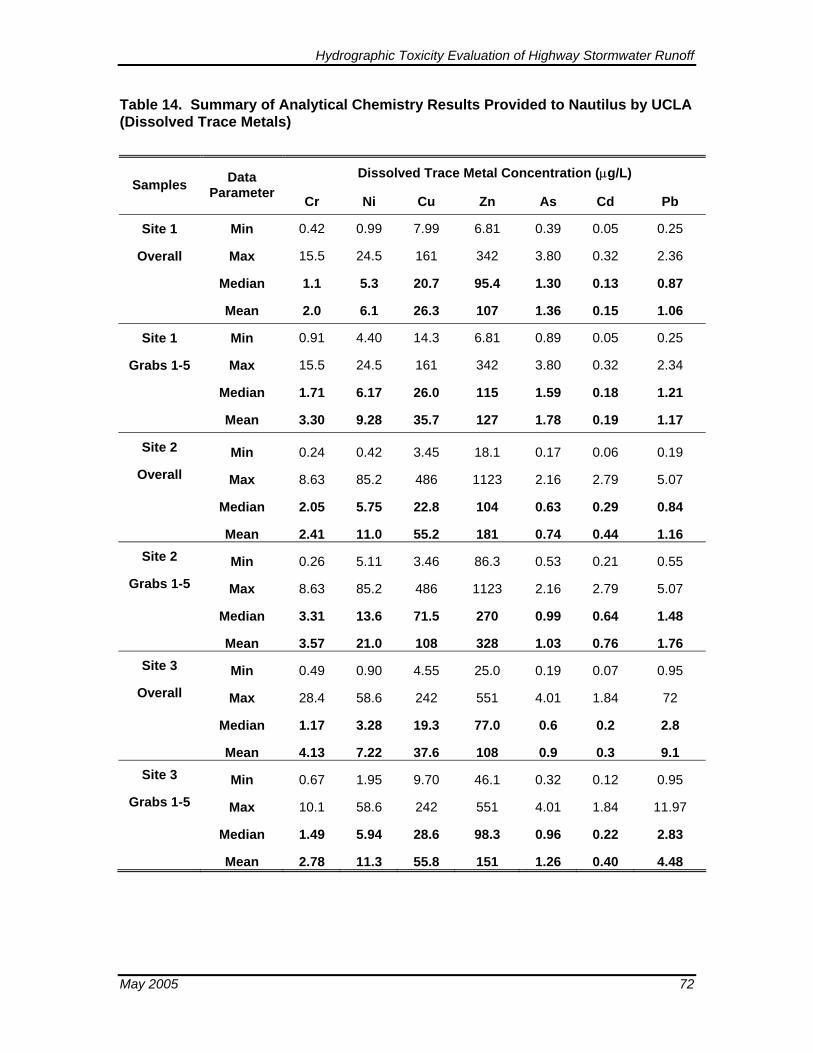
Hydrographic Toxicity Evaluation of Highway Stormwater Runoff
Table 14. Summary of Analytical Chemistry Results Provided to Nautilus by UCLA (Dissolved Trace Metals)
Dissolved Trace Metal Concentration (µg/L) Samples Data
Parameter Cr Ni Cu Zn As Cd Pb
Site 1 Min 0.42 0.99 7.99 6.81 0.39 0.05 0.25
Overall Max 15.5 24.5 161 342 3.80 0.32 2.36
Median 1.1 5.3 20.7 95.4 1.30 0.13 0.87
Mean 2.0 6.1 26.3 107 1.36 0.15 1.06
Site 1 Min 0.91 4.40 14.3 6.81 0.89 0.05 0.25
Grabs 1-5 Max 15.5 24.5 161 342 3.80 0.32 2.34
Median 1.71 6.17 26.0 115 1.59 0.18 1.21
Mean 3.30 9.28 35.7 127 1.78 0.19 1.17
Site 2 Min 0.24 0.42 3.45 18.1 0.17 0.06 0.19
Overall Max 8.63 85.2 486 1123 2.16 2.79 5.07
Median 2.05 5.75 22.8 104 0.63 0.29 0.84 Mean 2.41 11.0 55.2 181 0.74 0.44 1.16
Site 2 Min 0.26 5.11 3.46 86.3 0.53 0.21 0.55
Grabs 1-5 Max 8.63 85.2 486 1123 2.16 2.79 5.07
Median 3.31 13.6 71.5 270 0.99 0.64 1.48 Mean 3.57 21.0 108 328 1.03 0.76 1.76
Site 3 Min 0.49 0.90 4.55 25.0 0.19 0.07 0.95
Overall Max 28.4 58.6 242 551 4.01 1.84 72
Median 1.17 3.28 19.3 77.0 0.6 0.2 2.8 Mean 4.13 7.22 37.6 108 0.9 0.3 9.1
Site 3 Min 0.67 1.95 9.70 46.1 0.32 0.12 0.95
Grabs 1-5 Max 10.1 58.6 242 551 4.01 1.84 11.97
Median 1.49 5.94 28.6 98.3 0.96 0.22 2.83 Mean 2.78 11.3 55.8 151 1.26 0.40 4.48
May 2005 72
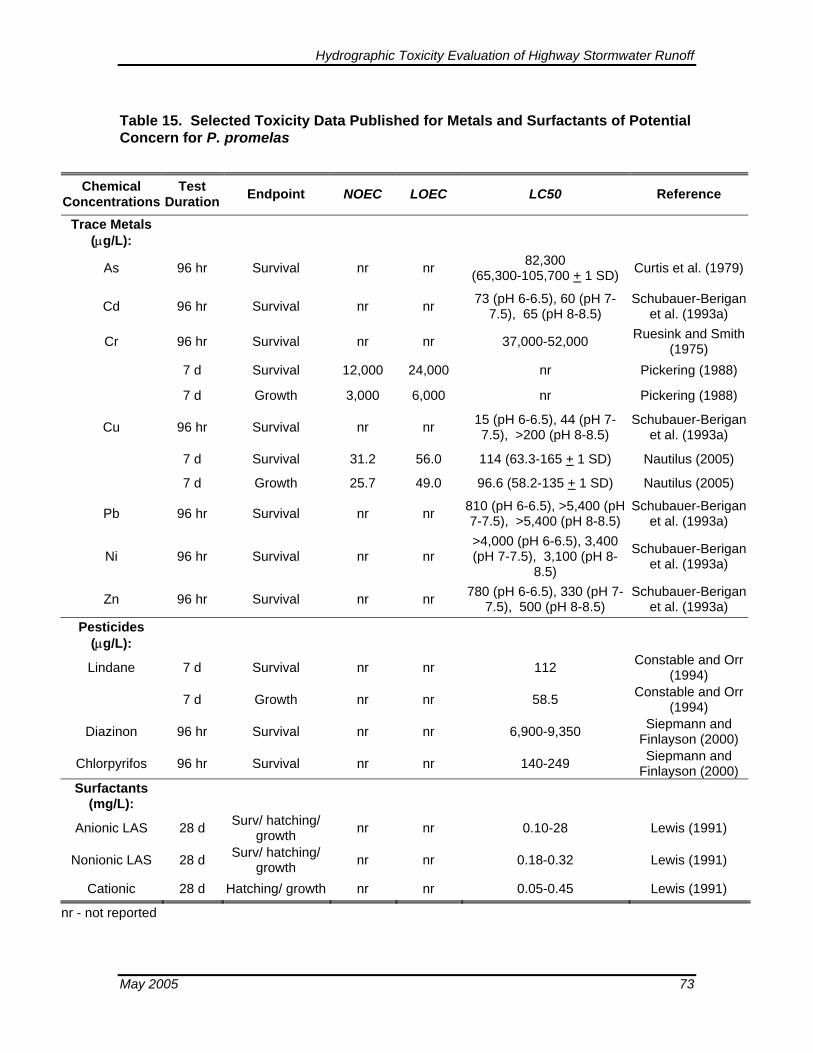
Hydrographic Toxicity Evaluation of Highway Stormwater Runoff
Table 15. Selected Toxicity Data Published for Metals and Surfactants of Potential Concern for P. promelas
Chemical
Concentrations Test
Duration Endpoint NOEC LOEC LC50 Reference
Trace Metals (µg/L):
As 96 hr Survival nr nr 82,300 (65,300-105,700 + 1 SD) Curtis et al. (1979)
Cd 96 hr Survival nr nr 73 (pH 6-6.5), 60 (pH 7-7.5), 65 (pH 8-8.5)
Schubauer-Berigan et al. (1993a)
Cr 96 hr Survival nr nr 37,000-52,000 Ruesink and Smith (1975)
7 d Survival 12,000 24,000 nr Pickering (1988)
7 d Growth 3,000 6,000 nr Pickering (1988)
Cu 96 hr Survival nr nr 15 (pH 6-6.5), 44 (pH 7-7.5), >200 (pH 8-8.5)
Schubauer-Berigan et al. (1993a)
7 d Survival 31.2 56.0 114 (63.3-165 + 1 SD) Nautilus (2005)
7 d Growth 25.7 49.0 96.6 (58.2-135 + 1 SD) Nautilus (2005)
Pb 96 hr Survival nr nr 810 (pH 6-6.5), >5,400 (pH 7-7.5), >5,400 (pH 8-8.5)
Schubauer-Berigan et al. (1993a)
Ni 96 hr Survival nr nr >4,000 (pH 6-6.5), 3,400 (pH 7-7.5), 3,100 (pH 8-
8.5)
Schubauer-Berigan et al. (1993a)
Zn 96 hr Survival nr nr 780 (pH 6-6.5), 330 (pH 7-7.5), 500 (pH 8-8.5)
Schubauer-Berigan et al. (1993a)
Pesticides (µg/L):
Lindane 7 d Survival nr nr 112 Constable and Orr (1994)
7 d Growth nr nr 58.5 Constable and Orr (1994)
Diazinon 96 hr Survival nr nr 6,900-9,350 Siepmann and Finlayson (2000)
Chlorpyrifos 96 hr Survival nr nr 140-249 Siepmann and Finlayson (2000)
Surfactants (mg/L):
Anionic LAS 28 d Surv/ hatching/ growth nr nr 0.10-28 Lewis (1991)
Nonionic LAS 28 d Surv/ hatching/ growth nr nr 0.18-0.32 Lewis (1991)
Cationic 28 d Hatching/ growth nr nr 0.05-0.45 Lewis (1991)
nr - not reported
May 2005 73
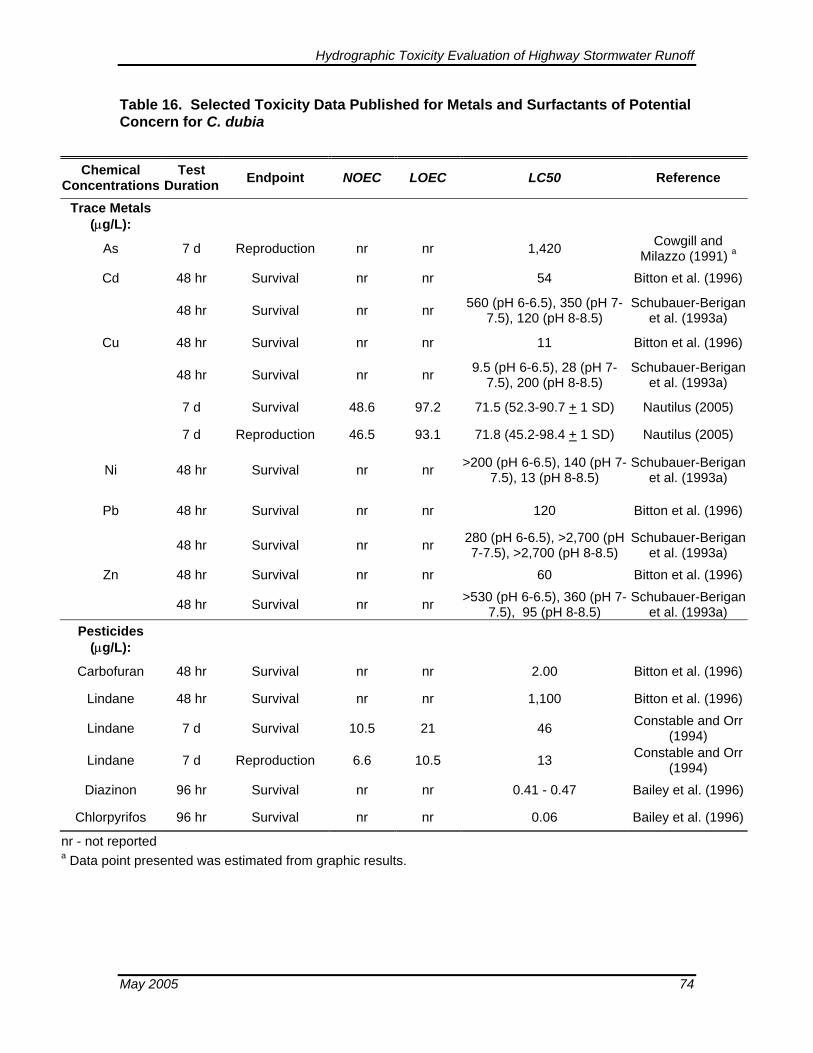
Hydrographic Toxicity Evaluation of Highway Stormwater Runoff
Table 16. Selected Toxicity Data Published for Metals and Surfactants of Potential Concern for C. dubia
Chemical
Concentrations Test
Duration Endpoint NOEC LOEC LC50 Reference
Trace Metals (µg/L):
As 7 d Reproduction nr nr 1,420 Cowgill and Milazzo (1991) a
Cd 48 hr Survival nr nr 54 Bitton et al. (1996)
48 hr Survival nr nr 560 (pH 6-6.5), 350 (pH 7-7.5), 120 (pH 8-8.5)
Schubauer-Berigan et al. (1993a)
Cu 48 hr Survival nr nr 11 Bitton et al. (1996)
48 hr Survival nr nr 9.5 (pH 6-6.5), 28 (pH 7-7.5), 200 (pH 8-8.5)
Schubauer-Berigan et al. (1993a)
7 d Survival 48.6 97.2 71.5 (52.3-90.7 + 1 SD) Nautilus (2005)
7 d Reproduction 46.5 93.1 71.8 (45.2-98.4 + 1 SD) Nautilus (2005)
Ni 48 hr Survival nr nr >200 (pH 6-6.5), 140 (pH 7-7.5), 13 (pH 8-8.5)
Schubauer-Berigan et al. (1993a)
Pb 48 hr Survival nr nr 120 Bitton et al. (1996)
48 hr Survival nr nr 280 (pH 6-6.5), >2,700 (pH 7-7.5), >2,700 (pH 8-8.5)
Schubauer-Berigan et al. (1993a)
Zn 48 hr Survival nr nr 60 Bitton et al. (1996)
48 hr Survival nr nr >530 (pH 6-6.5), 360 (pH 7-7.5), 95 (pH 8-8.5)
Schubauer-Berigan et al. (1993a)
Pesticides (µg/L):
Carbofuran 48 hr Survival nr nr 2.00 Bitton et al. (1996)
Lindane 48 hr Survival nr nr 1,100 Bitton et al. (1996)
Lindane 7 d Survival 10.5 21 46 Constable and Orr (1994)
Lindane 7 d Reproduction 6.6 10.5 13 Constable and Orr (1994)
Diazinon 96 hr Survival nr nr 0.41 - 0.47 Bailey et al. (1996)
Chlorpyrifos 96 hr Survival nr nr 0.06 Bailey et al. (1996)
nr - not reported a Data point presented was estimated from graphic results.
May 2005 74
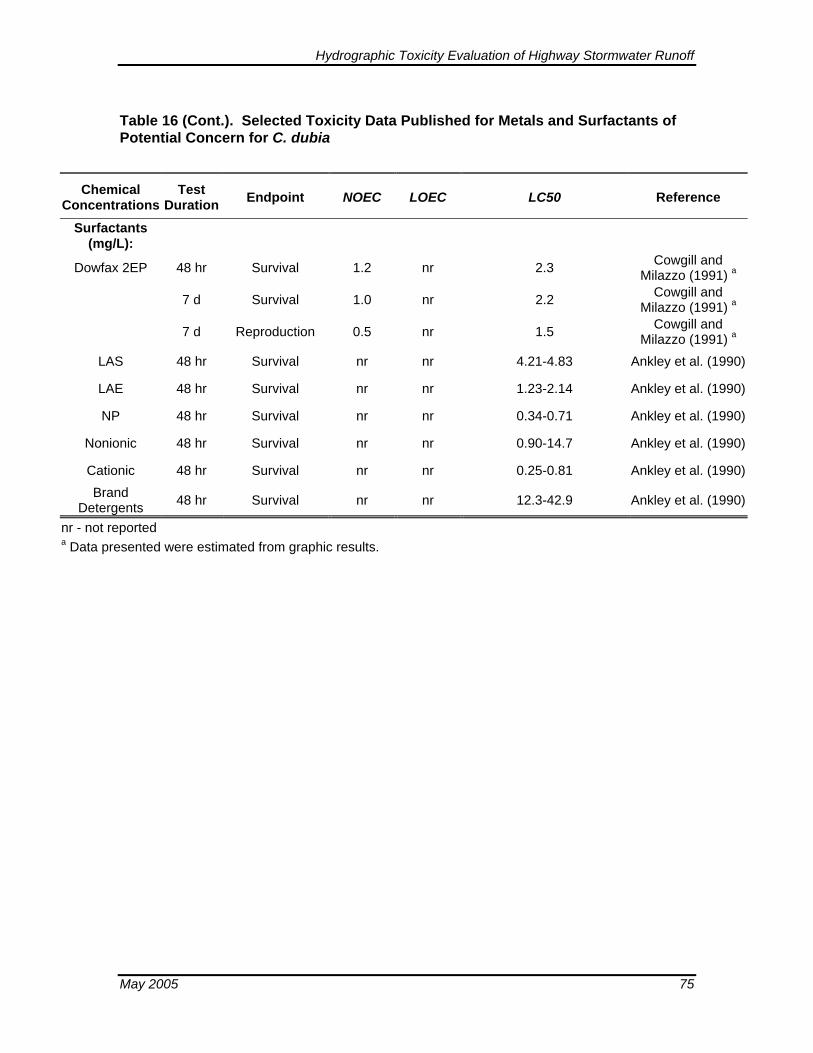
Hydrographic Toxicity Evaluation of Highway Stormwater Runoff
Table 16 (Cont.). Selected Toxicity Data Published for Metals and Surfactants of Potential Concern for C. dubia
Chemical
Concentrations Test
Duration Endpoint NOEC LOEC LC50 Reference
Surfactants (mg/L):
Dowfax 2EP 48 hr Survival 1.2 nr 2.3 Cowgill and Milazzo (1991) a
7 d Survival 1.0 nr 2.2 Cowgill and Milazzo (1991) a
7 d Reproduction 0.5 nr 1.5 Cowgill and Milazzo (1991) a
LAS 48 hr Survival nr nr 4.21-4.83 Ankley et al. (1990)
LAE 48 hr Survival nr nr 1.23-2.14 Ankley et al. (1990)
NP 48 hr Survival nr nr 0.34-0.71 Ankley et al. (1990)
Nonionic 48 hr Survival nr nr 0.90-14.7 Ankley et al. (1990)
Cationic 48 hr Survival nr nr 0.25-0.81 Ankley et al. (1990)Brand
Detergents 48 hr Survival nr nr 12.3-42.9 Ankley et al. (1990)
nr - not reported a Data presented were estimated from graphic results.
May 2005 75
Hydrographic Toxicity Evaluation of Highway Stormwater Runoff
3.3.1 Screening Test Chemistry versus Toxicity Relationships
Relationships between the various analytical parameters measured in this study and toxicity endpoints are summarized in Figures 32 through 35. These figures combine all available data collected during the initial screening studies from all storms and sites for the following toxicity endpoints: 1) P. promelas 7-day survival; 2) C. dubia 7-day survival; and 3) C. dubia reproduction. Trace metals data from Storm 9, however, are not included, as they were not finalized prior to production of this report. Analyses for growth of P. promelas are not shown in these figures due to its strong relationship to survival. Acute toxicity data were also evaluated but are not displayed due to the relative similarity to that observed for the chronic endpoints for both species. Parameters that had no overall relation to toxicity (e.g. arsenic, chromium, lead, conductivity, and hardness) were also not depicted in these figures.
In general, there is agreement between a number of elevated chemical parameters and toxicity, as expected. Threshold levels, where toxicity was always present in this study, are depicted as vertical red lines on each figure. Based on data collected to date, there is a reasonable potential for toxicity to occur when levels of specific constituents or parameters exceed these values. These figures, however, are rather poor at evaluating cause and effect relationships for the following reasons:
1) Chemical data often co-vary, as observed in this study,
2) Only a select group of potentially toxic chemicals are analyzed and reported,
3) A number of environmental parameters may affect the toxicity of any given compound (e.g. pH, hardness, particulates, total and dissolved organics),
4) Speciation of the chemical may strongly affect toxicity. Dissolved metals, for example, may consist of a variety of ionic and nonionic forms that may differ greatly in their toxicity (Sandrin and Maier, 2002),
5) Stormwater consists of a complex mixture of compounds that may interact in a variety of ways that effect toxicity of any given constituent. Some chemicals, such as some trace metals, organophosphate pesticides, and ammonia are known to have additive or synergistic toxicity (Forget et. al. 1999, Bailey et al., 1997 and 2001). Mixtures of other chemicals may also result in antagonistic or inhibitory effects (Ankley et al. 1991), and
6) Combining all data for all storms dilutes relationships that may be clear for certain groups of samples.
May 2005 76
Hydrographic Toxicity Evaluation of Highway Stormwater Runoff
Interestingly, the strongest relationship for all stormwater data combined was observed for total ammonia and survival of P. promelas with an r2 value of 0.651. The relationship with un-ionized ammonia, (i.e. the fraction of ammonia most associated with toxicity) was much weaker, with an r2 value of only 0.243. Despite the relationship with total ammonia, measurements of un-ionized ammonia during the screening tests in all but a few grab samples were well below that expected to cause toxicity based on laboratory-derived values.
Relationships between P. promelas survival and COD, DOC, and oil and grease were also relatively strong with r2 values ranging from 0.508 to 0.524. Relationships between all toxicity endpoints presented and dissolved trace metals including cadmium, copper, nickel, and zinc were relatively similar with r2 values ranging from 0.242 (copper versus C. dubia reproduction) to 0.481 (copper versus P. promelas). Overall, relationships were generally stronger for P. promelas than C. dubia.
Relationships between surfactant concentrations (as MBAS) and survival of P. promelas and C. dubia for Grab samples 1-5 collected from Storms 8 and 9 are shown in Figure 35. Although the overall relationships were weak, a threshold of 2.0 to 2.5 mg/L for P. promelas and C. dubia, respectively are consistent with that observed previously.
When groups of grab samples from a single storm and site are evaluated, stronger relationships may be observed. For example, toxicity to P. promelas in Storm 2, Site 3 had very strong relationships (r2 values of > 0.8) with conductivity, hardness, COD, DOC, oil and grease, total ammonia, nitrite, chromium, copper, nickel, and cadmium, whereas most of these relationships were very poor for C. dubia in this particular set of samples.
Toxicants and/or their bioavailability may also vary during a storm event as evident by periods of toxicity that occur later in a storm after the first-flush toxicity disappears. In a few cases, at least one or more chemical parameters corresponded well to a toxic hit later during a storm. In Storm 2, Site 2, toxicity and DOC, conductivity, oil and grease, and several trace metals increased in Grabs 4 and 5 following a reduction in most parameters in Grabs 2 and 3. In another sample (Storm 8, Site 2) a dramatic increase in conductivity in Grabs 7 through 12 was related to a latent toxicity hit to C. dubia. In most cases, however, an increase in toxicity later during a storm was not related at all to chemical parameters measured.
These observations illustrate the difficulty in attributing toxicity to a specific compound based on relationships alone. Comparison of measured chemical parameters to known effect-levels is one way of narrowing down primary constituents of concern. Screening the available data for this study identified copper, zinc, and surfactants as constituents of primary concern. Laboratory-derived data, however, are often very conservative since tests are performed in clean water without natural organics and particulates that are May 2005 77
Hydrographic Toxicity Evaluation of Highway Stormwater Runoff
known to reduce toxicity of numerous compounds (Bergman and Dorward-King 1997). For example, a number of non-toxic stormwater samples in this study had levels of copper and zinc well above expected effects levels for both species tested. On the other hand, it is also known that chemical additivity or synergistic relationships may result in more toxicity than expected for any single compound (Klaassen 1996).
May 2005 78
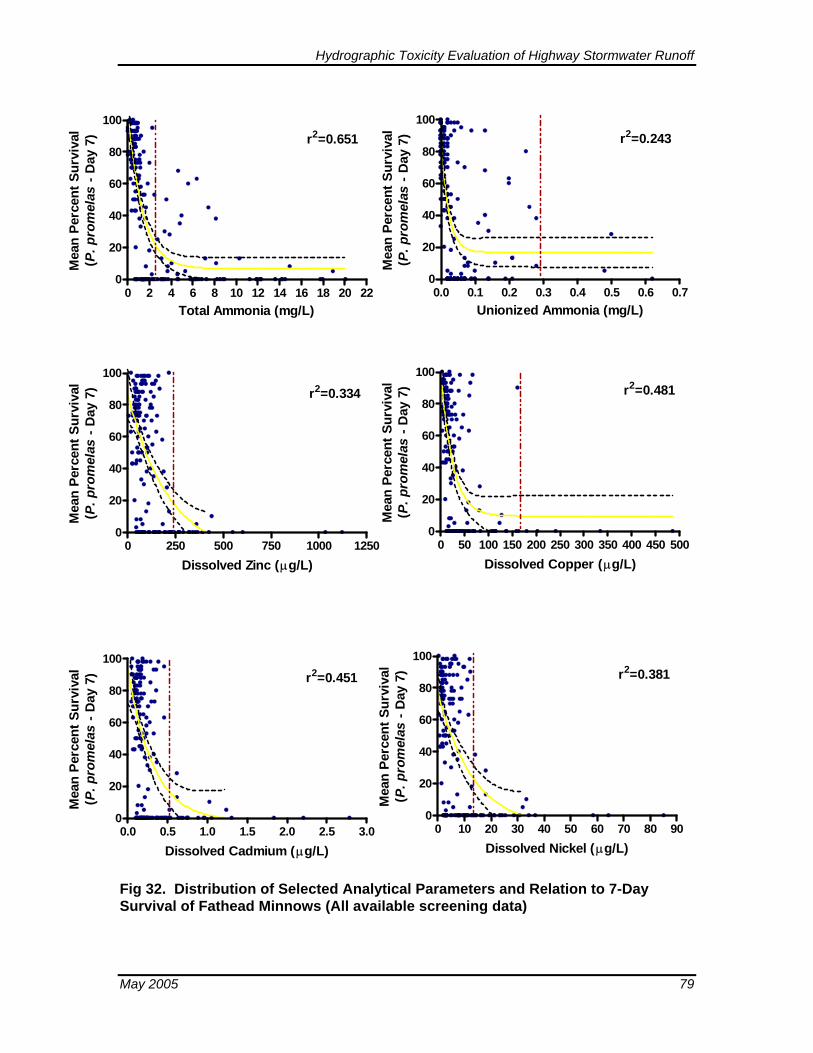
Hydrographic Toxicity Evaluation of Highway Stormwater Runoff
0 2 4 6 8 10 12 14 16 18 20 220
20
40
60
80
100
Total Ammonia (mg/L)
Mea
n Pe
rcen
t Sur
viva
l(P
. pro
mel
as -
Day
7) r2=0.651
0 50 100 150 200 250 300 350 400 450 5000
20
40
60
80
100
Dissolved Copper (µg/L)
Mea
n Pe
rcen
t Sur
viva
l(P
. pro
mel
as -
Day
7) r2=0.481
0 250 500 750 1000 12500
20
40
60
80
100
Dissolved Zinc (µg/L)
Mea
n Pe
rcen
t Sur
viva
l(P
. pro
mel
as -
Day
7) r2=0.334
0 10 20 30 40 50 60 70 80 900
20
40
60
80
100
Dissolved Nickel (µg/L)
Mea
n Pe
rcen
t Sur
viva
l(P
. pro
mel
as -
Day
7) r2=0.381
0.0 0.5 1.0 1.5 2.0 2.5 3.00
20
40
60
80
100
Dissolved Cadmium (µg/L)
Mea
n Pe
rcen
t Sur
viva
l(P
. pro
mel
as -
Day
7) r2=0.451
0.0 0.1 0.2 0.3 0.4 0.5 0.6 0.70
20
40
60
80
100r2=0.243
Unionized Ammonia (mg/L)
Mea
n Pe
rcen
t Sur
viva
l(P
. pro
mel
as -
Day
7)
Fig 32. Distribution of Selected Analytical Parameters and Relation to 7-Day Survival of Fathead Minnows (All available screening data)
May 2005 79
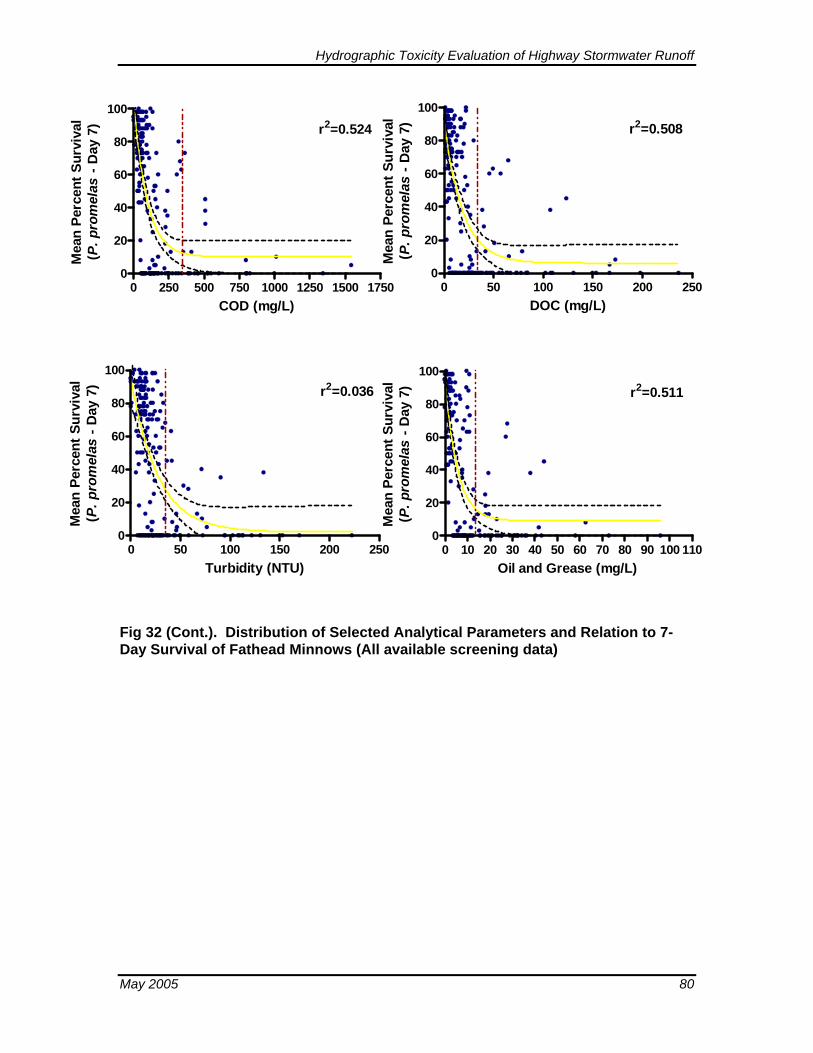
Hydrographic Toxicity Evaluation of Highway Stormwater Runoff
0 250 500 750 1000 1250 1500 17500
20
40
60
80
100
COD (mg/L)
Mea
n Pe
rcen
t Sur
viva
l(P
. pro
mel
as -
Day
7) r2=0.524
0 50 100 150 200 2500
20
40
60
80
100
DOC (mg/L)
Mea
n Pe
rcen
t Sur
viva
l(P
. pro
mel
as -
Day
7) r2=0.508
0 50 100 150 200 2500
20
40
60
80
100
Turbidity (NTU)
Mea
n Pe
rcen
t Sur
viva
l(P
. pro
mel
as -
Day
7) r2=0.036
0 10 20 30 40 50 60 70 80 90 100 1100
20
40
60
80
100
Oil and Grease (mg/L)
Mea
n Pe
rcen
t Sur
viva
l(P
. pro
mel
as -
Day
7) r2=0.511
Fig 32 (Cont.). Distribution of Selected Analytical Parameters and Relation to 7-Day Survival of Fathead Minnows (All available screening data)
May 2005 80
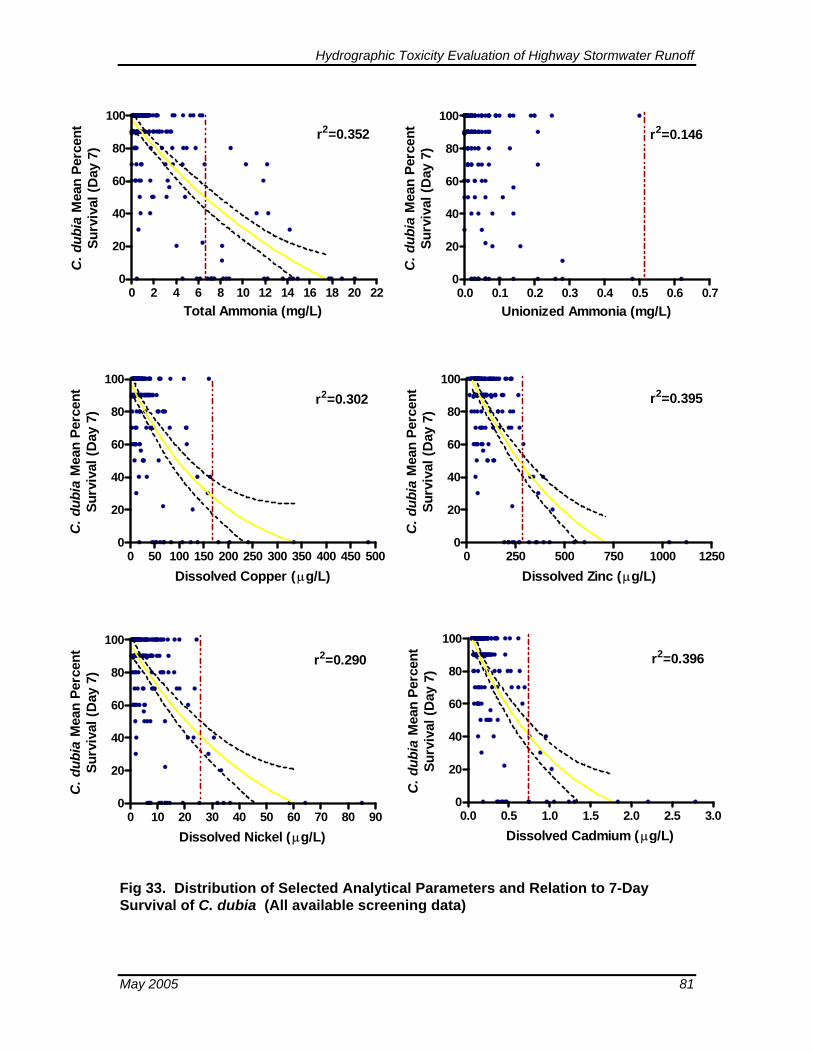
Hydrographic Toxicity Evaluation of Highway Stormwater Runoff
0 2 4 6 8 10 12 14 16 18 20 220
20
40
60
80
100
Total Ammonia (mg/L)
C. d
ubia
Mea
n Pe
rcen
tSu
rviv
al (D
ay 7
)
r2=0.352
0.0 0.1 0.2 0.3 0.4 0.5 0.6 0.70
20
40
60
80
100r2=0.146
Unionized Ammonia (mg/L)
C. d
ubia
Mea
n Pe
rcen
tSu
rviv
al (D
ay 7
)
0 50 100 150 200 250 300 350 400 450 5000
20
40
60
80
100
Dissolved Copper (µg/L)
C. d
ubia
Mea
n Pe
rcen
tSu
rviv
al (D
ay 7
)
r2=0.302
0 250 500 750 1000 12500
20
40
60
80
100
Dissolved Zinc (µg/L)
C. d
ubia
Mea
n Pe
rcen
tSu
rviv
al (D
ay 7
)
r2=0.395
0 10 20 30 40 50 60 70 80 900
20
40
60
80
100
Dissolved Nickel (µg/L)
C. d
ubia
Mea
n Pe
rcen
tSu
rviv
al (D
ay 7
)
r2=0.290
0.0 0.5 1.0 1.5 2.0 2.5 3.00
20
40
60
80
100
Dissolved Cadmium (µg/L)
C. d
ubia
Mea
n Pe
rcen
tSu
rviv
al (D
ay 7
)
r2=0.396
Fig 33. Distribution of Selected Analytical Parameters and Relation to 7-Day Survival of C. dubia (All available screening data)
May 2005 81
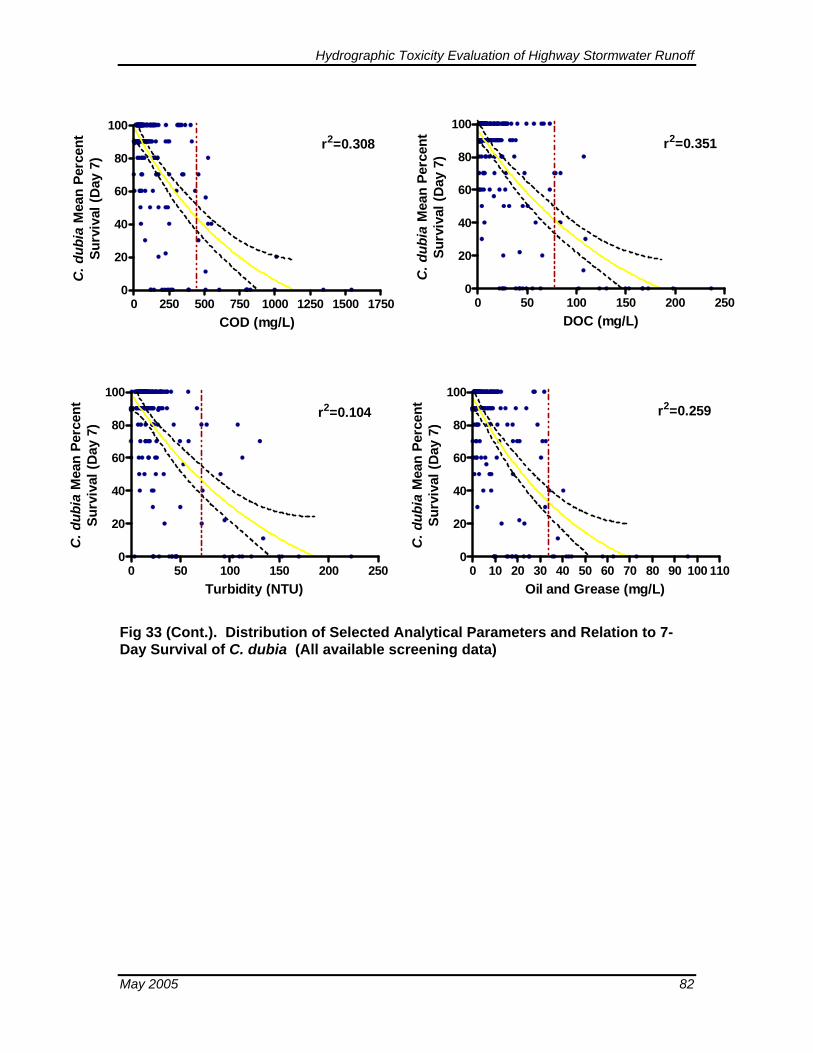
Hydrographic Toxicity Evaluation of Highway Stormwater Runoff
0 250 500 750 1000 1250 1500 17500
20
40
60
80
100
COD (mg/L)
C. d
ubia
Mea
n Pe
rcen
tSu
rviv
al (D
ay 7
)
r2=0.308
0 50 100 150 200 2500
20
40
60
80
100
DOC (mg/L)
C. d
ubia
Mea
n Pe
rcen
tSu
rviv
al (D
ay 7
)
r2=0.351
0 50 100 150 200 2500
20
40
60
80
100
Turbidity (NTU)
C. d
ubia
Mea
n Pe
rcen
tSu
rviv
al (D
ay 7
)
r2=0.104
0 10 20 30 40 50 60 70 80 90 100 1100
20
40
60
80
100
Oil and Grease (mg/L)
C. d
ubia
Mea
n Pe
rcen
tSu
rviv
al (D
ay 7
)r2=0.259
Fig 33 (Cont.). Distribution of Selected Analytical Parameters and Relation to 7-Day Survival of C. dubia (All available screening data)
May 2005 82
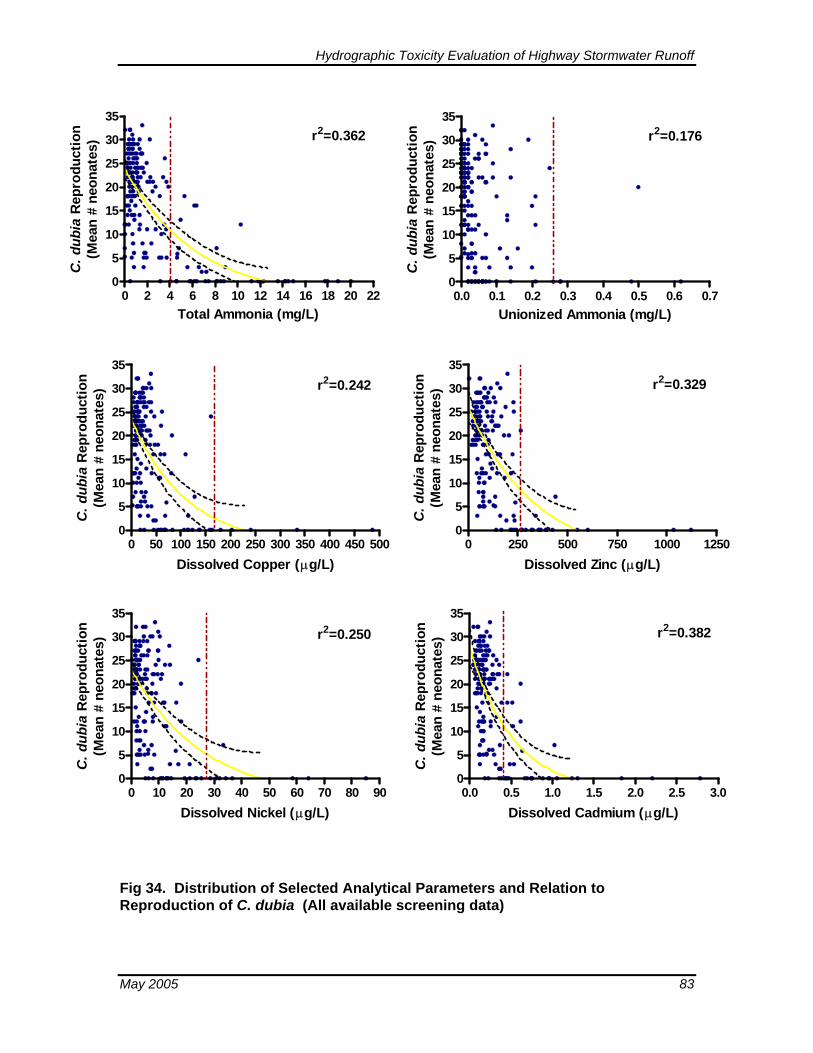
Hydrographic Toxicity Evaluation of Highway Stormwater Runoff
0
2 4 6 8 10 12 14 16 18 20 220
5
10
15
20
25
30
35
Total Ammonia (mg/L)
C. d
ubia
Rep
rodu
ctio
n(M
ean
# ne
onat
es) r2=0.362
0.0 0.1 0.2 0.3 0.4 0.5 0.6 0.70
5
10
15
20
25
30
35r2=0.176
Unionized Ammonia (mg/L)
C. d
ubia
Rep
rodu
ctio
n(M
ean
# ne
onat
es)
0 50 100 150 200 250 300 350 400 450 5000
5
10
15
20
25
30
35
Dissolved Copper (µg/L)
C. d
ubia
Rep
rodu
ctio
n(M
ean
# ne
onat
es) r2=0.242
0 250 500 750 1000 12500
5
10
15
20
25
30
35
Dissolved Zinc (µg/L)
C. d
ubia
Rep
rodu
ctio
n(M
ean
# ne
onat
es) r2=0.329
0 10 20 30 40 50 60 70 80 900
5
10
15
20
25
30
35
Dissolved Nickel (µg/L)
C. d
ubia
Rep
rodu
ctio
n(M
ean
# ne
onat
es) r2=0.250
0.0 0.5 1.0 1.5 2.0 2.5 3.00
5
10
15
20
25
30
35
Dissolved Cadmium (µg/L)
C. d
ubia
Rep
rodu
ctio
n(M
ean
# ne
onat
es) r2=0.382
Fig 34. Distribution of Selected Analytical Parameters and Relation to Reproduction of C. dubia (All available screening data)
May 2005 83
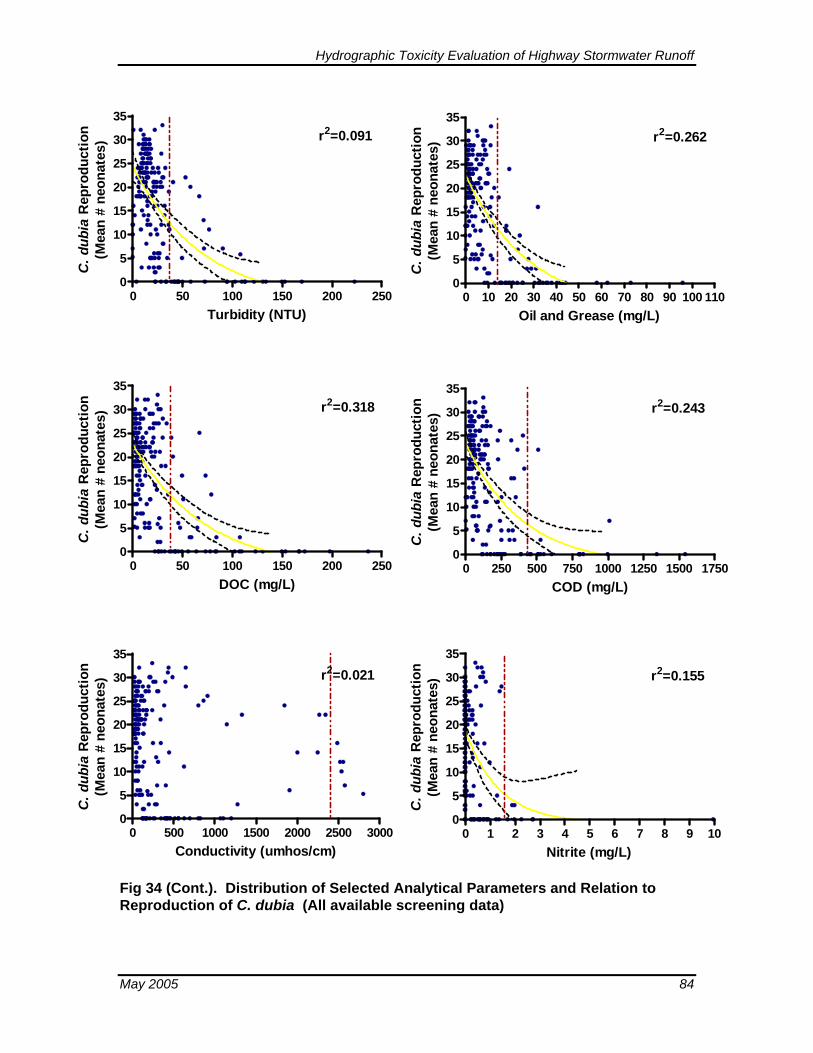
Hydrographic Toxicity Evaluation of Highway Stormwater Runoff
May 2005 84
0 50 100 150 200 2500
5
10
15
20
25
30
35
Turbidity (NTU)
C. d
ubia
Rep
rodu
ctio
n(M
ean
# ne
onat
es) r2=0.091
0 10 20 30 40 50 60 70 80 90 100 1100
5
10
15
20
25
30
35
Oil and Grease (mg/L)
C. d
ubia
Rep
rodu
ctio
n(M
ean
# ne
onat
es) r2=0.262
0 50 100 150 200 2500
5
10
15
20
25
30
35
DOC (mg/L)
C. d
ubia
Rep
rodu
ctio
n(M
ean
# ne
onat
es) r2=0.318
0 250 500 750 1000 1250 1500 17500
5
10
15
20
25
30
35
COD (mg/L)
C. d
ubia
Rep
rodu
ctio
n(M
ean
# ne
onat
es) r2=0.243
0 500 1000 1500 2000 2500 30000
5
10
15
20
25
30
35
Conductivity (umhos/cm)
C. d
ubia
Rep
rodu
ctio
n(M
ean
# ne
onat
es) r2=0.021
0 1 2 3 4 5 6 7 8 9 100
5
10
15
20
25
30
35
Nitrite (mg/L)
C. d
ubia
Rep
rodu
ctio
n(M
ean
# ne
onat
es) r2=0.155
Fig 34 (Cont.). Distribution of Selected Analytical Parameters and Relation to Reproduction of C. dubia (All available screening data)
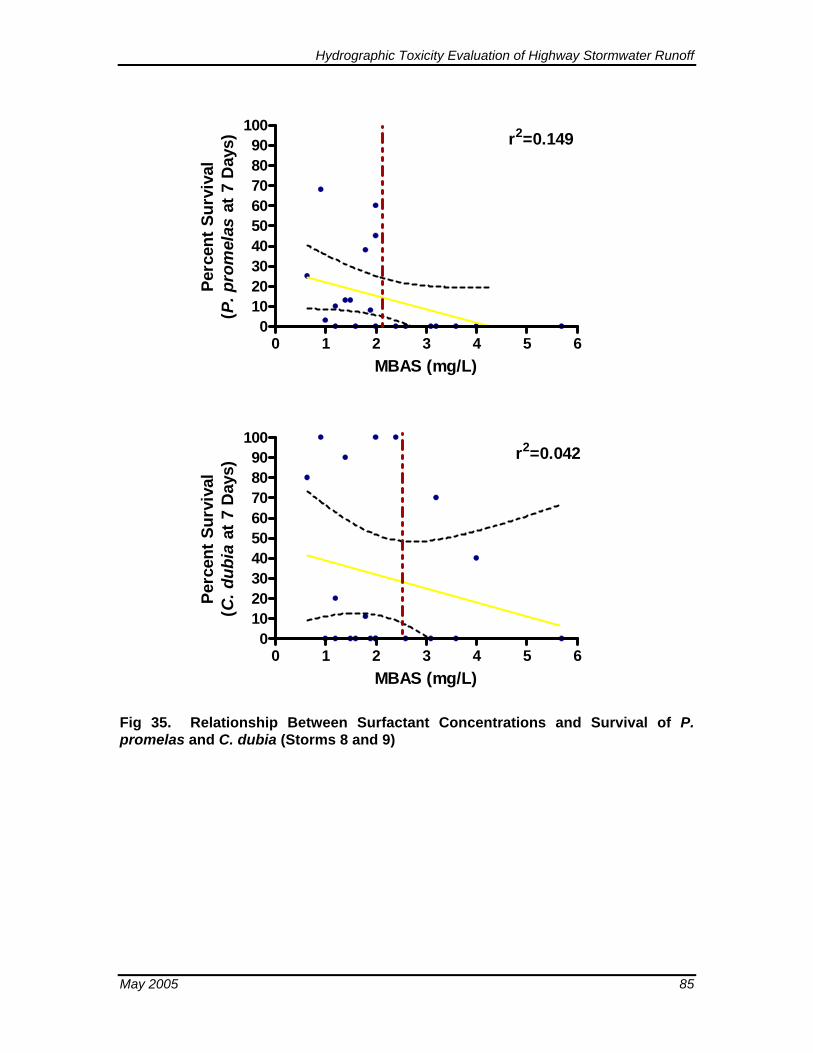
Hydrographic Toxicity Evaluation of Highway Stormwater Runoff
0 1 2 3 4 5 60
102030405060708090
100
MBAS (mg/L)
Perc
ent S
urvi
val
(P. p
rom
elas
at 7
Day
s) r2=0.149
0 1 2 3 4 5 60
102030405060708090
100
MBAS (mg/L)
Perc
ent S
urvi
val
(C. d
ubia
at 7
Day
s)
r2=0.042
Fig 35. Relationship Between Surfactant Concentrations and Survival of P. promelas and C. dubia (Storms 8 and 9)
May 2005 85
Hydrographic Toxicity Evaluation of Highway Stormwater Runoff
3.4 Use of Toxicity Data for Stormwater Treatment BMP Performance Evaluation
The cost and effectiveness of structural or treatment control BMPs is becoming the subject of increased interest as storm water dischargers face permit requirements that include “BMP ratcheting down” clauses and TMDL waste load allocations. Stormwater’s high volume, intermittent nature and variable quality make treatment a tremendous challenge (Jones-Lee 2000).
The ultimate goal of BMP implementation is to achieve beneficial use attainability in downstream receiving waters. Protection of aquatic life is listed as a primary beneficial use in almost all receiving environments. Estimating aquatic life toxicity based on chemical parameters alone, however, proves to be difficult based on a number of observations and points outlined in this report including:
1) Chemical data often co-varies, as observed in this study,
2) Only a select group of potentially toxic chemicals are analyzed and reported,
3) A number of environmental parameters may affect the toxicity of any given compound (e.g. pH, hardness, particulates, total and dissolved organics),
4) Speciation of the chemical may strongly affect toxicity.
5) Stormwater consists of a complex mixture of compounds that may interact in a variety of ways that effect toxicity of any given constituent, and
6) Variability between storm events, sites, grab samples, and species makes is difficult to draw conclusions on potential BMP effectiveness for any given storm event.
Another issue of importance is whether exceedences of established water quality standards always constitute environmental impairment of concern. A review of analytical data collected during this study indicates that a large number of non-toxic grab samples exceed recommended maximum water quality criteria for both dissolved copper (13 µg/L) and zinc (120 µg/L) in freshwater based on a hardness of 100 mg/L CaCO3 (EPA 2002c). A general comparison of grab sample toxicity and these criteria can be seen in Figures 32-34. Water quality exceedences, especially for trace metals, often fail to elicit toxicity in environmental samples since the criteria are developed using clean laboratory water without natural organics and particulates (Bergman and Dorward-King 1997). Toxicity tests directly address this issue of bioavailability.
Nautilus is currently providing toxicity testing support for a variety of BMP effectiveness
May 2005 86
Hydrographic Toxicity Evaluation of Highway Stormwater Runoff
studies related to toxicity testing. A few examples follow. Overall results have been mixed so far. In some cases, treatment methods have been consistently successful at reducing toxicity, some have been relatively poor at removing toxicity or have actually increased toxicity, and others have had mixed results for different storm events. A review of several current stormwater BMP methods used in California is provided by Jones-Lee (2000), Caltrans (2003), and CASQA (2004).
• For the past three years Nautilus has provided toxicity testing support for a southern California shipyard that has installed three filtration options to evaluate their effectiveness in treating stormwater to render it compliant with their discharge permit. Both artificially created storms using city water (previously evaluated by Nautilus for confounding effects) and natural storm events are being monitored to evaluate the pilot implementation of these materials. Samples are collected both prior to and following contact with each of the pilot filtration methods, flow information is collected, the samples are analyzed for cumulative toxicity and specific contaminants of concern, and the data evaluated for neutrality, improvement, or degradation in BMP performance. At lease one of the filtration methods for this project has been consistently successful at reducing primary toxicants of concern including trace metals, and reducing or completely removing toxicity.
• Nautilus is providing testing support for a conglomerate of stormwater BMP studies currently in progress in collaboration with the Southern California Coastal Water Research Project (SCCWRP), County of Orange Public Facilities and Resources Department, Santa Monica Bay Restoration Project, City of Long Beach, and Los Angeles County Department of Public Works. This project is partially funded by the State Water Resources Control Board (SWRCB). Collaborative monitoring programs with local research and stormwater management agencies have been established by SCCWRP that will be implementing BMPs in the southern California coastal area including Orange County. As a part of this project, Nautilus is analyzing samples of stormwater from upstream and downstream locations of various BMPs for toxicity to freshwater and marine life. A key product expected from this project will be a matrix describing the effectiveness of various BMPs for removing toxicity and selected chemicals. These data will be of high value to agencies statewide in their effort to develop and implement watershed management plans.
In summary, the use of toxicity data is a direct pertinent measure of BMP success for the protection of receiving water quality since this measure integrates all interactions between various water quality variables. The complex nature and variability of chemistry in stormwater runoff may make it difficult to evaluate whether or not aquatic life may be impaired for a given storm event based on these measurements alone. Chemistry data, of course, is extremely useful to help understand trends, dynamics, and potential effects.
May 2005 87
Hydrographic Toxicity Evaluation of Highway Stormwater Runoff
Identification of primary toxicants of concern through the use of TIEs can help prioritize which chemical parameters should be evaluated during future sampling events and help identify BMP methods most appropriate for the primary chemical(s) of concern.
3.5 QA/QC
Laboratory controls corresponding to P. promelas tests met acceptability criteria for all sites during every storm event with the exception of Storm 2. A separate lab control was assigned to each of the three sites, however, only the Site 2 control met the acceptability criterion of 80 percent mean survival. Mean survival in the controls for Sites 1 and 3 was 53 and 78 percent, respectively. To be conservative, the Site 2 control (with a mean of 95 percent survival) was shared among all three sites for comparison purposes. Site 1 data were consistent with the general trend of increased mortality and inhibition of growth for the first-flush grabs and less toxicity toward the later part of the storm. Therefore, these data are presented, but higher variability than is typical may limit statistical power when interpreting these results. Data for Site 3 were deemed acceptable for reporting because there was a similar trend in toxicity with very low variability throughout the test. In all other cases, mean percent survival for P. promelas lab controls met or exceeded the mean criteria of 80 percent survival and mean dry biomass of 0.25 mg.
In some samples for each storm event, DO dropped dramatically 24 hours after initial set up of P. promelas tests. This was especially evident in the first five grab samples from each site. In some cases, these samples were retested after 24 hours with continuous aeration in order to rule out DO as the primary cause of toxicity. The initial grab samples were not retested, however, if subsequent grab samples with acceptable DO levels (at or above 4 mg/L) exhibited similar toxic responses.
Laboratory controls for C. dubia tests also met test acceptability criteria for all sites during every storm event with the exception of Storm 2. The criteria for acceptability of the lab control in a water flea test are: 1) 80 percent survival; 2) 60 percent of the surviving females must produce at least 3 broods of offspring; and 3) the mean brood size must be greater than or equal to 15 offspring per surviving female. As with the P. promelas tests, the lab control for Site 2 did pass these acceptability criteria, and was shared among all three sites for comparison purposes. Poor control performance in Sites 1 and 3 was attributed to an unidentified microorganism that was observed in the food used for this series of tests. An obvious infection of the test organisms, however, was more evident in the two controls for these sites than in the stormwater samples. Again, these data are presented, but higher variability than is typical may limit statistical power when interpreting these results.
Method controls for all of the TIE treatments performed using C. dubia passed the 90 percent survival criterion for a 96-hour acute test, indicating that none of the treatments
May 2005 88
Hydrographic Toxicity Evaluation of Highway Stormwater Runoff
applied negatively impacted the performance of this species. Mean survival for P. promelas in the EDTA 50 mg/L control was 75 percent. It is possible that this level of EDTA can cause some toxicity, as indicated by 100 percent survival in the 25 mg/L EDTA control. Method controls for zeolite with EDTA, and centrifugation both exhibited poor performance with mean survival of 0 and 45 percent, respectively. Since a zeolite with EDTA control exhibited 80 percent survival in a TIE performed on the same sample 10 days earlier, contamination of the control test solution may be accountable for the unusually high mortality in this instance. However, results for these treatments may have been impacted and should be interpreted cautiously. All other method controls for TIE treatments using P. promelas met the 90 percent survival criterion except for the following: Baseline, STS (10 mg/L), EDTA at pH 6, pH 9, and zeolite with EDTA, which all exhibited mean survival between 80 and 85 percent. Sample treatment data associated with these controls were deemed acceptable because the control survival was close to the acceptability criterion in each case, and there were observable effects in the treated samples relative to the baseline samples, regardless of differences observed between controls and treatments.
Reference toxicant tests using P. promelas were conducted concurrently to each storm event, met test acceptability criteria, and LC50 values fell within two standard deviations of laboratory control chart means (Appendix G). During storms 2, 4, 6, and 7, C. dubia reference toxicant testing was concurrent, met test acceptability criteria, and LC50 values fell within two standard deviations of laboratory control chart means. Storms 8 and 9 did not have concurrent C. dubia reference toxicant tests, however, a valid reference toxicant test was performed within the same month as stormwater testing, where LC50 values for these tests fell within two standard deviations of laboratory control chart means.
May 2005 89
Hydrographic Toxicity Evaluation of Highway Stormwater Runoff
4. REFERENCES Anderson, H. B. and J. A. Buckley. 1998. Acute toxicity of ammonia to Ceriodaphnia
dubia and a procedure to improve control survival. Bull. Environ. Contam. Toxicol. Vol 61:116-122.
Ankley, G.T., G.S. Peterson, M.T. Lukasewycz, and D.A. Jensen. 1990. Characterization of surfactants in toxicity identification evaluations. Chemosphere Vol 21(1-2):3-12.
Ankley, G. T., J. R. Dierkes, D. A. Jensen, and G. S. Perterson. 1991. Piperonyl butoxide as a tool in aquatic toxicological research with organophosphorous insecticides. Ecotoxicol. Environ. Saf. Vol 21:266-274.
Bailey, H.C, C. DiGiorgio, K. Kroll, J.L. Miller, D.E. Hinton, and G. Starrett. 1996. Development of procedures for identifying pesticide toxicity in ambient waters: Carbofuran, Diazinon, Chlorpyrifos. Environ. Toxicol. and Chem. 15:837-845.
Bailey, H. C., J. L. Miller, M. J. Miller, L. C. Wiborg, L. Deanovic, and T. Shed. 1997. Joint acute toxicity of diazinon and chlorpyrifos to Ceriodaphnia dubia. Eviron. Tox. And Chem. Vol 16:2304-2308.
Bailey, H. C., J. R. Elphick, R. Krassoi, and A. Lovell. 2001. Joint acute toxicity of diazinon and ammonia to Ceriodaphnia dubia. Eviron. Tox. And Chem. Vol 12:2877-2882.
BASMAA. (1996). San Francisco Bay area stormwater runoff monitoring data analysis, 1988-1995. Final Report. Woodward-Clyde, San Francisco, CA.
Bergman,H. L. and E.J. Dorward-King 1997. Reassessment of Metals Criteria for Aquatic Life Protection. SETAC Press 1997.
Bitton, G., K. Rhodes, and B. Koopman. 1996. Ceriofast: An acute toxicity test based on Ceriodaphnia dubia feeding behavior. Environ. Toxicol. and Chem.Vol 15(2):123-125
Caltrans. 2003. Construction Site Best Management Practices Manual (BMPs). State of California Department of Transportation. March 2003. 257 pp.
CASQA. 2004. Stormwater Best Management Practice Industrial and Commercial, New Development and Redevelopment, Construction, and Municipal Handbooks. September 2004. http://www.cabmphandbooks.com/
Constable, M. and P. Orr. 1994. Lethal and sublethal toxicity of lindane to Pimephales promelas and Ceriodaphnia dubia. Arch. Environ. Contam. Toxicol. Vol 52:298-304.
Curtis, M.W., T. L. Copeland, and C. H. Ward. 1979. Acute toxicity of 12 industrial chemicals to freshwater and saltwater organisms. Water Res. Vol 13:137-141.
May 2005 90
Hydrographic Toxicity Evaluation of Highway Stormwater Runoff
Cowgill, U.M. and D.P. Milazzo. 1991. The response of the three brood Ceriodaphnia test to fifteen formulations and pure compounds in common use. Arch. Environ. Contam. Toxicol. Vol 21:35-40.
EPA. 1991. Methods for Aquatic Toxicity Identification Evaluation – Phase I Toxicity Characterization Procedures, Second Edition (EPA/600/6-91/003). United States Environmental Protection Agency Office of Research and Development, Washington DC.
EPA 1993a. Methods for Aquatic Toxicity Identification Evaluations - Phase II Toxicity Identification Procedures for Samples Exhibiting Acute and Chronic Toxicity. EPA/600/R-92/080 September 1993.
EPA 1993b. Methods for Aquatic Toxicity Identification Evaluations - Phase III Toxicity Confirmation Procedures for Samples Exhibiting Acute and Chronic Toxicity. EPA/600/R-92/081 September 1993.
EPA 2002. National recommended water quality criteria: 2002. US Environmental Protection Agency Office of Water and Office of Science and Technology. EPA-822-R-02-047, November 2002
EPA. 2002a. Methods for Measuring the Chronic Toxicity of Effluents and Receiving Waters to Freshwater Organisms. Fourth Edition. United States Environmental Protection Agency Office of Water, Washington DC (EPA-821-R-02-013).
EPA. 2002b. Methods for Measuring the Acute Toxicity of Effluents and Receiving Waters to Freshwater and Marine Organisms. Fifth Edition. United States Environmental Protection Agency Office of Water, Washington DC (EPA-821-R-02-012).
Forget, J., J. F. Pavillon, B. Beliaeff, and G. Bocquené. 1999. Joint Action of Pollutant Combinations (Pesticides and Metals) on Survival (LC50 Values) and Acetylcholinesterase Activity of Tigriopus brevicornis (Copepoda, Harpacticoida). Environ. Toxicol. and Chem. Vol 18(5): 912-918.
GraphPad Software Inc. 1994-2000. GraphPad Prism, Version 4.02.
Hampson, B.L. 1977. Relationship between total ammonia and free ammonia in terrestrial and ocean waters. J. Cons. Int. Explor. Mer, 37(2):117-122.
Hockett, J.R. and D.R. Mount. 1996. Use of metal chelating agents to differentiate among sources of acute aquatic toxicity. Environ. Toxicol. and Chem. Vol 15(10): 1687-1693.
Jones-Lee, 2000. Stormwater runoff water quality science/engineering newsletter devoted to urban stormwater runoff. Water quality management issues Volume 3 Number 2, May 19, 2000
Klaassen C. 1996. Casarett and Doull’s Toxicology: The Basic Science of Poisons, Fifth Edition, New York, MacMillan Publishing Company.
Lewis, M.A. 1991. Chronic and sublethal toxicities of surfactants to aquatic animals: A May 2005 91
Hydrographic Toxicity Evaluation of Highway Stormwater Runoff
review and risk assessment. Water Research Vol 25(1):101-113.
Marsalek, J., Rochfort, Q., Brownlee, B., Mayer, T. and Servos, M. (1999). An exploratory study of urban runoff toxicity. Water Science and Technology, 39(12): 33-39.
Mayes, M.A., H.C. Alexander, and D.L. Hopkins. 1986. Acute and chronic toxicity of ammonia to freshwater fish: A site-specific study. Environ. Toxicol. and Chem. Vol 5:437-442.
Nimmo, D.W., D. Link, L.P. Parrish, G.J. Rodriguez, W. Wuerthele, and P.H. Davies. 1989. Comparison of on-site and laboratory toxicity tests: Derivation of site-specific criteria for un-ionized ammonia in a Colorado transitional stream. Environ. Toxicol. and Chem. Vol 8:1177-1189.
Nautilus. 2001. Sensitivity of larval P. promelas, and Ceriodaphnia dubia to total and un-ionized ammonia. Unpublished laboratory data. Nautilus Environmental (as predecessors Ogden/AMEC). 1999-2001.
Nautilus. 2005. Sensitivity of larval P. promelas, and Ceriodaphnia dubia to total copper. Unpublished laboratory data. Nautilus Environmental. 2004-2005.
Pickering, Q. H. 1988. Evaluation and compariosn of two short-term fathead minnow tests for estimating chronic toxicity. Water Res. Vol 22:833-893.
Pitt, R., Field, R., Lalor, M. and Brown, M. (1995). Urban stormwater toxic pollutants: assessment, sources, and treatability. Water Environment Research, Vol. 67, 260-275.
Reinbold, K.A. and S.M. Pescitelli. 1982. Acute toxicity of ammonia to the White Sucker. Report to U.S. EPA by the Illinois Natural History Survey, Champaign, IL.
Ruesink, R. G., and L. L. Smith, Jr. 1975. The relationship of the 96-Hr LC50 to the Lethal Threshold Concentration of hexavalent chromium, phenol, and sodium pentachlorophenate for fathead minnows (Pimephales promelas Rafinesque). Trans. Am. Fish Soc. Vol 104:567-570.
Sandrin, T.R. and R.M. Maier. 1992. Effect of pH on Cadmium Toxicity, Speciation, and Accumulation During Naphthalene Biodegradation. Environ. Toxicol. and Chem. Vol 21(10): 2075-2079.
Schubauer-Berigan, M.K., J.R. Dierkes, P.D. Monson, and G.T. Ankley. 1993a. pH-dependent toxicity of Cd, Cu, Ni, Pb, and Zn to Ceriodaphnia dubia, Pimephales promelas, Hyalella azteca, and Lumbriculus variegatus. Environ. Toxicol. and Chem. Vol. 12:1261-1266.
May 2005 92
Schubauer-Berigan, M.K., J.R. Amato, G.T. Ankley, S.E. Baker, L.P. Burkhard, J.R. Dierkes, J.J. Jenson, M.T. Lukasewycz, and T.J. Norberg-King. 1993b. The behavior and identification of toxic metals in complex mixtures: Examples from effluent and sediment porewater Toxicity Identification Evaluations. Arch. Environ. Contam. Toxicol. Vol. 24:298-306.
Hydrographic Toxicity Evaluation of Highway Stormwater Runoff
Siepmann S. and Finlayson, B. 2000. Water quality criteria for diazinon and chlorpyrifos. Calif. Dept. of Fish and Game Pesticides Investigation Unit. 64 pp.
Swigert, J.P., and A. Spacie 1983. Survival and growth of warmwater fishes exposed to ammonia under low flow conditions. PB83-257535. National Technical Information Service, Springfield, MA.
Thurston, R.V. and R.C. Russo. 1981. Ammonia toxicity to fishes: Effect of pH on the toxicity of the un-ionized ammonia species. Environ. Sci. Technol. Vol. 15:837-840.
Thurston, R.V., R.C. Russo, and G.R. Phillips. 1983. Acute toxicity of ammonia to fathead minnows. Trans. Amer. Fish. Soc. Vol 112:705-711.
Tidepool Scientific Software. 2001-2002. CETIS Comprehensive Toxicity Data Analysis and Database Software, Version 1.025B.
Traina, S.J. and V. Laperche. 1999. Contaminant Bioavailability in Soils, Sediments, and Aquatic Environments. Proc. Natl. Acad. Sci. USA. Vol 96: 3365-3371.
West, C.W. 1985. Acute toxicty of ammonia to 14 freshwater species. Internal report. U.S. EPA, Environmental Research Laboratory, Duluth, MN.
May 2005 93