hydrocarbon unit energy and mineral resources...
TRANSCRIPT
Annual Gas Production, 2112-13
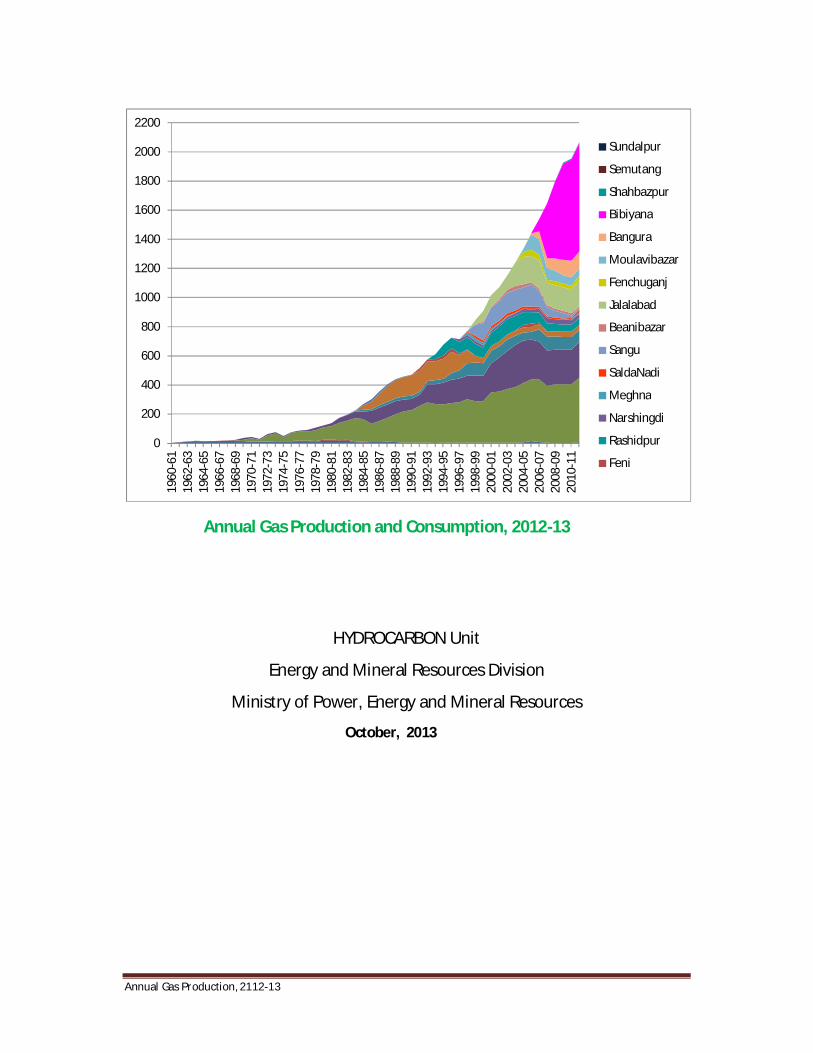
Annual Gas Production and Consumption, 2012-13
HYDROCARBON Unit
Energy and Mineral Resources Division
Ministry of Power, Energy and Mineral Resources
October, 2013
0
200
400
600
800
1000
1200
1400
1600
1800
2000
2200
1960
-61
1962
-63
1964
-65
1966
-67
1968
-69
1970
-71
1972
-73
1974
-75
1976
-77
1978
-79
1980
-81
1982
-83
1984
-85
1986
-87
1988
-89
1990
-91
1992
-93
1994
-95
1996
-97
1998
-99
2000
-01
2002
-03
2004
-05
2006
-07
2008
-09
2010
-11
Sundalpur
Semutang
Shahbazpur
Bibiyana
Bangura
Moulavibazar
Fenchuganj
Jalalabad
Beanibazar
Sangu
SaldaNadi
Meghna
Narshingdi
Rashidpur
Feni

Annual Gas Production, 2112-13
Table of Content
1.0. Introduction 2.0. Summary of Gas Production 3.0. Gas Production.
3.1. National Gas Producing Companies 3.1.1. Bangladesh Petroleum Exploration and Production Co. Ltd. (BAPEX) 3.1.2. Fenchuganj Gas Field 3.1.3. Salda Nadi Gas Field 3.1.4. Shahbazpur Gas Field 3.1.5. Semutang Gas Fields 3.1.6. Sundalpur Gas Field 3.1.7. Srikail Gas Field
3.2. Bangladesh gas Fields Co. Ltd (BGFCL) 3.2.1. Titas Gas Field 3.2.2. Habiganj Gas Field 3.2.3. Bakhrabad Gas Field 3.2.4. Narshingdi Gas Field 3.2.5. Meghna Gas Field
3.3. Sylhet Gas Fields Co. Ltd. 3.4. Kailas Tila Gas Field 3.5. Rashidpur Gas Field 3.6. Beani Bazar Gas Field 3.7. Sylhet Gas Field 3.8.
4.0. International Oil and Gas Companies 4.1. Chevron Bangladesh Ltd
4.1.1. Bibiyana Gas Field 4.1.2. Jalalabad Gas Field 4.1.3. Moulavi Bazar Gas Field
4.2. Tullow Oil 4.3. Bangura Gas Field
5.0. Santos Sangu Gas Field
6. Gas Supply and Consumption

Annual Gas Production, 2112-13
List of Figures:
Figure 1: Field wise Daily Gas Production in MMcfd.
Figure 2: Well wise Annual Gas Production in MMcfd
Figure 3A: Comparison of Annual Gas Production in MMcfd.
Figure 3 B: Annual Gas Production, Gas fields flowing low (below 55 MMcfd)
Figure 4: Line Graph highlighting gas production by National, International Companies
Figure 5: Company wise Gas Production in MMcfd/Bscf.
Figure 6: Field wise Gas Production in MMcfd
Figure 7: Field-wise Condensate Recovery in bbl /Day,
Figure 8: Comparison of Field wise Annual Condensate Recovery,
Figure 9: Annual Recovery of Liquid in 1000 Liter,
Figure 10: Recovery of Liquid fraction in 1000 Lit,
Figure 11: Well wise Gas Production in MMcfd, National Companies,
Figure 12: Field wise Gas Production in MMcfd, National Companies, 3
Figure 13: Comparison of Annual Gas Production by National Companies,
Figure 14: Field Wise Annual Gas Production of National Companies
Figure 15: Field wise Gas Production by BAPEX, (Stack Bar)
Figure 16: Annual Gas Production in MMcfd, BAPEX, Pie graph,
Figure 17: Field wise Gas Production by BGFCL,
Figure 18: Field Wise Annual Gas Production in MMcfd, BGFCL, (Pie graph)
Figure 19: Field Wise Gas Production in MMcfd, SGFL,
Figure 20: Well wise Gas Production in MMcfd, SGFL.
Figure 21: Well Wise Gas Production by IoC s,
Figure 22: Field wise Gas Production in MMcfd, IoCs,
Figure 23: Field wise Gas Production by IOCs in MMcfd and Bscf, (Pie Graph)
Figure 24: Field wise Gas Production in MMcfd, Chevron operated Gas Fields.
Figure 25: Pie Graph showing Share in Production of gas fields operated by Chevron, .
Annual Gas Production, 2112-13
Figure 26: Well wise gas production from wells operated Tullow Oil.
Figure 27: Shows well wise gas production of Sangu Off Shore field.
Figure 28 shows sector wise gas consumption in MMcfd. Last figure shows
Fig: 26: Sector wise Gas Consumption in MMcfd
Figure 29: Shows volume of Liquid fraction recovered from producing gas Fields.
Figure 30: Sector wise Gas Consumption in MMcfd/Bscf,

Annual Gas Production, 2112-13
Introduction:
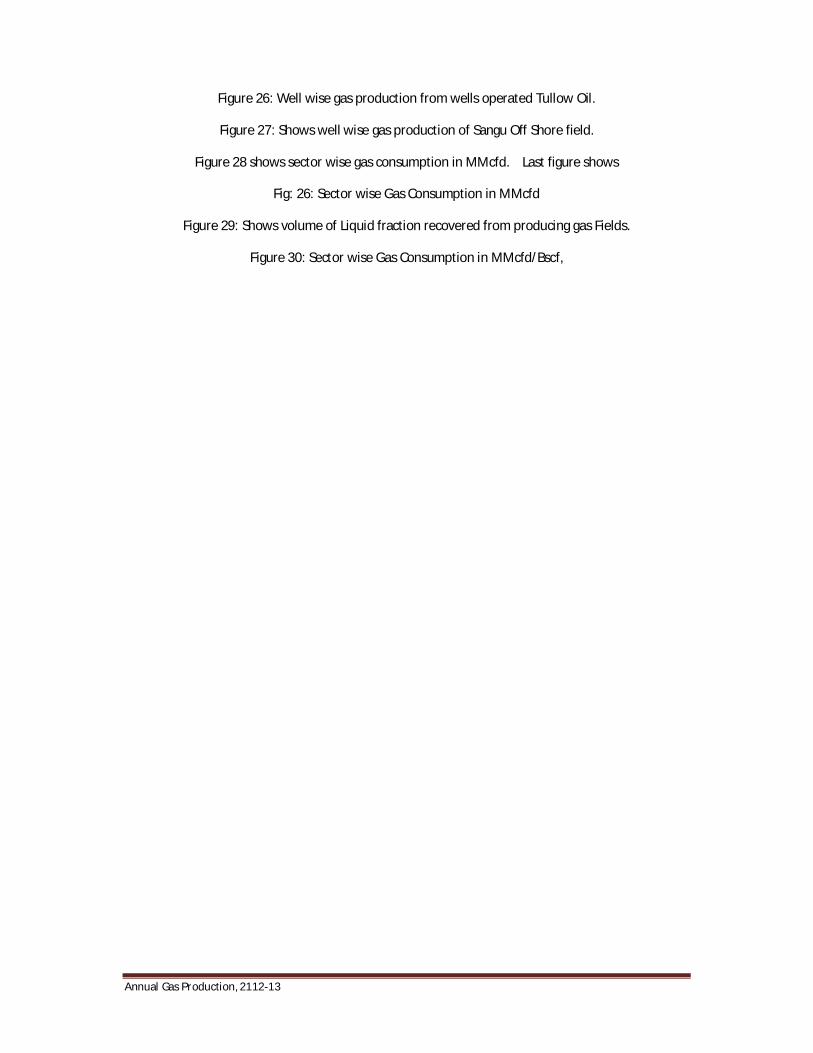
In 2012-13 fiscal year total production of gas logged 811 Bscf and in MMcfd daily average production was 2222 MMcfd. During the year well wise maximum daily gas production was 117.4 MMcfd . Well wise minimum gas production was 3.24 MMcfd. During the two Eid holidays gas consumption is significantly reduced. In figure 1 and 2 significant reduction in gas production during two Eid holidays can be observed (Figure 1, 2, 4 and 5.
During the year some of the wells were shut down. At the same time a number of new wells were open for production. Rate of increase in production over the year was quite low. In 2011-12 fiscal year total gas production was 749 MMcfd and this equals to 2045MMcfd.
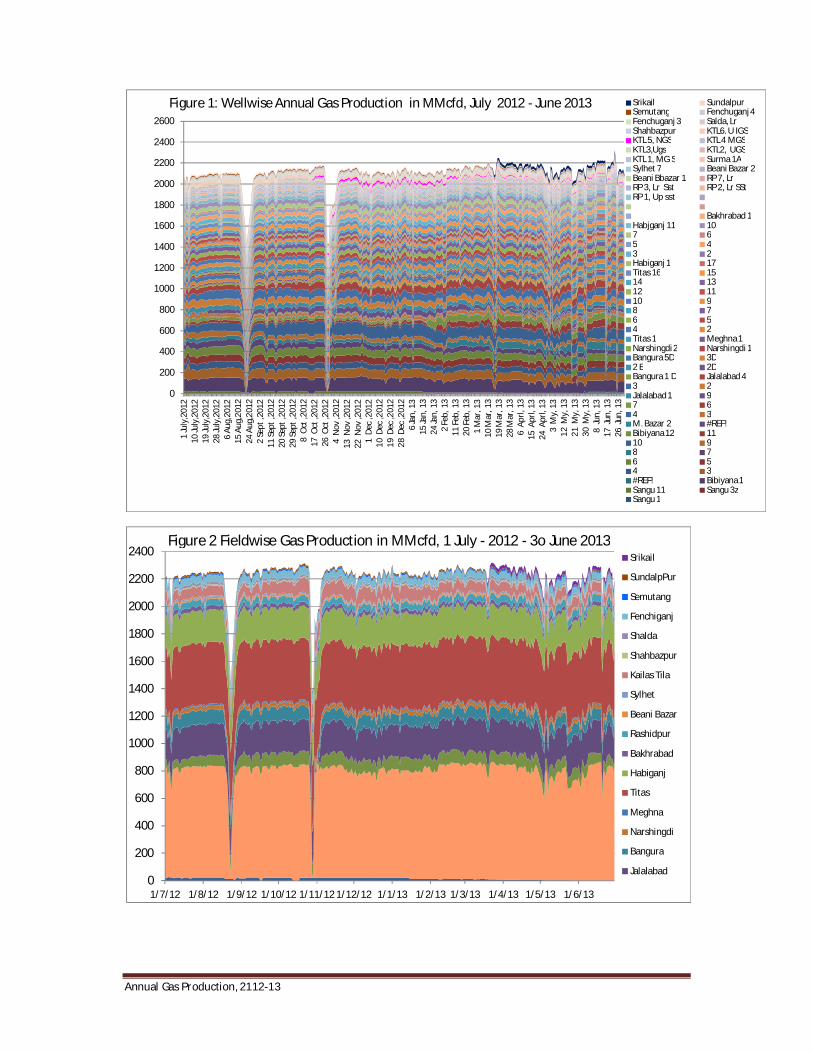
In 2012-13 annual increase in gas production was 177 MMcfd. Annual gas production in 2012-13 logged 2222 MMcfd. Total producing wells was 20. Gas production is largely depended on Bibiyana, Titas, Jalalabad and Habiganj gas fields. This four gas fields provided 84 percent (1707 MMcfd) of total production.
According to Gustavson Associates in 2012-13 gas demand could be 2565 MMcfd under most likely gas demand scenario. In case of low gas demand, this volume could be 2416 MMcfd. Actual production was below the projected minimum gas demand.
During the year 77 wells in 20 gas fields were flowing. However during the year a number of wells were shut down. On the other hand new wells were added to the production stream. At the end of the year 81 wells were flowing. During the year national companies produced 367 Bscf gas from 54 wells. Minimum production was recorded from Shahbazpur gas field (7.2 MMcfd). Srikail gas field was open for production in the middle of March, 2013. During this period (3 1/ months) average daily production from Srikail gas field was 24.8 MMcfd.
Chevron, Tullow Oil and Santos, these three international companies remained active during the period. IOCs production logged 395 Bscf which equals to 1083 MMcfd. At the beginning of the year IOC production was below 1200 MMcfd and this gradually increased with tine and at the later part of the year production was above 1204 MMcfd. Sangu gas field is struggling and may shut down shortly. Howe this will bale little effect in gas production.
Report on annual gas production of the year 2012-13 is prepared using daily gas and condensate production data. Information on gas and condensate production was received from the gas production companies. Information on gas purchase and sales is collected from MIS report (June 2013) of Petrobangla. Figure 1 shows daily well wise gas production in MMcfd. Field wise annual gas production in MMcfd is shown in Figure 2. Figure 3A shows field wise gas production in line graph. This is for convenience of readers Figure 4A and 3B compared field wise gas production in line graph. Low producing gas fields are shown in separate figure Fig 3B. Figure 4 compares daily gas production of national companies and IOCs.
In the current year four gas fields,. Bibyana, Titas, Jalalabad and Habioganj gas fields produced 592 Bscf gas and average production was 1622 MMcfd. Remaining 182 Bscf gas is produced by 12 gas fields (figure 2).
According to MIS report (2012-13)

Annual Gas Production, 2112-13
Gas Production Summary:
Three national and three international companies remain active in production of gas. d. Well wise average daily gas production was 2222 MMcfd (811 Bscf) This is presented as Figure 1. Field wise gas production in MMcfd for the year is provided in Figure 2.
Figure 3A shows annual gas production (MMcfd) of all producing gas fields in line graph. For better under understanding gas fields producing less than 55 MMcfd is included in figure 3B as Figure 3B. Figure 4 compares annual gas production in MMcfd by national and international companies. For better understanding total gas production is added to the figure 4. Company wise gas production is shown as figure 5. Figure 6 is based on field wise annual gas production in MMcfd.
According Gustavson Associates in 2012-13 gas demand could be 2535 MMcfd under most likely gas demand scenario. In case of low gas demand Gustavson considered gas demand at 2285 MMcfd.
During the year increase in gas production was 49 Bscf (139 MMcfd). Cumulative production on 31 June 2013 logged 11.4 Tscf. Figure 7 shows company wise condensate extraction in bbl/day. Field wise condensate recovery in bbl per day is shown as figure 8. Annual recovery of liquid (Condensate, Kerosene, Octane, NGL, MS, HSD and ) is displayed in figure 10. Figure 9
Well wise minimum gas production was recorded at 0.7 MMcfd from Sangu well 1. Maximum well wise production was recorded from Bibiyana well 1 at 115 MMcfd.
Out of total production national companies share was 1001 MMcfd. Total production of national companies during the year was 365 Bscf . In the past year total production by national companies was 1079 MMcfd. 54 wells was open for production during the year.
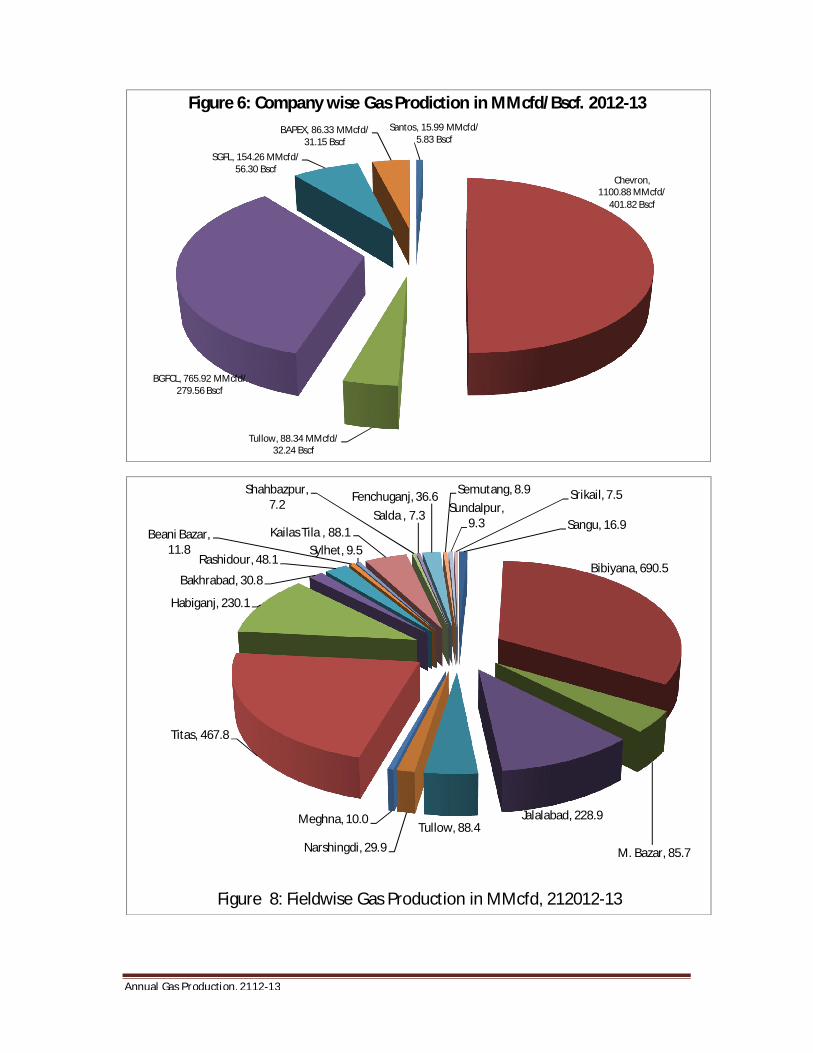
During the year IOCs gas production logged 1186 MMcfd (433 Bscf). IOCs produced this volume of gas using 30 wells. During the year maximum gas production was recorded from Bibiyana Gas field. Table (Below) compares company wise gas production for 2012-13. .
MMcfd SGFL BGFCL BAPEX Chevron Tullow Sangu Total 2012-13 154 100.4 77 1101 88 15.4 2222
Figure 7 shows field wise condensate recovery during the year. Maximum condensate recovery was 33023 bbl/day from Bibiyana gas field. Kailas Tila gas field occupied second position and daily condensate recovery was 748 bbl/day. Condensate recovery from Titas gas field was 447 bbl per day. In addition to condensate, NGL, Octane, Octane, Kerosene, HSD, and MS is recovered. Figure 8 shows condensate recovery arranged according to volume. Table below shows
Table below shows volume of liquid products in 1000 liter from well stream.
FY, BSCF MS HSDL NGL Condensate SKO Octane 2012-13 8027.7 6771 2584 34153 2928 1649
Figure 9 shows annual recovery of condensate, kerosene, octane, MS, HSD and NGL. In figure 10 condensate is removed to highlight the remaining liquid fraction.

Annual Gas Production, 2112-13
Gas Production:
National Companies:
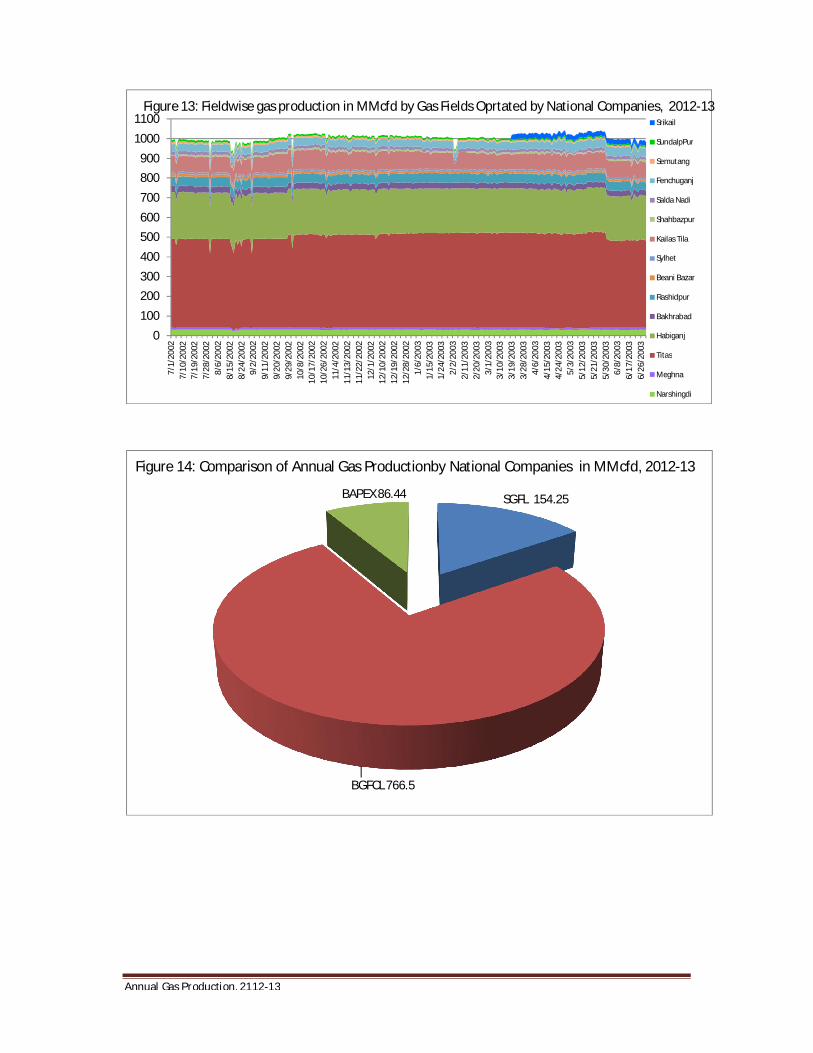
In 2012-13 fiscal year one E and P company (BAPEX) and two gas producing companies ( BGFCL and SGFL) operating 15 gas fields in the country. During the year total production of national companies logged 375 Bsc, which equals to 1028 MMcfdcf). National companies produced through 55 wells Average well wise production was 18.7 MMcfd. Well wise maximum production was 41 MMcfd (Titas) and minimum production was 2.0 MMcfd. Condensate production logged 52.3 thousand bbl. Figure 12 shows daily gas production in MMcfd Figure 12 shows fieldwise gas production in MMcfd of national companies. Figure 13 displayed company wise (National Co) gas production in MMcfd. These companies are BGFCL, SGFL and BAPEX. Figure 14 shows field wise gas production in MMcfd.
The national companies produced 368 Bscfgas. Average daily production was 1007 MMcfd. Production was obtained through 54 wells. Maximum well wise production was recorded from well 7 and well 10. Average gas flow rate was 41 MMcfd. 41 MMcfd from Habiganj well # 7 and 10.
Bangladesh Petroleum Exploration and Production Co. Ltd. (BAPEX): BAPEX is the lone E and P company of Petrobangla. In 2012-13 fiscal year the company operated six gas fields i.e. Shahbazpur, Salda, Fenchuganj, Semutang, Sundalpur and Srikail gas fields. Sundalpur and Srikail are two discoveries by BAPEX. Geologically Bangura and Srikail could be a single anticline. Some study may be considered. Figure 15 shows field wise annual gas production in stack gar. Figure 16 shows annual gas production in pie graph. Total gas production during the year the company produced at an average rate of 100 MMcfd. Figure 6 shows well wise annual gas production in MMcfd. Field wise annual gas production is shown in Figure 16. During the year 2961 thousand liter condensate was recovered.
Fenchuganj gas field is the main gas producer of the company. In 2012-13 13.Average daily production was 51.8 MMcfd. Average daily production was within 17-19 MMcfd. In the middle of May well #2 (Lower Sand) was open for production. This increased field production to 38-39 MMcfd. Annual average gas production was 36 MMcfd. During the year 1828 thousand liter condensate was recovered.
Salda Nadi Gas Field: During the year two wells were producing. Average production was 15 MMcfd. Total production during the year was 5.5 Bscf. In addition 434 thousand liter condensate was recovered.
Salda gas field is a small gas field. This gas field is producing for quite some time. During 2012-13 fiscal year this gas field showed indication of pressure decline. During the year this field produced at an average rate of 16 MMcfd.
Shahbazpur Gas Field: Shahbazpur gas field id located in Shahbazpur i.e. Bhola island. Because of this gas supply is limited within the island. In 2012-13 this gas field produced at an average rerate of 7.2 MMcfd and total production was 2.9 Bscf. Second well drilled to increase production. 1828 thousand liter condensate was also recovered during the year.

Annual Gas Production, 2112-13
Semutang Gas Field; This gas field was discovered in 1970-71 Oil & Gas Development Corporation. After independence the area, including the discovered gas pool was awarded Shell Oil. Shell drilled another well. Shell left the country as the reward was not attractive for them. This field was awarded to BAPEX. This well was completed as a gas producer in December 2011. During 2012-13 fiscal year this field produced at an average rate of 8.9 MMcfd. Total production in the year was 3.3 Bscf. In addition to this 231 thousand litre condensate was also recovered.
Sundalpur Gas Field: This gas field was discovered by BAPEX in in 2011-12. In the s3ame year this gas field was brought into production in March 2011-12. During the current fiscal year this field produced at an average rate of 8.6 MMcfd. Total production during the year logged 2.4 Bscf. 24 thousand litre condensate was recovered.
Srikail Gas Field: Srikail gas field was discovery of BAPEX. This field was brought into production in on 14 May, 202. Average daily production was 7.5 MMcfd Figure 16) and total production was 2.7 Bscf. In addition to this 429 thousand condensate was also recovered. It may be mentioned here that geologically Srikail is part of Bangura structure. Tulllow is producing from this structure. A joint study on Srikail and Bangura can be initiated for better understanding of the structure.
Bangladesh Gas Fields Co. Ltd: This the second largest gas producer of the country. The company operates Titas, Habiganj, Bakhrabad, Narshingdi and Meghna gas fields. In 2012-13 the company produced 281 Bscf gas. Average daily production was 771 MMcfd. In term of gas reserve, Titas is the largest gas field of the country. During the year 257365 thousand liter liquid was recovered. MS, 65,716 thousand liter, 37324 thousand HSD and 957005 thousand liter condensate was recovered. Figure 17 shows field-wise gas production in 2012-13. Figure 18 shows fieldwise annual gas production.
Titas Gas Field is the largest gas field of the country and second largest gas producer. In 2012-13 this gas field produced at an average 468 MMcfd. Well wise maximum production was 40 MMcfd and minimum production was recorded at 6.5 MMcfd (well 10). In addition to gas, From this this fielded 78181 thousand liter liquid was recovered. This includes 13274 thousand liter MS, 37324 liter HSD and 27584 thousand liter re HSD and 21834 thousand liter condensate was recovered.
Habiganj Gas Field is the third largest gas field of the country. During the year Habiganj field produced 85 Bscf gas. Daily average production was 227 MMcfd. and total production was 84 Bscf. During the year production from well 1 and 2 was suspended due to water encroachment. It may be mentioned here that Habiganj reservoir is a strong water drive one. In such case recovery will will be less than that of an expansion drive reservoir.
Bakhrabad Gas Field: During the year this field 11.3 Bscf.2 This equals to daily average production rate of 30.9 MMcfd. During the period 13274 thousand liter MS, 37324 thousand liter HSD and 27584 thousand 74 110 MS, 37328 thousand MS, 12201 thousand liter HSD and 498 thousand liter condensate was recovered.
Narshingdi: During the year well 1 and 2 were flowing at an average rate of production was 17 and 12 MMcfd receptively. Total production was 310 . During the year 3490 thousand liter condensate was recovered.

Annual Gas Production, 2112-13
Meghna Gas Field: During the year this field produced 3.7 Bscf and average gas production was 10 MMcfd. Gas production rate was quite stable. During the year 1102 thousand liter condensate was recovered.
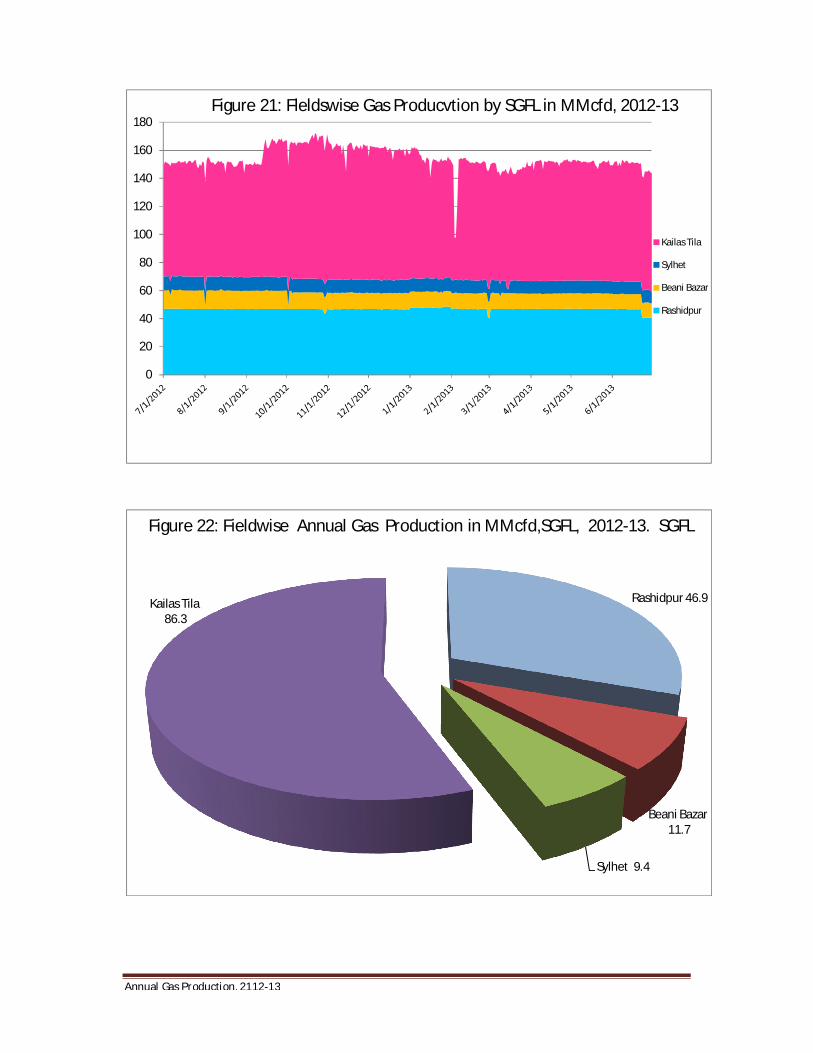
Sylhet Gas Fields Ltd: This company operates four gas fields. Gas. During the year 62 Bscf gas was produced by SGFL. Average daily production was 158 MMCFD. During the year 78290 thousand liter MS, 45759 HSD, 29255 NGL, 63848 condensate, 25852 kerosene and 14362 octane. Unit is thousand liter. Brief description of the gas fields are provided below. It may be mention here that gas production stated in this part of the world from Sylhet gas field.
Kailas Tila gas field: This is the main producer of SGFL. During the year 57.9 Bsc f gas was produced. Average daily gas production was 88 MMcfd. During the year six wells were producing. In addition to gas, liquid product is also recovered. This gas field is quite wet and maximum recovery of liquid was achieved from this gas field. In the reported period 62740 thousand liter liquid was recovered. This include 9424 thousand liter MS, 8178 thousand liter HSD, 45591 thousand liter condensate, 29255 thousand liter NGL was recovered.
Rashidpur Gas Field: During the year 17.3 Bscf gas was produced. And daily average production was 48 MMcfd. Rashidpur gas is quite dry and 3430 thousand liter condensate was recovered.
Beani Bazar Gas Field: During the year 3.4 Bscf gas was produced. Average daily production was 9.2 MMcfd. During the same period 10524 thousand liter condensate was recovered.
Sylhet Gas Field: This is the oldest producing gas field of the country. Sylhet structure is known for first oil discovery of the country. During the year 3.4 Bscf gas was produced from yjios field. Average daily gas production 9.2 MMcfd. In addition to gas, 2906 thousand liter MS, 934 thousand liter kerosene and 4305 thousand liter condensate was also recovered.
International E and P Companies
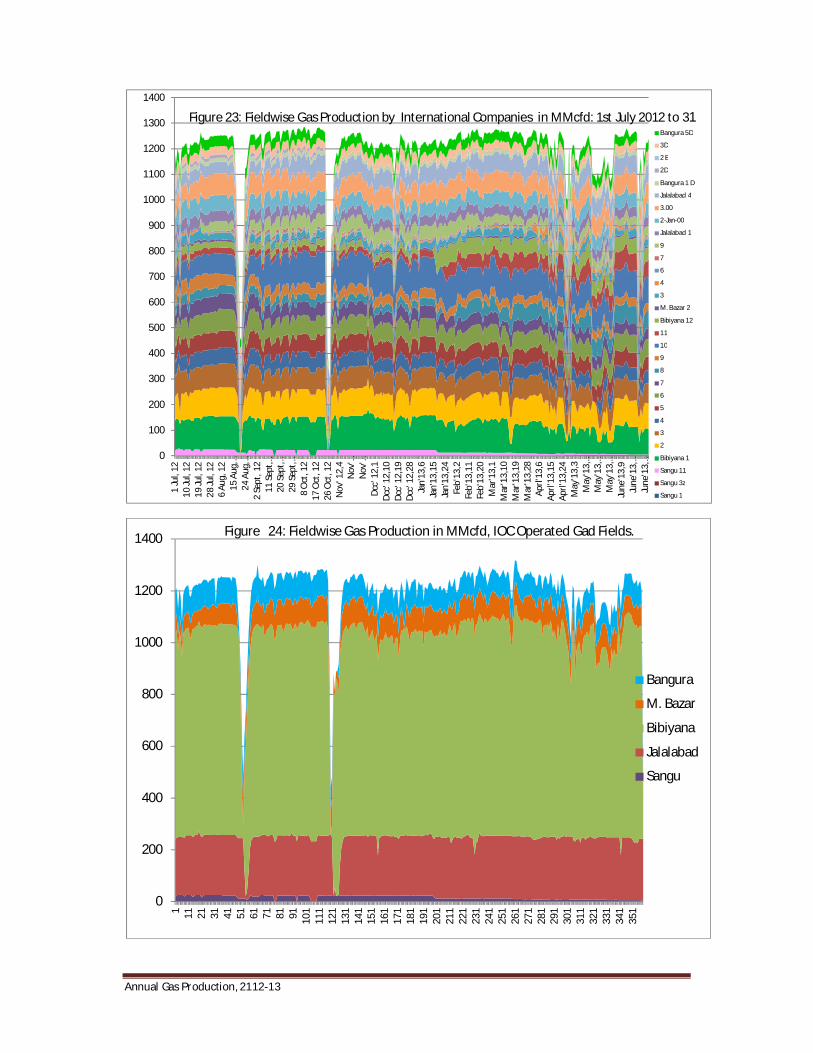
Chevron, Tullow and Santos are three international oil and gas companies (IoC) operating in the country. During the year these three companies produced 443 Bscf gas. Average daily production was 1115 MMcfd. In average per well gas production of IoC wells is much higher than that of the national companies. IoC produce 1115 MMcfd using 28 wells. Average per well production of IoC well is 40 MMcfd. Maximum production was 117 MMcfd from Bibiyana well 1.Durimg tye year 4485 thousand condensate was recovered by the IoCs. Average daily recovery of condensate was 12.3 thousand per day.
Chevron: This company is the largest producer of gas of the country. Chevron operates three gas fields i.e. Bibiyana, Jalalabad and Moulavi Bazar. It may be mentioned It may be mentioned that Bibiyana is the second largest gas field of the country and it is also the largest gas producer of the country. During the year Chevron produced 368 Bscf gas and average daily production was 1008 MMcfd. In addition to gas, this company producer 294,726 thousand liter condensate.
During the year Bibiyana Gas field Produced t 253 Bscf gas and average daily gas production was 692 MMcfd. In addition to gas, 194770 thousand liter condensate was also recovered.

Annual Gas Production, 2112-13
Jalalabad is the second gas field operated by Chevron. In 2012-13 this field Jalalabad produced 230 MMcfd and total production during the year 10038 thousand liter condensate.
Moulavi Bazar gas field produced 30 Bscf gas average daily production was 86 MMcfd . In addition to gas, 918 thousand liter condensate was recovered.
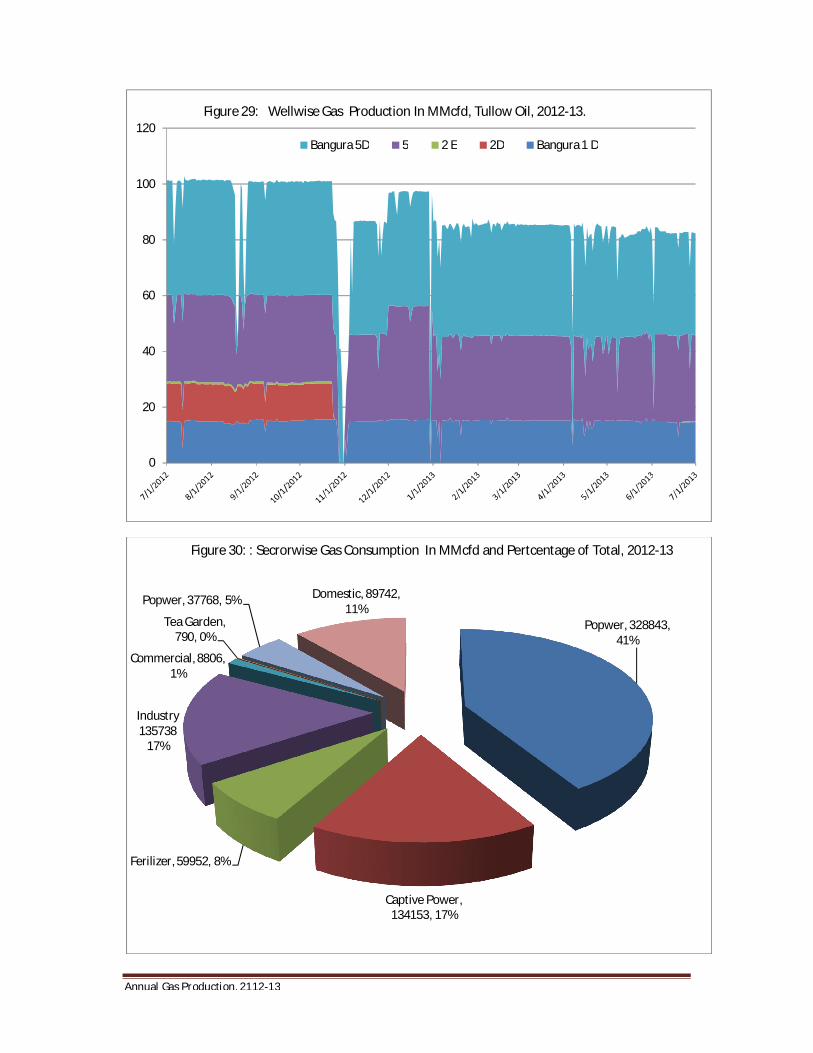
Tullow Oil operates Bangura gas field. During reported year 32 Bscf gas was produced. Average daily production was 88.4 MMcfd . During the year condensate at an average rate was 99 bbl/day.
Sangu is the lone offshore gas field operated by Santos from Australia. During the year average daily production was 17.3 MMcfd and total production was 6.2 Bscf. Santos is struggling to maintain production.
Production and Supply: During the year gas production logged 764 Bscf and average daily production was 2093 MMcfd.
According to gas production data during the year total production logges 2222 MMcfd which rquals to 811 Bacf. 9 811 Bscf) 222 Mcfd MIS report gas production n logged 226696 MMCM. This equals to 22494 MMcm). According to MIS report gas sales total production was 226669 MMCM and this equals to 801 Bscf. During theyear
Annual Gas Production, 2112-13
0
200
400
600
800
1000
1200
1400
1600
1800
2000
2200
2400
2600
1 Ju
ly,2
012
10 Ju
ly,2
012
19 Ju
ly,2
012
28 Ju
ly,2
012
6 Au
g,20
1215
Aug
,201
224
Aug
,201
22
Sept
,201
211
Sept
,201
220
Sept
,201
229
Sept
,201
28
Oct
,201
217
Oct
,201
226
Oct
,201
24
Nov
,201
213
Nov
,201
222
Nov
,201
21
Dec
,201
210
Dec
,201
219
Dec
,201
228
Dec
,201
26
Jan,
13
15 Ja
n, 1
324
Jan,
13
2 Fe
b, 1
311
Feb,
13
20 Fe
b, 1
31
Mar
, 13
10 M
ar, 1
319
Mar
, 13
28 M
ar, 1
36
Apr
l, 13
15 A
prl,
1324
Apr
l, 13
3 M
y, 1
312
My,
13
21 M
y, 1
330
My,
13
8 Ju
n, 1
317
Jun
, 13
26 J
un, 1
3
Srikail SundalpurSemutang Fenchuganj 4Fenchuganj 3 Salda, Lr Shahbazpur KTL6. U IGSKTL 5, NGS KTL 4 MGSKTL3,Ugs KTL2, UGSKTL 1, MG S Surma 1ASylhet 7 Beani Bazar 2Beani Bbazar 1 RP 7, LrRP 3, Lr Sst RP 2, Lr SStRP 1, Up sst
Bakhrabad 1Habjganj 11 107 65 43 2Habiganj 1 17Titas 16 1514 1312 1110 98 76 54 2Titas 1 Meghna 1Narshingdi 2 Narshingdi 1Bangura 5D 3D2 E 2DBangura 1 D Jalalabad 43 2Jalalabad 1 97 64 3M. Bazar 2 #REF!Bibiyana 12 1110 98 76 54 3#REF! Bibiyana 1Sangu 11 Sangu 3zSangu 1
Figure 1: Wellwise Annual Gas Production in MMcfd, July 2012 - June 2013
0
200
400
600
800
1000
1200
1400
1600
1800
2000
2200
2400
1/7/12 1/8/12 1/9/12 1/10/12 1/11/12 1/12/12 1/1/13 1/2/13 1/3/13 1/4/13 1/5/13 1/6/13
Srikail
SundalpPur
Semutang
Fenchiganj
Shalda
Shahbazpur
Kailas Tila
Sylhet
Beani Bazar
Rashidpur
Bakhrabad
Habiganj
Titas
Meghna
Narshingdi
Bangura
Jalalabad
Figure 2 Fieldwise Gas Production in MMcfd, 1 July - 2012 - 3o June 2013

Annual Gas Production, 2112-13
0
20
40
60
80
100
120
7/1/2012
7/15/2012
7/29/2012
8/12/2012
8/26/2012
9/9/2012
9/23/2012
10/7/2012
10/21/2012
11/4/2012
11/18/2012
12/2/2012
12/16/2012
12/30/2012
1/13/2013
1/27/2013
2/10/2013
2/24/2013
3/10/2013
3/24/2013
4/7/2013
4/21/2013
5/5/2013
5/19/2013
6/2/2013
6/16/2013
Sangu
M. Bazar
Bangura
Narshingdi
Meghna
Bakhrabad
Rashidpur
Beani Bazar
Sylhet
Kailas Tila
Shahbazpur
Shalda
Fenchiganj
Semutang
SundalpPur
Srikail
Figure 3A: Comparison of Fieldwise Daily Gas Production in MMcfd, 2013-13
0
10
20
30
40
50
60
70
80
90
100
110
120 Sangu
M. Bazar
Bangura
Narshingdi
Meghna
Bakhrabad
Rashidpur
Beani Bazar
Sylhet
Kailas Tila
Shahbazpur
Shalda
Fenchiganj
Semutang
SundalpPur
Figure 3 B : Comparison of Fieldwise Gas Production in MMcfd, 2012-13
Annual Gas Production, 2112-13
0
250
500
750
1000
1250
1500
1750
2000
2250
2500
7/1…
7/1…
7/2…
8/1…
8/2…
9/9…
9/2…
10/…
10/…
11/…
11/…
12/…
12/…
12/…
1/1…
1/2…
2/1…
2/2…
3/1…
3/2…
4/7…
4/2…
5/5…
5/1…
6/2…
6/1…
6/3…
IOC National Total
Figure 4: Contribution in Gas Production MMcfd by the National and International Companies. 2012-13
Jalalabad, 229 MMcfd/ 84 Bscf
Bibiyana, 789 MMcfd/ 288 Bscf
Titas, 469 MMcfd/ 171 Bscf
Habiganj, 231 MMcfd/84 Bscf
Figure 5: Four Major Gas Producer in MMcfd, 2012-13
Annual Gas Production, 2112-13
Santos, 15.99 MMcfd/5.83 Bscf
Chevron, 1100.88 MMcfd/
401.82 Bscf
Tullow, 88.34 MMcfd/32.24 Bscf
BGFCL, 765.92 MMcfd/279.56 Bscf
SGFL, 154.26 MMcfd/56.30 Bscf
BAPEX, 86.33 MMcfd/31.15 Bscf
Figure 6: Company wise Gas Prodiction in MMcfd/Bscf. 2012-13
Sangu, 16.9
Bibiyana, 690.5
M. Bazar, 85.7
Jalalabad, 228.9Tullow, 88.4
Narshingdi, 29.9
Meghna, 10.0
Titas, 467.8
Habiganj, 230.1
Bakhrabad, 30.8
Rashidour, 48.1
Beani Bazar, 11.8 Sylhet, 9.5
Kailas Tila , 88.1
Shahbazpur, 7.2
Salda , 7.3Fenchuganj, 36.6 Semutang, 8.9
Sundalpur, 9.3
Srikail, 7.5
Figure 8: Fieldwise Gas Production in MMcfd, 212012-13

Annual Gas Production, 2112-13
Sangu, 0.45
Bibiyana, 3302.8
Titas, 447.5
Habiganj, 13.1
Jalalabad, 230.6
Bangura, 270.2
Kailas Tila, 747.6
M. Bazar, 19.0
Rashidpur, 57.7
Bakhrabad, 8.7
Narshingdi, 60.0
Beani Bazar, 12.6
Fenchuganj, 19.7Salda, 7.5
Sylhet, 14.1 Meghna, 19.2
Semutang, 4.5Sundalpur, 0.7Shahcazpur, 0.4
Shrikail, 7.6
Figure 9: Fieldwise Condensate Recovery in bbl/Day: 2012-13
3303
748
447270 231
60 57.7 19.7 19.2 14.1 13.1 12.6 8.67 7.6 7.5 7.6 4.5 0.70 0.45 0.450
500
1000
1500
2000
2500
3000
3500Figure 10 : Comparison of Fieldwise Annual Condensate Reconery in bbl/day, 2012-13

Annual Gas Production, 2112-13
MS, 91564
HSD, 83083
NGl, 29255
Condensate, 410256
SK, 25852 Octane, 14361
Figure 11: Annual Recovery of Liquid in 1000 Litre, 2012-13
0
100
200
300
400
500
600
700
800
900
1000
1100SrikailSundalpurSemutangFenchuganj 4Fenchuganj 3Salda, Lr ShahbazpurKTL6. U IGSKTL 5, NGSKTL 4 MGSKTL3,UgsKTL2, UGSKTL 1, MG SSurma 1ASylhet 7Beani Bazar 2Beani Bbazar 1RP 7, LrRP 3, Lr SstRP 2, Lr SStRP 1, Up sst
Bakhrabad 1Habjganj 1110765432Habiganj 117Titas 161514131211109876542Titas 1Meghna 1Narshingdi 2Narshingdi 1
Annual Gas Production, 2112-13
0100200300400500600700800900
10001100
7/1/
2002
7/10
/200
27/
19/2
002
7/28
/200
28/
6/20
028/
15/2
002
8/24
/200
29/
2/20
029/
11/2
002
9/20
/200
29/
29/2
002
10/8
/200
210
/17/
2002
10/2
6/20
0211
/4/2
002
11/1
3/20
0211
/22/
2002
12/1
/200
212
/10/
2002
12/1
9/20
0212
/28/
2002
1/6/
2003
1/15
/200
31/
24/2
003
2/2/
2003
2/11
/200
32/
20/2
003
3/1/
2003
3/10
/200
33/
19/2
003
3/28
/200
34/
6/20
034/
15/2
003
4/24
/200
35/
3/20
035/
12/2
003
5/21
/200
35/
30/2
003
6/8/
2003
6/17
/200
36/
26/2
003
Srikail
SundalpPur
Semutang
Fenchuganj
Salda Nadi
Shahbazpur
Kailas Tila
Sylhet
Beani Bazar
Rashidpur
Bakhrabad
Habiganj
Titas
Meghna
Narshingdi
Figure 13: Fieldwise gas production in MMcfd by Gas Fields Oprtated by National Companies, 2012-13
SGFL 154.25
BGFCL 766.5
BAPEX 86.44
Figure 14: Comparison of Annual Gas Productionby National Companies in MMcfd, 2012-13

Annual Gas Production, 2112-13
Narshingdi, 29.9
Meghna, 10.0
Titas, 468.2
Habiganj, 227.5
Bakhrabad, 30.8
Rashidpur, 46.9
Beani Bazar, 11.7
Sylhet, 9.4Kailas Tila, 86.3
Shahbazpur, 7.2
Salda Nadi, 16.0Fenchuganj, 38.8
Semutang, 8.6
SundalpPur, 8.6
Srikail, 7.1
Figure 15: Fieldwise Annual Gas Prodution of Gas Fields Under National Comoanies, 2012-13
0
10
20
30
40
50
60
70
80
90
100
110
120
130
Srikail
SundalpPur
Semutang
Fenchuganj
Salda Nadi
Shahbazpur
Figure 16: Fleldswise Gas Producvtion by BAPEX, 2012-13

Annual Gas Production, 2112-13
Fenchuganj: 36.5 MMcfd
Salda, 16.2
Shahbazpur7.2
Semutang8.9
Sundalpur9.3
Sundalpur7.5
Figutr 17: : Annual Fieldwise Gas Production in MMcfd. BAPEX, 2012-13
Shahbazpur: 7.2MMcfd,
2.6 Bscf
Shahbazpur: 7. MMcfd/2.65 Bscf2
16.2
36.6 MMcfd//.4..2 Bscf
Fenchuganj: 36..6 MMcfd/13.4 Bscf2/
9.30 MMcfd/ 3.4 Bscf
Srikail: 7.5 MMcfd/ 2.7 Bscf
Figure 18: Fieldwise Annual Gas Production in MMcfd, BAPEX, 2012-13

Annual Gas Production, 2112-13
0
100
200
300
400
500
600
700
800
900
Bakhrabad
Habiganj
Titas
Meghna
Narshingdi
Figure 19: Fleldswise Gas Producvtion by BGFCLin MMcfd, 2012-13
Narshingdi, 29.9 Meghna, 10.0
Titas, 468.2
Habiganj, 227.5
Bakhrabad, 30.8
Figure 20: Fieldwise Annual Gas Production in MMcfd of BGFCL, 2012-13
Annual Gas Production, 2112-13
0
20
40
60
80
100
120
140
160
180
Kailas Tila
Sylhet
Beani Bazar
Rashidpur
Figure 21: Fleldswise Gas Producvtion by SGFL in MMcfd, 2012-13
Rashidpur 46.9
Beani Bazar11.7
Sylhet 9.4
Kailas Tila86.3
Figure 22: Fieldwise Annual Gas Production in MMcfd,SGFL, 2012-13. SGFL
Annual Gas Production, 2112-13
0
100
200
300
400
500
600
700
800
900
1000
1100
1200
1300
1400
1 Ju
l, 12
10 Ju
l, 12
19 Ju
l, 12
28 Ju
l, 12
6 Au
g, 1
215
Aug
, …24
Aug
, …2
Sept
, 12
11 S
ept, …
20 S
ept, …
29 S
ept, …
8 O
ct, 1
217
Oct
, 12
26 O
ct, 1
2N
ov' 1
2,4
Nov
' …N
ov' …
Dcc'
12,
1Dc
c' 1
2,10
Dcc'
12,
19Dc
c' 1
2,28
Jan'
13,6
Jan'
13,1
5Ja
n'13
,24
Feb'
13,2
Feb'
13,1
1Fe
b'13
,20
Mar
'13,
1M
ar'1
3,10
Mar
'13,
19M
ar'1
3,28
Aprl'
13,6
Aprl'
13,1
5Ap
rl'13
,24
May
'13,
3M
ay'1
3,…
May
'13,
…M
ay'1
3,…
June
'13,
9Ju
ne'1
3,…
June
'13,
…
Bangura 5D
3D
2 E
2D
Bangura 1 D
Jalalabad 4
3.00
2-Jan-00
Jalalabad 1
9
7
6
4
3
M. Bazar 2
Bibiyana 12
11
10
9
8
7
6
5
4
3
2
Bibiyana 1
Sangu 11
Sangu 3z
Sangu 1
Figure 23: Fieldwise Gas Production by International Companies in MMcfd: 1st July 2012 to 31
0
200
400
600
800
1000
1200
1400
1 11 21 31 41 51 61 71 81 91 101
111
121
131
141
151
161
171
181
191
201
211
221
231
241
251
261
271
281
291
301
311
321
331
341
351
Bangura
M. Bazar
Bibiyana
Jalalabad
Sangu
Figure 24: Fieldwise Gas Production in MMcfd, IOC Operated Gad Fields.

Annual Gas Production, 2112-13
Figure 25: Fieldwise Gs Productionby IOCs in MMcfd and Bscf. 2012-13
Jalalabad: 229.5 MMcfd/
Bibiyana: 690.5 MMcfd/252 Bscf
0
200
400
600
800
1000
1200
1400
1 11 21 31 41 51 61 71 81 91 101
111
121
131
141
151
161
171
181
191
201
211
221
231
241
251
261
271
281
291
301
311
321
331
341
351
M. Bazar
Bibiyana
Jalalabad
Figure 26: Fieldwise Gas Production in MMcfd, IOC Operated Gad Fields.

Annual Gas Production, 2112-13
Jalabad 224.8 MMcfd/
20.8 % f
Bibiyana 771.MMcfd/
71 %
M. Bazar: 84.4 MMcfd.
7.8 %
0
5
10
15
20
25
30
1 Ju
ly,2
012
8 Ju
ly,2
012
15 Ju
ly,2
012
22 Ju
ly,2
012
29 Ju
ly,2
012
5 Au
g,20
1212
Aug
,201
219
Aug
,201
226
Aug
,201
22
Sept
,201
29
Sept
,201
216
Sept
,201
223
Sept
,201
230
Sept
,201
27
Oct
,201
214
Oct
,201
221
Oct
,201
228
Oct
,201
24
Nov
,201
211
Nov
,201
218
Nov
,201
225
Nov
,201
22
Dec
,201
29
Dec
,201
216
Dec
,201
223
Dec
,201
230
Dec
,201
26
Jan,
13
13 Ja
n, 1
320
Jan,
13
27 Ja
n, 1
33
Feb,
13
10 Fe
b, 1
317
Feb,
13
24 Fe
b, 1
33
Mar
, 13
10 M
ar, 1
317
Mar
, 13
24 M
ar, 1
331
Mar
, 13
7 A
prl,
1314
Apr
l, 13
21 A
prl,
1328
Apr
l, 13
5 M
y, 1
312
My,
13
19 M
y, 1
326
My,
13
2 Ju
n, 1
39
Jun,
13
16 J
un, 1
323
Jun
, 13
30 J
un, 1
3
Sangu 11
Sangu 3z
Sangu 1
Annual Gas Production, 2112-13
0
20
40
60
80
100
120Bangura 5D 5 2 E 2D Bangura 1 D
Figure 29: Wellwise Gas Production In MMcfd, Tullow Oil, 2012-13.
Popwer, 328843, 41%
Captive Power, 134153, 17%
Ferilizer, 59952, 8%
Industry135738
17%
Commercial, 8806, 1%
Tea Garden, 790, 0%
Popwer, 37768, 5% Domestic, 89742, 11%
Figure 30: : Secrorwise Gas Consumption In MMcfd and Pertcentage of Total, 2012-13
Annual Gas Production, 2112-13
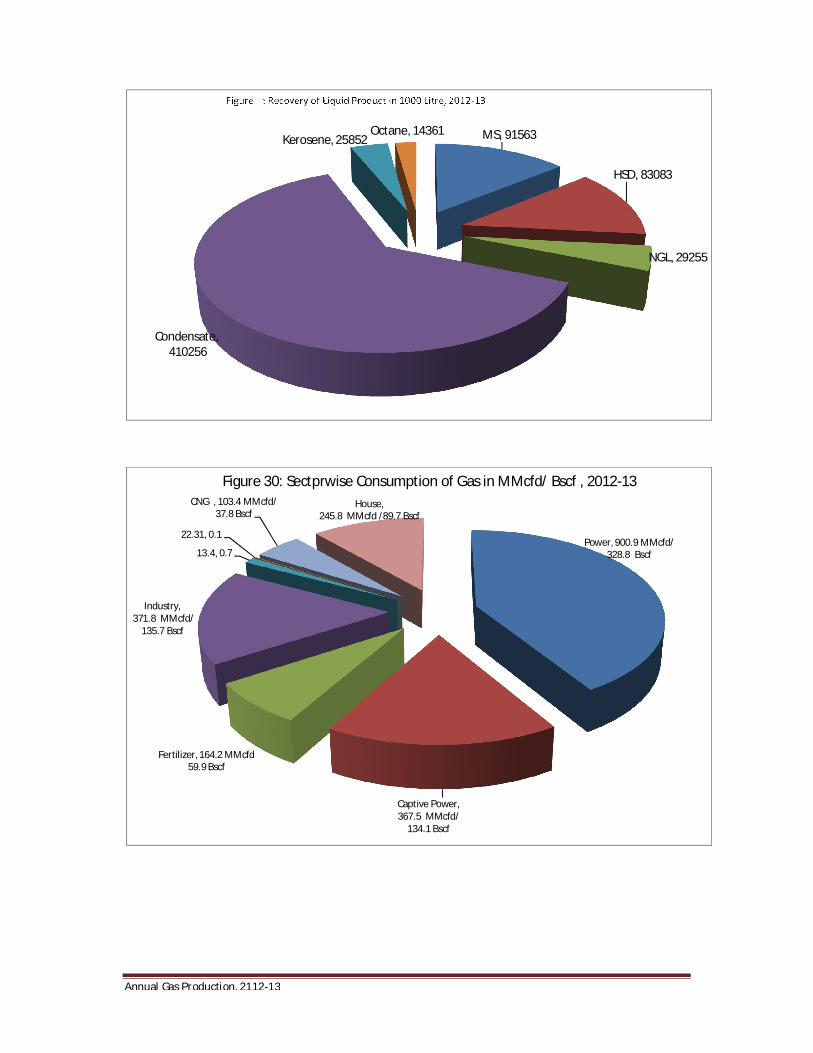
MS, 91563
HSD, 83083
NGL, 29255
Condensate,410256
Kerosene, 25852Octane, 14361
Power, 900.9 MMcfd/328.8 Bscf
Captive Power, 367.5 MMcfd/
134.1 Bscf
Fertilizer, 164.2 MMcfd59.9 Bscf
Industry,371.8 MMcfd/
135.7 Bscf
13.4, 0.7
22.31, 0.1
CNG , 103.4 MMcfd/37.8 Bscf
House, 245.8 MMcfd /89.7 Bscf
Figure 30: Sectprwise Consumption of Gas in MMcfd/ Bscf , 2012-13