hydraulic fracturing technique: pore pressure effect and stress heterogeneity
TRANSCRIPT
Int. J. Rock Mech. Min. Sci. & Geomech. Abstr. Vol. 26, No. 6, pp. 471-475, 1989 0148-9062/89 $3.00+0.00 Printed in Great Britain. All rights t~-served Copyright ~ 1989 Pergamon Press pie
Hydraulic Fracturing Technique: Pore Pressure Effect and Stress Heterogeneity R. IKEDA? H. TSUKAHARA?
Hydraulic fracturing stress measurements have been conducted in 19 boreholes at depths from 100m to a maximum of 9oom. From detailed observation of the pressure-time record for each test, it is found that the increase of pore pressure during pressurization for hydraulic fracturing affects the pressure- time curve considerably. A new "curve fitting method" is proposed for identification of the shut-in point on the pressure-time record which is affected by the pore pressure. Concerning the stress variation with depth, stress concentrations and~or relaxation zones are found at some sites. Test pro- cedures and field equipment are described. A dual impression packer system, which has been developed for its efficiency and overall low cost, is also described.
INTRODUCTION
Since 1978, hydraulic fracturing stress measurements have been conducted to investigate the stress state in relation to earthquake prediction in Japan [1]. Stress magnitudes and orientations were obtained in 19 bore- holes of depths from 100 m to a maximum of 900 m. From these measurements, we have been able to derive an outline of the stress state related to the crustal structure as well as the crustal movement around the Kanto-Tokai area.
In this paper, we describe: (1) a new method for interpreting hydraulic fracturing data, including the pore pressure effect; and (2) stress variation with depth, especially stress concentration at various depths in a particular borehole.
REOPENING AND SHUT-IN PRESSURE
Pressure-time record and in situ stress 50
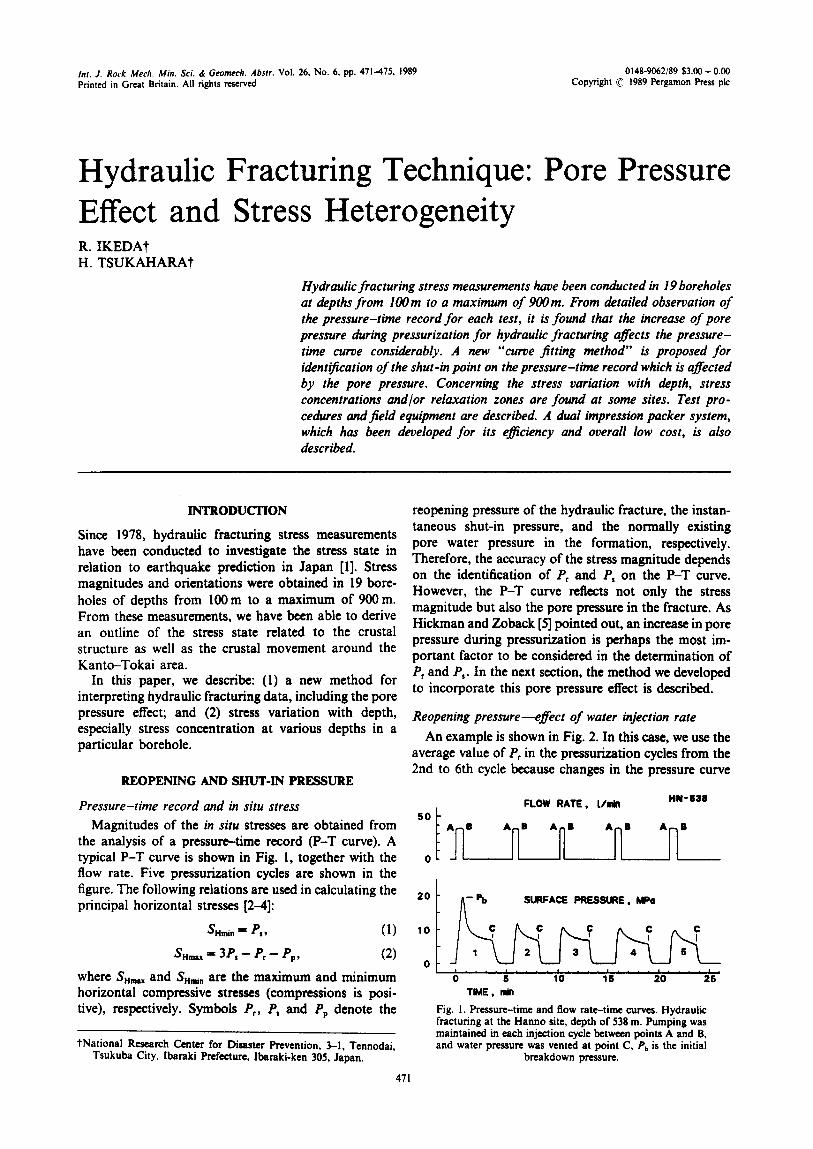
Magnitudes of the in situ stresses are obtained from the analysis of a pressure--time record (P-T curve). A typical P-T curve is shown in Fig. 1, together with the o flow rate. Five pressurization cycles arc shown in the figure. The following relations are used in calculating the 2 o
principal horizontal stresses [2-4]:
SHm,. ffi P,, (I) 10
S . . . . = 3/', - Pr - Pp, (2) o
where S...x and S.~. are the maximum and minimum horizontal compressive stresses (compressions is posi- tive), respectively. Symbols Pr, P, and Pp denote the
?National Research Center for Disaster Prevention, 3-1, Tennodai, Tsukuba City, Ibaraki Prefecture, lbaraki-ken 305, Japan.
471
reopening pressure of the hydraulic fracture, the instan- taneous shut-in pressure, and the normally existing pore water pressure in the formation, respectively. Therefore, the accuracy of the stress magnitude depends on the identification of Pr and P, on the P-T curve. However, the P-T curve reflects not only the stress magnitude but also the pore pressure in the fracture. As Hickman and Zoback [5] pointed out, an increase in pore pressure during pressurization is perhaps the most im- portant factor to be considered in the determination of Pr and P,. In the next section, the method we developed to incorporate this pore pressure effect is described.
Reopening pressure---effect of water injection rate
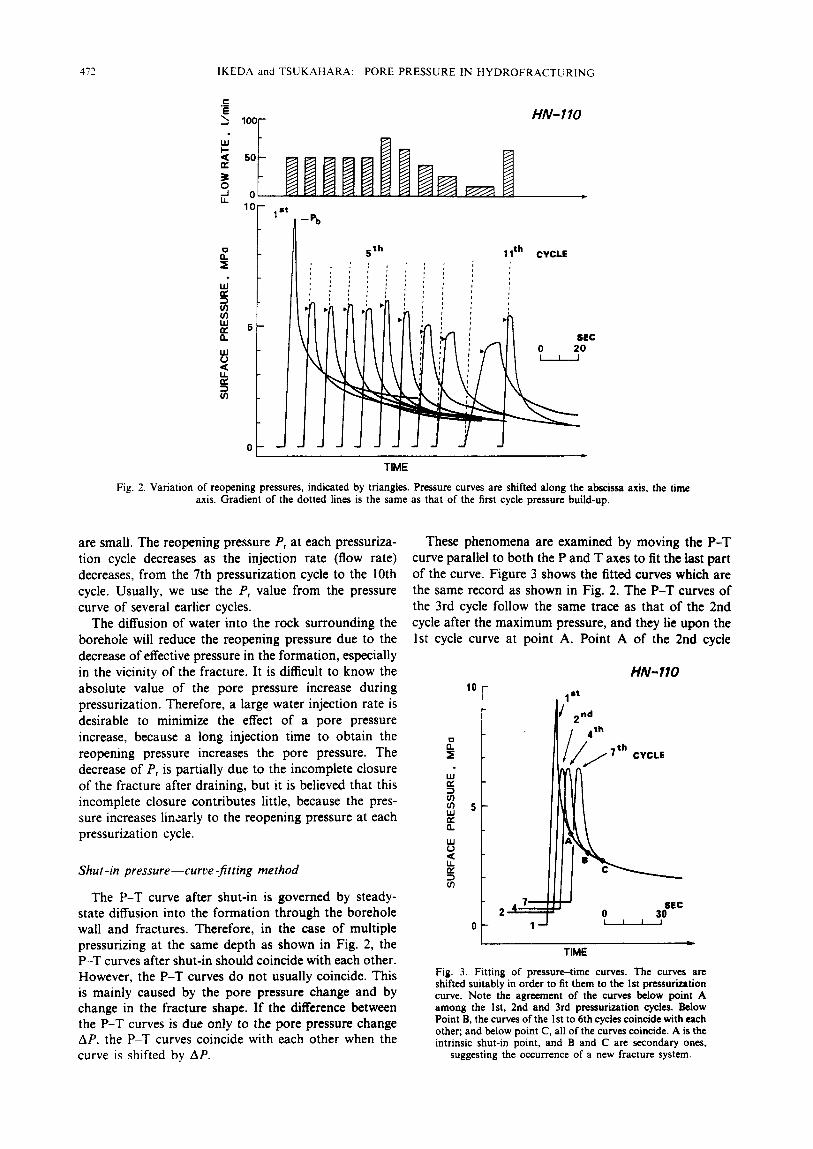
An example is shown in Fig. 2. In this case, we use the average value of Pr in the pressurization cycles from the 2nd to 6th cycle because changes in the pressure curve
FLOW RATE, L/rain HN-$38
FA " "n" "n' An" "n" --Pb SURFACE PRESSURE. MPa
. . . . 5 . . . . ; o . . . . +'5 . . . . . . . . i s +
TIME, mln
Fig. ]. Prcssm~-time and flow rate-time curves. Hydraulic fracturing at the Hanno site, depth of 538 m. Pumping was maintained in each injection cycle between points A and B, and water pressure was vented at point C, Pb is the initial
breakdown pressure.
472 IKEDA and T S U K A H A R A : PORE PRESSURE IN H Y D R O F R A C T U R I N G
E
~-w ~" ~°° I ,< 50 r,,
~ 0 LL 10
0 n :E
LU
03 03 LU ~. 5 n
UJ o < u.
03
H N - I I O
I "~ _~
5th
ili ii! i
' PI
JJJJ
) i )
' i
TIME
m . . .
11 th CYCLE
0 ~c
Fig. 2. Variation of reopening pressures, indicated by triangles. Pressure curves are shifted along the abscissa axis, the time axis. Gradient of the dotted lines is the same as that of the first cycle pressure build-up.
are small. The reopening pressure Pr at each pressuriza- tion cycle decreases as the injection rate (flow rate) decreases, from the 7th pressurization cycle to the 10th cycle. Usually, we use the Pr value from the pressure curve of several earlier cycles.
The diffusion of water into the rock surrounding the borehole will reduce the reopening pressure due to the decrease of effective pressure in the formation, especially in the vicinity of the fracture. It is difficult to know the absolute value of the pore pressure increase during pressurization. Therefore, a large water injection rate is desirable to minimize the effect of a pore pressure increase, because a long injection time to obtain the reopening pressure increases the pore pressure. The decrease of P~ is partially due to the incomplete closure of the fracture after draining, but it is believed that this incomplete closure contributes little, because the pres- sure increases linearly to the reopening pressure at each pressurization cycle.
Shut-in pressure--curve-fitting method
The P-T curve after shut-in is governed by steady- state diffusion into the formation through the borehole wall and fractures. Therefore, in the case of multiple pressurizing at the same depth as shown in Fig. 2, the P-T curves after shut-in should coincide with each other. However, the P-T curves do not usually coincide. This is mainly caused by the pore pressure change and by change in the fracture shape. If the difference between the P-T curves is due only to the pore pressure change AP, the P-T curves coincide with each other when the curve is shifted by Ap.
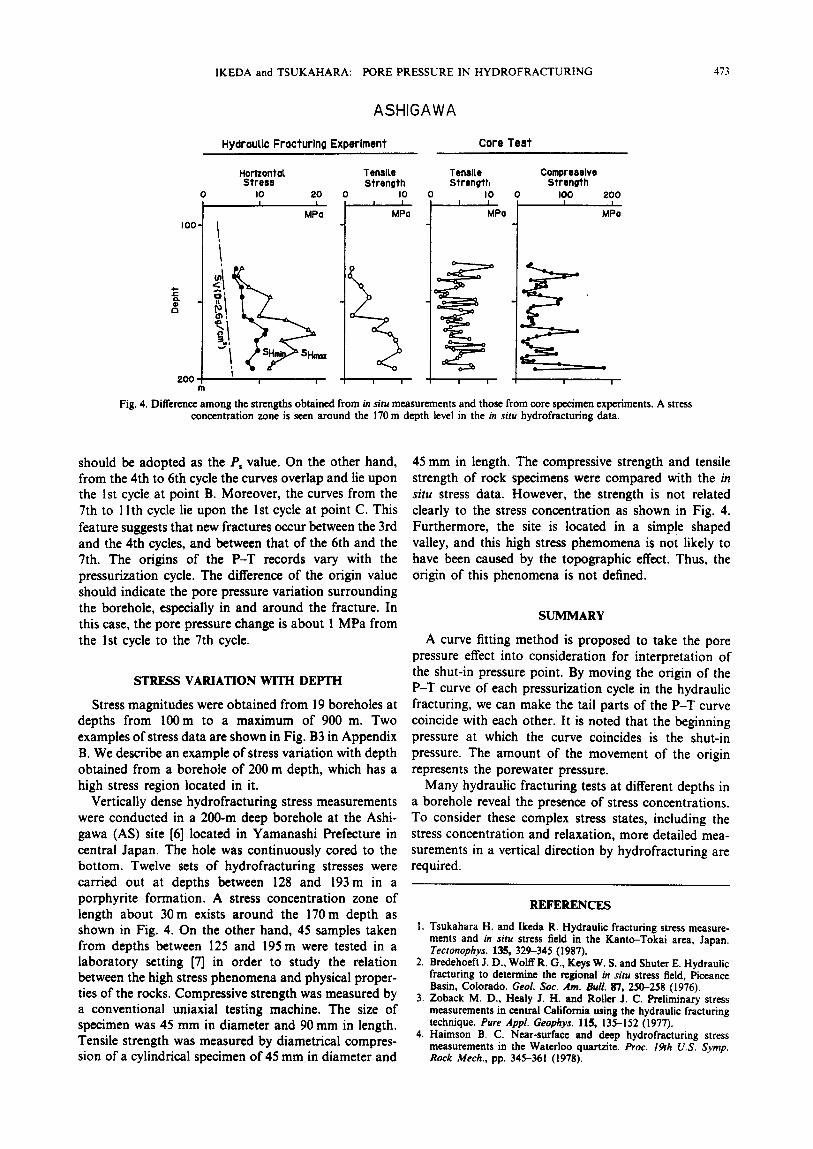
These phenomena are examined by moving the P-T curve parallel to both the P and T axes to fit the last part of the curve. Figure 3 shows the fitted curves which are the same record as shown in Fig. 2. The P-T curves of the 3rd cycle follow the same trace as that of the 2rid cycle after the maximum pressure, and they lie upon the 1st cycle curve at point A. Point A of the 2rid cycle
LU
O3 03 LU n~ n
w
03
1 0 - HN- I10
7 1 i |
2 4 J I 1
/ 1 2 n d
/ 4 th
/ / J 7th CYCLE
k
I SEC 0 30 I 1 I I
TIME
Fig. 3. Fitting of pressure-t ime curves. The curves are shifted suitably in order to fit them to the 1st pressurization curve. Note the agreement of the curves below point A among the 1st, 2nd and 3rd pressurization cycles. Below Point B, the curves of the 1st to 6th cycles coincide with each other; and below point C, all of the curves coincide. A is the intrinsic shut-in point, and B and C are secondary ones,
suggesting the occurrence of a new fracture system.
IKEDA and TSUKAHARA: PORE PRESSURE IN HYDROFRACTURING 473
ASHIGAWA
Hydroutlc Fracturing Experiment core Test
Horizontal TensiLe Stress Strength
0 I0 20 0 I0 I I
MPo I00-
2OO m
~ X ! I
! I MPo
TensiLe Compressive Strength Strength
o I o o I00 200 I I I l
MPo MPo
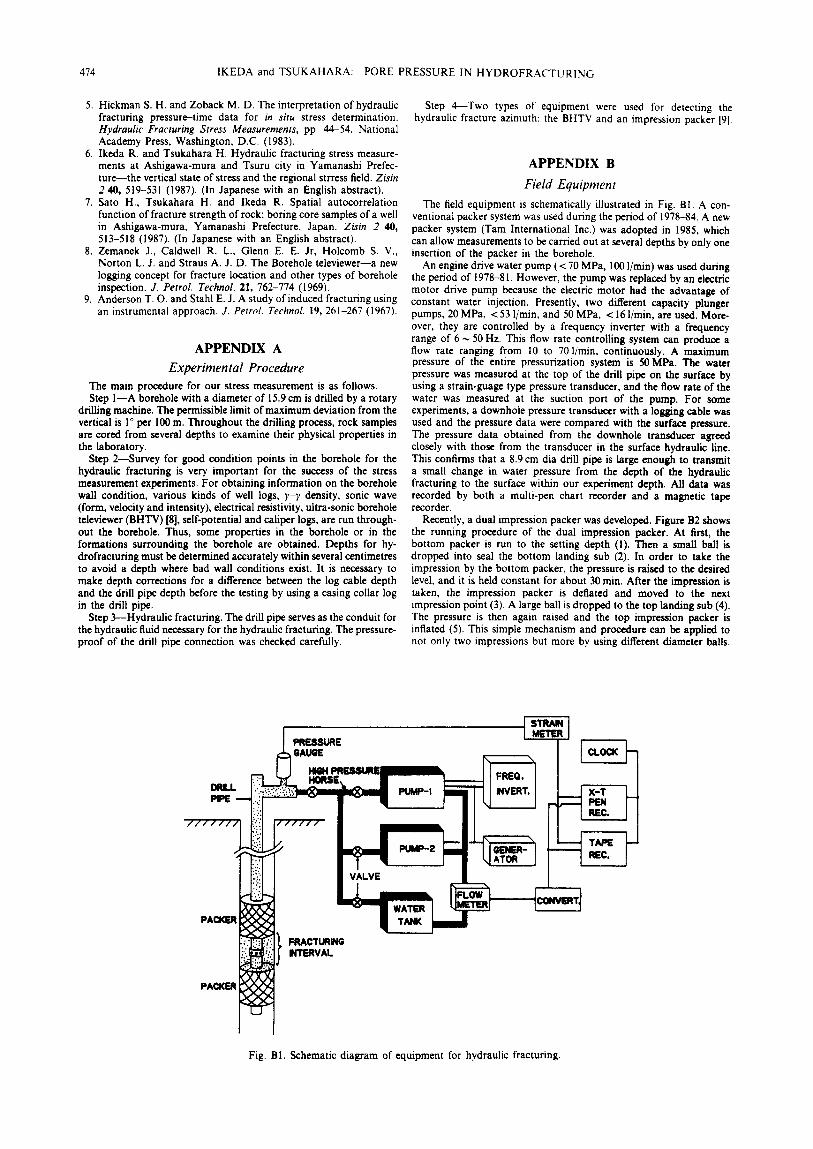
I I Fig. 4. Difference among the strengths obtained from/n situ measurements and those from core specimen experiments. A stress
concentration zone is seen around the 170 m depth level in the/n situ hydrofracturing data.
should be adopted as the P, value. On the other hand, from the 4th to 6th cycle the curves overlap and lie upon the 1st cycle at point B. Moreover, the curves from the 7th to 1 lth cycle lie upon the 1 st cycle at point C. This feature suggests that new fractures occur between the 3rd and the 4th cycles, and between that of the 6th and the 7th. The origins of the P -T records vary with the pressurization cycle. The difference of the origin value should indicate the pore pressure variation surrounding the borehole, especially in and around the fracture. In this case, the pore pressure change is about 1 MPa from the 1st cycle to the 7th cycle.
STRESS VARIATION WITH DEPTH
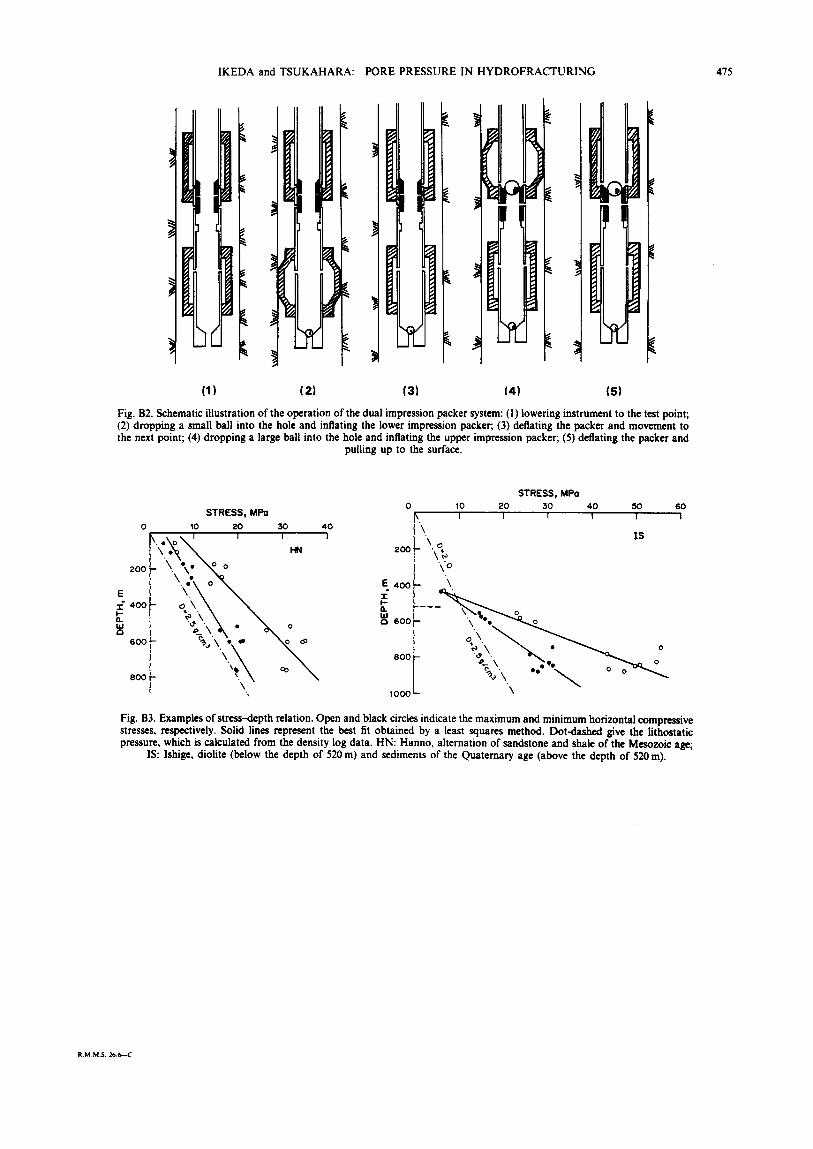
Stress magnitudes were obtained from 19 boreholes at depths from 100m to a maximum of 900 m. Two examples of stress data are shown in Fig. B3 in Appendix B. We describe an example of stress variation with depth obtained from a borehole of 200 m depth, which has a high stress region located in it.
Vertically dense hydrofracturing stress measurements were conducted in a 200-m deep borehole at the Ashi- gawa (AS) site [6] located in Yamanashi Prefecture in central Japan. The hole was continuously cored to the bottom. Twelve sets of hydrofracturing stresses were carried out at depths between 128 and 193m in a porphyrite formation. A stress concentration zone of length about 30 m exists around the 170 m depth as shown in Fig. 4. On the other hand, 45 samples taken from depths between 125 and 195 m were tested in a laboratory setting [7] in order to study the relation between the high stress phenomena and physical proper- ties of the rocks. Compressive strength was measured by a conventional uniaxial testing machine. The size of specimen was 45 mm in diameter and 90 mm in length. Tensile strength was measured by diametrical compres- sion of a cylindrical specimen of 45 mm in diameter and
45 mm in length. The compressive strength and tensile strength of rock specimens were compared with the in
situ stress data. However, the strength is not related clearly to the stress concentration as shown in Fig. 4. Furthermore, the site is located in a simp!e shaped valley, and this high stress phemomena is not likely to have been caused by the topographic effect. Thus, the origin of this phenomena is not defined.
SUMMARY
A curve fitting method is proposed to take the pore pressure effect into consideration for interpretation of the shut-in pressure point. By moving the origin of the P-T curve of each pressurization cycle in the hydraulic fracturing, we can make the tail parts of the P -T curve coincide with each other. It is noted that the beginning pressure at which the curve coincides is the shut-in pressure. The amount of the movement of the origin represents the porewater pressure.
Many hydraulic fracturing tests at different depths in a borehole reveal the presence of stress concentrations. To consider these complex stress states, including the stress concentration and relaxation, more detailed mea- surements in a vertical direction by hydrofracturing are required.
R E F E R E N C E S
1. Tsukahara H. and lkeda R. Hydraulic fracturing stress measure- ments and /n situ stress field in the Kanto-Tokai area, Japan. Tectonophys. 135, 329-345 (1987).
2. Bredehoeft J. D., Wolff R. G., Keys W. S. and Shuter E. Hydraulic fracturing to determine the regional /n situ stress field, Piceance Basin, Colorado. Geol. Sac. Am. Bull. 87, 250-258 (1976).
3. Zoback M. D., Healy J. H. and Roller J. C. Preliminary stress measurements in central California using the hydraulic fracturing technique. Pure Appl. Geophys. 115, 135-152 (1977).
4. Haimson B. C. Near-surface and deep hydrofracturing stress measurements in the Waterloo quartzite. Prec. 19th U.S. Syrup. Rock Mech., pp. 345-361 0978).
474 IKEDA and TSUKAHARA: PORE PRESSURE IN HYDROFRACTURING
5. Hickman S. H. and Zoback M. D. The interpretation of hydraulic fracturing pressure-time data for in situ stress determination. Hydraulic Fracturing Stress Measurements, pp. 44-54. National Academy Press, Washington, D.C. (1983).
6. Ikeda R. and Tsukahara H. Hydraulic fracturing stress measure- ments at Ashigawa-mura and Tsuru city in Yamanashi Prefec- ture---the vertical state of stress and the regional strress field. Zisin 2 40, 519-531 (1987). (In Japanese with an English abstract).
7. Sato H., Tsukahara H. and Ikeda R. Spatial autocorrelation function of fracture strength of rock; boring core samples of a well in Ashigawa-mura, Yamanashi Prefecture, Japan. Zisin 2 40, 513-518 (1987). (In Japanese with an English abstract).
8. Zemanek J., Caldwell R. L., Glenn E. E. Jr, Holcomb S. V., Norton L. J. and Straus A. J. D. The Borehole televiewer--a new logging concept for fracture location and other types of borehole inspection. J. Petrol. Technol. 21, 762-774 (1969).
9. Anderson T. O. and Stahl E. J. A study of induced fracturing using an instrumental approach. J. Petrol. Technol. 19, 261-267 (1967).
A P P E N D I X A
Experimental Procedure
The main procedure for our stress measurement is as follows. Step i - -A borehole with a diameter of 15.9 cm is drilled by a rotary
drilling machine. The permissible limit of maximum deviation from the vertical is 1 ° per 100 m. Throughout the drilling process, rock samples are cored from several depths to examine their physical properties in the laboratory.
Step 2--Survey for good condition points in the borehole for the hydraulic fracturing is very important for the success of the stress measurement experiments. For obtaining information on the borehole wall condition, various kinds of well logs, ~-~, density, sonic wave (form, velocity and intensity), electrical resistivity, ultra-sonic borehole televiewer (BHTV) [8], self-potential and caliper logs, are run through- out the borehole. Thus, some properties in the borehole or in the formations surrounding the borehole are obtained. Depths for hy- drofracturing must be determined accurately within several centimetres to avoid a depth where bad wall conditions exist. It is necessary to make depth corrections for a difference between the log cable depth and the drill pipe depth before the testing by using a casing collar log in the drill pipe.
Step 3--Hydraulic fracturing. The drill pipe serves as the conduit for the hydraulic fluid necessary for the hydraulic fracturing. The pressure- proof of the drill pipe connection was checked carefully.
Step 4--Two types of equipment were used for detecting the hydraulic fracture azimuth: the BHTV and an impression packer [9].
A P P E N D I X B
Field Equipment
The field equipment is schematically illustrated in Fig. BI. A con- ventional packer system was used during the period of 1978-84. A new packer system (Tam International Inc.) was adopted in 1985, which can allow measurements to be carried out at several depths by only one insertion of the packer in the borehole.
An engine drive water pump ( < 70 MPa, 1001/min) was used during the period of 1978-81. However, the pump was replaced by an electric motor drive pump because the electric motor had the advantage of constant water injection. Presently, two different capacity plunger pumps, 20 MPa, < 53 1/min, and 50 MPa, < 16 l/rain, are used. More- over, they are controlled by a frequency inverter with a frequency range of 6 ~ 50 Hz. This flow rate controlling system can produce a flow rate ranging from 10 to 70 l/min, continuously. A maximum pressure of the entire pressurization system is 50 MPa. The water pressure was measured at the top of the drill pipe on the surface by using a strain-guage type pressure transducer, and the flow rate of the water was measured at the suction port of the pump. For some experiments, a downhole pressure transducer with a logging cable was used and the pressure data were compared with the surface pressure. The pressure data obtained from the downhole transducer agreed closely with those from the transducer in the surface hydraulic line. This confirms that a 8.9 cm dia drill pipe is large enough to transmit a small change in water pressure from the depth of the hydraulic fracturing to the surface within our experiment depth. All data was recorded by both a multi-pen chart recorder and a magnetic tape recorder.
Recently, a dual impression packer was developed. Figure 132 shows the running procedure of the dual impression packer. At first, the bottom packer is run to the setting depth (!). Then a small ball is dropped into seal the bottom landing sub (2). In order to take the impression by the bottom packer, the pressure is raised to the desired level, and it is held constant for about 30 min. After the impression is taken, the impression packer is deflated and moved to the next impression point (3). A large ball is dropped to the top landing sub (4). The pressure is then again raised and the top impression packer is inflated (5). This simple mechanism and procedure can be applied to not only two impressions but more by using different diameter balls.
/ I~ESgURE
////// ~//'/// !
Fig. B1. Schematic diagram of equipment for hydraulic fracturing.
IKEDA and TSUKAHARA: PORE PRESSURE IN HYDROFRACTURING 475
I I
,l
'I |
(1) (2) (31 (4) (5)
Fig. B2. Schematic illustration of the operation of the dual impression packer system: (1) lowering instrument to the test point; (2) dropping a small ball into the hole and inflating the lower impression packer; (3) deflating the packer and movement to the next point; (4) dropping a large ball into the hole and inflating the upper impression packer; (5) deflating the packer and
pulling up to the surface.
S T R E S S , M P o
0 10 20 3O 40 • \ ^ ~ , v - - ' I
\'~\.~.\'.~oo oo o HN
- \ o ". \ k • N
\
2 0 0
E :E 4 0 0 I 0 bJ
6 0 0
8 0 0
2 0 0
E 4 0 0 x I-,- o. w r 6 0 0
800 I 10 O0
STRESS MPa 10 20 50 40 50 60
~, I I I I I I '\ ZS \.x°~
"\'o \
~\e'\. * o
\
Fig. B3. Examples of stress-depth relation. Open and black circles indicate the maximum and minimum horizontal compressive stresses, respectively. Solid lines represent the best fit obtained by a least squares method. Dot-dashed give the lithostatic pressure, which is calculated from the density log data. HN: Hanno, alternation of sandstone and shale of the Mesozoic age;
IS: Ishige, diolite (below the depth of 520 m) and sediments of the Quaternary age (above the depth of 520 m).
R.M.M.S, 261'6~C