hybrid energy systems- · hybrid energy systems- prospects and initiatives at nit calicut 3 ... and...
TRANSCRIPT

DECEMBER 2009 1
Volume 3 Issue 1 December 2009
N a t i o n a l I n s t i t u t e o f T e c h n o l o g y C a l i c u t
For Private Circulation Only
N I T C
Hybrid Energy
Systems-Prospects and
Initiatives
at NIT Calicut

DECEMBER 2009 1
CONTENTS
Hybrid Energy Systems- Prospects and Initiatives at NIT Calicut 3S. Ashok
Types of arcs in a fuzzy graph 17Sunil Mathew, M.S. Sunitha
Steel fiber reinforced SCC wall panels in one-way in-plane action 21N. Ganesan, P.V. Indira, S. Rajendra Prasad
Bioaccumulation of heavy metal ions - A Review 26S. Bhuvaneshwari, K. Suguna, V. Sivasubramanian
Planning Annualised Hours 30M.R. Sureshkumar, V. Madhusudanan Pillai
Nanoscience and Biomedicine: Converging Technologies 35Mahesh Kumar Teli, G.K. Rajanikant
Organic Light Emitting Diodes: A Review on Device Physics, and Modeling usingArtificial Neural Networks 44T.A. Shahul Hameed, M.R. Baiju, P. Predeep
Strength and behaviour of petrofitted multi-storey RCC frames under lateral loading 54N. Ganesan, P.V. Indira, Shyju P. Thadathil

2 NIT CALICUT RESEARCH REVIEW
To the Authors
NITC Research Review is a publication devoted to throwlight on the research activities carried out at NationalInstitute of Technology Calicut and their outcome andis meant for limited circulation. The authors retain theirright to publish these results in any journal of their choicefully or partially.
Technical papers based on research conducted at NITC,and Technical notes/ review papers on state of the arton a topic/theme may be submitted through any memberof the editorial committee. One hard copy and one softcopy of the manuscript, complete in all respects arerequired. Matter should be arranged in the followingorder-titlenames of authors-affiliation-abstract-nomenclature-main body of the paperacknowledgements-references –appendices if any. Allfigures and tables should be numbered and captioned.

DECEMBER 2009 3
Introduction: Electricity is a major commodityfor the socio-economic development of anycountry. It plays vital role in all activity of humanbeings in the present scenario. The major part ofelectricity is developed mainly from the fossil fuellike coal, oil, gas. These fossil fuels have severeimpact over the atmosphere in various aspects.Even, these fossil fuels are limited and also goingto over almost middle of this century. Still 18000villages have to be electrified in India and 18% ofworld population. Electricity for this villages andincreased demand will end with vast power crisisin the future. Yet, new sources/technology has tobe invented to meet the future demand throughoutthe world.
For over four decades, scientist and engineersaround the world have been advocating theutilization of renewable energy resources. Becauserenewable sources are abundant, though dilute andvariable, locally available, almost evenlydistributed around the earth, no severe harm overthe environment, simplicity in onsite generation.Table 1 Installed capacity and estimated potentialfrom different renewables in India
Hybrid Energy Systems
Table 1 Renewable sources Installed Capacity Estimated Potential
Wind 2483 MW 45000 MW
Biomass Power/ Cogeneration 613 MW 19500 MW
Biomass Gasifier 58 MW —
Small Hydro 1603 MW 15000 MW
Waste to Energy 41 MW 1700 MW
Solar PV 151 MW 20 MW/sq.km
Since, it is dilute and variable in nature, many com-plexity exist in conversion, condition, control, co-ordination etc. They are utilized as a standalonesystem to electrify many applications like light-ing system, water pumping for irrigation, trafficcontrol, T.V in remote areas etc,. But it is costly,unreliable, stiff, need individual conditioner andcontrolling units. In this challenging atmosphere,Hybrid Energy System (HES) is one of the viablesolutions to harvest energy from renewable energyresources. This work discusses Different types ofHES, their advantages and their future researchscopes.
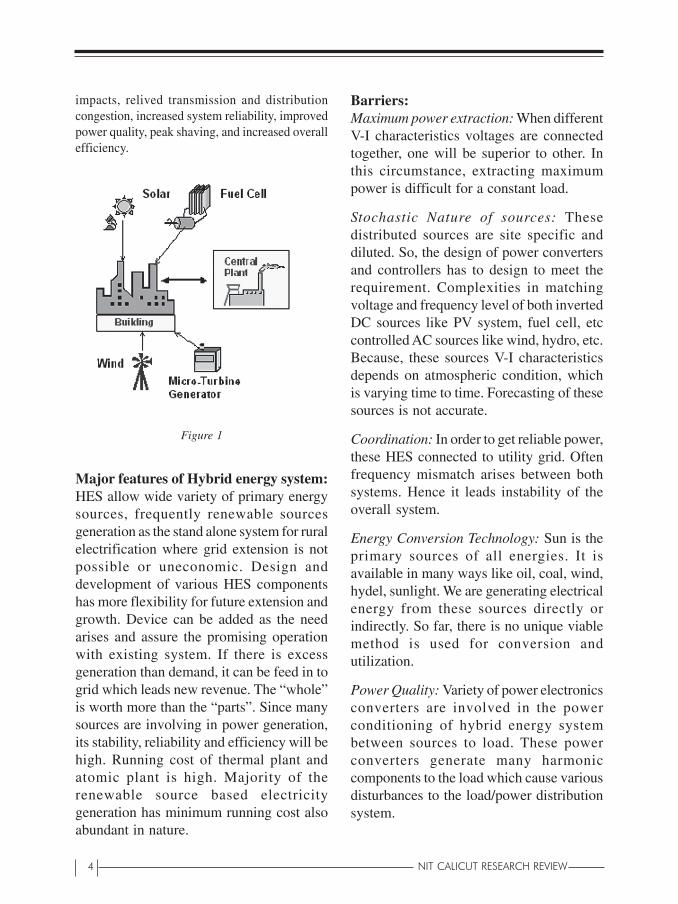
Hybrid Energy System: Hybrid energy system isincluding several (two or more) energy sourceswith appropriate energy conversion technologyconnected together to feed power to local load/grid.Figure 1 gives the general pictorial representationof Hybrid energy system.
Since, it is coming under distributed generationumbrella, there is no unified standard or structure.It receives benefits in terms of reduced line andtransformer losses, reduced environmental
S. Ashok*
Prospects and Initiatives at NIT Calicut
* Professor, Department of Electrical Engg., e-mail:[email protected]
4 NIT CALICUT RESEARCH REVIEW
impacts, relived transmission and distributioncongestion, increased system reliability, improvedpower quality, peak shaving, and increased overallefficiency.
Major features of Hybrid energy system:HES allow wide variety of primary energysources, frequently renewable sourcesgeneration as the stand alone system for ruralelectrification where grid extension is notpossible or uneconomic. Design anddevelopment of various HES componentshas more flexibility for future extension andgrowth. Device can be added as the needarises and assure the promising operationwith existing system. If there is excessgeneration than demand, it can be feed in togrid which leads new revenue. The “whole”is worth more than the “parts”. Since manysources are involving in power generation,its stability, reliability and efficiency will behigh. Running cost of thermal plant andatomic plant is high. Majority of therenewable source based electricitygeneration has minimum running cost alsoabundant in nature.
Barriers:Maximum power extraction: When differentV-I characteristics voltages are connectedtogether, one will be superior to other. Inthis circumstance, extracting maximumpower is difficult for a constant load.
Stochastic Nature of sources: Thesedistributed sources are site specific anddiluted. So, the design of power convertersand controllers has to design to meet therequirement. Complexities in matchingvoltage and frequency level of both invertedDC sources like PV system, fuel cell, etccontrolled AC sources like wind, hydro, etc.Because, these sources V-I characteristicsdepends on atmospheric condition, whichis varying time to time. Forecasting of thesesources is not accurate.
Coordination: In order to get reliable power,these HES connected to utility grid. Oftenfrequency mismatch arises between bothsystems. Hence it leads instability of theoverall system.
Energy Conversion Technology: Sun is theprimary sources of all energies. It isavailable in many ways like oil, coal, wind,hydel, sunlight. We are generating electricalenergy from these sources directly orindirectly. So far, there is no unique viablemethod is used for conversion andutilization.
Power Quality: Variety of power electronicsconverters are involved in the powerconditioning of hybrid energy systembetween sources to load. These powerconverters generate many harmoniccomponents to the load which cause variousdisturbances to the load/power distributionsystem.
Figure 1

DECEMBER 2009 5
Major research work carried out at NITCCampus:We have developed a hybrid energy system,which is consisting of consisting of biomass,wind, solar photovoltaic (SPV) and battery.Figure 2 shows the proposed hybrid energysystem model. The sources are operated todeliver energy at optimum efficiency. Anoptimization model is developed to supplythe available energy to the loads accordingto the priority. It is also proposed to maintaina fair level of energy storage to meet thepeak load demand together with biomass,wind, solar photovoltaic, during low or nosolar radiation periods or during low windperiods.
MODEL DEVELOPMENTThe objective of the proposed optimization modelis to optimize the availability of energy to the loadsaccording to their levels of priority. It is alsoproposed to maintain a fair level of energy storagein battery to meet peak load demand (together withthe gasifier, wind and PV array), during low or noradiation periods and wind speed is very less. Theloads are classified as primary and deferrable loads.It is desired to minimize, dumped energy, Q
dump
(t). The dumped energy is the excess energy, orenergy which cannot be utilized by the loads.The objective function is to maximize
(1)
Figure 2
with
where,t is hour of a particular day t = 1,2, …24i is load type primary and deferrable loads
(2)
Pi is Demand of load i at time t in KW
Ii (t) is the fraction of time t that the load i is
supplied energy
Load constraints
The energy distribution from the energy sourcesat period t to each load i is given as Where Q
P, Q
w,
QG, Q
B are the energy supplied by the PV, Wind,
Gasifier and Battery respectively.
PV Array constraintsEp(t) is the sum of the energy supplied by the PVarray to the loads and to the battery bank, inhour t,
(3)where, Q
P,i (t) is the energy supplied by PV array to the
loadsQ
P,B (t) is the energy supplied by PV array to the
battery bankQ
P,R (t) is the energy dumped by PV array
Since energy generated by the system varies withinsolation, therefore the available array energyEp(t) at any particular time is given bywhere,
(4)
V is the capacity of PV array
S(t) is the insolation index
Wind energy system constraintsE
W(t) is the sum of the energy supplied by the wind
energy system to the loads and battery bank at hourt,
(5)

6 NIT CALICUT RESEARCH REVIEW
where,Q
w,i(t) is the energy supplied by the wind energy
system
Qw,B
(t) is the energy supplied by the wind energysystem to the battery bank
Qw,R
(t) is the dumped energy by the wind energysystem
Gasifier constraintsE
G(t)
is the sum of the energy supplied by the
gasifier based power generation system to the loadsand battery bank, with a possibility of excesses. Itis desired to run the generator at its Optimumcapacity to ensure longevity and efficiency.
(6)
where,
QG,i
(t) is the energy supplied by the gasifier to theloads
QG,B
(t) is the energy supplied by the gasifier tothe battery bank
QG,R
(t) the dumped energy from the gasifier
Battery bank constraintsThe battery bank serves as an energy source entitywhen discharging and a load when charging. Thenet energy balance to the battery determines it’sstate-of-charge, (SOC)
The state of charge is expressed as follows
(7)
Where QB is the capacity of the battery bank
The battery has to be protected againstovercharging; therefore, the charge level at
(t-1) plus the influx of energy from the PV, windand gasifier at period (t-l), (t) should not exceedthe capacity of the battery.
Mathematically,
(8)
It is also necessary to guard the batteryagainst excessive discharge. Therefore theSOC at any period t should be greater thana specified minimum SOC, SOC
min
(9)Dumped energyFrom the above equations the total dumpedenergy in each hour t as follows
(10)
Maximum power point tracking of PV arrayand wind system are developed in our campus toharvest maximum energy form the source.
Peak power point tracking of pv array:Peak power point tracking of PV array fedinduction motor drive is developed in our campus.This system shown in figure 3 consists of PV array,DC chopper, inverter, microcontroller unit andsingle-phase capacitor run induction motor drive.PV array is providing electricity to the load throughthe power conditioning circuits respectivelychopper and inverter. Microcontroller isincorporated with the proposed system in closedloop operation to generate firing pulses for bothchopper and inverter in order to track peak powerpoint. Dedicated software is developed for thefiring pulse generation in MPLAB platform andtested successfully in PROTEUS software, which
Figure 3
DECEMBER 2009 7
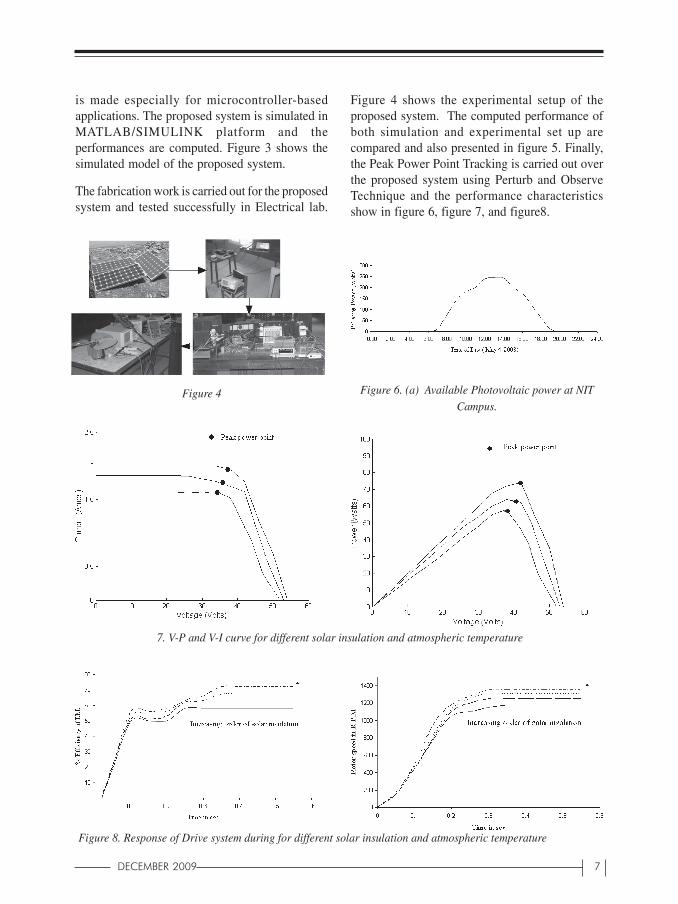
is made especially for microcontroller-basedapplications. The proposed system is simulated inMATLAB/SIMULINK platform and theperformances are computed. Figure 3 shows thesimulated model of the proposed system.
The fabrication work is carried out for the proposedsystem and tested successfully in Electrical lab.
Figure 4 shows the experimental setup of theproposed system. The computed performance ofboth simulation and experimental set up arecompared and also presented in figure 5. Finally,the Peak Power Point Tracking is carried out overthe proposed system using Perturb and ObserveTechnique and the performance characteristicsshow in figure 6, figure 7, and figure8.
Figure 6. (a) Available Photovoltaic power at NIT
Campus.Figure 4
7. V-P and V-I curve for different solar insulation and atmospheric temperature
Figure 8. Response of Drive system during for different solar insulation and atmospheric temperature
8 NIT CALICUT RESEARCH REVIEW
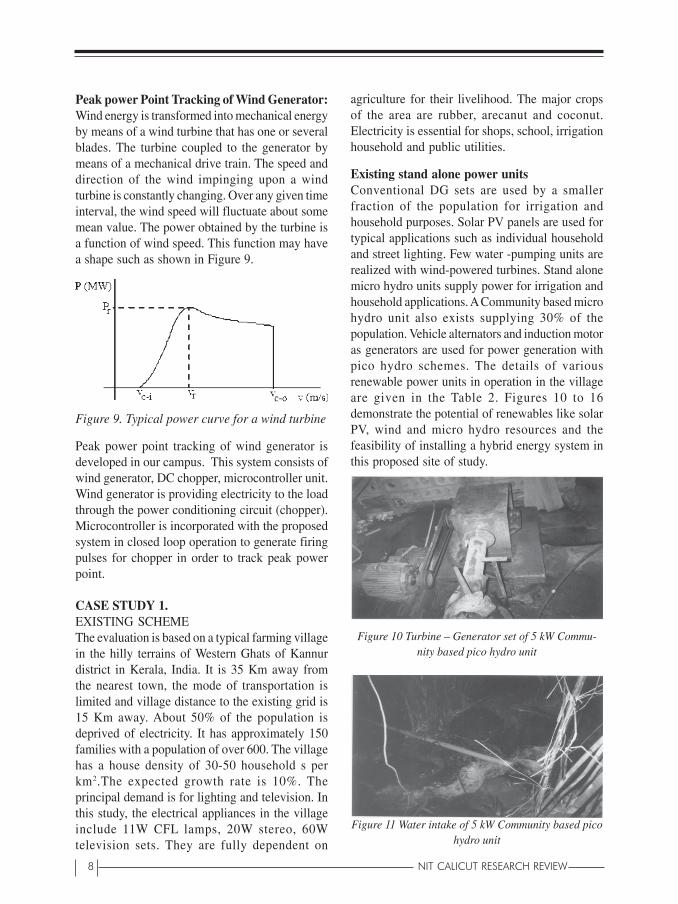
Peak power Point Tracking of Wind Generator:Wind energy is transformed into mechanical energyby means of a wind turbine that has one or severalblades. The turbine coupled to the generator bymeans of a mechanical drive train. The speed anddirection of the wind impinging upon a windturbine is constantly changing. Over any given timeinterval, the wind speed will fluctuate about somemean value. The power obtained by the turbine isa function of wind speed. This function may havea shape such as shown in Figure 9.
Figure 9. Typical power curve for a wind turbine
Peak power point tracking of wind generator isdeveloped in our campus. This system consists ofwind generator, DC chopper, microcontroller unit.Wind generator is providing electricity to the loadthrough the power conditioning circuit (chopper).Microcontroller is incorporated with the proposedsystem in closed loop operation to generate firingpulses for chopper in order to track peak powerpoint.
CASE STUDY 1.EXISTING SCHEMEThe evaluation is based on a typical farming villagein the hilly terrains of Western Ghats of Kannurdistrict in Kerala, India. It is 35 Km away fromthe nearest town, the mode of transportation islimited and village distance to the existing grid is15 Km away. About 50% of the population isdeprived of electricity. It has approximately 150families with a population of over 600. The villagehas a house density of 30-50 household s perkm2.The expected growth rate is 10%. Theprincipal demand is for lighting and television. Inthis study, the electrical appliances in the villageinclude 11W CFL lamps, 20W stereo, 60Wtelevision sets. They are fully dependent on
agriculture for their livelihood. The major cropsof the area are rubber, arecanut and coconut.Electricity is essential for shops, school, irrigationhousehold and public utilities.
Existing stand alone power unitsConventional DG sets are used by a smallerfraction of the population for irrigation andhousehold purposes. Solar PV panels are used fortypical applications such as individual householdand street lighting. Few water -pumping units arerealized with wind-powered turbines. Stand alonemicro hydro units supply power for irrigation andhousehold applications. A Community based microhydro unit also exists supplying 30% of thepopulation. Vehicle alternators and induction motoras generators are used for power generation withpico hydro schemes. The details of variousrenewable power units in operation in the villageare given in the Table 2. Figures 10 to 16demonstrate the potential of renewables like solarPV, wind and micro hydro resources and thefeasibility of installing a hybrid energy system inthis proposed site of study.
Figure 10 Turbine – Generator set of 5 kW Commu-nity based pico hydro unit
Figure 11 Water intake of 5 kW Community based picohydro unit

DECEMBER 2009 9
Figure 12 Control panel of 5 kW Community basedpico hydro unit
Figure 13 A 1 kW Individual owned pico hydro unit inthe Western Ghats of Kannur
Figure 15 A 700W Individual owned pico hydro unitin the Western Ghats of Kannur
Figure 14 Solar panels in a school in Western Ghatsof Kannur, Kerala
Figure 16 Wind powered water pumping unit in theWestern Ghats of Kannur
10 NIT CALICUT RESEARCH REVIEW
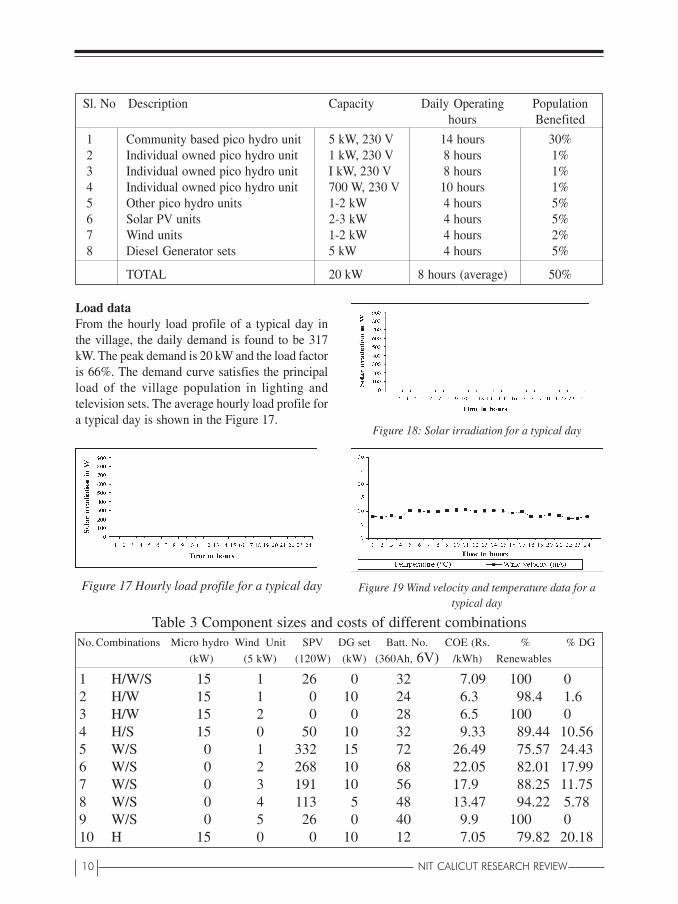
Sl. No Description Capacity Daily Operating Populationhours Benefited
1 Community based pico hydro unit 5 kW, 230 V 14 hours 30%2 Individual owned pico hydro unit 1 kW, 230 V 8 hours 1%3 Individual owned pico hydro unit I kW, 230 V 8 hours 1%4 Individual owned pico hydro unit 700 W, 230 V 10 hours 1%5 Other pico hydro units 1-2 kW 4 hours 5%6 Solar PV units 2-3 kW 4 hours 5%7 Wind units 1-2 kW 4 hours 2%8 Diesel Generator sets 5 kW 4 hours 5%
TOTAL 20 kW 8 hours (average) 50%
Load dataFrom the hourly load profile of a typical day inthe village, the daily demand is found to be 317kW. The peak demand is 20 kW and the load factoris 66%. The demand curve satisfies the principalload of the village population in lighting andtelevision sets. The average hourly load profile fora typical day is shown in the Figure 17.
Figure 17 Hourly load profile for a typical day
Figure 18: Solar irradiation for a typical day
Figure 19 Wind velocity and temperature data for atypical day
Table 3 Component sizes and costs of different combinationsNo. Combinations Micro hydro Wind Unit SPV DG set Batt. No. COE (Rs. % % DG
(kW) (5 kW) (120W) (kW) (360Ah, 6V) /kWh) Renewables
1 H/W/S 15 1 26 0 32 7.09 100 02 H/W 15 1 0 10 24 6.3 98.4 1.63 H/W 15 2 0 0 28 6.5 100 04 H/S 15 0 50 10 32 9.33 89.44 10.565 W/S 0 1 332 15 72 26.49 75.57 24.436 W/S 0 2 268 10 68 22.05 82.01 17.997 W/S 0 3 191 10 56 17.9 88.25 11.758 W/S 0 4 113 5 48 13.47 94.22 5.789 W/S 0 5 26 0 40 9.9 100 010 H 15 0 0 10 12 7.05 79.82 20.18
DECEMBER 2009 11
11 W 0 1 0 20 8 28.9 18.12 81.8812 W 0 2 0 15 8 19.9 37.77 62.2313 W 0 3 0 15 8 13.42 57.45 42.5514 W 0 4 0 15 16 10.15 77.26 22.7415 W 0 5 0 10 32 8.68 97.27 2.7316 W 0 6 0 0 40 9.85 100 017 S 0 0 359 15 76 31.4 76.8 23.2
CASE STUDY 2:A hybrid energy system consists of PV, Wind,Biomass gasifier and Battery bank along with thedeveloped power conditioner is implemented in asite (Vallam, 325km south of Chennai, India).Utility grid supply is already available at the site.This hybrid energy system is implemented toreduce the demand of the utility grid. Table 4 showsthe ratings and parameters of the hybrid energysystem.
TABLE 4: Ratings and Parameters of the HybridEnergy System
PV SystemCapacity 100kW, 400 VSize of PV panel 1341mmX990mm
X36mmNo of panels 556Overall Efficiency 15%
Wind systemCapacity 90kW, 415 VAir density 1.225 kg/m3
Coefficient of performance 0.59Rotor diameter 13 mNumber of Blade 3Working wind speed 3-25 m/sTower height 18 m
Biomass gasifierCapacity 125 kW, 400VMinimum loading 30%
BatteryRating 6 V, 1156 AhMinimum State-of-Charging 40%Minimum charging rate 1A/AhMaximum Charging current 41 AThis site has an average solar radiation of 5.32 kW/ms/day and an average wind speed of 6.48 m/s.
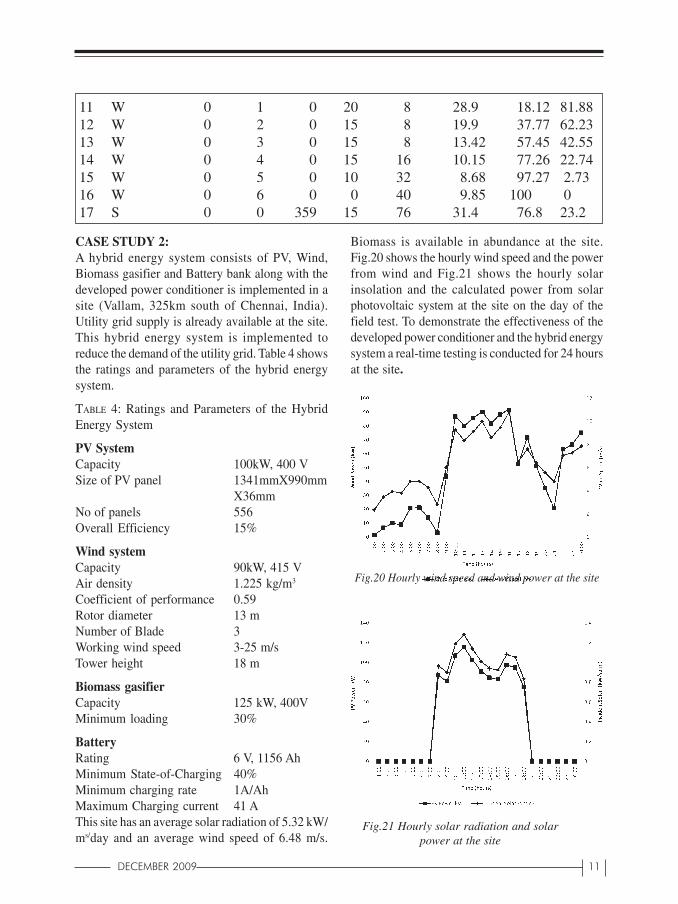
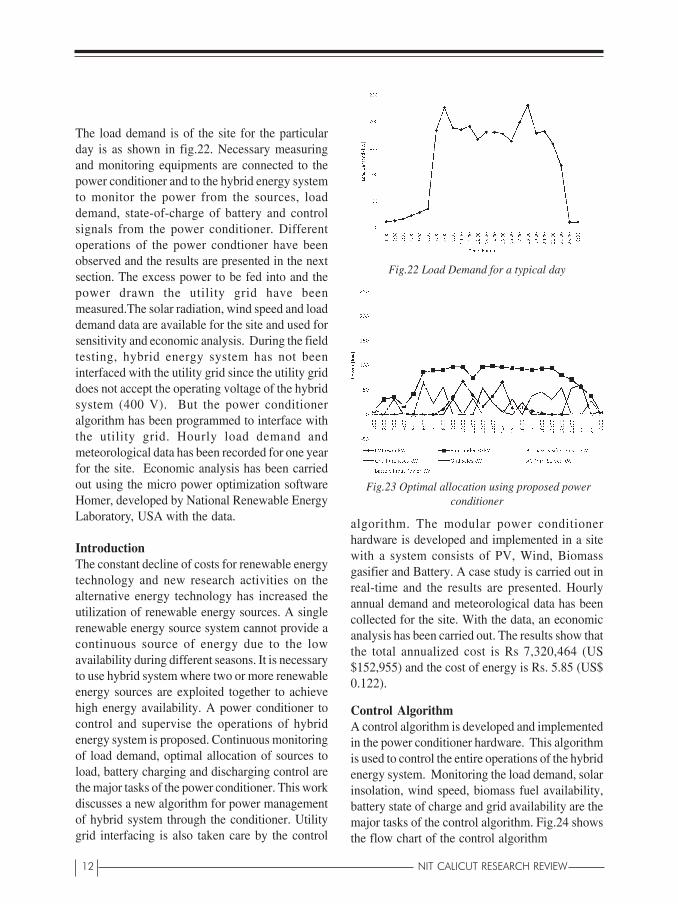
Biomass is available in abundance at the site.Fig.20 shows the hourly wind speed and the powerfrom wind and Fig.21 shows the hourly solarinsolation and the calculated power from solarphotovoltaic system at the site on the day of thefield test. To demonstrate the effectiveness of thedeveloped power conditioner and the hybrid energysystem a real-time testing is conducted for 24 hoursat the site.
Fig.20 Hourly wind speed and wind power at the site
Fig.21 Hourly solar radiation and solarpower at the site
12 NIT CALICUT RESEARCH REVIEW
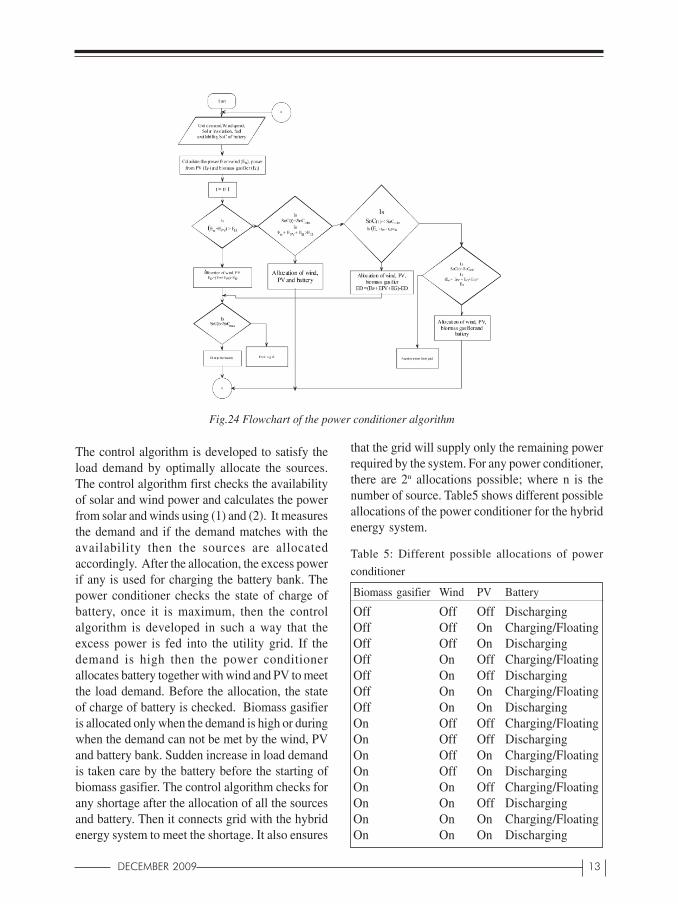
The load demand is of the site for the particularday is as shown in fig.22. Necessary measuringand monitoring equipments are connected to thepower conditioner and to the hybrid energy systemto monitor the power from the sources, loaddemand, state-of-charge of battery and controlsignals from the power conditioner. Differentoperations of the power condtioner have beenobserved and the results are presented in the nextsection. The excess power to be fed into and thepower drawn the utility grid have beenmeasured.The solar radiation, wind speed and loaddemand data are available for the site and used forsensitivity and economic analysis. During the fieldtesting, hybrid energy system has not beeninterfaced with the utility grid since the utility griddoes not accept the operating voltage of the hybridsystem (400 V). But the power conditioneralgorithm has been programmed to interface withthe utility grid. Hourly load demand andmeteorological data has been recorded for one yearfor the site. Economic analysis has been carriedout using the micro power optimization softwareHomer, developed by National Renewable EnergyLaboratory, USA with the data.
IntroductionThe constant decline of costs for renewable energytechnology and new research activities on thealternative energy technology has increased theutilization of renewable energy sources. A singlerenewable energy source system cannot provide acontinuous source of energy due to the lowavailability during different seasons. It is necessaryto use hybrid system where two or more renewableenergy sources are exploited together to achievehigh energy availability. A power conditioner tocontrol and supervise the operations of hybridenergy system is proposed. Continuous monitoringof load demand, optimal allocation of sources toload, battery charging and discharging control arethe major tasks of the power conditioner. This workdiscusses a new algorithm for power managementof hybrid system through the conditioner. Utilitygrid interfacing is also taken care by the control
Fig.22 Load Demand for a typical day
Fig.23 Optimal allocation using proposed powerconditioner
algorithm. The modular power conditionerhardware is developed and implemented in a sitewith a system consists of PV, Wind, Biomassgasifier and Battery. A case study is carried out inreal-time and the results are presented. Hourlyannual demand and meteorological data has beencollected for the site. With the data, an economicanalysis has been carried out. The results show thatthe total annualized cost is Rs 7,320,464 (US$152,955) and the cost of energy is Rs. 5.85 (US$0.122).
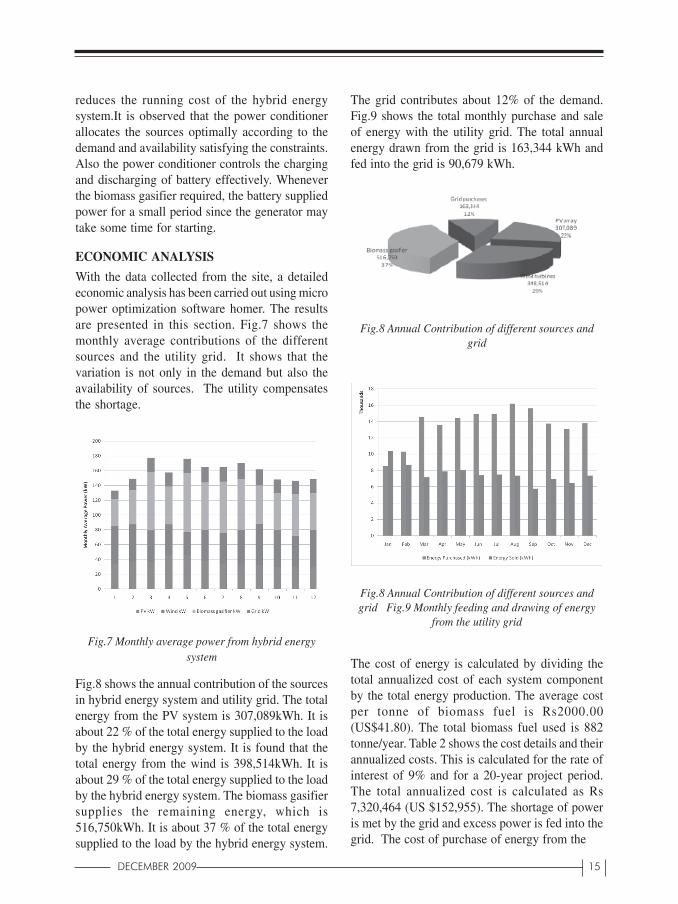
Control AlgorithmA control algorithm is developed and implementedin the power conditioner hardware. This algorithmis used to control the entire operations of the hybridenergy system. Monitoring the load demand, solarinsolation, wind speed, biomass fuel availability,battery state of charge and grid availability are themajor tasks of the control algorithm. Fig.24 showsthe flow chart of the control algorithm
DECEMBER 2009 13
The control algorithm is developed to satisfy theload demand by optimally allocate the sources.The control algorithm first checks the availabilityof solar and wind power and calculates the powerfrom solar and winds using (1) and (2). It measuresthe demand and if the demand matches with theavailability then the sources are allocatedaccordingly. After the allocation, the excess powerif any is used for charging the battery bank. Thepower conditioner checks the state of charge ofbattery, once it is maximum, then the controlalgorithm is developed in such a way that theexcess power is fed into the utility grid. If thedemand is high then the power conditionerallocates battery together with wind and PV to meetthe load demand. Before the allocation, the stateof charge of battery is checked. Biomass gasifieris allocated only when the demand is high or duringwhen the demand can not be met by the wind, PVand battery bank. Sudden increase in load demandis taken care by the battery before the starting ofbiomass gasifier. The control algorithm checks forany shortage after the allocation of all the sourcesand battery. Then it connects grid with the hybridenergy system to meet the shortage. It also ensures
Fig.24 Flowchart of the power conditioner algorithm
that the grid will supply only the remaining powerrequired by the system. For any power conditioner,there are 2n allocations possible; where n is thenumber of source. Table5 shows different possibleallocations of the power conditioner for the hybridenergy system.
Table 5: Different possible allocations of power
conditioner
Biomass gasifier Wind PV Battery
Off Off Off DischargingOff Off On Charging/FloatingOff Off On DischargingOff On Off Charging/FloatingOff On Off DischargingOff On On Charging/FloatingOff On On DischargingOn Off Off Charging/FloatingOn Off Off DischargingOn Off On Charging/FloatingOn Off On DischargingOn On Off Charging/FloatingOn On Off DischargingOn On On Charging/FloatingOn On On Discharging

14 NIT CALICUT RESEARCH REVIEW
Power ConditionerThe power conditioner is developed using twomicrocontrollers. Fig.25 shows the powerconditioner and the different energy sourcesconnected through ac and dc buses. One is tocontrol the operation of the hybrid energy systemand the other is to log the wind speed and solarinsolation data. The power conditioner is designedusing a PIC16F873 microcontroller. The powerconditioner receives the wind speed and solarinsolation data every minute from environmentalmonitoring station. The data acquisition system inthe power conditioner is designed using aPIC18F458 microcontroller with 1GB memory tolog the data. The logged data can be transferred tocomputer system for further analysis. Necessarycircuitry is provided to measure the load demand,state-of-charging of battery.
The power conditioner controls the allocation ofsources through relays by sending the suitablecontrol signals depend on the availability of thesources. The power conditioner measures thebattery bank voltage using voltage divider circuitand current flow from and to the battery usingresistor-shunt circuitry to find the state of chargeof battery. The relays are operated by themicrocontroller through appropriate control signalsto the relay driver circuits. In the proposedhardware there are 4 such relays to control theoperation of the wind, PV, biomass gasifier andbattery apart from the grid interfacing. The ultimateaim of the power conditioner design is to utilizethe renewable energy sources to the maximumextent. However, during the shortage of powerafter allocating all the sources including batterybank, and during excess power after the demandis met and state of charge of battery bank is full,the power conditioner will interface the hybridenergy system with the utility grid to draw or feedpower.
RESULTS AND DISCUSSION
From the real-time test conducted, variousfunctions of the power conditioner were tested witha hybrid energy system. Fig.6 shows the allocationof sources under different conditions by the powerconditioner.Fig.6 shows how the demand is met
Fig.25 Schematic of the proposed powerconditioner
by the hybrid energy system (PV, Wind andbiomass gasifier). It shows that how the sourceswere allocated according to the load demand andavailability. The entire operations of the powerconditioner can be seen from fig.6. It shows thatthe power from PV is fully utilized to supply theload demand as well as charging the battery duringday times. The charging and discharging of thebattery bank is also shown. It was observed thatthe power conditioner utilized the battery bankeffectively. Power conditioner switches thebatteries into charging mode whenever excesspower available from the sources. It was indischarging mode, whenever there was a shortageof power from sources.
From fig.6, it is found that the maximum demandof 204.79kW occurs at 11:00 am is met by all theenergy sources along with the battery bank. Duringthat time excess power is available from the hybridenergy system and can be fed in to the grid. It ismentioned in the fig.6. The power conditionerturns off the biomass gasifier when the loaddemand can be met together by the PV, wind andbattery bank. For example on the typical day, at16:00 hours the load demand is only 161.41kW,the power conditioner allocates PV, wind andbattery bank to supply the energy to the loadwithout allocating the biomass gasifier. Theremaining power is taken from the grid. Duringthe day of the real-time site test, the powerconditioner allocated the biomass gasifier only for8 hours. The demand was met by the renewableenergy sources (PV + wind) along with the batterybank and from grid in the remaining periods. It
DECEMBER 2009 15
reduces the running cost of the hybrid energysystem.It is observed that the power conditionerallocates the sources optimally according to thedemand and availability satisfying the constraints.Also the power conditioner controls the chargingand discharging of battery effectively. Wheneverthe biomass gasifier required, the battery suppliedpower for a small period since the generator maytake some time for starting.
ECONOMIC ANALYSIS
With the data collected from the site, a detailedeconomic analysis has been carried out using micropower optimization software homer. The resultsare presented in this section. Fig.7 shows themonthly average contributions of the differentsources and the utility grid. It shows that thevariation is not only in the demand but also theavailability of sources. The utility compensatesthe shortage.
Fig.7 Monthly average power from hybrid energysystem
Fig.8 shows the annual contribution of the sourcesin hybrid energy system and utility grid. The totalenergy from the PV system is 307,089kWh. It isabout 22 % of the total energy supplied to the loadby the hybrid energy system. It is found that thetotal energy from the wind is 398,514kWh. It isabout 29 % of the total energy supplied to the loadby the hybrid energy system. The biomass gasifiersupplies the remaining energy, which is516,750kWh. It is about 37 % of the total energysupplied to the load by the hybrid energy system.
The grid contributes about 12% of the demand.Fig.9 shows the total monthly purchase and saleof energy with the utility grid. The total annualenergy drawn from the grid is 163,344 kWh andfed into the grid is 90,679 kWh.
Fig.8 Annual Contribution of different sources andgrid Fig.9 Monthly feeding and drawing of energy
from the utility grid
Fig.8 Annual Contribution of different sources andgrid
The cost of energy is calculated by dividing thetotal annualized cost of each system componentby the total energy production. The average costper tonne of biomass fuel is Rs2000.00(US$41.80). The total biomass fuel used is 882tonne/year. Table 2 shows the cost details and theirannualized costs. This is calculated for the rate ofinterest of 9% and for a 20-year project period.The total annualized cost is calculated as Rs7,320,464 (US $152,955). The shortage of poweris met by the grid and excess power is fed into thegrid. The cost of purchase of energy from the
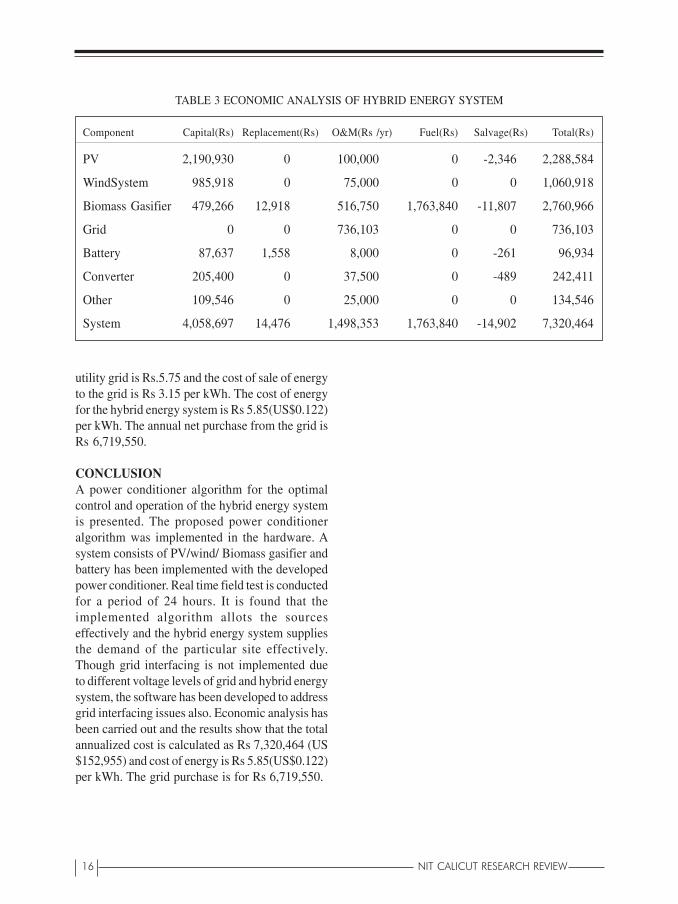
16 NIT CALICUT RESEARCH REVIEW
TABLE 3 ECONOMIC ANALYSIS OF HYBRID ENERGY SYSTEM
Component Capital(Rs) Replacement(Rs) O&M(Rs /yr) Fuel(Rs) Salvage(Rs) Total(Rs)
PV 2,190,930 0 100,000 0 -2,346 2,288,584
WindSystem 985,918 0 75,000 0 0 1,060,918
Biomass Gasifier 479,266 12,918 516,750 1,763,840 -11,807 2,760,966
Grid 0 0 736,103 0 0 736,103
Battery 87,637 1,558 8,000 0 -261 96,934
Converter 205,400 0 37,500 0 -489 242,411
Other 109,546 0 25,000 0 0 134,546
System 4,058,697 14,476 1,498,353 1,763,840 -14,902 7,320,464
utility grid is Rs.5.75 and the cost of sale of energyto the grid is Rs 3.15 per kWh. The cost of energyfor the hybrid energy system is Rs 5.85(US$0.122)per kWh. The annual net purchase from the grid isRs 6,719,550.
CONCLUSIONA power conditioner algorithm for the optimalcontrol and operation of the hybrid energy systemis presented. The proposed power conditioneralgorithm was implemented in the hardware. Asystem consists of PV/wind/ Biomass gasifier andbattery has been implemented with the developedpower conditioner. Real time field test is conductedfor a period of 24 hours. It is found that theimplemented algorithm allots the sourceseffectively and the hybrid energy system suppliesthe demand of the particular site effectively.Though grid interfacing is not implemented dueto different voltage levels of grid and hybrid energysystem, the software has been developed to addressgrid interfacing issues also. Economic analysis hasbeen carried out and the results show that the totalannualized cost is calculated as Rs 7,320,464 (US$152,955) and cost of energy is Rs 5.85(US$0.122)per kWh. The grid purchase is for Rs 6,719,550.
DECEMBER 2009 17
1 IntroductionFuzzy graphs were introduced by A.Rosenfeld [5]in 1975, ten years after Zadeh’slandmark paper “Fuzzy Sets” [9] in 1965. Fuzzy graph theory is nowfinding
numerous applications in modern science andtechnology especially in the fields of informationtheory, neural networks, expert systems, clusteranalysis, medical diagnosis, control theory, etc.Fuzzy modeling is an essential tool in all branchesof science, engineering and medicine. Fuzzymodels give more precision, flexibility andcompatibility to the system when compared to theclassic models . Rosenfeld has obtained the fuzzyanalogues of several basic graph-theoretic conceptslike bridges, paths, cycles, trees and connectednessand established some of their properties [5].
2 PreliminariesA fuzzy graph(f-graph) [5] is a pair G : (σ, ì) whereσ is a fuzzy subset of a set S and ì is a fuzzyrelation on σ. We assume that S is finite andnonempty, ì is reflexive and symmetric [5]. In allthe examples σ is chosen suitably. Also, we denotethe underlying graph by G * : (σ*, ì*_) where σ* ={u ∈S : σ(u) > 0} and ì * = {(u, v)_S×S : ì(u, v) >0}. A fuzzy graph H : (τ, υ) is called a partial fuzzysubgraph of G : (σ, ì) if τ (u) ≤ σ(u) for every uand υ (u, v) ≤ ì(u, v) for every u and v [4]. Inparticular we call a partial fuzzy sub graph H : (τ,υ) a fuzzy subgraph of G : (σ, ì ) if τ (u) = σ(u)for every u in τ * and υ (u, v) = ì(u, v) for everyarc (u, v) in υ*. Now a fuzzy sub graph H : (τ, υ)spans the fuzzy graph G : (σ, ì) if τ = σ. A
connected f-graph G : (σ, ì) is a fuzzy tree(f-tree)if it has a fuzzy spanning subgraph F : (σ, υ), whichis a tree, where for all arcs (x, y) not in F thereexists a path from x to y in F whose strength ismore than ì(x, y) [5]. Note that here F is a treewhich contains all nodes of G and hence is aspanning tree of G. Also note that F is the uniquemaximum spanning tree(MST) of G [7]. A path Pof length n is a sequence of distinct nodes u0, u1,.......un such that ì(ui”1, ui) > 0, i = 1, 2, ......, nand the degree of membership of a weakest arc isdefined as its strength. If u
0 = un and n≥ 3, then P
is called a cycle and a cycle P is called a fuzzycycle(f-cycle) if it contains more than one weakestarc [4]. The strength of connectedness between twonodes x and y is defined as the maximum of thestrengths of all paths between x and y and isdenoted by
CONNG(x, y). An x “ y path P is called a strongestx “ y path if its strength equals CONNG(x, y) [5].An f-graph G : (σ, ì) is connected if for every x,yin σ* , CONNG(x, y) > 0. Through out this, weassume that G is connected. An arc of a f-graph iscalled strong if its weight is at least as great as theconnectedness of its end nodes when it is deletedand an x”y path P is called a strong path if Pcontains only strong arcs [1]. An arc is called an f-bridge of G if its removal reduces the strength ofconnectedness between some pair of nodes in G[5]. Similarly an f-cutnode w is a node in G whoseremoval from G reduces the strength ofconnectedness between some pair of nodes otherthan w. A complete fuzzy graph (CFG) is an f-graph
Types of arcs
in a fuzzy graphSunil Mathew* & M.S.Sunitha**
* Research Scholar, Department of Mathematics. e-mail: [email protected]** Assistant Professor, Department of Mathematics. e-mail: [email protected]
DECEMBER 2009 17

18 NIT CALICUT RESEARCH REVIEW
G : (σ, ì) such that ì(x, y) = σ(x) ∧σ(y) for all xand y.
3 Types of arcs in a fuzzy graphDepending on the CONNG(x, y) of an arc (x, y) ina fuzzy graph G we define the following threedifferent types of arcs. Note that CONNG”(x,y)(x,y) is the strength of connectedness between x andy in the fuzzy graph obtained from G by deletingthe arc (x, y).
Definition 1: An arc (x, y) in G is called α - strongif ì(x, y) > CONNG”(x,y)(x, y)
Definition 2: An arc (x, y) in G is called β - strongif ì(x, y) = CONNG”(x,y)(x, y).
Definition 3: An arc (x, y) in G is called a δ - arc ifì(x, y) < CONNG”(x,y)(x, y).
Remark 1: A strong arc is either α- strong or β -strong by definition 1 and definition 2 respectively.
Definition 4: A δ - arc (x, y) is called a δ* - arc ifì(x, y) > ì(u, v) where (u, v) is a weakest arc of G.
Definition 5: A path in an f-graph G : (σ, ì) iscalled an α-strong path if all its arcs are
α - strong and is called a β - strong path if all itsarcs are β - strong.
Example 1 : Let G : (σ, ì) be with σ* = {u, v,w, x}and ì(u, v) = 0.2 = ì(x, u), ì(v,w) = 1 = ì(w, x),ì ( v, x) = 0.3. Here, (v,w) and (w, x) are α-strongarcs, (u, v) and (x, u) are β- strong arcs and (v, x)is a -arc. Also (v, x) is a δ* - arc since ì(v, x) > ì(u,v), where (u, v) is a weakest arc of G. Here P1 :x,w, v is an α- strong x “ v path whereas P2 : x, u,v is a β - strong x “ v path.
Note that in an f-graph G, the types of arcs cannotbe determined by simply examining the arcweights; for, the membership value of a δ-arc canexceed membership values of α -strong and β-strong arcs. Also membership value of a β- strongarc can exceed that of an α - strong arc as can beseen from the following examples.
(a) Membership value of δ - arc exceedsmembership value of β - strong arc.
In Example 1, ì(v, x) = 0.3 > 0.2 = ì(u, v). Here,(v, x) is a δ- arc whereas (u, v) is
β - strong.
(b) Membership value of δ - arc exceedsmembership value of α - strong arc.
Example 2 : Let G : (σ, ì) be with σ*= {u, v,w, x}and ì(u, v) = 1 = ì (v,w), ì(u,w) = 0.4, ì(w, x) =0.3, ì(x, u) = 0.1. Here, (u, v), (v,w) and (w, x) areα-strong arcs,whereas (u,w) and (x, u) are δ-arcswith ì(u,w) = 0.4 > 0.3 = ì (w, x).
(c) Membership value of β -strong arc exceedsmembership value of α - strong arc.
Example 3 : Let G : (σ, ì) be with σ* = {u, v,w, x}and ì(u, v) = ì(u,w) = ì (v,w) = 1, ì(w, x) = 0.5,ì(x, u) = 0.1. Here, (u, v),(v,w), (u,w) are β - strongarcs, whereas (w, x) is α - strong and (x, u) is a δ-arc with ì(u,w) = ì(u, v) = ì ( v,w) = 1 > 0.5 = ì(w,x).
4 Types of arcs in a strongest pathNow we shall discuss the types of arcs of astrongest path in G.
Remark 2: A strongest path may contain all typesof arcs.
In example 1, the strength of the path P : u, v, x,wis 0.2, which is a strongest path from u to w and itcontains all types of arcs, namely (u, v) is β -strong, (x,w) is α - strong and (v, x) is a δ-arc.
Remark 3: As per Remark 1, a strong path containsonly α-strong and β- strong arcs but no δ - arcs.
Remark 4: In a graph G, each path is strong as wellas strongest . But in a fuzzy graph a strongest pathneed not be a strong path and a strong path neednot be a strongest path. In example 1, P1 : u, v,x,w is a strongest u”w path, but not a strong u “ wpath. Note that P2 : u, v,w and P3 : u, x,w are strongu “ w paths.
Now, P4 : v, u, x is a strong v “ x path which is nota strongest v “ x path and P5 : v,w, x is the strongestv “ x path.
Remark 5: A strongest path without δ-arcs is a
18 NIT CALICUT RESEARCH REVIEW

DECEMBER 2009 19
strong path; for, it contains only α-strong and β-strong arcs .
Proposition 1: A strong path P from x to y is astrongest x “ y path in the following cases.
(i) If P contains only α - strong arcs.
(ii) If P is the unique strong x “ y path.
(iii) If all x “ y paths in G are of equal strength.
Proof:
(i) Let G : (σ, ì) be an f-graph. Let P be a strongx”y path in G containing only α - strong arcs. Ifpossible suppose that P is not a strongest x”y path.Let Q be a strongest x “ y path in G. Then P ∩ Qwill contain at least one cycle C in which everyarc of C “ P will have strength greater than strengthof P. Thus a weakest arc of C is an arc of P and let(u, v) be such an arc of C. Let C’ be the u “ v pathin C, not containing the arc (u, v). Then,
ì(u, v) ≤ strength of C’ ≤ CONNG”(u,v)(u, v),
which implies that (u, v) is not α - strong, acontradiction. Thus P is a strongest x “ y path.
(ii) Let G : (σ, ì) be an f- graph. Let P be the uniquestrong x”y path in G. If possible suppose that P isnot a strongest x “ y path . Let Q be a strongest x “y path in G. Then, strength of Q > strength of P. ie;for every arc (u, v) in Q, ì(u, v) > ì(x’, y’) where(x’, y’) is a weakest arc of P.
Claim: Q is a strong x “ y path.
For; otherwise, if there exists an arc (u, v) in Qwhich is a δ - arc, then
ì(u, v) < CONNG”(u,v)(u, v) ≤ CONNG(u, v)
and hence ì(u, v) < CONNG(u, v).
Then there exists a path from u to v in G whosestrength is greater than ì(u, v). Let it be P|. let wbe the last node after u, common to Q and P|in theu “ w sub path of P|and w| be the first node beforev, common to Q and P| in the w’ “ v sub path of P|.(If P|and Q are disjoint u “ v paths then w = u andw| = v). Then the path P| | consisting of the x “ wpath of Q, w “ w| path of P|, and w|” y path of Q is
an x “ y path in G such that Strength of P| | >Strength of Q, contradiction to the assumption thatQ is a strongest x “ y path
in G. Thus (u, v) cannot be a c - arc and hence Q isa strong x “ y path in G. Thus we have anotherstrong path from x to y, other than P, which is acontradiction to the assumption that P is the uniquestrong x “ y path in G. Hence P should be a strongestx “ y path in G.
(iii) If every path from x to y have the samestrength, then each such path is strongest x”y path.In particular a strong x”y path is a strongest x”ypath.
We observe that if all arcs of an f-graph G are β -strong, as in graphs without bridges, then eachstrongest path is a strong path but the converseneed not be true. For; consider the f-graph G : (σ,ì) with σ* = {u, v,w, x, y} and ì(u, v) = ì(v,w) =ì (w, x) = ì(x, u) = 0.2, ì(u, y) = ì(y,w) = 0.1.Here all arcs are β - strong and u, y,w is a strong u“ w path but it is not a strongest u “ w path.
References1. K. R. Bhutani, A Rosenfeld, Strong arcs in fuzzy
graphs, Information sciences 152 (2003) 319-322.
2. K. R. Bhutani,A Rosenfeld, Fuzzy end nodesin fuzzy graphs, Information sciences 152(2003) 323-326.
3. K. R. Bhutani,A.Battou,On M-strong fuzzygraphs, Information Sciences1-2 (2003) 103-109.
4. J.N. Mordeson, P.S. Nair, Fuzzy Graphs andFuzzy Hypergraphs, Physica -Verlag, 2000.
5. A. Rosenfeld, Fuzzy graphs, In: Zadeh. L.A.,Fu, K.S., Shimura M (Eds). Fuzzy sets and theirApplications to Cognitive and DecisionProcesses, Academic Press, New York 1975, 77-95.
6. Sameena K,M.S.Sunitha,Strong arcs andmaximum spanning trees in fuzzy graphs,International Journal of Mathematical Sciences5(2006) 17-20.
DECEMBER 2009 19

20 NIT CALICUT RESEARCH REVIEW
7. M. S. Sunitha, A. Vijayakumar, Acharacterization of fuzzy trees, InformationSciences 113 (1999) 293-300.
8. Sunil Mathew , M. S. Sunitha, Types of arcs ina fuzzy graph, Information Sciences 179(2009) 1760 – 1768.
9. L.A.Zadeh, Fuzzy sets,Information and Control8(1965) 338-353.

DECEMBER 2009 21
AbstractEight Steel Fibre Reinforced Self CompactingConcrete (SFRSCC) rectangular wall panels,hinged at top and bottom with free vertical edges,were tested and properties evaluated. The panelswere subjected to uniformly distributed loadapplied at a small eccentricity of t/6 to reflectpossible eccentric load in practice. The variablesconsidered were 4 different values of SlendernessRatio (SR) viz. 12, 15, 21 and 30 and 4 differentvalues of Aspect Ratio (AR) viz. 0.75, 1.07, 1.5and 1.875. The thickness of wall panels was keptconstant. The vertical and horizontal reinforcementwas kept constant at 0.88% and 0.74% respectively.The crack patterns of the specimens, failure modesand load-deformation characteristics are reported.The ultimate strength of SFRSCC wall panelsdecrease non-linearly with the increase in SR anddecrease linearly with the increase in AR.
KeywordsAspect ratio, slenderness ratio, self compactingconcrete, steel fibres, wall panels
IntroductionOver the years, Reinforced Concrete (RC) wallshave gained greater acceptance as load bearingstructural members and RC wall construction hasbecome increasingly popular world wide. The trendtowards RC core walls in high rise buildings is thereason for this popularity in the usage of RC wallsand it acts as an integral component in the corewall system of tall buildings. Also they can appear
* Professor, Department of Civil Engineering** Research Scholar, Department of Civil Engineering
as integral components in box frames, foldedplates, box girders, etc
Recently Self Compacting Concrete (SCC) hasgained much attention in the concrete industry andis being used in many applications successfullythroughout the world1. The increased flowabilityof SCC can ease the constructability requirementsof pre-cast elements for which the important aspectof the design is the ability to place and consolidateconcrete within the form and around the internalreinforcing2. With the increased flowability ofSCC, it is possible to produce thin concrete wallswith minimum reinforcement consisting of smallerdiameter reinforcing bars. This leads to reductionin the cost of the building as well as increase inthe usable space of the building.
The investigations on the strength and behaviourof SFRSCC wall panels are not yet reported. Hencea large scale experimental investigation wasrecently carried out to study the strength andbehaviour of SFRSCC wall panels at the NationalInstitute of Technology Calicut.
Experimental ProgrammeThe experimental program consists of casting andtesting of 8 wall panels under compression. Table.1gives the details of over all dimensions, SR andAR of wall panels. The thickness of the wall panelswas kept constant. For casting the specimens, theformwork was fabricated using Indian Standard(IS) equal angles of 40mm×40mm×6mm.
Steel fiber reinforced SCC
wall panels in
one-way in-plane actionN. Ganesan*, P.V. Indira* and S. Rajendra Prasad**
22 NIT CALICUT RESEARCH REVIEW
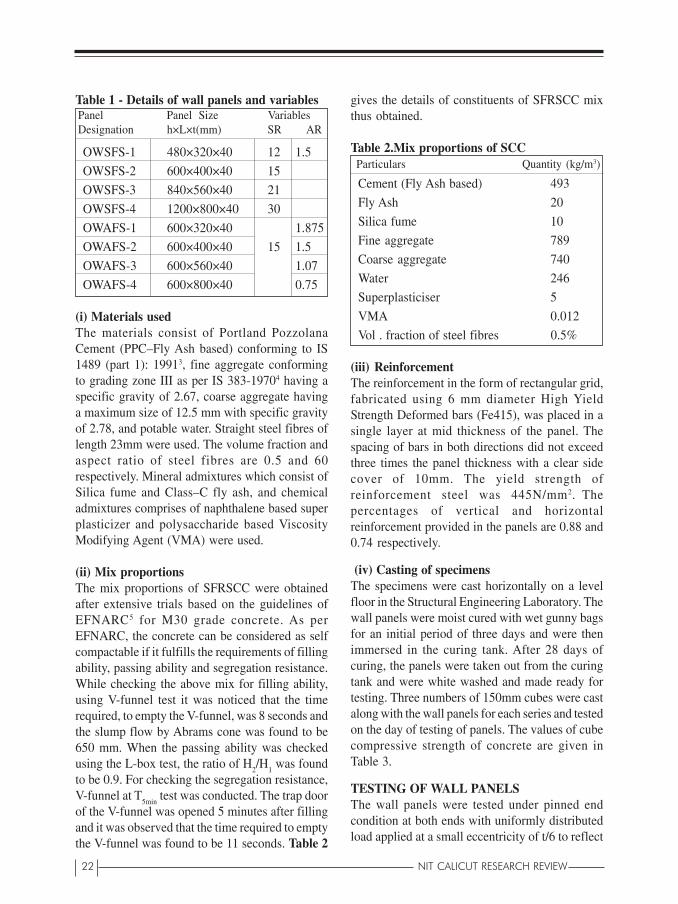
Table 1 - Details of wall panels and variablesPanel Panel Size VariablesDesignation h×L×t(mm) SR AR
OWSFS-1 480×320×40 12 1.5
OWSFS-2 600×400×40 15
OWSFS-3 840×560×40 21
OWSFS-4 1200×800×40 30
OWAFS-1 600×320×40 1.875
OWAFS-2 600×400×40 15 1.5
OWAFS-3 600×560×40 1.07
OWAFS-4 600×800×40 0.75
(i) Materials usedThe materials consist of Portland PozzolanaCement (PPC–Fly Ash based) conforming to IS1489 (part 1): 19913, fine aggregate conformingto grading zone III as per IS 383-19704 having aspecific gravity of 2.67, coarse aggregate havinga maximum size of 12.5 mm with specific gravityof 2.78, and potable water. Straight steel fibres oflength 23mm were used. The volume fraction andaspect ratio of steel fibres are 0.5 and 60respectively. Mineral admixtures which consist ofSilica fume and Class–C fly ash, and chemicaladmixtures comprises of naphthalene based superplasticizer and polysaccharide based ViscosityModifying Agent (VMA) were used.
(ii) Mix proportionsThe mix proportions of SFRSCC were obtainedafter extensive trials based on the guidelines ofEFNARC5 for M30 grade concrete. As perEFNARC, the concrete can be considered as selfcompactable if it fulfills the requirements of fillingability, passing ability and segregation resistance.While checking the above mix for filling ability,using V-funnel test it was noticed that the timerequired, to empty the V-funnel, was 8 seconds andthe slump flow by Abrams cone was found to be650 mm. When the passing ability was checkedusing the L-box test, the ratio of H
2/H
1 was found
to be 0.9. For checking the segregation resistance,V-funnel at T
5min test was conducted. The trap door
of the V-funnel was opened 5 minutes after fillingand it was observed that the time required to emptythe V-funnel was found to be 11 seconds. Table 2
gives the details of constituents of SFRSCC mixthus obtained.
Table 2.Mix proportions of SCCParticulars Quantity (kg/m3)
Cement (Fly Ash based) 493
Fly Ash 20
Silica fume 10
Fine aggregate 789
Coarse aggregate 740
Water 246
Superplasticiser 5
VMA 0.012
Vol . fraction of steel fibres 0.5%
(iii) ReinforcementThe reinforcement in the form of rectangular grid,fabricated using 6 mm diameter High YieldStrength Deformed bars (Fe415), was placed in asingle layer at mid thickness of the panel. Thespacing of bars in both directions did not exceedthree times the panel thickness with a clear sidecover of 10mm. The yield strength ofreinforcement steel was 445N/mm2. Thepercentages of vertical and horizontalreinforcement provided in the panels are 0.88 and0.74 respectively.
(iv) Casting of specimensThe specimens were cast horizontally on a levelfloor in the Structural Engineering Laboratory. Thewall panels were moist cured with wet gunny bagsfor an initial period of three days and were thenimmersed in the curing tank. After 28 days ofcuring, the panels were taken out from the curingtank and were white washed and made ready fortesting. Three numbers of 150mm cubes were castalong with the wall panels for each series and testedon the day of testing of panels. The values of cubecompressive strength of concrete are given inTable 3.
TESTING OF WALL PANELSThe wall panels were tested under pinned endcondition at both ends with uniformly distributedload applied at a small eccentricity of t/6 to reflect

DECEMBER 2009 23
possible eccentric load in practice, as carried outby other investigators6,7. All specimens were testedin the vertical position in a Compression TestingMachine of 2,943 kN (300tons) capacity. A levelingruler was used to ensure the proper leveling of thepanels. Plumb-bob was used to ensure verticalityof the panels. Fig.1 shows the details of test setup. The loading was gradually increased in stagesup to failure. At each stage, lateral deformationsat quarter and mid height points along the centralvertical line of the panel were measured usingLVDTs. The experimental ultimate loads (P
ue) were
recorded and are given in Table 3. Also thenormalized values of ultimate loads obtained bydividing the ultimate load by f
c×Lt called axial
strength ratio of panels are also given in Table 3.
Table 3.Experimentalultimate Loads
Panel fcu
Experimental (Pue
)
designation (N/mm2) ultimate load Fc Lt
(Pue
) (kN)
OWSFS-1 264.87 0.61
OWSFS -2 323.73 0.59
OWSFS -3 441.45 0.58
OWSFS -4 42.73 412.02 0.38
OWAFS-1 215.82 0.49
OWAFS -2 274.68 0.50
OWAFS -3 392.40 0.51
OWAFS -4 711.23 0.65
Fig.2 Test set-up
RESULTS AND DISCUSSION
(i) Crack patterns and failure modeThe crack patterns observed on both the tensionand the compression faces of the panels indicatedthe following; (i) the specimen OWSFS-1 failedby crushing near the edge, (ii) the panel OWSFS-2 failed by bending at mid height by formingcentral horizontal cracks on tension side andcrushing on compression side. (iii) The wall panelsOWSFS-3 and OWSFS-4 failed by bending withmultiple narrow width cracks at mid height. In thecase of wall panel having SR equals to 12, it wasfound that the wall tend to crush before the yieldingof the reinforcement. The failure patterns of SFRCwall panels of OWAFS series are similar to thoseof OWSFS series. The specimens, OWAFS-1 andOWAFS-2 failed due to bending at mid height. Thewall panel OWAFS-3 failed by bending withmultiple narrow width cracks. This kind of failurepatterns may be due to the improvement in thetensile strain carrying capacity of the compositein the neighbourhood of steel fibres, which arrestmicro cracks and enhance the ductility . Howeverthe failure pattern of OWSFS–4 is different fromthe wall panels having AR more than 0.75 and thispanel failed by crushing near the edges. Fig.3shows typical crack patterns of tested specimens.
Fig.3 Typical crack pattern of tested specimen
24 NIT CALICUT RESEARCH REVIEW
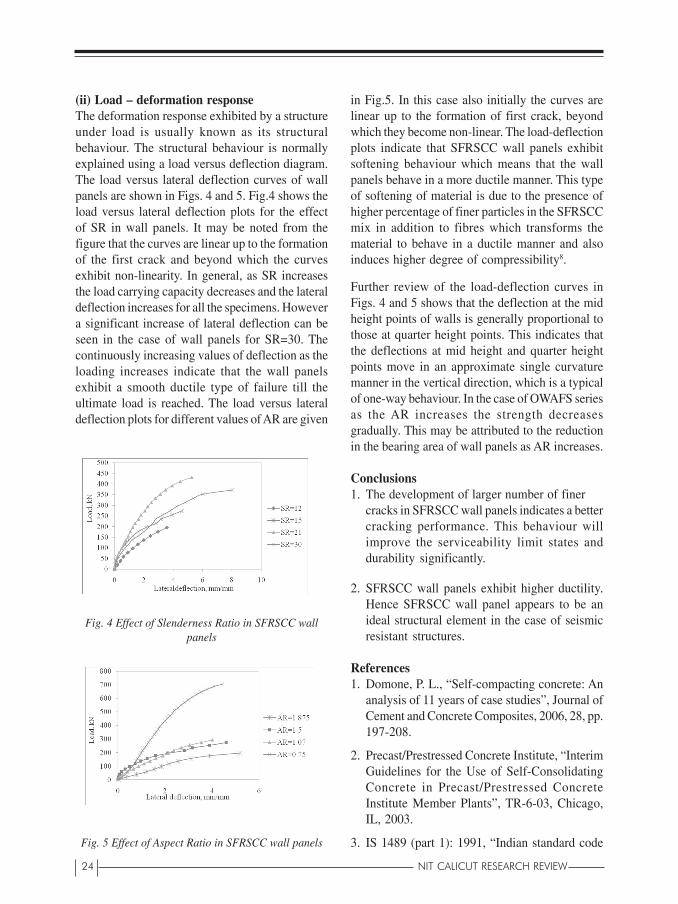
(ii) Load – deformation responseThe deformation response exhibited by a structureunder load is usually known as its structuralbehaviour. The structural behaviour is normallyexplained using a load versus deflection diagram.The load versus lateral deflection curves of wallpanels are shown in Figs. 4 and 5. Fig.4 shows theload versus lateral deflection plots for the effectof SR in wall panels. It may be noted from thefigure that the curves are linear up to the formationof the first crack and beyond which the curvesexhibit non-linearity. In general, as SR increasesthe load carrying capacity decreases and the lateraldeflection increases for all the specimens. Howevera significant increase of lateral deflection can beseen in the case of wall panels for SR=30. Thecontinuously increasing values of deflection as theloading increases indicate that the wall panelsexhibit a smooth ductile type of failure till theultimate load is reached. The load versus lateraldeflection plots for different values of AR are given
Fig. 4 Effect of Slenderness Ratio in SFRSCC wallpanels
Fig. 5 Effect of Aspect Ratio in SFRSCC wall panels
in Fig.5. In this case also initially the curves arelinear up to the formation of first crack, beyondwhich they become non-linear. The load-deflectionplots indicate that SFRSCC wall panels exhibitsoftening behaviour which means that the wallpanels behave in a more ductile manner. This typeof softening of material is due to the presence ofhigher percentage of finer particles in the SFRSCCmix in addition to fibres which transforms thematerial to behave in a ductile manner and alsoinduces higher degree of compressibility8.
Further review of the load-deflection curves inFigs. 4 and 5 shows that the deflection at the midheight points of walls is generally proportional tothose at quarter height points. This indicates thatthe deflections at mid height and quarter heightpoints move in an approximate single curvaturemanner in the vertical direction, which is a typicalof one-way behaviour. In the case of OWAFS seriesas the AR increases the strength decreasesgradually. This may be attributed to the reductionin the bearing area of wall panels as AR increases.
Conclusions1. The development of larger number of finer
cracks in SFRSCC wall panels indicates a bettercracking performance. This behaviour willimprove the serviceability limit states anddurability significantly.
2. SFRSCC wall panels exhibit higher ductility.Hence SFRSCC wall panel appears to be anideal structural element in the case of seismicresistant structures.
References1. Domone, P. L., “Self-compacting concrete: An
analysis of 11 years of case studies”, Journal ofCement and Concrete Composites, 2006, 28, pp.197-208.
2. Precast/Prestressed Concrete Institute, “InterimGuidelines for the Use of Self-ConsolidatingConcrete in Precast/Prestressed ConcreteInstitute Member Plants”, TR-6-03, Chicago,IL, 2003.
3. IS 1489 (part 1): 1991, “Indian standard code

DECEMBER 2009 25
of practice for Portland-Pozzolana Cement-Specification, (Fly Ash based)”, Bureau ofIndian Standards, New Delhi, 1991.
4. IS 383: (1970), “Indian standard code ofpractice for specification for coarse and fineaggregate from natural sources for concrete”,Bureau of Indian Standards, New Delhi, 1970.
5. EFNARC, “Specifications and guidelines forself compacting concrete”. European Federationof National Trade Associations, Surrey, UK,Feb. 2002.
6. Pillai, S. U., and Parthasarathy, C. V., “Ultimatestrength and design of concrete walls”, Buildingand Environment, 1977, Vol.12, pp. 25-29.
7. Saheb, S. M., and Desayi, P., “Ultimate strengthof RC wall panels in one-way in-plane action”,Journal of structural Engineering, ASCE,October 1989, 115 (10), pp. 2617-2630.
8. Ganesan, N., and Ramana Murthy, J. V.,“Strength and Behaviour of Confined steel FibreReinforced Concrete Columns”, ACI MaterialsJournal, American Concrete Institute, No.3,May-June 1990, pp. 221-227.
26 NIT CALICUT RESEARCH REVIEW
AbstractAlgae, bacteria and fungi and yeasts have provedto be potential metal biosorbents. Chitin is poly â-(1’!4)-2-acetamido-2-deoxy-D- glucopyranosefound in cell wall of certain fungi, bacteria, algae& yeast. By alkaline deacetylation of chitin,chitosan is produced. Chitosan is poly â-(1’!4)-2-amino-2-deoxy-D-glucopyranose. Chitosan is awell-known biosorpent of metal ions. Among themany other low cost absorbents, chitosan has thehighest sorption capacity for several metal ions.Chitosan chelates five to six times greater amountsof metals than chitin. Heavy metals of concerninclude copper, chromium, mercury, uranium,cadmium. Heavy metal pollution has become aserious threat today and of great environmentconcern as they are non biodegradable and thuspersistent. Bioaccumulation for the removal ofheavy metal ions may provide an attractivealternative to physico-chemical methods as theconventional techniques presently in existence forremoval of heavy metals from contaminated waterhave disadvantage like incomplete removal, highenergy and reagent requirements.
IntroductionBiosorption is a property of certain types ofinactive, dead, microbial biomass to bind andconcentrate heavy metals from even very diluteaqueous solutions. Biomass exhibits this property,acting just as a chemical substance, as an ionexchanger of biological origin. It is particularlythe cell wall structure of certain algae, fungi andbacteria which was found responsible for this
Bioaccumulation
of heavy metal ions-A Review
S. Bhuvaneshwari*, K. Suguna** and V. Sivasubramanian***
phenomenon. Opposite to biosorption ismetabolically driven active bioaccumulation byliving cells. That is an altogether differentphenomenon requiring a different approach for itsexploration
Biotechnology has been investigated as analternative method for treating the metal-containing wastewater of low concentrations. Inresponse to heavy metals, microorganisms haveevolved various measures via processes such astransport across the cell membrane, biosorption tocell walls and entrapment in extracellular capsules,precipitation, complexation and oxidation-reduction reactions. It has been proved that theyare capable of adsorbing heavy metals fromaqueous solutions, especially for the metalconcentration below 50 mg/L.
The utilization of microbial biomass, either aliveor dead, for the removal of metals from industrialwastewater and polluted waters has already beenrecognized 1.Chitosan is one such an organicmaterial found rarely in living organisms butabundant in the cell wall of certain fungi, bacteria,algae & yeast. The chitin of fungi possessesprincipally the same structure as the chitinoccurring in other organisms. However, not allfungi contain chitin; variations in the amount ofchitin may depend on physiological parameter innatural environment as well as on the fermentationconditions in biotechnology processing or inculture of fungi. The interest in the potentialutilization of fungal chitosan as a biosorbent is
* Lecturer, Department of ** Research Scholar, Department of Chemical Engg.*** Assistant Professor, Department of Chemical Engg., NIT Calicut.e-mail: [email protected]
DECEMBER 2009 27
increasing due to the need for economical andefficient adsorbents to remove heavy metal ionsfrom wastewater. This is attributed to the freeamino groups exposed in chitosan because ofdeacetylation of chitin 2.
Determination of physico-chemical propertiesThe viscosity, average molecular weight ofchitosan is calculated by the equation by Mark–Houwink–Sakurada that relates the intrinsicviscosity to the polymer’s molecular weight. Sizeexclusion chromatography, Gel permeationchromatography has been applied to study themolecular weight of polymers 3, Detectors are alsoused to determine the molecular weight of chitin.The deacetylation degree of chitosan wasdetermined by the potentiometric titration methods4. Chitosan was dissolved in a known excess ofhydrochloric acid. From the titration of thissolution with a 0.1 M sodium hydroxide solution,a curve with two inflexion points was obtained.The difference between the volumes of these twoinflexion points corresponded to the acidconsumption for the salification of amine groupsand permitted the determination of chitosan’sacetylation degree, through equation%NH
2 = 16.1 (V
2 - V
1) x M
b/W
where (V1) and (V
2) are the base volumes referred
to first and second inflexion points, respectively,in mL, (M
b) is the base molarity in g/mol, and (W)
is the original weight of the polymer in g. Theoptimum condition for the deacetylation reactionfor molecular weight was observed at a temperatureof 130 °C and in 90 min, and corresponded to amolecular weight of chitosan of about 150 kDa,and a deacetylation degree of 90% 5.
BiosorptionBiosorbents are prepared by pretreating thebiomass with different methods. Biomass can bepretreated with several ways; they are heattreatment, detergent washing, employing acids,alkalis & enzymes etc 6. Metabolism independenton adsorption of pollutants on microbial biomassbased on the partition process. Biosorption overconventional treatment methods include manyadvantages 7 some are metal recovery, regenerationof biosorpents etc.
Chitosan was the polysaccharide with best capacityfor copper biosorption (75%) 8. Chitin presentedthe maximum iron uptake 9, Metal biosorption willbe better in single metal system The Algae,Distigma proteus, isolated from industrial wastewater remove 48% Cd2+ after 2 days, 90% after 8days.75% Cr removal by Aspergillus niger wasdetermined by diphenyl carbazide colorimetricassay & atomic absorption spectrophotometer10.
Factors affecting biosorptionIn the biosorption process, The influence of severaloperational parameters such as dose of adsorbent,agitation speed, temperature, initial pH and contacttime gets accounted, pH seems to be the mostimportant parameter it affects the solutionchemistry of the metals, the activity of thefunctional groups in the biomass and thecompetition of metallic ions 11 .In the range of 20-35 0C , temperature wont influence the biosorptionperformances12.The metal adsorption by chitin andchitosan in aqueous solution was directlyinfluenced by the metal concentration.
Biosorption using biomassRhizopus arrhizus biomass obtained 54% recoveryof uranium. Cd & Cu sorption by Microcystisaeruginosa, showed 22 & 61% of metal recovery.Dry mycelia of Saccaromyces cerevisae andPseudomonas aeruginosa for pb2+ recovery andshowed about 30% & 50%. These results are lowerthan those obtained for chitin and chitosanextracted from C. elegans (IFM 46109), suggestingthat this microorganism has a biotechnologicalpotential as source for polysaccharides productionand metal bioremediation of contaminated water.Best results found for chitin were iron recovery of56% and for chitosan, Cu recovery 75%, those arereported by mycelia of zygomycetes, biosorptionof Cu(II) reached a maximal capacity of 39.84mgCu(II)/g dry cell weight of Thiobacillusthiooxidans at pH 5.0. One of the best metal-sorbing biomass types is ubiquitous Sargassumseaweed 13. Ni and Cd are adsorbed by dried cellsof E. agglomerans SM 38 and found that atoptimum pH their removal reached 25.2% and32%, respectively. While for B. subtilis WD 90their removal exhibited 27% and 25%,respectively.
28 NIT CALICUT RESEARCH REVIEW
Immobilization of BiomassBiomass immobilization has various applications.The principal techniques that are available inliterature for the application of biosorption arebased on adsorption on inert supports, onentrapment in polymeric matrix, on covalent bondsin vector compounds, or on cell cross-linking.Immobilization will offers easy & convenientusage compared to free biomass which is easilybiodegradable and has better shelf life 14.Entrapments in polymeric matrix (eg) polymersused were alginate and polyacrylamide. Adsorptionon inert supports (eg) activated carbon was usedas a support for Enterobacter aerogens biofilm 15.Support materials are introduced prior tosterilization and inoculation with starter culture andare left inside the continuous culture for a periodof time, after which a film of microorganisms isapparent on the support surfaces. Theimmobilization of Rhizopus arrhizus fungalbiomass in reticulated foam biomass supportparticles. Rhizopus nigricans are immobilized onpolyurethane foam cubes and coconut fibres.
Chitosan preparation, membrane formulationand applicationsMany of the methods reported for converting chitinin crustacean shell to chitosan are slow andconsume significant amounts of reagents. Arelatively rapid and mild deacetylation method isfollowed now to convert chitin to chitosan 16.Chitosan membranes were produced from asolution of chitosan in formic acid 17 present anapplication of chitosan membranes for removal ofheavy metal ions.The Macroporous Chitosanmembranes were prepared according to the methoddescribed by Zeng and Ruckenstein. The porousmembrane is a very important configuration forthe use as biomedical materials 18.Chitosan hasvarious applications, it is used in waste watertreatment, to stabilize food and oil pills, as bacterialimmobilizer, effective to improve the quality ofpaper, both in wet end addition and in sizingoperation, plays main role in agriculture andhorticulture, especially on orchid cultivation 19.Biomedical application-as beads for controlleddrug release, chitosan-alginte beads have beenproven to resist the pH and pepsin concentration
in the human stomach 20, chitosan has anaccelerating effect on the regeneration of bonetissue 21.
ConclusionRapid industrialization and progressiveurbanization are highly responsible foraccumulation of metal ions in the environment. Theassessment of the metal-binding capacity of sometypes of biomass has gained momentum since1985. Indeed, some biomass types are veryeffective in accumulating heavy metals.Availability is a major factor to be taken intoaccount to select biomass for clean-up purposes.Optimization of specific biosorption processapplications has to be done in conjunction withindustrial users and requires specific processengineering expertise and a serious developmentalcommitment for effective outcome.
AcknowledgementThe authors are grateful to the Department ofscience and technology, Ministry of science andTechnology, Government of india, New Delhi, fortheir financial support (Project No : SR/FTP/CS-68/2007).
References1. B. Volesky, and Z.R. Holan, Biosorption of
heavy metals. Biotechnology Progress, vol.11, no. 3, p 235-250, 1995.
2. M. Beran, L. Adamek, P. Hanak, and P.Molik, Isolation and Some applications ofFungal Chitin- Glucan Complex andChitosan.
3. P .Pochanavanaich, and W. Suntornsuk,Fungal Chitosan production and itscharacterization. Letters in appliedmicrobiology, vol. 35, p 17-21, 2002.
4. Marco Antonio Torres, Marisa MasumiBeppu, Eduardo Jose Arruda, Viscous andviscoelastic properties of chitosan solutionsand gels. Brazilian Journal of FoodTechnology, vol.9, no.2,p 101-108, 2006.
5. Kalaivani Nadarajah, Dawn Carmel Paul,Abdul Jalil Abdul Kader, Effects of alkalineand acid treatment to the yield and quality

DECEMBER 2009 29
of chitosan extracted from Absidia sp.Journal of Salwa Technology, vol.44,p 33-42, 2006.
6. R.Suleman Qaiser , Anwar Saleemi,Muhammad Mahmood Ahmad, Heavy metaluptake by agro based waste materials.Electronic Journal of Biotechnology, vol.10,no. 3,p 409-416, 2007.
7. Hima Karnika Alluri, Srinivasa ReddyRonda, Vijaya Saradhi Settalluri, JayakumarSingh.Bondili, Suryanarayana.V andVenkateshwar. P, BIOSORPTION: An Eco-friendly alternative for Heavy Metalremoval. African journal of Biotechnology,vol.6,no.25, pp. 2924-2931, 2007.
8. J. L., Zhou, and R. J .Kiff , The uptake ofcopper from aqueous solution byimmobilized fungal biomass. Journal ofChemical Technology and Biotechnology,vol. 52 ,p 317-330, 1991.
9. A. Meyer and F.M .Wallis, The use ofAspergillus niger (strain 4) biomass for leaduptake from aqueous systems, Water SA ,vol.23 no. 2, 1997.
10. R Schmuhl. HM Krieg and K Keizer,Adsorption of Cu(II) and Cr(VI) ions bychitosan: Kinetics and equilibrium. vol.27,p1-6
11. K.Anand Kishore, M.Praveen Kumar,V.Ravi Krishna and G. Venkat Reddy,Optimization of process variables of citricacid production using Aspergillus niger in abatch fermentor. vol.16,p 16-20, 2008.
12. Iqbal Ahmad, Shaheen Zafar; Farah Ahmad,Heavy Metal Biosorption potential ofAspergillus and Rhizopus sp. isolated fromwaste water treated soil, Journal of Appl.Sci.Environ. Mgt. vol. 9,no. 1, p 123-126, 2005.
13. B.Bina, M.Kermani,H.Movahedian andZ.Khazaei, Biosorption and recovery ofcopper and zinc from aqueous solution bynon living biomass of marine brown algaeof sargassum,Pakistan Journal of Biologicalscience, vol.9,no.8,2006.
14. Ranifaryal, Maria yusuf, Kiran munir,Faheem Tahi and Abdul hameed,Enhancement of Cr6+ removal by Aspergillusniger rh19 using a biofermentor.vol.39,no.5,p 1873-1881, 2007.
15. K.Nadarajah, J. Kader, Mohd. Mazmira andD.C.Paul, Production of chitosan by fungi.Pakistan Journal of Biological Sciences,vol.4,no.3, p 263-265, 2001.
16. Yuzhu Fu and T Viraraghavan, Columnstudies for biosorption of dyes from aqueoussolutions on immobilized Aspergillus nigerfungal biomass. Water SA, vol. 29, no.4,2003.
17. Trang Si Trung, Wah Wah Thein- Han,Nguyen Thi Qui, Chuen- How Ng, WillemF. Stevens, Functional characteristics ofshrimp chitosan and its membranes asaffected by the degree of Deacetylation.Bioresource Technology , vol.97, p 659-663,2006.
18. Z.Y.Gu,P.h.Xue and W.J.Li, Preaparation ofthe porous chitosan membrane by cryogenicinduced phase separation, Polymers foradvanced technologies.
19. R.W.Coughlin, M.R.Deshaies, andE.M.Davis, Preparation of chitosan forheavy metal removal. EnvironmentalProgress, vol. 9,no. 35, 1990.
20. Rosa Valeria da Silva Amorim, Wanderleyde Souza, Kazutaka Fukushima, Galba Mariade Campos-Takaki, Faster chitosanproduction by Mucoralean straines insubmerged culture. Brazilian Journal ofMicrobiology, vol.32,p 20-23, 2001.
21 W.Kaminski, Z .Modrzejewska,Applicationof chitosan membranes in separation ofheavy metal ions. Separation Science andTechnology, vol.32,no.16, p 2659-2668,1997

30 NIT CALICUT RESEARCH REVIEW
* Graduate student, Department of Mechanical Engineering** Assistant Professor, Department of Mechanical Engineering. e-mail: [email protected]
1. IntroductionThe demand fluctuation is a major concern for theindustries. Some industry faces seasonal demandpattern. Normal way of managing this demandpattern includes varying workforce size, buildinginventory, subcontracting and varying workforceutilization. All these methods have its owndisadvantages. For example, varying the workforceutilization leads to idle time in slow periods andcostly overtime in hectic periods. Annualisingworking hours is another method to face seasonaldemand and this method is increasingly popularin Europe and in the UK in particular.Annualisation is a variation in the arrangement ofhours where staff work to an annualised contractedhours rather than weekly or monthly number ofhours. The working hours vary with the demandpattern. During busy periods they may have towork more and on the other hand in slack periodsthey will work less. The hours, which the employeehas to execute, will be decided in advance and itcan vary daily, weekly, or monthly basis. Thus,annualised hours (AH) allows employer to varyworkforce availability according to the demandlevel without incurring much overtime/hiring/training/ subcontracting costs.
The AH application gives positive results. Thisinclude reduced inventory cost, decreased unit cost,less labour turnover and training, easierrecruitment, and better customer service. Thus, theoverall expense of the firm is reduced. AH methodhas already been successfully implemented in
Planning
Annualised HoursM.R. Sureshkumar * and V. Madhusudanan Pillai**
many manufacturing organizations whereemployers are often faced with busy and slackperiods. However, the scheme has beenimplemented mainly in the service type industrialsector.
The pattern for the introduction of collectively-agreed AH schemes is that the basic parametersare laid down in sectored agreements, with theirconcrete implementation referred to agreement atcompany or workplace level, between managementand local trade unions. Under the influence oflegislation, collective agreements at sector andcompany level is very common for AH schemes[1].
The major advantage of annualising working hoursis the reduced cost, reduction in the use oftemporary workers and overtime in comparison toother options. A reduction in the use of temporaryworkers can also lead to an improvement inproductivity and the quality of the product orservice. Rhodia Consumer Specialities [2]introduced the annualised hours for staffscheduling and the benefits were that the consumercomplaints fell by 25% and the service standard isimproved substantially. The results from the Tesco[3] distribution showed that after the introductionof the AH system the stock levels have reduced toa large extent.
2. Problem DescriptionIn an AH problem the number of workers is takenon the basis of total annual demand.
DECEMBER 2009 31
The manpower requirement is calculated as givenbelow.Assume 52 weeks in a year.Average working hours in a week = 35 hoursTotal annual forecasted demand = 16100 hoursTotal number of holiday weeks in a year peremployee = 6Total number of working weeks = 52 - 6 = 46Manpower required = 16100/ (46×35) = 10 Nos.
The workers are assumed to be cross trained andthey are able to perform different types of task butwith different relative efficiency. A relativeefficiency is considered for each type of taskperformed by each category. A value of 0.8signifies that a worker in a given category needsto work 1/0.8 hours to meet a demand that a workerwith a relative efficiency equal to 1 would meet in1 hour. The duties to be performed by an employeeare predetermined and there are a specified numberof worker categories, for instance 3. Since thepossibilities of overtime or hiring temporaryworkers are not considered, a capacity shortage ispossible during certain weeks as a result of therelative efficiency considered for different typesof tasks. However, shortages will be a smallpercentage of the required capacity in AHapplications compared to other methods of workerassignment.
3. Objective functionThe success of an organisation lies in the fact thatat what level their customers are satisfied. As theservice level improves, the customer satisfactionincreases. The capacity of the organization is fixedas per the forecasted demand. If the requiredcapacity is more than the actual capacity then theservice level deteriorates and the customer will notbe satisfied. If the relative capacity shortage, whichis defined as the capacity shortage related to therequired capacity, is large then the demand cannotbe met. On the other hand, if the capacity shortageis a small part of the required capacity then theworkers can meet the demand with a small extraeffort. That is, the demand will be met with slightlyreduced service quality.
The maximum relative capacity shortage, whichhas to be minimised, can be considered as the
objective function, thus optimising the servicelevel. This function avoids large capacity shortagesand tends to distribute capacity over the course ofthe year in a regular way. This function minimisesthe maximum capacity shortage, however, it is notgiving consideration to periods where capacityshortages less than the maximum relative capacityshortage. For obtaining a small capacity shortagein every week, a secondary objective function,which is the sum of relative capacity shortages, isconsidered. Now the objective function is definedas weighted the sum of these two functions. Thatis, the objective function minimises the weightedsum of two terms: (i) the maximum relativecapacity shortage and (ii) the sum of weeklyrelative capacity shortages. The objective functiondescribed here is same as that of Corominas et. al[4].
4. Models for annualised hoursThe following different models can be consideredin the annualised scenario.
i. Holiday weeks are partially individualised -Mixed Integer Linear Programming (MILP)Model.
In this type, a part of the holiday weeks areindividualised, which means that a certain numberof holiday weeks is fixed as per the agreement andthe remaining holiday weeks are assigned on thebasis of the demand requirement. Workers are notallowed to take individualised holiday weeks atthe same time [5]. For example, if total number ofholiday weeks is six and out of these two weeksare individualised and when should be theremaining four holiday weeks are determined bythe model. This type of assignment of holidayweeks reduces the shortages compared tocompletely individualised holiday weeks.
ii. Holiday periods are individualised – MILPModelInstead of holiday weeks the periods in whichholiday weeks can be availed are individualisedThat is, the assignment may be like two weeks inwinter and four weeks in summer. The holidayweeks which lie in these periods are determinedby the model.

32 NIT CALICUT RESEARCH REVIEW
iii.When spike in demand exist – MILP ModelThis model can be used when there is spike indemand in some particular weeks. This happensin festival seasons.
iv. Variable working weeks - LinearProgramming (LP) Model
In the previous models weekly working hours foran employee may belong to a finite set. But, inthis model the weekly working hours areconsidered to be variable and will vary from workerto worker subjected to an upper bound for theweekly working hours. However, the total annualworking hours will be same for all employees.
4.1 General characteristics of MILP modeli. The weekly working hours are taken from a
finite set. For example, a set can contain 25,35, and 50 weekly working hours.
ii. The total number of holiday weeks is fixedpreviously.
iii.Overtime is not allowed.
iv. Hiring of temporary workers is not allowed.
v. The average working hours for a group of 12consecutive weeks cannot be larger than44 hours per week.
vi. All the workers cannot take the holiday weeksat the same time.
In all the above models the objective is to minimisethe weighted sum of maximum relative capacityshortage and sum of weekly capacity shortagesconsidering the relevant constraints.
4.2 General characteristics of LP modeli. The weekly working hours will vary for
different workers subjected to an upper bound,for example 50 hours.
ii. The total number of individualised holidayweeks is as agreed previously through contract.
The characteristics of MILP model from iii to viare applicable here also.
4.3 General model descriptionObjective function
Minimises the weighted sum of: (i) the maximumrelative capacity shortage and (ii) the sum ofweekly relative capacity shortages,
Constraints:1. Considers the effect of maximum relative
capacity shortage;
2. Assigns the required number of hours for eachworker as stipulated in the contract;
3. Ensures the assigned hours, consideringefficiency and capacity shortage in hours, isgreater than or equal to the required hours asper the forecast;
4. Equalise the time allotted for all types of taskin a week for a category of workers with thetime assigned for the category of workers forthe same week;
5. Ensures the contractual condition that theaverage time assigned over a consecutive 12weeks is less than 44 hours;
6. Shows the non-negativity condition for thevariables.
5. Implication of AH.A problem for illustration is modelled with a staffstrength of five and number of working weeks of46 and six holiday weeks. The workers are groupedin three categories and considered three types oftask. Each category of workers has differentefficiency for doing different types of task. Therelative efficiency of categories of workers forperforming tasks is given in Table 1.
Table 1. Relative efficiency
Task1 Task2 Task3Category 1 1 0.9 0.8Category 2 0 1 0.9Category 3 0 0 1
The annualised hours problem can be formulatedas MILP model or as LP model. Here, a comparisonis made with respect to the capacity shortages underthese models. In literature the planning annualisedhour is carried out with a finite set of weeklyworking hours [4]. AH models with finite set of
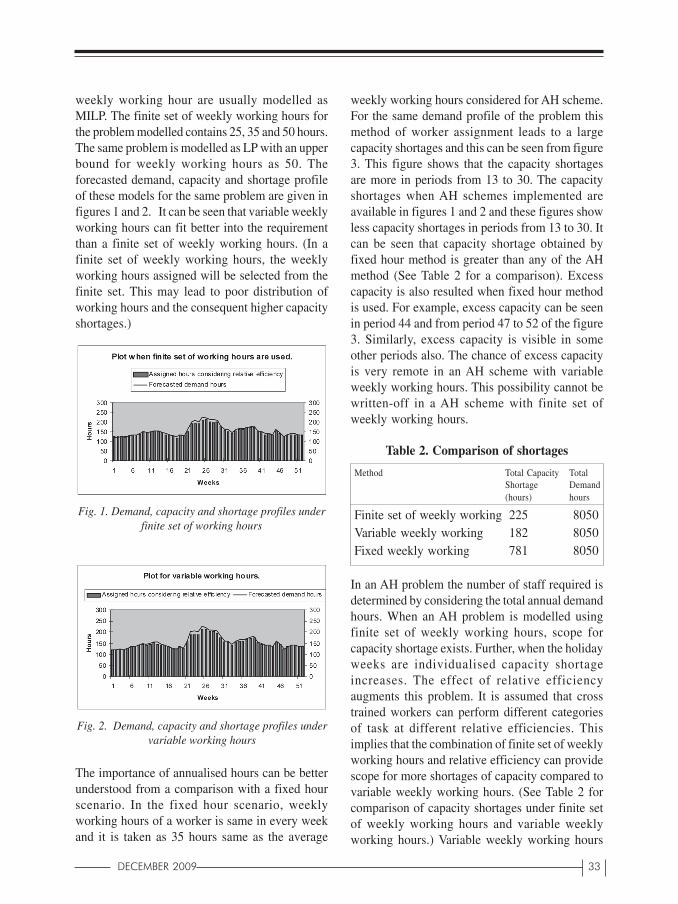
DECEMBER 2009 33
weekly working hour are usually modelled asMILP. The finite set of weekly working hours forthe problem modelled contains 25, 35 and 50 hours.The same problem is modelled as LP with an upperbound for weekly working hours as 50. Theforecasted demand, capacity and shortage profileof these models for the same problem are given infigures 1 and 2. It can be seen that variable weeklyworking hours can fit better into the requirementthan a finite set of weekly working hours. (In afinite set of weekly working hours, the weeklyworking hours assigned will be selected from thefinite set. This may lead to poor distribution ofworking hours and the consequent higher capacityshortages.)
Fig. 1. Demand, capacity and shortage profiles underfinite set of working hours
The importance of annualised hours can be betterunderstood from a comparison with a fixed hourscenario. In the fixed hour scenario, weeklyworking hours of a worker is same in every weekand it is taken as 35 hours same as the average
Fig. 2. Demand, capacity and shortage profiles undervariable working hours
weekly working hours considered for AH scheme.For the same demand profile of the problem thismethod of worker assignment leads to a largecapacity shortages and this can be seen from figure3. This figure shows that the capacity shortagesare more in periods from 13 to 30. The capacityshortages when AH schemes implemented areavailable in figures 1 and 2 and these figures showless capacity shortages in periods from 13 to 30. Itcan be seen that capacity shortage obtained byfixed hour method is greater than any of the AHmethod (See Table 2 for a comparison). Excesscapacity is also resulted when fixed hour methodis used. For example, excess capacity can be seenin period 44 and from period 47 to 52 of the figure3. Similarly, excess capacity is visible in someother periods also. The chance of excess capacityis very remote in an AH scheme with variableweekly working hours. This possibility cannot bewritten-off in a AH scheme with finite set ofweekly working hours.
Table 2. Comparison of shortages
Method Total Capacity TotalShortage Demand(hours) hours
Finite set of weekly working 225 8050Variable weekly working 182 8050Fixed weekly working 781 8050
In an AH problem the number of staff required isdetermined by considering the total annual demandhours. When an AH problem is modelled usingfinite set of weekly working hours, scope forcapacity shortage exists. Further, when the holidayweeks are individualised capacity shortageincreases. The effect of relative efficiencyaugments this problem. It is assumed that crosstrained workers can perform different categoriesof task at different relative efficiencies. Thisimplies that the combination of finite set of weeklyworking hours and relative efficiency can providescope for more shortages of capacity compared tovariable weekly working hours. (See Table 2 forcomparison of capacity shortages under finite setof weekly working hours and variable weeklyworking hours.) Variable weekly working hours
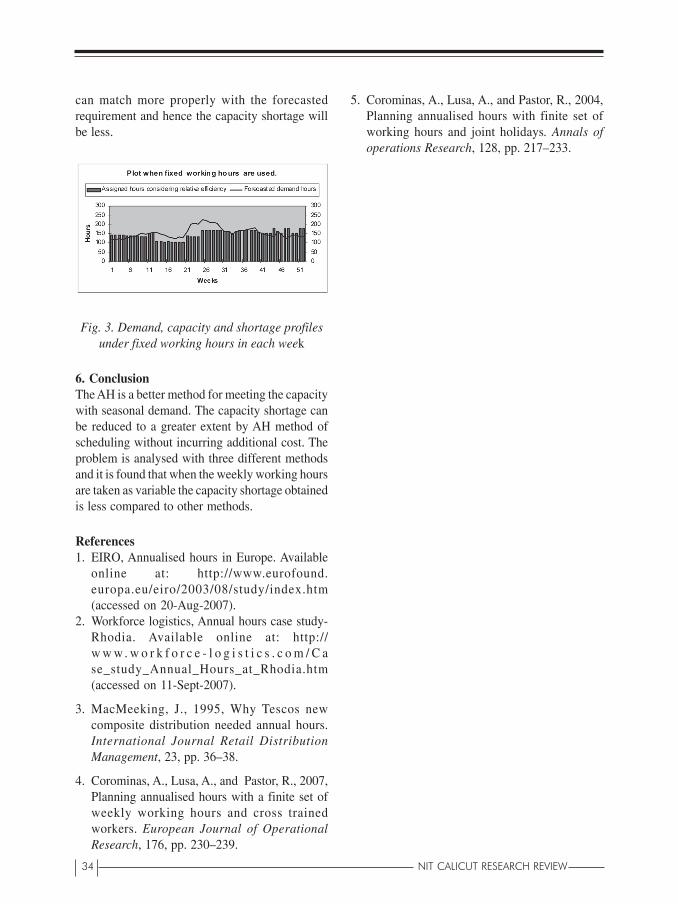
34 NIT CALICUT RESEARCH REVIEW
can match more properly with the forecastedrequirement and hence the capacity shortage willbe less.
Fig. 3. Demand, capacity and shortage profilesunder fixed working hours in each week
6. ConclusionThe AH is a better method for meeting the capacitywith seasonal demand. The capacity shortage canbe reduced to a greater extent by AH method ofscheduling without incurring additional cost. Theproblem is analysed with three different methodsand it is found that when the weekly working hoursare taken as variable the capacity shortage obtainedis less compared to other methods.
References1. EIRO, Annualised hours in Europe. Available
online at: http://www.eurofound.europa.eu/eiro/2003/08/study/index.htm(accessed on 20-Aug-2007).
2. Workforce logistics, Annual hours case study-Rhodia. Available online at: http://w w w . w o r k f o r c e - l o g i s t i c s . c o m / C ase_study_Annual_Hours_at_Rhodia.htm(accessed on 11-Sept-2007).
3. MacMeeking, J., 1995, Why Tescos newcomposite distribution needed annual hours.International Journal Retail DistributionManagement, 23, pp. 36–38.
4. Corominas, A., Lusa, A., and Pastor, R., 2007,Planning annualised hours with a finite set ofweekly working hours and cross trainedworkers. European Journal of OperationalResearch, 176, pp. 230–239.
5. Corominas, A., Lusa, A., and Pastor, R., 2004,Planning annualised hours with finite set ofworking hours and joint holidays. Annals ofoperations Research, 128, pp. 217–233.
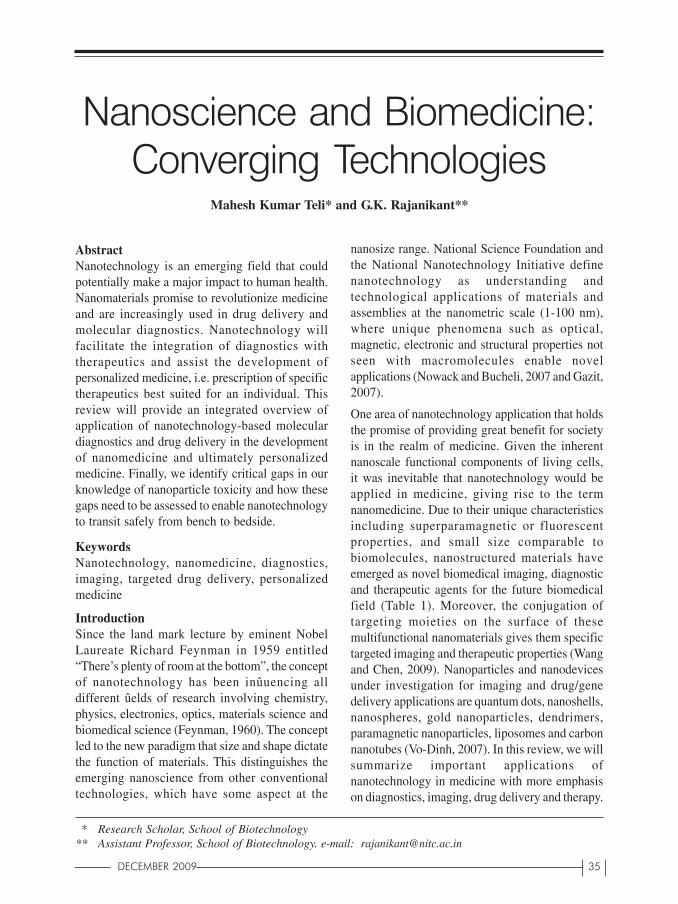
DECEMBER 2009 35
Nanoscience and Biomedicine:
Converging TechnologiesMahesh Kumar Teli* and G.K. Rajanikant**
AbstractNanotechnology is an emerging field that couldpotentially make a major impact to human health.Nanomaterials promise to revolutionize medicineand are increasingly used in drug delivery andmolecular diagnostics. Nanotechnology willfacilitate the integration of diagnostics withtherapeutics and assist the development ofpersonalized medicine, i.e. prescription of specifictherapeutics best suited for an individual. Thisreview will provide an integrated overview ofapplication of nanotechnology-based moleculardiagnostics and drug delivery in the developmentof nanomedicine and ultimately personalizedmedicine. Finally, we identify critical gaps in ourknowledge of nanoparticle toxicity and how thesegaps need to be assessed to enable nanotechnologyto transit safely from bench to bedside.
KeywordsNanotechnology, nanomedicine, diagnostics,imaging, targeted drug delivery, personalizedmedicine
IntroductionSince the land mark lecture by eminent NobelLaureate Richard Feynman in 1959 entitled“There’s plenty of room at the bottom”, the conceptof nanotechnology has been inûuencing alldifferent ûelds of research involving chemistry,physics, electronics, optics, materials science andbiomedical science (Feynman, 1960). The conceptled to the new paradigm that size and shape dictatethe function of materials. This distinguishes theemerging nanoscience from other conventionaltechnologies, which have some aspect at the
nanosize range. National Science Foundation andthe National Nanotechnology Initiative definenanotechnology as understanding andtechnological applications of materials andassemblies at the nanometric scale (1-100 nm),where unique phenomena such as optical,magnetic, electronic and structural properties notseen with macromolecules enable novelapplications (Nowack and Bucheli, 2007 and Gazit,2007).
One area of nanotechnology application that holdsthe promise of providing great benefit for societyis in the realm of medicine. Given the inherentnanoscale functional components of living cells,it was inevitable that nanotechnology would beapplied in medicine, giving rise to the termnanomedicine. Due to their unique characteristicsincluding superparamagnetic or fluorescentproperties, and small size comparable tobiomolecules, nanostructured materials haveemerged as novel biomedical imaging, diagnosticand therapeutic agents for the future biomedicalfield (Table 1). Moreover, the conjugation oftargeting moieties on the surface of thesemultifunctional nanomaterials gives them specifictargeted imaging and therapeutic properties (Wangand Chen, 2009). Nanoparticles and nanodevicesunder investigation for imaging and drug/genedelivery applications are quantum dots, nanoshells,nanospheres, gold nanoparticles, dendrimers,paramagnetic nanoparticles, liposomes and carbonnanotubes (Vo-Dinh, 2007). In this review, we willsummarize important applications ofnanotechnology in medicine with more emphasison diagnostics, imaging, drug delivery and therapy.
* Research Scholar, School of Biotechnology** Assistant Professor, School of Biotechnology. e-mail: [email protected]
36 NIT CALICUT RESEARCH REVIEW
Table 1. Nanomedicine in the 21st century
Nanodiagnostics• Molecular diagnostics• Imaging with nanoparticle contrast materials• Nanobiosensors• NanoendoscopyNanopharmaceuticals• Nanotechnology based drugs• Targeted drug delivery system• Implanted nanopumps and nanocoated stents for
drug delivery• Gene/cell therapyReconstructive surgery• Tissue engineering with nanotechnology
scaffolds• Implantation of rejection-resistant artificial
tissues and organs• Nanosensor implanted catheters for real-time
data during surgery• Nanolaser surgery Nanorobotics• Nanorobotic vascular surgery• Remote controlled nanorobots for tumor
detection and destruction Implants• Bioimplantable sensors that bridge the gap
between electronic and neurological circuitry• Durable rejection-resistant artificial tissues and
organs• Nanocoated stent implantations in coronary
arteries to elute drugs and to prevent re-occlusion
• Implantation of nanopumps for drug delivery
Nanotechnology for cytogenetics anddiagnosticsCytogenetics, a part of molecular diagnostics, hasbeen used mainly to describe the chromosomestructure and identify abnormalities related todiseases. Localizing specific gene probes byfluorescent in situ hybridization (FISH) combinedwith conventional fluorescence microscopy hasreached its limit. Molecular cytogenetics is nowenhanced by nanotechnology. Endothelialprogenitor cells taken from human umbilical cordblood and labeled with perfluorocarbonnanoparticles (200 nm) can be detected bymagnetic resonance imaging (MRI) (Partlow et al,2007). Further, a superparamagnetic iron oxidenanoparticle is emerging as an ideal probe fornoninvasive cell tracking.
Combining advances in related ûelds such asnanotechnology, biotechnology andpharmaceutics, nanomedicine offers the potentialto move from a ‘one-size-fits-all’ approach to onemore individually tailored for higher efficacy (Jain,2009). For diagnosis, this translates to recognitionand characterization of very early (even pre-symptomatic) disease providing assessment,preferably non-invasively. One of the earliestapplications of nanotechnology in MRI was theuse of paramagnetic iron oxide particles; whentaken up by healthy hepatocytes, these particlescould help to distinguish between normal andcancerous liver cells (Saini et al, 1995). Similarly,substantial success in nanotechnology-enabledmolecular imaging have been made in all imagingmodalities including optical, nuclear, ultrasoundand computed tomography (Bergman, 1997,Herschman, 2003, Wickline and Lanza, 2003,Lanza and Wickline, 2003, Sakamoto et al, 2005,Winter et al, 2005, Kobayashi and Brechbiel, 2005and Caruthers et al, 2006). For example, carbonnanotube based X-ray device that emit a scanningX-ray beam composed of multiple smaller beamswhile also remaining stationary will enable theconstruction of smaller and faster X-ray imagingsystems for medical tomography such as CTscanners, which will produce higher-resolutionimages (Zhang et al, 2005). Another studyindicated that it is feasible to use silica nanospheresas contrast-enhancing agents for ultrasonic imaging(Liu et al, 2006).
Because of the small dimension, most of the‘nanodiagnostics’ fall under the broad category ofnanobiochips and nanoarrays (Jain, 2007).Nanotechnology-on-a-chip is a new paradigm fortotal chemical analysis systems (Jain, 2005).Protein nanobiochips in development can detecttraces of proteins in biological fluids that are notdetected by conventional immunoassays.Nanobiosensors based on nanotechnology areportable and sensitive detectors of chemical andbiological agents, which are useful for point-of-care testing of patients. Small pieces of DNAattached to gold particles (~13 nm) can detectmillions of different DNA sequencessimultaneously (Jain, 2007). Quantum dots (QDs)
DECEMBER 2009 37
are inorganic fluorophores with potentialapplications for cancer diagnosis (Zhang et al,2009). Another application of QDs is for viraldiagnosis. For example, current respiratorysyncytial virus (RSV) detection methods are notsensitivity enough and time consuming. However,antibody-conjugated nanoparticles rapidly andsensitively detect RSV and estimate relative levelsof surface protein expression (Agrawal et al, 2005).
Nanotechnology will have an impact on improvingour understanding of the central nervous system(CNS) and developing new treatments, bothmedical and surgical, for CNS disorders (Jain2006). For instance, neuroscientists havesuccessfully detected the activity of individualneurons lying adjacent to the blood vessels usingplatinum nanowires and blood vessels as conduitsto guide the wires (Llinas et al, 2005). Iron oxidenanoparticles can outline not only brain tumorsunder MRI, but also other lesions in the brain thatmay otherwise have gone unnoticed (Neuwelt etal, 2004). Further, iron oxide nanoparticle coatedwith biocompatible polymer and tagged withchlorotoxin (tumor-targeting agent) and afluorophore, has been shown to cross the blood-brain barrier and specifically target brain tumor,as established through in vivo magnetic resonanceand biophotonic imaging (Veiseh et al, 2009). QDtechnology has been employed to gatherinformation about how the CNS environmentbecomes inhospitable to neuronal regenerationfollowing injury or degenerative events (Gao etal, 2008).
NanotherapeuticsUnfortunately, early diagnosis is futile if notcoupled with effective therapy. However,developing effective drug delivery system is amajor challenge for pharmaceutical companiessince nearly half of the drugs are poorly soluble inwater, which is an essential factor for drugeffectiveness. Packaging a small-molecule druginto nanoparticles not only improves its bio-availability, bio-compatibility and safety profilesbut also facilitates targeted transport, immuneevasion and favorable drug release kinetics at thetarget site, maximizing patient compliance
(Devalapally et al, 2007). In this regard,nanotechnology is already moving from being usedin passive structures to active structures in medicalfield, through more targeted drug therapies or“smart drugs” by conjugation of nanocarriers tospecific ligands or to aptamers. These new nano-drug therapies have already been shown to causefewer side effects and be more effective thantraditional therapies (Jain, 2007). There are anumber of advantages with nanoparticles incomparison to microparticles. For example,nanoscale particles can travel through the bloodstream without sedimentation or blockage of themicrovasculature. Small nanoparticles cancirculate in the body and penetrate tissues such astumors. In addition, nanoparticles can be taken upby the cells through natural means such asendocytosis. Nanotechnology improves drugdelivery by the following approaches:
• Minuscule particle size to increase the surfacearea, thereby enhancing the rate of dissolution.
• Development of novel nanoparticle formulationswith improved stability and shelf-life.
• Development of nanoparticle formulations forimproved absorption of insoluble compounds/macromolecules enables improvedbioavailability and release rates, potentiallyreducing the amount of dose required andincreasing safety through reduced side effects.
• Nanoparticle formulations having sustainedrelease profiles up to 24 h improve patientcompliance with drug regimens.
• Nanoparticles conjugated to specific ligands fortargeted drug delivery.
• Nanotechnology is particularly useful fordelivery of biological therapies (gene, proteinor stem cells).
Few nanotechnology-based products are alreadyapproved for the treatment of cancer - Doxil (aliposome preparation of doxorubicin) andAbraxane (paclitaxel in nanoparticle formulation).Many of these already commercialized productsare not available directly to the consumer. Instead,they are employed by researchers involved in drugdiscovery, physicians in need of better imagingtechniques and as prescriptions to treat particular
38 NIT CALICUT RESEARCH REVIEW
kinds of illness (Table 2). Further, goldnanoparticles offer a novel class of selectivephotothermal agents to destroy the malignant cells(El-Sayed et al, 2006). The ability of goldnanoparticles to detect cancer was demonstratedpreviously. Similarly, immunotargeted nanoshells,engineered to both scatter light in the near-infraredrange enabling optical molecular cancer imagingand to absorb light, enable selective destructionof targeted carcinoma cells through photothermaltherapy (Loo et al, 2005). Hence, it will be possiblenow to design an ‘all-in-one’ active agent that canbe used to find cancer noninvasively and thendestroy it. This selective technique has a potentialin molecularly targeted photothermal therapy invivo. Nanoshells, e.g. AuroShellTM (NanospectraBiosciences Inc.), are in commercial developmentfor the targeted destruction of various cancers. Inaddition to this, novel nanoparticlespreprogrammed to alter their structure andproperties by the incorporation of molecularsensors that are able to respond to physical orbiological stimuli, including changes in pH, redoxpotential or enzymes, will make a most effectivedrug delivery systems (Wagner, 2007).
An important role of nanotechnology in themanagement of infections is use of formulationswhich improve the action of known bactericidalagents. The bactericidal properties of some agentsare apparent only in nanoparticulate form. Theseformulations are made of simple, nontoxic metaloxides such as magnesium oxide (MgO) andcalcium oxide (CaO, lime) in nanocrystalline form,carrying active forms of halogens, for example,MgO.Cl
2 and MgO.Br
2. When these ultrafine
powders contact vegetative cells of Escherichiacoli, Bacillus cereus, or Bacillus globigii, over 90%are killed within a few minutes. The aluminumoxide or copper oxide nanoparticles have beendemonstrated to exhibit significant antimicrobialactivity (Sadiq et al, 2009 and Ren et al, 2009).Silver nanoparticles have been incorporated incommercial preparations for wound care to preventinfection (Bhattacharyya and Bradley, 2008 andRai et al, 2009). A simple molecule from ahydrocarbon and an ammonium compound,diacetylene amine salt, has been used to produce a
unique nanotube structure with antimicrobialcapability (Lee et al, 2004).
Some drug delivery devices are implanted in thebody for release of therapeutic substances. Thelining of these devices can be improved bynanotechnology. For example, formation ofmicrocapsules by depositing coatings onto theparticle surface will make it possible to controldrug release kinetics by: (a) diffusion of the drugthrough a polymeric coating, (b) degradation of abiodegradable polymer coating on the drugparticles, releasing the core drug material. A self-assembling cube-shaped perforatedmicrocontainer, no larger than a dust speck, couldserve as a delivery system for medications/cell andcan be tracked easily by MRI (Gimi et al, 2005).
Delivery of drugs to the central nervous system isa challenge and most of the strategies based onnanotechnology are directed at overcoming theblood-brain barrier, a major hurdle in drug deliveryto the brain (Jain, 2007). Nanotechnology canfacilitate neuroprotection. Water-solublederivatives of buckminsterfullerene C60derivatives are a unique class of nanoparticlecompounds with potent antioxidant properties.Robust neuroprotection against excitotoxic,apoptotic and metabolic insults in cortical cellcultures has been demonstrated by use ofcarboxyfullerenes (Aksenova et al, 2005). Apartfrom therapeutic drugs, several genes are beingintroduced to cells using nanotechnology. A varietyof nanoparticles including nanoliposomes, gelatinnanoparticles, calcium phosphate nanoparticles,dendrimers and other nanostructures are now beingconsidered/used for nonviral gene delivery(Chowdhury, 2007).
Nanotechnology is well suited to optimize thegenerally encouraging results already achieved incell transplantation (Halberstadt et al, 2006). Thesmall size of nanomaterial constructs provides anincreasing number of options to label, transfect,visualize, and monitor cells/tissues used intransplantation. Neural progenitor cells,encapsulated in vitro within a three-dimensionalnetwork of nanofibers formed by self-assembly ofpeptide amphiphile molecules, facilitate growth of

DECEMBER 2009 39
nerve cells in tissue cultures (Silva et al, 2004).
Nanodevices like carbon nanotubes to locate anddeliver anticancer drugs at the specific tumor siteare under research. Nanotechnology promisesconstruction of artificial cells, enzymes and genes.Currently nanodevices like respirocytes,microbivores and probes encapsulated bybiologically localized embedding have a greaterapplication in treatment of anaemia and infections.Thus in the present scenario, nanotechnology isspreading its wings to address the key problems inthe field of medicine (Sandhiya et al, 2009).
Table 2. Commercialized nanotechnologyproducts for various biomedical applications
Appetite Control
Megace® ES [Par Pharmaceutical Companies, Inc.(USA)]• Drug designed to stimulate appetite• Utilizes Elan’s NanoCrystal technology delivery
system to improve the rate of dissolution andbioavailability of the original megesterol acetateoral suspension
CancerAbraxane™ [American Pharmaceutical Partners,Inc. (USA)]• Anti-cancer drug for advanced breast cancer.• Albumin-bound form of paclitaxel with a mean
particle size of approximately 130 nanometers.Doxil® [ALZA Corporation (USA)]
• Anti-cancer drug for refractory ovarian cancerand AIDS-related Kaposi’s sarcoma.
• Lipid nanoparticles that incorporate apolyethylene glycol (PEG) coating.
Emend® [Merck & Co., Inc. (USA)]• Anti-nausea drug for chemotherapy patients.• 80 or 125 mg of aprepitant formulated as
NanoCrystal drug particles.
CholesterolTriCor® [Abbott Laboratories (USA)]• Cholesterol-lowering drug that employs Elan’s
NanoCrystal Technology for an easyadministration.
ImagingQdot Nanocrystals [Invitrogen Corporation(USA)]
• Qdot nanocrystals are nanometer-scale atomclusters, containing a semiconductor material(cadmium mixed with selenium or tellurium),which has been coated with an additionalsemiconductor shell (zinc sulfide) to improvethe optical properties of the material.
TriLite™ Technology [Crystalplex Corporation(USA)]• Alloyed nanocrystal aggregates of 8-12
individual nanocrystals.• These nanoclusters are 40-50 nm in size and are
functionalized on the surface with carboxylgroups using a proprietary Crystalplextechnology.
Medical ToolsEnSeal Laparoscopic Vessel Fusion System[SurgRx, Inc. (USA)]• Indicated for surgical hemostasis.• An electrode consisting of nanometer-sized
conductive particles embedded in a temperature-sensitive material.
• Each particle acts like a discrete thermostaticswitch to regulate the amount of current thatpasses into the tissue area with which it is incontact.
TiMESH [GfE Medizintechnik GmbH(Germany)]• Indicated for laparoscopic and open surgery.• TiMESH with its ideal surgical mesh properties,
including biocompatibility, resistance toinfection and the ability to be recognized by thebody as a solid titanium implant.
Acticoat® [Smith & Nephew, Inc. (USA)]• Patented nanocrystalline technology for safe
bactericidal concentrations of silver.
SilvaGard™ [Technology AcryMed, Inc. (USA)]• Antimicrobial silver nanoparticle in solution
form.
Bone ReplacementVitoss [Orthovita (USA)]• Scaffolds (porous, 100 nm) for bone defects and
to enhance resorption and new bone growth.Zirconium Oxide [Altair Nanotechnologies,Inc. (USA)]
• Nano-sized zirconium oxide for dental
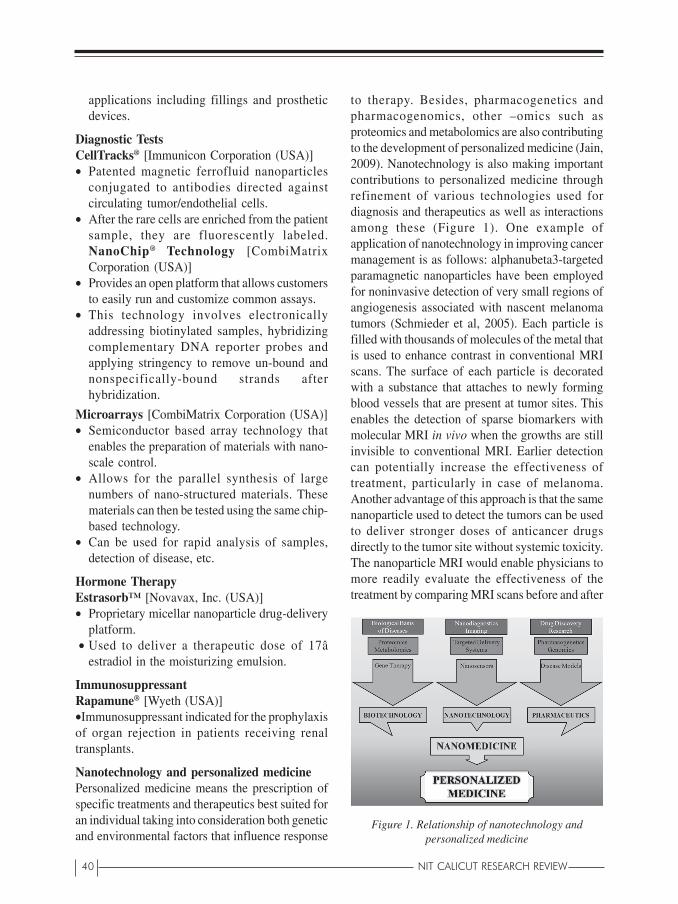
40 NIT CALICUT RESEARCH REVIEW
applications including fillings and prostheticdevices.
Diagnostic TestsCellTracks® [Immunicon Corporation (USA)]• Patented magnetic ferrofluid nanoparticles
conjugated to antibodies directed againstcirculating tumor/endothelial cells.
• After the rare cells are enriched from the patientsample, they are fluorescently labeled.NanoChip® Technology [CombiMatrixCorporation (USA)]
• Provides an open platform that allows customersto easily run and customize common assays.
• This technology involves electronicallyaddressing biotinylated samples, hybridizingcomplementary DNA reporter probes andapplying stringency to remove un-bound andnonspecifically-bound strands afterhybridization.
Microarrays [CombiMatrix Corporation (USA)]• Semiconductor based array technology that
enables the preparation of materials with nano-scale control.
• Allows for the parallel synthesis of largenumbers of nano-structured materials. Thesematerials can then be tested using the same chip-based technology.
• Can be used for rapid analysis of samples,detection of disease, etc.
Hormone TherapyEstrasorb™ [Novavax, Inc. (USA)]• Proprietary micellar nanoparticle drug-delivery
platform. • Used to deliver a therapeutic dose of 17â
estradiol in the moisturizing emulsion.
ImmunosuppressantRapamune® [Wyeth (USA)]•Immunosuppressant indicated for the prophylaxisof organ rejection in patients receiving renaltransplants.
Nanotechnology and personalized medicinePersonalized medicine means the prescription ofspecific treatments and therapeutics best suited foran individual taking into consideration both geneticand environmental factors that influence response
to therapy. Besides, pharmacogenetics andpharmacogenomics, other –omics such asproteomics and metabolomics are also contributingto the development of personalized medicine (Jain,2009). Nanotechnology is also making importantcontributions to personalized medicine throughrefinement of various technologies used fordiagnosis and therapeutics as well as interactionsamong these (Figure 1). One example ofapplication of nanotechnology in improving cancermanagement is as follows: alphanubeta3-targetedparamagnetic nanoparticles have been employedfor noninvasive detection of very small regions ofangiogenesis associated with nascent melanomatumors (Schmieder et al, 2005). Each particle isfilled with thousands of molecules of the metal thatis used to enhance contrast in conventional MRIscans. The surface of each particle is decoratedwith a substance that attaches to newly formingblood vessels that are present at tumor sites. Thisenables the detection of sparse biomarkers withmolecular MRI in vivo when the growths are stillinvisible to conventional MRI. Earlier detectioncan potentially increase the effectiveness oftreatment, particularly in case of melanoma.Another advantage of this approach is that the samenanoparticle used to detect the tumors can be usedto deliver stronger doses of anticancer drugsdirectly to the tumor site without systemic toxicity.The nanoparticle MRI would enable physicians tomore readily evaluate the effectiveness of thetreatment by comparing MRI scans before and after
Figure 1. Relationship of nanotechnology andpersonalized medicine
DECEMBER 2009 41
treatment. This fulfills some of the importantcomponents of personalized cancer therapy: earlydetection, combination of diagnostics withtherapeutics and monitoring of efficacy of therapy.
Both nanomedicine and personalized medicine arealready present on the medical scene, although notofficially designated as specialties of medicine.Both will continue to interact and evolve and willplay an important role in shaping the future ofmedical practice. Nanotechnology will play themost important role in integration of diagnosticswith therapeutics, which is an essential componentof personalized medicine.
ConclusionsNanotechnology is an emerging field that ispotentially changing the way we treat diseasesthrough ground-breaking diagnostic andtherapeutic methods. Employing constructs suchas dendrimers, liposomes, nanoshells, nanotubes,emulsions and quantum dots, these advances leadtoward the concept of personalized medicine andthe potential for very early, even pre-symptomatic,diagnosis coupled with highly-effective targetedtherapy. Current preclinical research innanomedicine promises new ways to diagnosedisease, to deliver speciûc therapy and to monitorthe effects acutely and non-invasively.
The potential that nanotechnology offers for a drugwith improved circulating half-life, greaterfunctional surface area and other beneûts aresuperb, but offset by new and yet unknown,constraints. Coupled with changing circulationtimes, for example, are changes with clearancefrom the body. Other nanoparticles might beretained not only for days, but potentially for years.In that case, the safety proûle for all componentsbecomes of paramount signiûcance. Therefore,significant challenges remain in pushing this fieldinto clinically viable therapies. Current problemsfor nanotechnology and nanomedicine involveunderstanding the issues related to toxicity andenvironmental impact of nanoscale materials (Jain,2008). Nanoparticles must be evaluated on aparticle-by-particle basis and a rationalcharacterisation strategy must include absorption,
distribution, metabolism and excretion (ADME)tests and physicochemical and toxicologicalcharacterisation, involving both in vitro and in vivostudies. As we continue exploring nanotechnologyfor biomedical applications, it is essential for usto ensure that the nanotechnologies developed aresafe. Nanotoxicology is an emerging ûeld ofresearch that will become an integral part ofnanotechnology research; however, the burden forensuring the safety of these tools and technologiesresides with all of us.
References1. Agrawal A, Tripp RA, Anderson LJ, Nie S.
Real-time detection of virus particles and viralprotein expression with two-color nanoparticleprobes. J Virol 2005;79:8625–28.
2. Aksenova MV, Aksenov MY, Mactutus CF,Booze RM.. Cell culture models of oxidativestress and injury in the central nervoussystem. Curr Neurovasc Res. 2005Jan;2(1):73-89.
3. Bergman A. Hepatocyte-speciûc contrastmedia for CT. An experimental investigation.Acta Radiol Suppl 1997;411:1-27.
4. Bhattacharyya M, Bradley H. A case report ofthe use of nanocrystalline silver dressing inthe management of acute surgical site woundinfected with MRSA to prevent cutaneousnecrosis following revision surgery Int J LowExtrem Wounds. 2008;7:45-8.
5. Caruthers SD, Winter PM, Wickline SA, LanzaGM. Targeted magnetic resonance imagingcontrast agents. Methods Mol Med2006;124:387-400.
6. Chowdhury EH. pH-sensitive nano-crystals ofcarbonate apatite for smart and cell-specifictransgene delivery. Expert Opin Drug Deliv2007;4:193–6.
7. Devalapally H, Chakilam A, Amiji MM. Roleof nanotechnology in pharmaceutical productdevelopment. J Pharm Sci. 2007 ;96:2547-65.
8. El-Sayed IH, Huang X, El-Sayed M. Selective
42 NIT CALICUT RESEARCH REVIEW
laser photo-thermal therapy of epithelialcarcinoma using anti-EGFR antibodyconjugated gold nanoparticles. Cancer Lett2006;239:129–35.
9. Feynman, R. P., There’s Plenty of Room at theBottom - An Invitation to Enter a New Fieldof Physics, Eng Sci, 1960;23:22-36.
10. Gao X, Chen J, Chen J, Wu B, Chen H, JiangX. Quantum dots bearing lectin-functionalizednanoparticles as a platform for in vivo brainimaging. Bioconjug Chem. 2008;19:2189-95.
11. Gazit E. Plenty of room for biology at thebottom: An introduction toBionanotechnology. Imperial College Press,London, 2007; pp 129-146.
12. Gimi B, Leong T, Gu Z, Yang M, Artemov D,Bhujwalla ZM, Gracias DH. Self-assembled3D radiofrequency-shielded (RS) containersfor cell encapsulation. Biomed Microdevices2005;7:341-5.
13. Halberstadt C, Emerich DF, Gonsalves K.Combining cell therapy and nanotechnology.Expert Opin Biol Ther 2006;6:971–81.
14. Herschman HR. Molecular imaging: lookingat problems, seeing solutions. Science2003;302:605-8.
15. Jain KK. Applications of nanobiotechnologyin clinical diagnostics. Clin Chem2007;53:2002–9.
16. Jain KK. Handbook of Nanomedicine.Humana/Springer, Totowa, NJ, USA, 2008.
17. Jain KK. Nanobiotechnology-based drugdelivery to the central nervous system.Neurodegener Dis 2007;4:287–91.
18. Jain KK. Nanotechnology-based lab-on-a-chipdevices; in Encyclopedia of DiagnosticGenomics and Proteomics. New York, Dekker,2005; pp.891–5.
19. Jain KK. Role of nanobiotechnology in thedevelopment of personalized medicine.Nanomedicine 2009;4:249-52.
20. Jain KK. Role of nanotechnology indeveloping new therapies for diseases of thenervous system (editorial). Nanomedicine2006;1:9–12.
21. Jain KK. Textbook of personalized medicine.Humana/Springer, Totowa, NJ, USA, 2009.
22. Kobayashi H, Brechbiel MW. Nano-sized MRIcontrast agents with dendrimer cores. AdvDrug Deliv Rev 2005;57:2271-86.
23. Lanza GM, Wickline SA. Targeted ultrasoniccontrast agents for molecular imaging andtherapy. Curr Probl Cardiol 2003;28:625-53.
24. Lee SB, Koepsel R, Stolz DB, Warriner HE,Russell AJ. Self-assembly of biocidalnanotubes from a single chain diacetyleneamine salt. J Am Chem Soc. 2004;126:13400-5.
25. Liu J, Levine AL, Mattoon JS, Yamaguchi M,Lee RJ, Pan X, Rosol TJ. Nanoparticles asimage enhancing agents for ultrasonography.Phys Med Biol 2006;51:2179–89.
26. Llinas RR, Walton KD, Nakao M, Hunter I,Anquetil PA. Neuro-vascular central nervousrecording/stimulating system: usingnanotechnology probes. J Nanoparticle Res2005;7:111–27.
27. Loo C, Lowery A, Halas N, West J, Drezek R.Immunotargeted nanoshells for integratedcancer imaging and therapy. Nano Lett2005;5:709–11.
28. Neuwelt EA, Várallyay P, Bagó AG, MuldoonLL, Nesbit G, Nixon R. Imaging of iron oxidenanoparticles by MR and light microscopy inpatients with malignant brain tumours.Neuropathol Appl Neurobiol. 2004;30:456-71.
29. Nowack, B., Bucheli, T.D., Occurrence,behaviour and effects of nanoparticles in theenvironment, Environ Pollut, 2007;150:5-22.
30. Partlow KC, Chen J, Brant JA, Neubauer AM,Meyerrose TE, Creer MH, Nolta JA, CaruthersSD, Lanza GM, Wickline SA. 19F magnetic
DECEMBER 2009 43
resonance imaging for stem/progenitor celltracking with multiple unique perfluorocarbonnanobeacons. FASEB J 2007;21:1647–54.
31. Rai M, Yadav A, Gade A. Silver nanoparticlesas a new generation of antimicrobials.Biotechnol Adv. 2009;27:76-83.
32. Ren G, Hu D, Cheng EW, Vargas-Reus MA,Reip P, Allaker RP. Characterisation of copperoxide nanoparticles for antimicrobialapplications. Int J Antimicrob Agents.2009;33:587-90.
33. Sadiq IM, Chowdhury B, Chandrasekaran N,Mukherjee A. Antimicrobial sensitivity ofEscherichia coli to alumina nanoparticles.Nanomedicine. 2009;5:282-6.
34. Saini S, Edelman RR, Sharma P, Li W, Mayo-Smith W, Slater GJ, Eisenberg PJ, Hahn PF.Blood-pool MR contrast material for detectionand characterization of focal hepatic lesions:initial clinical experience with ultra smallsuperparamagnetic iron oxide (AMI-227). AJRAm J Roentgenol 1995;164:1147-52.
35. Sakamoto JH, Smith BR, Xie B, Rokhlin SI,Lee SC, Ferrari M. The molecular analysis ofbreast cancer utilizing targeted nanoparticlebased ultrasound contrast agents. TechnolCancer Res Treat 2005;4:627-36.
36. Sandhiya S, Dkhar SA, Surendiran A.Emerging trends of nanomedicine—anoverview. Fundam Clin Pharmacol.2009;23:263-9.
37. Schmieder AH, Winter PM, Caruthers SD,Harris TD, Williams TA, Allen JS, Lacy EK,Zhang H, Scott MJ, Hu G, Robertson JD,Wickline SA, Lanza GM. Molecular MRimaging of melanoma angiogenesis withalphanubeta3-targeted paramagneticnanoparticles. Magn Reson Med. 2005;53:621-7.
38. Silva GA, Czeisler C, Niece KL, Beniash E,Harrington DA, Kessler JA, Stupp SI.Selective differentiation of neural progenitor
cells by high-epitope density nanofibers.Science 2004;303:1352-5.
39. Veiseh O, Sun C, Fang C, Bhattarai N, GunnJ, Kievit F, Du K, Pullar B, Lee D, EllenbogenRG, Olson J, Zhang M. Specific targeting ofbrain tumors with an optical/magneticresonance imaging nanoprobe across theblood-brain barrier. Cancer Res. 2009;69:6200-7.
40. Vo-Dinh T. Nanotechnology in biology andmedicine: methods, devices, and applications.CRC Press, Florida, USA, 2007.
41. Wagner E. Programmed drug delivery:nanosystems for tumor targeting. Expert OpinBiol Ther 2007;7:587–93.
42. Wang H, Chen X. Applications for site-directedmolecular imaging agents coupled with drugdelivery potential. Expert Opin Drug Deliv.2009;6:745-68.
43. Wickline SA, Lanza GM. Nanotechnology formolecular imaging and targeted therapy.Circulation 2003;107:1092-5.
44. Winter PM, Shukla HP, Caruthers SD, ScottMJ, Fuhrhop RW, Robertson JD, Gaffney PJ,Wickline SA, Lanza GM. Molecular imagingof human thrombus with computedtomography. Acad Radiol 2005;12:9-13.
45. Zhang H, Zeng X, Li Q, Gaillard-Kelly M,Wagner CR, Yee D. Fluorescent tumourimaging of type I IGF receptor in vivo:comparison of antibody-conjugated quantumdots and small-molecule fluorophore. Br JCancer 2009;101:71-9.
46. Zhang J, Yang G, Cheng Y, Gao B, Qiu Q, LeeYZ, JP Lu, Zhou O. Stationary scanning X-ray source based on carbon nanotube fieldemitters. Appl Phys Lett 2005;86: 184104/1-184104/3.
44 NIT CALICUT RESEARCH REVIEW
Organic Light Emitting Diodes:
A Review on Device Physics,
and Modeling using
Artificial Neural NetworksT.A. Shahul Hameed*, M.R. Baiju** and P. Predeep***
AbstractSearch for flexible and robust displays impartedgreater momentum to the hectic research in thefield of Organic and Polymer Light EmittingDiodes (OLEDs & PLEDs). Ease of fabricatingmulti color displays through affordable and costeffective techniques accelerated theseinvestigations. Being an interdisciplinary areaunderstanding its physics and modeling havebecome unequivocally important for shapingtomorrow’s device technology. Here a review onthe physics of OLEds is presented. Further , thescope of Artificial Neural Networks in devicemodeling is explored by fabricating andcharacterizing an MEH-PPV based device andmodeling it by using MATLAB tool for ANN.
KeywordsPLED, MEH-PPV, PEDOT-PSS, ISAM andElectro Phosphorescent Device, ANN, Backpropagation
I. IntroductionResearch in organic displays [1] has been attaininggreater momentum for the last two decadesobviously due to their capacity to form flexiblemulti color displays. Their potential advantages
include easy processing, robustness andinexpensive foundry compared to inorganiccounterparts. In fact, this new comer in display israpidly moving from fundamental research intoindustrial product, throwing [2] many newchallenges like degradation and lifetime. In orderto design suitable structures displays it is beyonddoubt that information on device physics is to bebrought out.
Such studies will lead to the development ofaccurate and reliable models of performance,design optimization, integration with existingplatforms, design of silicon driver circuitry andprevention of device degradation. Moreover, aclear understanding on the device physics isnecessary for optimizing electrical propertiesincluding balanced carrier injection and thelocation of the emission in the device. Thecommendable efforts for unveiling the basicoperation of PLEDs, the physical phenomena anddevice models using analytical and experimentalevidences are reviewed in coming sections. Thisis is appended with our attempts to implement anartificial neural net work based model of an MEH-PPV device.
* Department of Electronics and Communication Engineering, TKM College of Engineering, Kollam, Kerala** Department of Electronics and Communication Engineering, College of Engineering Trivandrum, Kerala
*** Professor, Laboratory for Unconventional Electronics and Photonics, NIT Calicute-mail: [email protected]
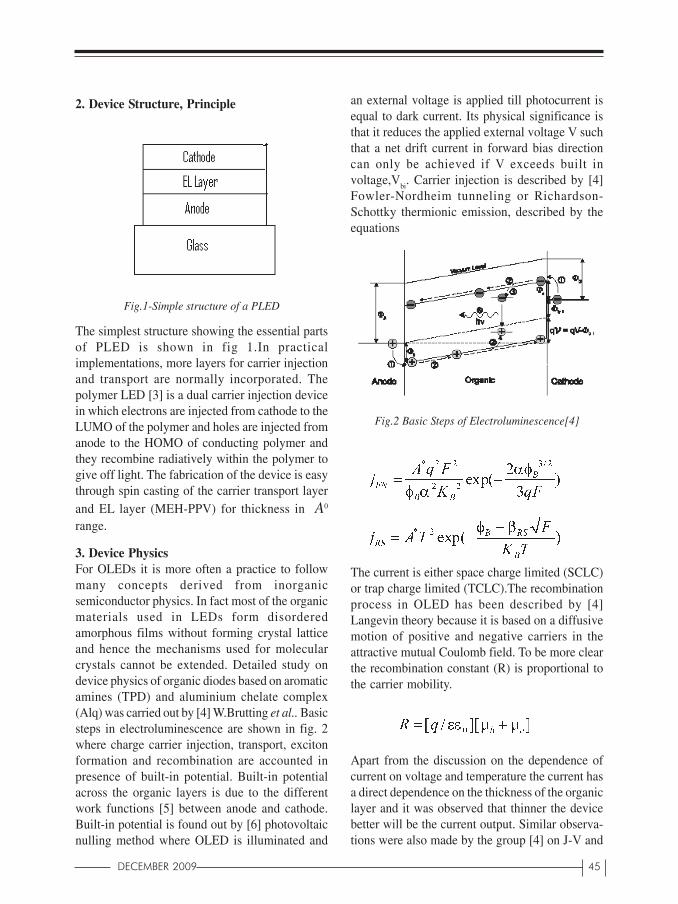
DECEMBER 2009 45
2. Device Structure, Principle
Fig.1-Simple structure of a PLED
The simplest structure showing the essential partsof PLED is shown in fig 1.In practicalimplementations, more layers for carrier injectionand transport are normally incorporated. Thepolymer LED [3] is a dual carrier injection devicein which electrons are injected from cathode to theLUMO of the polymer and holes are injected fromanode to the HOMO of conducting polymer andthey recombine radiatively within the polymer togive off light. The fabrication of the device is easythrough spin casting of the carrier transport layerand EL layer (MEH-PPV) for thickness in A0
range.
3. Device PhysicsFor OLEDs it is more often a practice to followmany concepts derived from inorganicsemiconductor physics. In fact most of the organicmaterials used in LEDs form disorderedamorphous films without forming crystal latticeand hence the mechanisms used for molecularcrystals cannot be extended. Detailed study ondevice physics of organic diodes based on aromaticamines (TPD) and aluminium chelate complex(Alq) was carried out by [4] W.Brutting et al.. Basicsteps in electroluminescence are shown in fig. 2where charge carrier injection, transport, excitonformation and recombination are accounted inpresence of built-in potential. Built-in potentialacross the organic layers is due to the differentwork functions [5] between anode and cathode.Built-in potential is found out by [6] photovoltaicnulling method where OLED is illuminated and
an external voltage is applied till photocurrent isequal to dark current. Its physical significance isthat it reduces the applied external voltage V suchthat a net drift current in forward bias directioncan only be achieved if V exceeds built involtage,V
bi. Carrier injection is described by [4]
Fowler-Nordheim tunneling or Richardson-Schottky thermionic emission, described by theequations
Fig.2 Basic Steps of Electroluminescence[4]
The current is either space charge limited (SCLC)or trap charge limited (TCLC).The recombinationprocess in OLED has been described by [4]Langevin theory because it is based on a diffusivemotion of positive and negative carriers in theattractive mutual Coulomb field. To be more clearthe recombination constant (R) is proportional tothe carrier mobility.
Apart from the discussion on the dependence ofcurrent on voltage and temperature the current hasa direct dependence on the thickness of the organiclayer and it was observed that thinner the devicebetter will be the current output. Similar observa-tions were also made by the group [4] on J-V and
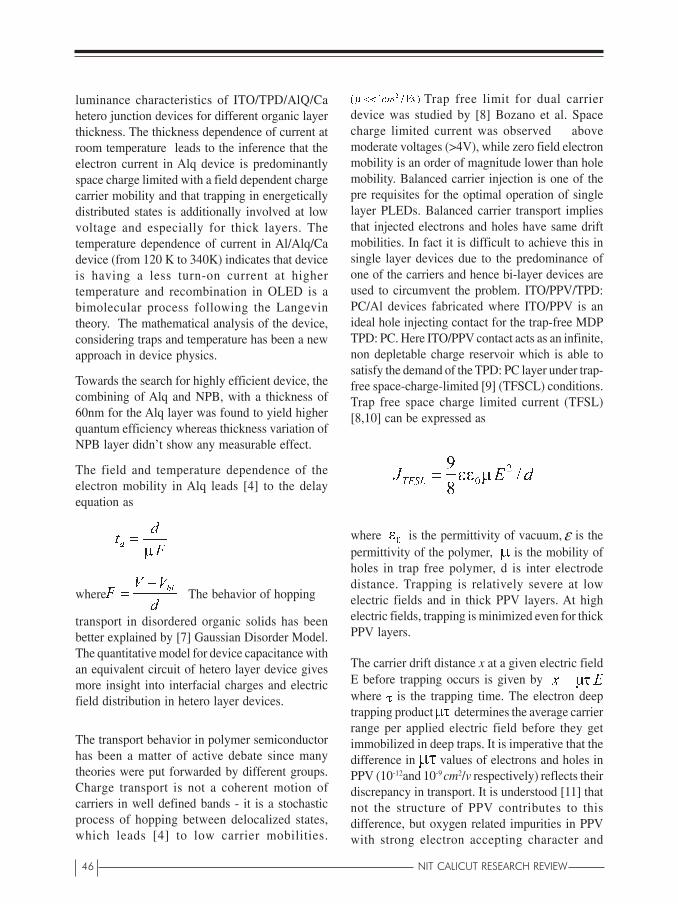
46 NIT CALICUT RESEARCH REVIEW
luminance characteristics of ITO/TPD/AlQ/Cahetero junction devices for different organic layerthickness. The thickness dependence of current atroom temperature leads to the inference that theelectron current in Alq device is predominantlyspace charge limited with a field dependent chargecarrier mobility and that trapping in energeticallydistributed states is additionally involved at lowvoltage and especially for thick layers. Thetemperature dependence of current in Al/Alq/Cadevice (from 120 K to 340K) indicates that deviceis having a less turn-on current at highertemperature and recombination in OLED is abimolecular process following the Langevintheory. The mathematical analysis of the device,considering traps and temperature has been a newapproach in device physics.
Towards the search for highly efficient device, thecombining of Alq and NPB, with a thickness of60nm for the Alq layer was found to yield higherquantum efficiency whereas thickness variation ofNPB layer didn’t show any measurable effect.
The field and temperature dependence of theelectron mobility in Alq leads [4] to the delayequation as
where The behavior of hopping
transport in disordered organic solids has beenbetter explained by [7] Gaussian Disorder Model.The quantitative model for device capacitance withan equivalent circuit of hetero layer device givesmore insight into interfacial charges and electricfield distribution in hetero layer devices.
The transport behavior in polymer semiconductorhas been a matter of active debate since manytheories were put forwarded by different groups.Charge transport is not a coherent motion ofcarriers in well defined bands - it is a stochasticprocess of hopping between delocalized states,which leads [4] to low carrier mobilities.
Trap free limit for dual carrierdevice was studied by [8] Bozano et al. Spacecharge limited current was observed abovemoderate voltages (>4V), while zero field electronmobility is an order of magnitude lower than holemobility. Balanced carrier injection is one of thepre requisites for the optimal operation of singlelayer PLEDs. Balanced carrier transport impliesthat injected electrons and holes have same driftmobilities. In fact it is difficult to achieve this insingle layer devices due to the predominance ofone of the carriers and hence bi-layer devices areused to circumvent the problem. ITO/PPV/TPD:PC/Al devices fabricated where ITO/PPV is anideal hole injecting contact for the trap-free MDPTPD: PC. Here ITO/PPV contact acts as an infinite,non depletable charge reservoir which is able tosatisfy the demand of the TPD: PC layer under trap-free space-charge-limited [9] (TFSCL) conditions.Trap free space charge limited current (TFSL)[8,10] can be expressed as
where is the permittivity of vacuum,ε is thepermittivity of the polymer, is the mobility ofholes in trap free polymer, d is inter electrodedistance. Trapping is relatively severe at lowelectric fields and in thick PPV layers. At highelectric fields, trapping is minimized even for thickPPV layers.
The carrier drift distance x at a given electric fieldE before trapping occurs is given by where is the trapping time. The electron deeptrapping product determines the average carrierrange per applied electric field before they getimmobilized in deep traps. It is imperative that thedifference in values of electrons and holes inPPV (10-12and 10-9 cm2/v respectively) reflects theirdiscrepancy in transport. It is understood [11] thatnot the structure of PPV contributes to thisdifference, but oxygen related impurities in PPVwith strong electron accepting character and
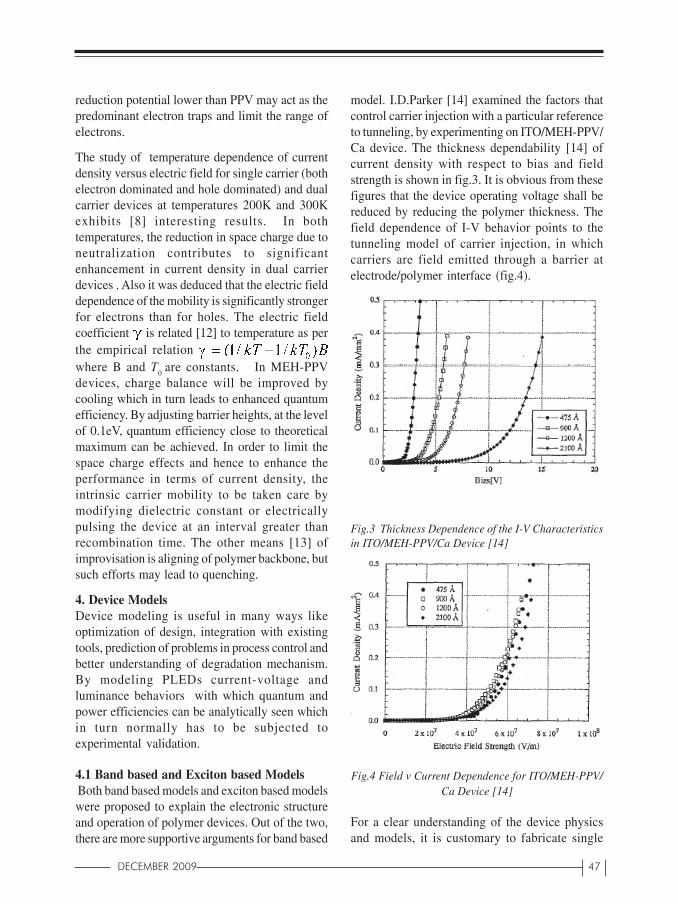
DECEMBER 2009 47
reduction potential lower than PPV may act as thepredominant electron traps and limit the range ofelectrons.
The study of temperature dependence of currentdensity versus electric field for single carrier (bothelectron dominated and hole dominated) and dualcarrier devices at temperatures 200K and 300Kexhibits [8] interesting results. In bothtemperatures, the reduction in space charge due toneutralization contributes to significantenhancement in current density in dual carrierdevices . Also it was deduced that the electric fielddependence of the mobility is significantly strongerfor electrons than for holes. The electric fieldcoefficient is related [12] to temperature as perthe empirical relation where B and T
0 are constants. In MEH-PPV
devices, charge balance will be improved bycooling which in turn leads to enhanced quantumefficiency. By adjusting barrier heights, at the levelof 0.1eV, quantum efficiency close to theoreticalmaximum can be achieved. In order to limit thespace charge effects and hence to enhance theperformance in terms of current density, theintrinsic carrier mobility to be taken care bymodifying dielectric constant or electricallypulsing the device at an interval greater thanrecombination time. The other means [13] ofimprovisation is aligning of polymer backbone, butsuch efforts may lead to quenching.
4. Device ModelsDevice modeling is useful in many ways likeoptimization of design, integration with existingtools, prediction of problems in process control andbetter understanding of degradation mechanism.By modeling PLEDs current-voltage andluminance behaviors with which quantum andpower efficiencies can be analytically seen whichin turn normally has to be subjected toexperimental validation.
4.1 Band based and Exciton based Models Both band based models and exciton based modelswere proposed to explain the electronic structureand operation of polymer devices. Out of the two,there are more supportive arguments for band based
model. I.D.Parker [14] examined the factors thatcontrol carrier injection with a particular referenceto tunneling, by experimenting on ITO/MEH-PPV/Ca device. The thickness dependability [14] ofcurrent density with respect to bias and fieldstrength is shown in fig.3. It is obvious from thesefigures that the device operating voltage shall bereduced by reducing the polymer thickness. Thefield dependence of I-V behavior points to thetunneling model of carrier injection, in whichcarriers are field emitted through a barrier atelectrode/polymer interface (fig.4).
Fig.3 Thickness Dependence of the I-V Characteristicsin ITO/MEH-PPV/Ca Device [14]
Fig.4 Field v Current Dependence for ITO/MEH-PPV/Ca Device [14]
For a clear understanding of the device physicsand models, it is customary to fabricate single
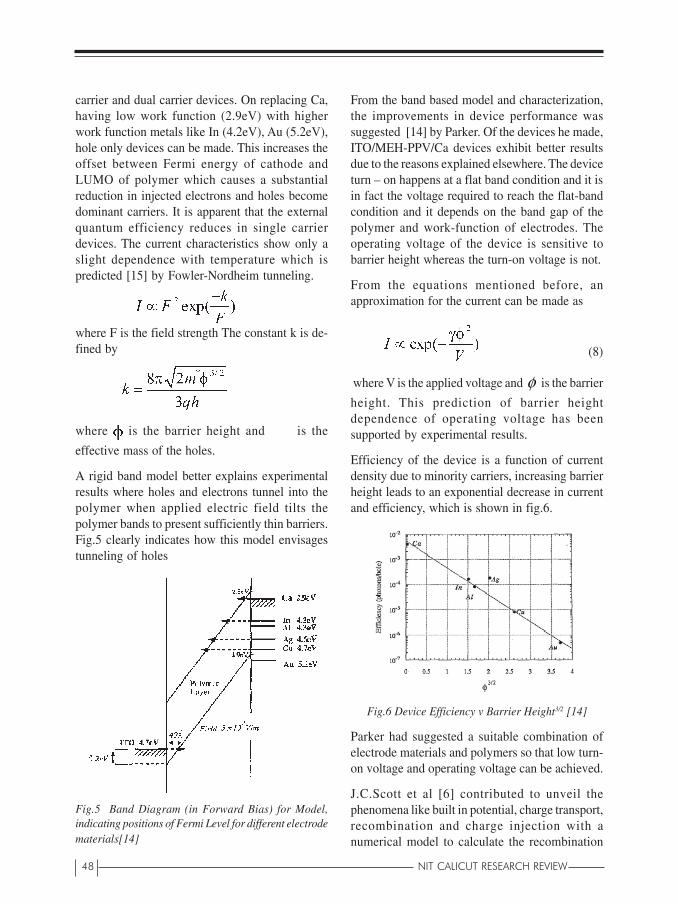
48 NIT CALICUT RESEARCH REVIEW
carrier and dual carrier devices. On replacing Ca,having low work function (2.9eV) with higherwork function metals like In (4.2eV), Au (5.2eV),hole only devices can be made. This increases theoffset between Fermi energy of cathode andLUMO of polymer which causes a substantialreduction in injected electrons and holes becomedominant carriers. It is apparent that the externalquantum efficiency reduces in single carrierdevices. The current characteristics show only aslight dependence with temperature which ispredicted [15] by Fowler-Nordheim tunneling.
where F is the field strength The constant k is de-fined by
where is the barrier height and is the
effective mass of the holes.
A rigid band model better explains experimentalresults where holes and electrons tunnel into thepolymer when applied electric field tilts thepolymer bands to present sufficiently thin barriers.Fig.5 clearly indicates how this model envisagestunneling of holes
Fig.5 Band Diagram (in Forward Bias) for Model,indicating positions of Fermi Level for different electrodematerials[14]
From the band based model and characterization,the improvements in device performance wassuggested [14] by Parker. Of the devices he made,ITO/MEH-PPV/Ca devices exhibit better resultsdue to the reasons explained elsewhere. The deviceturn – on happens at a flat band condition and it isin fact the voltage required to reach the flat-bandcondition and it depends on the band gap of thepolymer and work-function of electrodes. Theoperating voltage of the device is sensitive tobarrier height whereas the turn-on voltage is not.
From the equations mentioned before, anapproximation for the current can be made as
(8)
where V is the applied voltage and φ is the barrier
height. This prediction of barrier heightdependence of operating voltage has beensupported by experimental results.
Efficiency of the device is a function of currentdensity due to minority carriers, increasing barrierheight leads to an exponential decrease in currentand efficiency, which is shown in fig.6.
Fig.6 Device Efficiency v Barrier Height3/2 [14]
Parker had suggested a suitable combination ofelectrode materials and polymers so that low turn-on voltage and operating voltage can be achieved.
J.C.Scott et al [6] contributed to unveil thephenomena like built in potential, charge transport,recombination and charge injection with anumerical model to calculate the recombination
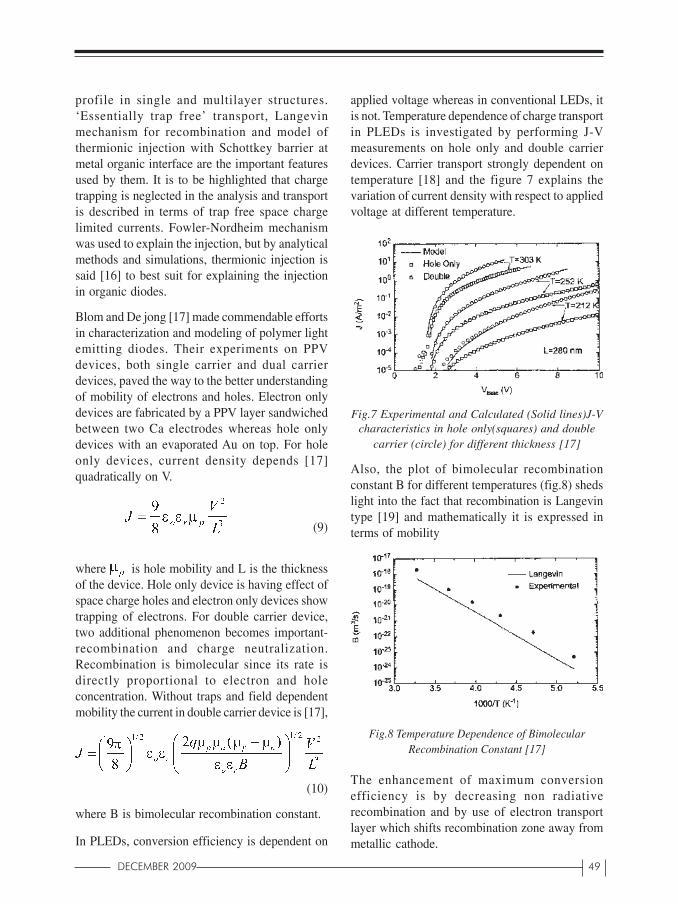
DECEMBER 2009 49
profile in single and multilayer structures.‘Essentially trap free’ transport, Langevinmechanism for recombination and model ofthermionic injection with Schottkey barrier atmetal organic interface are the important featuresused by them. It is to be highlighted that chargetrapping is neglected in the analysis and transportis described in terms of trap free space chargelimited currents. Fowler-Nordheim mechanismwas used to explain the injection, but by analyticalmethods and simulations, thermionic injection issaid [16] to best suit for explaining the injectionin organic diodes.
Blom and De jong [17] made commendable effortsin characterization and modeling of polymer lightemitting diodes. Their experiments on PPVdevices, both single carrier and dual carrierdevices, paved the way to the better understandingof mobility of electrons and holes. Electron onlydevices are fabricated by a PPV layer sandwichedbetween two Ca electrodes whereas hole onlydevices with an evaporated Au on top. For holeonly devices, current density depends [17]quadratically on V.
(9)
where is hole mobility and L is the thicknessof the device. Hole only device is having effect ofspace charge holes and electron only devices showtrapping of electrons. For double carrier device,two additional phenomenon becomes important-recombination and charge neutralization.Recombination is bimolecular since its rate isdirectly proportional to electron and holeconcentration. Without traps and field dependentmobility the current in double carrier device is [17],
(10)
where B is bimolecular recombination constant.
In PLEDs, conversion efficiency is dependent on
applied voltage whereas in conventional LEDs, itis not. Temperature dependence of charge transportin PLEDs is investigated by performing J-Vmeasurements on hole only and double carrierdevices. Carrier transport strongly dependent ontemperature [18] and the figure 7 explains thevariation of current density with respect to appliedvoltage at different temperature.
Fig.7 Experimental and Calculated (Solid lines)J-Vcharacteristics in hole only(squares) and double
carrier (circle) for different thickness [17]
Also, the plot of bimolecular recombinationconstant B for different temperatures (fig.8) shedslight into the fact that recombination is Langevintype [19] and mathematically it is expressed interms of mobility
Fig.8 Temperature Dependence of BimolecularRecombination Constant [17]
The enhancement of maximum conversionefficiency is by decreasing non radiativerecombination and by use of electron transportlayer which shifts recombination zone away frommetallic cathode.
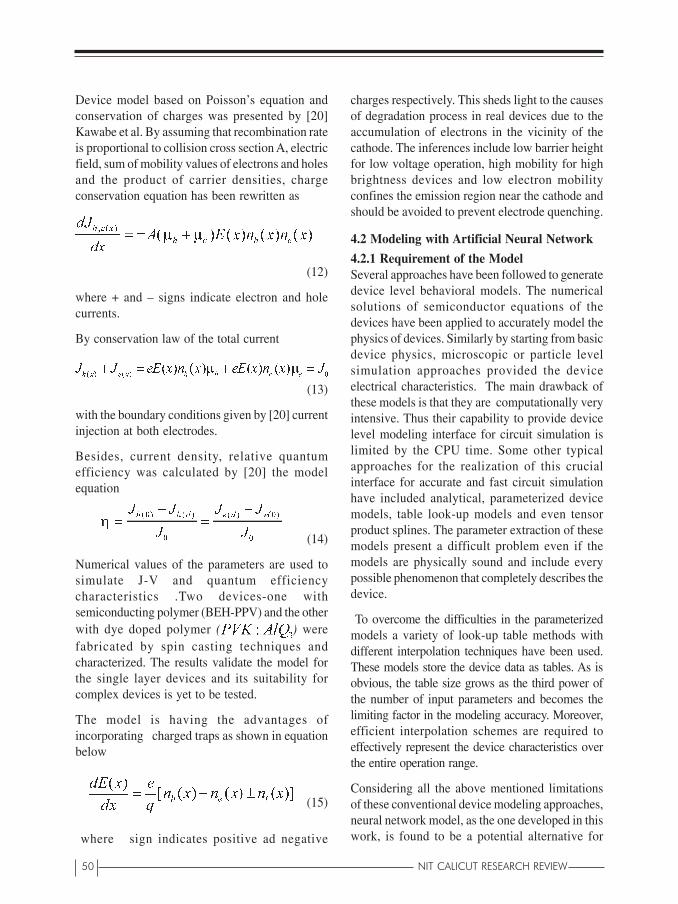
50 NIT CALICUT RESEARCH REVIEW
Device model based on Poisson’s equation andconservation of charges was presented by [20]Kawabe et al. By assuming that recombination rateis proportional to collision cross section A, electricfield, sum of mobility values of electrons and holesand the product of carrier densities, chargeconservation equation has been rewritten as
(12)
where + and – signs indicate electron and holecurrents.
By conservation law of the total current
(13)
with the boundary conditions given by [20] currentinjection at both electrodes.
Besides, current density, relative quantumefficiency was calculated by [20] the modelequation
(14)
Numerical values of the parameters are used tosimulate J-V and quantum efficiencycharacteristics .Two devices-one withsemiconducting polymer (BEH-PPV) and the otherwith dye doped polymer ( ) werefabricated by spin casting techniques andcharacterized. The results validate the model forthe single layer devices and its suitability forcomplex devices is yet to be tested.
The model is having the advantages ofincorporating charged traps as shown in equationbelow
(15)
where sign indicates positive ad negative
charges respectively. This sheds light to the causesof degradation process in real devices due to theaccumulation of electrons in the vicinity of thecathode. The inferences include low barrier heightfor low voltage operation, high mobility for highbrightness devices and low electron mobilityconfines the emission region near the cathode andshould be avoided to prevent electrode quenching.
4.2 Modeling with Artificial Neural Network
4.2.1 Requirement of the ModelSeveral approaches have been followed to generatedevice level behavioral models. The numericalsolutions of semiconductor equations of thedevices have been applied to accurately model thephysics of devices. Similarly by starting from basicdevice physics, microscopic or particle levelsimulation approaches provided the deviceelectrical characteristics. The main drawback ofthese models is that they are computationally veryintensive. Thus their capability to provide devicelevel modeling interface for circuit simulation islimited by the CPU time. Some other typicalapproaches for the realization of this crucialinterface for accurate and fast circuit simulationhave included analytical, parameterized devicemodels, table look-up models and even tensorproduct splines. The parameter extraction of thesemodels present a difficult problem even if themodels are physically sound and include everypossible phenomenon that completely describes thedevice.
To overcome the difficulties in the parameterizedmodels a variety of look-up table methods withdifferent interpolation techniques have been used.These models store the device data as tables. As isobvious, the table size grows as the third power ofthe number of input parameters and becomes thelimiting factor in the modeling accuracy. Moreover,efficient interpolation schemes are required toeffectively represent the device characteristics overthe entire operation range.
Considering all the above mentioned limitationsof these conventional device modeling approaches,neural network model, as the one developed in thiswork, is found to be a potential alternative for
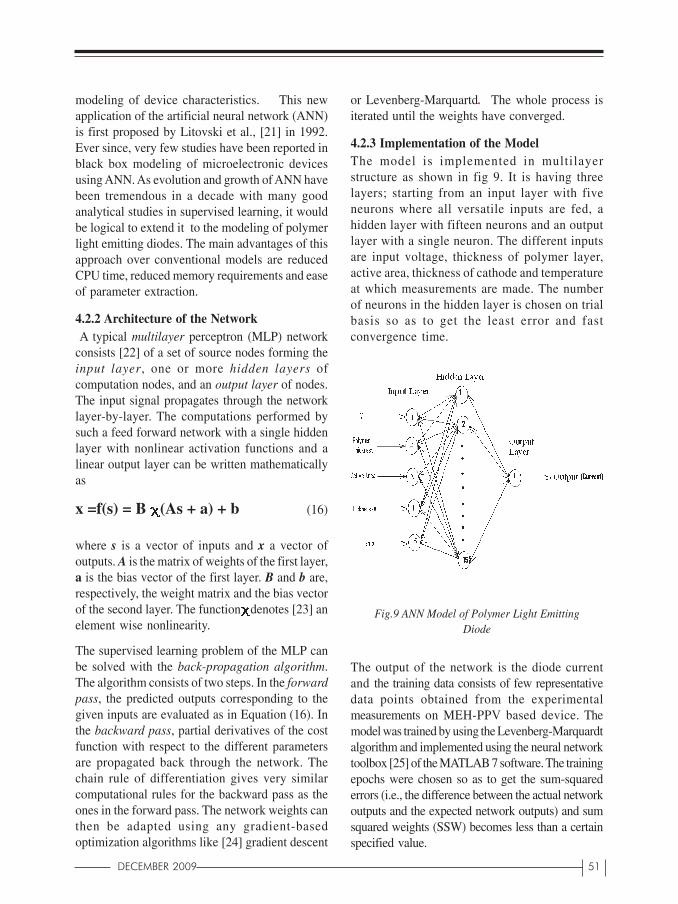
DECEMBER 2009 51
modeling of device characteristics. This newapplication of the artificial neural network (ANN)is first proposed by Litovski et al., [21] in 1992.Ever since, very few studies have been reported inblack box modeling of microelectronic devicesusing ANN. As evolution and growth of ANN havebeen tremendous in a decade with many goodanalytical studies in supervised learning, it wouldbe logical to extend it to the modeling of polymerlight emitting diodes. The main advantages of thisapproach over conventional models are reducedCPU time, reduced memory requirements and easeof parameter extraction.
4.2.2 Architecture of the Network A typical multilayer perceptron (MLP) networkconsists [22] of a set of source nodes forming theinput layer, one or more hidden layers ofcomputation nodes, and an output layer of nodes.The input signal propagates through the networklayer-by-layer. The computations performed bysuch a feed forward network with a single hiddenlayer with nonlinear activation functions and alinear output layer can be written mathematicallyas
x =f(s) = B (As + a) + b (16)
where s is a vector of inputs and x a vector ofoutputs. A is the matrix of weights of the first layer,a is the bias vector of the first layer. B and b are,respectively, the weight matrix and the bias vectorof the second layer. The function denotes [23] anelement wise nonlinearity.
The supervised learning problem of the MLP canbe solved with the back-propagation algorithm.The algorithm consists of two steps. In the forwardpass, the predicted outputs corresponding to thegiven inputs are evaluated as in Equation (16). Inthe backward pass, partial derivatives of the costfunction with respect to the different parametersare propagated back through the network. Thechain rule of differentiation gives very similarcomputational rules for the backward pass as theones in the forward pass. The network weights canthen be adapted using any gradient-basedoptimization algorithms like [24] gradient descent
or Levenberg-Marquartd. The whole process isiterated until the weights have converged.
4.2.3 Implementation of the ModelThe model is implemented in multilayerstructure as shown in fig 9. It is having threelayers; starting from an input layer with fiveneurons where all versatile inputs are fed, ahidden layer with fifteen neurons and an outputlayer with a single neuron. The different inputsare input voltage, thickness of polymer layer,active area, thickness of cathode and temperatureat which measurements are made. The numberof neurons in the hidden layer is chosen on trialbasis so as to get the least error and fastconvergence time.
Fig.9 ANN Model of Polymer Light EmittingDiode
The output of the network is the diode currentand the training data consists of few representativedata points obtained from the experimentalmeasurements on MEH-PPV based device. Themodel was trained by using the Levenberg-Marquardtalgorithm and implemented using the neural networktoolbox [25] of the MATLAB 7 software. The trainingepochs were chosen so as to get the sum-squarederrors (i.e., the difference between the actual networkoutputs and the expected network outputs) and sumsquared weights (SSW) becomes less than a certainspecified value.
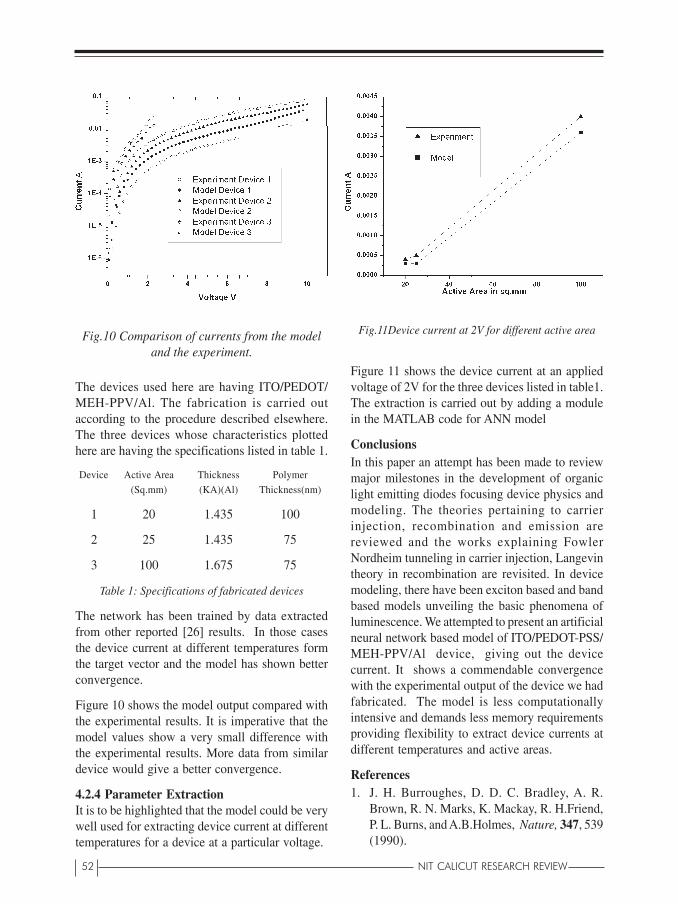
52 NIT CALICUT RESEARCH REVIEW
Fig.11Device current at 2V for different active area
Figure 11 shows the device current at an appliedvoltage of 2V for the three devices listed in table1.The extraction is carried out by adding a modulein the MATLAB code for ANN model
ConclusionsIn this paper an attempt has been made to reviewmajor milestones in the development of organiclight emitting diodes focusing device physics andmodeling. The theories pertaining to carrierinjection, recombination and emission arereviewed and the works explaining FowlerNordheim tunneling in carrier injection, Langevintheory in recombination are revisited. In devicemodeling, there have been exciton based and bandbased models unveiling the basic phenomena ofluminescence. We attempted to present an artificialneural network based model of ITO/PEDOT-PSS/MEH-PPV/Al device, giving out the devicecurrent. It shows a commendable convergencewith the experimental output of the device we hadfabricated. The model is less computationallyintensive and demands less memory requirementsproviding flexibility to extract device currents atdifferent temperatures and active areas.
References1. J. H. Burroughes, D. D. C. Bradley, A. R.
Brown, R. N. Marks, K. Mackay, R. H.Friend,P. L. Burns, and A.B.Holmes, Nature, 347, 539(1990).
Fig.10 Comparison of currents from the modeland the experiment.
The devices used here are having ITO/PEDOT/MEH-PPV/Al. The fabrication is carried outaccording to the procedure described elsewhere.The three devices whose characteristics plottedhere are having the specifications listed in table 1.
Device Active Area Thickness Polymer
(Sq.mm) (KA)(Al) Thickness(nm)
1 20 1.435 100
2 25 1.435 75
3 100 1.675 75
Table 1: Specifications of fabricated devices
The network has been trained by data extractedfrom other reported [26] results. In those casesthe device current at different temperatures formthe target vector and the model has shown betterconvergence.
Figure 10 shows the model output compared withthe experimental results. It is imperative that themodel values show a very small difference withthe experimental results. More data from similardevice would give a better convergence.
4.2.4 Parameter ExtractionIt is to be highlighted that the model could be verywell used for extracting device current at differenttemperatures for a device at a particular voltage.

DECEMBER 2009 53
2. G.Yu and Alan J.Heeger, Synthetic Metals 85(1997) 1183
3. Y.Cao et al, Synthetic Metals 87 (1997) 171
4. Wolfgang Brutting, Stefan Berleb, AntonG.Muckl , Organic Electronics 2 (2001) 1- 36
5. I.H. Campbell, T.W. Hagler, D.L. Smith, J.P.Ferraris, Phys. Rev. Lett. 76 1996 1900.
6. J.C.Scott, Philip J.Brock, Jesse R.Salem,Sergio Ramos, George G.Malliaras, Sue A.Carter and Luisa Bozano, Synthetic Metals111-112(2000) 289-293
7. H.Bassler.Phys.State Sol .(b), 175 (1993),15
8. L.Bozano,S.A.Carter, J.C.Scott, G.G.Malliarasand P.J.Brock , Applied Physics Letters Volume74, Number 8 22 February 1999
9. H.Antoniadis. M.A.Abkowitz and B.R.Hsieh,Applied Physics Letters 65 (16), 17 October1994
10 M. A. Lampert and P. Mark, Current Injectionin Solids ~Academic, NewYork, 1970
11 Papadimitrakopoulos,K. Konstadinidis, T.Miller, R. Opila, E. A. Chandross and M. E.Galvin, Chem. Mater. 6, 1563 (1994)
12. W.D.Gill, Journal of Applied Physics 43, 5033(1972)
13. L.Bozano, S.A.Carter, and P.J.Brock, AppliedPhysics Letters 73, 3911(1998)
14. I.D. Parker, Journal of Applied Physics. 751994, 1656.
15. S. M. Sze, Physics of Semiconductor Devices(Wiley, New York, 1981).
16. G.G. Malliaras, J.R. Salem, P.J. Brock, J.C.Scott, Phys. Rev. B 58 1998 R13411.
17. P.W.M.Blom and Marc J.M.de jong,IEEEjournal of selected topics in quantumelectronics 4(1), 1998
18. P. W. M. Blom, M. J. M. De Jong, and S.Breedijk, Appl. Phys. Lett., vol. 71, pp. 930-932, 1997.
19. P. Langevin, Ann. Chim. Phys.,vol. 28, pp.433-530, 1903.
20.Y.Kawabe, M.M. Morrell, G.E. Jabbour,S.E. Shaheen, B.Kippelen and N.Peyghambarian, .Journal of Applied Physics84(9) 1998
21. V.B.Litovsky, .I.Radjenovic,Z.M.Mrcaricaand S.L.Milenkovic Electronics Letters 27th
August 1992 Vol.28 No.18
23. A.K.Jain, J.Mao and J.Mohiuddin , IEEEComputer, Vol 29, 3, pp 33-44 , March 1996
23. Simon Haykin, ‘Neural Networks - AComprehensive Foundation’, 2nd ed.Prentice-Hall India, 1998.
24. M.T.Hagan and M.B.Menhaj , IEEE Trans. OnNeural Networks vol 5 P 989 1994
25. Neural Network Documentation- MATLAB 7Mathworks Inc., U.S.A.
26. L.F.Santos, R.F.Bianchi, R.M.Faria, Journalof Non crystalline Solids 338-340(2004) 590-594.
54 NIT CALICUT RESEARCH REVIEW
AbstractThis paper deals with an experimental investigationcarried out to examine the suitability offerrocement as a retrofitting material for RCCframes, which are subjected to distress underreversed lateral cyclic loading. The experimentalinvestigation consists of casting and testing of athree-bay three storey RCC frame under reversedlateral cyclic loading until severely distressed.After unloading, retrofitting with ferrocement atthe beam-column joints was adopted for the frame.The strengthened specimen was subjected to sameloading sequence in the 2nd stage. The performanceparameters such as stiffness degradation, energydissipation capacity, ductility of the bare frame andretrofitted frame were compared and the resultsare presented.
Keywords: RCC frames, retrofitting, cyclic,ductility, ferrocement.
IntroductionLateral load resistance of reinforced concretemoment resisting frames depends upon their abilityto deform well into inelastic range and dissipatethe energy through the stable hysteretic behaviour.These inelastic deformations are mainly
* Professor, Department of Civil Engineering** Research Scholar, Department of Civil Engineering
Strength and behaviour
of petrofitted
multi-storey RCC frames
under lateral loadingN. Ganesan*, P.V. Indira* and Shyju P. Thadathil**
concentrated in certain critical regions of the framelike end sections of the beams at beam-columnjoints which are suitably designed and detailed toundergo large inelastic deformations. As per theglobal practice, the resulting yield mechanismunder lateral cyclic loads for the entire structuralframe system should be capable of sustaining largedrifts by distributing the inelastic demanduniformly across its various members. Hence theductile moment resisting frames are designed todevelop plastic hinges at the ends of the beams,while columns remain elastic except at the base ofthe frame. This will form strong-column weak-beam mechanism. RCC framed structures that werebuilt, when effective design provisions for lateralloads were not established, exist at various places.Due to several design deficiencies relative tocurrent code requirements (IS: 456(2000), IS:1893(2002), ACI 318, NZS 3101 etc.), thebehaviour of such structures under lateral loadconditions are governed by undesirable mode offailures like weak column-strong beam failuremechanisms. In addition to this, many RCC framesare already in distressed and deteriorated conditiondue to material deficiencies, poor workmanship,and unexpected loading from natural hazards like
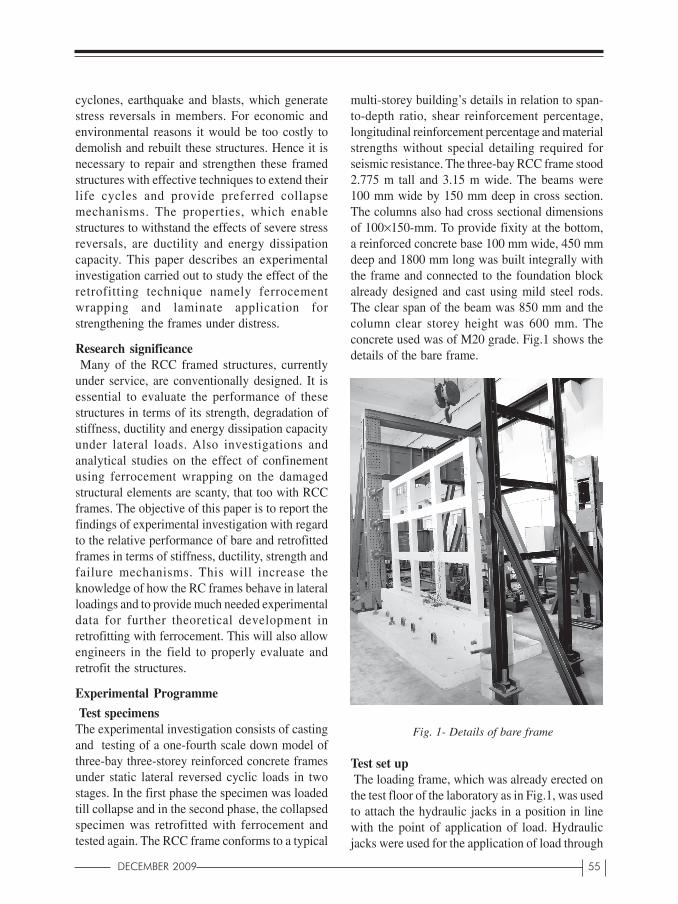
DECEMBER 2009 55
cyclones, earthquake and blasts, which generatestress reversals in members. For economic andenvironmental reasons it would be too costly todemolish and rebuilt these structures. Hence it isnecessary to repair and strengthen these framedstructures with effective techniques to extend theirlife cycles and provide preferred collapsemechanisms. The properties, which enablestructures to withstand the effects of severe stressreversals, are ductility and energy dissipationcapacity. This paper describes an experimentalinvestigation carried out to study the effect of theretrofitting technique namely ferrocementwrapping and laminate application forstrengthening the frames under distress.
Research significance Many of the RCC framed structures, currentlyunder service, are conventionally designed. It isessential to evaluate the performance of thesestructures in terms of its strength, degradation ofstiffness, ductility and energy dissipation capacityunder lateral loads. Also investigations andanalytical studies on the effect of confinementusing ferrocement wrapping on the damagedstructural elements are scanty, that too with RCCframes. The objective of this paper is to report thefindings of experimental investigation with regardto the relative performance of bare and retrofittedframes in terms of stiffness, ductility, strength andfailure mechanisms. This will increase theknowledge of how the RC frames behave in lateralloadings and to provide much needed experimentaldata for further theoretical development inretrofitting with ferrocement. This will also allowengineers in the field to properly evaluate andretrofit the structures.
Experimental Programme
Test specimensThe experimental investigation consists of castingand testing of a one-fourth scale down model ofthree-bay three-storey reinforced concrete framesunder static lateral reversed cyclic loads in twostages. In the first phase the specimen was loadedtill collapse and in the second phase, the collapsedspecimen was retrofitted with ferrocement andtested again. The RCC frame conforms to a typical
multi-storey building’s details in relation to span-to-depth ratio, shear reinforcement percentage,longitudinal reinforcement percentage and materialstrengths without special detailing required forseismic resistance. The three-bay RCC frame stood2.775 m tall and 3.15 m wide. The beams were100 mm wide by 150 mm deep in cross section.The columns also had cross sectional dimensionsof 100×150-mm. To provide fixity at the bottom,a reinforced concrete base 100 mm wide, 450 mmdeep and 1800 mm long was built integrally withthe frame and connected to the foundation blockalready designed and cast using mild steel rods.The clear span of the beam was 850 mm and thecolumn clear storey height was 600 mm. Theconcrete used was of M20 grade. Fig.1 shows thedetails of the bare frame.
Fig. 1- Details of bare frame
Test set up The loading frame, which was already erected onthe test floor of the laboratory as in Fig.1, was usedto attach the hydraulic jacks in a position in linewith the point of application of load. Hydraulicjacks were used for the application of load through
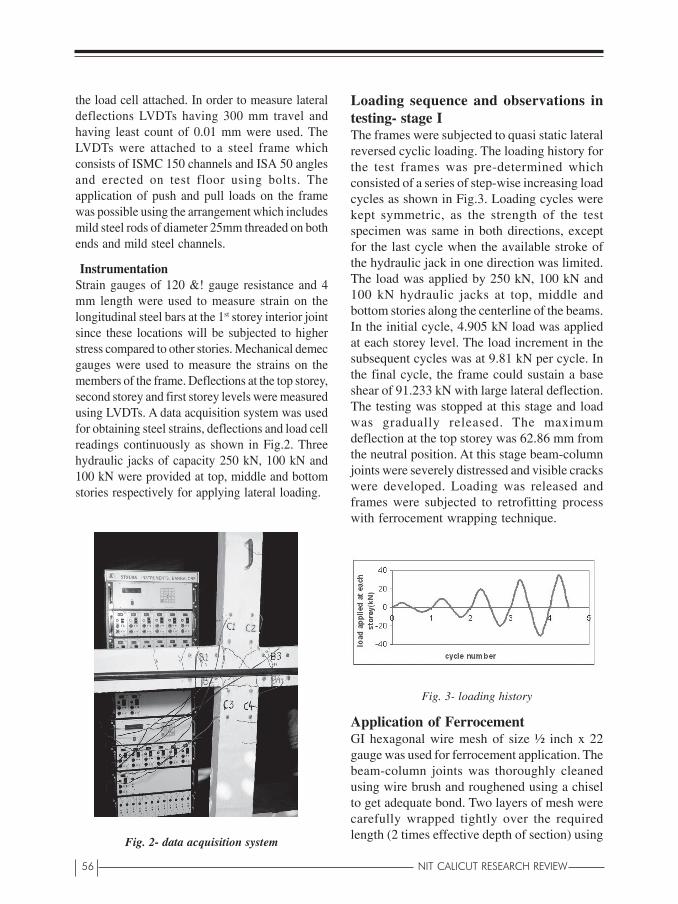
56 NIT CALICUT RESEARCH REVIEW
the load cell attached. In order to measure lateraldeflections LVDTs having 300 mm travel andhaving least count of 0.01 mm were used. TheLVDTs were attached to a steel frame whichconsists of ISMC 150 channels and ISA 50 anglesand erected on test floor using bolts. Theapplication of push and pull loads on the framewas possible using the arrangement which includesmild steel rods of diameter 25mm threaded on bothends and mild steel channels.
InstrumentationStrain gauges of 120 &! gauge resistance and 4mm length were used to measure strain on thelongitudinal steel bars at the 1st storey interior jointsince these locations will be subjected to higherstress compared to other stories. Mechanical demecgauges were used to measure the strains on themembers of the frame. Deflections at the top storey,second storey and first storey levels were measuredusing LVDTs. A data acquisition system was usedfor obtaining steel strains, deflections and load cellreadings continuously as shown in Fig.2. Threehydraulic jacks of capacity 250 kN, 100 kN and100 kN were provided at top, middle and bottomstories respectively for applying lateral loading.
Fig. 2- data acquisition system
Loading sequence and observations intesting- stage IThe frames were subjected to quasi static lateralreversed cyclic loading. The loading history forthe test frames was pre-determined whichconsisted of a series of step-wise increasing loadcycles as shown in Fig.3. Loading cycles werekept symmetric, as the strength of the testspecimen was same in both directions, exceptfor the last cycle when the available stroke ofthe hydraulic jack in one direction was limited.The load was applied by 250 kN, 100 kN and100 kN hydraulic jacks at top, middle andbottom stories along the centerline of the beams.In the initial cycle, 4.905 kN load was appliedat each storey level. The load increment in thesubsequent cycles was at 9.81 kN per cycle. Inthe final cycle, the frame could sustain a baseshear of 91.233 kN with large lateral deflection.The testing was stopped at this stage and loadwas gradually released. The maximumdeflection at the top storey was 62.86 mm fromthe neutral position. At this stage beam-columnjoints were severely distressed and visible crackswere developed. Loading was released andframes were subjected to retrofitting processwith ferrocement wrapping technique.
Fig. 3- loading history
Application of FerrocementGI hexagonal wire mesh of size ½ inch x 22gauge was used for ferrocement application. Thebeam-column joints was thoroughly cleanedusing wire brush and roughened using a chiselto get adequate bond. Two layers of mesh werecarefully wrapped tightly over the requiredlength (2 times effective depth of section) using
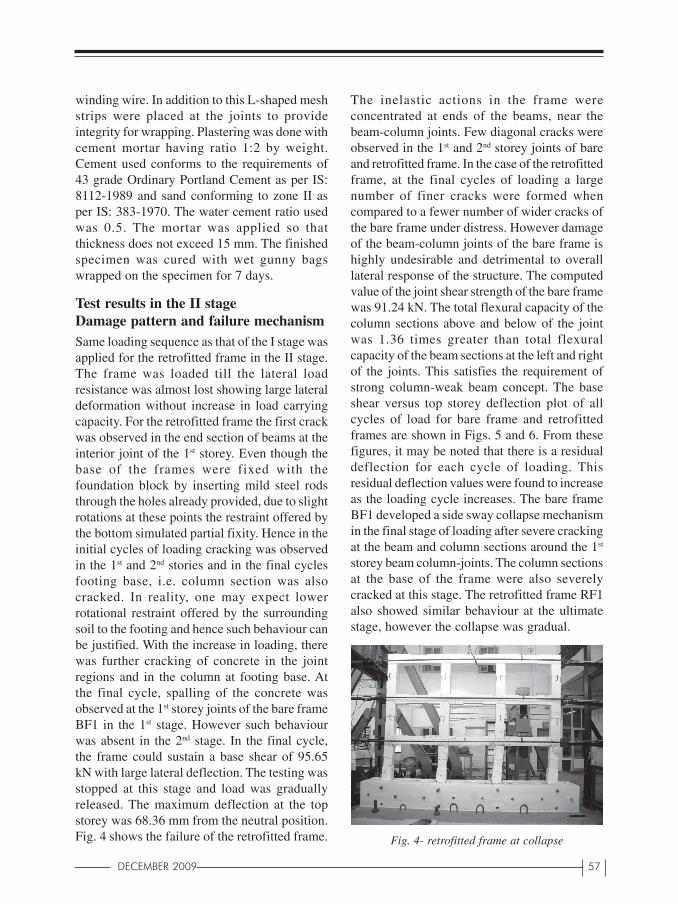
DECEMBER 2009 57
winding wire. In addition to this L-shaped meshstrips were placed at the joints to provideintegrity for wrapping. Plastering was done withcement mortar having ratio 1:2 by weight.Cement used conforms to the requirements of43 grade Ordinary Portland Cement as per IS:8112-1989 and sand conforming to zone II asper IS: 383-1970. The water cement ratio usedwas 0.5. The mortar was applied so thatthickness does not exceed 15 mm. The finishedspecimen was cured with wet gunny bagswrapped on the specimen for 7 days.
Test results in the II stageDamage pattern and failure mechanismSame loading sequence as that of the I stage wasapplied for the retrofitted frame in the II stage.The frame was loaded till the lateral loadresistance was almost lost showing large lateraldeformation without increase in load carryingcapacity. For the retrofitted frame the first crackwas observed in the end section of beams at theinterior joint of the 1st storey. Even though thebase of the frames were fixed with thefoundation block by inserting mild steel rodsthrough the holes already provided, due to slightrotations at these points the restraint offered bythe bottom simulated partial fixity. Hence in theinitial cycles of loading cracking was observedin the 1st and 2nd stories and in the final cyclesfooting base, i.e. column section was alsocracked. In reality, one may expect lowerrotational restraint offered by the surroundingsoil to the footing and hence such behaviour canbe justified. With the increase in loading, therewas further cracking of concrete in the jointregions and in the column at footing base. Atthe final cycle, spalling of the concrete wasobserved at the 1st storey joints of the bare frameBF1 in the 1st stage. However such behaviourwas absent in the 2nd stage. In the final cycle,the frame could sustain a base shear of 95.65kN with large lateral deflection. The testing wasstopped at this stage and load was graduallyreleased. The maximum deflection at the topstorey was 68.36 mm from the neutral position.Fig. 4 shows the failure of the retrofitted frame.
The inelastic actions in the frame wereconcentrated at ends of the beams, near thebeam-column joints. Few diagonal cracks wereobserved in the 1st and 2nd storey joints of bareand retrofitted frame. In the case of the retrofittedframe, at the final cycles of loading a largenumber of finer cracks were formed whencompared to a fewer number of wider cracks ofthe bare frame under distress. However damageof the beam-column joints of the bare frame ishighly undesirable and detrimental to overalllateral response of the structure. The computedvalue of the joint shear strength of the bare framewas 91.24 kN. The total flexural capacity of thecolumn sections above and below of the jointwas 1.36 times greater than total flexuralcapacity of the beam sections at the left and rightof the joints. This satisfies the requirement ofstrong column-weak beam concept. The baseshear versus top storey deflection plot of allcycles of load for bare frame and retrofittedframes are shown in Figs. 5 and 6. From thesefigures, it may be noted that there is a residualdeflection for each cycle of loading. Thisresidual deflection values were found to increaseas the loading cycle increases. The bare frameBF1 developed a side sway collapse mechanismin the final stage of loading after severe crackingat the beam and column sections around the 1st
storey beam column-joints. The column sectionsat the base of the frame were also severelycracked at this stage. The retrofitted frame RF1also showed similar behaviour at the ultimatestage, however the collapse was gradual.
Fig. 4- retrofitted frame at collapse
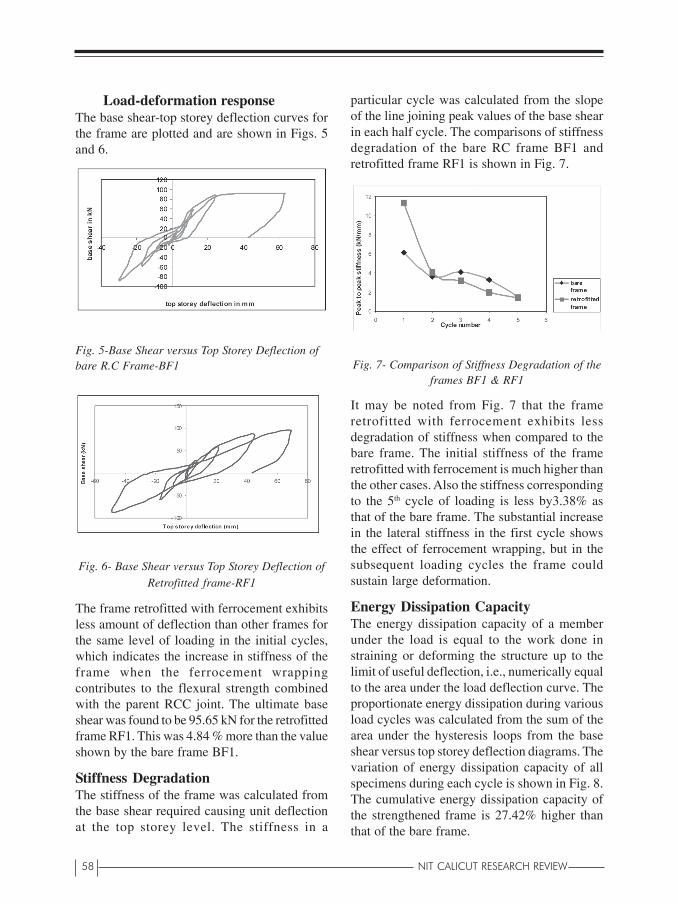
58 NIT CALICUT RESEARCH REVIEW
Load-deformation responseThe base shear-top storey deflection curves forthe frame are plotted and are shown in Figs. 5and 6.
Fig. 5-Base Shear versus Top Storey Deflection ofbare R.C Frame-BF1
Fig. 6- Base Shear versus Top Storey Deflection of
Retrofitted frame-RF1
The frame retrofitted with ferrocement exhibitsless amount of deflection than other frames forthe same level of loading in the initial cycles,which indicates the increase in stiffness of theframe when the ferrocement wrappingcontributes to the flexural strength combinedwith the parent RCC joint. The ultimate baseshear was found to be 95.65 kN for the retrofittedframe RF1. This was 4.84 % more than the valueshown by the bare frame BF1.
Stiffness DegradationThe stiffness of the frame was calculated fromthe base shear required causing unit deflectionat the top storey level. The stiffness in a
particular cycle was calculated from the slopeof the line joining peak values of the base shearin each half cycle. The comparisons of stiffnessdegradation of the bare RC frame BF1 andretrofitted frame RF1 is shown in Fig. 7.
Fig. 7- Comparison of Stiffness Degradation of theframes BF1 & RF1
It may be noted from Fig. 7 that the frameretrofitted with ferrocement exhibits lessdegradation of stiffness when compared to thebare frame. The initial stiffness of the frameretrofitted with ferrocement is much higher thanthe other cases. Also the stiffness correspondingto the 5th cycle of loading is less by3.38% asthat of the bare frame. The substantial increasein the lateral stiffness in the first cycle showsthe effect of ferrocement wrapping, but in thesubsequent loading cycles the frame couldsustain large deformation.
Energy Dissipation CapacityThe energy dissipation capacity of a memberunder the load is equal to the work done instraining or deforming the structure up to thelimit of useful deflection, i.e., numerically equalto the area under the load deflection curve. Theproportionate energy dissipation during variousload cycles was calculated from the sum of thearea under the hysteresis loops from the baseshear versus top storey deflection diagrams. Thevariation of energy dissipation capacity of allspecimens during each cycle is shown in Fig. 8.The cumulative energy dissipation capacity ofthe strengthened frame is 27.42% higher thanthat of the bare frame.
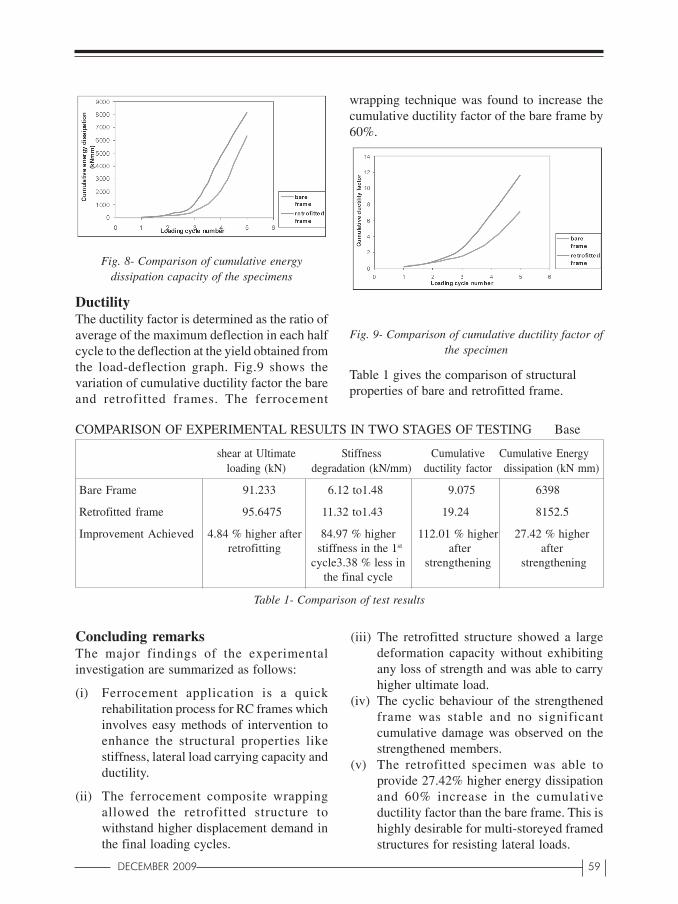
DECEMBER 2009 59
Fig. 8- Comparison of cumulative energydissipation capacity of the specimens
DuctilityThe ductility factor is determined as the ratio ofaverage of the maximum deflection in each halfcycle to the deflection at the yield obtained fromthe load-deflection graph. Fig.9 shows thevariation of cumulative ductility factor the bareand retrofitted frames. The ferrocement
wrapping technique was found to increase thecumulative ductility factor of the bare frame by60%.
Fig. 9- Comparison of cumulative ductility factor ofthe specimen
Table 1 gives the comparison of structuralproperties of bare and retrofitted frame.
Concluding remarksThe major findings of the experimentalinvestigation are summarized as follows:
(i) Ferrocement application is a quickrehabilitation process for RC frames whichinvolves easy methods of intervention toenhance the structural properties likestiffness, lateral load carrying capacity andductility.
(ii) The ferrocement composite wrappingallowed the retrofitted structure towithstand higher displacement demand inthe final loading cycles.
COMPARISON OF EXPERIMENTAL RESULTS IN TWO STAGES OF TESTING Base
shear at Ultimate Stiffness Cumulative Cumulative Energyloading (kN) degradation (kN/mm) ductility factor dissipation (kN mm)
Bare Frame 91.233 6.12 to1.48 9.075 6398
Retrofitted frame 95.6475 11.32 to1.43 19.24 8152.5
Improvement Achieved 4.84 % higher after 84.97 % higher 112.01 % higher 27.42 % higherretrofitting stiffness in the 1st after after
cycle3.38 % less in strengthening strengtheningthe final cycle
Table 1- Comparison of test results
(iii) The retrofitted structure showed a largedeformation capacity without exhibitingany loss of strength and was able to carryhigher ultimate load.
(iv) The cyclic behaviour of the strengthenedframe was stable and no significantcumulative damage was observed on thestrengthened members.
(v) The retrofitted specimen was able toprovide 27.42% higher energy dissipationand 60% increase in the cumulativeductility factor than the bare frame. This ishighly desirable for multi-storeyed framedstructures for resisting lateral loads.

60 NIT CALICUT RESEARCH REVIEW
Hence the ferrocement retrofitting technique canbe adopted as an efficient and effective methodof retrofitting of RCC frames
5. References1. Bracci, J.M., Reinhorn, A.M., and Mander,
J.B., “Seismic retrofit of reinforced concretebuildings designed for gravity loads:performance of structural model,” ACIstructural Journal,November-December1995,pp.711-723.
2. Paramasivam,P.,Lim,C.T.E., andOng,K.C.G.,“Strengthening of RC beams withferrocement laminates,”Cement and ConcreteComposites, 1998,pp.53-65.
3. Alpa S; “Seismic Retrofitting byConventional Methods”; ICJ, August, 2002;489-495.
4. Yong Lu; “Comparative Study of SeismicBehaviour of Multi-storey ReinforcedConcrete Framed Structures”; J. StructuralEngineering, February, 2002; 169-178.
5. R o c h a , P. , D e i g a d o , P. , C o s t a , A . , a n dDelgado,R., “Seismic retrofit of RCframes,” Computers and Structures,May 2004,pp.1523-;1534.
6. Arulselvan S, Perumal E B P, SubramanianK, and Shanthakumar A R; “ExperimentalInvestigation on Two Dimensional RCInfilled Frame-RC Plane Frame Interactionfor Seismic Resistance”; Proceedings ofNational Conference, EQADS-2006; B.43 –B.55.
7. Huang C H, Sung Y C; “Experimental Studyand Modelling Masonry-Infilled Concretewith and without CFRP Jacketing”; StructuralEngineering and Mechanics, Vol 22, No.4;November; 2006; 449-467.
8. Kien Vinh Duong et al., “Seismic Behaviorof Shear-Critical Reinforced Concrete Frame:Experimental Investigation,”ACI StructuralJournal,May-June 2007,pp.304-313.
9. Stefano Pampanin, Davide Bolognini, andAlberto Pavese, “ Performance based retrofitstrategy for existing reinforced concreteframe systems using fiber reinforced polymercomposites ,” ASCE Journal of Composites
for Construction, March-April 2007, pp.211-226.
10.Alexandros G. Tsonos., “Cyclic LoadBehavior of Reinforced Concrete Beam-Column Subassemblages of ModernStructures,”ACI Structural Journal,July-August 2007,pp.468-478.