hvem signalling promotes colitis filehvem signalling promotes colitis corinne schaer1, stefanie...
TRANSCRIPT
HVEM Signalling Promotes ColitisCorinne Schaer1, Stefanie Hiltbrunner1, Bettina Ernst1, Christoph Mueller2, Michael Kurrer3, Manfred
Kopf1, Nicola L. Harris4*
1 Molecular Biomedicine, Institute of Integrative Biology, Swiss Federal Institute of Technology, Zurich, Switzerland, 2 Institute of Pathology, University of Bern, Bern,
Switzerland, 3 Institute of Pathology, Cantonal Hospital Aarau, Aarau, Switzerland, 4 Swiss Vaccine Research Institute and Global Health Institute, Ecole Polytechnique
Federale, Lausanne, Switzerland
Abstract
Background: Tumor necrosis factor super family (TNFSF) members regulate important processes involved in cellproliferation, survival and differentiation and are therefore crucial for the balance between homeostasis and inflammatoryresponses. Several members of the TNFSF are closely associated with inflammatory bowel disease (IBD). Thus, theyrepresent interesting new targets for therapeutic treatment of IBD.
Methodology/Principal Findings: We have used mice deficient in TNFSF member HVEM in experimental models of IBD toinvestigate its role in the disease process. Two models of IBD were employed: i) chemical-induced colitis primarily mediatedby innate immune cells; and ii) colitis initiated by CD4+CD45RBhigh T cells following their transfer into immuno-deficientRAG1-/- hosts. In both models of disease the absence of HVEM resulted in a significant reduction in colitis and inflammatorycytokine production.
Conclusions: These data show that HVEM stimulatory signals promote experimental colitis driven by innate or adaptiveimmune cells.
Citation: Schaer C, Hiltbrunner S, Ernst B, Mueller C, Kurrer M, et al. (2011) HVEM Signalling Promotes Colitis. PLoS ONE 6(4): e18495. doi:10.1371/journal.pone.0018495
Editor: Lena Alexopoulou, Centre d’Immunologie de Marseille-Luminy, CNRS-Inserm, France
Received October 22, 2010; Accepted March 8, 2011; Published April 18, 2011
Copyright: � 2011 Schaer et al. This is an open-access article distributed under the terms of the Creative Commons Attribution License, which permitsunrestricted use, distribution, and reproduction in any medium, provided the original author and source are credited.
Funding: N. Harris is supported by the Swiss Vaccine Research Institute (http://www.swissvaccineresearchinstitute.ch/). The project was funded by a researchgrant (no. TH-1407-3) from the Swiss Federal Institute of Technology (http://www.ethz.ch/index_EN). The funders had no role in study design, data collection andanalysis, decision to publish, or preparation of the manuscript.
Competing Interests: The authors have declared that no competing interests exist.
* E-mail: [email protected]
Introduction
Members of the TNFSF play a central role in the regulation of
immune responses by providing signals involved in differentiation,
activation, survival and homeostasis of immune cells [1]. HVEM
can promote T cell proliferation and IFNc production [2,3], and
has been linked to IFNc production by human mucosal T cells [4].
HVEM has a widespread expression, being present on most
hematopoietic cells in addition to some stromal and epithelial cells
[5,6]. HVEM has multiple ligands, however LIGHT is thought to
be the predominant ligand delivering stimulatory signals in vivo [7].
LIGHT is expressed by activated T cells, immature DCs and
monocytes [3], and binds to both HVEM and lymphotoxin breceptor (LTbR) which is present on stromal cells and some
hematopoietic cells including DCs and monocytes [7]. LIGHT has
been shown to induce the maturation of DCs as well as NK cell
proliferation [8,9]. LIGHT-deficient mice exhibit defective T cell
proliferation and activation in vitro [3], and fail to reject MHC-
mismatched cardiac allografts coinciding with decreased intragraft
expression of IFNc [10]. However, LIGHT-deficient mice display
normal immune responses following infection with Mycobacterium
tuberculosis [11] or influenza A [12], suggesting that LIGHT may
regulate some cellular responses whilst being superfluous for others.
LIGHT is contained within a region of the human chromosome
19p13.3 identified as a susceptibility locus for IBD [13], and
LIGHT mRNA transcripts are over-expressed in inflamed biopsies
from IBD patients [14]. In an experimental model of IBD,
transgenic over-expression of LIGHT on T cells resulted in a
lymphoid proliferative disorder, widespread autoimmune disease
and development of severe intestinal inflammation [15]. Intestinal
inflammation driven by transgenic over-expression of LIGHT was
found to involve signalling to both HVEM expressed by T cells
and LTbR expressed by stromal cells [15]. Collectively, these data
implicate, but do not prove, a role for HVEM stimulatory
interactions in promoting intestinal inflammation.
In the current study we subjected mice deficient for LIGHT or
HVEM to Dextran sulfate sodium (DSS)-induced colitis and
investigated the impact of gene deficiency on diarrhea, ulcerations
and cellular infiltration of the colon. Additionally, we compared
the ability of wildtype C57BL/6 or HVEM-/- and LIGHT-/-
CD4+CD45RBhigh T cells to mediate experimental colitis following
their transfer into immuno-compromised RAG1-/- hosts. Our data
demonstrates that HVEM-mediated stimulatory signals are essential
for promoting innate and adaptive immune cell activation, pro-
inflammatory cytokine production and intestinal pathology.
Materials and Methods
MiceC57BL/6 mice, HVEM-/- [16] mice and LIGHT-/- [10] mice
were bred and maintained under specific pathogen-free (SPF)
PLoS ONE | www.plosone.org 1 April 2011 | Volume 6 | Issue 4 | e18495
conditions at Bio-Support (Zurich, Switzerland). HVEM-/- and
LIGHT-/- mice were backcrossed for 9 generations to C57BL/6
background. RAG1-/- (C57BL/6) mice were purchased from the
Institute for Laboratory Animal Science, University of Zurich.
Congenic CD45.1-allelic C57BL/6 mice were purchased from
Jackson Laboratory. All mice used in this study were 5–8 weeks
old. Mice from different genotypes were housed within the same
cage or bedding from the cages of male mice was mixed for at least
2–3 weeks prior to all the experiments.
Ethics StatementAll animal procedures were approved by the local animal
committee Kantonales Veterinaramt Zurich, protocol no. 3282,
and performed in accordance with our institutional guidelines.
DSS- induced experimental colitisAcute colitis was induced in age-matched C57BL/6, HVEM-/-,
LIGHT-/- and RAG1-/- mice, by oral administration of Dextran
sulfate sodium (DSS) (MP Biomedicals) at a concentration of 5%
(w/v) in drinking water for 4 days. Age-matched C57BL/6,
HVEM-/- and LIGHT-/- mice receiving normal drinking water
served as controls. Mice were evaluated daily for changes in body
weight or the development of clinical symptoms. Six days after the
induction of colitis mice were sacrificed by CO2 inhalation, the
abdominal cavity was exposed and the entire colon was removed
from the cecum to the anus. As the distal colon is the main site of
inflammation in the DSS model [17], the distal colon was analyzed
for inflammation by mRNA expression for inflammatory cytokines
and by histology.
Experimental colitis induced by CD4+ T cellsT cell-mediated colitis was induced by transferring 46105
CD4+CD25-CD45RBhigh T cells into RAG1-/- mice. Cells isolated
from spleen cell preparations were labeled with anti-CD4 micro-
beads and separated by positive selection on a magnetic column,
according to the manufacturer’s instructions (Miltenyi Biotech).
Purified CD4+ T cells were then labeled with CD4, CD25 and
CD45RB antibodies and sorted for CD4+CD25-CD45RBhigh
population on a FACS Vantage (BD Biosciences). The purity of
FACS sorted CD4+CD25-CD45RBhigh cells was routinely $98%.
Mice were sacrificed at 14 days, 28 days, or 6–8 weeks post
transfer. In preliminary experiments the colon was divided into 3
parts and each part analyzed for inflammation by mRNA
expression for inflammatory cytokines and by histology. As the
middle section was repeatedly the most inflamed section in all mice
we only analyzed this portion in later experiments and data is
shown only for this section.
Assessment of the clinical activity score during DSS-induced colitis
Assessment of body weight, stool consistency and the presence of
occult/gross blood by a guaiac test (Hemoccult Sensa; Beckman
Coulter) were determined at the day of sacrifice for all mice. Colitis
was quantified with a clinical score, as described by Cooper et al.
[17], using the parameters of weight loss, stool consistency and fecal
blood. Briefly, weight loss was considered as negligible (0 points), 1–
5% (1 point), 5–10% (2 points), 10–15% (3 points) or $15%
(necessitating sacrifice and given 4 points). Stool character was
characterized as normal (0 points), soft with well-formed pellets (2
points), or diarrhea (4 points). For occult blood, scores were given as
an absence of blood (0 points), a positive hemoccult score (2 points)
or gross bleeding (4 points). The scores for each individual parameter
were then added together to give a total score between 0 and 12.
Histological assessment of colitisColonic specimens obtained as described were fixed in formalin
for at least 24 hours, embedded into paraffin, and cut into 4–5 mm
sections. Sections were then stained with hematoxylin and eosin
(H&E) for blind microscopic assessment of mucosal lesions.
Histological scoring for DSS colon sections was performed, with
slight modifications, as previously described by Schenk et al. [18].
Briefly, for inflammation scores were given as rare inflammatory
cells in the lamina propria (0 points), increased numbers of
lymphocytes and granulocytes in the lamina propria (1 point),
confluence of inflammatory cells extending into the submucosa (2
points), or transmural extension of the infiltrate (3 points). For
crypt damage scores reflected intact crypts (0 points), loss of every
third crypt (1 point), loss of two out of three crypts (2 points),
complete crypt loss (3 points), or change of epithelial surface with
epithelial erosion (4 points). For evaluation of the confluence of
epithelial erosion scores reflected an absence of epithelial erosion
(0 points), 1–2 foci of epithelial erosion (1 point), 3–4 foci (2
points), or confluent epithelial erosion (3 points). The scores for
each individual parameter were then added together to give a total
score between 0 and 10.
Histological scoring of colonic sections from the T cell transfer-
induced colitis model was determined according to the following
parameters. An estimated score was made based on first
impression (score from 0–3), loss of goblet cells (score from 0–4),
crypt abscesses (score from 0–3), mucosal thickness (score from 0–
3), cellular infiltration (score from 0–3) and epithelial erosions
(score from 0–2). The scores for each individual parameter were
then added together to give a total score between 0 and 18.
Cell isolation and Flow cytometryMLN single cell suspensions were obtained by mechanical
disruption through a 40 mM cell strainer (BD Biosciences). Colon
LP lymphocytes were isolated as previously described [19]. Briefly,
colon tissue was cut into 0.5 cm pieces and incubated at 37uC for
30 min. in PBS containing 0.5% BSA, 2% HEPES, 1%
NaPyruvate and 10 mM EDTA to remove epithelial cells. The
remaining tissue was further digested in complete IMDM medium
containing 10% FCS and 1.5 mg Collagenase VIII (Sigma
Aldrich) for 20 min. at 37uC and then smashed through a cell
strainer. Cells were stained with surface antibodies diluted in PBS
with 0.5% BSA (Sigma Aldrich). For intracellular staining cells
were fixed in BD lysis buffer (BD Biosciences), permeabilized using
0.5% Saponin (Sigma Aldrich) in 0.5% BSA/PBS and stained
with intracellular antibodies in 0.5% Saponin in 0.5% BSA/PBS.
For the analysis of cytokine production by intracellular staining
cells were first stimulated with PMA (Sigma-Aldrich) and
ionomycin (Sigma-Aldrich) for 4 h at 37uC in IMDM medium
plus 7% FCS. For the final two hours, Brefeldin A (10 mg/ml) was
added to the cultures to retain cytokines in the cytoplasm. Stained
cells were analyzed on FACS Calibur (BD Bioscience) or Cyan
(Dako Cytomation) flow cytometers using FlowJo software (Tree
Star). Fluorescently conjugated mAbs directed against CD4
(L3T4), CD25 (PC61), CD45RB (C363-16A), CD45.1 (A20), Ki-
67 (MOPC-21), IL-17A (TC11), IFNc (XMG1.2) and Foxp3
(FJK-16s) were purchased from eBiosciences.
Detection of cytokine mRNA expression by quantitativeRT-PCR
Total RNA was isolated from all colonic specimens obtained as
described using TRI Reagent (Molecular Research Center, Inc.)
and reverse transcribed using Superscript III RT kit (Invitrogen).
Transcribed cDNA was used as a template for the PCR reaction.
HVEM Signaling and Colitis
PLoS ONE | www.plosone.org 2 April 2011 | Volume 6 | Issue 4 | e18495

Real-time RT-PCR was performed using Brilliant SYBR Green
(Stratagene) and an iCycler (Bio-Rad Laboratories). Expression
was normalized according to expression of the housekeeping gene
b-Actin. Sequences of primers used: b-Actin; 59-CTT TTC ACG
GTT GGC CTT AG-39 and 59-CCC TGA AGT ACC CCA
TTG AAC-39, CCL3; 59-AGA TTC CAC GCC AAT TCA TC-
39 and 59-CCC AGG TCT CTT TGG AGT CA-39, CCL4; 59-
TTC TGT GCT CCA GGG TTC TC-39 and 59-AGC AAA
GAC TGC TGG TCT CA-39, CCL5; 59- CAA TCT TGC AGT
CGT GTT TG-39 and 59- AGA ATC AAG AAA CCC TCT
ATC-39, IL-6; 59-TTC CAT CCA GTT GCC TTC TTG-39 and
59-TCA TTT CCA CGA TTT CCC AGA G-39, IFNc; 59-GCT
CTG AGA CAA TGA ACG CTA C-39 and 59-TTC TAG GCT
TTC AAT GAC TGT GC-39, TNFa; 5-GAA CTG GCA GAA
GAG GCA CT-39 and 59-AGG GTC TGG GCC ATA GAA
CT-39, CXCL9, 59-GCA AAA GTG AGC TCC AGA AGG-39
and 59-AGC TTC CCA GAT CAC AGA GG-39.IL-6; 59-TTC
CAT CCA GTT GCC TTC TTG-39 and 59-TCA TTT CCA
CGA TTT CCC AGA G-39, IL-12p40; 59-TAC AGT TCA GGC
GCC GGA T-39 and 59-AGA GTT AAC CTG AGG TCC GCA-
39, TNFa; 5-GAA CTG GCA GAA GAG GCA CT-39 and 59-
AGG GTC TGG GCC ATA GAA CT-39, IL-21R; 59-TCT
GGA CCA TCA CCT GTG TC-39and 59-TTG TGG CCA
GAC CTG TGT AG-39, IL23R; 59-GCC AAG AAG ACC ATT
CCC GA-39 and 59-TCA GTG CTA CAA TCT TCT TCA
GAG GAC A-39 and IL-6R; 59-AAG AGT GAC TTC CAG
GTG CC-39 and 59-GGT ATC GAA GCT GGA ACT GC-39 .
Statistical AnalysisA two-tailed unpaired Student’s t test with a confidence interval
of 95% was performed on all data and are shown as p-values
p,0.05 (*), p,0.005 (**), or p,0.0005 (***).
Results
HVEM is required for DSS-induced colitisTo investigate the role of HVEM signaling during intestinal
inflammation mediated by innate immune cells, we examined the
response of HVEM-/- mice to DSS-induced intestinal damage. In
this model, administration of DSS in the drinking water results in
weight loss, intestinal epithelial cell damage and immune-mediated
colonic inflammation. As expected wild type C57BL/6 mice
exhibited severe weight loss and intestinal inflammation following
acute DSS administration (Figure 1A). In contrast HVEM-/- mice
exhibited significantly reduced weight loss and reduced rectal
bleeding following DSS treatment (Figure 1A&B). In addition,
HVEM-/- mice showed attenuated intestinal immuno-pathology as
determined by histological analysis of leukocyte infiltration, crypt
destruction and epithelial erosion within the colon (Figure 1C&D).
Importantly, the absence of inflammation in HVEM-/- mice was
Figure 1. HVEM-/- mice are resistant to DSS-induced colitis. C57BL/6, HVEM-/- and LIGHT-/- mice were given 5% DSS in the drinking water for 4days, then returned to normal drinking water and sacrificed at day 6. (A) Body weight loss was monitored daily and is expressed as percentagechange from initial body weight at day 0 for C57BL/6 (closed squares), HVEM-/- (open circles) or LIGHT-/- (closed circles). (B) Clinical activity scores wereassessed at the time of sacrifice by a combination of total weight loss, stool character and occult blood. (C) Histological scores indicating immuno-pathology were calculated as described in the Materials and Methods and are shown for the distal part of the colon of individual mice for C57BL/6(closed squares), HVEM-/- (open circles) or LIGHT-/- (closed circles). (D) Representative H&E staining of distal colon tissue sections from control andDSS-treated mice. Scale bars are 106magnification = 200 mm and 406magnification = 0.05 mm. Data in (A), (B) and (C) represent the mean 6 SD ofone experiment (n = 4-6 mice per group) out of three independent experiments. Statistically significant differences between groups were assessed bya two tailed Student’s t test: *p,0.05, **p,0.005, ***p,0.0005.doi:10.1371/journal.pone.0018495.g001
HVEM Signaling and Colitis
PLoS ONE | www.plosone.org 3 April 2011 | Volume 6 | Issue 4 | e18495

not due to a delayed response, as mice did not exhibit weight loss
even at late time points following DSS administration. Although
DSS-induced intestinal inflammation can lead to the activation
and recruitment of T cells, the disease is mediated largely by the
activation of innate immune cells [20,21]. Taken together, these
data demonstrate that HVEM-mediated stimulatory signals are
necessary to promote the activation of innate immune responses
responsible for disease induction.
LIGHT is thought to represent a major HVEM stimulatory
ligand. We therefore additionally investigated DSS-induced intes-
tinal inflammation in LIGHT-/- mice. LIGHT-/- mice exhibited an
intermediate phenotype showing less severe inflammation than
C57BL/6 mice, but significantly more severe inflammation than
that observed for HVEM-/- mice (Figure 1A–D).
To further assess the impact of HVEM on immunity during
DSS-induced intestinal inflammation we analyzed the production
of chemokines and pro-inflammatory cytokines within the
intestine. DSS-induced production of CCL3 (MIP-1a), CCL4
(MIP-1b), CCL5 (RANTES), IFNc, TNFa, IL-6 and CXCL9 was
severely attenuated in the absence of HVEM (Figure 2A-G). These
cytokines and chemokines are largely produced by local DC,
monocytes and stromal cells, NK cells and/or T cells and their
attenuation in the absence of HVEM indicates that HVEM is
required for both innate and adaptive immune cell activation in
this model. Chemokine and cytokine expression in LIGHT-/- mice
was highly variable but overall there was a non-significant
decrease compared to C57BL/6 mice, and a non-significant
increase as compared to HVEM-/- mice (Figure 2A-G).
These data suggested that HVEM could signal directly to
innate immune cells within the intestine to promote the
production of pro-inflammatory cytokines and chemokines
following DSS administration. The intermediate phenotype of
LIGHT-/- mice - in terms of chemokine and cytokine expression,
weight loss and intestinal immuno-pathology - indicated that
LIGHT only partially accounts for HVEM-mediated stimulatory
signals in our model and raises the possibility that additional
HVEM-stimulatory ligands contribute to intestinal inflammation
in vivo.
Figure 2. HVEM is required for DSS-induced pro-inflammatory cytokine and chemokine production. C57BL/6, HVEM-/- and LIGHT-/- micewere given 5% DSS in the drinking water for 4 days, then returned to normal drinking water. At day 6 mice were sacrificed and the colon removed forRNA isolation. (A) CCL3, (B) CCL4, (C) CCL5, (D) IFNc, (E) TNFa, (F) IL-6 and (G) CXCL9 gene expression in the distal colon was analyzed by quantitativeRT-PCR for C57BL/6 (black bar), HVEM-/- (grey bar) and LIGHT-/- (white bar) mice. For each individual sample, gene expression was normalized relativeto b-Actin. Values represent fold increases in mRNA expression over the corresponding untreated controls. Means 6 SD are shown for twoindependent experiments (n = 8–10 mice per group) out of three independent experiments. Statistically significant differences between groups wereassessed by a two tailed Student’s t test: *p,0.05, **p,0.005, ***p,0.0005.doi:10.1371/journal.pone.0018495.g002
HVEM Signaling and Colitis
PLoS ONE | www.plosone.org 4 April 2011 | Volume 6 | Issue 4 | e18495
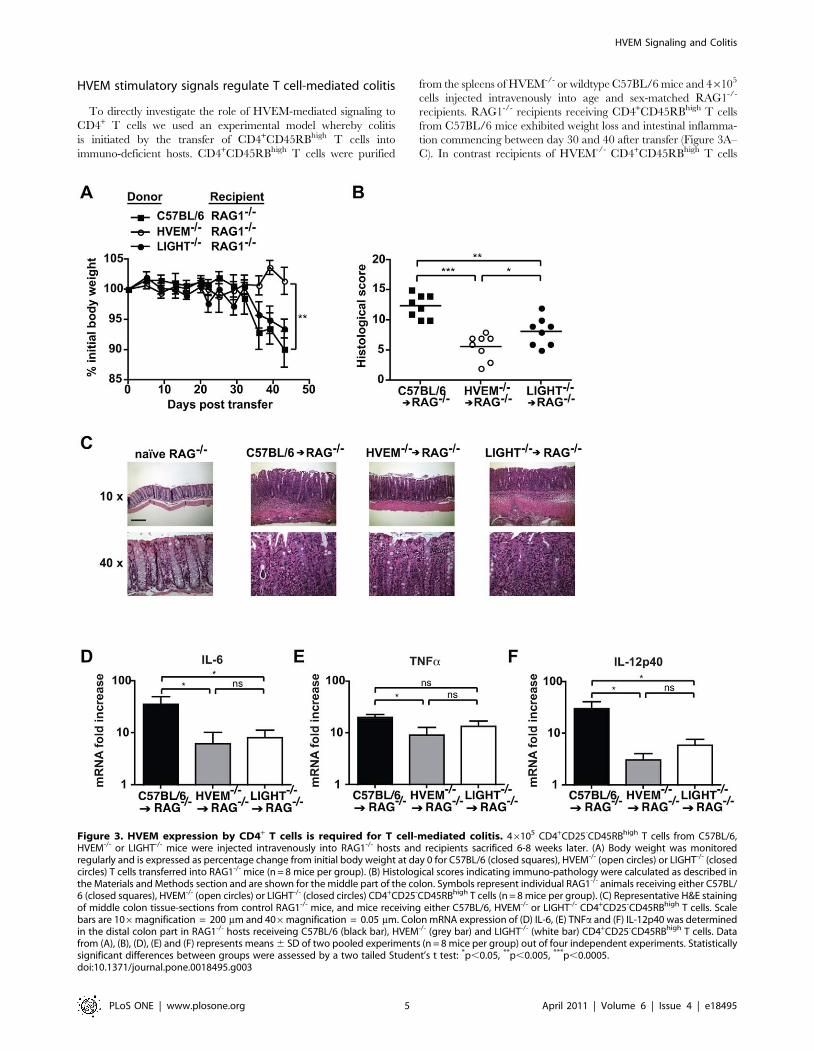
HVEM stimulatory signals regulate T cell-mediated colitis
To directly investigate the role of HVEM-mediated signaling to
CD4+ T cells we used an experimental model whereby colitis
is initiated by the transfer of CD4+CD45RBhigh T cells into
immuno-deficient hosts. CD4+CD45RBhigh T cells were purified
from the spleens of HVEM-/- or wildtype C57BL/6 mice and 46105
cells injected intravenously into age and sex-matched RAG1-/-
recipients. RAG1-/- recipients receiving CD4+CD45RBhigh T cells
from C57BL/6 mice exhibited weight loss and intestinal inflamma-
tion commencing between day 30 and 40 after transfer (Figure 3A–
C). In contrast recipients of HVEM-/- CD4+CD45RBhigh T cells
Figure 3. HVEM expression by CD4+ T cells is required for T cell-mediated colitis. 46105 CD4+CD25-CD45RBhigh T cells from C57BL/6,HVEM-/- or LIGHT-/- mice were injected intravenously into RAG1-/- hosts and recipients sacrificed 6-8 weeks later. (A) Body weight was monitoredregularly and is expressed as percentage change from initial body weight at day 0 for C57BL/6 (closed squares), HVEM-/- (open circles) or LIGHT-/- (closedcircles) T cells transferred into RAG1-/- mice (n = 8 mice per group). (B) Histological scores indicating immuno-pathology were calculated as described inthe Materials and Methods section and are shown for the middle part of the colon. Symbols represent individual RAG1-/- animals receiving either C57BL/6 (closed squares), HVEM-/- (open circles) or LIGHT-/- (closed circles) CD4+CD25-CD45RBhigh T cells (n = 8 mice per group). (C) Representative H&E stainingof middle colon tissue-sections from control RAG1-/- mice, and mice receiving either C57BL/6, HVEM-/- or LIGHT-/- CD4+CD25-CD45RBhigh T cells. Scalebars are 106magnification = 200 mm and 406magnification = 0.05 mm. Colon mRNA expression of (D) IL-6, (E) TNFa and (F) IL-12p40 was determinedin the distal colon part in RAG1-/- hosts receiveing C57BL/6 (black bar), HVEM-/- (grey bar) and LIGHT-/- (white bar) CD4+CD25-CD45RBhigh T cells. Datafrom (A), (B), (D), (E) and (F) represents means 6 SD of two pooled experiments (n = 8 mice per group) out of four independent experiments. Statisticallysignificant differences between groups were assessed by a two tailed Student’s t test: *p,0.05, **p,0.005, ***p,0.0005.doi:10.1371/journal.pone.0018495.g003
HVEM Signaling and Colitis
PLoS ONE | www.plosone.org 5 April 2011 | Volume 6 | Issue 4 | e18495

exhibited a clear resistance to weight loss (Figure 3A). Analysis of
histopathology showed clear intestinal pathology in recipients
of HVEM-/- CD4+CD45RBhigh T cells, however this was sig-
nificantly reduced compared to RAG1-/- mice receiving C57BL/6
CD4+CD45RBhigh T cells (Figure 3B&C). The presence of some
degree of intestinal inflammation in recipients of HVEM-/-
CD4+CD45RBhigh T cells did not correlate with the absence of
weight loss. However this was not unexpected as it is well described
in this model that weight loss alone is not a reliable measure of
intestinal inflammation [22].
Since T cells are known to be a major source of LIGHT [23],
we additionally investigated the role of T cell-expressed LIGHT in
promoting intestinal inflammation. Transfer of CD4+CD45RBhigh
T cells from LIGHT-/- mice into RAG1-/- recipients did not
impact on weight loss (Figure 3A) but did reduce intestinal
inflammation (Figure 3B&C). Attenuated intestinal inflammation
observed following transfer of LIGHT-/- T cells was significant
when compared to mice receiving C57BL/6 T cells, but was not as
dramatic as that observed for mice receiving HVEM-/- T cells,
indicating that other sources of LIGHT, or additional HVEM
stimulatory ligands must exist.
To validate the reduced intestinal inflammation observed in
mice receiving HVEM-/- or LIGHT-/- CD4+CD45RBhigh T cells
we additionally investigated the production of pro-inflammatory
cytokines within the colon. All mice exhibited increased cytokine
production as compared to naıve RAG1-/- controls (Figure 3D–F).
However, mice receiving HVEM-/- T cells exhibited reduced
levels of IL-6, TNFa and IL-12p40 as compared to recipients that
received C57BL/6 naıve T cells, in the colon (Figure 3D, E&F).
Mice receiving LIGHT-/- T cells exhibited an intermediate
phenotype compared to both C57BL/6 and HVEM-/-
CD4+CD45RBhigh T cell-transferred mice, with significantly
reduced IL-6 plus IL-12p40 in the colon (Figure 3D&F) but
normal levels of TNFa (Figure 3E). Overall these data correlate
well with the relative degrees of intestinal immuno-pathology
observed in the same animals (Figure 3A–C) and reinforce our
observations that HVEM stimulatory signals to T cells promote
development of intestinal inflammation.
We next investigated the impact of HVEM or LIGHT
deficiency on the accumulation of T cells in the draining
mesenteric lymph node (MLN) and their production of inflam-
matory cytokines. Mice receiving C57BL/6, HVEM-/- or
LIGHT-/- CD4+CD45RBhigh T cells had similar percentages of
CD4+ T cells in the MLN (Figure 4A), however those mice
receiving HVEM-/- T cells had a decreased total number of CD4+
T cells present (Figure 4B). Both the percentage and total number
of CD4+ T cells producing IFNc or IL-17A was significantly
decreased in mice receiving HVEM-/- T cells as compared to mice
Figure 4. HVEM expression is required for the expansion and differentiation of CD4+ T cells during intestinal inflammation.CD4+CD25-CD45RBhigh T cells (46105) from C57BL/6, HVEM-/- or LIGHT-/- mice were injected intravenously into RAG1-/- hosts, recipients sacrificed 6-8weeks later and total MLN lymphocytes isolated. Frequency of (A) CD4+, (C) CD4+IFNc+ and (E) CD4+IL-17A+ T cells in C57BL/6 (closed circles and blackbar), HVEM-/- (grey circles and squattered bar) and LIGHT-/- (open circles and white bar) transferred RAG1-/- recipients were analyzed by flowcytometry using fluorescent marker-conjugated mAbs (n = 8 mice per group). Total numbers (indicated by # symbol) of (B) CD4+, (D) CD4+IFNc+, (F)CD4+IL-17A+ T cells in the MLN of RAG1-/- mice receiving either C57BL/6 (black bar), HVEM-/- (striped bar) or LIGHT-/- (white bar) CD4+CD25-CD45RBhigh
T cells were calculated (n = 8 mice per group). (G) Representative FACS profiles for IFNc and IL-17A production by C57BL/6, HVEM-/- or LIGHT-/- CD4+ Tcells isolated from the MLN of RAG1-/- recipients. Symbols and bar graphs represent means (6 SD) from two pooled experiments, and arerepresentative of four independent experiments. Statistical analysis between groups was assessed by a two tailed Student’s t test: *p,0.05,**p,0.005, ***p,0.0005.doi:10.1371/journal.pone.0018495.g004
HVEM Signaling and Colitis
PLoS ONE | www.plosone.org 6 April 2011 | Volume 6 | Issue 4 | e18495
receiving C57BL/6 T cells (Figure 4C–G). Selective deficiency of
LIGHT on CD4+ T cells did not impact significantly on the total
number of CD4+ T cells present in the MLN (Figure 4B), or on the
percentage of CD4+ T cells producing IFNc (Figure 4C) or IL-17A
(Figure 4E). Total numbers of IFNc+ or IL-17A+ LIGHT-/- T cells
were routinely observed to be decreased but this did not reach
statistical significance (Figure 4D&F). By contrast, no differences in
CD4+ T cell number and cytokine production were seen in
C57BL/6, HVEM-/- or LIGHT-/- CD4+ T cells obtained from
the spleen of transferred RAG1-/- recipient mice (data not shown).
These findings indicated that HVEM expression by CD4+ T cells
is required for their expansion, activation or survival within the
draining lymph nodes and for their effector function within the
intestine during experimental colitis. Our data also demonstrated
that the required HVEM-stimulatory signals were derived, at least
in part, by T cell-expressed LIGHT.
Attenuated CD4+ T cell expansion and cytokineproduction in the absence of HVEM stimulatory signalscannot be overcome by inflammatory conditions
We hypothesized that the decreased numbers of HVEM-/-
CD4+ T cells, and their inability to produce normal levels of
inflammatory cytokines, may result from inadequate T cell-
mediated DC activation and/or reduced production of pro-
inflammatory cytokines in recipient mice. To address this we
performed a co-transfer of equal numbers of HVEM-/- and
congenic C57BL/6 CD4+CD45RBhigh T cells into RAG1-/-
recipients. Mice receiving both sets of T cells developed severe
colitis similar to that observed in mice receiving C57BL/6 T cells
alone (data not shown). However, both the percentage and total
number of HVEM-/- CD4+ T cells was markedly reduced in both
the MLN (Figure 5A&B) and the spleen (Figure S1A&B) compared
to their C57BL/6 counterparts. HVEM deficiency also resulted in
reduced percentages and total numbers of IFNc+ or IL-17A+ cells
in the MLN (Figure 5C–G) and the spleen (Figure S1C–F). Thus,
in contrast to our original hypothesis the co-transfer of C57BL/6
T cells allowed for the full development of inflammatory C57BL/6
T cells capable of initiating intestinal inflammation, but these cells
acted in a competitive manner with HVEM-/- T cells to further
reduce their expansion.
HVEM-/- CD4+ T cells exhibit normal expansion at earlytime-points following their transfer into lymphopenichosts
Our earlier findings indicated that HVEM deficiency on CD4+
T cells results in an inherent defect in the ability of these cells to
expand and produce effector cytokines. We next set out to
determine whether this defect occurred due to a failure to undergo
homeostatic and/or spontaneous expansion following their
transfer into lymphopenic hosts, or whether it was related to a
defect in T cell activation and differentiation into effector cells. For
this purpose a time-course experiment was performed whereby
RAG1-/- recipients receiving HVEM-/- CD4+ T cells together with
congenic wildtype C57BL/6 CD4+ T cells were sacrificed at day
14, 28 and 50 following transfer. The percentage and total
numbers of CD4+ T cells was then determined and the fraction of
CD4+ T cells expressing the proliferation marker Ki-67 examined.
No differences in the percentage or total number of HVEM-/-
versus wildtype CD4+ T cells present in the draining MLN
(Figure 6A&B) or colon (Figure S2A&B) were observed at day 14
following transfer. The fraction of CD4+ T cells expressing Ki-67
was also similar for HVEM-/- and C57BL/6 cells (Figure 6C and
Figure S2C). At day 28 following transfer the total numbers of
HVEM-/- CD4+ T cells, and the percentage of these cells
expressing Ki-67 were not significantly different in the MLN
(Figure 6D&F) or colon (Fig. S2D&F). However a significant
reduction in the percentage of CD4+ HVEM-/- T cells relative to
C57BL/6 cells was noted for the MLN and colon at this time
(Figure 6E and Figure S2E). In keeping with the data presented in
Figure 5, both the percentage and total number of HVEM-/- T
cells was reduced compared to wildtype cells by day 50 post-
transfer (Figure 6G&H and Figure S2G&H). This correlated with
a decreased fraction of HVEM-/- CD4+ T cells expressing the
proliferation marker Ki-67 (Figure 6I and Figure S2I), and
attenuated production of IFNc and IL-17A (Figure 5). No
significant production of IFNc or IL-17A was noted for either
C57BL/6 or HVEM-/- T cells time-points earlier than day 50
(data not shown).
Taken together these data indicate that HVEM deficiency does
not alter the ability of CD4+ T cells to undergo expansion, or to
survive, during the first few weeks following their transfer into
lymphopenic hosts. Instead defective T cell responses in the
absence of HVEM appear to occur at approximately the same
time as inflammation begins, indicating that they result from a
reduced capacity to maintain expansion and to differentiate into
effector cells in the presence of ongoing intestinal inflammation.
Discussion
LIGHT-HVEM interactions have been previously implicated in
IBD but the therapeutic potential of targeting this stimulatory
pathway remains unclear. The aim of our study was to investigate
how LIGHT- and HVEM-mediated stimulatory signals regulate
intestinal immune responses during homeostasis or inflammation.
For this purpose we used two mouse models of intestinal
inflammation - where disease is driven primarily by innate cells
or by CD4+ T cells and thus replicate distinct components of
human IBD. These studies have allowed us to reveal that HVEM-
mediated co-stimulatory signals to both innate immune cells and
CD4+ T cells form an essential component of immune cell
activation, proliferation, pro-inflammatory cytokine production
and intestinal pathology.
Although we noted attenuated intestinal inflammation in the
absence of HVEM, it is important to keep in mind that HVEM
can also act as an inhibitory ligand. HVEM signaling to B and T
lymphocyte attenuator (BTLA) [24] and CD160 [25] can result in
an inhibition of T cell responses [24,25,26]. Indeed, inhibitory
signals mediated by HVEM have been postulated to explain
observations in HVEM-/- mice of increased mortality during
ConA-mediated autoimmune hepatitis [27], and increased
susceptibility to MOG peptide-induced experimental autoimmune
encephalomyelitis (EAE) [27]. In addition Steinberg et al. reported
a critical role for HVEM expression by stromal cells in preventing
intestinal inflammation following T cell transfer to immunodefi-
cient hosts [28]. In keeping with our own observations, these
authors saw a clear reduction in the histopathological score in the
colon of RAG-/- mice receiving HVEM or LIGHT deficient T
cells [28]. However, they also reported an accelerated onset of
intestinal inflammation following transfer of wildtype T cells into
HVEM and RAG double deficient mice. This anti-inflammatory
role of HVEM was determined to be mediated through T cell
expressed BTLA [28]. Taken together with our own experiments
these findings demonstrate that HVEM can mediate both pro- and
anti-inflammatory signals during intestinal inflammation. We
believe the most likely explanation of these collective data is that
HVEM stimulatory signals are required to turn-on immune
responses, whilst HVEM-mediated inhibitory signals function
HVEM Signaling and Colitis
PLoS ONE | www.plosone.org 7 April 2011 | Volume 6 | Issue 4 | e18495

largely to switch-off immune responses. Support for this hypothesis
comes from the finding that expression levels of the inhibitory
ligands BTLA and CD160 are increased on T cells following their
activation [24].
Although HVEM-mediated stimulatory signals were clearly
required for the full activation of innate cells during DSS-induced
colitis in our experiments, the exact identity of the stimulatory
ligand(s) remains unclear. LIGHT is a known stimulatory ligand
for HVEM, however LIGHT-/- mice only exhibited a partial
defect in intestinal inflammation indicating that an alternative
ligand must exist. LTa3 is produced by activated T-, B- and NK-
cells and has been reported to bind to HVEM in vitro [29].
Although not formally proven, it was postulated that LTa3
delivers stimulatory signals to HVEM based on the finding that
both LIGHT and LTa3 bind to the CRD2 and CRD3 regions of
HVEM [30]. Thus LTa3 and LIGHT together may deliver the
stimulatory signals necessary to promote inflammation. Paradox-
ically, LTa-deficient mice are reported to exhibit increased disease
severity following DSS administration suggestive of a regulatory
role for LTa in this model [31]. However, it should be kept in
mind that delineating a clear role for LTa3-HVEM interactions in
vivo is difficult as LTa forms a heterodimer with LTb which acts
to stimulate stromal cell-expressed LTb receptor (LTbR), an
interaction that is essential for lymphoid organogenesis and
organization (reviewed in [32]).
It is also possible that ligands other than LIGHT are responsible
for HVEM mediated stimulatory signals during T cell mediated
intestinal inflammation. In our experiments an absence of LIGHT
Figure 5. Attenuated HVEM-/- CD4+ T cell expansion and cytokine production cannot be overcome by the presence of C57BL/6 CD4+
T cells. Purified 46105 CD4+CD25-CD45RBhight T cells from congenic C57BL/6 (CD45.1+) and HVEM-/- (CD45.1-) mice were injected together at a 1:1ratio (26105 cells each genotype) into RAG1-/- recipients and mice were sacrificed 6-8 weeks later. Whole MLN cell suspensions from RAG1-/-
recipients were analyzed by flow cytometry and percentages of C57BL/6 (closed circles and black bar) and HVEM-/- (open circles and white bar) (A)CD4+, (C) CD4+IFNc+ and (E) CD4+IL-17A+ T cell lymphocytes assessed (n = 6 mice per group). Total numbers (indicated by # symbol) of C57BL/6(closed circles and black bar) or HVEM-/- (open circles and white bar) for (B) CD4+, (D) CD4+IFNc+ and (F) CD4+IL-17A+ T cells were calculated (n = 6mice per group). (G) Flow cytometry plots showing gating strategy to distinguish C57BL/6 (CD45.1+) from HVEM-/- (CD45.1-) MLN CD4+ T cellsrecovered from RAG1-/- recipients and representative plots of CD4+ T cell IFNc and IL-17A cytokine staining. Symbols and bar graphs represent means6 SD from two pooled experiments and are representative of three independent experiments. Statistical analysis between groups were calculatedusing the two tailed Student’s t test: *p,0.05, **p,0.005, ***p,0.0005.doi:10.1371/journal.pone.0018495.g005
HVEM Signaling and Colitis
PLoS ONE | www.plosone.org 8 April 2011 | Volume 6 | Issue 4 | e18495

on T cells did lead to a reduction in disease pathology but not to
the same degree as T cell HVEM deficiency. Of course additional
sources of LIGHT are likely to be present in the RAG1-/-
recipients in the form of resident innate cells (DCs, NK cells,
monocytes), and these sources may account for the remaining
disease observed in RAG1-/- mice receiving LIGHT-/- CD4+ T
cells. Alternatively, CD4+ T cells may be able to receive HVEM
stimulatory signals from other ligands such as LTa3. Lastly,
Although BTLA-HVEM signaling is recognized to deliver inhibitory
signals via HVEM, BTLA was recently shown to play a role in the
accumulation T cells following T cell transfer into immunodeficient
hosts [33]. This finding was attributed to an ability of BTLA to
provide intrinsic survival signals to T cells following ligation of
HVEM in a cis-complex and indicates than an absence of BTLA-
HVEM signals may also play a role in the inability of HVEM-/- T
cells to promote intestinal inflammation [33].
Figure 6. HVEM expression is required for the prolonged expansion of CD4+ T cells and differentiation of effector cells. 46105
CD4+CD25-CD45RBhight T cells from congenic C57BL/6 (CD45.1+) and HVEM-/- (CD45.1-) mice were injected together at a 1:1 ratio (26105 cells eachgenotype) into RAG1-/- recipients and mice were sacrificed at the indicated time points following transfer. MLN lymphocyte suspensions werecounted and the total number (indicated by # symbol) of transferred C57BL/6 (CD45.1+, black bar) or HVEM-/- (CD45.1-, white bar) CD4+ T cellsdetermined. CD4+ T cell numbers at (A) day 14, (D) day 28 and (G) day 50 post transfer into RAG1-/- recipient mice are shown. Frequencies ofC57BL/6 (CD45.1+, black bar) or HVEM-/- (CD45.1-, white bar) CD4+ T cells were assessed by flow cytometry at (B) day 14, (E) day 28 and (H) day 50after injection into RAG1-/- mice. Expression of the proliferation marker Ki-67 by C57BL/6 (CD45.1+, black bar) or HVEM-/- (CD45.1-, white bar) CD4+ Tcells. Data represent means 6 SD of two pooled experiments (n = 6 mice per group) and are representative of three independent experiments.Statistically significant differences between groups (n = 6 mice per group) were assessed by a two tailed Student’s t test: *p,0.05, **p,0.005,***p,0.0005.doi:10.1371/journal.pone.0018495.g006
HVEM Signaling and Colitis
PLoS ONE | www.plosone.org 9 April 2011 | Volume 6 | Issue 4 | e18495
Supporting Information
Figure S1 Reduced HVEM-/- CD4+ T cell expansion andcytokine production in spleen cannot be overcome by thepresence of C57BL/6 CD4+ T cells. Purified 46105
CD4+CD25-CD45RBhigh T cells from congenic C57BL/6
(CD45.1+) and HVEM-/- (CD45.1-) mice were injected together
at a 1:1 ratio (26105 cells each genotype) into RAG1-/- recipients
and mice were sacrificed 6-8 weeks later. Whole spleen cell
suspensions from RAG1-/- recipients were analyzed by flow
cytometry and percentages of C57BL/6 (closed circles and black
bar) and HVEM-/- (open circles and white bar) (A) CD4+, (C)
CD4+IFNc+ and (E) CD4+IL-17A+ T cell lymphocytes assessed
(n = 6 mice per group). Total numbers (indicated by # symbol) of
C57BL/6 (closed circles and black bar) or HVEM-/- (open circles
and white bar) for (B) CD4+, (D) CD4+IFNc+ and (F) CD4+IL-
17A+ T cells were calculated (n = 6 mice per group). Symbols and
bar graphs represent means 6 SD from one experiment. Statistical
analysis between groups were calculated using the two tailed
Student’s t test: *p,0.05, **p,0.005, ***p,0.0005.
(TIF)
Figure S2 HVEM expression is required for the expan-sion of CD4+ T cells in the colon during intestinalinflammation. 46105 CD4+CD25-CD45RBhight T cells from
congenic C57BL/6 (CD45.1+) and HVEM-/- (CD45.1-) mice were
injected together at a 1:1 ratio into RAG1-/- recipients and mice
sacrificed at the indicated time points after transfer. Colon lamina
propria suspensions were counted and the total number (indicated
by # symbol) of transferred C57BL/6 (CD45.1+, black bar) or
HVEM-/- (CD45.1-, white bar) CD4+ T cells calculated. CD4+ T
cell number at (A) day 14, (D) day 28 and (G) day 50 post transfer
into RAG1-/- recipient mice. Frequencies of C57BL/6 (CD45.1+,
black bar) or HVEM-/- (CD45.1-, white bar) CD4+ T cells were
assessed by flow cytometry at (B) day 14, (E) day 28 and (H) day 50
after injection into RAG1-/- mice. Expression of the proliferation
marker Ki-67 by C57BL/6 (CD45.1+, black bar) or HVEM-/-
(CD45.1-, white bar) CD4+ T cells was analyzed by flow cytometry
at (C) day 14, (F) day 28 and (I) day 50 after injection. Data
represent means 6 SD of two pooled experiments (n = 6 mice per
group) and are representative of three independent experiments.
Statistically significant differences between groups (n = 6 mice per
group) were assessed by a two tailed Student’s t test: *p,0.05,**p,0.005, ***p,0.0005.
(TIF)
Acknowledgments
We thank Anthony J. Coyle for providing the HVEM-/- and LIGHT-/-
mice.
Author Contributions
Conceived and designed the experiments: CS NLH. Performed the
experiments: CS SH BE. Analyzed the data: CS NLH M. Kurrer CM.
Contributed reagents/materials/analysis tools: M. Kopf. Wrote the paper:
CS NLH.
References
1. Mackay F, Kalled SL (2002) TNF ligands and receptors in autoimmunity: an
update. Curr Opin Immunol 14: 783–790.
2. Scheu S, Alferink J, Potzel T, Barchet W, Kalinke U, et al. (2002) Targeted
disruption of LIGHT causes defects in costimulatory T cell activation andreveals cooperation with lymphotoxin beta in mesenteric lymph node genesis.
J Exp Med 195: 1613–1624.
3. Tamada K, Shimozaki K, Chapoval AI, Zhai Y, Su J, et al. (2000) LIGHT, a
TNF-like molecule, costimulates T cell proliferation and is required for dendriticcell-mediated allogeneic T cell response. J Immunol 164: 4105–4110.
4. Cohavy O, Zhou J, Granger SW, Ware CF, Targan SR (2004) LIGHT
expression by mucosal T cells may regulate IFN-gamma expression in the
intestine. J Immunol 173: 251–258.
5. Harrop JA, McDonnell PC, Brigham-Burke M, Lyn SD, Minton J, et al. (1998)Herpesvirus entry mediator ligand (HVEM-L), a novel ligand for HVEM/TR2,
stimulates proliferation of T cells and inhibits HT29 cell growth. J Biol Chem
273: 27548–27556.
6. Pakala R, Liang CT, Benedict CR (2001) A peptide analogue of thrombinreceptor-activating peptide inhibits thrombin and thrombin-receptor-activating
peptide-induced vascular smooth muscle cell proliferation. J Cardiovasc
Pharmacol 37: 619–629.
7. Ware CF (2008) Targeting lymphocyte activation through the lymphotoxin andLIGHT pathways. Immunol Rev 223: 186–201.
8. Morel Y, Truneh A, Sweet RW, Olive D, Costello RT (2001) The TNFsuperfamily members LIGHT and CD154 (CD40 ligand) costimulate induction
of dendritic cell maturation and elicit specific CTL activity. J Immunol 167:2479–2486.
9. Fan Z, Yu P, Wang Y, Wang Y, Fu ML, et al. (2006) NK-cell activation byLIGHT triggers tumor-specific CD8+ T-cell immunity to reject established
tumors. Blood 107: 1342–1351.
10. Jiang HQ, Kushnir N, Thurnheer MC, Bos NA, Cebra JJ (2002) Monoassocia-
tion of SCID mice with Helicobacter muridarum, but not four other enterics,provokes IBD upon receipt of T cells. Gastroenterology 122: 1346–1354.
11. Ehlers S, Holscher C, Scheu S, Tertilt C, Hehlgans T, et al. (2003) The
lymphotoxin beta receptor is critically involved in controlling infections with the
intracellular pathogens Mycobacterium tuberculosis and Listeria monocyto-genes. J Immunol 170: 5210–5218.
12. Sedgmen BJ, Dawicki W, Gommerman JL, Pfeffer K, Watts TH (2006) LIGHT
is dispensable for CD4+ and CD8+ T cell and antibody responses to influenza A
virus in mice. Int Immunol 18: 797–806.
13. Granger SW, Butrovich KD, Houshmand P, Edwards WR, Ware CF (2001)Genomic characterization of LIGHT reveals linkage to an immune response
locus on chromosome 19p13.3 and distinct isoforms generated by alternate
splicing or proteolysis. J Immunol 167: 5122–5128.
14. Cohavy O, Zhou J, Ware CF, Targan SR (2005) LIGHT is constitutively
expressed on T and NK cells in the human gut and can be induced by CD2-
mediated signaling. J Immunol 174: 646–653.
15. Castaneda FE, Walia B, Vijay-Kumar M, Patel NR, Roser S, et al. (2005)
Targeted deletion of metalloproteinase 9 attenuates experimental colitis in mice:
central role of epithelial-derived MMP. Gastroenterology 129: 1991–2008.
16. Tao R, Wang L, Murphy KM, Fraser CC, Hancock WW (2008) Regulatory T
cell expression of herpesvirus entry mediator suppresses the function of B and T
lymphocyte attenuator-positive effector T cells. J Immunol 180: 6649–6655.
17. Cooper HS, Murthy SN, Shah RS, Sedergran DJ (1993) Clinicopathologic study
of dextran sulfate sodium experimental murine colitis. Lab Invest 69: 238–249.
18. Schenk M, Bouchon A, Seibold F, Mueller C (2007) TREM-1–expressing
intestinal macrophages crucially amplify chronic inflammation in experimental
colitis and inflammatory bowel diseases. J Clin Invest 117: 3097–3106.
19. Prestwood TR, Prigozhin DM, Sharar KL, Zellweger RM, Shresta S (2008) A
mouse-passaged dengue virus strain with reduced affinity for heparan sulfate
causes severe disease in mice by establishing increased systemic viral loads.
J Virol 82: 8411–8421.
20. Axelsson LG, Landstrom E, Goldschmidt TJ, Gronberg A, Bylund-Fellenius AC
(1996) Dextran sulfate sodium (DSS) induced experimental colitis in immuno-
deficient mice: effects in CD4(+) -cell depleted, athymic and NK-cell depleted
SCID mice. Inflamm Res 45: 181–191.
21. Dieleman LA, Ridwan BU, Tennyson GS, Beagley KW, Bucy RP, et al. (1994)
Dextran sulfate sodium-induced colitis occurs in severe combined immunode-
ficient mice. Gastroenterology 107: 1643–1652.
22. Ostanin DV, Bao J, Koboziev I, Gray L, Robinson-Jackson SA, et al. (2009) T
cell transfer model of chronic colitis: concepts, considerations, and tricks of the
trade. Am J Physiol Gastrointest Liver Physiol 296: G135–146.
23. Morel Y, Schiano de Colella JM, Harrop J, Deen KC, Holmes SD, et al. (2000)
Reciprocal expression of the TNF family receptor herpes virus entry mediator
and its ligand LIGHT on activated T cells: LIGHT down-regulates its own
receptor. J Immunol 165: 4397–4404.
24. Hurchla MA, Sedy JR, Gavrieli M, Drake CG, Murphy TL, et al. (2005) B and
T lymphocyte attenuator exhibits structural and expression polymorphisms and
is highly Induced in anergic CD4+ T cells. J Immunol 174: 3377–3385.
25. Cai G, Anumanthan A, Brown JA, Greenfield EA, Zhu B, et al. (2008) CD160
inhibits activation of human CD4+ T cells through interaction with herpesvirus
entry mediator. Nat Immunol 9: 176–185.
26. Gonzalez LC, Loyet KM, Calemine-Fenaux J, Chauhan V, Wranik B, et al.
(2005) A coreceptor interaction between the CD28 and TNF receptor family
members B and T lymphocyte attenuator and herpesvirus entry mediator. Proc
Natl Acad Sci U S A 102: 1116–1121.
HVEM Signaling and Colitis
PLoS ONE | www.plosone.org 10 April 2011 | Volume 6 | Issue 4 | e18495

27. Wang Y, Subudhi SK, Anders RA, Lo J, Sun Y, et al. (2005) The role of
herpesvirus entry mediator as a negative regulator of T cell-mediated responses.J Clin Invest 115: 711–717.
28. Steinberg MW, Turovskaya O, Shaikh RB, Kim G, McCole DF, et al. (2008) A
crucial role for HVEM and BTLA in preventing intestinal inflammation. J ExpMed 205: 1463–1476.
29. Deppong C, Juehne TI, Hurchla M, Friend LD, Shah DD, et al. (2006) Cuttingedge: B and T lymphocyte attenuator and programmed death receptor-1
inhibitory receptors are required for termination of acute allergic airway
inflammation. J Immunol 176: 3909–3913.30. Sarrias MR, Whitbeck JC, Rooney I, Ware CF, Eisenberg RJ, et al. (2000) The
three HveA receptor ligands, gD, LT-alpha and LIGHT bind to distinct sites onHveA. Mol Immunol 37: 665–673.
31. Spahn TW, Herbst H, Rennert PD, Lugering N, Maaser C, et al. (2002)
Induction of colitis in mice deficient of Peyer’s patches and mesenteric lymph
nodes is associated with increased disease severity and formation of colonic
lymphoid patches. Am J Pathol 161: 2273–2282.
32. Drayton DL, Liao S, Mounzer RH, Ruddle NH (2006) Lymphoid organ
development: from ontogeny to neogenesis. Nat Immunol 7: 344–353.
33. Cheung TC, Oborne LM, Steinberg MW, Macauley MG, Fukuyama S, et al.
(2009) T cell intrinsic heterodimeric complexes between HVEM and BTLA
determine receptivity to the surrounding microenvironment. J Immunol 183:
7286–7296.
HVEM Signaling and Colitis
PLoS ONE | www.plosone.org 11 April 2011 | Volume 6 | Issue 4 | e18495